Embed Size (px)
Citation preview
N A S A TECHNICAL
0 N d P n
Q c/I 4 z
NOTE NASA TN D-4420 . - .-
DIVERGENT-FLOW CONTACT-IONIZATION ELECTROSTATIC THRUSTOR FOR SATELLITE ATTITUDE CONTROL A N D STATION KEEPING
N A T I O N A L AERONAUTICS A N D SPACE A D M I N I S T R A T I O N W A S H I N G T O N , D. C. A P R I L 1968
https://ntrs.nasa.gov/search.jsp?R=19680010718 2020-02-12T23:22:11+00:00Z
TECH LIBRARY KAFB, NM
0333395
DIVERGENT - FLOW CONTACT - ION ZATION ELECTROSTATIC
THRUSTOR FOR SATELLITE ATTITUDE
CONTROL AND STATION KEEPING
By Walter C. Lathem and John F. Staggs
Lewis Research Center Cleveland, Ohio
NATIONAL AERONAUTICS AND SPACE ADMINISTRATION
For sale by the Clearinghouse for Federal Scientific and Technical Information Springfield, Virginia 22151 - CFSTI price $3.00
DIVERGENT-FLOW CONTACT-IONIZATION ELECTROSTATIC THRUSTOR FOR
SATELLITE AUITU DE CONTROL AND STATION KEE PING*
by Walter C. Lathem a n d John F. Staggs
Lewis Research Center
SUMMARY
A divergent-flow contact-ionization electrostatic thrustor is described herein. thrustor performed well at thrust levels between 0.89 and 1. 56 millinewtons, a range that is applicable to satellite attitude-control and station-keeping missions. Power effi- ciencies up to 45 percent (excluding vaporizer and neutralizer powers) were obtained for operation at specific impulses from 5000 to 8000 seconds. No damage due to primary ion impingement was detected in about 200 hours of running. Accelerator drain currents were typically less than 2 percent of the beam current. accelerator electrode lifetime in excess of 20 000 hours.
tion up to about 15'. center plane of up to 30 percent of the total thrust of an undeflected beam.
This
Computer studies indicated an
Experimental data verified the computer predictions for electrostatic beam deflec- This deflection produced a component of thrust normal to the
1 N TR 0 DU CTlON
Contact-ionization thrustors using cylindrical electrode geometries are investigated analytically in reference 1. converging flow and plane parallel flow. mental evaluation of a thrustor based on diverging flow between coaxial cylinders
Most experimental effort to date has been directed toward This report presents theoretical and experi-
* Part of the material, ?'Experimental Performance of a Low-Thrust, Divergent-
Flow, Contact-Ionization Electrostatic Thrustor" by John F. Staggs and Walter C. Lathem, was presented at the AIAA Second Propulsion Joint Specialist Conference, Colorado Springs, Colo., June 13-17, 1966, and was published in the Journal of Space- craft and Rockets, vol. 4, no. 5, May 1367, pp. 610-615.
Accelerator
\ I / \-
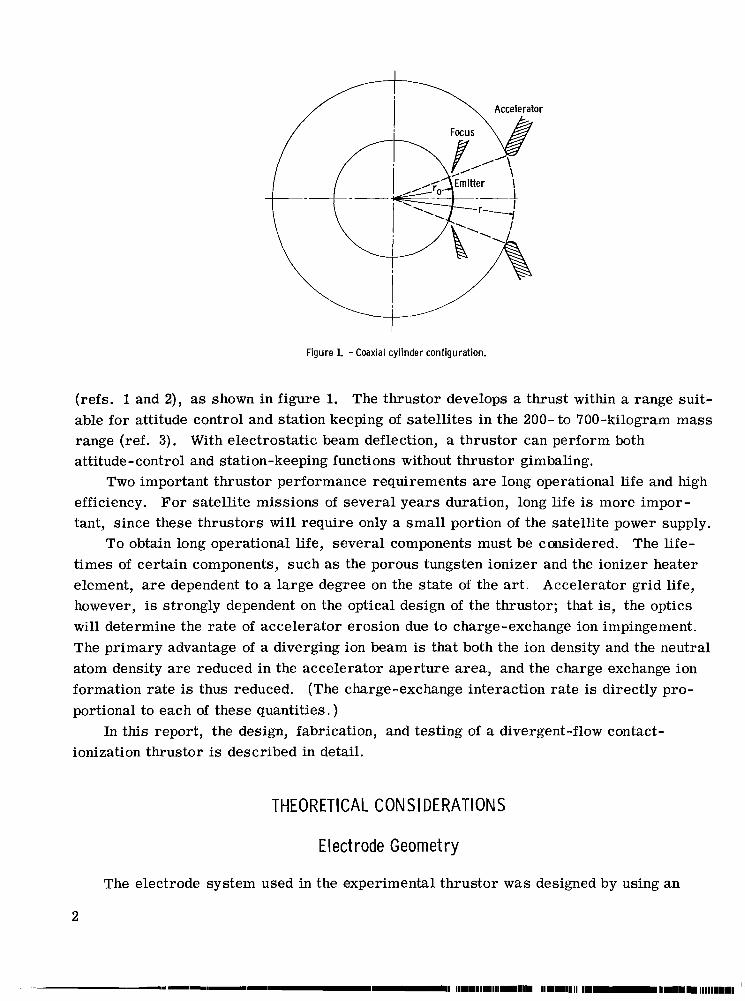
Figure 1. - Coaxial cyl inder configuration.
(refs. 1 and 2), as shown in figure 1. The thrustor develops a thrust within a range suit- able for attitude control and station keeping of satellites in the 200- to 700-kilogram mass range (ref. 3). With electrostatic beam deflection, a thrustor can perform both attitude-control and station-keeping functions without thrustor gimbaling.
Two important thrustor performance requirements are long operational life and high efficiency. For satellite missions of several years duration, long life is more impor- tant, since these thrustors will require only a small portion of the satellite power supply.
To obtain long operational life, several components must be considered. The life- t imes of certain components, such as the porous tungsten ionizer and the ionizer heater element, are dependent to a large degree on the state of the a r t . Accelerator grid life, however, is strongly dependent on the optical design of the thrustor; that is, the optics will determine the rate of accelerator erosion due to charge-exchange ion impingement. The primary advantage of a diverging ion beam is that both the ion density and the neutral atom density a r e reduced in the accelerator aperture area, and the charge exchange ion formation rate is thus reduced. (The charge-exchange interaction rate is directly pro- portional to each of these quantities. )
ionization thrustor is described in detail. In this report, the design, fabrication, and testing of a divergent-flow contact-
THEORETICAL CONSIDERATIONS
Elect rode Geometry
The electrode system used in the experimental thrustor w a s designed by using an
2
I \
I I \ I
Figure 2. - Cross section of program.
ionizer, electrodes, and optical characteristics from digital computer
t - m
c a, 0 a
.- c
c
Emitter Accel- erator
Distance - Figure 3. - Ideal potential distribution.
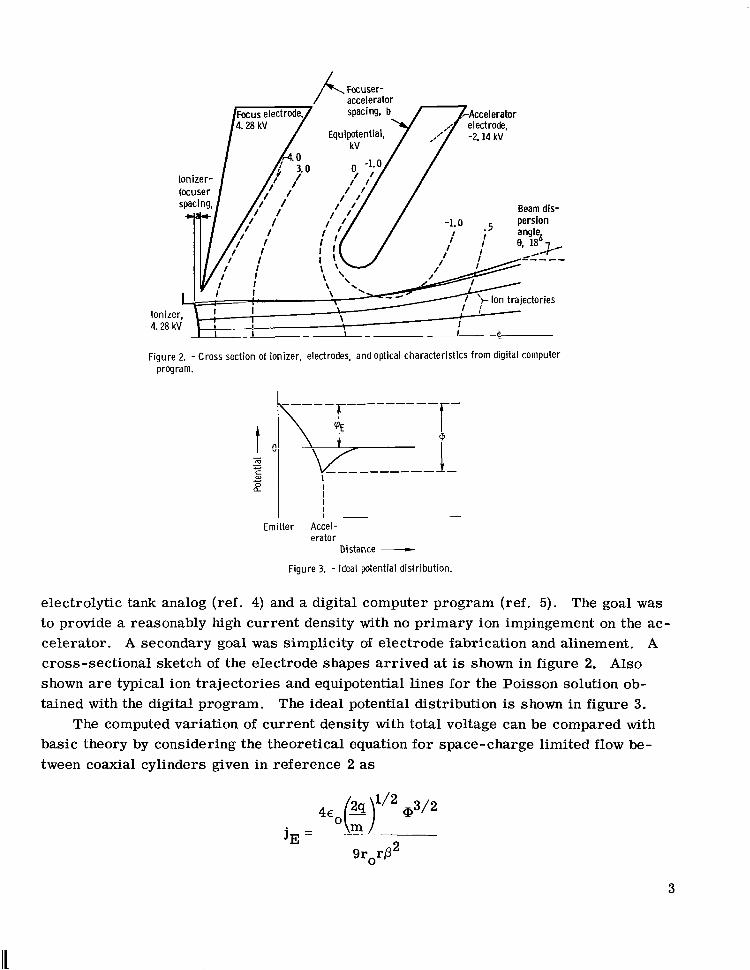
electrolytic tank analog (ref. 4) and a digital computer program (ref. 5). The goal was to provide a reasonably high current density with no primary ion impingement on the ac- celerator. A secondary goal was simplicity of electrode fabrication and alinement. A cross-sectional sketch of the electrode shapes arrived at is shown in figure 2. Also shown are typical ion trajectories and equipotential lines for the Poisson solution ob- tained with the digital program. The ideal potential distribution is shown in figure 3.
The computed variation of current density with total voltage can be compared with basic theory by considering the theoretical equation for space-charge limited flow be- tween coaxial cylinders given in reference 2 as
3
I1 Ill lllll Ill I1 IIIIIIIII llllll11l11llIII.I!IIlIIIl11
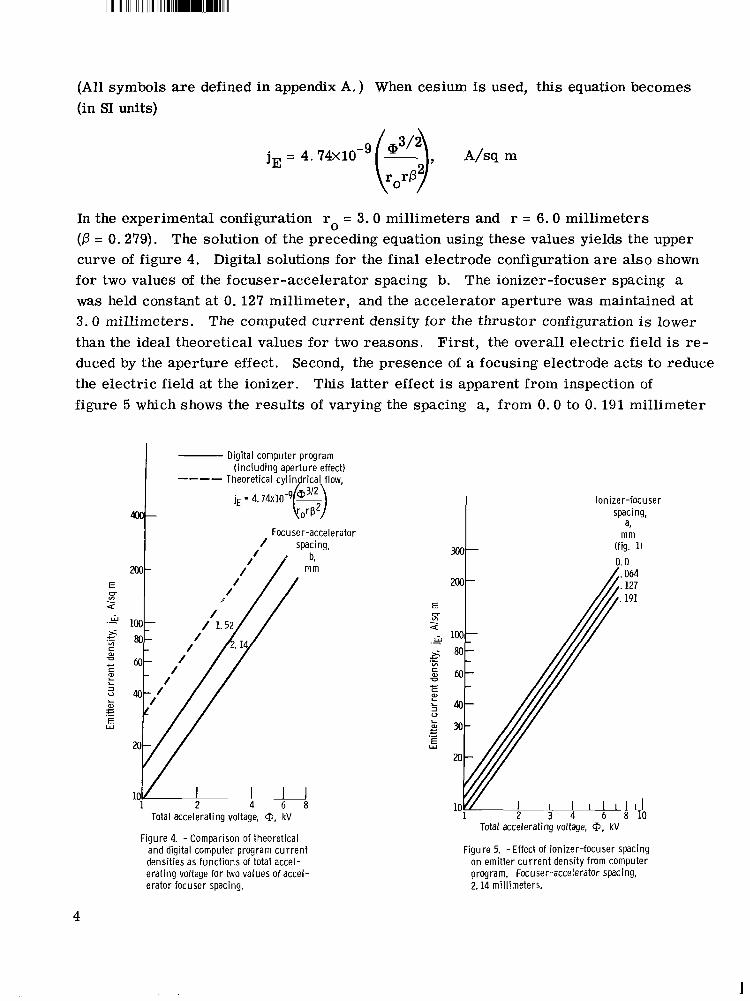
(All symbols are defined in appendix A.) When cesium is used, this equation becomes (in SI units)
In the experimental configuration ro = 3.0 millimeters and r = 6.0 millimeters (P = 0.279). The solution of the preceding equation using these values yields the upper curve of figure 4. Digital solutions for the final electrode configuration are also shown for two values of the focuser-accelerator spacing b. The ionizer-focuser spacing a was held constant at 0. 127 millimeter, and the accelerator aperture was maintained at 3.0 millimeters. The computed current density for the thrustor configuration is lower than the ideal theoretical values for two reasons. First, the overall electric field is re- duced by the aperture effect. Second, the presence of a focusing electrode acts to reduce the electric field at the ionizer. This latter effect is apparent from inspection of figure 5 which shows the resul ts of varying the spacing a, from 0 .0 to 0. 191 millimeter
Digital computer program ( including aperture effect) ----
400 ! c c al L L
3 U
Total accelerating voltage, @, kV
Figure 4. - Comparison of theoretical and digital computer program cur ren t densities as functions of total accel- erating voltage for two values of accel- erator focuser spacing.
Ionizer-focuser spacing,
a, mm
(fig. 1) 0.0
Figure 5. -Effect of ionizer-focuser spacing on emitter cur ren t density from computer program. Focuser-accelerator spacing, 2. 14 millimeters.
4
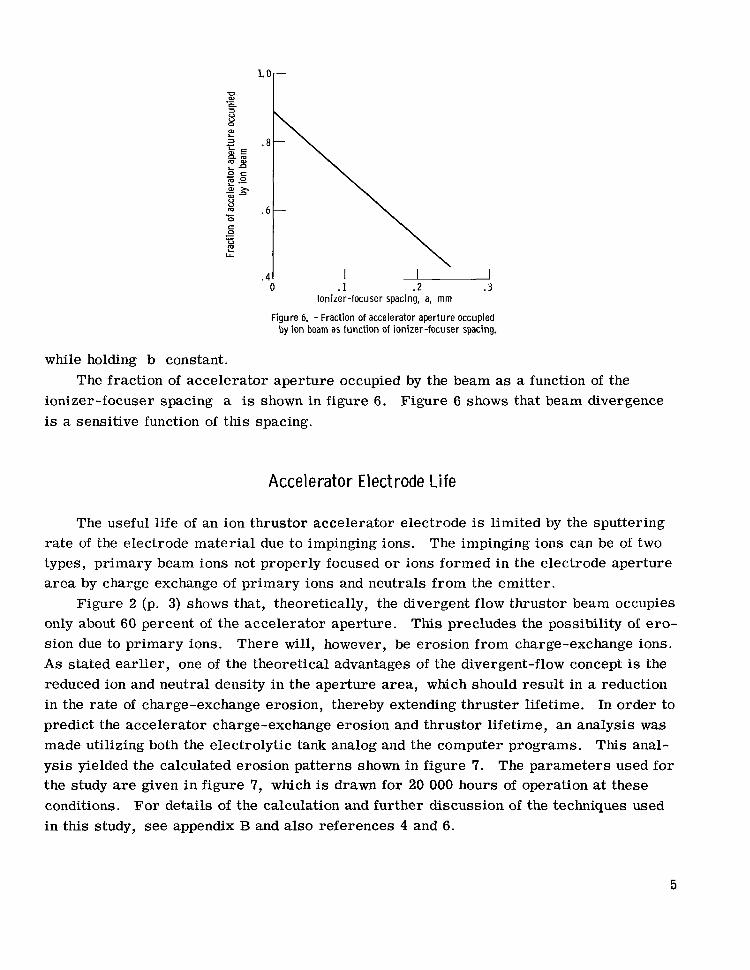
Figure 6. - Fraction of accelerator aperture occupied by ion beam as funct ion of ionizer-focuser spacing.
while holding b constant. The fraction of accelerator aperture occupied by the beam as a function of the
ionizer-focuser spacing a is shown in figure 6. Figure 6 shows that beam divergence is a sensitive function of this spacing.
Accelerator Elect rode Life
The useful life of an ion thrustor accelerator electrode is limited by the sputtering The impinging ions can be of two rate of the electrode material due to impinging ions.
types, primary beam ions not properly focused or ions formed in the electrode aperture a rea by charge exchange of primary ions and neutrals from the emitter.
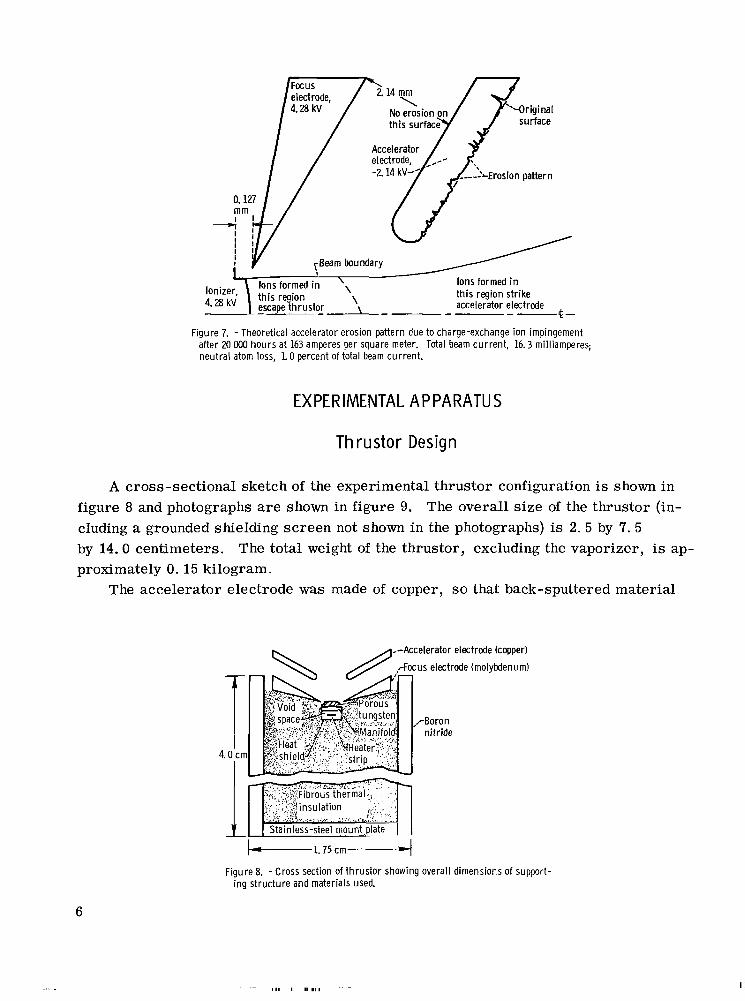
Figure 2 (p. 3) shows that, theoretically, the divergent flow thrustor beam occupies only about 60 percent of the accelerator aperture. This precludes the possibility of ero- sion due to primary ions. There will, however, be erosion from charge-exchange ions. As stated ear l ier , one of the theoretical advantages of the divergent-flow concept is the reduced ion and neutral density in the aperture area, which should result in a reduction in the rate of charge-exchange erosion, thereby extending thruster lifetime. In order to predict the accelerator charge-exchange erosion and thrustor lifetime, an analysis was made utilizing both the electrolytic tank analog and the computer programs. This anal- ysis yielded the calculated erosion patterns shown in figure 7. The parameters used for the study are given in figure 7, which is drawn for 20 000 hours of operation at these conditions. For details of the calculation and further discussion of the techniques used in this study, see appendix B and also references 4 and 6.
5
Ions formed in th is region str ike accelerator electrode --
Figure 7. - Theoretical accelerator erosion pattern due to charge-exchange ion impingement after 20 000 hours at 163 amperes per square meter. Total beam current , 16.3 milliamperes; neutra l atom loss, 1.0 percent of total beam current.
EXPERIMENTAL AP PARATU S
Th rustor Design
A cross-sectional sketch of the experimental thrustor configuration is shown in figure 8 and photographs a r e shown in figure 9. The overall s ize of the thrustor (in- cluding a grounded shielding screen not shown in the photographs) is 2. 5 by 7 . 5 by 14.0 centimeters. proximately 0. 15 kilogram.
The total weight of the thrustor, excluding the vaporizer, is ap-
The accelerator electrode was made of copper, so that back-sputtered material
r-Accelerator electrode (copper)
J o c u s electrode (molybdenum)
T I
1 4.0 cm
b--1.75cm-4
Figure 8. -Cross section of thrustor showing overall dimensions of support- ing s t ructure and materials used.
6
I
Focuser electrode-,
Accelerator electrode-, \
Ionizer assembly (viewed from read
c
L l o n i z e r heater leads - - - - --f I
C-65-273
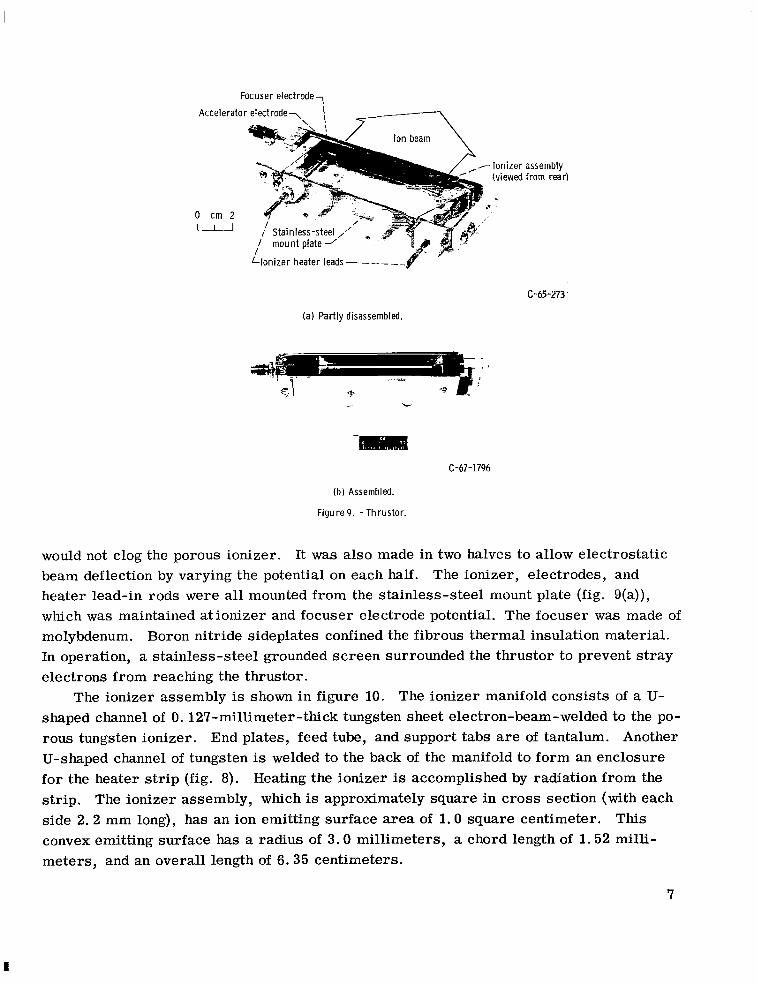
(a ) Partly disassembled.
C-67-1796
(b) Assembled.
Figure 9. - Thrustor.
would not clog the porous ionizer. It was also made in two halves to allow electrostatic beam deflection by varying the potential on each half. heater lead-in rods were all mounted from the stainless-steel mount plate (fig. 9(a)), which was maintained ationizer and focuser electrode potential. The focuser was made of molybdenum. Boron nitride sideplates confined the fibrous thermal insulation material. In operation, a stainless-steel grounded screen surrounded the thrustor to prevent s t ray electrons from reaching the thrustor.
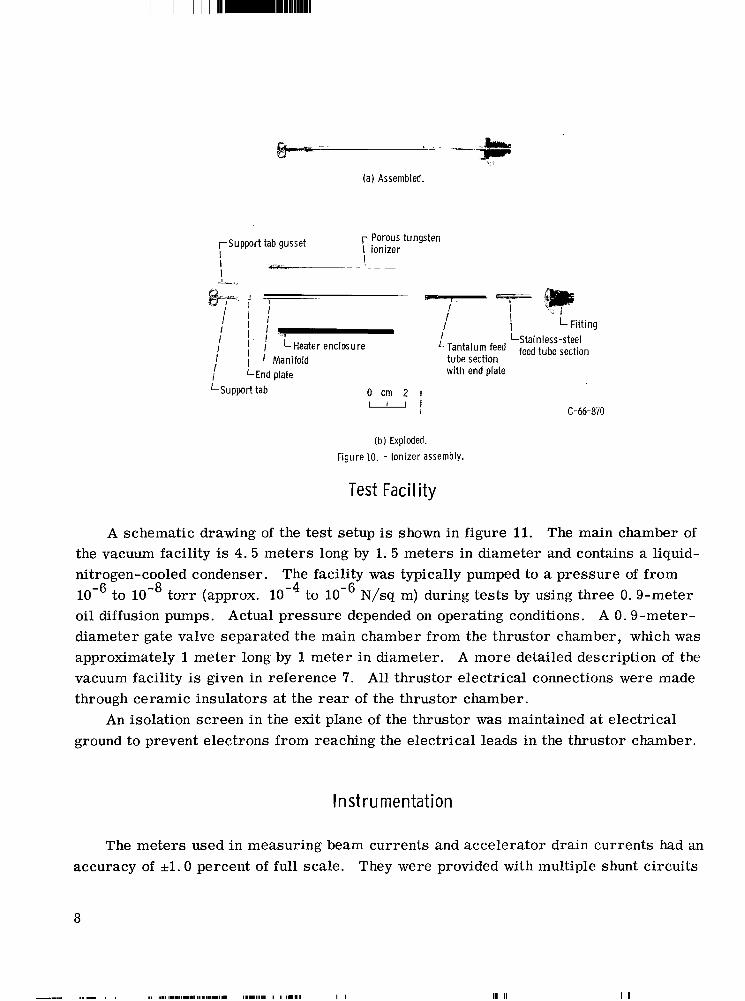
shaped channel of 0. 127-millimeter-thick tungsten sheet electron-beam-welded to the po- rous tungsten ionizer. End plates, feed tube, and support tabs are of tantalum. Another U-shaped channel of tungsten is welded to the back of the manifold to form an enclosure for the heater s t r ip (fig. 8). Heating the ionizer is accomplished by radiation from the strip. The ionizer assembly, which is approximately square in c ross section (with each side 2.2 mm long), has an ion emitting surface area of 1 .0 square centimeter. convex emitting surface has a radius of 3.0 millimeters, a chord length of 1.52 milli- meters , and an overall length of 6.35 centimeters.
The ionizer, electrodes, and
The ionizer assembly is shown in figure 10. The ionizer manifold consists of a U-
This
7
I
r S u p p o r t tab gusset I I
r Porous tungsten I ionizer
yc- -- ! ! 7 ’ I_”_(
I I I I I I I ‘
L Fitting I
k t a i n l e s s - s t e e l I feed feed tube section
I I L M a n i f o l d tube section f LEnd plate wi th end plate
LSupport tab O c m 2 ” - 1 C-66-870
(b ) Exploded. Figure 10. - Ionizer assembly.
Test Facility
A schematic drawing of the test setup is shown in figure 11. The main chamber of the vacuum facility is 4 . 5 meters long by 1. 5 meters in diameter and contains a liquid- nitrogen-cooled condenser. The facility was typically pumped to a pressure of from
N/sq m) during tes t s by using three 0.9-meter oil diffusion pumps. Actual pressure depended on operating conditions. A 0.9-meter- diameter gate valve separated the main chamber from the thrustor chamber, which was approximately 1 meter long by 1 meter in diameter. A more detailed description of the vacuum facility is given in reference 7. All thrustor electrical connections were made through ceramic insulators at the r e a r of the thrustor chamber.
ground to prevent electrons from reaching the electrical leads in the thrustor chamber.
to t o r r (approx. lom4 to
An isolation screen in the exit plane of the thrustor was maintained at electrical
Instrumentation
The meters used in measuring beam currents and accelerator drain currents had an accuracy of &l. 0 percent of full scale. They were provided with multiple shunt circuits
8
II II
I I 0-10 kV; IA
Emitter-focuser
Heater r---- supply I ! 1
I I I 1 I
Vaporizer heater supplies
xy-plotter
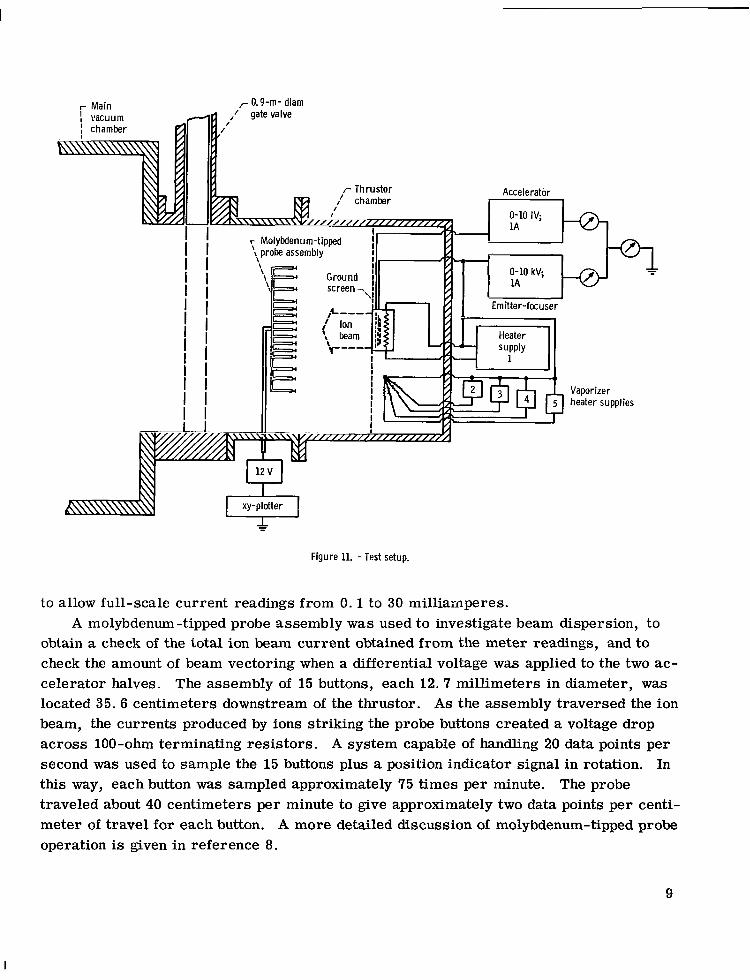
Figure 11. - Test setup.
to allow full-scale current readings from 0.1 to 30 milliamperes.
obtain a check of the total ion beam current obtained from the meter readings, and to check the amount of beam vectoring when a differential voltage was applied to the two ac- celerator halves. The assembly of 15 buttons, each 12. 7 millimeters in diameter, was located 35.6 centimeters downstream of the thrustor. As the assembly traversed the ion beam, the currents produced by ions striking the probe buttons created a voltage drop across 100-ohm terminating resis tors . A system capable of handling 20 data points per second was used to sample the 15 buttons plus a position indicator signal in rotation. In this way, each button was sampled approximately 75 times per minute. The probe traveled about 40 centimeters per minute to give approximately two data points per centi- meter of travel for each button. A more detailed discussion of molybdenum-tipped probe operation is given in reference 8.
A molybdenum-tipped probe assembly was used to investigate beam dispersion, to
9
I
RESULTS AND DISCUSSION
I o n i z e r C u r r e n t Densi ty and C r i t i c a l Temperature
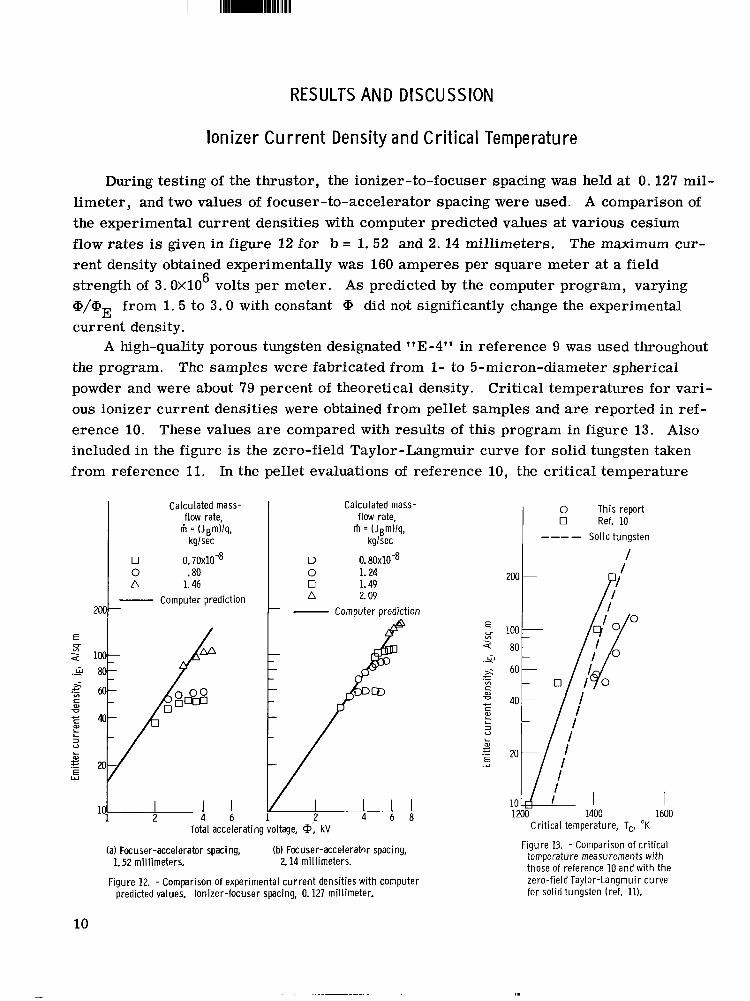
During testing of the thrustor, the ionizer-to-focuser spacing was held at 0. 127 mil- limeter, and two values of focuser-to-accelerator spacing were used. A comparison of the experimental current densities with computer predicted values at various cesium flow rates is given in figure 12 for b = 1 .52 and 2. 14 millimeters. The maximum cur- rent density obtained experimentally was 160 amperes per square meter at a field strength of 3 . 0 ~ 1 0 volts per meter. As predicted by the computer program, varying @/aE from 1 . 5 to 3 . 0 with constant @ did not significantly change the experimental current density.
A high-quality porous tungsten designated "E-4" in reference 9 was used throughout the program. The samples were fabricated from 1- to 5-micron-diameter spherical powder and were about 79 percent of theoretical density. Critical temperatures for vari- ous ionizer current densities were obtained from pellet samples and a r e reported in ref- erence 10. These values are compared with results of this program in figure 13. Also included in the figure is the zero-field Taylor-Langmuir curve for solid tungsten taken from reference 11. In the pellet evaluations of reference 10, the cri t ical temperature
6
Calculated mass- flow rate,
kglsec Iil = (Jgm)/q,
0 0 . 7 0 ~ 1 0 - ~ 0 .80 a 1.46 - Computer prediction -
E CT
.w 80-
10
I 4
I 4 2 1 6
Calculated mass- flow rate,
kglsec rh = (Jgm)/q,
D 0.8oxlO-8 0 1.24 0 1.49 a 2.09
Computer prediction -
Total accelerating voltage, @; kV
(a) Focuser-accelerator spacing,
Figure 12. - Comparison of experimental cur ren t densities wi th computer
(b) Focuser-acceleratnr spacing, 1.52 millimeters. 2.14 millimeters.
predicted values. Ionizer-focuser spacing, 0. 127 millimeter.
0 This report 0 Ref. 10
Solid tungsten ---- I
200 -
1200 1400 I
1600 Crit ical temperature, Tc, "K
Figure 13. -Comparison of cr i t ical temperature measurements with those of reference 10 and with the zero-field Taylor-Langmuir curve for solid tungsten (ref. 11).
. ..
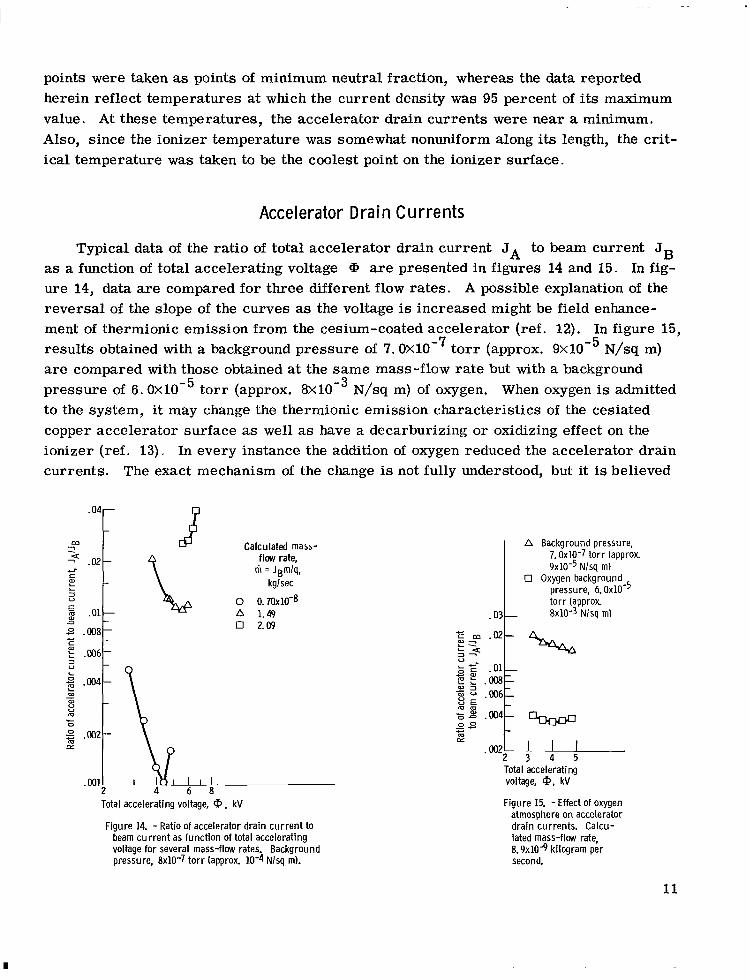
points were taken as points of minimum neutral fraction, whereas the data reported herein reflect temperatures at which the current density was 95 percent of its maximum value. At these temperatures, the accelerator drain currents were near a minimum. Also, since the ionizer temperature was somewhat nonuniform along its length, the crit- ical temperature was taken to be the coolest point on the ionizer surface.
Accelerator D r a i n C u r r e n t s
Typical data of the ratio of total accelerator drain current JA to beam current JB are presented in figures 14 and 15. In fig- as a function of total accelerating voltage
ure 14, data are compared for three different flow rates. A possible explanation of the reversal of the slope of the curves as the voltage is increased might be field enhance- ment of thermionic emission from the cesium-coated accelerator (ref. 12). In figure 15, results obtained with a background pressure of 7. OX10-7 to r r (approx. 9 ~ 1 0 - ~ N/sq m) are compared with those obtained at the same mass-flow rate but with a background pressure of 6. OX10-5 to r r (approx. 8 ~ 1 0 - ~ N/sq m) of oxygen. When oxygen is admitted to the system, it may change the thermionic emission characteristics of the cesiated copper accelerator surface as well as have a decarburizing or oxidizing effect on the ionizer (ref. 13). In every instance the addition of oxygen reduced the accelerator drain currents. The exact mechanism of the change is not fully understood, but it is believed
m L L
V
.01
8 .W8
g .w2 4- .W1 I
2 LA 4 6
Calculated mas>- flow rate,
ni = JBmlq, kglsec
0 0 . 7 0 ~ 1 0 - ~ A 1.49 0 2.09
I 8
Total accelerating voltage, @ , kV
Figure 14. - Ratio of accelerator drain cu r ren t to beam cu r ren t as function of total accelerating voltage for several mass-flow rates. Background pressure, 8x10⁻⁷ t o r r (approx. 10-4 Nlsq m).
A Background pressure, 7.0~10-7 t o r r (approx. 9x10⁻⁵ Nlsq m)
0 Oxygen background pressure, 6. O X ~ O - ~ t o r r (approx
,03 I 8x10⁻³ Nlsq m)
Total accelerating voltage, @, kV
Figure 15. -Effect of oxygen atmosphere on accelerator drain currents. Calcu- lated mass-flow rate, 8.9~10-9 kilogram per second.
11
IIIII I1 I1 l1l11l1II IIIII Ill1 II Ill1 111111lll1I1l1111 1111 I1 111lll1ll
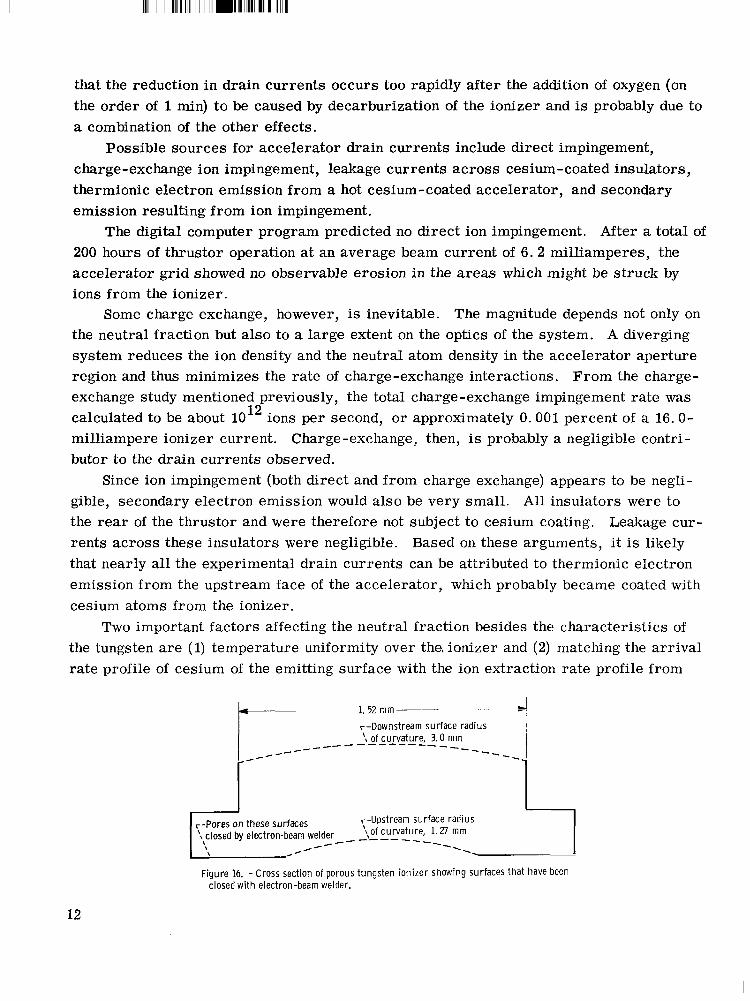
,--Downstream surface radius ‘\ of curvature, 3.0 mm -- --- -- - - - - - - - - --_----
that the reduction in drain currents occurs too rapidly after the addition of oxygen (on the order of 1 min) t o be caused by decarburization of the ionizer and is probably due to a combination of the other effects.
Possible sources for accelerator drain currents include direct impingement, charge-exchange ion impingement, leakage currents across cesium-coated insulators, thermionic electron emission from a hot cesium-coated accelerator, and secondary emission resulting from ion impingement.
200 hours of thrustor operation at an average beam current of 6 . 2 milliamperes, the accelerator grid showed no observable erosion in the areas which might be struck by ions from the ionizer.
Some charge exchange, however, is inevitable. The magnitude depends not only on the neutral fraction but also to a large extent on the optics of the system. A diverging system reduces the ion density and the neutral atom density in the accelerator aperture region and thus minimizes the rate of charge-exchange interactions. F rom the charge- exchange study mentioned previously, the total charge-exchange impingement rate was calculated to be about 10l2 ions per second, o r approximately 0.001 percent of a 16.0- milliampere ionizer current. Charge-exchange, then, is probably a negligible contri- butor to the drain currents observed.
Since ion impingement (both direct and from charge exchange) appears to be negli- gible, secondary electron emission would also be very small . All insulators were to the r e a r of the thrustor and were therefore not subject to cesium coating. rents across these insulators were negligible. Based on these arguments, it is likely that nearly all the experimental drain currents can be attributed to thermionic electron emission from the upstream face of the accelerator, which probably became coated with cesium atoms from the ionizer.
Two important factors affecting the neutral fraction besides the characterist ics of the tungsten a r e (1) temperature uniformity over the ionizer and (2) matching the arr ival rate profile of cesium of the emitting surface with the ion extraction rate profile from
The digital computer program predicted no direct ion impingement. After a total of
Leakage cur-
J -1
1.52 mm ___ .- +
-l r-Upstream surface radius ‘\\Of curv%Le, ’. 27 -- --._
Figure 16. - Cross section of porous tungsten ionizer showing surfaces that have been closed wi th electron-beam welder.
12
that surface.
perature uniformity and/or operation with the coolest portion of the ionizer above the critical temperature.
The second factor is taken care of by contouring the back (upstream face) of the po- rous tungsten. The final shape (fig. 16) was obtained by setting up an analog of the flow through the porous tungsten by using the electrolytic tank. In this figure, the dashed lines show the contour of the porous surfaces and the solid lines represent surfaces where the pores have been ttwdshedtt closed with an electron-beam welder (short dura- tion heating, so that a thin surface layer is melted).
The first factor can be handled by designing the ionizer and heater to assure tem-
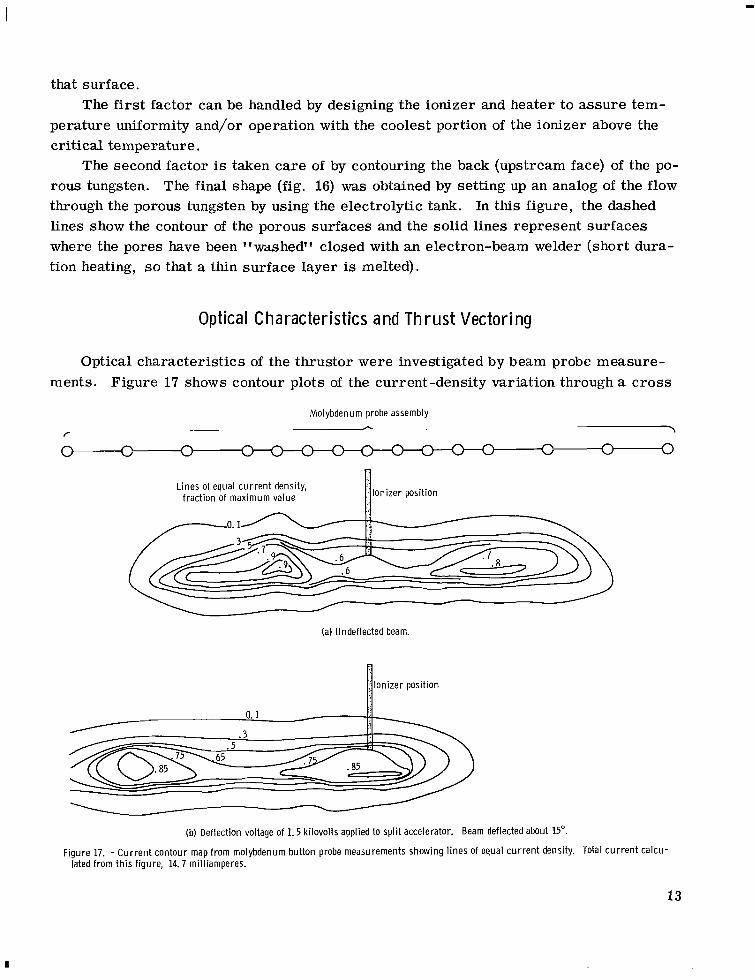
Optical Character ist ics and T h r u s t Vec tor ing
Optical characterist ics of the thrustor were investigated by beam probe measure- ments. Figure 17 shows contour plots of the current-density variation through a c ross
Molybdenum probe assembly A
,- \ n n C- 0 W
- Ionizer position n Lines of equal cur ren t density, fraction of maximum value
~
(a) Undeflected beam.
, Ionizer position n 0. 1
. 3
(b) Deflection voltage of 1.5 kilovolts applied to split accelerator. Beam deflected about 15".
Figure 17. - Cur ren t contour map from molybdenum button probe measurements showing l ines of equal cur ren t density. Total cur ren t calcu- lated from th is figure, 14.7 milliamperes.
13

I I1 I I l111111lll11~111111111
section of the beam 35.6 centimeters downstream of the ionizer. Figure 17(a) shows an undeflected beam, while figure 17(b) shows the effect of a 1. 5-kilovolt deflection voltage. This deflection voltage was obtained by increasing the voltage on one accelerator half ~y 750 volts and decreasing the voltage by the same amount on the other half.
A rough integration of this contour map yielded a current of about 14.7 milliamperes. The difference is due both to secondary emission from the probes and to inaccuracies in drawing the map. Although these current values do not show good agreement, the quali- tative profile and magnitude of beam deflection obtained agreed with theoretical predic- tions. Fo r example, it was determined from the contour map that 90 percent of the beam lies within a dispersion angle 8 of about 15'. 18' angle predicted by the digital computer solution (fig. 2, p. 3). The double peaked profile of the beam had also been predicted from the computer results.
While these data were being taken, the metered beam current was 9 . 4 milliamperes.
This value agrees well with the
I"."""/ I / 4 Beam deflection
(a) Differential voltage, Aq, 1. 5 kilovolts.
(b) Differential voltage, Acp, 0.
Figure 18. - Effects of applying differential voltage A($ t o two halves of split accelerator. Solutions obtained from digital computer; Acp = cpl - ( ~ 2 .
14
.... . . __.. .. - .... .. . .
The beam deflection angle a! was analyzed theoretically, and typical results are shown in figure 18 for a differential voltage Acp of 1.5 and 0 kilovolt. The deflection angle a! (fig. 19) is approximately 1.0’ for every 100 volts of deflection voltage. (This angle is not to be confused with the dispersion angle 8 , which is a measure of the nor- mal spread of the beam. ) Experimental results for beam deflection are compared with theory in figure 20. The deflection angles determined from the probe contour maps are shown as data points and are in good agreement with theory.
The calculated thrust component normal to the center plane T for a! = 0 is plotted against the calculated deflection angle in figure 21 (as in fig. 19, T, = Tres for a! = 0). With a deflection of 15O, T
as a fraction of T, Y
is about 30 percent of (Tx)a!=o. Y
Tres Center trajectory
Center plane
TY -_-
Figure 19. - Cross section of t h rus to r showing deflection angle a and th rus t vectors.
A Probe profile data Computer
A
A/
I 15
I 10
1 5
/ 0
I I 500 1000 IHW)
V 0
Deflection voltage, Ap, V
Figure 20. - Beam deflection angle as funct ion of deflection voltage.
_ _ _.
Calculated angle between center plane and resultant t h r u s t vector, a
Figure 21. - T h r u s t component normal to center plane (as fraction of undeflected total thrust ) as function of deflection angle.
15
‘ I l l Ill I1 I I l l
I1111l11 II Ill I lll1ll1 Ill11 11l11l1~11111111l11111l
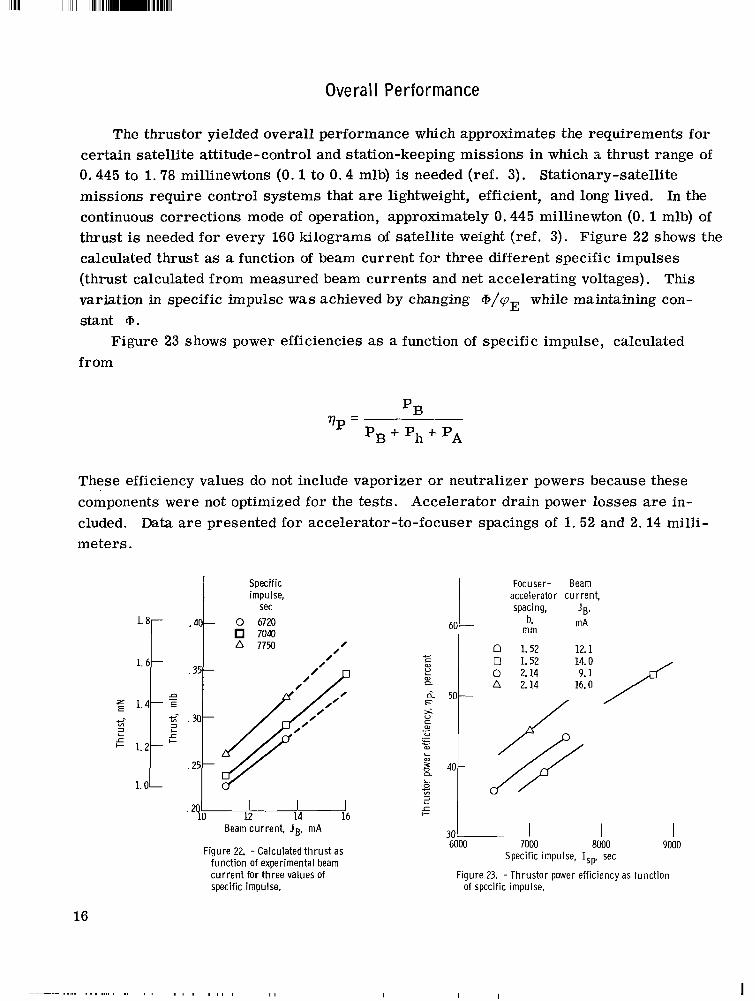
Ove ral I Perfor ma nce
The thrustor yielded overall performance which approximates the requirements for certain satellite attitude-control and station-keeping missions in which a thrust range of 0.445 to 1.78 millinewtons (0. 1 to 0 . 4 mlb) is needed (ref. 3). Stationary-satellite missions require control systems that are lightweight, efficient, and long lived. In the continuous corrections mode of operation, approximately 0.445 millinewton (0.1 mlb) of thrust is needed for every 160 kilograms of satellite weight (ref. 3) . Figure 22 shows the calculated thrust as a function of beam current for three different specific impulses (thrust calculated from measured beam currents and net accelerating voltages). This variation in specific impulse was achieved by changing @/q, while maintaining con- stant @.
from Figure 23 shows power efficiencies as a function of specific impulse, calculated
These efficiency values do not include vaporizer or neutralizer powers because these components were not optimized for the tests. Accelerator drain power losses are in- cluded. meters .
Data a r e presented for accelerator-to-focuser spacings of 1. 52 and 2. 14 milli-
16
Specific impulse,
sec 0 6720 'T .4 7040
. 3 5
z- .30. 3 L
.25-
UI 3 L
+ 1. 2
1. O L 'u
12 14 16 Beam current, JB, mA
To
Figure 22. - Calculated t h r u s t as funct ion of experimental beam cur ren t for three values of specific impulse.
I
Focuser- Beam accelerator current, spacing, JB,
- b, mA mm
n 1.52 12. 1 0 1.52
P) 0 2 1 4 A 2.14 n
F 50
.- I
40 n L 0 c VI
3 I
+
30 6000 7000
I 8000
I 9000
Specific impulse, ISp. sec
Figure 23. - Thrustor power efficiency as function of specific impulse.
I I I
0
m CT .- c
500 -
Beam current,
mA
a 11.0 0 16.0
J B*
Figure 24. - Power-thrust ratio as function of spe- cific impulse.
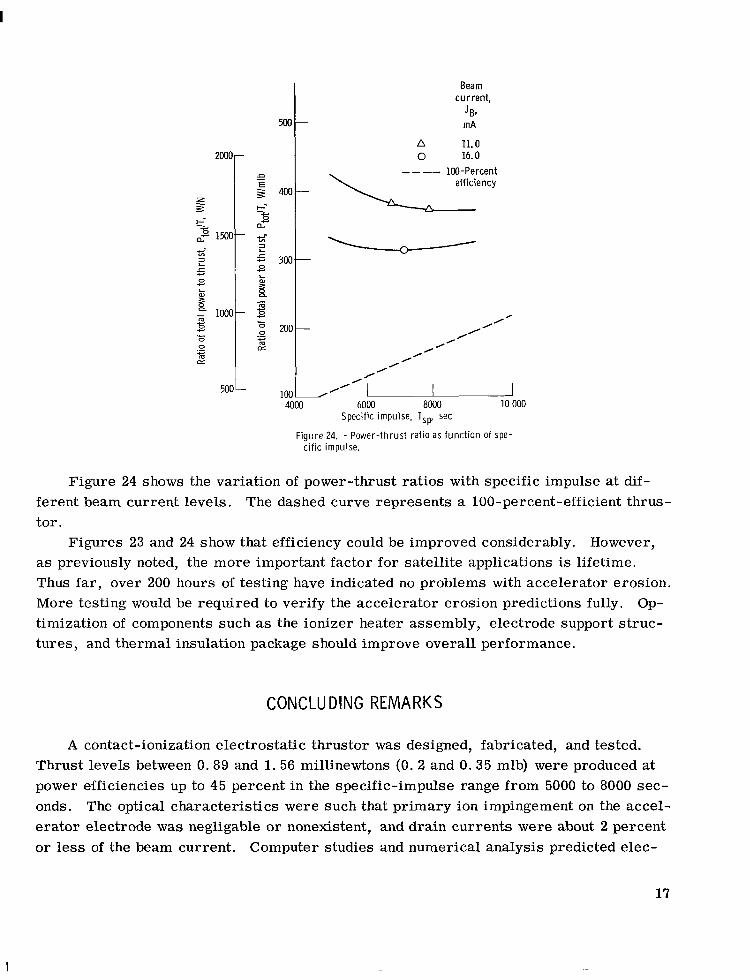
Figure 24 shows the variation of power-thrust ratios with specific impulse at d i f - ferent beam current levels. tor .
as previously noted, the more important factor for satellite applications is lifetime. Thus far, over 200 hours of testing have indicated no problems with accelerator erosion. More testing would be required to verify the accelerator erosion predictions fully. Op- timization of components such as the ionizer heater assembly, electrode support s t ruc- tures , and thermal insulation package should improve overall performance.
The dashed curve represents a 100-percent-efficient thrus-
Figures 23 and 24 show that efficiency could be improved considerably. However,
CONCLUDING REMARKS
A contact-ionization electrostatic thrustor was designed, fabricated, and tested. Thrust levels between 0.89 and 1.56 millinewtons (0.2 and 0.35 mlb) were produced at power efficiencies up to 45 percent in the specific-impulse range from 5000 to 8000 sec- onds. The optical characterist ics were such that pr imary ion impingement on the accel- erator electrode was negligable or nonexistent, and drain currents were about 2 percent or less of the beam current. Computer studies and numerical analysis predicted elec-
17
I
trode lifetimes in excess of 20 000 hours. Electrostatic ion beam deflection worked well for producing a thrust component nor-
mal to the center plane. By deflecting the ion beam 15O, a thrust is produced in a direc- tion perpendicular to the thrustor center plane which is about 30 percent of the original total thrust. With this technique, both attitude-control and station-keeping functions could be performed with the same thrustor, and the need for mechanical gimbaling would thus be eliminated.
Lewis Research Center, National Aeronautics and Space Administration,
Cleveland, Ohio, August 16, 1967, 1 20 - 26 - 0 2 - 06 - 2 2.
18
APPENDIX A
SYMBOLS
a
b
f
ISP
J
j
k
m
m
N
P
Q
rO
T
Tresy 1
V - V
ionizer-focuser spacing W width of emitter chord
focuser -accelerator spacing X normal distance from emitter
ratio of neutral atom emission rate to ion emission rate
surface to center of charge- exchange volume
from emitter Y normal distance from plane of
specific impulse symmetry of thrustor to center of charge-exchange
current volume
current density
Boltzmann constant
mass of atom
a! beam deflection angle
P
VP
function of r/ro (ref. 2)
power efficiency
mass-f low rate 9 beam dispersion angle
charge-exchange ion formation 1-1 arrival rate at charge- rate exchange volume
power V emission rate from ionizer
cross section for charge- P number density
exchange interact ion 9 total accelerating voltage
charge on electron v voltage radius of outer cylinder of Sub scripts: -
coaxial cylinder electrode system A accelerator
B beam radius of inner cylinder (emit- ter) of coaxial cylinder E emitter electrode system h ionizer heater
temperature j jth plane parallel to yz-phne
k k plane parallel to xz-plane thrust vectors Superscripts :
0 neutral atom charge-exchange volume
+ positive ion mean velocity
th
19
I I I IIIIIII II Ill II ll1111111111l1111111
APPENDIX B
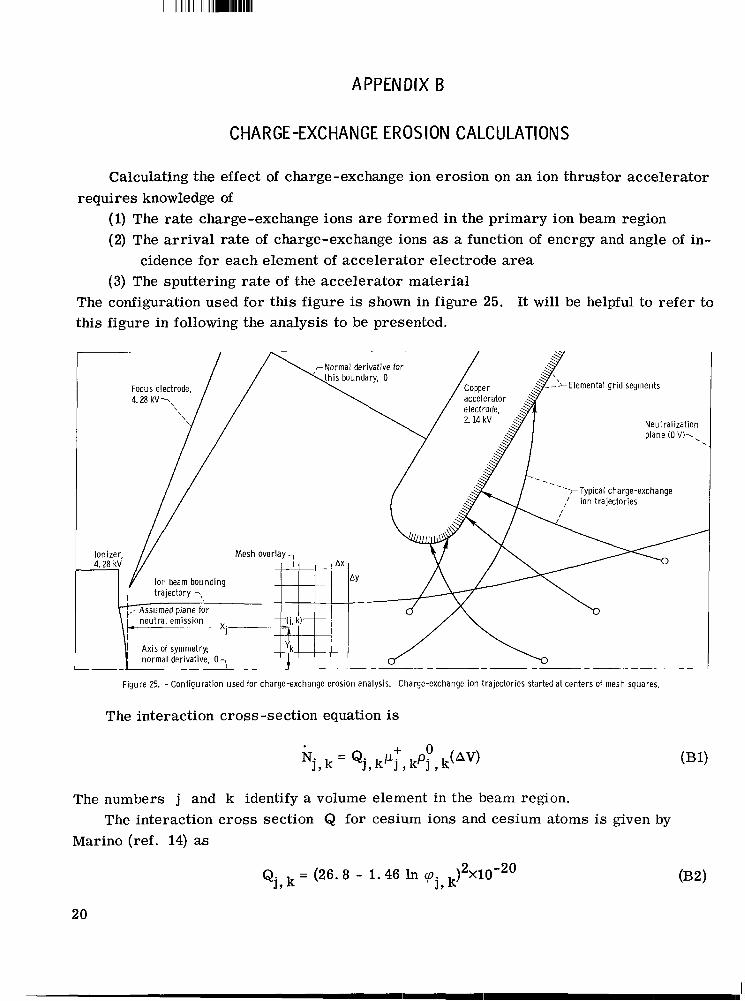
CHARGE -EXCHANGE EROSION CALCULATIONS
Calculating the effect of charge-exchange ion erosion on an ion thrustor a---ler
(1) The rate charge-exchange ions are formed in the pr imary ion beam region requires knowledge of
tor
(2) The a r r iva l rate of charge-exchange ions as a function of energy and angle of in-
(3) The sputtering rate of the accelerator material The configuration used for this figure is shown in figure 25. It will be helpful to refer to this figure in following the analysis to be presented.
cidence for each element of accelerator electrode area
Neutralization plane (0 VI\,
1 Axis of symmetry;
Figure 25. - Configuration used for charge-exchange erosion analysis. Charge-exchange ion trajectories started at centers of mesh squares.
The interaction cross-section equation is
The numbers j and k identify a volume element in the beam region.
Marino (ref. 14) as The interaction c ross section Q for cesium ions and cesium atoms is given by
Qj, k = (26.8 - 1.46 In q. J ? k )2X10-20 032)
20
The voltage q is the difference between emitter potential and the potential at the center of the j , k charge-exchange volume and is determined from the digital computer solutions. The ion a r r iva l rate 1-1' is also obtained from the digital computer solu- tion.
vo from the emitter, which can be expressed as a fraction f of the ion emission rate v'; that is,
j, k
j , k
Obtaining the neutral atom density po requires a neutral atom emission rate j , k
o + v = f v
A value for f of loe2 is assumed. across the emitter.
The quantities v+ and YO are assumed constant The atom ar r iva l rate is then calculated from the equation (ref. 15)
Finally,
where
The ar r iva l rate of impinging charge-exchange ions on the accelerator is determined by tracing out trajectories on the electrolytic tank analog. The Poisson potential distri- bution from the computer solution is established in the electrolytic tank. The exhaust beam is divided into a number of mesh squares (fig. 25, p. 20). Charge-exchange ion trajectories are then started with zero initial velocity from the centers of these mesh squares and t raced on an xy-plotter. Figure 25 shows that the accelerator electrode has been divided into elemental segments on the downstream face. (No ions were found to impinge on the upstream face.) All ions formed in a particular mesh square are as- sumed to begin at the center of that square and to have the same energy when striking
21
I
the grid. Furthermore, it is assumed that they are equally distributed over the ele- mental grid segment and strike at the same angle of incidence. These assumptions are reasonable since the mesh squares and accelerator electrode segments are compara- tively small. With these assumptions, the next step is to determine the sputtering dam- age for each elemental segment. Sputtering yields as a function of energy and angle of incidence for cesium ions (amu, 132.9) incident on copper were not available. Instead, data for xenon (amu, 131.3) on copper from reference 16 was used.
sults of the electrolytic tank trajectory plots (fig. 25) yielded a solution for the distri- bution of ions striking the downstream face of the accelerator electrode. Then with the use of the sputtering data of reference 16 an erosion pattern was obtained. An example of an erosion pattern after 20 000 hours is shown i n figure 7 (p. 6).
In summary, the charge-exchange ion formation rate from equation (Bl ) and the re-
22
REFERENCES
1. Lockwood, David L. ; Mickelsen, William R. ; and Hamza, Vladimir: Analytic Space -Charge Flow and Theoretical Electrostatic Rocket Engine Performance . Preprint 2400-62, ARS, Mar. 1962.
2. Langmuir, Irving; and Blodgett, Katherine B. : Currents Limited by Space-Charge Between Coaxial Cylinders. Phys. Rev., vol. 22, no. 4, Oct. 1923, pp. 347-356.
3. Molitor, Jerome H. : Ion Propulsion System for Stationary-Satellite Control. J. Spacecraft Rockets, vol. 1, no. 2, Mar. -Apr. 1964, pp. 170-175.
4. Staggs, John F. : An Electrolytic Tank Analog for Two-Dimensional Analysis of Electrostatic-Thrustor Optics. NASA TN D-2803, 1965.
5. Bogart, Carl D. ; and Richley, Edward A. : Space-Charge-Flow Computer Program. NASA TN D-3394, 1966.
6. Brewer, G. R. : On the Nature of Leakage Currents in Cesium Contact Ion Engines. Rep. No. 281, Hughes Res. Lab., Aug. 1963.
7. Keller, Thomas A. : NASA Electric Rocket Test Facilities. Seventh National Sym- posium on Vacuum Technology Transactions. C. Robert Meissner, ed . , Pergamon Press, 1961, pp. 161-167.
8. Kerslake, William R. : Accelerator Grid Tests on an Electron-Bombardment Ion Rocket. NASA TN D-1168, 1962.
9. Butler, C. K. : Fabrication and Testing of Five (5) Porous Tungsten Blocks. Rep. No. EOS-5140-Final, Electro-Optical-Systems, Inc. , Dec. 1364.
10. Cho, A. Y. ; Hall, D. F. ; and Shelton, H. : Program of Analytical and Experi- mental Study of Porous Metal Ionizers. Rep. No. TRW-4148-6013-SU-000 (NASA CR-54325), TRW Systems, July 15, 1965.
11. Reynolds, Thaine W. ; and Childs, J. Howard: A Graphical Method for Estimating Ion-Rocket Performance. NASA TN D-466, 1960.
12. Wasserbauer, Joseph F. : Field-Enhanced Thermionic Emission from Electrodes of Cesium Ion Thrustors. NASA TN D-2635, 1965.
13. Turk, R. R. ; and McKee, W. E. : Ion Engine Supporting Research and Evaluation. Vol. 1. Hughes Research Lab. (NASA CR-54411), Nov. 1965.
14. Marino, Lawrence L. ; Smith, A. C. H. ; and Caplinger, E. : Charge Transfer Be- tween Positive Cesium Ions and Cesium Atoms. Phys. Rev., vol. 128, no. 5, Dec. 1, 1962, pp. 2243-2250.
23
15. Reynolds, Thaine W. ; and Richley, Edward A. : Thermionic Emission from Cesium- Coated Electrostatic Ion-Thruster Electrodes. NASA T N D-1879, 1963.
16. Cheney, K. B.; Rogers, E. E.; and Pitkin, E. T.: Research on Experimental Evaluation of Sputtering Yield Rates. (AFARL 63-125), Marquardt Corp. , July 1963.
24
, , . I. I
NASA-Langley, 1968 - 28 E-4000
National Aeronautics and Space Administration WASHINGTON, D. C.
FIRST CLASS MAIL POSTAGE AND FEES PAID NATZONAL AERONAUTICS A N D
SPACE ADhfINISIRAIION
OFFICIAL BUSINESS
POSTMASTER: II Undeliverable (Section 158 POStal Manual) Do Not R e t u r n
"The aeronautical and space activities of the United States shall be conducted so as to contribute . . . to the expansion of human h o w l - edge of phenomena in the atmosphere and space. The Administration shall provide for the widest practicable and appropriate dissemination of information concerning its activities and the results tbereof."
-NATIONAL ~ERONAUTICS AND SPACa ACT OF 1958
NASA SCIENTIFIC AND TECHNICAL PUBLICATIONS
TECHNICAL REPORTS: Scientific and technical information considered important, complete, and a lasting contribution to existing .knowl&ge.
TECHNICAL NOTES: Information less broad in scope but nevertheless of importance as a contribution to existing knowledge.
TECHNICAL MEMORANDUMS: Information receiving limited distribu- tion because of preliminary data, security classification, or other reasons.
CONTRACTOR REPORTS: Scientific and technical information generated under a NASA contract or grant and considered an important contribution to existing knowledge.
TECHNICAL TRANSLATIONS: Information published in a foreign language considered to merit NASA distribution in English.
SPECIAL PUBLICATIONS: Information derived from or of value to NASA activities. Publications include conference proceedings, monographs, data compilations, handbooks, sourcebooks, and special bibliographies.
TECHNOLOGY UTILIZATION PUBLICATIONS; Information on tech- nology used by NASA that may be of particular interest in commercial and other non-aerospace applications. Publications include Tech Briefs, Technology Utilization Reports and Notes, and Technology Surveys.
Details on the availability of these publications may be obtained from:
SCIENTIFIC AND TECHNICAL INFORMATION DIVISION
NATIONAL AERONAUTICS AND SPACE ADMINISTRATION
Washington, D.C. PO546


![3-D ionization structure (in stereoscopic view) of ...robertoragazzoni.it/Repository/[PAPERS-REF]R043-aa1018.pdf · Abstract. Long-slit echellograms of the high excitation planetary](https://img.pdfslide.us/doc/110x75/5f7c0b0d904f54243d515cc2/3-d-ionization-structure-in-stereoscopic-view-of-papers-refr043-aa1018pdf.jpg)