Embed Size (px)
Citation preview
Divergences in Insulin Resistance Between theDifferent Phenotypes of the Polycystic OvarySyndrome
Paolo Moghetti, Flavia Tosi, Cecilia Bonin, Daniela Di Sarra, Tom Fiers,Jean-Marc Kaufman, Vito Angelo Giagulli, Chiara Signori, Francesca Zambotti,Marlene Dall’Alda, Giovanna Spiazzi, Maria Elisabetta Zanolin, and Enzo Bonora
Endocrinology, Diabetes and Metabolism (P.M., F.T., D.D.S., F.Z., M.D., G.S., E.B.), and Obstetrics andGynecology (C.B., C.S.), University of Verona and Azienda Ospedaliera Universitaria Integrata Verona,37126 Verona, Italy; Laboratory for Hormonology (T.F., J.-M.K.) and Department of Endocrinology (J.-M.K.), Ghent University Hospital, B-9000 Ghent, Belgium; Unit of Metabolic Diseases and Endocrinology(V.A.G.), Conversano Hospital, 70014 Conversano, Italy; and Department of Public Health andCommunity Medicine (M.E.Z.), University of Verona, 37131 Verona, Italy
Context/Objective: Current diagnostic criteria for polycystic ovary syndrome (PCOS) have gener-ated distinct PCOS phenotypes, based on the different combinations of diagnostic features foundin each patient. Our aim was to assess whether either each single diagnostic feature or theircombinations into the PCOS phenotypes may predict insulin resistance in these women.
Patients/Design: A total of 137 consecutive Caucasian women with PCOS, diagnosed by the Rot-terdam criteria, underwent accurate assessment of diagnostic and metabolic features. Insulinsensitivity was measured by the glucose clamp technique.
Results: Among women with PCOS, 84.7% had hyperandrogenism, 84.7% had chronic oligoan-ovulation, and 89% had polycystic ovaries. According to the individual combinations of thesefeatures, 69.4% of women had the classic phenotype, 15.3% had the ovulatory phenotype, and15.3% had the normoandrogenic phenotype. Most subjects (71.4%) were insulin resistant. How-ever, insulin resistance frequency differed among phenotypes, being 80.4%, 65.0%, and 38.1%,respectively, in the 3 subgroups (P � .001). Although none of the PCOS diagnostic features per sewas associated with the impairment in insulin action, after adjustment for covariates, the classicphenotype and, to a lesser extent, the ovulatory phenotype were independently associated withinsulin resistance, whereas the normoandrogenic phenotype was not. Metabolic syndrome fre-quency was also different among phenotypes (P � .030).
Conclusions: There is a scale of metabolic risk among women with PCOS. Although no singlediagnostic features of PCOS are independently associated with insulin resistance, their combina-tions, which define PCOS phenotypes, may allow physicians to establish which women shouldundergo metabolic screening. In metabolic terms, women belonging to the normoandrogenicphenotype behave as a separate group. (J Clin Endocrinol Metab 98: 0000–0000, 2013)
Polycystic ovary syndrome (PCOS) is a common con-dition of women in the reproductive age, with a num-
ber of potential clinical consequences, including an in-creased risk for infertility, dysfunctional bleeding,endometrial hyperplasia, obesity, and insulin resistance
with the associated metabolic alterations. Moreover, thesesubjects have an increased risk of endometrial carcinomaand possibly cardiovascular disease later in life (1, 2).
Unfortunately, there are no unequivocal criteria for di-agnosing PCOS, and its definition remains controversial.
ISSN Print 0021-972X ISSN Online 1945-7197Printed in U.S.A.Copyright © 2013 by The Endocrine SocietyReceived November 15, 2012. Accepted February 13, 2013.
Abbreviations: AE-PCOS, Androgen Excess and PCOS Society; BP, blood pressure; CV,coefficient of variation; ESHRE/ASRM, European Society of Human Reproduction and Em-bryology/American Society for Reproductive Medicine; OR, odds ratio; PCO, polycysticovary; PCOS, polycystic ovary syndrome.
O R I G I N A L A R T I C L E
E n d o c r i n e C a r e
doi: 10.1210/jc.2012-3908 J Clin Endocrinol Metab jcem.endojournals.org 1
J Clin Endocrin Metab. First published ahead of print March 8, 2013 as doi:10.1210/jc.2012-3908
Copyright (C) 2013 by The Endocrine Society
According to the 2003 Rotterdam European Society ofHuman Reproduction and Embryology/American Societyfor Reproductive Medicine (ESHRE/ASRM) consensusworkshop (3), PCOS may be diagnosed by the presence ofat least 2 of 3 cardinal features: hyperandrogenism,chronic oligoanovulation, and polycystic ovary (PCO)morphology, after exclusion of secondary causes. Thisdefinition widened the previous diagnostic boundaries ofthe syndrome, set out in 1990 by a National Institutes ofHealth consensus conference (4), with two major conse-quences: (1) PCOS prevalence has risen substantially,from 6–8% to 12–20% (5, 6); and (2) according to thevarious possible combinations of the 3 above-mentioneddiagnostic features in each individual subject, adoption ofthe Rotterdam criteria has introduced different PCOS phe-notypes, subsequently named classic (characterized by hy-perandrogenism and oligoanovulation, with or withoutPCO morphology, and corresponding to the previous Na-tional Institutes of Health definition), ovulatory (hyperan-drogenism and PCO), and normoandrogenic (oligoan-ovulation and PCO).
In 2006, the Rotterdam criteria were brought into ques-tion by the Androgen Excess and PCOS Society (AE-PCOS). The document summarizing this discussion con-firmed that PCOS diagnosis should be based on the 3clinical features indicated by the ESHRE/ASRM consen-sus. However, it established a hierarchical order of thesefeatures, in that hyperandrogenism was considered fun-damental, combined with oligoanovulation and/or PCOmorphology (1). As a consequence, the AE-PCOS positionexcluded the possibility of a normoandrogenic PCOS phe-notype. The debate on these issues is still ongoing.
One major implication of the increased clinical heter-ogeneity underpinning adoption of the Rotterdam diag-nostic criteria comes from the hypothesis that the differentPCOS phenotypes could diverge in terms of insulin resis-tance (7). If confirmed, this hypothesis suggests that thesepatients should be screened differently and possiblytreated differently for the metabolic dysfunction. On theother hand, these findings may actually reflect disparitiesin obesity, which seems to be associated differently withthe various PCOS phenotypes (8).
A better understanding of these issues may also havesignificant theoretical implications, because it was arguedthat if the various PCOS phenotypes have the same overallmorbidity in terms of insulin resistance, then the conclu-sion that they all really reflect the same overall syndromewould be strongly supported (1).
Insulin resistance is not a disease per se, but rather it isa common physiological abnormality increasing the like-lihood that several alterations may occur (9). In this re-gard, it is noteworthy that insulin resistance probably
plays a pathogenetic role in PCOS (10). Moreover, it is aforerunner of several metabolic alterations, which alsooccur frequently in these subjects. It has been estimatedthat about 70% of women with PCOS are insulin resistant(11, 12). However, the true prevalence of this phenome-non in subjects with PCOS and it stratification among thedifferent PCOS phenotypes remain unclear issues, becauseinterpretation of available studies is constrained by severallimitations, particularly with regard to methods used toassess insulin sensitivity.
The hyperinsulinemic-euglycemic clamp is the bestavailable technique for measurement of in vivo insulinsensitivity (13). However, it is complex and expensive.Therefore, epidemiological studies generally rely on sur-rogate indices, based on measurement of insulin and glu-cose levels (14). Unfortunately, although all these indirectestimates correlate with the direct measures of insulin ac-tion, the degree of correlation is limited (15–18). More-over, most of these studies used routine testosterone as-says. These methods generally have poor sensitivity andaccuracy in the female range (19, 20), making assessmentof hyperandrogenism and, consequently, of PCOS pheno-types imprecise.
The aim of this study was to assess whether either thedifferent features used for diagnosing PCOS or their com-binations into the PCOS phenotypes may be helpful inpredicting insulin resistance in these women. To answerthis question, 137 women with PCOS were carefully char-acterized, using state-of-the-art methods.
Subjects and Methods
SubjectsA total of 137 consecutive Caucasian women with PCOS,
recruited in the Verona PCOS Pathophysiology and Phenotype(Verona 3P) Study, an ongoing project with the aim of buildinga detailed resource for assessing the relationships between thedifferent features of these women, were studied. All of them hadbeen referred to the Division of Endocrinology, Diabetes andMetabolism of Verona Hospital, Verona, Italy, for oligoamen-orrhea and/or hyperandrogenism. Inclusion criteria were a con-firmed diagnosis of PCOS and age 18 to 40 years. Exclusioncriteria were diabetes mellitus or other diseases or use of medi-cations that could potentially interfere with the evaluations car-ried out in the study. In particular, patients should not havereceived oral contraceptives, insulin-sensitizing agents, antian-drogens, or glucocorticoids in the past 6 months.
PCOS was diagnosed according to criteria indicated by theRotterdam Workshop (3), ie, the presence of at least 2 of thefollowing 3 features: clinical and/or biochemical hyperandro-genism, chronic oligoanovulation, and PCO morphology, afterexclusion of secondary causes. Hyperandrogenism was definedby presence of hirsutism and/or increased free testosterone.Acne, alopecia, and serum androgens other than free testoster-one were not used to diagnose hyperandrogenism, because they
2 Moghetti et al Insulin Resistance in PCOS Phenotypes J Clin Endocrinol Metab
are less specific and add a limited incremental amount to diag-nosis of PCOS (1). Chronic oligoanovulation was diagnosed bypresence of either oligoamenorrhea (fewer than 9 cycles per year)or a luteal phase serum progesterone level less than 12 nmol/L.In most cases, progesterone measurement was repeated in 2 sub-sequent menstrual cycles. PCO was diagnosed according toESHRE/ASRM recommendations (3). Secondary causes ofPCOS were ruled out by systematic 17-hydroxyprogesterone,prolactin, and TSH assays.
All the participants gave their written informed consent be-fore the study, which was conducted according to the Declara-tion of Helsinki and approved by our institutional ethicscommittee.
ProtocolSubjects included in the study underwent complete medical
examination, assessment of endocrine and metabolic featuresand glucose tolerance, ultrasound evaluation of ovarian mor-phology, and measurement of insulin sensitivity.
Medical examination comprised measurement of bodyweight and height, waist circumference, blood pressure (BP), andhirsutism score. Elevated BP values were confirmed on 2 occa-sions. Hirsutism was assessed by the modified Ferriman-Gallweyscore, the gold standard for clinical evaluation of hirsutism (21),with a cutoff point of �8.
Subsequently, in the early follicular phase of a spontaneousmenstrual cycle, or, in women with severe menstrual alterations,after at least 3 months of amenorrhea, a fasting venous bloodsample was drawn for metabolic and hormonal profile assess-ment. A standard 75-g oral glucose tolerance test was also per-formed, with measurement of plasma glucose and insulin at fast-ing and every 30 minutes for 2 hours.
Ovarian morphology was evaluated by 1 of 2 experiencedgynecologists, by a transvaginal approach whenever possible,with a Voluson 730 PRO device (GE Healthcare, Milwaukee,Wisconsin), equipped with volumetric 3-dimensional probes.Ovary volume was calculated using the ellipsoid formula(length � height � width � �/6).
Insulin sensitivity was assessed by the glucose clamp tech-nique as described previously (22), using a primed insulin infu-sion rate of 80 mU/m2 � min. The duration of the clamp was 120minutes, and the glucose disposal rate was calculated during thelast 30 minutes, with standard equation (23). Because muscle isresponsible for most insulin-induced glucose metabolism (24),data are expressed per fat-free mass (FFM). Body compositionwas assessed by bioelectrical impedance (Bia-103; Akern, Flor-ence, Italy) (25).
Metabolic syndrome was diagnosed according to the 2009Joint Interim Statement of the International Diabetes Federation(IDF) and other societies (26). This document revised the AdultTreatment Panel III (ATP III) diagnostic criteria for metabolicsyndrome (27), concluding that the cutoff point for waist cir-cumference to define abdominal obesity should be � 80cm inwomen of European origin, as were the women recruited in thepresent study.
In 4 women with PCOS (3 with the classic phenotype and 1with the ovulatory phenotype), glucose clamp studies were notcompleted, because of technical problems. Therefore, clampdata refer to 133 subjects. Metabolic syndrome could be diag-
nosed as present or absent in 134 women. Diagnosis in 3 subjectswith the classic phenotype was not possible because of missinglipid data.
A historical sample of 24 healthy nonhirsute women, withregular menstrual cycles and normal ovarian morphology,served as the reference cohort for clamp data, whereas 51 womenwith the same characteristics served to define the reference in-terval for serum testosterone.
AssaysPlasma glucose was measured by the glucose-oxidase
method, using a glucose analyzer (YSI-2300 Stat Plus; YSI Inc,Yellow Springs, Ohio).
Serum total testosterone was measured by liquid chromatog-raphy-mass spectrometry using a Micromass Quattro PremierXE Mass Spectrometer (Waters Corporation, Milford, Massa-chusetts). The limit of quantification was 2.5 ng/dL and the intra-assay coefficient of variation (CV) was 9.1% at concentration 14ng/dL, and interassay CV was 9.3% at concentration 26 ng/dL.The free testosterone fraction was estimated by equilibrium di-alysis (28, 29); the interassay CV was �8%.
SHBG and insulin were assayed by immunoradiometricmethods (Orion Diagnostica, Espoo, Finland; and Biosource,Fleurus, Belgium, respectively) and gonadotropins by an auto-mated chemiluminescent method (Advia Centaur XP; Siemens,Tarrytown, New York). Serum lipids were determined by stan-dard laboratory procedures.
Statistical analysisContinuous variables are described by median and interquar-
tile range, because most of them (except for the M-clamp value,total cholesterol, and BP) were not normally distributed. Cate-gorical variables are summarized by percentages. Nonnormallydistributed variables were log- or square root�transformed be-fore analysis.
Comparisons between phenotypes were performed using1-way ANOVA. Because triglyceride distribution could not benormalized, values were compared by a nonparametric Kruskal-Wallis ANOVA. Multiple post hoc comparisons were performedusing Bonferroni correction.
Multiple regression was used to assess the relationship be-tween the M-clamp value as a dependent continuous variableand the clinical features used in diagnosis of PCOS as indepen-dent variables. Multiple regression analysis was also used tocompare M-clamp values in subjects belonging to the differentPCOS phenotypes vs the historical sample of healthy women,which was included as the reference group, to establish whetherinsulin sensitivity was abnormal in each PCOS phenotype. Thesame analyses were performed with adjustment for age and fatmass (analysis of covariance).
Logistic regression analyses were performed to investigate theassociations between the dichotomized M-clamp variable (insu-lin resistance present or absent) as a dependent categorical vari-able and either the PCOS diagnostic features or the PCOS phe-notypes as independent variables. In a second step, adjustmentsfor age and fat mass were performed. In these analyses, insulinresistance was defined by a M-clamp value below the 25th per-centile (11.75 mg/kg FFM � min) of the distribution in healthywomen, according to the World Health Organization and theEuropean Group for the Study of Insulin Resistance (EGIR) def-initions of insulin resistance (30, 31).
doi: 10.1210/jc.2012-3908 jcem.endojournals.org 3
Percentages of women with metabolic syndrome in the dif-ferent PCOS phenotype groups were compared using the Fisherexact test.
For power calculation, the primary endpoint was risk of in-sulin resistance in each PCOS phenotype. From the limited avail-able literature, the prevalence of insulin resistance in thesewomen is about 70% (11, 12). To detect a difference with respectto the reference population, in which this prevalence is by defi-nition 25%, with an � error � .05 and power � .80 and a 2-sidedtest, 19 subjects per group are required.
Analyses were performed using STATA version 10.1 (Stata-Corp, College Station, Texas).
Results
In the whole sample of 137 women with PCOS included inthe study, 84.7% had hyperandrogenism, 84.7% hadchronic oligoanovulation, and 89% had PCO morphol-ogy. According to the individual combinations of thesefeatures, 95 (69.4%) of these women had the classic phe-notype, whereas 21 (15.3%) had the ovulatory pheno-type, and the remaining 21 (15.3%) had the normoan-drogenic phenotype.
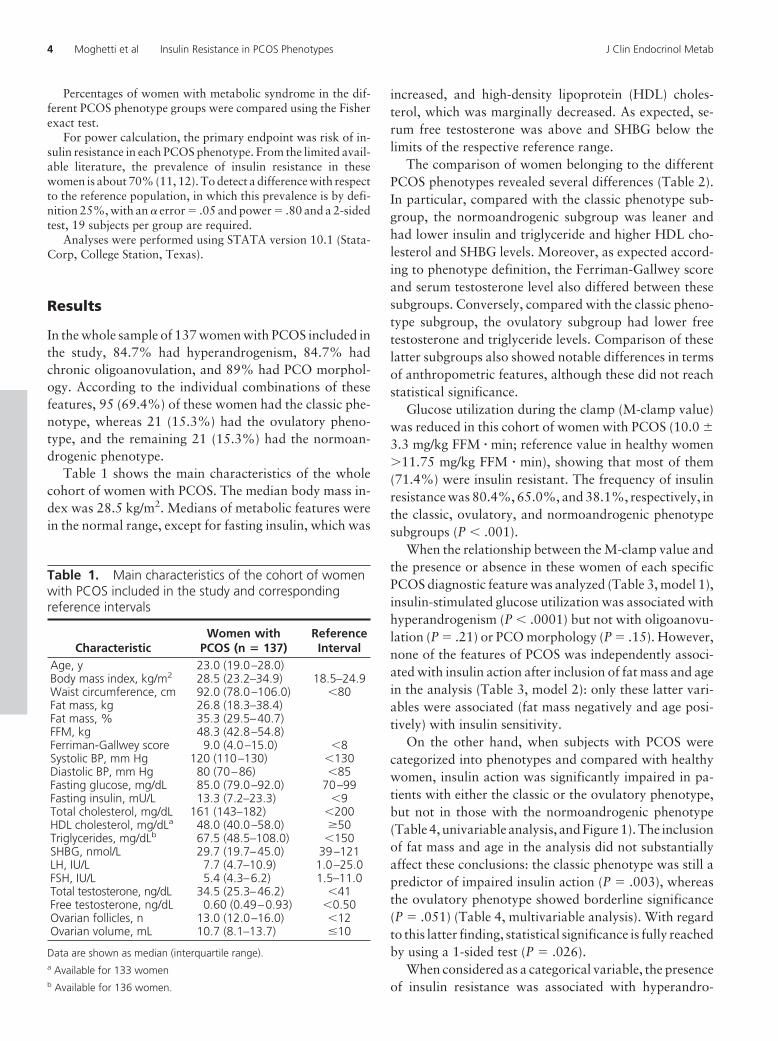
Table 1 shows the main characteristics of the wholecohort of women with PCOS. The median body mass in-dex was 28.5 kg/m2. Medians of metabolic features werein the normal range, except for fasting insulin, which was
increased, and high-density lipoprotein (HDL) choles-terol, which was marginally decreased. As expected, se-rum free testosterone was above and SHBG below thelimits of the respective reference range.
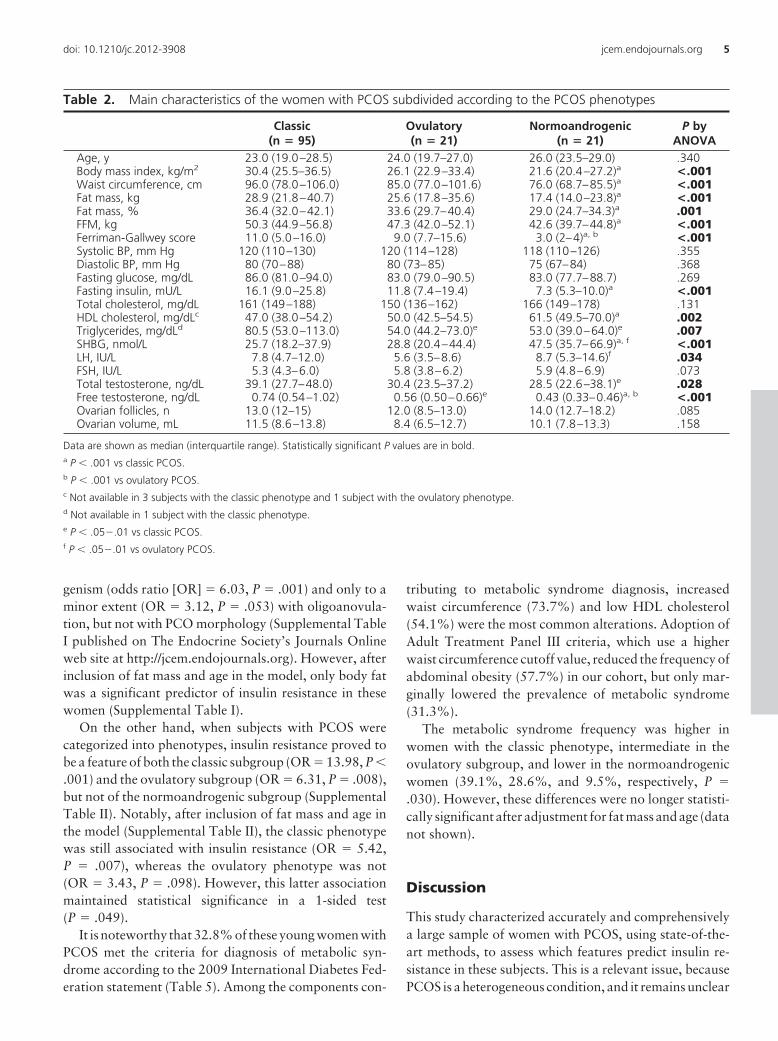
The comparison of women belonging to the differentPCOS phenotypes revealed several differences (Table 2).In particular, compared with the classic phenotype sub-group, the normoandrogenic subgroup was leaner andhad lower insulin and triglyceride and higher HDL cho-lesterol and SHBG levels. Moreover, as expected accord-ing to phenotype definition, the Ferriman-Gallwey scoreand serum testosterone level also differed between thesesubgroups. Conversely, compared with the classic pheno-type subgroup, the ovulatory subgroup had lower freetestosterone and triglyceride levels. Comparison of theselatter subgroups also showed notable differences in termsof anthropometric features, although these did not reachstatistical significance.
Glucose utilization during the clamp (M-clamp value)was reduced in this cohort of women with PCOS (10.0 �3.3 mg/kg FFM � min; reference value in healthy women�11.75 mg/kg FFM � min), showing that most of them(71.4%) were insulin resistant. The frequency of insulinresistance was 80.4%, 65.0%, and 38.1%, respectively, inthe classic, ovulatory, and normoandrogenic phenotypesubgroups (P � .001).
When the relationship between the M-clamp value andthe presence or absence in these women of each specificPCOS diagnostic feature was analyzed (Table 3, model 1),insulin-stimulated glucose utilization was associated withhyperandrogenism (P � .0001) but not with oligoanovu-lation (P � .21) or PCO morphology (P � .15). However,none of the features of PCOS was independently associ-ated with insulin action after inclusion of fat mass and agein the analysis (Table 3, model 2): only these latter vari-ables were associated (fat mass negatively and age posi-tively) with insulin sensitivity.
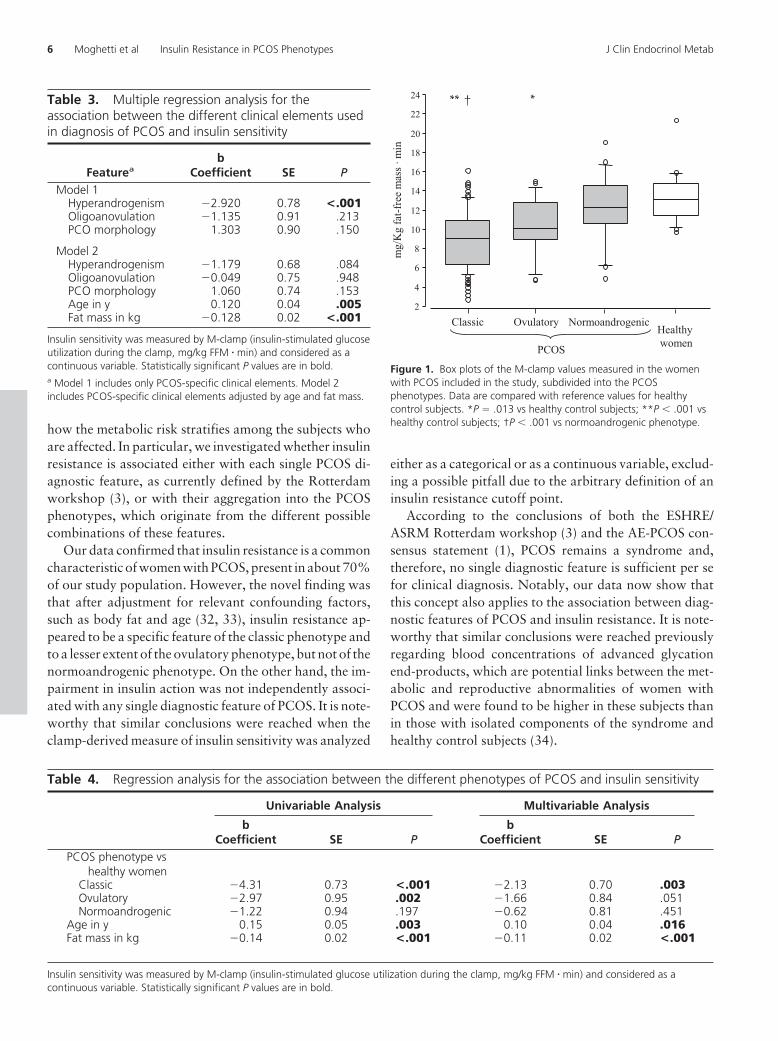
On the other hand, when subjects with PCOS werecategorized into phenotypes and compared with healthywomen, insulin action was significantly impaired in pa-tients with either the classic or the ovulatory phenotype,but not in those with the normoandrogenic phenotype(Table 4, univariable analysis, and Figure 1). The inclusionof fat mass and age in the analysis did not substantiallyaffect these conclusions: the classic phenotype was still apredictor of impaired insulin action (P � .003), whereasthe ovulatory phenotype showed borderline significance(P � .051) (Table 4, multivariable analysis). With regardto this latter finding, statistical significance is fully reachedby using a 1-sided test (P � .026).
When considered as a categorical variable, the presenceof insulin resistance was associated with hyperandro-
Table 1. Main characteristics of the cohort of womenwith PCOS included in the study and correspondingreference intervals
CharacteristicWomen with
PCOS (n � 137)ReferenceInterval
Age, y 23.0 (19.0–28.0)Body mass index, kg/m2 28.5 (23.2–34.9) 18.5–24.9Waist circumference, cm 92.0 (78.0–106.0) �80Fat mass, kg 26.8 (18.3–38.4)Fat mass, % 35.3 (29.5–40.7)FFM, kg 48.3 (42.8–54.8)Ferriman-Gallwey score 9.0 (4.0–15.0) �8Systolic BP, mm Hg 120 (110–130) �130Diastolic BP, mm Hg 80 (70–86) �85Fasting glucose, mg/dL 85.0 (79.0–92.0) 70–99Fasting insulin, mU/L 13.3 (7.2–23.3) �9Total cholesterol, mg/dL 161 (143–182) �200HDL cholesterol, mg/dLa 48.0 (40.0–58.0) �50Triglycerides, mg/dLb 67.5 (48.5–108.0) �150SHBG, nmol/L 29.7 (19.7–45.0) 39–121LH, IU/L 7.7 (4.7–10.9) 1.0–25.0FSH, IU/L 5.4 (4.3–6.2) 1.5–11.0Total testosterone, ng/dL 34.5 (25.3–46.2) �41Free testosterone, ng/dL 0.60 (0.49–0.93) �0.50Ovarian follicles, n 13.0 (12.0–16.0) �12Ovarian volume, mL 10.7 (8.1–13.7) �10
Data are shown as median (interquartile range).a Available for 133 womenb Available for 136 women.
4 Moghetti et al Insulin Resistance in PCOS Phenotypes J Clin Endocrinol Metab
genism (odds ratio [OR] � 6.03, P � .001) and only to aminor extent (OR � 3.12, P � .053) with oligoanovula-tion, but not with PCO morphology (Supplemental TableI published on The Endocrine Society’s Journals Onlineweb site at http://jcem.endojournals.org). However, afterinclusion of fat mass and age in the model, only body fatwas a significant predictor of insulin resistance in thesewomen (Supplemental Table I).
On the other hand, when subjects with PCOS werecategorized into phenotypes, insulin resistance proved tobe a feature of both the classic subgroup (OR � 13.98, P �.001) and the ovulatory subgroup (OR � 6.31, P � .008),but not of the normoandrogenic subgroup (SupplementalTable II). Notably, after inclusion of fat mass and age inthe model (Supplemental Table II), the classic phenotypewas still associated with insulin resistance (OR � 5.42,P � .007), whereas the ovulatory phenotype was not(OR � 3.43, P � .098). However, this latter associationmaintained statistical significance in a 1-sided test(P � .049).
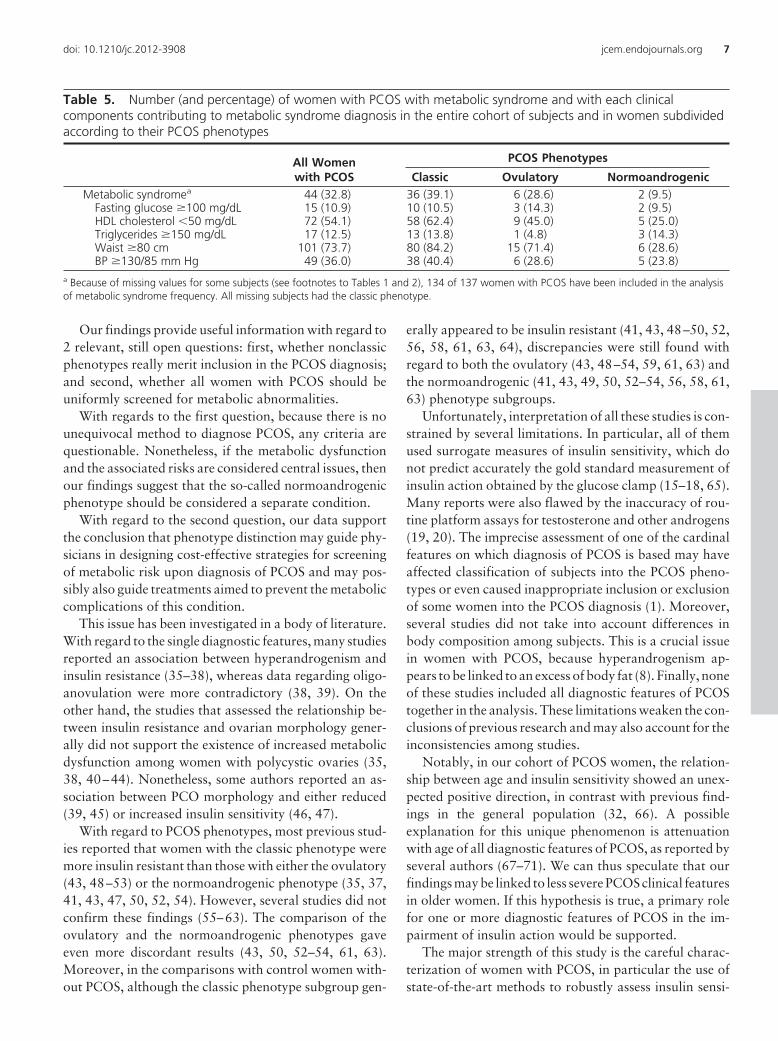
It is noteworthy that 32.8% of these young women withPCOS met the criteria for diagnosis of metabolic syn-drome according to the 2009 International Diabetes Fed-eration statement (Table 5). Among the components con-
tributing to metabolic syndrome diagnosis, increasedwaist circumference (73.7%) and low HDL cholesterol(54.1%) were the most common alterations. Adoption ofAdult Treatment Panel III criteria, which use a higherwaist circumference cutoff value, reduced the frequency ofabdominal obesity (57.7%) in our cohort, but only mar-ginally lowered the prevalence of metabolic syndrome(31.3%).
The metabolic syndrome frequency was higher inwomen with the classic phenotype, intermediate in theovulatory subgroup, and lower in the normoandrogenicwomen (39.1%, 28.6%, and 9.5%, respectively, P �.030). However, these differences were no longer statisti-cally significant after adjustment for fat mass and age (datanot shown).
Discussion
This study characterized accurately and comprehensivelya large sample of women with PCOS, using state-of-the-art methods, to assess which features predict insulin re-sistance in these subjects. This is a relevant issue, becausePCOS is a heterogeneous condition, and it remains unclear
Table 2. Main characteristics of the women with PCOS subdivided according to the PCOS phenotypes
Classic(n � 95)
Ovulatory(n � 21)
Normoandrogenic(n � 21)
P byANOVA
Age, y 23.0 (19.0–28.5) 24.0 (19.7–27.0) 26.0 (23.5–29.0) .340Body mass index, kg/m2 30.4 (25.5–36.5) 26.1 (22.9–33.4) 21.6 (20.4–27.2)a <.001Waist circumference, cm 96.0 (78.0–106.0) 85.0 (77.0–101.6) 76.0 (68.7–85.5)a <.001Fat mass, kg 28.9 (21.8–40.7) 25.6 (17.8–35.6) 17.4 (14.0–23.8)a <.001Fat mass, % 36.4 (32.0–42.1) 33.6 (29.7–40.4) 29.0 (24.7–34.3)a .001FFM, kg 50.3 (44.9–56.8) 47.3 (42.0–52.1) 42.6 (39.7–44.8)a <.001Ferriman-Gallwey score 11.0 (5.0–16.0) 9.0 (7.7–15.6) 3.0 (2–4)a, b <.001Systolic BP, mm Hg 120 (110–130) 120 (114–128) 118 (110–126) .355Diastolic BP, mm Hg 80 (70–88) 80 (73–85) 75 (67–84) .368Fasting glucose, mg/dL 86.0 (81.0–94.0) 83.0 (79.0–90.5) 83.0 (77.7–88.7) .269Fasting insulin, mU/L 16.1 (9.0–25.8) 11.8 (7.4–19.4) 7.3 (5.3–10.0)a <.001Total cholesterol, mg/dL 161 (149–188) 150 (136–162) 166 (149–178) .131HDL cholesterol, mg/dLc 47.0 (38.0–54.2) 50.0 (42.5–54.5) 61.5 (49.5–70.0)a .002Triglycerides, mg/dLd 80.5 (53.0–113.0) 54.0 (44.2–73.0)e 53.0 (39.0–64.0)e .007SHBG, nmol/L 25.7 (18.2–37.9) 28.8 (20.4–44.4) 47.5 (35.7–66.9)a, f <.001LH, IU/L 7.8 (4.7–12.0) 5.6 (3.5–8.6) 8.7 (5.3–14.6)f .034FSH, IU/L 5.3 (4.3–6.0) 5.8 (3.8–6.2) 5.9 (4.8–6.9) .073Total testosterone, ng/dL 39.1 (27.7–48.0) 30.4 (23.5–37.2) 28.5 (22.6–38.1)e .028Free testosterone, ng/dL 0.74 (0.54–1.02) 0.56 (0.50–0.66)e 0.43 (0.33–0.46)a, b <.001Ovarian follicles, n 13.0 (12–15) 12.0 (8.5–13.0) 14.0 (12.7–18.2) .085Ovarian volume, mL 11.5 (8.6–13.8) 8.4 (6.5–12.7) 10.1 (7.8–13.3) .158
Data are shown as median (interquartile range). Statistically significant P values are in bold.a P � .001 vs classic PCOS.b P � .001 vs ovulatory PCOS.c Not available in 3 subjects with the classic phenotype and 1 subject with the ovulatory phenotype.d Not available in 1 subject with the classic phenotype.e P � .05�.01 vs classic PCOS.f P � .05�.01 vs ovulatory PCOS.
doi: 10.1210/jc.2012-3908 jcem.endojournals.org 5
how the metabolic risk stratifies among the subjects whoare affected. In particular, we investigated whether insulinresistance is associated either with each single PCOS di-agnostic feature, as currently defined by the Rotterdamworkshop (3), or with their aggregation into the PCOSphenotypes, which originate from the different possiblecombinations of these features.
Our data confirmed that insulin resistance is a commoncharacteristic of women with PCOS, present in about 70%of our study population. However, the novel finding wasthat after adjustment for relevant confounding factors,such as body fat and age (32, 33), insulin resistance ap-peared to be a specific feature of the classic phenotype andto a lesser extent of the ovulatory phenotype, but not of thenormoandrogenic phenotype. On the other hand, the im-pairment in insulin action was not independently associ-ated with any single diagnostic feature of PCOS. It is note-worthy that similar conclusions were reached when theclamp-derived measure of insulin sensitivity was analyzed
either as a categorical or as a continuous variable, exclud-ing a possible pitfall due to the arbitrary definition of aninsulin resistance cutoff point.
According to the conclusions of both the ESHRE/ASRM Rotterdam workshop (3) and the AE-PCOS con-sensus statement (1), PCOS remains a syndrome and,therefore, no single diagnostic feature is sufficient per sefor clinical diagnosis. Notably, our data now show thatthis concept also applies to the association between diag-nostic features of PCOS and insulin resistance. It is note-worthy that similar conclusions were reached previouslyregarding blood concentrations of advanced glycationend-products, which are potential links between the met-abolic and reproductive abnormalities of women withPCOS and were found to be higher in these subjects thanin those with isolated components of the syndrome andhealthy control subjects (34).
2
4
6
8
10
12
14
16
18
20
22
24
Classic Ovulatory NormoandrogenicHealthy women
mg/
Kg
fat-f
ree
mas
s ·m
in
PCOS
** † *
Figure 1. Box plots of the M-clamp values measured in the womenwith PCOS included in the study, subdivided into the PCOSphenotypes. Data are compared with reference values for healthycontrol subjects. *P � .013 vs healthy control subjects; **P � .001 vshealthy control subjects; †P � .001 vs normoandrogenic phenotype.
Table 3. Multiple regression analysis for theassociation between the different clinical elements usedin diagnosis of PCOS and insulin sensitivity
Featureab
Coefficient SE PModel 1
Hyperandrogenism �2.920 0.78 <.001Oligoanovulation �1.135 0.91 .213PCO morphology 1.303 0.90 .150
Model 2Hyperandrogenism �1.179 0.68 .084Oligoanovulation �0.049 0.75 .948PCO morphology 1.060 0.74 .153Age in y 0.120 0.04 .005Fat mass in kg �0.128 0.02 <.001
Insulin sensitivity was measured by M-clamp (insulin-stimulated glucoseutilization during the clamp, mg/kg FFM � min) and considered as acontinuous variable. Statistically significant P values are in bold.a Model 1 includes only PCOS-specific clinical elements. Model 2includes PCOS-specific clinical elements adjusted by age and fat mass.
Table 4. Regression analysis for the association between the different phenotypes of PCOS and insulin sensitivity
Univariable Analysis Multivariable Analysis
bCoefficient SE P
bCoefficient SE P
PCOS phenotype vshealthy women
Classic �4.31 0.73 <.001 �2.13 0.70 .003Ovulatory �2.97 0.95 .002 �1.66 0.84 .051Normoandrogenic �1.22 0.94 .197 �0.62 0.81 .451
Age in y 0.15 0.05 .003 0.10 0.04 .016Fat mass in kg �0.14 0.02 <.001 �0.11 0.02 <.001
Insulin sensitivity was measured by M-clamp (insulin-stimulated glucose utilization during the clamp, mg/kg FFM � min) and considered as acontinuous variable. Statistically significant P values are in bold.
6 Moghetti et al Insulin Resistance in PCOS Phenotypes J Clin Endocrinol Metab
Our findings provide useful information with regard to2 relevant, still open questions: first, whether nonclassicphenotypes really merit inclusion in the PCOS diagnosis;and second, whether all women with PCOS should beuniformly screened for metabolic abnormalities.
With regards to the first question, because there is nounequivocal method to diagnose PCOS, any criteria arequestionable. Nonetheless, if the metabolic dysfunctionand the associated risks are considered central issues, thenour findings suggest that the so-called normoandrogenicphenotype should be considered a separate condition.
With regard to the second question, our data supportthe conclusion that phenotype distinction may guide phy-sicians in designing cost-effective strategies for screeningof metabolic risk upon diagnosis of PCOS and may pos-sibly also guide treatments aimed to prevent the metaboliccomplications of this condition.
This issue has been investigated in a body of literature.With regard to the single diagnostic features, many studiesreported an association between hyperandrogenism andinsulin resistance (35–38), whereas data regarding oligo-anovulation were more contradictory (38, 39). On theother hand, the studies that assessed the relationship be-tween insulin resistance and ovarian morphology gener-ally did not support the existence of increased metabolicdysfunction among women with polycystic ovaries (35,38, 40–44). Nonetheless, some authors reported an as-sociation between PCO morphology and either reduced(39, 45) or increased insulin sensitivity (46, 47).
With regard to PCOS phenotypes, most previous stud-ies reported that women with the classic phenotype weremore insulin resistant than those with either the ovulatory(43, 48–53) or the normoandrogenic phenotype (35, 37,41, 43, 47, 50, 52, 54). However, several studies did notconfirm these findings (55–63). The comparison of theovulatory and the normoandrogenic phenotypes gaveeven more discordant results (43, 50, 52–54, 61, 63).Moreover, in the comparisons with control women with-out PCOS, although the classic phenotype subgroup gen-
erally appeared to be insulin resistant (41, 43, 48–50, 52,56, 58, 61, 63, 64), discrepancies were still found withregard to both the ovulatory (43, 48–54, 59, 61, 63) andthe normoandrogenic (41, 43, 49, 50, 52–54, 56, 58, 61,63) phenotype subgroups.
Unfortunately, interpretation of all these studies is con-strained by several limitations. In particular, all of themused surrogate measures of insulin sensitivity, which donot predict accurately the gold standard measurement ofinsulin action obtained by the glucose clamp (15–18, 65).Many reports were also flawed by the inaccuracy of rou-tine platform assays for testosterone and other androgens(19, 20). The imprecise assessment of one of the cardinalfeatures on which diagnosis of PCOS is based may haveaffected classification of subjects into the PCOS pheno-types or even caused inappropriate inclusion or exclusionof some women into the PCOS diagnosis (1). Moreover,several studies did not take into account differences inbody composition among subjects. This is a crucial issuein women with PCOS, because hyperandrogenism ap-pears to be linked to an excess of body fat (8). Finally, noneof these studies included all diagnostic features of PCOStogether in the analysis. These limitations weaken the con-clusions of previous research and may also account for theinconsistencies among studies.
Notably, in our cohort of PCOS women, the relation-ship between age and insulin sensitivity showed an unex-pected positive direction, in contrast with previous find-ings in the general population (32, 66). A possibleexplanation for this unique phenomenon is attenuationwith age of all diagnostic features of PCOS, as reported byseveral authors (67–71). We can thus speculate that ourfindings may be linked to less severe PCOS clinical featuresin older women. If this hypothesis is true, a primary rolefor one or more diagnostic features of PCOS in the im-pairment of insulin action would be supported.
The major strength of this study is the careful charac-terization of women with PCOS, in particular the use ofstate-of-the-art methods to robustly assess insulin sensi-
Table 5. Number (and percentage) of women with PCOS with metabolic syndrome and with each clinicalcomponents contributing to metabolic syndrome diagnosis in the entire cohort of subjects and in women subdividedaccording to their PCOS phenotypes
All Womenwith PCOS
PCOS Phenotypes
Classic Ovulatory NormoandrogenicMetabolic syndromea 44 (32.8) 36 (39.1) 6 (28.6) 2 (9.5)
Fasting glucose �100 mg/dL 15 (10.9) 10 (10.5) 3 (14.3) 2 (9.5)HDL cholesterol �50 mg/dL 72 (54.1) 58 (62.4) 9 (45.0) 5 (25.0)Triglycerides �150 mg/dL 17 (12.5) 13 (13.8) 1 (4.8) 3 (14.3)Waist �80 cm 101 (73.7) 80 (84.2) 15 (71.4) 6 (28.6)BP �130/85 mm Hg 49 (36.0) 38 (40.4) 6 (28.6) 5 (23.8)
a Because of missing values for some subjects (see footnotes to Tables 1 and 2), 134 of 137 women with PCOS have been included in the analysisof metabolic syndrome frequency. All missing subjects had the classic phenotype.
doi: 10.1210/jc.2012-3908 jcem.endojournals.org 7

tivity and hyperandrogenism. This assessment adds morevalidity to the argument that there is a scale of metabolicrisk among PCOS phenotypes. Although, to the best of ourknowledge, this is the largest published study to use thegold standard technique to measure insulin sensitivity inthese women, the number of subjects with the nonclassicphenotypes was still limited. Moreover, extrapolation ofthese findings to non-Caucasian women with PCOSshould be undertaken with caution.
In conclusion, insulin resistance is a common feature inwomen with PCOS. However, there is a scale of metabolicrisk in these subjects. Although no single diagnostic fea-ture of PCOS is independently associated with impairedinsulin action, the combinations of these features, whichdefine PCOS phenotypes, may allow physicians to estab-lish which women merit screening for metabolic dysfunc-tion. From a metabolic point of view, women with thenormoandrogenic phenotype behave as a separate group.
Acknowledgments
We thank all the participants in this study and the staff of theEndocrinology, Diabetes and Metabolism Unit, University ofVerona and Azienda Ospedaliera Universitaria Integrata Ve-rona, Verona, Italy, for their invaluable work.
Address all correspondence and requests for reprints to:Prof. Paolo Moghetti, Section of Endocrinology, Diabetesand Metabolism, Department of Medicine, University ofVerona, Piazzale Stefani, 1-I-37126 Verona, Italy. E-mail:[email protected].
This work was supported by academic grants from the Uni-versity of Verona (to P.M.).
Disclosure Summary: The authors have nothing to disclose.
References
1. Azziz R, Carmina E, Dewailly D, et al. The Androgen Excess andPCOS Society criteria for the polycystic ovary syndrome: the com-plete task force report. Fertil Steril. 2009;91:456–488.
2. Randeva HS, Tan BK, Weickert MO, et al. Cardiometabolic aspectsof the polycystic ovary syndrome. Endocr Rev. 2012;33:812–841.
3. The Rotterdam ESHRE/ASRM-Sponsored PCOS Consensus Work-shop Group. Revised 2003 consensus on diagnostic criteria andlong-term health risks related to polycystic ovary syndrome. FertilSteril. 2004;81:19–25.
4. Zawadzki JK, Dunaif A. Diagnostic criteria for polycystic ovarysyndrome: towards a rational approach. In: Dunaif A, Givens JR,Haseltine FP, Merriam GR, eds. Polycystic Ovary Syndrome. Cam-bridge, MA: Blackwell Scientific Publications; 1992:377–384.
5. March WA, Moore VM, Willson KJ, Phillips DI, Norman RJ, DaviesMJ. The prevalence of polycystic ovary syndrome in a communitysample assessed under contrasting diagnostic criteria. Hum Reprod.2010;25:544–551.
6. Yildiz BO, Bozdag G, Yapici Z, Esinler I, Yarali H. Prevalence,phenotype and cardiometabolic risk of polycystic ovary syndrome
under different diagnostic criteria. Hum Reprod. 2012;27:3067–3073.
7. Moran L, Teede H. Metabolic features of the reproductive pheno-types of polycystic ovary syndrome. Hum Reprod Update. 2009;15:477–488.
8. Moran C, Arriaga M, Rodriguez G, Moran S. Obesity differentiallyaffects phenotypes of polycystic ovary syndrome. Int J Endocrinol.2012;2012:317241.
9. Reaven GM. The insulin resistance syndrome: definition and dietaryapproaches to treatment. Annu Rev Nutr. 2005;25:391–406.
10. Diamanti-Kandarakis E, Dunaif A. Insulin resistance and the poly-cystic ovary syndrome revisited: an update on mechanisms and im-plications. Endocr Rev. 2012;33:981–1030.
11. Carmina E, Lobo RA. Use of fasting blood to assess the prevalenceof insulin resistance in women with polycystic ovary syndrome. Fer-til Steril. 2004;82:661–665.
12. DeUgarte CM, Bartolucci AA, Azziz R. Prevalence of insulin resis-tance in the polycystic ovary syndrome using the homeostasis modelassessment. Fertil Steril. 2005;83:1454–1460.
13. Ferrannini E, Mari A. How to measure insulin sensitivity. J Hyper-tens. 1998;16:895–906.
14. Muniyappa R, Lee S, Chen H, Quon MJ. Current approaches forassessing insulin sensitivity and resistance in vivo: advantages, lim-itations, and appropriate usage. Am J Physiol Endocrinol Metab.2008;294:E15–E26.
15. Quon MJ. Limitations of the fasting glucose to insulin ratio as anindex of insulin sensitivity. J Clin Endocrinol Metab. 2001;86:4615–4617.
16. Wallace TM, Levy JC, Matthews DR. Use and abuse of HOMAmodeling. Diabetes Care. 2004;27:1487–1495.
17. Hücking K, Watanabe RM, Stefanovski D, Bergman RN. OGTT-derived measures of insulin sensitivity are confounded by factorsother than insulin sensitivity itself. Obesity (Silver Spring). 2008;16:1938–1945.
18. Buchanan TA, Watanabe RM, Xiang AH. Limitations in surrogatemeasures of insulin resistance. J Clin Endocrinol Metab. 2010;95:4874–4876.
19. Bhasin S, Zhanga A, Coviello A, et al. The impact of assay qualityand reference ranges on clinical decision making in the diagnosis ofandrogen disorders. Steroids. 2008;73:1311–1317.
20. Rosner W, Vesper H, The Endocrine Society and the EndorsingOrganizations. Toward excellence in testosterone testing: a consen-sus statement. J Clin Endocrinol Metab. 2010;95:4542–4548.
21. Escobar-Morreale HF, Carmina E, Dewailly D, et al. Epidemiology,diagnosis and management of hirsutism: a consensus statement bythe Androgen Excess and Polycystic Ovary Syndrome Society. HumReprod Update. 2012;18:146–170.
22. Moghetti P, Tosi F, Castello R, et al. The insulin resistance in womenwith hyperandrogenism is partially reversed by antiandrogen treat-ment: evidence that androgens impairs insulin action in women.J Clin Endocrinol Metab. 1996;81:952–960.
23. DeFronzo RA, Tobin JD, Andres R. Glucose clamp technique: amethod for quantifying insulin secretion and resistance. Am JPhysiol. 1979;237:E214–E223.
24. DeFronzo RA. The triumvirate: �-cell, muscle, liver: a collusionresponsible for NIDDM. Diabetes. 1988;37:667–687.
25. Gray DS, Bray GA, Gemayel N, Kaplan K. Effect of obesity onbioelectrical impedance. Am J Clin Nutr. 1989;50:255–260.
26. Alberti KG, Eckel RH, Grundy SM, et al. Harmonizing the meta-bolic syndrome: a joint interim statement of the International Dia-betes Federation Task Force on Epidemiology and Prevention; Na-tional Heart, Lung, and Blood Institute; American HeartAssociation; World Heart Federation; International AtherosclerosisSociety; and International Association for the Study of Obesity. Cir-culation. 2009;120:1640–1645.
27. National Cholesterol Education Program (NCEP) Expert Panel onDetection, Evaluation, and Treatment of High Blood Cholesterol inAdults (Adult Treatment Panel III). Third Report of the National
8 Moghetti et al Insulin Resistance in PCOS Phenotypes J Clin Endocrinol Metab
Cholesterol Education Program (NCEP) Expert Panel on Detection,Evaluation, and Treatment of High Blood Cholesterol in Adults(Adult Treatment Panel III): final report. Circulation. 2002;106:3143–3421.
28. Vermeulen A, Stoica T, Verdonck L. The apparent free testosteroneconcentration, an index of androgenicity. J Clin Endocrinol. 1971;33:759–767.
29. Vermeulen A, Verdonck L, Kaufman JM. A critical evaluation ofsimple methods for the estimation of free testosterone in serum.J Clin Endocrinol Metab. 1999;84:3666–3672.
30. World Health Organization. Definition, Diagnosis and Classifica-tion of Diabetes Mellitus and Its Complications. Report of a WhoConsultation. Part 1: Diagnosis and Classification of Diabetes Mel-litus. Geneva, Switzerland: World Health Organization; 1999.
31. Balkau B, Charles MA, Drivsholm T, et al. Frequency of the WHOmetabolic syndrome in European cohorts, and an alternative defi-nition of an insulin resistance syndrome. Diabetes Metab. 2002;28:364–376.
32. Ferrannini E, Vichi S, Beck-Nielsen H, Laakso M, Paolisso G, SmithU. Insulin action and age. European Group for the Study of InsulinResistance (EGIR). Diabetes. 1996;45:947–953.
33. Reaven GM. Insulin resistance: the link between obesity and car-diovascular disease. Med Clin North Am. 2011;95:875–892.
34. Diamanti-Kandarakis E, Katsikis I, Piperi C, et al. Increased serumadvanced glycation end-products is a distinct finding in lean womenwith polycystic ovary syndrome (PCOS). Clin Endocrinol (Oxf).2008;69:634–641.
35. Broekmans FJ, Knauff EAH, Valkenburg O, Laven JS, EijkemansMJ, Fauser BCJM. PCOS according to the Rotterdam consensuscriteria: change in prevalence among WHO-II anovulation and as-sociation with metabolic factors. BJOG. 2006;113:1210–1217.
36. Park HR, Choi Y, Lee H-J, OH J-Y, Hong YS, Sung Y-A. Phenotypiccharacteristics according to insulin sensitivity in non-obese Koreanwomen with polycystic ovary syndrome. Diabetes Res Clin Pract.2007;77:S233–S237.
37. Goverde AJ, van Koert AJB, Eijkemans MJ, et al. Indicators formetabolic disturbances in anovulatory women with polycystic ovarysyndrome diagnosed according to the Rotterdam consensus criteria.Hum Reprod. 2009;24:710–717.
38. Svendsen PF, Madsbad S, Nilas L. The insulin-resistant phenotypeof polycystic ovary syndrome. Fertil Steril. 2010;94:1052–1058.
39. Norman RJ, Hague WM, Masters SC, Wang XJ. Subjects with poly-cystic ovaries without hyperandrogenaemia exhibit similar distur-bances in insulin and lipid profiles as those with polycystic ovarysyndrome. Hum Reprod. 1995;10:2258–2261.
40. Legro RS, Chiu P, Kunselman AR, et al. Polycystic ovaries are com-mon in women with hyperandrogenic chronic anovulation but donot predict metabolic or reproductive phenotype. J Clin EndocrinolMetab. 2005;90:2571–2579.
41. Dewailly D, Catteau-Jonard S, Reyss A-C, Leroy M, Pigny P. Oli-goanovulation with polycystic ovaries but not overt hyperandro-genism. J Clin Endocrinol Metab. 2006;91:3922–3927.
42. Hahn S, Bering van Halteren W, Roesler S, et al. The combinationof increased ovarian volume and follicle number is associated withmore severe hyperandrogenism in German women with polycysticovary syndrome. Exp Clin Endocrinol Diabetes. 2006;114:175–181.
43. Guastella E, Longo RA, Carmina E. Clinical and endocrine char-acteristics of the main polycystic ovary syndrome phenotypes. FertilSteril. 2010;94:2197–2201.
44. Johnstone EB, Rosen MP, Neril R, et al. The polycystic ovary post-Rotterdam: a common, age-dependent finding in ovulatory womenwithout metabolic significance. J Clin Endocrinol Metab. 2010;95:4965–4972.
45. Adams JM, Taylor AE, Crowley WF, Hall JE. Polycystic ovarianmorphology with regular ovulatory cycles: insights into the patho-physiology of polycystic ovarian syndrome. J Clin EndocrinolMetab. 2004;89:4343–4350.
46. Michelmore K, Ong K, Mason S, et al. Clinical features in womenwith polycystic ovaries: relationships to insulin sensitivity, insulingene VNTR and birth weight. Clin Endocrinol (Oxf). 2001;55:439–446.
47. Mehrabian F, Khani B, Kelishadi R, Kermani N. The prevalence ofmetabolic syndrome and insulin resistance according to the pheno-typic subgroups of polycystic ovary syndrome in a representativesample of Iranian females. J Res Med Sci. 2011;16:763–769.
48. Carmina E, Chu MC, Longo RA, Rini GB, Lobo RA. Phenotypicvariation in hyperandrogenic women influences the findings of ab-normal metabolic and cardiovascular risk parameters. J Clin Endo-crinol Metab. 2005;90:2545–2549.
49. Welt CK, Gudmundsson JA, Arason G, et al. Characterizing discretesubsets of polycystic ovary syndrome as defined by the Rotterdamcriteria: the impact of weight on phenotype and metabolic features.J Clin Endocrinol Metab. 2006;91:4842–4848.
50. Barber TM, Wass JAH, McCarthy MI, Franks S. Metabolic char-acteristics of women with polycystic ovaries and oligo-amenorrhoeabut normal androgen levels: implications for the management ofpolycystic ovary syndrome. Clin Endocrinol. 2007;66:513–517.
51. Rizzo M, Berneis K, Hersberger M, et al. Milder forms of athero-genic dyslipidemia in ovulatory versus anovulatory polycystic ovarysyndrome phenotype. Hum Reprod. 2009;24:2286–2292.
52. Yilmaz M, Isaoglu U, Delibas IB, Kadanali S. Anthropometric, clin-ical and laboratory comparison of four phenotypes of polycysticovary syndrome based on Rotterdam criteria. J Obstet GynaecolRes. 2011;37:1020–1026.
53. Melo AS, Vieira CS, Maltoni Romano LG, Ferriani RA, NavarroPA. The frequency of metabolic syndrome is higher among PCOSBrazilian women with menstrual irregularity plus hyperandro-genism. Reprod Sci. 2011;18:1230–1236.
54. Amato MC, Verghi M, Galluzzo A, Giordano C. The oligomenor-rheic phenotypes of polycystic ovary syndrome are characterized bya high visceral adiposity index: a likely condition of cardiometabolicrisk. Hum Reprod. 2011;26:1486–1494.
55. Shroff R, Syrop CH, Davis W, Van Voorhis BJ, Dokras A. Risk ofmetabolic complications in the new PCOS phenotypes based on theRotterdam criteria. Fertil Steril. 2007;88:1389–1395.
56. Chae SJ, Kim JJ, Choi YM, et al. Clinical and biochemical charac-teristics of polycystic ovary syndrome in Korean women. Hum Re-prod. 2008;23:1924–1931.
57. Kauffman RP, Baker TE, Baker VM, DiMarino P, Castracane VD.Endocrine and metabolic differences among phenotypic expressionsof polycystic ovary syndrome according to the 2003 Rotterdamconsensus criteria. Am J Obstet Gynecol. 2008;198:670.e1–670.e10.
58. Wang Y, Qu JW, Wu XK, Hou LH, Erkkola R, Wang Y. Differentphenotypes of polycystic ovary syndrome by Rotterdam criteria aredifferently steroidogenic but similarly insulin resistant. Fertil Steril.2010;93:1362–1365.
59. Moran LJ, Cameron JD, Strauss BJ, Teede HJ. Vascular function inthe diagnostic categories of polycystic ovary syndrome. Hum Re-prod. 2011;26:2192–2199.
60. Dilbaz B, Ozkaya E, Cinar M, Cakir E, Dilbaz S. Cardiovasculardisease risk characteristics of the main polycystic ovary syndromephenotypes. Endocrinology 2011;39:272–277.
61. Panidis D, Tziomalos K, Misichronis G, et al. Insulin resistance andendocrine characteristics of the different phenotypes of polycysticovary syndrome: a prospective study. Hum Reprod. 2012;27:541–549.
62. Gluszak O, Stopinska-Gluszak U, Glinicki P, et al. Phenotype andmetabolic disorders in polycystic ovary syndrome. ISRN Endocri-nol. 2012;2012:569862.
63. Zhang J, Fan P, Liu H, Bai H, Wang Y, Zhang F. Apolipoprotein A-Iand B levels, dyslipidemia and metabolic syndrome in south-westChinese women with PCOS. Hum Reprod. 2012;27:2484–2493.
64. Diamanti-Kandarakis E, Panidis D. Unravelling the phenotypic map
doi: 10.1210/jc.2012-3908 jcem.endojournals.org 9

of polycystic ovary syndrome (PCOS): a prospective study of 634women with PCOS. Clin Endocrinol. 2007;67:735–742.
65. Diamanti-Kandarakis E, Kouli C, Alexandraki K, Spina G. Failureof mathematical indices to accurately assess insulin resistance inlean, overweight, or obese women with polycystic ovary syndrome.J Clin Endocrinol Metab. 2004;89:1273–1276.
66. Jackson JA, Hawa MI, Roshania RD, Sim BM, DiSilvio L, Jaspan JB.Influence of aging on hepatic and peripheral glucose metabolism inhumans. Diabetes. 1988;36:119–129.
67. Elting MW, Korsen TJ, Rekers-Mombarg LT, Schoemaker J.Women with polycystic ovary syndrome gain regular menstrual cy-cles when aging. Hum Reprod. 2000;15:24–28.
68. Bili H, Laven J, Imani B, Eijkemans MJ, Fauser BC. Age-related
differences in features associated with polycystic ovary syndrome innormogonadotrophic oligo-amenorrhoeic infertile women of repro-ductive years. Eur J Endocrinol. 2001;145:749–755.
69. Alsamarai S, Adams JM, Murphy MK, et al. Criteria for polycysticovarian morphology in polycystic ovary syndrome as a function ofage. J Clin Endocrinol Metab. 2009;94:4961–4970.
70. Brown ZA, Louwers YV, Fong SL, et al. The phenotype of polycysticovary syndrome ameliorates with aging. Fertil Steril. 2011;96:1259–1265.
71. Panidis D, Tziomalos K, Macut D, et al. Cross-sectional analysis ofthe effects of age on the hormonal, metabolic, and ultrasonographicfeatures and the prevalence of the different phenotypes of polycysticovary syndrome. Fertil Steril. 2012;97:494–500.
10 Moghetti et al Insulin Resistance in PCOS Phenotypes J Clin Endocrinol Metab