Embed Size (px)
Citation preview

Diffusive versus Displacive Contact Plasticity of Nanoscale Asperities:Temperature- and Velocity-Dependent Strongest SizeWei Guo,† Zhao Wang,*,† and Ju Li*,‡
†Frontier Institute of Science and Technology, and State Key Laboratory for Mechanical Behavior of Materials, Xi’an JiaotongUniversity, 710054, Xi’an, People’s Republic of China‡Department of Nuclear Science and Engineering and Department of Materials Science and Engineering, Massachusetts Institute ofTechnology, Cambridge, Massachusetts 02139, United States
*S Supporting Information
ABSTRACT: We predict a strongest size for the contactstrength when asperity radii of curvature decrease below 10nm. The reason for such strongest size is found to becorrelated with the competition between the dislocationplasticity and surface diffusional plasticity. The essential roleof temperature is calculated and illustrated in a comprehensiveasperity size-strength-temperature map taking into account theeffect of contact velocity. Such a map should be essential forvarious phenomena related to nanoscale contacts such asnanowire cold welding, self-assembly of nanoparticles andadhesive nanopillar arrays, as well as the electrical, thermal, andmechanical properties of macroscopic interfaces.
KEYWORDS: Material strength, dislocation plasticity, surface diffusion, sub-10 nm, Zener-Hollomon scaling
When two macroscopic solids touch, the atomistic realitiesof their nanoscale contacts are hidden from easy view,
but they actually control how heat, electrical charge, and forcesare transferred across the rough interface.1 The true contactarea, Atrue, defined by atoms of the two bodies that truly interactatomistically (within certain interatomic force/distance cutoffs),is usually much smaller than the nominal macroscopic contactarea A. Atrue/A usually decreases with increasing surfaceroughness of the two bodies and increases with externallyapplied pressure Pext ≡ −Fext/A. Recently, Pastewka andRobbins showed numerically using linear elasticity and half-space Green’s function how Atrue/A depends on Pext (e.g.,linearly) for two self-affine random surfaces, statistically self-similar within profile wavelengths [λs, λL].
2 They found thatwhen the solids are elastically compliant enough, the ratiobetween Atrue/A and Pext diverges due to microscopic adhesion,signifying a “non-sticky”-to-“sticky” transition of the macro-contact.While Pastewka and Robbins’ results are revealing, the
assumptions of linear elasticity, especially at the lowerwavelength cutoff λs “of order nanometers”,2 could be limiting.This is because plasticity by dislocation motion and/ordiffusion can occur, certainly at high enough Pext, but mayalso occur at Pext = 0, as we show below. One may also ask whatcould be a physical basis for the λs cutoff in solving elasticityproblems: is this assumed initial condition reflecting priorhistory with surface diffusional plasticity3 that tends to smoothout profile roughnesses finer than λs? Incidentally, for
nanostructures Jiang et al.4 and Guisbiers and Buchaillot5
have proposed size-dependent effective diffusivity
α= − − ∞
∞ ⎜ ⎟⎡⎣⎢
⎛⎝
⎞⎠⎤⎦⎥D T R D
CTk T R
( , ) exp 120
m
B (1)
affecting nanoscale creep that accompanies the well-establishedmelting-point reduction6,7
α= −∞⎜ ⎟⎛⎝
⎞⎠T R T
R( ) 1
2m m (2)
where R is the radius of curvature of the nanoasperity, Tm∞ isthe bulk thermodynamic melting point, kB is the Boltzmannconstant, and C,α,α,D0∞ are temperature- and size-independentpositive constants. Such “exponentially accelerated” small-sizediffusive kinetics in eq 1 seem to have some experimentalsupport.8,9 While the physical basis for eq 1 is not as well-understood as eq 2, one notes that in the R < 10 nm, and lower-homologous-temperature deformation regime that we aremostly interested in, the effective diffusivity D(T,R) isdominated by the surface diffusion contribution. The activationenergy QS of surface diffusion mathematically could have aleading-order correction proportional to 1/R in an asymptoticexpansion with respect to curvature that physically could be dueto, for example, elasticity effect of the saddle-point config-
Received: June 10, 2015Revised: August 8, 2015Published: August 31, 2015
Letter
pubs.acs.org/NanoLett
© 2015 American Chemical Society 6582 DOI: 10.1021/acs.nanolett.5b02306Nano Lett. 2015, 15, 6582−6585
uration of diffusion, or the ratio of atoms near surfacecrystallographic facet−facet intersections (“surface defects”)among all surface atoms. In other words, the curvature effect onsurface diffusion may be explained by the curvature-dependentconcentration and mobility of “surface defects”. Surfacediffusion could be the key for understanding λs. Recently, itwas demonstrated experimentally that under an external load ora capillarity-generated Young−Laplace pressure, plasticity bysurface diffusion can indeed happen at sub-10 nm length scaleat room temperature.10,11
With the above motivation, it is critical to understand thecharacteristics of plasticity for nanoscale asperities. Manyexperiments have shown that individual nanostructures cansustain close to their ideal strength12 due to dislocationstarvation. The “smaller is stronger” trend provides a strategyfor increasing the material strength by nanostructuring.However, when R goes down to even smaller, surface diffusioncould cause dramatic softening and “smaller is much weaker”.13
Here we look into this issue of diffusive versus displacivecontact plasticity by atomistic simulations using the classicalmolecular dynamics (MD) simulator LAMMPS.14 As shown inthe inset of Figure 1, in our simulations two identical metal
cylinders are moved toward each other. An embedded atommethod potential15 was used to describe the atomisticinteraction of Al, which is chosen because of its elastic isotropythat simplifies the analysis. We have applied displacementcontrol −2Δx(t) between the two rigid outer boundaries in oursimulations. To contrast the outcome of different-size nano-asperities, we define total strain as ε ≡ Δx(t)/R. The stress isdefined by the engineering stress convention σengineering ≡ F/A,where F is the computed total force sustained in one of therigid outer boundaries, and A ≡ (2R)L is the initial projectedcross-sectional area of the cylinder, which is a “nominal”contact area in this simulation. In this paper, the “strength” ofcontact is defined as the time-average of σengineering in the strainrange 0.08−0.2 during loading, so it should be interpreted asplastic “flow strength” and not the initiation or yield strength(see stress−strain curve in Supporting Information forexplanation of the strength measure used). R is varied from 1
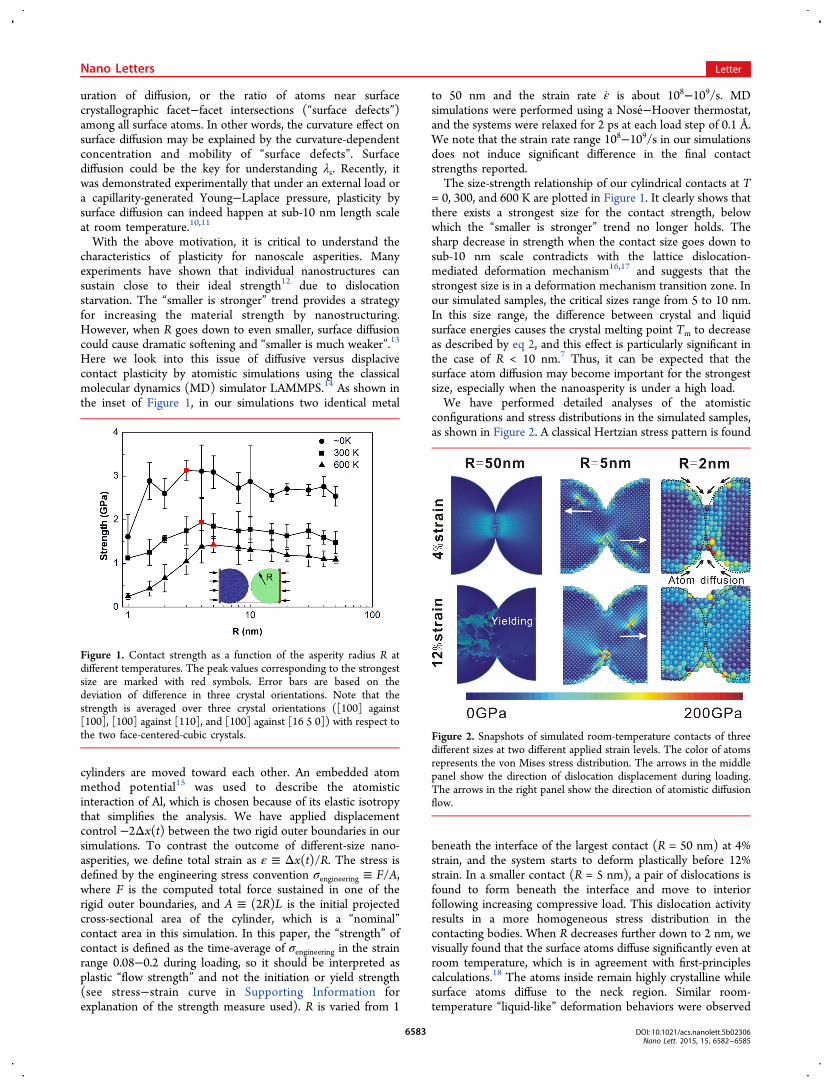
to 50 nm and the strain rate ε is about 108−109/s. MDsimulations were performed using a Nose−Hoover thermostat,and the systems were relaxed for 2 ps at each load step of 0.1 Å.We note that the strain rate range 108−109/s in our simulationsdoes not induce significant difference in the final contactstrengths reported.The size-strength relationship of our cylindrical contacts at T
= 0, 300, and 600 K are plotted in Figure 1. It clearly shows thatthere exists a strongest size for the contact strength, belowwhich the “smaller is stronger” trend no longer holds. Thesharp decrease in strength when the contact size goes down tosub-10 nm scale contradicts with the lattice dislocation-mediated deformation mechanism16,17 and suggests that thestrongest size is in a deformation mechanism transition zone. Inour simulated samples, the critical sizes range from 5 to 10 nm.In this size range, the difference between crystal and liquidsurface energies causes the crystal melting point Tm to decreaseas described by eq 2, and this effect is particularly significant inthe case of R < 10 nm.7 Thus, it can be expected that thesurface atom diffusion may become important for the strongestsize, especially when the nanoasperity is under a high load.We have performed detailed analyses of the atomistic
configurations and stress distributions in the simulated samples,as shown in Figure 2. A classical Hertzian stress pattern is found
beneath the interface of the largest contact (R = 50 nm) at 4%strain, and the system starts to deform plastically before 12%strain. In a smaller contact (R = 5 nm), a pair of dislocations isfound to form beneath the interface and move to interiorfollowing increasing compressive load. This dislocation activityresults in a more homogeneous stress distribution in thecontacting bodies. When R decreases further down to 2 nm, wevisually found that the surface atoms diffuse significantly even atroom temperature, which is in agreement with first-principlescalculations.18 The atoms inside remain highly crystalline whilesurface atoms diffuse to the neck region. Similar room-temperature “liquid-like” deformation behaviors were observed
Figure 1. Contact strength as a function of the asperity radius R atdifferent temperatures. The peak values corresponding to the strongestsize are marked with red symbols. Error bars are based on thedeviation of difference in three crystal orientations. Note that thestrength is averaged over three crystal orientations ([100] against[100], [100] against [110], and [100] against [16 5 0]) with respect tothe two face-centered-cubic crystals. Figure 2. Snapshots of simulated room-temperature contacts of three
different sizes at two different applied strain levels. The color of atomsrepresents the von Mises stress distribution. The arrows in the middlepanel show the direction of dislocation displacement during loading.The arrows in the right panel show the direction of atomistic diffusionflow.
Nano Letters Letter
DOI: 10.1021/acs.nanolett.5b02306Nano Lett. 2015, 15, 6582−6585
6583

in experiments on Ag nanoparticles of about 10 nm diameter,10
as well as the cold welding of Au nanowires (3−10 nmdiameter).19
To quantify diffusion in small samples under load, we applythe “deformation-diffusion” decomposition,20−22
∑= | − |∈
DN
d J d1
minii j N
ji i jiJ
2 0 2
ii (3)
where i,j index atoms, Di2 is a measure of magnitude of non-
affine motion of atoms around i; j∈ Ni are i’s initial neighborsat the reference configuration, dji
0 is the distance vector betweenatom j and i at the reference configuration, and dji is the currentdistance vector. The local deformation gradient Ji is numericallyoptimized to minimize Di
2. On the right-hand side, dji0Ji stands
for the displacive deformation, while dji0Ji−dji refers to the
contribution of the non-affine, or diffusional part of thedisplacement.20 When the contacting bodies are compressed todeformed plastically, we can see the mean D2
fluctuates as thatshown in Figure 3a due to the dislocation plasticity and
structure collapse. It is shown that D2 for R = 1.5 nm contact isthe largest indicating a clearly enhanced atom diffusion. Weborrow the threshold value from Lindemann criterion,23 whichwas used to predict the melting point of surface confinedmaterials, to qualitatively compare the extent of diffusion duringloading. For simplicity we label an atom as diffusive when its
Di2 exceeds the 10% of the nearest neighbor distance. Figure
3b shows that a smaller contact contains a higher ratio ofdiffusive atoms, an observation consistent with the nanowireand nanoparticle experiments.5,23,24 In our R = 2 nm sample,the surface diffusion results in lower plastic flow stress andbetter adhesion. Even though the diffusion is clearly acceleratedby the atomic random thermal motion when the temperatureincreases,18 we can also observe stress-induced surface diffusioneven at T → 0 K (see our energy minimization simulationresults in Supporting Information). It was suggested that this
type of diffusion can be not only thermally activated but alsodriven by externally applied stress22 and/or surface tension.11,25
The results above showed that the contact becomes “smalleris weaker” when the surface atom diffusion dominates. On thebasis of our simulation data, we obtain a comprehensive contactsize-strength-temperature map in Figure 4, illustrating the
competition between the displacive and diffusion mechanisms.We find the strongest size Rc and homologous temperature T/Tm∞ from simulations can be well-fitted as follows
= +∞
R AT
TBc
m (4)
We obtain A = 3.1 nm and B = 2.8 nm by fitting to our MDsimulation data. However, this result should not be directlyapplicable to laboratory experiments since the strain rate of theMD simulations could be many orders of magnitude higher. Toovercome this limitation, we use an empirical velocity-modifiedtemperature approach26 based on the Zener-Hollomonparameter that bridges the strain rate and the temperature.This approach considers that increasing the strain rate has thesimilar effect as decreasing the temperature upon the stress−strain relation.27 This semiempirical relation bridges thetemperature and strain rate as
εε
= −
⎛⎝⎜⎜
⎞⎠⎟⎟T T
k T
Q1 lnexp MD
B exp
S
MD
exp (5)
where QS is an activation energy, ε MD is the simulation strainrate, Texp is the experimental temperature, and εexp is theexperimental strain rate. The Zener-Hollomon correctedstrongest size can be derived when we combine eqs 4 and 5to write
=−
+εε
∞
⎜ ⎟
⎛
⎝
⎜⎜⎜⎜ ⎛⎝
⎞⎠
⎞
⎠
⎟⎟⎟⎟R
T
TA
B1 ln
k T
Q
cexp
m B exp
S
MD
exp (6)
Figure 3. (a) Mean D2 as a function of the strain in three contacts ofdifferent curvature radii. (b) Diffusive atom ratios as a function of thestrain.
Figure 4. Contact strength mechanism map as a function of the radiusof curvature (R) and homologous temperature (T/Tm∞). The colorrange represents the strength values. The highest contact asperitystrength computed with MD at ε = 108/s is outlined by the solid curve.The dashed curve represents the strongest contact size under anordinary experimental strain rate.
Nano Letters Letter
DOI: 10.1021/acs.nanolett.5b02306Nano Lett. 2015, 15, 6582−6585
6584

We assume that εexp = 10−3/s as a typical laboratory experimentstrain rate, and QS = 126 kJ/mol = 1.3 eV for the aluminumsystem studied here,28 which should be an upper bound forprocesses controlled by surface diffusion (and therefore givesthe most sensitive strain-rate dependence). The predictedtemperature-size effects at εexp = 10−3/s is shown by the dashedcurve in Figure 4. The sub-10 nm Au tips29 and Ag particles10
at homologous temperature Texp/Tm∞ of 0.22 and 0.24 are thenin the diffusion-dominated regime, which are in agreement withprevious experimental observations.10,29
Bridging the gap between nanoscale contacts and theelectrical, thermal and mechanical properties of rough macro-scopic interfaces2,30−32 must require accurate information aboutthe size-dependent plasticity. From Figure 1, it can be seen thatthe strength drops precipitously13 when the asperity size goesbelow Rc. The plastic deformation strength, which was oftenconsidered a constant, is clearly a function of the asperity size.Moreover, the correlation between the critical size andtemperature/strain rate provides some physical basis for λs,and also a criterion to judge whether the asperity in contact isin the diffusion-controlled regime (Figure 4), which if so isexpected to bond more strongly. Such criterion may be appliedto material cold welding1,19 and self-assembly33 and for physics-based modeling of the electrical, thermal, and mechanicalproperties of contacts.
■ ASSOCIATED CONTENT
*S Supporting InformationThe Supporting Information is available free of charge on theACS Publications website at DOI: 10.1021/acs.nano-lett.5b02306.
Surface atom diffusion to contact region, crystalorientation dependence of the contact strength, andstress-strain curve for explaining the strength measure.(PDF)
■ AUTHOR INFORMATION
Corresponding Authors*E-mail: [email protected].*E-mail: [email protected]
NotesThe authors declare no competing financial interest.
■ ACKNOWLEDGMENTSThis work is supported by a grant-in-aid of 985 Project fromXi’an Jiaotong University, the National Natural ScienceFoundation of China (Grant 11204228) and the NationalBasic Research Program of China (2012CB619402 and2014CB644003). J.L. acknowledges support by NSF DMR-1410636 and DMR-1120901.
■ REFERENCES(1) Ferguson, G. S.; Chaudhury, M. K.; Sigal, G. B.; Whitesides, G.M. Science 1991, 253, 776.(2) Pastewka, L.; Robbins, M. O. Proc. Natl. Acad. Sci. U. S. A. 2014,111, 3298.(3) Li, J. Nat. Mater. 2015, 14, 656.(4) Jiang, Q.; Zhang, S.; Li, J. Solid State Commun. 2004, 130, 581.(5) Guisbiers, G.; Buchaillot, L. Nanotechnology 2008, 19, 435701.(6) Buffat, P.; Borel, J. P. Phys. Rev. A: At., Mol., Opt. Phys. 1976, 13,2287.
(7) Zhang, M.; Efremov, M. Y.; Schiettekatte, F.; Olson, E. A.; Kwan,A. T.; Lai, S. L.; Wisleder, T.; Greene, J. E.; Allen, L. H. Phys. Rev. B:Condens. Matter Mater. Phys. 2000, 62, 10548.(8) Dick, K.; Dhanasekaran, T.; Zhang, Z. Y.; Meisel, D. J. Am. Chem.Soc. 2002, 124, 2312.(9) Shibata, T.; Bunker, B. A.; Zhang, Z. Y.; Meisel, D.; Vardeman, C.F.; Gezelter, J. D. J. Am. Chem. Soc. 2002, 124, 11989.(10) Sun, J.; He, L.; Lo, Y.-C.; Xu, T.; Bi, H.; Sun, L.; Zhang, Z.; Mao,S. X.; Li, J. Nat. Mater. 2014, 13, 1007.(11) Xie, D.-G.; Wang, Z.-J.; Sun, J.; Li, J.; Ma, E.; Shan, Z.-W. Nat.Mater. 2015, 14, 899.(12) Zhu, T.; Li, J. Prog. Mater. Sci. 2010, 55, 710.(13) Tian, L.; Li, J.; Sun, J.; Ma, E.; Shan, Z.-W. Sci. Rep. 2013, 3,2113.(14) Plimpton, S. J. Comput. Phys. 1995, 117, 1.(15) Zope, R.; Mishin, Y. Phys. Rev. B: Condens. Matter Mater. Phys.2003, 68, 024102.(16) Greer, J. R.; Oliver, W. C.; Nix, W. D. Acta Mater. 2005, 53,1821.(17) Zhu, T.; Li, J.; Samanta, A.; Leach, A.; Gall, K. Phys. Rev. Lett.2008, 100, 25502.(18) Sørensen, M. R.; Jacobsen, K. W.; Joonsson, H. Phys. Rev. Lett.1996, 77, 5067.(19) Lu, Y.; Huang, J.; Wang, C.; Sun, S.; Lou, J. Nat. Nanotechnol.2010, 5, 218.(20) Wang, C.-C.; Mao, Y.-W.; Shan, Z.-W.; Dao, M.; Li, J.; Sun, J.;Ma, E.; Suresh, S. Proc. Natl. Acad. Sci. U. S. A. 2013, 110, 19725.(21) Falk, M.; Langer, J. Phys. Rev. E: Stat. Phys., Plasmas, Fluids,Relat. Interdiscip. Top. 1998, 57, 7192.(22) Li, W.; Rieser, J. M.; Liu, A. J.; Durian, D. J.; Li, J. Phys. Rev. E2015, 91, 062212.(23) Mei, Q.; Lu, K. Prog. Mater. Sci. 2007, 52, 1175.(24) Gulseren, O.; Ercolessi, F.; Tosatti, E. Phys. Rev. B: Condens.Matter Mater. Phys. 1995, 51, 7377.(25) Zhang, K.; Weertman, J.; Eastman, J. Appl. Phys. Lett. 2005, 87,061921.(26) MacGregor, C.; Fisher, J. J. Appl. Mech. 1945, 12, A217.(27) Zener, C.; Hollomon, J. J. Appl. Phys. 1944, 15, 22.(28) Medina, S., Hernandez, C. Acta Mater. 1996, 44.(29) Strachan, D. R.; Smith, D. E.; Fischbein, M. D.; Johnston, D. E.;Guiton, B. S.; Drndic, M.; Bonnell, D. A.; Johnson, A. T. Nano Lett.2006, 6, 441.(30) Greenwood, J.; Williamson, J. Proc. R. Soc. London, Ser. A 1966,295, 300.(31) Persson, B. N. J. Surf. Sci. Rep. 2006, 61, 201.(32) Akarapu, S.; Sharp, T.; Robbins, M. O. Phys. Rev. Lett. 2011,106, 204301.(33) Klajn, R.; Bishop, K. J.; Fialkowski, M.; Paszewski, M.;Campbell, C. J.; Gray, T. P.; Grzybowski, B. A. Science 2007, 316, 261.
Nano Letters Letter
DOI: 10.1021/acs.nanolett.5b02306Nano Lett. 2015, 15, 6582−6585
6585