Embed Size (px)
Citation preview

2ND HALF YEARLY MONITORING REPORT OF RMSA TAMIL NADU
2014
DISTRICTS COVERED
THANJAVUR
THIRUVARUR
NAGAPATTINAM
I N D I A N I N S T I T U T E O F T E C H N O L O G Y M A D R A S

2
PARTICULARS
Preface and Acknowledgement Abbreviations General Information Consolidated Report for the Districts (Thanjavur, Thiruvarur and Nagapattinam) District wise Reports Thanjavur Thiruvarur Nagapattinam Annexures Annexure –I List of sample schools for RMSA Monitoring Thanjavur School list Thiruvarur School List Nagapattinam School list Annexure III – Welfare Schemes and Policies on Education in Tamil Nadu

3
PREFACE & ACKNOWLEDGEMENT
The Institute has been assigned the task of carrying the Monitoring Work for Rashtriya Madhyamik Shiksha
Abhiyan in thirteen districts of Tamil Nadu.
We gratefully acknowledge the support received from the Ministry of Human Resource Development (MHRD) and
SPO Rashtriya Madhyamik Shiksha Abhiyan, Tamil Nadu. This work would not have been completed without the
support of the district and school level officers who helped us by providing the requisite information.
We are thankful to the entire team who worked at the field and at office to successfully complete the field study and
in the compilation of report.
Milind Brahme & M. Suresh Babu
IIT Madras

4
General Information
1. 2nd Half Yearly Monitoring Report of (Monitoring Institution) on RMSA for
the State/UT of Tamil Nadufor the period of 1st January 2014 to 31st June 2014 1.1. General Information Sl. No. Subject Details
1. Name of the monitoring institution Indian Institute of Technology Madras
2. Period of the report 1st January 2014 to 31st June 2014 3. No. of Districts allocated 13 4. District names (write the districts names which the MI has
monitored) Thanjavur Thiruvarur Nagapattinam
5. Month of visit to the Districts /blocks (Information is to be given for district wise i.e District 1, District 2, District 3 etc)
District 1 (write the district name and month) District 2(write the district name and month) District3(write the district name and month)
6. MI selected the schools as per the criteria : Yes/No(Ref: As per the ToR 2013-15 point 4 (iii) under scale of work)
Yes
(i) Higher gender gap in enrolment Yes (ii) Higher population of SC/ST students, Yes (iii) Low retention rate and higher drop out rate Yes (iv) The School has a minimum of three CWSN Yes (v) The habitation where the school is located at has
sizeable number of OOSC Yes
(vi) The habitations where the school is located at witnesses in bound and out bound seasonal migration,
Yes
(vii) The ward/unit of planning where the school is located at is known to have sizeable number of urban deprived children
Yes
(viii) The school is located in a forest or far flung area Yes (ix) The habitation where the school is located at witnesses
recurrent floods or some other natural calamity Yes
(x) Pupil Teacher Ration (PTR) at school level Yes 7. Types of Schools visited as per the ToR 2013-15: Yes/No
(Ref: As per the ToR 2013-15 point 4(iv) under scale of work)
(i) 8 schools from urban areas visited Yes/No (ii) if yes write the number
Yes
(iii) 6 schools from Special Training Centers (3 residential and 3 non-residential) visited : Yes/No
(iv) if yes write the number
Yes
(v) 2 schools from civil works sanctioned Yes/No (vi) if yes write the number
Yes

5
(vii) 2 schools from NPEGEL blocks Yes/No (viii) if yes write the number
No (Not Applicable)
(ix) 3 schools from CWSN (priority to those having other than Orthopaedic Impairment (OI children) Yes/ No
(x) if yes write the number
Yes (12 schools)
(xi) 3 schools from Computer Aided Learning (CAL) and KGBV scheme Yes/No
(xii) if yes write the number
Yes (15 schools)
(xiii) 3 schools from KGBV scheme Yes/No (xiv) if yes write the number
No (Not Applicable)
8. The selection of schools (for all the districts to be monitored) shall be done on the basis of the latest school report card generated through DISE, HHS data and consultation with the district SSA functionaries: Yes/No Ref: TOR 2013-15 point 4(v) under scale of work (The procedure and criteria adopted, for the selection of schools shall from an essential part of the MIs report.)
Yes
9. Number of schools monitored (Information is to be given for district wise i.e. District 1, District 2, District 3 etc)
District 1 : (Write district name and also provide number of schools)
Thanjavur – 20
District 2 : (Write district name and also provide number of schools)
Thiruvarur – 20
District3:(Write district name and also provide number of schools)
Nagapattinam - 20
10 Whether the MI has sent their report to the SPO at the draft level : YES / NO (Ref: TOR 2013-15 point 5(i) under Reports)
11. After submission of the draft report to the SPO office whether the MI has received any comments from the SPO office : YES / NO (Ref: TOR 2013-15 point 5(ii) under Reports)
12. Before sending the reports to the GOI whether the MI has shared the report with SPO: YES /NO (Ref: TOR 2013-15 point 5(iii & iv) under Reports)
13.
Items to be attached with the report
a) List of Schools with DISE code visited by MI and list of schools visited by the Nodal Officer.- Annexure I
b) Any other relevant documents (only circulars/Amendments/Notices) – Annexure II

6
Consolidated Report/Executive Summary of RMSA Monitoring for the districts Thanjavur, Thiruvarur and
Nagapattinam
DISTRICT I DISTRICT II DISTRICT III
1. Planning and implementation
(I) At school level
1. Perspective plan has been prepared at the school level in all the schools in Thanjavur district
2. The SMDC members are made responsible in the preparation of school development plan
3. The planning strategy is common to all the students and not specific for disadvantaged groups. In the Perspective plan reports of few schools they have mentioned a statement that there are plans for disadvantaged groups. But there are no specific development plans conceived or mentioned in the plan document.
4. The SMDC General body meeting is held quarterly in Thanjavur district
1. Perspective plan has been prepared at the school level in all the schools in Thiruvarur district
2. The SMDC members are made responsible in the preparation of school development plan
3. The SMDC General body meeting is held quarterly in 15 schools and half yearly meetings conducted in 5 schools @Thiruvarur district
1. Perspective plan has been prepared at the school level in all the schools in Nagapattinam district
2. The SMDC members are made responsible in the preparation of school development plan
3. The SMDC General body meeting is held quarterly in 2 schools and half yearly meetings conducted in 18 schools @ Nagapattinam district
(II) At district level
1. District level plan was prepared
2. Regular monitoring of AWP&B is
being carried out through holding
meetings and workshops at nodal
school level and paying personal
visits to the schools
3. In Thanjavur, convergence approach
is followed with the following
departments. Water and Sanitation,
Minority department, Medical Health
and family department and Welfare
department.
1. District level plan was prepared
2. Regular monitoring of AWP&B
is being carried out through
holding meetings and workshops
at nodal school level and paying
personal visits to the schools
3. The HM is made responsible to
prepare the school development
plan since he/she is part of
SMDC. Other members are not
actively participating in
preparation of School
Development Plan. Finally it is
being prepared and discussed in
the SMDC meeting for approval
1. District level plan was prepared
2. Regular monitoring of AWP&B is
being carried out through holding
meetings and workshops at nodal
school level and paying personal
visits to the schools

7
(III) At state level
1. The SPD office conducts monthly
review meetings to review the
monitoring status of all districts.
ADPCs (Assistant District
Programme Coordinators) from all
the districts attend this review
meeting at the state office to update
the status of monitoring conducted at
the district level.
2. 2. The DPCs, ADPCs, Coordinators
at the district level have shared the
responsibility of monitoring the
RMSA implementation by making
personal visits to schools
1. The SPD office conducts monthly
review meetings to review the
monitoring status of all districts.
ADPCs (Assistant District
Programme Coordinators) from
all the districts attend this review
meeting at the state office to
update the status of monitoring
conducted at the district level.
1. The district level authorities are not
getting involved in the state level
planning team.
2. The state plan reflects the planning
needs of the district partially.
2. Physical Access
1. There are few schools in sensitive
area like flood prone /flood plain
area, drought prone area and also on
busy national /state highway that may
pose threat to the students.
2. Few schools are located near the state
and national highways which could
pose threat to the safety of children
3. No transportation facility is provided
by the schools.
4. There is no residential facility
available in any of the schools.
5. In the total survey of 20 schools in
Thanjavur district, most of the
children have access to upper primary
schools. There were 951 students
(45%) reside within 0-1 km distance,
553 children (26% )from the distance
of 1-2 km, 502 children (24%) from
2-3 km distance, 100 students (5%)
from 3-5 km distance. There are no
1. There are few schools in sensitive
area like flood prone /flood plain
area, drought prone area and also
on busy national /state highway
that may pose threat to the
students.
2. Few schools are located near the
state and national highways
which could pose threat to the
safety of children
3. No transportation facility is
provided by the schools.
4. There is no residential facility
available in any of the schools.
5. In the total survey of 20 schools
in Thiruvarur district, most of the
children have access to upper
primary schools. There were 763
students (35%) reside within 0-1
km distance, 426 children (20%
)from the distance of 1-2 km, 237
1. There are 3 schools in storm
surge prone area and 1 school
in contaminated ground water
area and 8 schools in sensitive
area on busy national /state
highway that may pose threat to
the students
2. No transportation facility is
provided by the schools.
3. There is no residential facility
available in any of the schools.
4. In the total survey of 20 schools
in Nagapattinam district, most
of the children have access to
upper primary schools. There
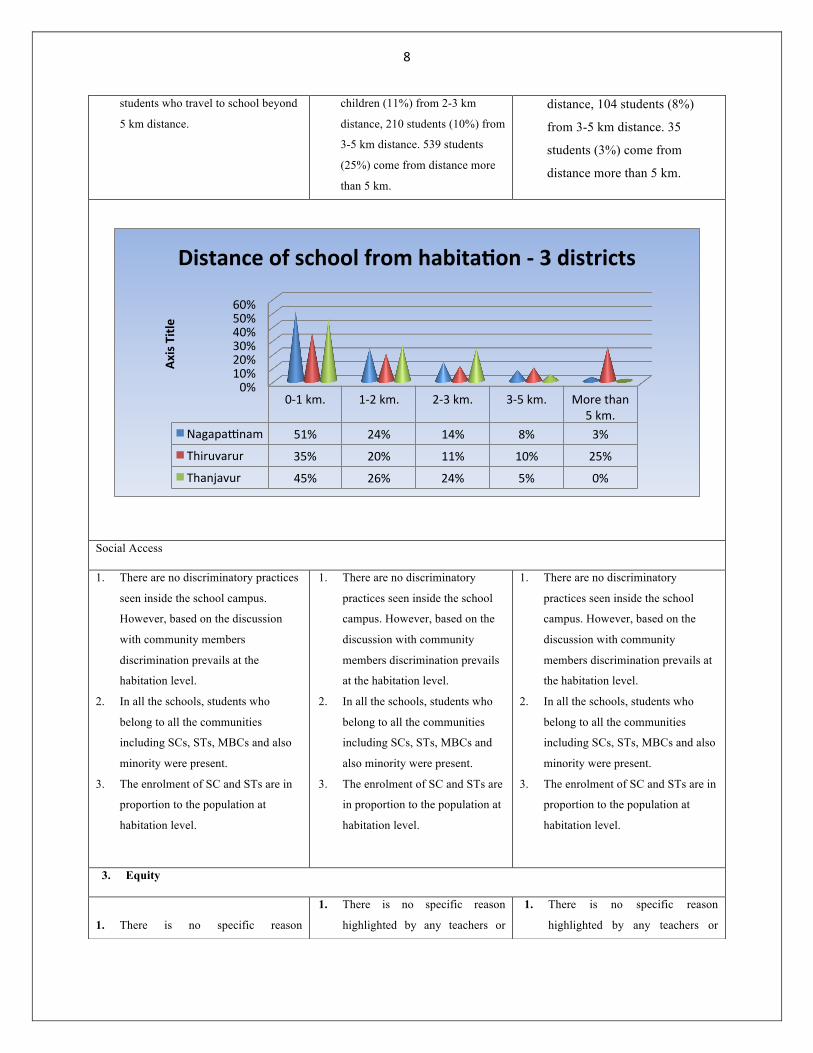
were 671 students (51%) reside
within 0-1 km distance, 323
children (24% ) from the
distance of 1-2 km, 191
children (14%) from 2-3 km
8
students who travel to school beyond
5 km distance.
children (11%) from 2-3 km
distance, 210 students (10%) from
3-5 km distance. 539 students
(25%) come from distance more
than 5 km.
distance, 104 students (8%)
from 3-5 km distance. 35
students (3%) come from
distance more than 5 km.
Social Access
1. There are no discriminatory practices
seen inside the school campus.
However, based on the discussion
with community members
discrimination prevails at the
habitation level.
2. In all the schools, students who
belong to all the communities
including SCs, STs, MBCs and also
minority were present.
3. The enrolment of SC and STs are in
proportion to the population at
habitation level.
1. There are no discriminatory
practices seen inside the school
campus. However, based on the
discussion with community
members discrimination prevails
at the habitation level.
2. In all the schools, students who
belong to all the communities
including SCs, STs, MBCs and
also minority were present.
3. The enrolment of SC and STs are
in proportion to the population at
habitation level.
1. There are no discriminatory
practices seen inside the school
campus. However, based on the
discussion with community
members discrimination prevails at
the habitation level.
2. In all the schools, students who
belong to all the communities
including SCs, STs, MBCs and also
minority were present.
3. The enrolment of SC and STs are in
proportion to the population at
habitation level.
3. Equity
1. There is no specific reason
1. There is no specific reason
highlighted by any teachers or
1. There is no specific reason
highlighted by any teachers or
0% 10% 20% 30% 40% 50% 60%
0-‐1 km. 1-‐2 km. 2-‐3 km. 3-‐5 km. More than 5 km.
Nagapa`nam 51% 24% 14% 8% 3%
Thiruvarur 35% 20% 11% 10% 25%
Thanjavur 45% 26% 24% 5% 0%
Axis Title
Distance of school from habitaFon -‐ 3 districts

9
highlighted by any teachers or head
mistress for the gap in achievement
level of boys and girls.
2. It was stated as a general opinion that
the impact of poor economic status
reflects more on Girl children. The
Girl children also support the parents
in house hold activities and also they
were given lesser priority in terms of
education when compared to boys.
During the discussion the teachers
expressed these views regarding
education of girl children.
3. To prevent drop out of SC girl
students, the IX th standard SC girls
of age less than 16 years are provided
with fixed deposit certificate for Rs.
3000. This scheme is applicable for
ST children as well.
head mistress for the gap in
achievement level of boys and
girls.
2. It was stated as a general opinion
that the impact of poor economic
status reflects more on Girl
children. The Girl children also
support the parents in house hold
activities and also they were
given lesser priority in terms of
education when compared to
boys. During the discussion the
teachers expressed these views
regarding education of girl
children.
3. There is no separate scheme
announced for minority children
in any district.
head mistress for the gap in
achievement level of boys and
girls.
2. It was stated as a general opinion
that the impact of poor economic
status reflects more on Girl
children. The Girl children also
support the parents in house hold
activities and also they were given
lesser priority in terms of
education when compared to boys.
During the discussion the teachers
expressed these views regarding
education of girl children.
4. Guidance and Counseling
1. Cell for guidance and counselling is
constituted in 3 schools (15%) and
the remaining 85% schools have no
counselling cell in Thanjavur
district
2. There is no proper training
provided to the teachers in
counseling the students. Student
Counselor Ratio is 1:50 in the 3
schools where counseling cell is
constituted.
3. However, there is no active
counseling assistance happening
in the government schools of
Thanjavur district.
1. There is no guidance and
counseling cell constituted in
any of the schools in
Nagapattinam district.
2. There is no proper training
provided to the teachers in
counseling the students.
1. There is no guidance and
counseling cell constituted in any of
the schools in Nagapattinam
district.
2. There is no proper training provided
to the teachers in counseling the
students.
5. Quality
I. Enabling Conditions

10
1. 94% of total rooms across 20 schools
have natural light
2. 94% rooms are properly ventilated
3. Blackboards are appropriately located
in 84% schools
4. 100% schools have CFL bulbs and
proper lighting.
5. Teaching aids are available only in
10% of schools in Thanjavur district.
1. 99% of total rooms across 20
schools have natural light
2. 99% rooms are properly
ventilated
3. Blackboards are appropriately
located in 95% schools4.
4. 89% schools have CFL bulbs and
proper lighting.
5. Fan is available in 98% schools.
6. The teaching aids are available in
90% schools in Thiruvarur
district.
1. 100% of total rooms across 20
schools have natural light
2. 100% rooms are properly ventilated
3. Blackboards are appropriately
located in 99% schools.
4. 100% schools have CFL bulbs and
proper lighting.
5. Fan is available in 98% schools.
6. The teaching aids are available in
75% schools in Thiruvarur district.
Teachers training
0% 10% 20% 30% 40% 50% 60% 70% 80% 90%
100%
Natural light
Venclacon
Black Board
appropriately
located in classroom
Bulb/Tube light /CFL
Fan Teaching aids
Thanjavur 94% 94% 84% 100% 97% 10%
Thiruvarur 99% 99% 95% 89% 98% 90%
Nagapa`nam 100% 100% 99% 100% 98% 75%
Axis Title
Availability of Enabling CondiFons in 3 districts

11
1. Training has been provided under
RMSA in some of the schools.
Training has been conducted in 17
schools out of 20 schools.
2. The total number of teachers for class
9th and 10th placed in 20 schools
comes to 175 against 192 sanctioned
posts, the number of posts lying
vacant is 17 (8.85%).
3. 95% teachers were found present on
the day of field visit across 20
schools.
1. Training has been provided under
RMSA in some of the schools.
Training has been conducted in
15 schools out of 20 schools.
2. The total number of teachers for
class 9th and 10th placed in 20
schools comes to 172 against 190
sanctioned posts, the number of
posts lying vacant is 18 (9.47%).
3. 98% teachers were found present
on the day of field visit across 20
schools.
1. Training has been provided under
RMSA in some of the schools.
Training has been conducted in all
20 schools
2. The total number of teachers for
class 9th and 10th placed in 20
schools comes to 143 against 152
sanctioned posts; the number of
posts lying vacant is 9 (5.92%).
3. 99% teachers were found present
on the day of field visit across 20
schools.
6. Civil work
1. Civil work has been undergoing in 5
schools in Thanjavur district. GHS
Mohammed Bunder, GHS Inthalur,
GHS Naduvoor, GHS Mudukadu,
GHS Silathur (North).
2. The construction activity has been
discontinued in GHS Mohammed
Bunder and GHS Inthalur due to
insufficient funds.
3. Training has been conducted for
1. Civil work is undergoing in 2
schools in Thiruvarur district.
GHS Palayakottai and GHS
Pazhayavalam. The civil work is
at the final stage in both the
schools.
2. Training has been conducted for
SMDC members regarding civil
work activities
3. Engineer also makes visit at
1. Civil work has been
undergoing in 2 schools in
Nagapattinam district. GHS
Agaraperunthottam and GHS
Vellapallam Meenavar
Colony. The civil work
construction has been
completed in 2012-13 in
Agaraperunthottam and it is
ongoing in Vellapallam school.
0.00% 10.00% 20.00% 30.00% 40.00% 50.00% 60.00% 70.00% 80.00% 90.00% 100.00%
Thanjavur Thiruvarur Nagapa`nam Teachers Placed 91.15% 90.53% 94.08%
Vacancy 8.85% 9.47% 5.92%
Axis Title
Teachers' Availability in 3 districts
12
SMDC members regarding civil work
activities
4. Engineer also makes visit at different
levels of construction
5. All branded paints and construction
materials are used in civil work
different levels of construction
4. All branded paints and
construction materials are used in
civil work
2. Training has been conducted
for SMDC members regarding
civil work activities
3. Engineer makes visit at
different levels of construction
4. All branded paints and
construction materials are used
in civil work
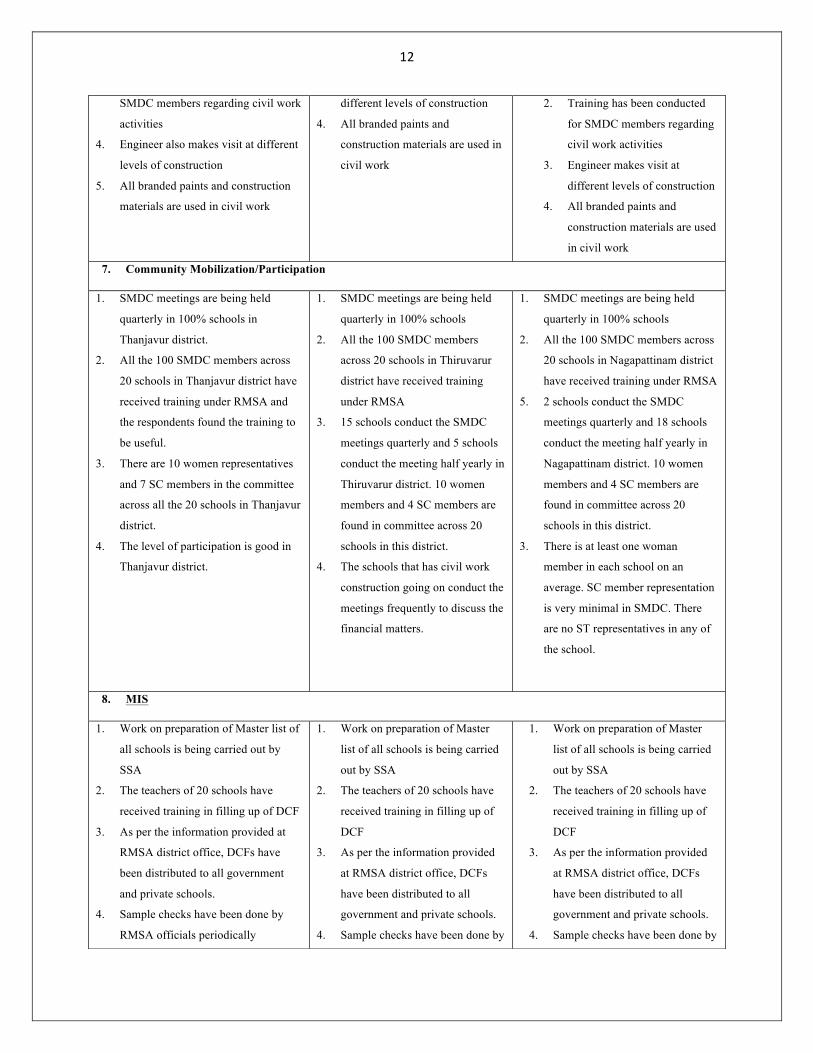
7. Community Mobilization/Participation
1. SMDC meetings are being held
quarterly in 100% schools in
Thanjavur district.
2. All the 100 SMDC members across
20 schools in Thanjavur district have
received training under RMSA and
the respondents found the training to
be useful.
3. There are 10 women representatives
and 7 SC members in the committee
across all the 20 schools in Thanjavur
district.
4. The level of participation is good in
Thanjavur district.
1. SMDC meetings are being held
quarterly in 100% schools
2. All the 100 SMDC members
across 20 schools in Thiruvarur
district have received training
under RMSA
3. 15 schools conduct the SMDC
meetings quarterly and 5 schools
conduct the meeting half yearly in
Thiruvarur district. 10 women
members and 4 SC members are
found in committee across 20
schools in this district.
4. The schools that has civil work
construction going on conduct the
meetings frequently to discuss the
financial matters.
1. SMDC meetings are being held
quarterly in 100% schools
2. All the 100 SMDC members across
20 schools in Nagapattinam district
have received training under RMSA
5. 2 schools conduct the SMDC
meetings quarterly and 18 schools
conduct the meeting half yearly in
Nagapattinam district. 10 women
members and 4 SC members are
found in committee across 20
schools in this district.
3. There is at least one woman
member in each school on an
average. SC member representation
is very minimal in SMDC. There
are no ST representatives in any of
the school.
8. MIS
1. Work on preparation of Master list of
all schools is being carried out by
SSA
2. The teachers of 20 schools have
received training in filling up of DCF
3. As per the information provided at
RMSA district office, DCFs have
been distributed to all government
and private schools.
4. Sample checks have been done by
RMSA officials periodically
1. Work on preparation of Master
list of all schools is being carried
out by SSA
2. The teachers of 20 schools have
received training in filling up of
DCF
3. As per the information provided
at RMSA district office, DCFs
have been distributed to all
government and private schools.
4. Sample checks have been done by

13
5. School report cards also have been
generated and distributed
RMSA officials periodically
5. School report cards also have
been generated and distributed
RMSA officials periodically
5. School report cards also have
been generated and distributed
9. Financial management
1. All the schools have received the
School Annual Grant, Minor Repair
Grant and 5 schools have received
civil work grant.
2. In all the schools, financial
statements and records are
maintained properly
3. The 5 civil work schools have
received Rs. 50, 000, 00 towards
construction activities.
4. There is no audit being carried out at
the district or state level for civil
work and for other funds as well.
1. All the schools have received
the School Annual Grant, Minor
Repair Grant and 2 schools
have received civil work grant.
2. In all the schools, financial
statements and records are
maintained properly.
3. The two schools where civil
work is going on had been
given Rs. 50, 000, 00 towards
construction expenditure.
1. All the schools have received the
School Annual Grant, Minor
Repair Grant and 2 schools have
received civil work grant.
2. In all the schools, financial
statements and records are
maintained properly
10. SAG
1. School Annual Grant has been
received by all the 20 schools for the
financial year 2012-13 and spent
completely
2. The schools have also submitted the
utilization certificate for the financial
year 2013-14
1. School Annual Grant has been
received by all the 20 schools for
the financial year 2012-13 and
spent completely
3. The schools have also submitted
the utilization certificate for the
financial year 2013-14
1. School Annual Grant has been
received by all the 20 schools for
the financial year 2012-13 and
spent completely
4. The schools have also submitted the
utilization certificate for the
financial year 2013-14
11. Minor repair grant (MRG)
1. The District office has informed that
overall, minor repair grant has not
been received by 33 schools in
Thanjavur district. .
2. The remaining schools have received
Rs. 25,000 towards Minor repair
grant.
3. The schools have also submitted the
utilization certificate
1. Minor Repair Grant has been
received by all the 20 monitored
schools for the financial year
2012-13 and spent completely.
2. The schools have received Rs.
25,000 towards Minor repair
grant.
3. The schools have also submitted
the utilization certificate.
1. Minor Repair Grant has been
received by all the 20 monitored
schools for the financial year
2012-13 and spent completely.
2. The schools have received Rs.
25,000 towards Minor repair grant.
3. The schools have also submitted
the utilization certificate.
4. Overall, 8 RMSA schools in

14
4. Overall, 11 RMSA schools in
Thiruvarur district have not
received the MRG, as per
information received from the
district office.
Nagapattinam district have not
received the MRG, as per
information received from the
district office.
5. Innovations
1. There are no innovative proposals
submitted at the state or district level
for the academic year 2013-14
2. Steps are being taken to conduct
innovative research projects in the
coming year.
1. There are no innovative proposals
submitted at the state or district
level for the academic year 2013-
14
2. Steps are being taken to conduct
innovative research projects in the
coming year.
1. There are no innovative proposals
submitted at the state or district
level for the academic year 2013-
14
2. Steps are being taken to conduct
innovative research projects in the
coming year.
6. MMER
1. Information about number of schools
visited by SPO level officers has not
been furnished by SPO
2. GIS mapping has been completed at
State and District level
3. MIS at district level is in place
4. State level data base mechanism is in
place
5. There is no vacancy at the DPO level
1. Information about number of
schools visited by SPO level
officers has not been furnished by
SPO
2. GIS mapping has been completed
at State and District level
3. MIS at district level is in place
4. State level data base mechanism
is in place
5. There is no vacancy at the DPO
level
1. Information about number of
schools visited by SPO level
officers has not been furnished
by SPO
2. GIS mapping has been
completed at State and District
level
3. MIS at district level is in place
4. State level data base
mechanism is in place
5. There is no vacancy at the
DPO level

15
DISTRICT THANJAVUR

16
INDEX
S. No. Particulars Page no. 1. Planning & Implementation
1. At School level 2. At District level 3. At State level
17-22
2. Access I. Physical Access
II. Social Access III. Open Schooling IV. OoSC
22-32
3. Equity I. General Information
II. Girls Education
32-39
4. Guidance & Counselling At school level
39-40
5. Quality I. Enabling conditions
II. Teaching learning process III. Teachers’ training
40-52
6. Civil works I. General Information
II. Design III. Schools with ongoing construction activity
52-77
7. Community Mobilization/Participation At school level
78-80
8. MIS (Management Information System) At School, DPO, SPO level
80-83
9. Financial Management At SMDC, DPO, SPO level
83-93
10. School annual grant (SAG) At SMDC, DPO, SPO level
93-94
11. Minor Repair Grant At SMDC, DPO, SPO level
94-96
12. Innovations At DPO, SPO level
96-100
13. MMER (Management /Monitoring/Evaluation and Research) I. Staffing pattern
AtDPO, SPO level II. Monitoring strategy at DPO, SPO level
III. Management systems DIET, SCERT, DEO Office
IV. State Database V. Research
100-109

17
14. Any other issues 110
MONITORING OF RMSA IMPLEMENTATION IN THANJAVUR DISTRICT
1. Planning & Implementation –
At School Level
1. Perspective Plan for the School –
No. of Schools
Plan developed Not developed Yes No 20 0
% 100% 0% If not reasons thereof Comments: Perspective plan has been developed in 100% schools in Thanjavur district. The perspective plan is
being submitted to the district RMSA office every year. There is a standard format used by all the schools
throughout the district to prepare the perspective plan. The school development plan includes demographic profile of
the area, data regarding nearby schools (including private and aided schools), children at school going age, school
mapping information, etc. The achievements of the school are also included in the perspective plan report.
2. Data base/sources adopted/taken for Planning and Plan preparation at School level other than SEMIS
No. of Schools
Other Data base/sourced adopted If yes names of other sources Yes No
0 20 - % 0% 100%
Comments: In most of the schools, SEMIS data is the only source for planning and plan preparation at the school
level, for some information they are using Census data. The Village Education Records (VER), School Mapping
information are also being used in the perspective plan report.
3. Whether disadvantaged groups have been appropriately factored in the Plan.
No. of Schools
Developed Planning strategy for disadvantaged groups
Yes No
0 20
% 0% 100%
If not reasons thereof
The planning strategy is common to all the students and not specific for disadvantaged groups. In the Perspective plan reports of few schools they have mentioned a statement that there are plans for disadvantaged groups. But there are no specific development plans conceived or mentioned in the

18
plan document.
No. of Schools
Convergence approach adopted Yes No 20 0
% 100% 0% Convergence Approach Convergence not adopted
S. No.
Departments No. of Schools
% Reasons thereof
1 Water & Sanitation 20 100% There is no tribal community in Thanjavur district. There is no direct involvement of Rural and Urban development departments in school development. However, these departments work at the habitation level which indirectly contributes for school development. There is no coordination with PWD for any projects at the school level
2 Social Welfare 20 100% 3 Tribal Development 0 0% 4 Minority Department 1 5% 5 Rural Development 0 0% Urban Development 0 0% 6 Health, Medical and
Family welfare 20 100%
7 Electricity department 20 100% 8 Transport (Roadways) 18 90% 9 Public Works Department 0 0% Problem areas of restructuring on convergence and coordination
Comments: The convergence and coordination with other departments are not made consciously but water and
sanitation department for water needs, social welfare for mid day meal and scholarships, health department for
health check ups, electricity department for EB connections, transport department for free bus pass for students. In
this way, these departments
5. Incorporation of SMDC recommendations in the School Development Plan
No. of Schools
School Development Plan Prepared Recommendations incorporated in School Development Plan
Yes No Yes No
20 0 20 0
% 100% 0% 100% 0%
If not reasons thereof If not reasons thereof
Recommendations given by the SMDC for school development plan.
Comments: There are recommendations documented in minutes of the weekly meeting conducted by SMDC.
19
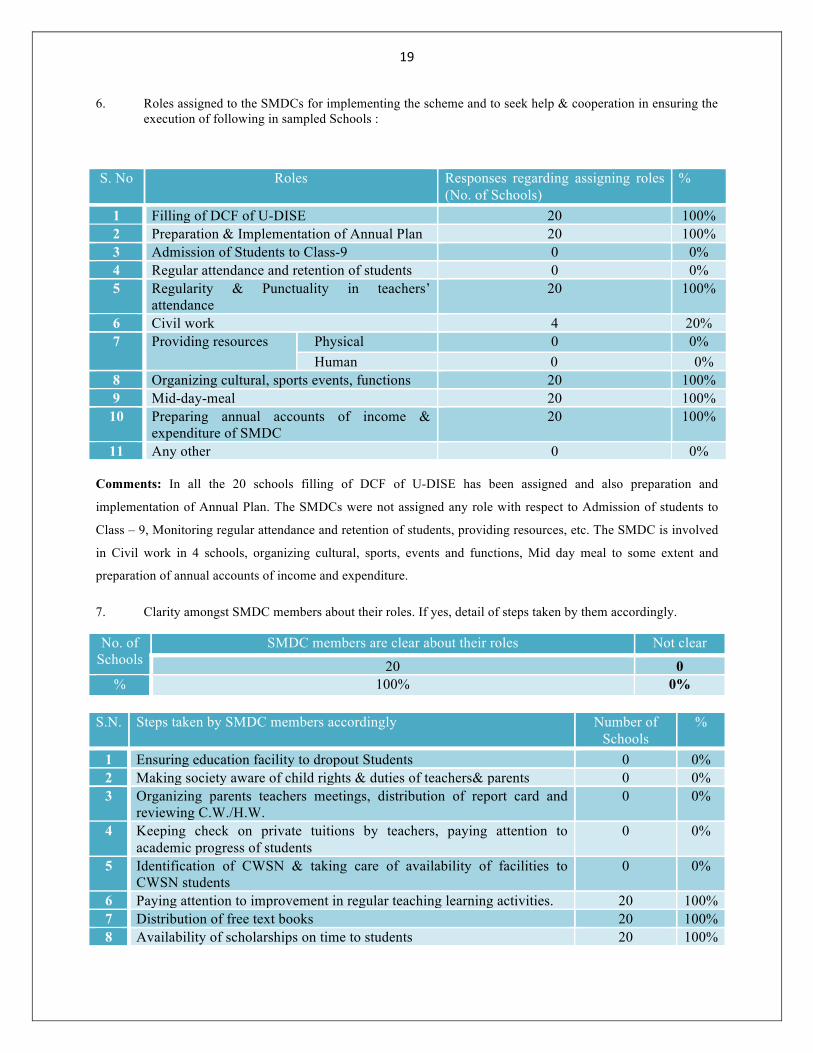
6. Roles assigned to the SMDCs for implementing the scheme and to seek help & cooperation in ensuring the execution of following in sampled Schools :
S. No Roles Responses regarding assigning roles (No. of Schools)
%
1 Filling of DCF of U-DISE 20 100% 2 Preparation & Implementation of Annual Plan 20 100% 3 Admission of Students to Class-9 0 0% 4 Regular attendance and retention of students 0 0% 5 Regularity & Punctuality in teachers’
attendance 20 100%
6 Civil work 4 20% 7 Providing resources Physical 0 0%
Human 0 0% 8 Organizing cultural, sports events, functions 20 100% 9 Mid-day-meal 20 100%
10 Preparing annual accounts of income & expenditure of SMDC
20 100%
11 Any other 0 0% Comments: In all the 20 schools filling of DCF of U-DISE has been assigned and also preparation and
implementation of Annual Plan. The SMDCs were not assigned any role with respect to Admission of students to
Class – 9, Monitoring regular attendance and retention of students, providing resources, etc. The SMDC is involved
in Civil work in 4 schools, organizing cultural, sports, events and functions, Mid day meal to some extent and
preparation of annual accounts of income and expenditure.
7. Clarity amongst SMDC members about their roles. If yes, detail of steps taken by them accordingly.
No. of Schools
SMDC members are clear about their roles Not clear
20 0 % 100% 0%
S.N. Steps taken by SMDC members accordingly Number of
Schools %
1 Ensuring education facility to dropout Students 0 0% 2 Making society aware of child rights & duties of teachers& parents 0 0% 3 Organizing parents teachers meetings, distribution of report card and
reviewing C.W./H.W. 0 0%
4 Keeping check on private tuitions by teachers, paying attention to academic progress of students
0 0%
5 Identification of CWSN & taking care of availability of facilities to CWSN students
0 0%
6 Paying attention to improvement in regular teaching learning activities. 20 100% 7 Distribution of free text books 20 100% 8 Availability of scholarships on time to students 20 100%

20
9 Preparing three years’ perspective Plan 20 100% 10 Proper use of funds i.e. SAG & other grants as per norms 0 0% 11 Monitoring of minor & major repair work and maintenance of physical
infrastructure 0 0%
12 Seeking knowledge and information about income and expenditure of SMDC and supervising the accounts thereof.
20 100%
Comments: In almost all the schools SMDC members have clarity on their roles and responsibilities. Though there
are no steps taken by SMDC members with respect to Ensuring education facility to dropout students, Making
society aware of child rights & duties of teachers & parents, organizing parents teachers meeting, distribution of
report cards and reviewing of CW and HW, keeping check on private tuitions by teachers and paying attention to
academic progress of students.
In most of the schools, SMDC involved in distribution of free text books, availability of scholarships on time to
students , Seeking knowledge and information about income and expenditure of SMDC and supervising the
accounts.
Reasons of ignorance of SMDC members regarding their roles: There is no ignorance of SMDC members but
not involved in activities. There lacks commitment of SMDC members on specific roles and activities.
8.1 Meetings of General Body of School Management and Development Committee-
Meetings of General body held
Number of Schools
Quarterly Half Yearly Annually No meeting held till date
20 0 0 0 % 100% 0% 0% 0%
Comments: The meetings of general body of school management and development committee have been held
quarterly in all the schools.
8.2 Reasons for not holding last meetings and whether the same has been recorded –
Comments:
Thanjavur 2. At District level – Name of District ………………………………………………………….
1. District level Plan has been prepared or not. Yes………………………………………………………………………………………………………………. 2(a) Whether District Plan adopted a convergence approach with following department.

21
(1. Yes 2. No)
a. Water & Sanitation
b. Social Welfare
c. Tribal Development
d. Minority department
e. Rural Development
f. Urban Development
g. Medical Health & Family
h. welfare
i. PWD
j. Transportation (Roadways)
Comments: As per the information provided by the CEO, they have adopted a convergence approach with other
departments such as water and sanitation, social welfare, health department and transportation.
2(b) any problem areas of restructuring on convergence and co-ordination
There are no problems mentioned by the district officials in areas of restructuring on convergence and coordination.
Comments
3. Methods adopted for regular monitoring of Perspective Plan and AWP&B
There is no clear method adopted for regular monitoring of Perspective Plan and AWP &B The school HM holds the responsibility to monitor the perspective plan. The RMSA officials often make Visit to schools to monitor the activities. _____________________________________________________________________________
At State level
1. Involvement of State Level Planning team in the preparation and finalization of District Level Plans1. Yes 2. No
2. Does the State Plan reflect the Planning needs at School and District Level?
1
2
0
1
2
2
1
1
2
-
2

22
Partially it reflects the planning needs.
3. Regular monitoring of Planning & implementation of the programme at State level, if not reasons thereof.
The SPD office conducts monthly review meetings to review the monitoring status of all districts.
ADPCs (Assistant District Programme Coordinators) from all the districts attend this review meeting
at the state office to update the status of monitoring conducted at the district level. The DPCs, ADPCs,
Coordinators at the district level have shared the responsibility of monitoring the RMSA
implementation by visiting the schools in person.
---------------------------------------------------------------------------------------------------------------------
Comments
4. Any separate strategies for naxalite/extremist affected districts prepared at the State/district level in consultation with the district authority?
2 1. Yes 2. No
If not, why? There are no naxalite/extremist affected districts.
2. ACCESS
I. Physical Access – At School and Habitation’s
1. Names Category of the Schools visited
S.N. Categories Number of Schools % 1 EBB 0 0% 2 Urban 1 5% 3 CWSN (Minimum 3 CWSN) 2 10% 4 Higher Gender gap 0 0% 5 SC/ST/Minority students abundance 6 30% 6 Low retention rate/Higher dropout rate 3 15% 7 Schools situated in habitation with large number of Oosc 3 15% 8 Low academic achievements 2 10% 9 Schools situated in habitation of seasonal migrants 1 5%
10 Urban Schools with most students of deprived sections 0 0% 11 Forest/Mountain/Remote/Desert area 2 5% 12 Flood/natural calamity prone area 5 25% 13 Ongoing civil work 4 20% 14 School with girls hostel 0 0% 15 None
Comments: *List of name of Schools is attached
The schools were selected in almost all the categories except few of the above mentioned list. There are no
Economically Backward Blocks (EBB) denoted in Thanjavur district. The was one school from urban area, 2
schools with minimum 3 CWSN (10%), 6 schools with higher proportion of SC/ST/Minority students (30%), 3

23
schools where there is low retention rate and higher dropout rate (15%), 3 schools situated in with large number of
out of school children (15%), 2 schools with low academic achievements (10%), 1 school situated in habitation of
seasonal migrants (5%), 2 schools from remote area (5%), 5 schools from flood natural calamity prone area (25%), 4
schools with ongoing civil work (20%). There are no schools in Thanjavur district with Girls’ hostel. There are no
schools in Urban area with most students of deprived sections.
2. Location of the School adjacent to or within any of the following sensitive areas.
S. N. Area Number of Schools Situated % 1 Protected area (National Park, Wild life sanctuary) 0 0% 2 Flood prone /flood plain area 3 5% 3 Earthquake prone zone 0 0% 4 Unstable slope 0 0% 5 Landslide prone Area 0 0% 6 Cyclone prone Area 0 0% 7 Storm surge prone Area 0 0% 8 Drought prone Area 2 10% 9 Polluting Industrial Area 0 0%
10 Mining Area 0 0% 11 Arsenic /fluoride contaminated ground water area 0 5% 12 Busy National/State Highway 2 10% 13 Congested urban/market/commercial area 0 0% 14 Any particular disturbance faced by School due to its location 3 0% 15 None 0 0%
Comments: There are few schools in sensitive area like flood prone /flood plain area, drought prone area and also
on busy national /state highway that may pose threat to the students.
3. Names and categories of the feeder primary and upper primary Schools in sampled district.
School Level No. of Schools managed by Govt. % Private %
PS 0 0% 0 0% UPS 20 100% 0 0% Total 20 100% 0 0%
*List of Schools is attached
Comments: The category of schools selected for monitoring is restricted only to Upper Primary Government
schools as per guidelines. No private schools have been included for monitoring.
4. Number of Students enrolled in School from habitations coming from a distance greater than what is prescribed for a neighborhood School.
S. N. Distance of School from habitation Number of students % 1 0-1 km. 951 45% 2 1-2 km. 553 26% 3 2-3 km. 502 24% 4 3-5 km. 100 5%

24
5 More than 5 km. 0 0% Total 2106 100% Comments: 6. In the total survey of 20 schools in Thanjavur district, most of the children have access to upper primary
schools. There were 951 students (45%) reside within 0-1 km distance, 553 children (26% )from the distance of
1-2 km, 502 children (24%) from 2-3 km distance, 100 students (5%) from 3-5 km distance. There are no
students who travel to school beyond 5 km distance.
7. The students commute to school in public transport and Tamil Nadu government has provided with free bus
pass.
8. The students depend only on public transport and there is no other mode of transport available or affordable for
children.
9. In few schools as mentioned in the below table, there is no bus frequency being a remote hilly region and there
is a river across a school and students have no ferry service.
5. Presence of any natural or man-made barrier that poses any problem for the Students in accessing the School.
No. of Schools
Yes No
9 11 % 45% 55%
If yes mention them
Three is a no bus, remote area, river nearby the schools, GHS Inthalur, Thukkachi and Vanniyadi There is a around river in village, no bus, very remote area Vanarankudi GHS There is a national high way in cholopuram, muthukadu, neerathanallur and vattathikottai GHS
There is a pond nearby the schools, neerathanallur, katathiunjiyaviduthy and sengamangalam
There is a railway crossing in vannakkudi GHS Comments: There are very few natural or man-made barriers seen in Thanjavur district such as National / State
Highways, Railway crossing and River.
6. Name and Distance of the nearest secondary School (Govt./Pvt.) from the habitation the School is located
at, and catchment area of the School.
Distance from School/Catchment area Total
No. of Schools Less than 1 km. 1-3 km. 3-5 km. More than 5 km.
5 7 8 0 20 % 25% 35% 40% 0% 100%
*List of Schools is attached

25
Comments: From the sampled schools, 5 schools have the proximity of reaching Higher secondary school at a
distance within 1 km (25%), 7 schools can access secondary school at a distance of 1-3 km (35%) where as 8
schools are situated with the nearest higher secondary school at a distance of 3-5 km.
7. Any special arrangement like transportation facility or residential facility made available for the benefit of
students.
Facility Provided by number of Schools %
Transport facility 0 0% Residential facility 0 0%
Comments:
Students are commuting to school in public transport only and they are distributed with free travel bus pass. No other
special arrangement like transportation facility or residential facility made available for students. There is no bus
service arunthavapuram, vanarankudi, inthalur,
II Social Access
1. Pattern of population of the habitation and enrollment in the School –
1. (A) Social category-wise population of Students of age group 14-16 years in the habitation.
Population Pattern of Habitation
Category 14-16 Age
Boys % Girls % Total %
SC
ST
Minority
General
Total
*There is no data available with the school or at the district office.
1. (b) If data of category-wise population of Students of age group 14-16 years is not available then approximation of families of various categories residing in habitation of Schools -
Category No. of Schools responded % SC 8 40% ST 0 0%
Minority 5 25% General 3 15%
All Categories 4 20%

26
Comments: The SMDC members and the school HM agreed in 8 schools (40%) that there are SC children in
abundance and they live with poor economic condition.
(c ) Share of SC,ST, Minority, and BPL families’ Girls-boys in enrollment is proportionate to their share in population of the habitation/neighborhood or not.
No. of Schools
Proportionate yes no 20 0
% 100% 0%
If not, reasons thereof ………………………………………………………………………
Comments:
.(a) Class wise, Social Category wise *B-Boy, G-Girl, E-enrolled, P-present
S C S T M i n o r it y O t h e r s T o t a l C W S N
B
G
T
B
G
T
B
G
T
B
G
T
B
G
T
B
G
T
E
P E
P E
P E
P E
P E
P E
P E
P E
P E
P E
P E
P E
P E
P E
P E
P E
P E
P
I X
1 8 3 2 1 2 1 7 0 1 6 4 3 5 3 3 7 6 6 6 0 0 6 6 2 6 1 3 3 2 2 1 5 8 3 4 6 2 7 5 3 9 4 2 4 3 8 1 1 0 5 1 9 1 6 6 6 1 5 6 1 4 5 8 4 0 3 1 1 1 9 9 6 0 2 3 2 1 4 4
X
1 7 4 7 6 1 3 4 1 2 3 3 0 8 1 9 9 0 0 0 0 0 0 1 6 8 2 4 1 2 4 0 2 0 5 5 2 5 2 9 3 1 1 3 1 8 8 7 0 8 6 2 5 7 5 5 3 8 3 3 6 3 3 0 9 1 7 8 8 3 7 1 0 0 7 1
T o t a l 3 5 7 2 8 8 3 0 4 2 8 7 6 6 1 5 7 5 6 6 0 0 6 6 4 2 2 1 5 6 3 3 9 8 5 4 1 1 7 9 1 0 6 8 7 3 5 6 9 9 1 9 2 1 1 7 7 8 1 2 3 6 1 0 9 9 7 9 4 7 3 3 2 0 3 6 1 8 4 3 9 4 2 1 1 1 5
%
2 9 2 6 3 8 3 9 3 2 3 1 0 1 0 0 0 0 3 2 7 5 5 3 9 5 9 7 9 3 9 5 9 4 9 6 1 0 0 1 0 0 1 0 0 1 0 0 1 0 0 1 0 0 1 0 0 0 1 0
2(b) *Enrollment and attendance of students of economically backward background on the day of field visit
(based on BPL Card)
Cla
ss
SC
ST
Min
ority
Gen
&
Oth
ers
Tota
l
Tota
l
CW
SN
Boy
s
G
Tot
a l B
G
Tot
a l B
G
Tot
a l B
G
Tot
a l B
G
Tot
a l B
G
Tot
a l
E
P E
P E
P E
P E
P E
P E
P E
P E
P E
P E
P E
P E
P E
P E
P E
P E
P E
P
9
1
6
1
6
2
1
2
1
3
7
3
7
0 0 0 0 0 0 0 0 0 0 0 0 11 1
1
12 1
2
23 2
3
27 27
33 33
60 60
0 0 0 0 0 0
10 1
8
1
8
1
4
1
4
3
2
3
2
0 0 0 0 0 0 0 0 0 0 0 0 4 4 6 6 10 1
0
22 22
20 20
42 42
0 0 0 0 0 0
Tota l
3
4
3
4
3
5
3
5
6
9
6
9
0 0 0 0 0 0 0 0 0 0
0
0 0 15 1
5
18 1
8
33 3
3
49 49
53 53
102 102
0 0 0 0 0 0
%
3
4
3
4
3
5
3
5
6
9
6
9
0 0 0 0 0 0 0 0 0 0 0 0 15 1
5
18 1
8
33 3
3
49 49
53 53
102 102
0 0 0 0 0 0
2 (c) Any major variations in the pattern of attendance in respect of SC, ST, Minority, Girl Students and Students from BPL background and reasons thereof
There is no major variation in the pattern of attendance in respect of SC 69, ST, Minority, Girl Students 18 and Students19 from BPL background.

27
Whether above schemes ensure convergence with provisions of RMSA?
1. Yes 2. No
Comments:
4. Any overt or covert, manifest or subtle discrimination against Students of any social group or community
by the teachers or peers is observed in School, and the efforts made to minimize it.
No. of Schools
Discrimination No discrimination By teachers By peers
No discriminatory practices seen inside the school campus however it exists in the community
No such practices seen
100%
Comments: There are no discriminatory practices seen inside the school premises however during discussion with
the community they shared discrimination exist in the community.
Efforts made to minimize discrimination
There are no discriminatory practices seen inside the school campus anywhere in Thanjavur district.
5. Do the overall conditions prevalent in Schools facilitating access of CWSN to secondary Schools. If not,
the details of obstructions and barriers.
Number of Schools providing following facilities for access of CWSN –
Facility Number of Schools %
Proper ramps with hand rail 20 100%
Western toilet seat 1 0%
Special furniture in classroom 0 0%
Tricycle 0 0%
Escort 0 0%
Other (Specify)
Obstructions ……………………………………………………………………………….
Barriers ……………………………………………………………………………………..
2

28
III. Open Schooling
Open Schooling System does not prevailing in the state of Tamil Nadu.
3. At State level
1. Whether the State open School is established at the State level? 1. Yes 2. No
2. Whether the State open School has its own district regional centres and study centres?
1. Yes 2. No
3(a) Admission and Re-admission procedure in the State open School.
________________________________________________________________________
(b) Examination & assessment pattern.
________________________________________________________________________
(c) Student support services.
________________________________________________________________________
Comments:
4. Advocacy programme for out of School Students for bringing them back to theSchool
_____________________________________________________________________________________________
_________________________________________________________
Comments:
5. Methods for identification of the number of out of School Students in the State (household survey etc.)
_____________________________________________________________________________________________
______________________________________________________________
Comments:
6. Identification procedure of out of School Students.
_____________________________________________________________________________________________
______________________________________________________________
Comments:

29
IV. Out of School Students (OoSC)/Dropout Students of Age Group 14-16 years. (At School level)
1. The number, gender and category-wise (SC/ST/Minorities/CWSN) profile of out of School Students
(OoSC)/Dropout Students of age group 14-16 years in preceding session (2012-13).
Category Class OoSC/Dropout of age group 14-16 years Total drop out
%
Enrolled Boys
Boys drop out
% Enrolled Girls
Girls drop out
% Total Enrolled
SC IX 183 17 9% 170 8 5% 353 25 7% X 174 11 6% 134 5 4% 308 16 5%
ST IX 6 0 0% 0 0 0% 6 0 0% X 0 0 0% 0 0 0% 0 0 0%
Minority IX 26 1 4% 32 1 3% 58 2 3% X 16 1 6% 24 1 4% 40 2 5%
Gen & OBC
IX 444 10 2% 371 6 2% 815 16 2% X 261 1 0% 178 0 0% 439 1 0%
Total IX 659 28 15% 573 15 10% 1232 43 12% X 451 13 12% 336 6 8% 787 19 10%
CWSN IX 2 0 0% 2 0 0% 4 0 0% X 7 0 0% 0 0 0% 7 0 0%
2. The separate number of CWSN is included in all categories.
Name of category with higher dropout
The SC community drop outs comprise 7% in class 9 and 5% in class 10.
IX X IX X IX X IX X
SC SC ST ST Minority Minority Gen & OBC
Gen & OBC
353 308 6 0 58 40
815 439
25 16 0 0 2 2 16 1
OoSC Drop out age group of 14-‐16 years -‐ Thanjavur District
Total Enrolled Total drop out
30
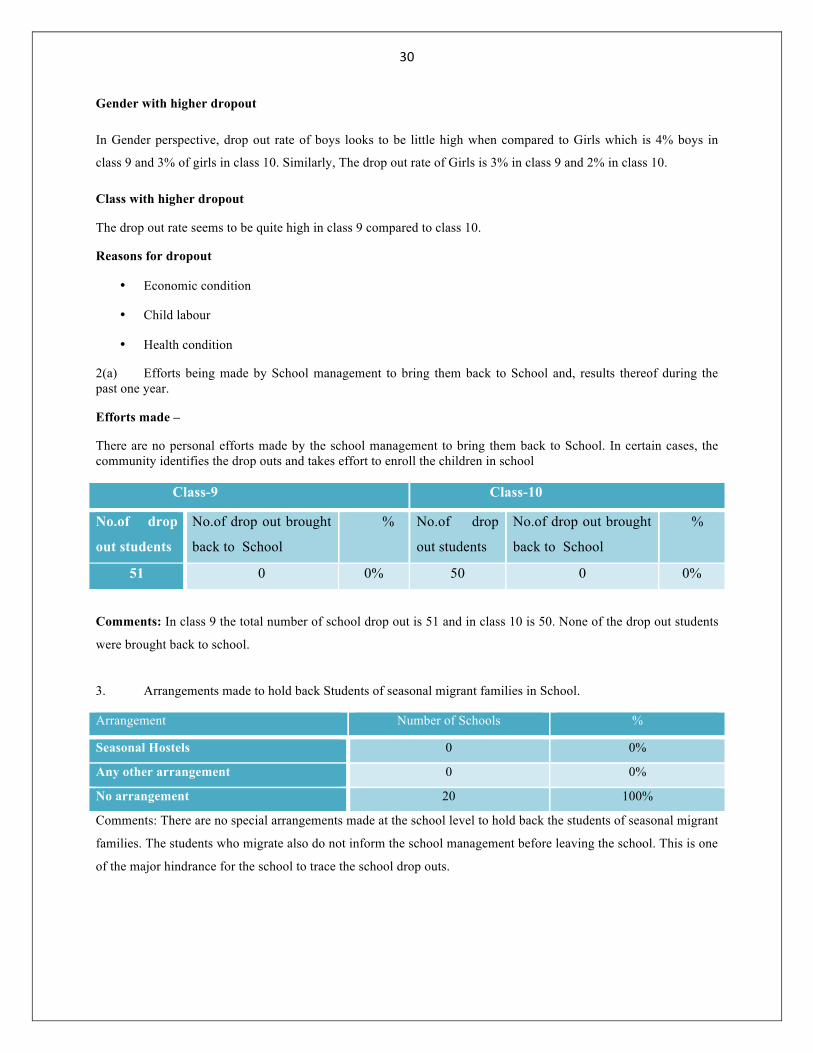
Gender with higher dropout
In Gender perspective, drop out rate of boys looks to be little high when compared to Girls which is 4% boys in
class 9 and 3% of girls in class 10. Similarly, The drop out rate of Girls is 3% in class 9 and 2% in class 10.
Class with higher dropout
The drop out rate seems to be quite high in class 9 compared to class 10.
Reasons for dropout
• Economic condition
• Child labour
• Health condition
2(a) Efforts being made by School management to bring them back to School and, results thereof during the past one year.
Efforts made –
There are no personal efforts made by the school management to bring them back to School. In certain cases, the community identifies the drop outs and takes effort to enroll the children in school
Class-9 Class-10
No.of drop
out students
No.of drop out brought
back to School
% No.of drop
out students
No.of drop out brought
back to School
%
51 0 0% 50 0 0%
Comments: In class 9 the total number of school drop out is 51 and in class 10 is 50. None of the drop out students
were brought back to school.
3. Arrangements made to hold back Students of seasonal migrant families in School.
Arrangement Number of Schools %
Seasonal Hostels 0 0%
Any other arrangement 0 0%
No arrangement 20 100%
Comments: There are no special arrangements made at the school level to hold back the students of seasonal migrant
families. The students who migrate also do not inform the school management before leaving the school. This is one
of the major hindrance for the school to trace the school drop outs.

31
4. If no such arrangement made, whether migration/transfer certificate is issued to such Students by the Schools?
No. of Schools issuing TC
No. of schools Yes No
11 9
% 55% 45%
Comments: There are 11 schools in Thanjavur district have issued Transfer Certificate to the students who migrate.
In 9 schools (45%) there was no instance of TC issued to the students who drop out from schools.
5. Information about any special training interventions meant for the OosC.
No. of Schools
Special trainings started Yes No 0 20
% 0% 100% Name of Trainings
1 2 3 4
5
5(a) Number of enrolled and present students in training programme on the day of visit
Boys Girls Total Enrolled Nil Nil Nil Present Nil Nil Nil
% Nil Nil Nil 5 (b) Training programme is imparted through –
Total No. of School conducting training
Trainers No. of School %
Regular teachers 0 0
NIOS 0 0 SIOS 0 0

32
(c ) Average duration of training programme in days and achievement level of students (on the basis of School
record)
Class Enrolled in Training
Programme
Appeared in Exam
Achievement level Above 60% 45-59% 33-44%
B G B G B G B G B G 9
10 Total
% Comments: There is no training programme conducted for out of school children
3. Equity
I. General Information
At School Level
Category-wise profile of attendance and achievement of students category-wise (SC/ST/Minority/CWSN)
Profiling of attendance and achievement (School result) of School Students in the age group of 14-16 years.
2011-12 2012-13 2013-14
Enrollment and Attendance on day of visit
SC ST MINO. CWSN SC ST MINO. CWSN SC ST MINO. CWSN
B G B G B G B G B G B G B G B G B G B G B G B G
Enrolled for 9th 110 129 0 0 30 32 0 1 120 164 0 0 21 33 3 2 143 136 0 0 28 34 2 2
Avg. % of Attend. 93 98 0 0 93 100 0 100 90 93 0 0 86 94 67 100 73 74 0 0 89 94 50 50
Appeared in Exam 102 127 0 0 28 32 0 1 108 152 0 0 18 31 2 2 105 101 0 0 25 32 1 1
% 93 98 0 0 93 100 0 100 90 93 0 0 86 94 67 100 73 74 0 0 89 94 50 50
Above 60% 31 43 0 0 6 15 0 1 31 43 0 0 10 16 2 1 43 51 0 0 10 20 0 0
% 30 34 0 0 21 47 0 100 29 28 0 0 56 52 100 50 41 50 0 0 40 63 0 0
Below 60% 71 84 0 0 22 17 0 0 77 109 0 0 8 15 0 1 62 50 0 0 15 12 1 1
% 70 56 0 0 79 53 0 0 61 72 0 0 44 48 0 50 59 50 0 0 60 37 100 100
Enrolled for 10 th 26 17 0 0 13 16 0 0 84 119 0 0 22 29 0 3 83 98 0 0 21 25 1 0
Avg. % Attend. 100 100 0 0 100 100 0 0 95 94 0 0 95 97 0 0 80 83 0 0 90 100 100 0
% 100 100 0 0 100 100 0 0 95 94 0 0 95 97 0 0 80 83 0 0 90 100 100 0
Appeared in Exam 26 17 0 0 13 16 0 0 80 112 0 0 21 28 0 0 66 81 0 0 19 25 1 0
% 100 100 0 0 100 100 0 0 95 94 0 0 95 97 0 0 80 83 0 0 90 100 100 0
Above 60% 11 5 0 0 3 15 9 6 28 52 0 0 10 20 0 0 22 22 0 0 6 14 0 0
% 42 29 0 0 23 94 0 0 33 44 0 0 45 69 0 0 27 22 0 0 29 56 0 0
Below 60% 15 12 0 0 10 1 0 0 52 60 0 0 11 8 0 0 44 59 0 0 13 11 1 0
% 58 71 0 0 77 6 0 0 67 66 0 0 55 31 0 0 73 88 0 0 71 44 100 0

33
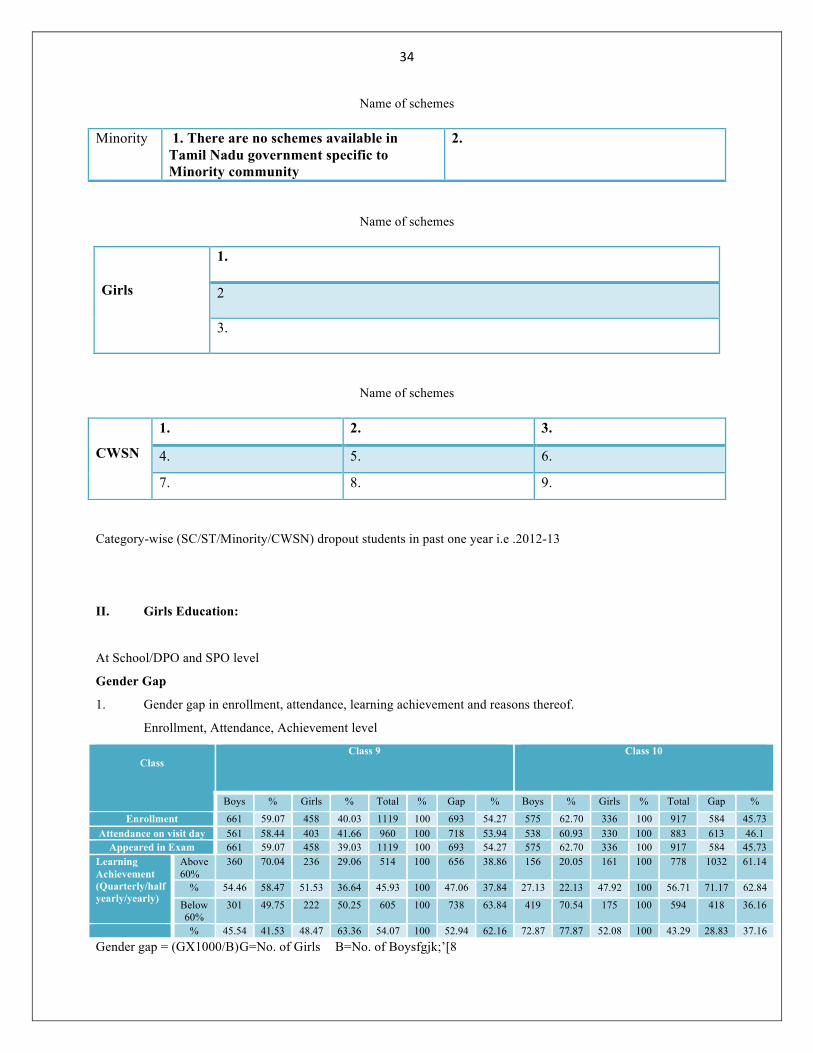
3. Details of specific schemes available in the State for ensuring enrollment of special category Students along with the assistance provided there under? c
There are no specific schemes available in the State for special category students other than one mentioned below.
Name of schemes
Name of schemes
0 100 200 300 400 500
B G B G B G B G B G B G B G B G B G B G B G B G
SC ST MINO. CWSN SC ST MINO. CWSN SC ST MINO. CWSN
2011-‐12 2012-‐13 2013-‐14
Category wise profile of students in Thanjavur District
Percentage scored below 60%
Percentage scored above 60%
Enrolled for 10 th
Percentage scored below 60%
Percentage scored above 60%
Enrolled for 9th
SC
1. Girls’ Incentive Scheme
To prevent drop outs of SC girl students, the IX th standard unmarried SC girls of age, less
than 16 years are provided with a fixed deposit certificate for Rs. 3000
2.
3.
ST
1. 1. Girls’ Incentive Scheme
To prevent drop outs of ST girl students, the IXth standard unmarried ST girls
of age, less than 16 years are provided with a fixed deposit certificate for Rs.
3000
4.
34
Name of schemes
Name of schemes
Name of schemes
Category-wise (SC/ST/Minority/CWSN) dropout students in past one year i.e .2012-13
II. Girls Education:
At School/DPO and SPO level
Gender Gap
1. Gender gap in enrollment, attendance, learning achievement and reasons thereof.
Enrollment, Attendance, Achievement level
Class
Class 9 Class 10
Boys % Girls % Total % Gap % Boys % Girls % Total Gap %
Enrollment 661 59.07 458 40.03 1119 100 693 54.27 575 62.70 336 100 917 584 45.73 Attendance on visit day 561 58.44 403 41.66 960 100 718 53.94 538 60.93 330 100 883 613 46.1
Appeared in Exam 661 59.07 458 39.03 1119 100 693 54.27 575 62.70 336 100 917 584 45.73 Learning Achievement (Quarterly/half yearly/yearly)
Above 60%
360 70.04 236 29.06 514 100 656 38.86 156 20.05 161 100 778 1032 61.14
% 54.46 58.47 51.53 36.64 45.93 100 47.06 37.84 27.13 22.13 47.92 100 56.71 71.17 62.84
Below 60%
301 49.75 222 50.25 605 100 738 63.84 419 70.54 175 100 594 418 36.16
% 45.54 41.53 48.47 63.36 54.07 100 52.94 62.16 72.87 77.87 52.08 100 43.29 28.83 37.16 Gender gap = (GX1000/B) G=No. of Girls B=No. of Boysfgjk;’[8
Minority 1. There are no schemes available in Tamil Nadu government specific to Minority community
2.
Girls
1.
2
3.
CWSN
1. 2. 3.
4. 5. 6.
7. 8. 9.

35
Comments: In class 9, an average of 54.46% boys have secured above 60% and average of 51.53% girls have
scored below 60%. In class 10, average of 27.13% boys have secured marks above 60% and 72.87% boys scored
below 60%. Similarly, 47.92% of Girls have scored above 60% in class 10 and an average of 52.08% has scored
below 60%.
Reasons for gaps in enrollment (if)
Reasons Respondent /districts %
a Socio Cultural/Reasons 0 0%
b Economic Reasons 60 100%
c Linguistic Reasons 0 0%
Total 60 schools -
Comments:
There is no specific reason highlighted by any teachers or head mistress for the gap in achievement level of boys and
girls. It was stated as a general opinion that the impact of poor economic status reflects more on Girl children. The
Girl children also support the parents in house hold activities and also they were given lesser priority in terms of
education when compared to boys. During the discussion the teachers expressed these views regarding education of
girl children.
0 20 40 60 80
Boys Girls Boys Girls
9th 9th 10th 10th
54.46 51.53
27.13 47.92
45.54 48.47
72.87 52.08
Achievement level of Boys and Girls in Class IX and X
Above 60%
Below 60%

36
Reasons for absenteeism (Gap in attendance)
Reasons Respondents (School/district)
%
A Health (own or family members) 3 15% B Social cultural issues 0 0% C Sibling Care 0 0%
D Household responsibilities 0 0% E Family issues / Gone to relatives 0 0% F Earning for livelihood 13 65%
G Migration 3 15% H Any other 1 5%
Total 20 100%
Comments: The major reasons for absenteeism are earning for livelihood where as 65% of drop out is due to this
factor, next being the migration factor while 15% have left schools, and another 15% children were report various
health problems for dropping schools.
0%
10%
20%
30%
40%
50%
60%
70%
Percentage
Reasons for Absenteeism
A Health (own or family members)
B Social cultural issues
C Sibling Care
D Household responsibilices
E Family issues / Gone to relacves
F Earning for livelihood
G Migracon
H Any other

37
2. Efforts made to address the gender gap attitudinal and physical.
Barriers No. of Schools % Efforts made to address barriers
(a) Physical barriers 0 0% - (b) Attitudinal 0 0% - (c) Linguistic barriers 0 0% - (d) Economic barriers 0 0% -
Comments:
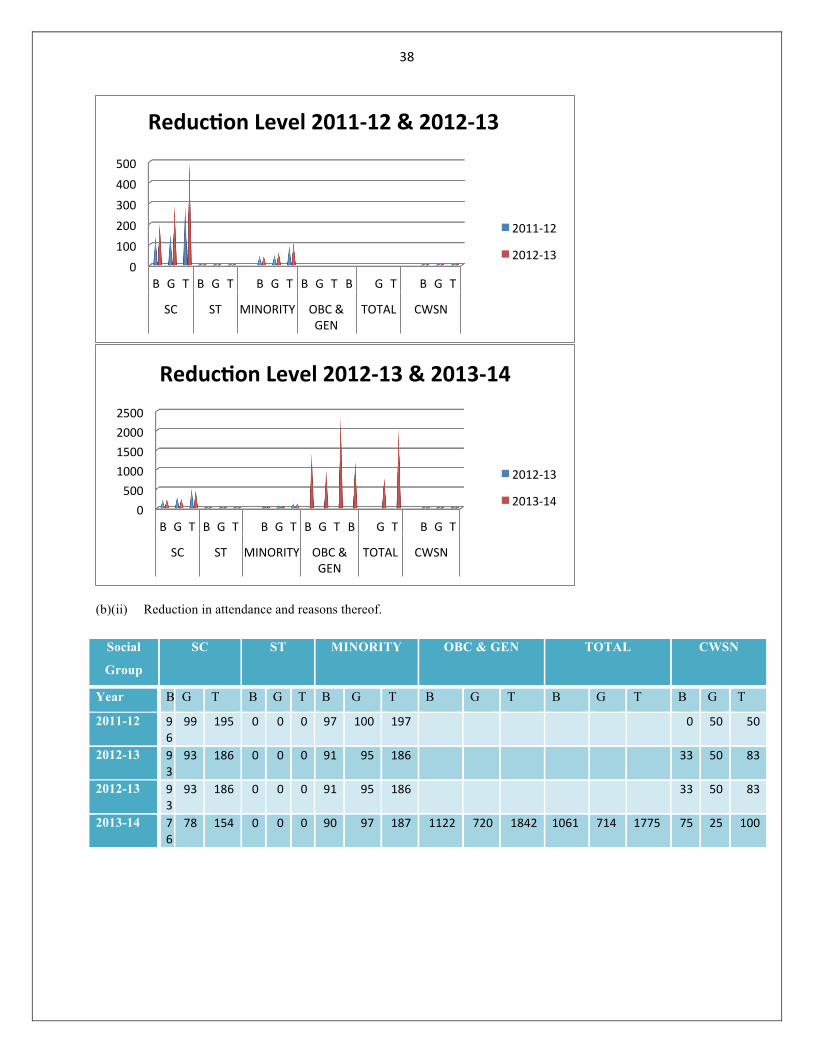
3. Any reduction in enrollment, attendance, learning achievement, and reasons thereof
(b) (i) Reduction in enrollment and reasons thereof.
Social
Group
SC ST MINORITY OBC & GEN TOTAL CWSN
Year B G T B G T B G T B G T B G T B G T
2011-12 136 146 282 0 0 0 43 48 91 0 1 1
2012-13 204 283 487 0 0 0 43 62 105 3 5 8
Gap
2012-13 204 283 487 0 0 0 43 62 105 3 5 8
2013-14 226 234 460 0 0 0 49 59 108 1413 969 2382 1233 792 2025 3 2 5
Gap 136 146 282 0 0 0 43 48 91 0 1 1
38
(b)(ii) Reduction in attendance and reasons thereof.
Social
Group
SC ST MINORITY OBC & GEN TOTAL CWSN
Year B G T B G T B G T B G T B G T B G T
2011-12 96
99 195 0 0 0 97 100 197 0 50 50
2012-13 93
93 186 0 0 0 91 95 186 33 50 83
2012-13 93
93 186 0 0 0 91 95 186 33 50 83
2013-14 76
78 154 0 0 0 90 97 187 1122 720 1842 1061 714 1775 75 25 100
0 100 200 300 400 500
B G T B G T B G T B G T B G T B G T
SC ST MINORITY OBC & GEN
TOTAL CWSN
ReducFon Level 2011-‐12 & 2012-‐13
2011-‐12
2012-‐13
0 500 1000 1500 2000 2500
B G T B G T B G T B G T B G T B G T
SC ST MINORITY OBC & GEN
TOTAL CWSN
ReducFon Level 2012-‐13 & 2013-‐14
2012-‐13
2013-‐14

39
(b)(iii) Reduction in achievement level and reasons thereof*.
Social
Group
SC ST MINORITY OBC & GEN TOTAL CWSN
Year B G T B G T B G T B G T B G T B G T
2011-12 42 48 90 0 0 0 9 30 39 9 7 16
2012-13 59 95 155 0 0 0 20 36 56 2 1 3
2012-13 59 95 155 0 0 0 20 36 56 2 1 3
2013-14 65 73 138 0 0 0 16 34 50 565 436 1001 516 397 913 0 0 0
Comments: There are no specific reasons or efforts taken to address the issue of gender gap.
5. Any efforts being made for the counseling of parents to handle the problem of girls. If not why?
No. of Schools
Counseling of parents done Yes No
0 20 % 0% 100%
Comments:
6. Impact of separate hostel and other physical facilities and availability of security on enrollment, attendance
and learning achievement of girls.
i. Number of Schools having facility of separate girls’ hostel in campus or in nearby area.
ii. Number of girls residing in girls’ hostel in sample Schools.
iii. Any physical barrier faced by hostellers in their access to School
______________________________________________________________________________
Comments:
4. Guidance and Counseling
At School level:
1. Guidance and Counseling Cell been constituted by the School or not. If yes, the available student counselor
ratio:
0
0

40
No. of Schools
Guidance & Counselling Cell Constituted Yes No
3 17 % 15% 85%
Avg. SCR 1:50
SCR: Student Counselor Ratio
Comments: It has been reported that only 3 schools have constituted Guidance and Counseling cell but however
there is no active counseling taking part in these cells as well. The remaining 17 schools (85%) have not constituted
a counseling cell. There is no proper training provided to the teachers in counseling the students. Student Counselor
Ratio is 1:50 in the 3 schools where counseling cell is constituted.
2. Number of Students being assisted by the cell.
Total Enrollment of Class IX, X in sampled Schools in
district
No. of students assisted by the Cell in total sampled Schools in district
%
- - -
Comments: There is no active counseling assistance happening in the government schools of Thanjavur district.
The schools are not properly equipped and there is no professional training given to the teachers to handle
counseling for students.
3. The frequent problem areas of the students for which guidance and counseling is being sought.
S.No. Problem areas Responses % 1 Selection of optional subjects after sec. 2 To opt scout/guide/NCC 3 In choosing career 4 Seeking information about entrance exams
to various professional streams
No data available
5. Quality
I. Enabling Conditions : At School level
Availability of following enabling conditions
S. Physical Aspects Total Number of rooms
Number of equipped rooms
%
No. 1 Natural light 250 236 94%

41
2 Ventilation 250 236 94% 3 Black Board appropriately located in
classroom 250 210 84%
4 Bulb/Tube light /CFL 250 251 100% 5 Fan 220 214 97% 6 Teaching aids 210 20 10%
Comments: Natural light is available in 94% rooms of 20 sampled schools, like wise ventilation exists in 94%
rooms. Blackboards are appropriately located in 84% rooms. Availability of bulbs/tubelights/CFL exists in 100%
rooms in sampled 20 schools. Fan is available in 97% rooms. The teaching aids are available only 20 class rooms
(10%).
The physical aspects are at the satisfactory level in almost all the schools.

42
1(b) Availability & workability of following material/equipments –
S. No.
Name of Material/Equipment Availability in Number of Schools
Functional in Number of Schools
Number % Number % 1 Teaching aids 20 100% 20 100% 2 Desk-chairs/stools for students (Adequate) 20 100% 19 100% 3 Integrated science lab with equipments and
material 20 100% 20 100%
4 Math kit 20 100% 20 100% 5 Science kit 20 100% 20 100% 6 Computer lab with computers and supportive
devices and internet connection 20 100% 18 80%
7 Art and Craft room 0 0 0 0 8 Library with age appropriate books and seating
arrangement 0 0% 0 0%
9 TV 0 0% 0 0% 10 Separate Activity room for girls 0 0% 0 0% 11 Audio Equipments 0 0% 0 0% 12 Video Equipments 0 0% 0 0% 13 LCD Projector 0 0% 0 0% 14 Overhead projector 0 0% 0 0% 15 Purified/ Safe Drinking Water 20 100% 20 100% 16 Fire Extinguisher 20 100% 20 100% 17 Auditorium 0 0% 0 0% 18 Staff room 0 0% 0 0% 19 Indoor games room 0 0% 0% 0% 20 N.S.S./NCC/Scout & Guides room 0 0 0 0 21 Counselor room 0 0% 0 0% 22 First-aid room 0 0% 0 0%
Comments:
2. The number of days, the School functioned during the last academic year? Give reasons for the closure, if
any of the School remains closed for long gaps during last year. Suggestions to avoid repetition of such instances
• No. of Schools remained closed
• Average No. of days, School(s) remained closed in last year
An average of 156 days closed in Thanjavur district including Saturdays, Sundays and Government
holidays.
• Reasons for the closure
1.
2.
3.
0
210 days

43
3. Number of teachers present in the School (Male & Female, vacancies against sanctioned posts.(In total sampled Schools in district)
Sanctioned Posts (subject-wise)
Number of teachers placed
Total % Number of teachers present in School on
visit day
Vacancies against
sanctioned posts
%
M F M F
192 70 105 175 91% 65 101 17 9% Comments:
The total number of teachers for class 9th and 10th placed in 20 schools comes to 170 against 192 sanctioned posts,
the number of posts lying vacant is 17 (9%). 95% teachers were found present on the day of field visit across 20
schools.
3. In case of teacher’s vacancy, the alternative arrangements being made by the head of the institution to complete
the course curriculum.
Comments: The course curriculum is completed through available teachers as they take additional classes.
Extra classes are also taken during Saturdays and on other public holidays in the schools where they have
teacher vacancies.
5. Availability of teachers for each class and for teaching science, mathematics and language.
Number of Schools
Sufficient teachers available to teach Science Math Language
20 20 19 % 100% 100% 95%
Comments:
6. Number of teachers possessing professional training qualifications (subject-wise) as mandated and number of untrained teachers.
No. of School
No. of trained teachers No. of untrained teachers in sampled Schools
20 0 0 % 100% 0% 0
Comments:
7. Practice of truancy, i.e. absenteeism/class bunking by students/teachers being reported in the School, if so,
the reasons thereof, steps taken by the School management to curb the practice.

44
Class bunking/Truancy % No. of Schools
Yes No Student 0 0 0%
Teachers 0 0 0% Comments:
8. Policy of teacher recruitment, deployment, training, remuneration and career advancement (At State
level)
Tamil Nadu Teacher Eligibility Test (TET) conducted by Teacher Recruitment Board (TRB) for the recruitment of
teachers for Tamil Nadu Government Schools; they conduct Teachers Eligibility Test for the selection of teachers
for Class I to XII.
II. Teaching Learning Process
1. Maintenance of teacher’s diary including curriculum delivery and lesson Plan etc. by teachers &
countersigned by the Head of the institution regularly.
No. of Schools
Teachers diary maintained Counter sign
Yes No Yes No
20 0 20 0
% 100% 0% 100% 0%
Observation & Comments
2. Availability of timetable prescribed by the School and followed by the teachers.
No. of Schools
Prescribed time table available Time table followed by teachers Yes No Yes No 20 0 20 0
% 100% 0% 100% 0% Comments:
3. Are discussions and group team works encouraged as a methodology of teaching for involvement of
Students/students in teaching learning process?
No. of School
Discussion and group team work encouraged Yes No 20 0
% 100% 0%

45
4. a-c Classroom management with reference to seating arrangement of Students.
No. of Schools
Students made to sit in small groups
Students of disadvantaged groups
and Students with disabilities sit
separately or on back benches
Students have role in classroom management
Yes No Yes No Yes No 0 20 0 20 20 0
% 0% 100% 0% 100% 100% 0% Groups
made of Different
Same class
No. of Schools
0 20
% 0% 100% Comments: all schools sit separate boys and girls
5. on site academic support by resource teachers in year 2012-13
Average frequency of visits of resource teachers /Schools
Average time spent by resource teacher/School
Nature of support provided
1. Resource teachers are appointed for 3 months in case if there are slow learners in the school 2. Resource teachers extend their support only to class 9 and not for class 10
3. Comments: A periodical visit of resource teacher is required both class 9 and 10 since the slow learners if
monitored closely and supported there will be more changes. It needs consideration.
6. Special Teaching for Learning Enhancement:-
Number of Schools, which arranged zero periods, extra classes etc. for academically weaker students –
No. of Schools who arranged zero period, extra class Yes No
20 0 % 100% 0%
Extra classes ran Throughout year Only for one month before exam 20 % 100%
46
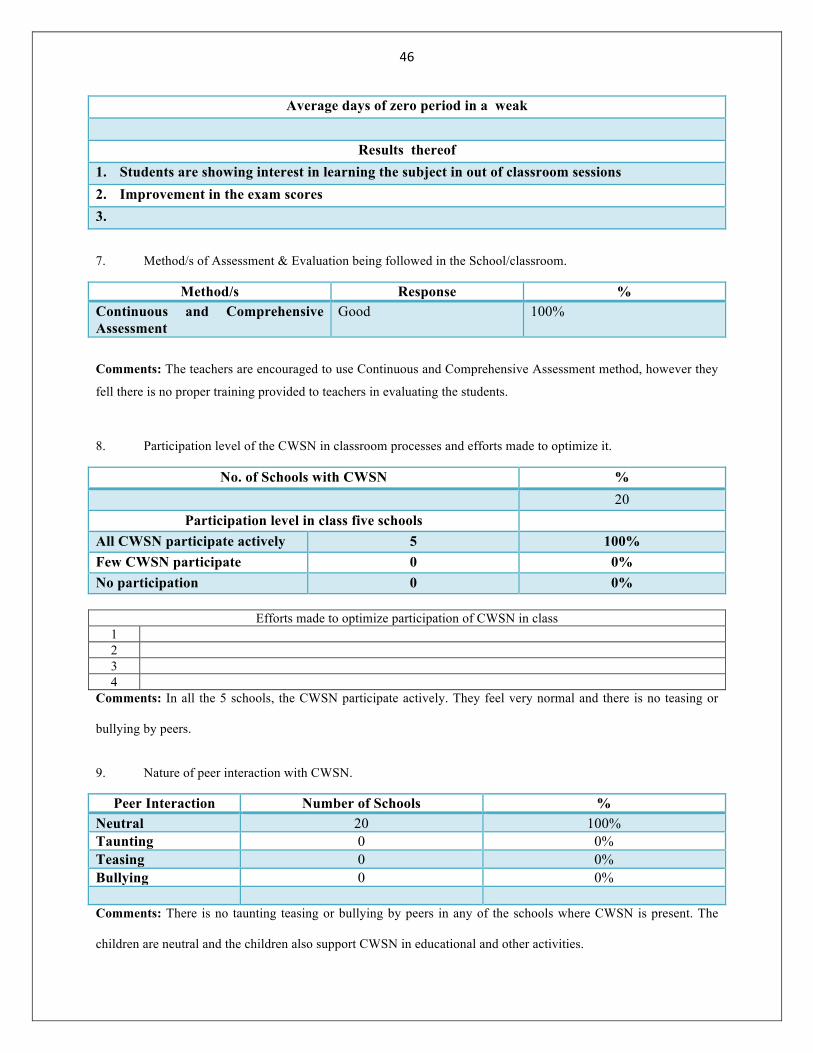
Average days of zero period in a weak
Results thereof 1. Students are showing interest in learning the subject in out of classroom sessions 2. Improvement in the exam scores 3.
7. Method/s of Assessment & Evaluation being followed in the School/classroom.
Method/s Response % Continuous and Comprehensive Assessment
Good 100%
Comments: The teachers are encouraged to use Continuous and Comprehensive Assessment method, however they
fell there is no proper training provided to teachers in evaluating the students.
8. Participation level of the CWSN in classroom processes and efforts made to optimize it.
No. of Schools with CWSN % 20
Participation level in class five schools All CWSN participate actively 5 100% Few CWSN participate 0 0% No participation 0 0%
Efforts made to optimize participation of CWSN in class 1 2 3 4
Comments: In all the 5 schools, the CWSN participate actively. They feel very normal and there is no teasing or
bullying by peers.
9. Nature of peer interaction with CWSN.
Peer Interaction Number of Schools % Neutral 20 100% Taunting 0 0% Teasing 0 0% Bullying 0 0% Comments: There is no taunting teasing or bullying by peers in any of the schools where CWSN is present. The
children are neutral and the children also support CWSN in educational and other activities.
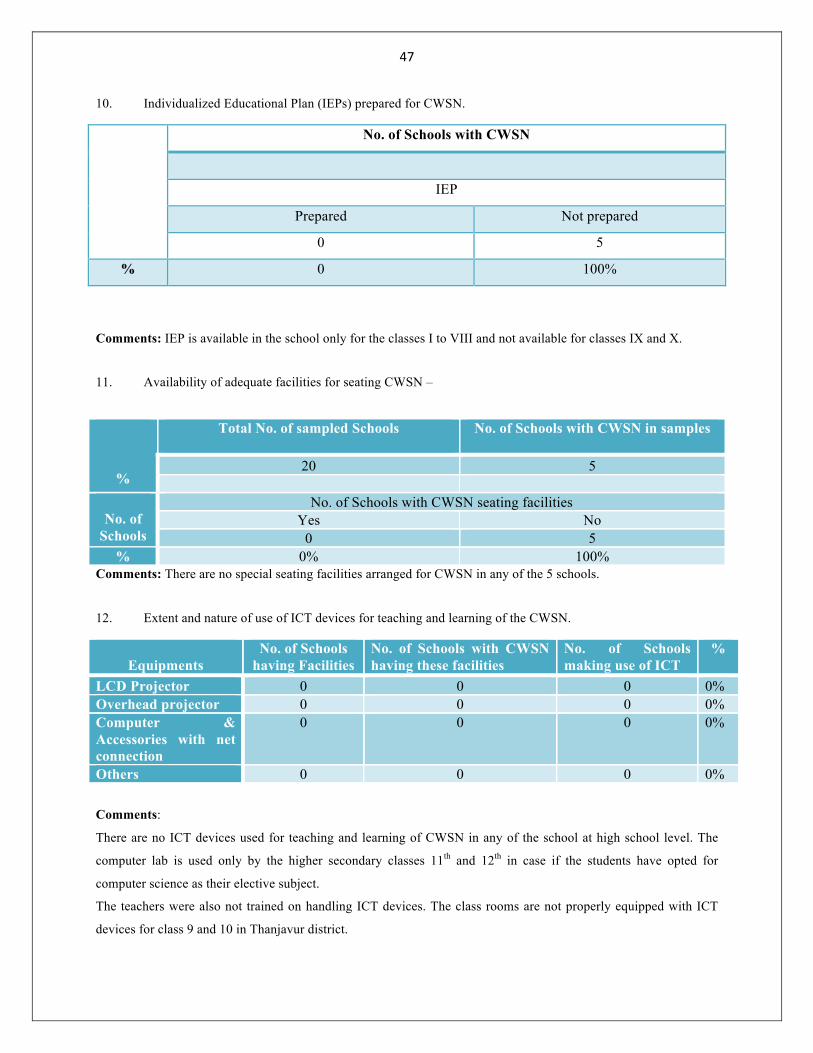
47
10. Individualized Educational Plan (IEPs) prepared for CWSN.
No. of Schools with CWSN
IEP
Prepared Not prepared
0 5
% 0 100%
Comments: IEP is available in the school only for the classes I to VIII and not available for classes IX and X.
11. Availability of adequate facilities for seating CWSN –
%
Total No. of sampled Schools
No. of Schools with CWSN in samples
20 5
No. of
Schools
No. of Schools with CWSN seating facilities Yes No
0 5 % 0% 100%
Comments: There are no special seating facilities arranged for CWSN in any of the 5 schools.
12. Extent and nature of use of ICT devices for teaching and learning of the CWSN.
Equipments
No. of Schools having Facilities
No. of Schools with CWSN having these facilities
No. of Schools making use of ICT
%
LCD Projector 0 0 0 0% Overhead projector 0 0 0 0% Computer & Accessories with net connection
0 0 0 0%
Others 0 0 0 0%
Comments:
There are no ICT devices used for teaching and learning of CWSN in any of the school at high school level. The
computer lab is used only by the higher secondary classes 11th and 12th in case if the students have opted for
computer science as their elective subject.
The teachers were also not trained on handling ICT devices. The class rooms are not properly equipped with ICT
devices for class 9 and 10 in Thanjavur district.

48
III. Teachers’ Training
1. Provisions for Training of Teachers
S. No.
Provisions for In-service training Schedule Duration
1 Induction training (Science, Maths, English, `Social Science, Hindi & Sanskrit)
For newly recruited teachers
10 days training programme based on NCF. 2005, content, pedagogy and classroom activities.
2 In-service training –need based 5 days’ training programme in workshop mode in Maths, English, Social Science and Science
From July to December (50% of existing teachers from each district to be covered)
5 days
3 Orientation programme for Head Master/ Principal
As per SPO calendar 3 days
4 Training for newly recruited Head Masters As per SPO calendar 10 days 5 Management training for Head Masters/
Principals From Aug. to January 14 days
6 Workshop for Development of different modules for training
As per SPO calendar 10 days
7 Training of Resource Persons for H.M.’s training
As per SPO calendar
8 Block head-quarters and girls hostels As per SPO calendar 2 hrs. daily after School for 15 days
9 Development and Life skills for girls As per SPO calendar 5 days 10 Sensitization programme (legal (literacy
workshop) As per SPO calendar 1 days
11 1(a) Targeted annual Plan prepared by the State for in-service teachers’ training to improve quality and skills – Yes Comments: The above table gives the information about the training provided to the teachers under RMSA as per
the SPO calendar.

49
2. Inclusion of trainings for dealing with CWSN, in training programme
Details of in-service training in subjects received by teachers -
No. of Schools whose teachers received training under RMSA
% S.No. Subjects Number of teachers,
received training under RMSA
Average teachers per School who received training
Average Duration
1 Science 11 0 7 days 2 Maths 9 0 7 days 3 English 7 0 7 days 4 Social Science 23 0 7 days 5 Sanskrit 0 0 0 6 Hindi 0 0 0
Total 0 0 0 Inclusion of training
to deal with CWSN 0 0 0
Comments:
There is very few teachers received training under RMSA in Thanjavur district. 11 teachers have received training in
Science subject, 9 teachers in Maths, 7 teachers in English and 23 teachers in social science subject. Almost all the
training had lasted for 7 days. There was no training session conducted for Inclusion of CWSN.
2 (i)
Need of various trainings expressed by teachers S.
No. Name of Training Number of Schools
expressed the need Frequency Duration
1 Subject based training 20 Annual 4 days 2 Orientation Programme 20 Annual 5 days 3 Innovations’ training 20 Annual 5 days 4 Training for Development of life
skills 20 Annual 5 days
5 Computer training 20 Annual 11 days 6 Scout Masters’ training 0 Annual 7 Disaster Management Training 0 Annual 11 days 8 CWSN 0 9 Any other (mention) - - -
Comments: In almost all the sampled schools, teachers expressed that they are in need of periodical subject based
training, various orientation programmes, Innovations training, training for development of life skills and computer
training.
4. Impact of training on the confidence level of the teacher in handling a class with CWSN :
There had been no training provided to teachers on handling CWSN. In most of the cases, the CWSN who complete
VIIIth standard do not continue their education further. It could be due to several reasons but at the school level

50
there is no special effort taken by the management to continue the education of CWSN. The number vastly reduced
in migration of VIII to IX th standard.
4. Physical availability of adequate and good quality facilities for inservice training with reference to – Facilities Adequate % Inadequate %
Space 20 100% 0 0 Projection 20 100% 0 0 Tools/Modules 20 100% 0 0% Equipments (LCD, Projector, Computer etc.)
20 100% 0 100%
Comments: There are no modules or tools available for in-service training in any of the schools
5. Whether training modules are need based or not?
No. of Schools Yes No
0 20
% 0% 100%
Comments: There are no training modules available
6. Impact: Use of new technologies like Computer Assisted Learning (CAL), LCD Projector etc. for
imparting lessons in the classroom by teachers.
Total No. of teachers received training No. of teachers using CAL, LCD, etc. teaching
%
192 0 0%
Comments: There are no teachers in 9th and 10th standard use Computer Aided teaching in Thanjavur District.
There is a computer lab available in all the schools. CAL centers are used by Primary students and higher secondary
children only if they have opted for computer science as elective subject.

51
7. Trainers/Resource persons from following institutions who imparted trainings –
N = (No. of Schools) whose teachers received training from RMSA
S.No. Institutes Number of Respondents % of respondents
1 Secondary Schools 20 100% 2 Higher Secondary Schools 20 100% 3 DIET 20 100% 4 College/University 20 100% 5 SIERT 0 0% 6 IASE 0 0% 7 CTE 8 NIC 9 Any other institution (mention)
10 Total

52
Comments: In almost all the schools teachers have been provided with training on various subjects under RMSA.
The resource persons/trainers are from secondary schools, higher secondary schools, DIET and few training sessions
were conducted by college / university professors.
8. Any other issue related with teachers’ training of secondary education.
1. ------------no----------------------------------------------------------------------------------
2. ------------no----------------------------------------------------------------------------------
3. ------------no----------------------------------------------------------------------------------
Comments:
6. CIVIL WORKS
I. General Information At School Level
(1-2)
S.N. Name of School Year of establishment
Year of construction
Remarks
1 GHS,Mohamed Bunder - 2011 The work good but now stopped because insufficient fund, First Floor Lintel Level
2 GHS inthalur 2011 The work good but now stopped because insufficient fund, First Floor Roof laid Gound Floor completed
3 GHS Naduvoor 2011 Weathering Course Tiles Electrification Plumbing Works, Finishing Level
4 GHS Mudukadu 2011 Weathering Course Tiles Electrification Plumbing Work, Finishing Level
5 GHS Sillathur (North) 2011 First Floor Brick Work Roof Concrete Weathering Course Tiles Electrification Plumbing Works Toilet Facilities White and Colour washing, First Floor Roof Level
Comments: In Thanjavur district, 5 schools had civil work. The civil works were started in the year 2011 but left
incomplete due to lack of funds.

53
RASHTRIYA MADHYAMIK SHIKSHA ABHIYAN, THANJAVUR DISTRICT
New School Construction 2009 - 2010 as on 19.02.2014
S.
N
o
Name of
School
Date of
Commenceme
nt
Administrati
ve
Sanctioned
Amount
Expenditur
e sofar
Stage Balance
work to be
done
Remarks
1 GHS,
Kollankar
ai
15.03.2011 50,50,000 5050000.00 Completed Weathering
Course &
Tiles
Electrificatio
n Plumbing
Works
Toilet
Facilities
2 GHS,
Panaveli
05.03.2012 50,50,000 5050000.00 First Floor
Roof laid
GoundFlo
or
completed
Weathering
Course &
Tiles
Electrificatio
n Plumbing
Works
Plastering
and White
and Colour
washing

54
3 GHS,
Indalur
26.01.2011 50,50,000
+ 612000
(Furniture)
----------------
5662000
----------------
5604000.00 First Floor
Roof laid
GoundFlo
or
completed
Weathering
Course
Electrificatio
n Plumbing
Works
White and
Colour
washing
4 GHS,
Mohamed
Bunder
23.07.2012 50,50,000 4281732.00 First Floor
Lintel
Level
Inner &
Outer
Plastering
Weathering
Course Tiles
Electrificatio
n Plumbing
Works
Toilet
Facilities
White and
Colour
washing
5 GHS,
Sillathur
(North)
10.07.2011 50,50,000 4565804.00 First Floor
Roof
Level
First Floor
Brick Work
Roof
Concrete

55
Weathering
Course Tiles
Electrificatio
n Plumbing
Works
Toilet
Facilities
White and
Colour
washing
6 GHS,
Thaligai
Viduthi
26.02.2011 50,50,000 5050000.00 Completed Weathering
Course Tiles
Electrificatio
n Plumbing
Works
Opened
by
Honorabl
e CM
7 GHS,
Naduvoor
07.03.2011 50,50,000 5050000.00 Finishing
Level
Weathering
Course Tiles
Electrificatio
n Plumbing
Works
8 GHS,
Mudukadu
05.02.2011 50,50,000 5050000.00 Finishing
Level
Weathering
Course Tiles
Electrificatio
n Plumbing
Works
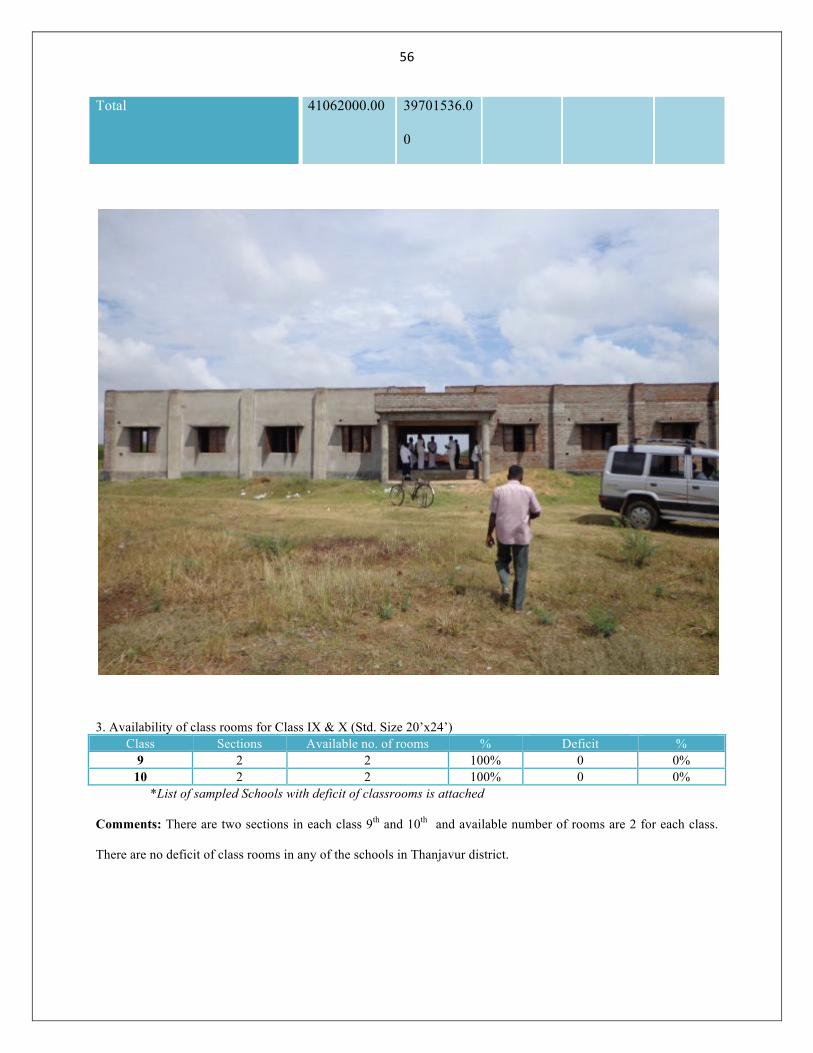
56
Total 41062000.00 39701536.0
0
3. Availability of class rooms for Class IX & X (Std. Size 20’x24’)
Class Sections Available no. of rooms % Deficit % 9 2 2 100% 0 0%
10 2 2 100% 0 0% *List of sampled Schools with deficit of classrooms is attached
Comments: There are two sections in each class 9th and 10th and available number of rooms are 2 for each class.
There are no deficit of class rooms in any of the schools in Thanjavur district.
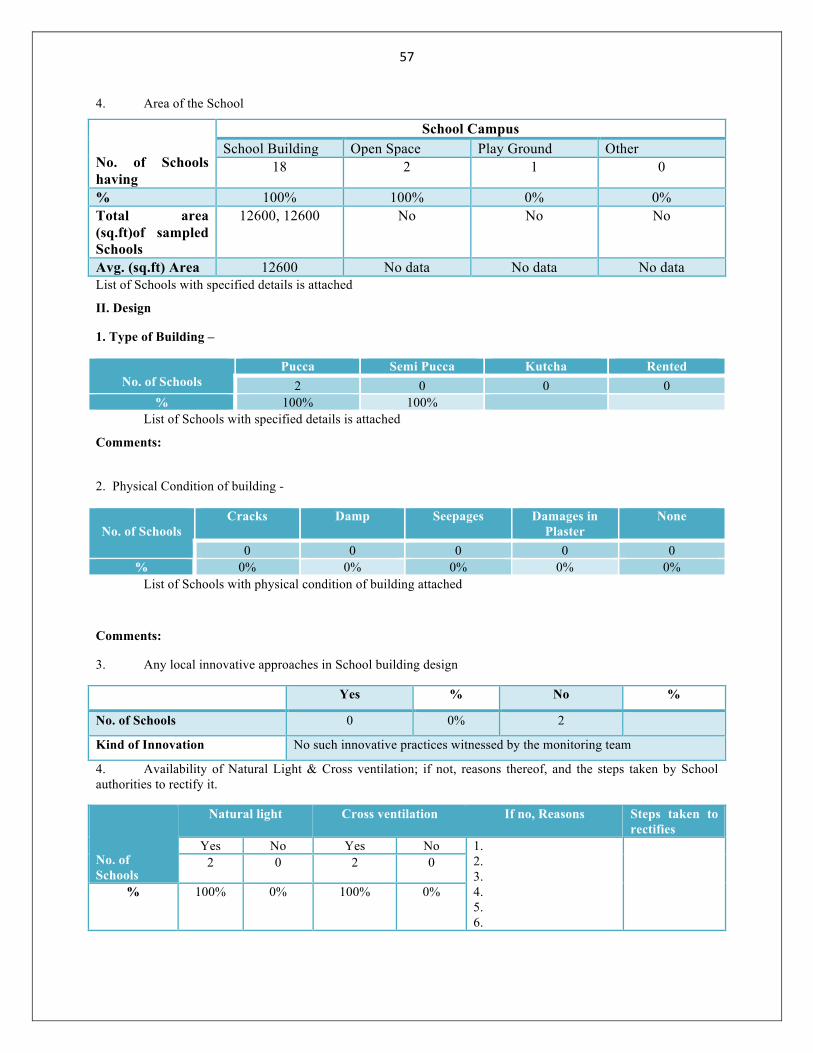
57
4. Area of the School
No. of Schools having
School Campus School Building Open Space Play Ground Other
18 2 1 0
% 100% 100% 0% 0% Total area (sq.ft)of sampled Schools
12600, 12600 No No No
Avg. (sq.ft) Area 12600 No data No data No data List of Schools with specified details is attached
II. Design
1. Type of Building –
No. of Schools
Pucca Semi Pucca Kutcha Rented 2 0 0 0
% 100% 100% List of Schools with specified details is attached
Comments:
2. Physical Condition of building -
No. of Schools
Cracks Damp Seepages Damages in Plaster
None
0 0 0 0 0 % 0% 0% 0% 0% 0%
List of Schools with physical condition of building attached
Comments:
3. Any local innovative approaches in School building design
Yes % No %
No. of Schools 0 0% 2
Kind of Innovation No such innovative practices witnessed by the monitoring team
4. Availability of Natural Light & Cross ventilation; if not, reasons thereof, and the steps taken by School authorities to rectify it.
No. of Schools
Natural light
Cross ventilation If no, Reasons Steps taken to rectifies
Yes No Yes No 1. 2. 3. 4. 5. 6.
2 0 2 0
% 100% 0% 100% 0%

58
5. Lighting Facility in Classrooms
No. of Schools
Arrangement of lighting facility Yes No
0 % 0% 0%
No. of Schools
Functional Not functional Yes No
0 2 % 0% 0%
If not functioned, Reasons 1. under going on constriction
2.
3. 4.
Steps taken 1. under going on constriction
2. 3. 4.
Supply of electricity
No. of Schools
Continuous Intermittent
20 0
% 100% 0%
Average duration of availability
6. Availability and usability of following provision of alternative electric power supply -
Generator Inverter Gobar Gas
Plant
Solar Panels
Wind Electricity
Other
No. of Schools Availability 0 0 0 0 0 0
% 0% 0% 0% 0% 0% 0%
No. of School In working condition
Nil Nil Nil Nil Nil Nil
% Nil Nil Nil Nil Nil Nil
No. of School Usability Nil Nil Nil Nil Nil Nil
% Nil Nil Nil Nil Nil NiL

59
7. (a-b) Library Design - Availability of the Following -
No. of Schools
Sufficient Seating
Space
Proper Light Ventilation Regular Pest Control
Yes No Yes No Yes No Yes No
1 1 0 0 2 0 0 2
% 5% 5% 0% 0% 10% 0% 0% 10%
Comments:
8. (a-d) Laboratory Design
Laboratory Number of Schools (a) Adequate space for Physics, Chemistry,
Biology and other subjects Yes % No %
2 0 (b) Proper height (3 ft.) of Lab. Table 2 0 (c) (i) Cross Ventilation 2 0
(ii) Exhaust Fan 2 0 (d) Availability of Running Water 0 0
The construction of laboratory has not been completed in all the 5 schools. The remaining 15 schools do not have a
laboratory.

60

61
9. Facilities for Physically Challenged:
(a) Availability of Ramps to access the following
S.No. Ramps to Number of Schools Yes % No %
(i) Entrance of School 18 90% 2 10% (ii) Drinking Water Facility 0 0% 0 0% (iii) Toilet Facility 0 0% 0 0% (iv) Science lab 0 0% 20 100% (v) Computer Lab 0 0% 20 100% (vi) Mathematic Lab 0 0% 20 100% (vii) Library 0 0% 20 100% (viii) Auditorium - - - - (ix) Play Ground - - - -
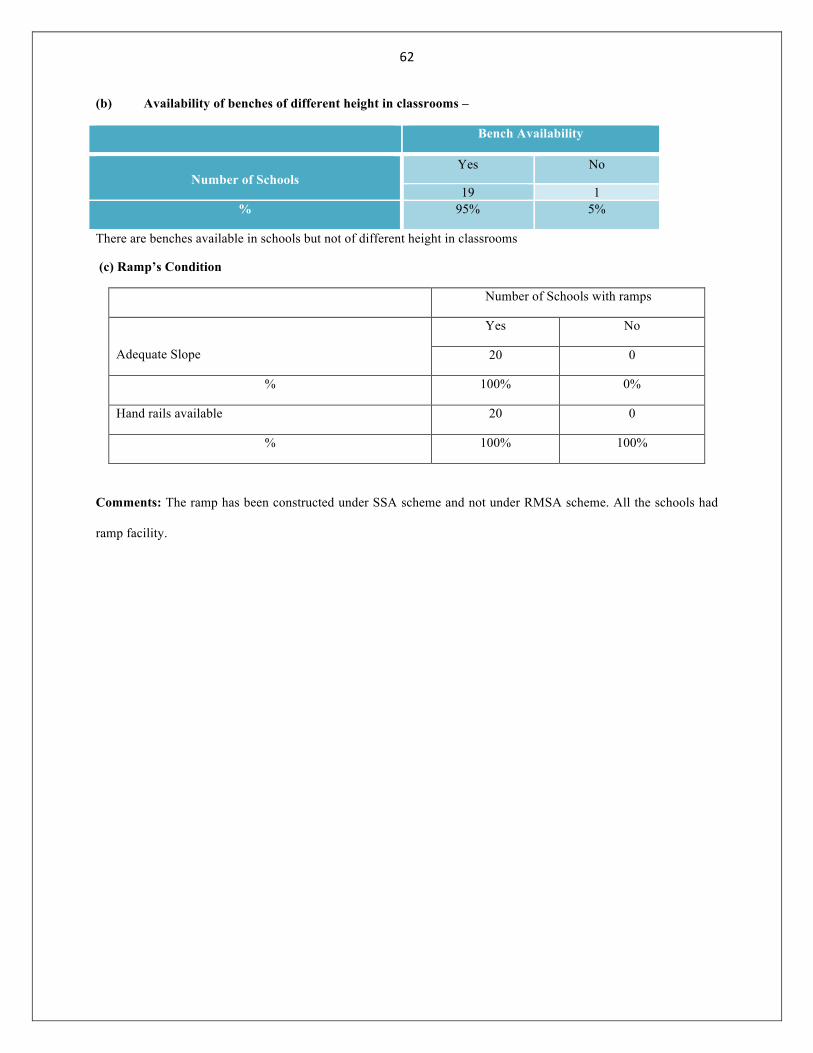
62
(b) Availability of benches of different height in classrooms –
Bench Availability
Number of Schools
Yes No
19 1 % 95% 5%
There are benches available in schools but not of different height in classrooms
(c) Ramp’s Condition
Comments: The ramp has been constructed under SSA scheme and not under RMSA scheme. All the schools had
ramp facility.
Number of Schools with ramps
Adequate Slope
Yes No
20 0
% 100% 0%
Hand rails available 20 0
% 100% 100%

63
10. Drinking Water Facility
(a) Source of drinking water
Source Number of Schools %
Supply water Panchayat / Corporation Water 20 schools
100%
Tube well 0 0%
Dug Well 0 0%
Hand Pump 0 0%
Other
No source 0 0%
Availability of sufficient water across all the seasons
No. of Schools Water Available
Yes No 20 0
% 100% 0%
Comments:
(b) Water Storage Facility & its condition & cleaning schedule
Type of Facility
No. of
Schools
Condition Cleaning Schedule
No. of Schools
%
Good &
Usable
Damaged not usable
Weekly
Open Tank 0 0 0 Fortnightly 0 0
% Monthly
Covered tank 0 0 0 Six Monthly 19
% 75% 75% 0% Not Definite
ground tank 1 0 0 1 5% % 0% 0% 0%
Overhead tank 19 19 0 19 % 95% 15% 95% 95%
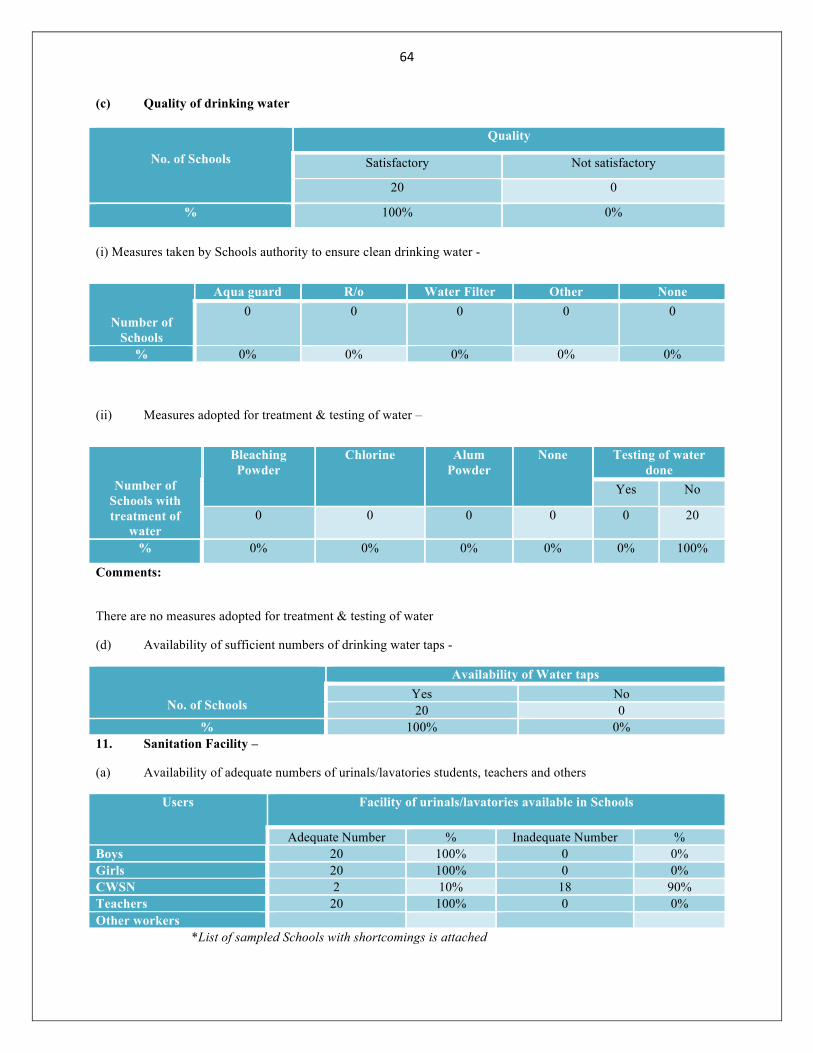
64
(c) Quality of drinking water
No. of Schools
Quality
Satisfactory Not satisfactory
20 0
% 100% 0%
(i) Measures taken by Schools authority to ensure clean drinking water -
Number of Schools
Aqua guard R/o Water Filter Other None 0 0 0 0 0
% 0% 0% 0% 0% 0%
(ii) Measures adopted for treatment & testing of water –
Number of Schools with treatment of
water
Bleaching Powder
Chlorine Alum Powder
None Testing of water done
Yes No
0 0 0 0 0 20
% 0% 0% 0% 0% 0% 100%
Comments:
There are no measures adopted for treatment & testing of water
(d) Availability of sufficient numbers of drinking water taps -
No. of Schools
Availability of Water taps Yes No 20 0
% 100% 0% 11. Sanitation Facility –
(a) Availability of adequate numbers of urinals/lavatories students, teachers and others
Users Facility of urinals/lavatories available in Schools
Adequate Number % Inadequate Number % Boys 20 100% 0 0% Girls 20 100% 0 0% CWSN 2 10% 18 90% Teachers 20 100% 0 0% Other workers *List of sampled Schools with shortcomings is attached

65
(b) Maintenance/Cleanliness of toilets and supply of water
No. of Schools
Maintenance Cleanliness Supply of running water
Yes No Yes No Yes No
18 2 2 18 20 0
% 90% 10% 10% 90% 100% 0%
Comments:
There is proper maintenance of toilets in most of the schools. But having only upper primary level

66
(c) Availability of Separate Toilets for Girls –
No. of Schools
Separate toilet availability Yes No 20 0
% 100% 0% Safer location of Girls’ toilets
No. of Schools
Yes No 20 0
% 100% 0%
Availability of Napkins & Dustbins
No. of Schools
Sanitary Napkins Dustbins Yes No Yes No
0 20 0 20 % 0% 100% 0% 100%
Comments: Napkins & Dustbins are not available in any of the schools in Thanjavur district, but having only at
upper primary level and there is no these facility for high school level due to no separate building for high school
(d) Provision in toilets for physically challenged students -
No. of Schools
Availability of Provision Yes No
2 18 % 10% 90%
(e) Lavatories’ single pits/double pits attached with septic tank and cleaning of septic tank
No. of Schools
Connectivity of lavatories with Single Pit/Double Pit Lavatories with Septic Tank
Regular cleaning of septic tank
Yes No Yes No 2 18 2 18
% 10% 90% 10% 90% Comments:
There is no any vacancy for scavenger at high school level but they have vacancy at school level not filled by
government

67
12. Drainage System
(a-c) Availability of drainage facility
No. of Schools
Drainage System available Yes No
0 20
% 100% 0% Type of Drains
Under ground Pucca Covered
Pucca & Open
Kutcha & Open
No. of Schools
0 0 0 0 20
% 100% 0% 0% 0% 0% Structural Condition
Good Bad Damaged Regular Cleaning of drains done in Schools
No. of Schools
0 20 0 0
% 0% 100% 0% 0% Any instance of Water Logging
No. of Schools
Yes No 0 20
% 0% 100% No. of Schools
If, yes, location of Water Logging Wrecked Drains
Entrance Gate
Open Space
Playground Near Toilets
Outside Classrooms/Lab/Lib/Kitchen
0 0 0 0 0 0 0 % 0% 0% 0% 0% 0% 0% 0%
Comments: There is no instance of water logging in any of the schools.

68
13. (a-c) Waste Water treatment/discharge/disposal of solid waste
No. of Schools
Waste Water Treatment & Discharge Arrangement Yes No
0 20 % 0% 100%
No. of Schools
If yes, Type of drainage system Septic Tank Municipal
drain Open field Any other
0 0 0 0 20 % 0% 0% 0% 0% 100%
No. of Schools
Availability of waste Collection facility Yes No
0 20 % 0% 100%
No. of Schools
If yes, Adequate No. of dustbins Yes No
0 20 % 0% 100%
No. of Schools
If yes, Condition of dustbins Usable Not usable
0 20 % 0% 0%
No. of Schools
Availability of facility for treatment of waste Yes No
0 20 % 0% 100%
No. of Schools
Facility for composting of organic waste Yes No
0 20 % 0% 100%
Comments:
There is no waste water treatment/discharge /disposal of solid waste management in any of the schools.

69
14. (A-b) Water & Energy Conservation
Number of Schools
Availability of Water Conservation Measures No Yes 20
0 % 0%
Number of
Schools
Availability of Rain water harvesting system Yes No
0 20 % 0% 100%
Number of
Schools
Condition of Rainwater harvesting system Working Not Working
0 20 % 0% 100%
Number of
Schools
Stored water consumable Yes No 20 0
% 100% 0%
Number of Schools
Lighting facility available Yes No 20 0
% 100% 0% Type Ordinary bulb Ordinary tube CFL None
Number of Schools
0 20 0 0
% 0% 100% 0% 0%
Number of Schools
Teacher’s School management’s awareness about use of renewable sources of energy Yes No
0 20
% 0% 100%
Type of source
Gobar gas Plant Solar energy Wind energy
No. of Schools using
0 0 0
% 0% 0% 0% Comments:
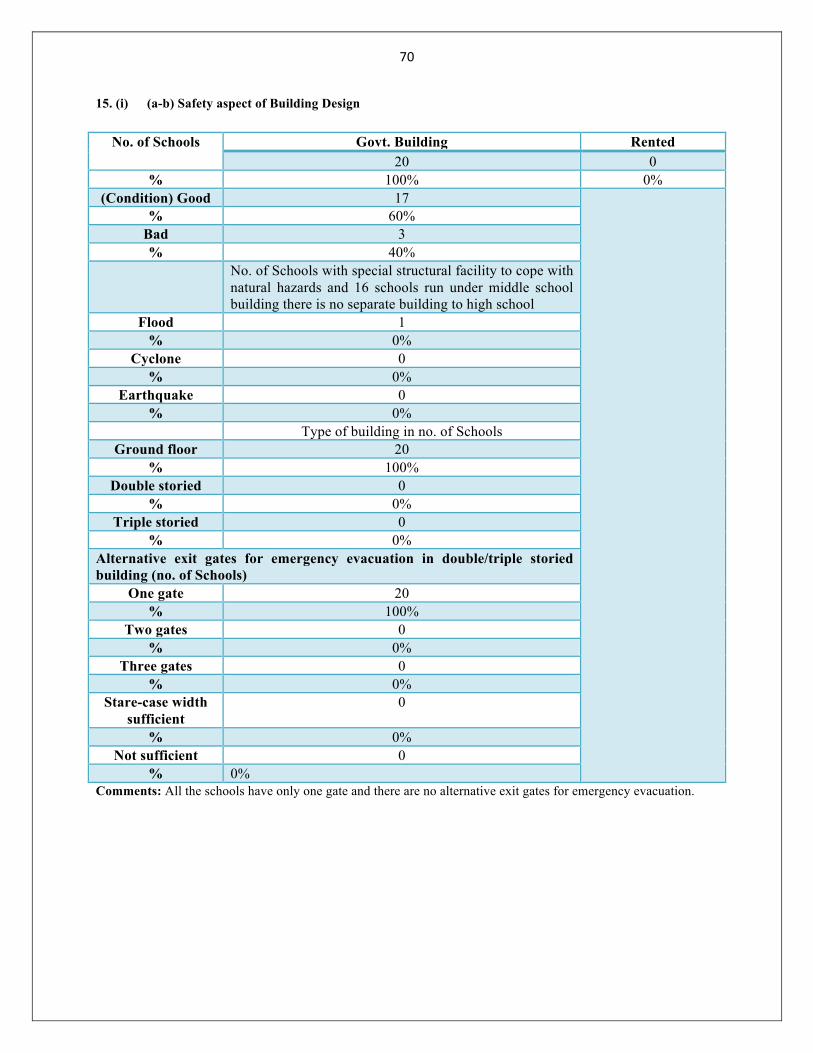
70
15. (i) (a-b) Safety aspect of Building Design
No. of Schools Govt. Building Rented 20 0
% 100% 0% (Condition) Good 17
% 60% Bad 3 % 40%
No. of Schools with special structural facility to cope with natural hazards and 16 schools run under middle school building there is no separate building to high school
Flood 1 % 0%
Cyclone 0 % 0%
Earthquake 0 % 0%
Type of building in no. of Schools Ground floor 20
% 100% Double storied 0
% 0% Triple storied 0
% 0% Alternative exit gates for emergency evacuation in double/triple storied building (no. of Schools)
One gate 20 % 100%
Two gates 0 % 0%
Three gates 0 % 0%
Stare-case width sufficient
0
% 0% Not sufficient 0
% 0% Comments: All the schools have only one gate and there are no alternative exit gates for emergency evacuation.

71
15 (ii) (c-e)
Disaster Preparedness Plan Available Emergency Evacuation Plan No. of
Schools Yes No Yes No
4 16 4 16 % 0% 100% 0% 100%
Awareness about disaster among No. of
Schools Students Teachers
0 0 % 0% 0%
Received training to handle disaster No. of
Schools Students Teachers
0 0 % 0% 0%
No. of Schools
Fire extinguishers available in HM room Kitchen Laboratory
0 0 % 0% 0%
No. of
Schools
In working condition In working condition Yes No Yes No 20 0 0 20
% 100% 0% 0% 100% Trained to handle fire extinguisher
No. of Schools
Teachers Students Yes No Yes No
0 20 0 20 % 0% 100% 0 100%
Availability of Contact Numbers of No. of
Schools Ambulance Fire brigade Nearest hospital
Yes No Yes No Yes No 0 20 0 20 0 20
% 0% 100% 0 100% 0 100% Display of Numbers
0 20 0 20 0 20
% 0% 100% 0 0% 0 100% Comments:
Disaster Preparedness Plan is not available in any of the schools, also there is no Emergency Evacuation Plan, there
is no Awareness about disaster among teachers and students. Teachers have not received training to handle disaster
to teachers, Fire extinguishers are available in HM room only and all are in working condition. In most of the
schools, teachers were not given proper training to handle or operate fire extinguishers.

72
III. Schools with ongoing construction activity
1. (a-d) sufficient measures being taken by School authorities to ensure that it does not hamper academic
activities vitiate air, water, land quality etc. in School.
No. of Schools
Ongoing construction activities Yes No
5 15
% 25% 75% Type New School building Strengthening of
existing School Repair works
No. of Schools
0 5 0 0
% 0% 25% 0 0
Measures being taken by School authorities
a. Measures being taken to ensure
No. of Schools
Academic activities not hampered due to
construction
Construction activity does not vitiate quality of
Noise pollution in permissible limit
Air Water Land Yes No Yes No Yes No Yes No Yes No
0 5 0 5 0 5 0 5 0 4 % 0% 100
% 0% 100
% 0% 100
% 0% 100
% 0% 100%
b. Construction material stored appropriately No. of
Schools Yes No
4 0 % 20% 0%
c. Temporary fencing of construction area done No. of
Schools Yes No
0 4 % 0% 20%

73
2. (a-b) Procurement aspects
No. of School
s
Same contractor whom the work was
awarded is doing work
(a)
Stage of construction work Construction work
being done according to layout Plan
Yes Sublette to
other
Foundation level
Plinth
level/
DPC
Lintel
Roof
level
Flooring/plastering
Finishing level
Yes No
5 0 0 0 0 0 0 5 5 0 % 100
% 0% 0% 0% 0% 0% 0% 100% 100
% 0%

74
2(c-g)
h. Number of visits per School of Technical persons and authentication done or instructions given on construction site –
No. of
Schoo
ls
Community
members
through
SMDC
involved in
procureme
nt process
Sub
Committee
(Constructi
on
Committee
)
Constituted
A/c Books
Civil Work
(Constructi
on)
maintained/
updated
MB for
Civil
Work
Maintaine
d
Payment
made to
contracto
r in
accordan
ce with
MB
Material
stocked
is in line
with
stock
register
Cheque
issue
register
maintain
ed
Quality up to the mark Physical
existence of
constructio
n material
matches
with entry
made in
stock
register
Constructi
on
Material
Constructi
on work
Yes No Ye
s
No Yes No Yes No Yes N
o
Yes N
o
Yes No Yes No Yes No Yes No
5 0 0 5 5 0 5 0 5 0 5 0 5 0 5 0 5 0 5 0
% 100
%
0% 0% 100% 100
%
0% 100
%
0% 100
%
0
%
100
%
0
%
100
%
0
%
100
%
0% 100
%
0
%
100
%
0%
100% 0%

75
Total Number of Schools with ongoing civil work in district –
Construction
level
No. of
Schools
Number
of visits
Average No.
of visit/School
No. of
Authentications
made
Average No. of
Authentication
Instructions
given in No. of
Schools
Recorded Not
recorded
Foundation 0 0 0 0 0 0 0 0
Plinth 0 0 0 0 0 0 0 0
Lintel 0 0 0 0 0 0 0 0
Roof level 4 10 2 0 0 0 0 0
Flooring 0 0 0 0 0 0 0 0
Finishing 4 12 3 0 0 0 0 0
Comments: -
S. No
Name of School Date of Commencement
Administrative Sanctioned
Amount
Expenditure so far
Stage Balance work to be done Remarks
1 GHS, Kollankarai 15.03.2011 50,50,000 5050000.00 Completed Weathering Course & Tiles Electrification Plumbing Works
Toilet Facilities
2 GHS, Panaveli 05.03.2012 50,50,000 5050000.00 First Floor Roof laid Ground
Floor completed
Weathering Course & Tiles Electrification Plumbing Works Plastering and White and Color
washing
8
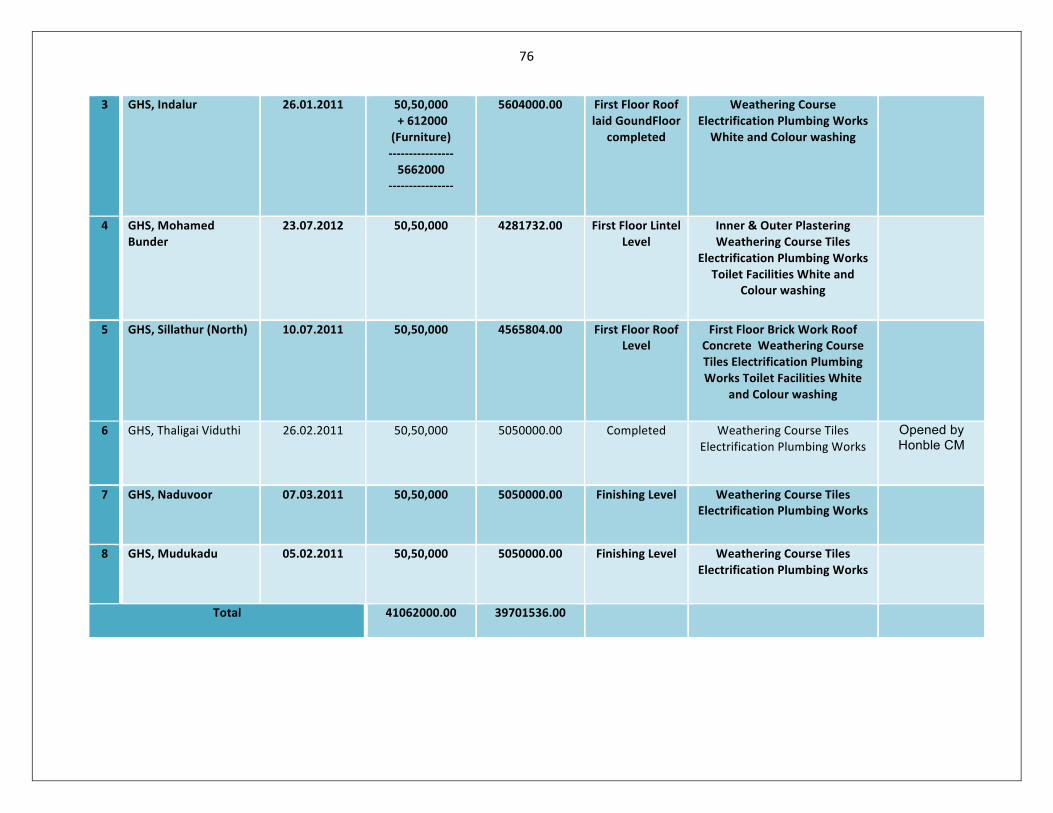
76
3 GHS, Indalur 26.01.2011 50,50,000 + 612000 (Furniture) -‐-‐-‐-‐-‐-‐-‐-‐-‐-‐-‐-‐-‐-‐-‐-‐ 5662000
-‐-‐-‐-‐-‐-‐-‐-‐-‐-‐-‐-‐-‐-‐-‐-‐
5604000.00 First Floor Roof laid GoundFloor
completed
Weathering Course Electrification Plumbing Works White and Colour washing
4 GHS, Mohamed Bunder
23.07.2012 50,50,000 4281732.00 First Floor Lintel Level
Inner & Outer Plastering Weathering Course Tiles
Electrification Plumbing Works Toilet Facilities White and
Colour washing
5 GHS, Sillathur (North) 10.07.2011 50,50,000 4565804.00 First Floor Roof Level
First Floor Brick Work Roof Concrete Weathering Course Tiles Electrification Plumbing Works Toilet Facilities White
and Colour washing
6 GHS, Thaligai Viduthi 26.02.2011 50,50,000 5050000.00 Completed Weathering Course Tiles Electrification Plumbing Works
Opened by Honble CM
7 GHS, Naduvoor 07.03.2011 50,50,000 5050000.00 Finishing Level Weathering Course Tiles Electrification Plumbing Works
8 GHS, Mudukadu 05.02.2011 50,50,000 5050000.00 Finishing Level Weathering Course Tiles Electrification Plumbing Works
Total 41062000.00 39701536.00

(i) System of fund flow from District to the accounts of SMDC
Mode of transfer Cheque Draft E-transfer
Dates of receipt of fund
No. of Schools 0 0 4 2011 onwards % 0% 0% 100% 0%
Comments: (j) Any good practices in civil works which can be replicated in other places/in other States.
No good practices in civil works observed during the monitoring team visit and all works stop right now because
fund.
S. No
Name of School
Date of Commenceme
nt
Administrative Sanctioned
Amount
Expenditure sofar
Stage Balance work to be
done
Remarks
4 GHS,
Mohame
d Bunder
23.07.2012 50,50,000 4281732.00 First
Floor
Lintel
Level
Inner &
Outer
Plastering
Weathering
Course Tiles
Electrificatio
n Plumbing
Works Toilet
Facilities
White and
Colour
washing
3 GHS, Indalur
26.01.2011 50,50,000 + 612000 (Furniture)
---------------- 5662000
----------------
5604000.00 First Floor
Roof laid Ground Floor
completed
Weathering Course
Electrification Plumbing
Works White and Colour
washing
______________________________________________________________________________
Comments: Good in civil works observed during the monitoring team visit and all works stopped right now because not
sufficient fund

78
7. Community Mobilization / Participation -
Total number of SMDC members in sampled Schools of the District
1. (a-c) Familiarity of SMDC members with their roles as notified by the State Government –
No. of
Schools
Level
Familiarity with their roles
% SEMIS
DCF
% School Report Car
d
% SDMC Register
% Guidelines of School Development Plan
% No. of Schools
Training
received by
SMDC Membe
rs
Printed copy of guidelin
es of SMDC made
available to
members
Better
Yes
No Yes
No
Good
Average
20 100%
20 100%
20 100%
20 100%
20 100%
% 20
0 20
0
Not familiar
0 0 0 0 0 0 0 0 0 0
Comments: school report card prepared by SSA both SSA and RMSA but RMSA data entirely wrong, RMSA gave
training to SMDC but not effectively
2. (I) Frequency of SMDC meetings held, issues discussed thereof and average attendance of the SMDC members-
No. of Schools
Meetings held Average Attendance of
SMDC members Monthly Quarterly Six
monthly Annually Whenever
needed Never 100%
0 20 0 0 0 0 % 0% 100% 0% 0% 0% 0%
Issues discussed –
1. Civil work 2. Perspective plan 3. Mainly grants Comments: 2(ii) Description of SMDC members –
Members Number Average no of members per School
Average Attendance in recent meeting
Total members 100 5 100% Women members 10 0.10 100% SC/ST members 7 0.07 0% Selected members 0 0 0%
5 members

79
Nominated members 0 0 0% Comments:
1. (I) Roles of SMDC members in monitoring attendance of teachers and students –
No of Schools
Monitoring Attendance of Monitoring Academic Progress of Students Teachers Students
Yes No Yes No Yes No 0 20 0 20 0 20
% 0% 100% 0 100% 0 100%
3(ii) Level of participation of SMDC members in helping School authorities to conduct following activities
No.
of S
choo
ls
Leve
l of P
artic
ipat
ion
RM
SA &
MD
M I
mpl
emen
tatio
n
%
Con
stru
ctio
n w
ork
unde
r RM
SA
%
SAG
Util
izat
ion
%
Free
Tex
t Boo
ks d
istri
butio
n
%
Scho
lars
hips
dis
tribu
tion
%
Prep
arin
g A
WP
& B
%
Stud
ents
Enr
ollm
ent,
Atte
ndan
ce
%
Reg
ular
ity o
f tea
cher
s
%
Run
ning
of d
ay to
day
act
iviti
es o
rgan
isin
g Sc
hool
&
cultu
ral e
vent
s
%
Hel
p in
pro
vidi
ng S
choo
l fac
ilitie
s
%
Filli
ng o
f DC
F
%
Good 20 0 4 0 20 0 20 0 20 0 20 0 20 0 20 0 20 0 20 0 0 0
Average 0 0 0 0 0 0 0 0 0 0 0 0 0 0 0 0 0 0 0 0 20 100%
Bad 0 0 0 0 0 0 0 0 0 0 0 0 0 0 0 0 0 0 0 0 0 0%
Comments:
4. Participation of SMDC members in preparation of AWP&B –
No. of Schools
Preparation of AWP & B Yes No
0 20 % 0% 100%

80
5. Training received by SMDC members and duration thereof –
No. of Schools
SMDC members received training
Total No. of SDMC
members
No. of members who received
training
Average of training duration
in days
Yes No 30 30 20 0 2 day
% 100% 0% 100 100% 100% Comments:
6. Schedule of trainings, received by SMDC members, name agency who conducted the trainings, and perception of SMDC members about trainings.
Month and year of
training held
Trainings conducted by
Responses about perception of SMDC members regarding trainings Topic, Content, Methodology
projection 1. DIET
No. of Schools
Good & Useful
Average Not Good 2014 2. School
HM 3.
4. 20 100% 5.
Comments:
8. MIS (Management Information System) at SPO, DPO and School level
1. Preparation of Master List of all Schools including private in District/State
Name of District visited
Thanjavur …………..
Master List of government and Pvt. Schools Prepared If master list not prepared reasons
thereof
Yes No 1. 100% 0% 2.
Name of State Tamil Nadu
3.
Total No. of govt. Schools
No. of govt. Schools of
which list is prepared
% Total No. of pvt.
Schools
No. of pvt. Schools of
which list is prepared
% 4.
District 5. State
Comments:

81
2. Distribution of DCF for the current year to all Schools in the District
No. of School DCF distributed to all DPOs from SPO Yes No
% 20 0
No. of School DCF distributed all Schools from DPO Yes NO
% 20 0 Comments: DCF distributed all Schools from DPO but not current year 3. Training received by teachers / head Master / Principal for filling up of DCF in sampled Schools and district
At district level At School level
Total No. of govt. & Pvt. Schools in district
400
No. of sampled Schools
Training received by teachers of sampled Schools
No. of teachers who received DCF training
400 yes no
Average No. of teachers who received DCF training
20 0
20 100% 0%
The training received was on how to fill up the DCF forms. Yes 400
Reasons for not receiving training
5. Availability of Copy of filled up DCF with School for record and reference
(At School level) No. of Schools
Copy of filled up DCF available Reasons of Non-availability of o/c of DCF
Yes No 1. 20 0 2.
% 100% 0% 3.

82
6-7 School report card and sample checks
Data entry done School report card generated
Sample checking being done
Yes No Yes No Yes No 0 20 20 0 0 20
School report card distributed to no. of Schools Finding of sample check
0% 0% 0%
Data entry done School report cards
Sample checking School report cards distributors all School
Yes No Yes No Yes No Yes No Name of district
20 0 20 0 0 20 20 0
Name of State
Overall finding of sampled checking yes 8. Has the data been submitted to State level as per time schedule?
1. Yes 2. No
9. At which level the data is being analyzed and disseminated?
At the district level, in RMSA office the data is being analyzed and disseminated but not in school.
10. Awareness of School authorities regarding importance of data collected under MIS and if so, are they using it
Awareness about data’s information Use of data being made
No. of Schools Yes No Yes No 20 0 20 0
% 100% 0% 100% 0%
11. Is SEMIS/ UDISE data used for Planning and budgeting?
1. Yes 2. No
12. Is the back up of the data supplied under SEMIS/UDISE properly maintained?
1. Yes 2. No
1
2
1
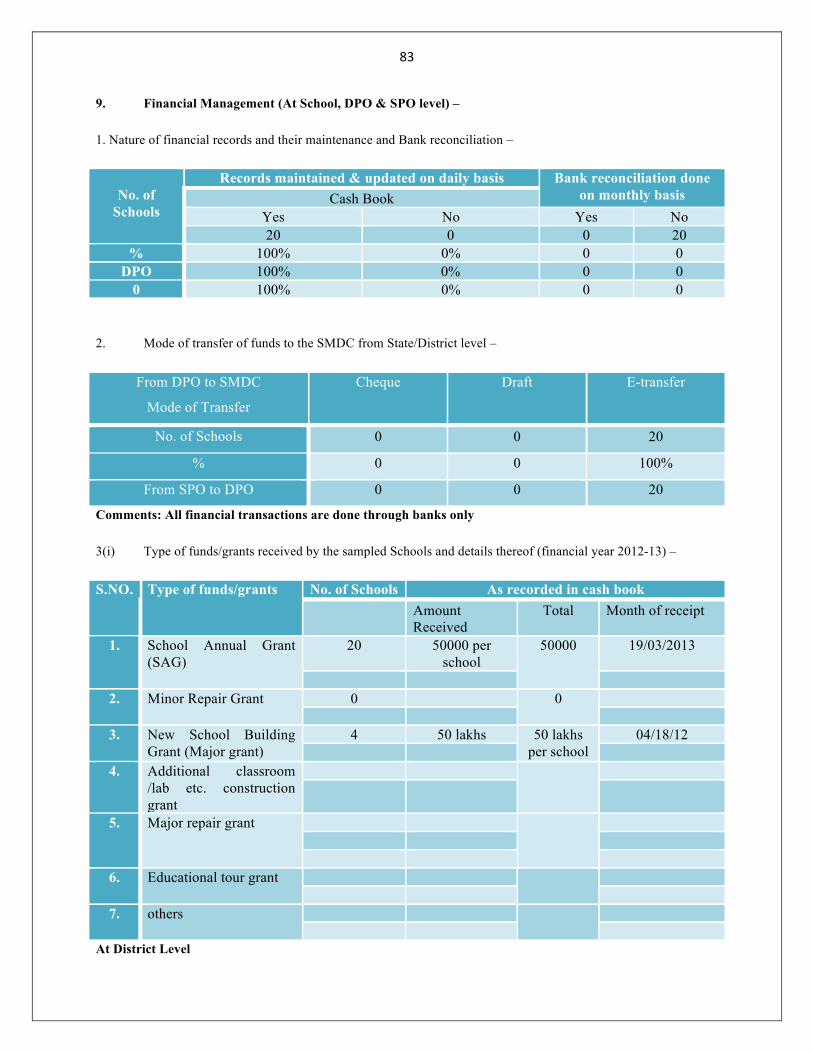
83
9. Financial Management (At School, DPO & SPO level) –
1. Nature of financial records and their maintenance and Bank reconciliation –
No. of
Schools
Records maintained & updated on daily basis Bank reconciliation done on monthly basis Cash Book
Yes No Yes No 20 0 0 20
% 100% 0% 0 0 DPO 100% 0% 0 0
0 100% 0% 0 0
2. Mode of transfer of funds to the SMDC from State/District level –
From DPO to SMDC
Mode of Transfer
Cheque Draft E-transfer
No. of Schools 0 0 20
% 0 0 100%
From SPO to DPO 0 0 20
Comments: All financial transactions are done through banks only
3(i) Type of funds/grants received by the sampled Schools and details thereof (financial year 2012-13) –
S.NO. Type of funds/grants No. of Schools As recorded in cash book Amount
Received Total Month of receipt
1. School Annual Grant (SAG)
20 50000 per school
50000 19/03/2013
2. Minor Repair Grant 0 0
3. New School Building
Grant (Major grant) 4 50 lakhs 50 lakhs
per school 04/18/12
4. Additional classroom
/lab etc. construction grant
5. Major repair grant
6. Educational tour grant
7. others
At District Level
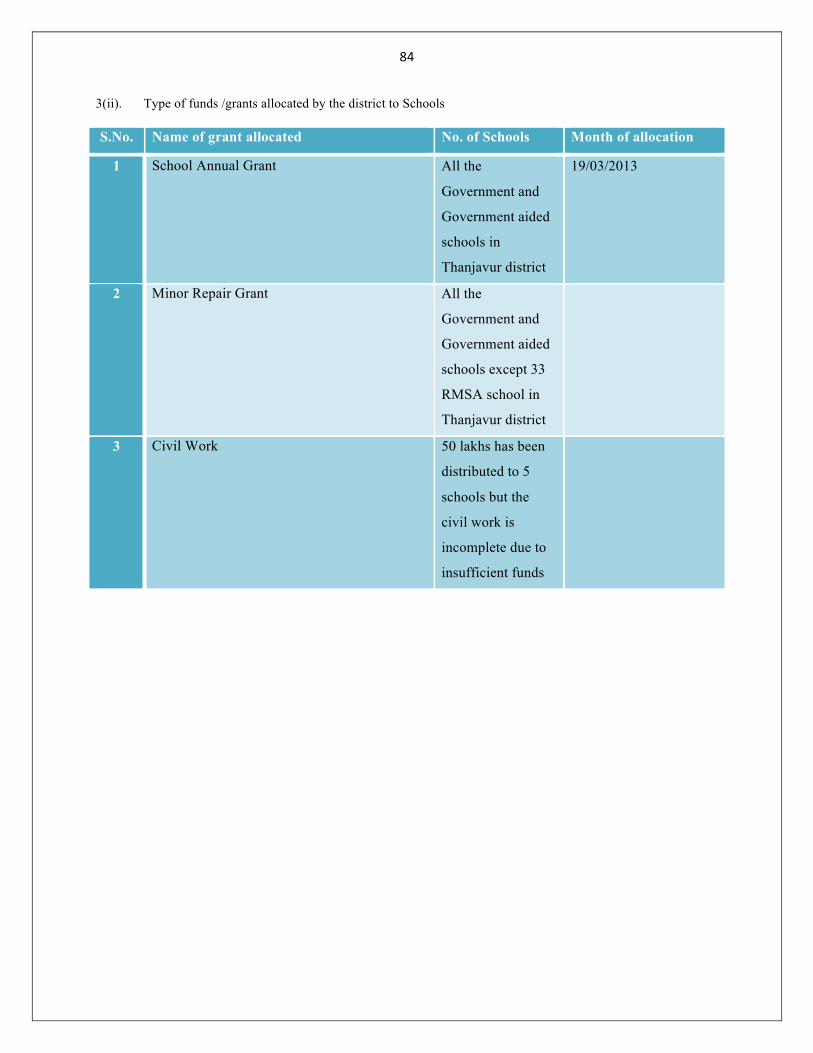
84
3(ii). Type of funds /grants allocated by the district to Schools
S.No. Name of grant allocated No. of Schools Month of allocation
1 School Annual Grant All the
Government and
Government aided
schools in
Thanjavur district
19/03/2013
2 Minor Repair Grant All the
Government and
Government aided
schools except 33
RMSA school in
Thanjavur district
3 Civil Work 50 lakhs has been
distributed to 5
schools but the
civil work is
incomplete due to
insufficient funds

85
At State Level
3(iii). Type of funds /grants allocated by the State to district
S.No. Name of grant allocated No. of districts Month of allocation 1 School Annual Grant No info No info 2 Minor Repair Grant No info No info 3 Civil Work No info No info 4 5 6 7 8 9
10 4. System for drawl and payment of fund from SMDC account –
No. of Schools Cash Cheque Both 0 20 0
% 0% 100% 0% Comments:
5. Sharing of proposal for expenditure and expenditure Statements with community
No. of Schools
Sharing of If yes, details of objections Proposal for
expenditure Expenditure Statements
Any objection raised by community about any
transaction Yes No Yes No Yes No 1.
0 20 0 20 0 20 2. % 0% 100% 0% 100% 0% 100% 3.
4. Comments :
6. Audit of SDMCs
All SDMCs in State/District are covered by audit 1. Yes 2.No
No. of Schools
Audit carried out YES NO 20 0
% 100% 0% D.P.O.
No. of Schools
If yes, Audit carried out by Education Deptt. A.G. C.A. Social Audit None
- - - 20 - % - - - 100%
Comments:
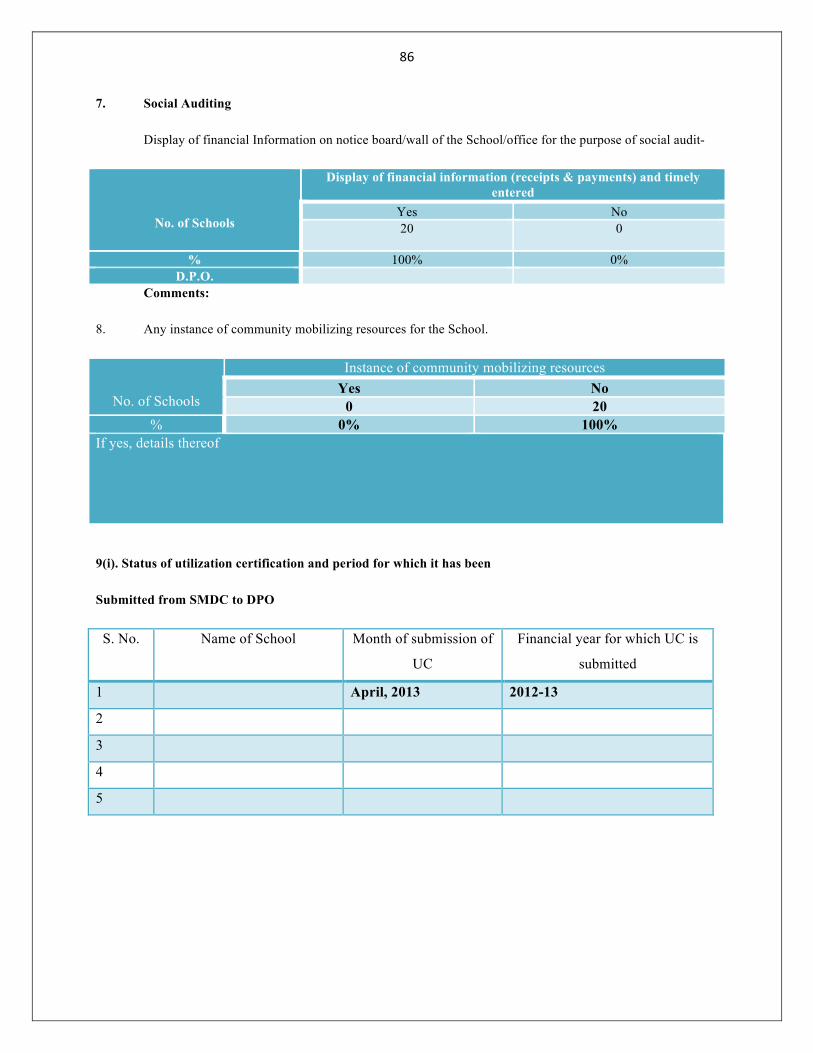
86
7. Social Auditing
Display of financial Information on notice board/wall of the School/office for the purpose of social audit-
No. of Schools
Display of financial information (receipts & payments) and timely entered
Yes No 20 0
% 100% 0% D.P.O.
Comments:
8. Any instance of community mobilizing resources for the School.
No. of Schools
Instance of community mobilizing resources Yes No
0 20 % 0% 100%
If yes, details thereof
9(i). Status of utilization certification and period for which it has been
Submitted from SMDC to DPO
S. No. Name of School Month of submission of
UC
Financial year for which UC is
submitted
1 April, 2013 2012-13
2
3
4
5

87
9(ii). Status of utilization certificates submitted by SMDCs to DPO (At District Level)
Total No. of Schools
No. of SMDCs from which U.C. is
received
% Period for which U.C. submitted
No. of Schools
400 400 2011-12 400
2012-13 400
Comments: At the district level 400 schools have submitted the utilization certificate in the 2011-12 and also in
the academic year 2012-13.
9(iii) Status of utilization certificates submitted to SPO from DPOs (from 1st April 2012 to 31st March, 2013) (At
State Level)
No. of sampled
DPOs
Name of Funds /Grants
No. of DPOS to
which fund released
Amount of fund
released
Date of release
Amount for which
U.C. received
Amount for which U.C. has not been received
School Annual Grant
Minor repair
work
Major repair
work
Civil work Education Tour Comments: Data not furnished by the State
10. Process of settlement of advance and collection of utilization certificate by SPO and DPO.
(i) Process of settlement of advance and collection of utilization certificate.
--------------------------------------------------------------------------------------------------
--------------------------------------------------------------------------------------------------
(ii) Communication to SMDCs after the settlement of advance has been done by DPO.
1. Yes 2. No
Mode of conveying SMDCs about settlement of advance
11. Financial Statement for SDMC/DPO/SPO (From 1 April 12 to ………….. (date /month of visit).
(i)
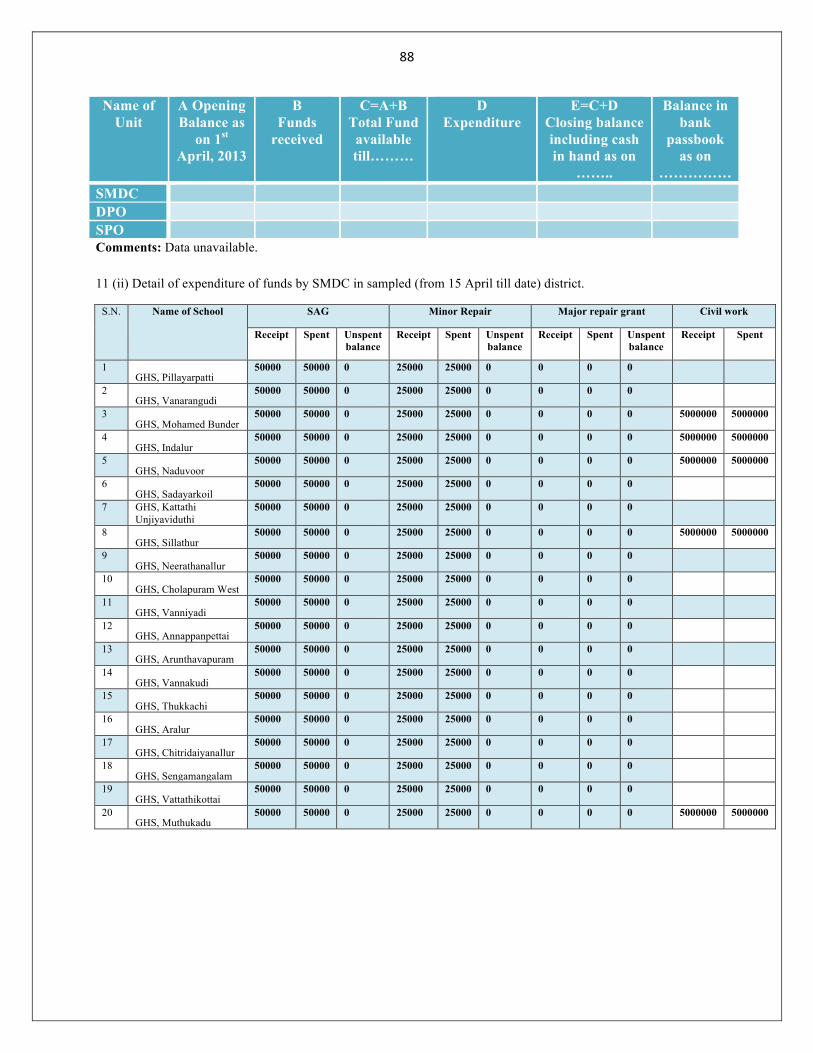
88
Name of Unit
A Opening Balance as
on 1st April, 2013
B Funds
received
C=A+B Total Fund available till………
D Expenditure
E=C+D Closing balance including cash in hand as on
……..
Balance in bank
passbook as on
…………… SMDC DPO SPO Comments: Data unavailable.
11 (ii) Detail of expenditure of funds by SMDC in sampled (from 15 April till date) district.
S.N. Name of School SAG Minor Repair Major repair grant Civil work
Receipt Spent Unspent balance
Receipt Spent Unspent balance
Receipt Spent Unspent balance
Receipt Spent
1 GHS, Pillayarpatti
50000 50000 0 25000 25000 0 0 0 0
2 GHS, Vanarangudi
50000 50000 0 25000 25000 0 0 0 0
3 GHS, Mohamed Bunder
50000 50000 0 25000 25000 0 0 0 0 5000000 5000000
4 GHS, Indalur
50000 50000 0 25000 25000 0 0 0 0 5000000 5000000
5 GHS, Naduvoor
50000 50000 0 25000 25000 0 0 0 0 5000000 5000000
6 GHS, Sadayarkoil
50000 50000 0 25000 25000 0 0 0 0
7 GHS, Kattathi Unjiyaviduthi
50000 50000 0 25000 25000 0 0 0 0
8 GHS, Sillathur
50000 50000 0 25000 25000 0 0 0 0 5000000 5000000
9 GHS, Neerathanallur
50000 50000 0 25000 25000 0 0 0 0
10 GHS, Cholapuram West
50000 50000 0 25000 25000 0 0 0 0
11 GHS, Vanniyadi
50000 50000 0 25000 25000 0 0 0 0
12 GHS, Annappanpettai
50000 50000 0 25000 25000 0 0 0 0
13 GHS, Arunthavapuram
50000 50000 0 25000 25000 0 0 0 0
14 GHS, Vannakudi
50000 50000 0 25000 25000 0 0 0 0
15 GHS, Thukkachi
50000 50000 0 25000 25000 0 0 0 0 16
GHS, Aralur 50000 50000 0 25000 25000 0 0 0 0
17
GHS, Chitridaiyanallur 50000 50000 0 25000 25000 0 0 0 0
18
GHS, Sengamangalam 50000 50000 0 25000 25000 0 0 0 0
19
GHS, Vattathikottai 50000 50000 0 25000 25000 0 0 0 0
20
GHS, Muthukadu 50000 50000 0 25000 25000 0 0 0 0 5000000 5000000

89
10. SCHOOL ANNUAL GRANT –
1 (i) Month of receiving School Annual Grant for the financial year 2012-13 in sampled Schools and status of utilization of funds.
S.N. Month of receipt of SAG Number of Schools % 1 March, 2013 20 100 2 3 4 5 Total 2 (i) status of utilization of funds with % and expenditure done as per norms of the scheme- S.N. Name of School Sanctioned
amount Month of
receipt Expenditure till
date % of
expenditure 1 50000 19/03/21013 50000 100% 2 3 4 5 2(ii) Status of Utilization of School Annual Grant
Details/No. of Schools
Which were not sanctioned
SAGs
Which were sanctioned but did
not receive SAGs
Which received but did not
spend
2(iii) Utilization of SAG as per norms
SAG funds utilized on works
Number of Schools
%
Funds utilized as per norms in number of Schools
If not utilized as per norms, give reasons
Yes % No % 1. 20 100 20 100 0 1. Comments: data available
11. Minor Repair Grant
1. Receipt of Minor Repair Grant – (For Financial Year 2012-13)
S.N. Name of School Sanctioned amount
Month of receipt
Expenditure till date
% of expenditure
1 2 3 4 Total

90
2(i) Utilization of minor repair grant on repair and white-wash of the School building –
Number of Schools Number % Total No. of Schools who received minor repair grant No 0 Number of Schools utilized the grant on repair and white wash
No 0
Number of Schools who did not utilized fund as per norms No 0 Comments: No data available
2 (ii) Utilization of minor repair grants as per norms
Minor Repair Grant utilized on works
Number of Schools
%
Funds utilized as per norms If not utilized as per norms, give reasons Yes % No %
1. 1. 2. 2. 3. 3. 4. 4. 5. 5. 6. 6. 7. 7. 8. 8. 9. 9. 10. 10 Comments: No split up available

91
12 INNOVATIONS – At SPO/DPO level
In Thanjavur district, promotion of sports activities is widely seen. The high school students are encouraged to participate in games, competitions and sports. The winners are recognized at the district level and they are given special prizes. Every year in SSLC examination, top 10 SC students are identified at the district level in Thanjavur and they are honored with special cash prizes.
1. Details of innovative proposals undertaken during the current financial year (At district level)
S. No.
Name of Innovative Proposals Amount of funds sanctioned/released
Stage of Implementation
Comments :
At the district level there are no innovative proposals submitted during the financial year April 2012 to March 2013.
The state project office has recently issued a proposal to all the district level project offices to undertake innovative
projects to monitor and evaluate the effectiveness of scheme. The district CEO assured that innovative proposals
will be undertaken during the next academic year.
2. Details of innovative proposals undertaken during the financial year 1st April, 2012 to 31st March, 2013 (At State level)
3 (a) If not, the mentions reasons thereof
--------------------------------------------------------------------------------------------------
(b) Effective monitoring and evaluation mechanism for implementation of innovation proposals.
--------------------------------------------------------------------------------------------------
--------------------------------------------------------------------------------------------------

92
(c) The objectives of innovation proposals being met in districts
(a) At district level
--------------------------------------------------------------------------------------------------
--------------------------------------------------------------------------------------------------
(b) At State Level
--------------------------------------------------------------------------------------------------
--------------------------------------------------------------------------------------------------
(d) Identified any successful elements in innovation proposals, to be scaled up under RMSA
--------------------------------------------------------------------------------------------------
--------------------------------------------------------------------------------------------------
13. INFORMATION ABOUT MMER At DPO and SPO level
1(i). The total number of staff sanctioned category wise in DPO under RMSA and the number in position. Thanjavur District
Name of District________________________________ S. N. Name of Post Sanctioned In position % Vacant %
1 CEO, District Programme Coordinator
1 1 100% 0 0%
2 Assistant District Programme Coordinator (ADPC)
1 1 100% 0 0%
3 Educational District Coordinators (EDCs)
2 2 100% 0 0%
4 Civil Engineers 2 1 50% 1 50% 5 Tally Managers 3 3 100% 0 0% 6 Data Entry Operators 2 2 100% 0 0% 7 Office Assistant (On
special request) 1 1 100% 0 0%
8
9 10
Total 12 12 100% 0 0% 1(ii) the total number of staff sanctioned category wise in SPO under RMSA and the number in position.

93
S. N. Name of Post Sanctioned In position % Vacant % 1 Project Director 1 1 100% 0 0% 2 JD (Administration) 1 1 100% 0 0%
3 JD (Training) 1 1 100% 0 0% 4 JD (Civil) 1 1 100% 0 0% 5 JD (District level
Coordination 1 1 100% 0 0%
6 Chief Accounts Officer
1 1 100% 0 0%
7 PG Teachers 3 3 100% 0 0% 8 BT level coordinators 2 2 100% 0 0%
9 Superintendents 1 1 100% 0 0% 10 Assistants 2 2 100% 0 0% 11 Tally Managers 1 1 100% 0 0% 12 Data Entry Operators 4 4 100% 0 0%
13 Personal Assistants for Director and JD
2 2 100% 0 0%
14 15
Total 21 21 100% 0 0% 1(iii) Action taken to fill up vacancies
There are no vacancies at district level
At district level ……………………………………………………………………………………….
At State level There are no vacancies at state level ………………………………………………………………………….
2 Personnel working on deputation/contract and their nature of engagement
No. of Personnel on deputation No. of Personnel on contract At DPO SPO At DPO SPO
NIL NIL NIL NIL Nature of engagement
At DPO At SPO At DPO At SPO
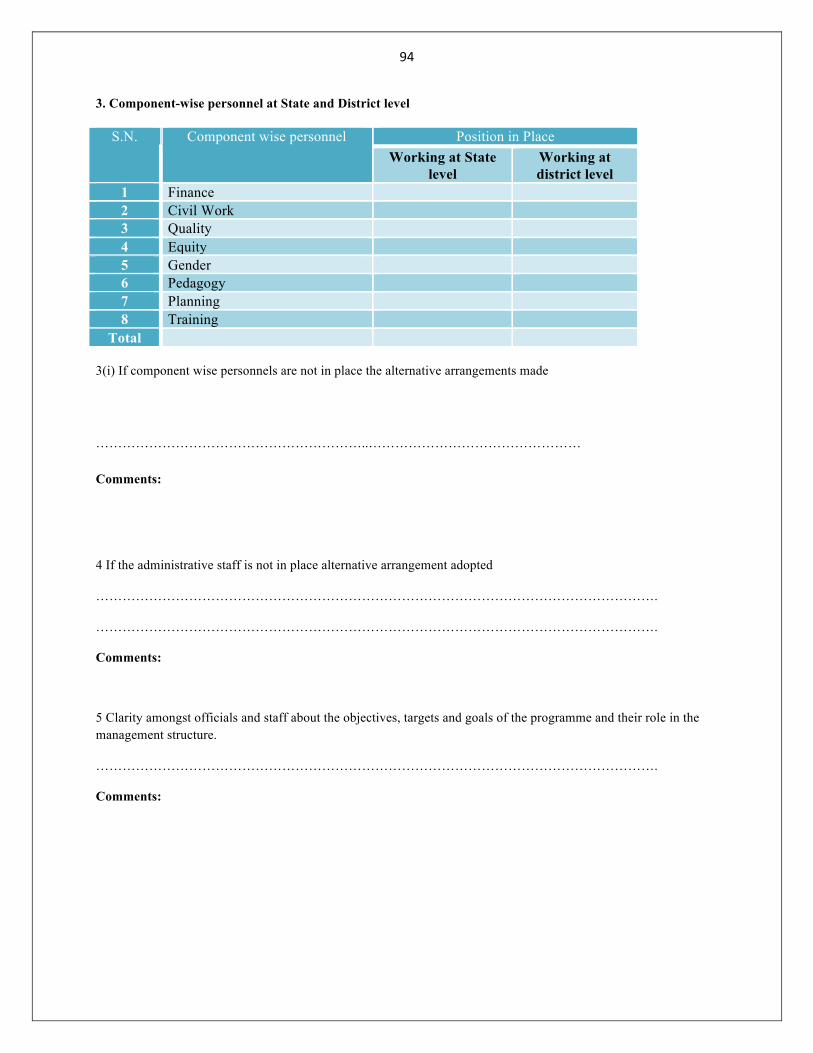
94
3. Component-wise personnel at State and District level
S.N. Component wise personnel Position in Place Working at State
level Working at district level
1 Finance 2 Civil Work 3 Quality 4 Equity 5 Gender 6 Pedagogy 7 Planning 8 Training
Total 3(i) If component wise personnels are not in place the alternative arrangements made
……………………………………………………..…………………………………………
Comments:
4 If the administrative staff is not in place alternative arrangement adopted
……………………………………………………………………………………………………………….
……………………………………………………………………………………………………………….
Comments:
5 Clarity amongst officials and staff about the objectives, targets and goals of the programme and their role in the management structure.
……………………………………………………………………………………………………………….
Comments:

95
II. MONITORING STRATEGY
1. (i) Use of monitoring tools/mechanism (reports, visits etc.) to ensure effective implementation of the scheme
………………………………………………….………………………………………
1(ii) Steps taken by DPO & SPO to ensure effective implementation of RMSA
……………………………………………………………………….………………………………………
……………………………………………………………………….………………………………………
1(iii) Details of visits made by officials of SPO and DPO to district/Schools along with time schedule (from 1st April, 2012 to 31st March, 2013)
At SPO level
S. No.
Post of Officer No. of Visits made
No. of district/ School visited
Time schedule
Average No. of visits per district
1. SPD 2. Additional
Director Project
3 Others
At DPO Level
S. No.
Post of Officer No. of Visits made
No. of School visited
Time schedule
Average No. of visits pre School
1 DPC 2 ADPC 3 APC 4 Others Total
Comments: No data available
2. Details of guidelines laid down for monitoring.
--------------------------------------------------------------------------------------------------
--------------------------------------------------------------------------------------------------

96
Comments:
III Management Systems –At District and State level.
Information about Academic Institutions (Details of SCERT & IASE/CTEs/DIETs)
1(i) Availability of Physical Infrastructural Facilities
-------------------------------------------------------------------------------------------------- -----------------------------------------
------------------------------------------------------------------------
1(ii) Facilities available in SCERT/SIERT
Staff Sanctioned In position Vacant %
1(iii) Availability of physical Infrastructural Facilities
--------------------------------------------------------------------------------------------------------------------------------------------
------------------------------------------------------------------------------------------------------------------
Comments:
1. Other essential facilities

97
In DIET In IASE/CTEs In SCERT/SIERT
1
2
3
4
5
6
7
8
9
10
1
2
3
4
5
6
7
8
9
10
1
2
3
4
5
6
7
8
9
10
Comments: IV. INFORMATION ABOUT STATE DATABASE At SPO level updated by DPO.
1. (i) School mapping completed or not in respect of the visited district/s
--------------------------------------------------------------------------------------------------
1(ii) If not completed, then the basis used for developing the annual/perspective Plan for access
Planning is based on the school report card, UDISE records, etc.
--------------------------------------------------------------------------------------------------
--------------------------------------------------------------------------------------------------
1(iii) Mechanism other than GIS mapping adopted by the State
--------------------------------------------------------------------------------------------------
Comments:
2. The database mechanism (MIS) at district level is in place or not
-------------------------------------------------------------------------------------- Yes/ No
2(i) If not, then name of other sources used for the Plan preparation at district level
--------------------------------------------------------------------------------------------------
--------------------------------------------------------------------------------------------------
Comments:
98
3. Major issues in collection and compilation of data at district and State level
S. N. District level issues State level issues 1 2 3 4 5 6 7 8
Comments: No major issues V RESEARCH (At district and State level)
There is no detailed information available regarding research at district and state level.
1. Details of research projects undertaken during the year (1st April, 2012 to 31st March, 2013) –
At District Level
S.No. Title of research project Purpose Major findings 1 There is no research and evaluation
carried out at the district level at present.
2
3
4
5
At State Level
S.No. Title of research project Purpose Major findings
1 At state level, MoU has been signed with NUEPA to conduct Annual Plan Action Research on RMSA Implementation in TN. Salem and Theni districts have been taken as pilot district to conduct this

99
research.
2
3
4
5
2. Research Advisory Committee being formed or not
(a) At State level ………………………………………………………………………………………….
(b) At District level ……………………………………………………………………………………….
--------------------------------------------------------------------------------------------------
3. (i) Identification of the kinds of research need was felt and at what level?
--------------------------------------------------------------------------------------------------
--------------------------------------------------------------------------------------------------
4. Action Research is being conducted or not, if yes it is conducted by the teachers or external agencies for finding out solutions to users pertaining to pedagogy and quality –
--------------------------------------------------------------------------------------- Yes/No
--------------------------------------------------------------------------------------------------
4(i) If Yes, Details of action research carried out at district level –
Areas of research
Problem No. of Action Research
conducted in district
Solution Conducted by (Teachers /external agencies)
Pedagogy

100
Quality
4(ii) If Yes, Details of action research carried out at State level –
Areas of research
Problem No. of Action Research
conducted in district
Solution Conducted by (Teachers /external agencies)
Pedagogy
Quality
14. Any other issues relevant to RMSA implementation
MI may give a maximum 2 page note, on any other issues, relevant to RMSA implementation, not covered above.

101
DISTRICT THIRUVARUR

102
INDEX
S. No. Particulars Page no. 1. Planning & Implementation
4. At School level 5. At District level 6. At State level
104-109
2. Access V. Physical Access
VI. Social Access VII. Open Schooling
VIII. OoSC
109-120
3. Equity III. General Information IV. Girls Education
121-128
4. Guidance & Counselling At school level
128-130
5. Quality IV. Enabling conditions V. Teaching learning process
VI. Teachers’ training
130-139
6. Civil works IV. General Information V. Design
VI. Schools with ongoing construction activity
140-158
7. Community Mobilization/Participation At school level
158-162
8. MIS (Management Information System) At School, DPO, SPO level
162-165
9. Financial Management At SMDC, DPO, SPO level
166-175
10. School annual grant (SAG) At SMDC, DPO, SPO level
176-177
11. Minor Repair Grant At SMDC, DPO, SPO level
177-178
12. Innovations At DPO, SPO level
178-182
13. MMER (Management /Monitoring/Evaluation and Research) VI. Staffing pattern
AtDPO, SPO level VII. Monitoring strategy at DPO, SPO level
VIII. Management systems DIET, SCERT, DEO Office
IX. State Database X. Research
182-188
14. Any other issues 188-188

103
MONITORING OF RMSA IMPLEMENTATION IN THIRUVARUR DISTRICT
1. Planning & Implementation –
At School Level
1. Perspective Plan for the School –
No. of Schools
Plan developed Not developed Yes No 20 0
% 100% 0% If not reasons thereof Comments: Perspective plan has been developed in 100% schools in Thiruvarur district. The perspective plan is
being submitted to the district RMSA office every year. There is a standard format used by all the schools
throughout the district to prepare the perspective plan. The school development plan includes demographic profile of
the area, data regarding nearby schools (including private and aided schools), children at school going age, school
mapping information, etc. The achievements of the school are also included in the perspective plan report.
2. Data base/sources adopted/taken for Planning and Plan preparation at School level other than SEMIS
No. of Schools
Other Data base/sourced adopted If yes names of other sources Yes No
0 20 - % 0% 100%
Comments: In most of the schools, SEMIS data is the only source for planning and plan preparation at the school
level, for some information they are using Census data. The Village Education Records (VER), School Mapping
information are also being used in the perspective plan report.
3. Whether disadvantaged groups have been appropriately factored in the Plan.
No. of Schools
Developed Planning strategy for disadvantaged groups
Yes No
0 20
% 0% 100%
If not reasons thereof
The planning strategy is common to all the students and not specific for disadvantaged groups. In the Perspective plan reports of few schools they have mentioned a statement that there are plans for disadvantaged groups. But there are no specific development plans conceived or mentioned in the plan document.

104
No. of Schools
Convergence approach adopted Yes No 20 0
% 100% 0% Convergence Approach Convergence not adopted
S. No.
Departments No. of Schools
% Reasons thereof
1 Water & Sanitation 20 100% There is no tribal community in Thiruvarur district. There is no direct involvement of Rural and Urban development departments in school development. However, these departments work at the habitation level which indirectly contributes for school development. There is no coordination with PWD for any projects at the school level
2 Social Welfare 20 100% 3 Tribal Development 0 0% 4 Minority Department 0 0% 5 Rural Development 0 0% Urban Development 0 0% 6 Health, Medical and
Family welfare 20 100%
7 Electricity department 20 100% 8 Transport (Roadways) 20 100% 9 Public Works Department 0 0% Problem areas of restructuring on convergence and coordination
Comments: The convergence and coordination with other departments are not made consciously but water and
sanitation department for water needs, social welfare for mid day meal and scholarships, health department for
health check ups, electricity department for EB connections, transport department for free bus pass for students. In
this way, these departments
5. Incorporation of SMDC recommendations in the School Development Plan
No. of Schools
School Development Plan Prepared Recommendations incorporated in School Development Plan
Yes No Yes No
20 0 20 0
% 100% 0% 100% 0%
If not reasons thereof If not reasons thereof
Recommendations given by the SMDC for school development plan.
Comments: There are recommendations documented in minutes of the weekly meeting conducted by SMDC.
8. Roles assigned to the SMDCs for implementing the scheme and to seek help & cooperation in ensuring the execution of following in sampled Schools :

105
S. No Roles Responses regarding assigning roles (No. of Schools)
%
1 Filling of DCF of U-DISE 20 100% 2 Preparation & Implementation of Annual Plan 20 100% 3 Admission of Students to Class-9 0 0% 4 Regular attendance and retention of students 0 0% 5 Regularity & Punctuality in teachers’
attendance 20 100%
6 Civil work 20 100% 7 Providing resources Physical 0 0%
Human 0 0% 8 Organizing cultural, sports events, functions 20 100% 9 Mid-day-meal 20 100%
10 Preparing annual accounts of income & expenditure of SMDC
20 100%
11 Any other 0 0% Comments: In all the 20 schools filling of DCF of U-DISE has been assigned and also preparation and
implementation of Annual Plan. The SMDCs were not assigned any role with respect to Admission of students to
Class – 9, Monitoring regular attendance and retention of students, providing resources, etc. The SMDC is involved
in Civil work in all 20 schools, organizing cultural, sports, events and functions, Mid day meal to some extent and
preparation of annual accounts of income and expenditure.
In case of civil work, the newly upgraded schools are not getting the maintenance grant.
9. Clarity amongst SMDC members about their roles. If yes, detail of steps taken by them accordingly.
No. of Schools
SMDC members are clear about their roles Not clear
20 0 % 100% 0%
S.N. Steps taken by SMDC members accordingly Number of
Schools %
1 Ensuring education facility to dropout Students 11 55% 2 Making society aware of child rights & duties of teachers& parents 0 0% 3 Organizing parents teachers meetings, distribution of report card and
reviewing C.W./H.W. 0 0%
4 Keeping check on private tuitions by teachers, paying attention to academic progress of students
0 0%
5 Identification of CWSN & taking care of availability of facilities to CWSN students
3 15%
6 Paying attention to improvement in regular teaching learning activities. 20 100% 7 Distribution of free text books 20 100% 8 Availability of scholarships on time to students 20 100% 9 Preparing three years’ perspective Plan 20 100%
10 Proper use of funds i.e. SAG & other grants as per norms 0 0%
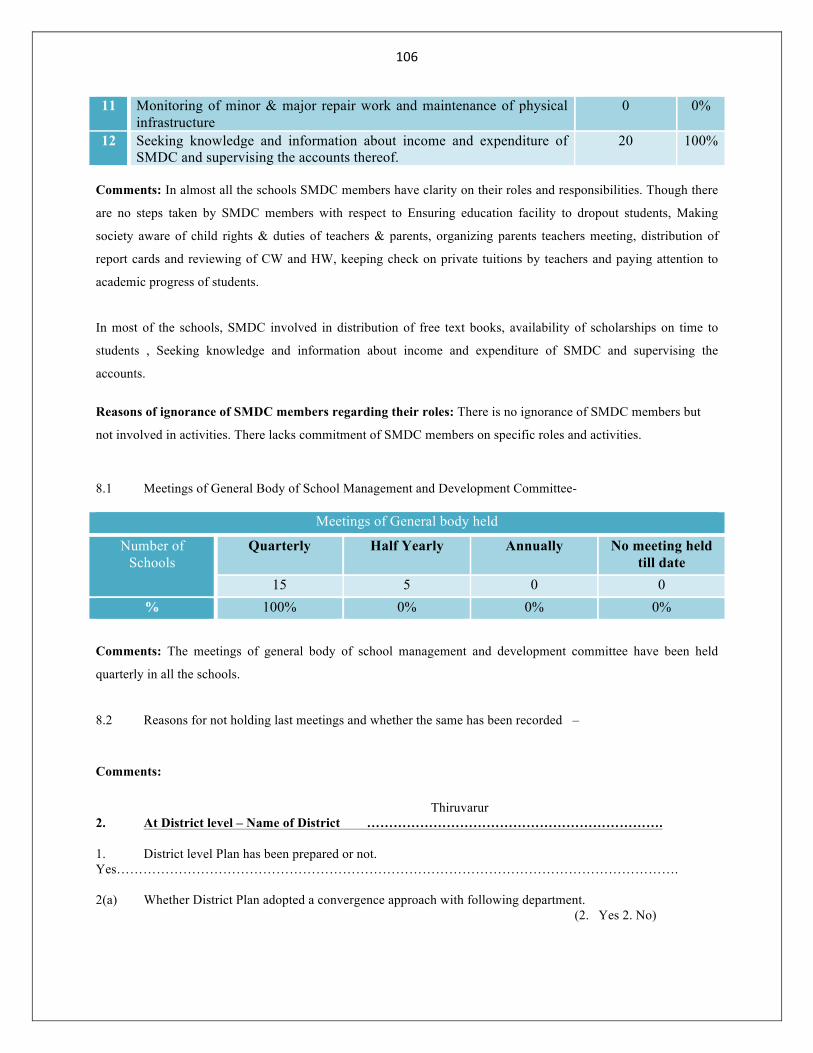
106
11 Monitoring of minor & major repair work and maintenance of physical infrastructure
0 0%
12 Seeking knowledge and information about income and expenditure of SMDC and supervising the accounts thereof.
20 100%
Comments: In almost all the schools SMDC members have clarity on their roles and responsibilities. Though there
are no steps taken by SMDC members with respect to Ensuring education facility to dropout students, Making
society aware of child rights & duties of teachers & parents, organizing parents teachers meeting, distribution of
report cards and reviewing of CW and HW, keeping check on private tuitions by teachers and paying attention to
academic progress of students.
In most of the schools, SMDC involved in distribution of free text books, availability of scholarships on time to
students , Seeking knowledge and information about income and expenditure of SMDC and supervising the
accounts.
Reasons of ignorance of SMDC members regarding their roles: There is no ignorance of SMDC members but
not involved in activities. There lacks commitment of SMDC members on specific roles and activities.
8.1 Meetings of General Body of School Management and Development Committee-
Meetings of General body held
Number of Schools
Quarterly Half Yearly Annually No meeting held till date
15 5 0 0 % 100% 0% 0% 0%
Comments: The meetings of general body of school management and development committee have been held
quarterly in all the schools.
8.2 Reasons for not holding last meetings and whether the same has been recorded –
Comments:
Thiruvarur 2. At District level – Name of District ………………………………………………………….
1. District level Plan has been prepared or not. Yes………………………………………………………………………………………………………………. 2(a) Whether District Plan adopted a convergence approach with following department.
(2. Yes 2. No)

107
k. Water & Sanitation
l. Social Welfare
m. Tribal Development
n. Minority department
o. Rural Development
p. Urban Development
q. Medical Health & Family
r. welfare
s. PWD
t. Transportation (Roadways)
Comments: As per the information provided by the CEO, they have adopted a convergence approach with other
departments such as water and sanitation, social welfare, health department and transportation.
2(b) any problem areas of restructuring on convergence and co-ordination
There are no problems mentioned by the district officials in areas of restructuring on convergence and coordination.
Comments
3. Methods adopted for regular monitoring of Perspective Plan and AWP&B
There is no clear method adopted for regular monitoring of Perspective Plan and AWP &B The school HM holds the responsibility to monitor the perspective plan. The RMSA officials often make Visit to schools to monitor the activities. _____________________________________________________________________________
At State level
1. Involvement of State Level Planning team in the preparation and finalization of District Level Plans1. Yes 2. No
3. Does the State Plan reflect the Planning needs at School and District Level?
Partially it reflects the planning needs.
3. Regular monitoring of Planning & implementation of the programme at State level, if not reasons thereof.
The SPD office conducts monthly review meetings to review the monitoring status of all districts.
ADPCs (Assistant District Programme Coordinators) from all the districts attend this review meeting
at the state office to update the status of monitoring conducted at the district level. The DPCs, ADPCs,
1
2
0
1
2
2
1
1
2
-
2

108
Coordinators at the district level have shared the responsibility of monitoring the RMSA
implementation by visiting the schools in person.
---------------------------------------------------------------------------------------------------------------------
Comments
4. Any separate strategies for naxalite/extremist affected districts prepared at the State/district level in consultation with the district authority?
2 1. Yes 2. No
If not, why? There are no naxalite/extremist affected districts.
2. ACCESS
I. Physical Access – At School and Habitation’s
1. Names Category of the Schools visited
S.N. Categories Number of Schools % 1 EBB 1 5% 2 Urban 2 10% 3 CWSN (Minimum 3 CWSN) 3 15% 4 Higher Gender gap 1 5% 5 SC/ST/Minority students abundance 3 15% 6 Low retention rate/Higher dropout rate 1 5% 7 Schools situated in habitation with large number of OoSC 1 5% 8 Low academic achievements 1 5% 9 Schools situated in habitation of seasonal migrants 0 0%
10 Urban Schools with most students of deprived sections 1 5% 11 Forest/Mountain/Remote/Desert area 2 10% 12 Flood/natural calamity prone area 2 10% 13 Ongoing civil work 2 10% 14 School with girls hostel 1 5% 15 None
Comments: *List of name of Schools is attached
The schools were selected in almost all the categories except few of the above mentioned list. There was only one
Economically Backward Blocks (EBB) denoted in Thiruvarur district. They were two schools from urban area, 3
schools with minimum 3 CWSN (15%), 3 schools with higher proportion of SC/ST/Minority students (15%),
schools situated in with large number of out of school children (15%), 1 school with low academic achievements
(5%), 2 schools from remote area (10%), 2 schools from flood natural calamity prone area (10%), 2 schools with
ongoing civil work (10%). There was one school with girls’ hostel in Thiruvarur district.

109
2. Location of the School adjacent to or within any of the following sensitive areas.
S. N. Area Number of Schools Situated % 1 Protected area (National Park, Wild life sanctuary) 0 0% 2 Flood prone /flood plain area 0 0% 3 Earthquake prone zone 0 0% 4 Unstable slope 0 0% 5 Landslide prone Area 0 0% 6 Cyclone prone Area 0 0% 7 Storm surge prone Area 3 15% 8 Drought prone Area 0 0% 9 Polluting Industrial Area 0 0%
10 Mining Area 0 0% 11 Arsenic /fluoride contaminated ground water area 1 5% 12 Busy National/State Highway 8 40% 13 Congested urban/market/commercial area 0 0% 14 Any particular disturbance faced by School due to its location 0 0% 15 None 0 0%

110
Comments: There are 3 schools in storm surge prone area and 1 school in contaminated ground water area and 8
schools in sensitive area on busy national /state highway that may pose threat to the students.
3. Names and categories of the feeder primary and upper primary Schools in sampled district.
School Level No. of Schools managed by Govt. % Private %
PS 0 0% 0 0% UPS 20 100% 0 0% Total 20 100% 0 0%
*List of Schools is attached
Comments: The category of schools selected for monitoring is restricted only to Upper Primary Government
schools as per guidelines. No private schools have been included for monitoring.
4. Number of Students enrolled in School from habitations coming from a distance greater than what is prescribed for a neighborhood School.
S. N. Distance of School from habitation Number of students % 1 0-1 km. 763 35% 2 1-2 km. 426 20% 3 2-3 km. 237 11% 4 3-5 km. 210 10% 5 More than 5 km. 539 25%
Total 2175 100% Comments: 10. In the total survey of 20 schools in Thiruvarur district, most of the children have access to upper primary
schools. There were 763 students (35%) reside within 0-1 km distance, 426 children (20% )from the distance of
1-2 km, 237 children (11%) from 2-3 km distance, 210 students (10%) from 3-5 km distance. 539 students
(25%) come from distance more than 5 km.
11. The students commute to school in public transport and Tamil Nadu government has provided with free bus
pass.
12. The students depend only on public transport and there is no other mode of transport available or affordable for
children.
5. Presence of any natural or man-made barrier that poses any problem for the Students in accessing the School.
No. of Schools
Yes No
6 14 % 30% 70%
If yes mention them
There is state highway near GHS Pazhayavalam There is a national highway at GHS Thiruthuraipoondi

111
There is a big pond in front of the school campus being a threat to children of ADWHS Amoor
Comments: There are very few natural or man-made barriers seen in Thiruvarur district such as National / State
Highways, Railway crossing and River.
6. Name and Distance of the nearest secondary School (Govt. /Pvt.) from the habitation the School is located
at, and catchment area of the School.
Distance from School/Catchment area Total
No. of Schools Less than 1 km. 1-3 km. 3-5 km. More than 5 km.
5 6 7 2 20 % 25% 30% 35% 10% 100%
*List of Schools is attached
Comments: From the sampled schools, 5 schools have the proximity of reaching Higher secondary school at a
distance within 1 km (25%), 6 schools can access secondary school at a distance of 1-3 km (30%) where as 7
schools are situated with the nearest higher secondary school at a distance of 3-5 km. Only two high schools have
their nearest secondary school at a distance more than 5 km
7. Any special arrangement like transportation facility or residential facility made available for the benefit of
students.
Facility Provided by number of Schools %
Transport facility 0 0% Residential facility 0 0%
Comments:
Students are commuting to school in public transport only and they are distributed with free travel bus pass. No other
special arrangement like transportation facility or residential facility made available for students.
II Social Access
1. Pattern of population of the habitation and enrollment in the School –
1. (A) Social category-wise population of Students of age group 14-16 years in the habitation.
Population Pattern of Habitation

112
Category 14-16 Age
Boys % Girls % Total %
SC
ST
Minority
General
Total
*There is no data available with the school or at the district office.
1. (b) If data of category-wise population of Students of age group 14-16 years is not available then approximation of families of various categories residing in habitation of Schools -
Category No. of Schools responded % SC 8 40% ST 0 0%
Minority 5 25% General 3 15%
All Categories 4 20%
Comments: The SMDC members and the school HM agreed in 8 schools (40%) that there are SC children in
abundance and they live with poor economic condition.
(c ) Share of SC,ST, Minority, and BPL families’ Girls-boys in enrollment is proportionate to their share in population of the habitation/neighborhood or not.
No. of Schools
Proportionate yes no 20 0
% 100% 0%
If not, reasons thereof ………………………………………………………………………
Comments:

113
.(a) Class wise, Social Category wise *B-Boy, G-Girl, E-enrolled, P-present
SC
ST
Minority
Others
Total
CWSN
B G T B G T B G T B G T B G T B G T
E P E P E P E P E P E P E P E P E P E P E P E P E P E P E P E P E P E P
IX
183
212
170
164
353
376
6 6 0 0 6 6 26
13
32
21
58
34
627
539
424
381
1051
916
661
561
458
403
1119
960
2 3 2 1 4 4
X 174
76
134
123
308
199
0 0 0 0 0 0 16
8 24
12
40
20
552
529
311
318
870
862
575
538
336
330
917
883
7 1 0 0 7 1
Total
357
288
304
287
661
575
6 6 0 0 6 6 42
21
56
33
98
54
1179
1068
735
699
1921
1778
1236
1099
794
733
2036
1843
9 4 2 1 11
5
% 29
26
38
39
32
31
0 1 0 0 0 0 3 2 7 5 5 3 95
97
93
95
94
96
100
100
100
100
100
100
1 0 0 0 1 0
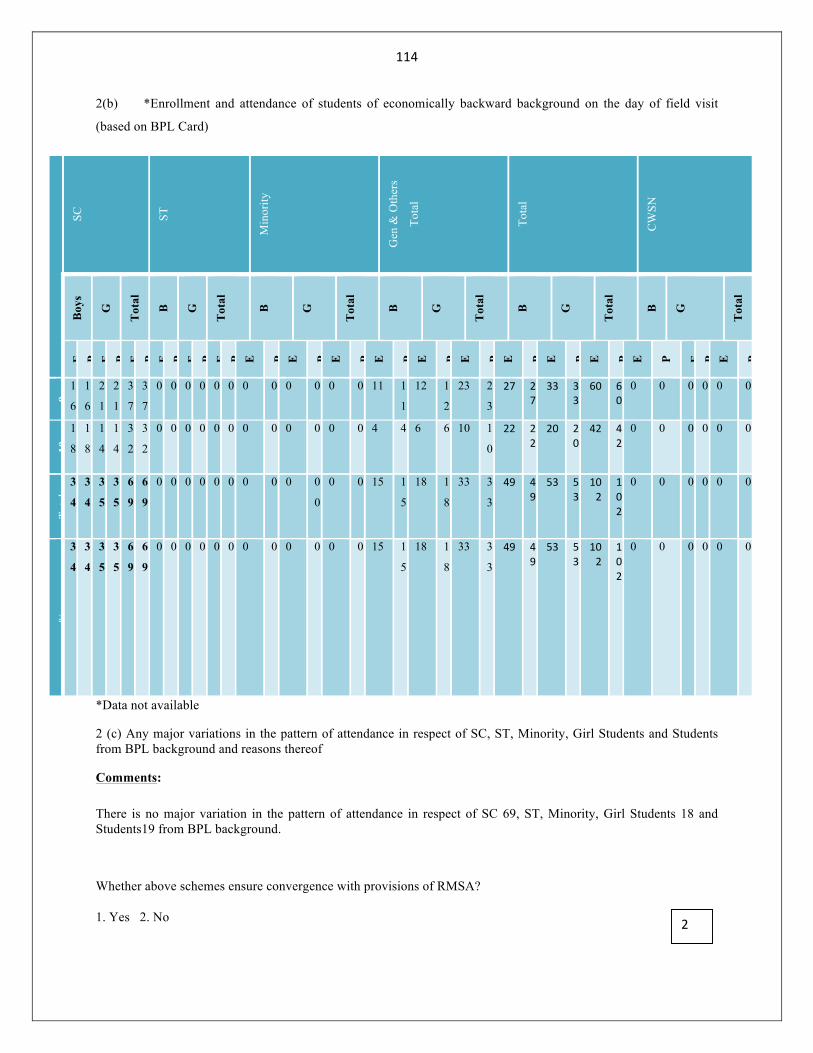
114
2(b) *Enrollment and attendance of students of economically backward background on the day of field visit
(based on BPL Card)
Cla
ss
SC
ST
Min
ority
Gen
& O
ther
s
Tota
l
Tota
l
CW
SN
Boy
s
G
Tot
al
B
G
Tot
al
B
G
Tot
al
B
G
Tot
al
B
G
Tot
al
B
G
Tot
al
E P E P E P E P E P E P E P E P E P E P E P E P E P E P E P E P E P E P
9
1
6
1
6
2
1
2
1
3
7
3
7
0 0 0 0 0 0 0 0 0 0 0 0 11 1
1
12 1
2
23 2
3
27 27
33 33
60 60
0 0 0 0 0 0
10
1
8
1
8
1
4
1
4
3
2
3
2
0 0 0 0 0 0 0 0 0 0 0 0 4 4 6 6 10 1
0
22 22
20 20
42 42
0 0 0 0 0 0
Tota
l
3
4
3
4
3
5
3
5
6
9
6
9
0 0 0 0 0 0 0 0 0 0
0
0 0 15 1
5
18 1
8
33 3
3
49 49
53 53
102
102
0 0 0 0 0 0
%
3
4
3
4
3
5
3
5
6
9
6
9
0 0 0 0 0 0 0 0 0 0 0 0 15 1
5
18 1
8
33 3
3
49 49
53 53
102
102
0 0 0 0 0 0
*Data not available
2 (c) Any major variations in the pattern of attendance in respect of SC, ST, Minority, Girl Students and Students from BPL background and reasons thereof
Comments:
There is no major variation in the pattern of attendance in respect of SC 69, ST, Minority, Girl Students 18 and Students19 from BPL background.
Whether above schemes ensure convergence with provisions of RMSA?
1. Yes 2. No 2

115
4. Any overt or covert, manifest or subtle discrimination against Students of any social group or community
by the teachers or peers is observed in School, and the efforts made to minimize it.
No. of Schools
Discrimination No discrimination By teachers By peers
No discriminatory practices seen inside the school campus however it exists in the community
No such practices seen
100%
Comments: There are no discriminatory practices seen inside the school premises however during discussion with
the community they shared discrimination exist in the community.
Efforts made to minimize discrimination
There are no discriminatory practices seen inside the school campus anywhere in Thiruvarur district.
5. Do the overall conditions prevalent in Schools facilitating access of CWSN to secondary Schools. If not,
the details of obstructions and barriers.
Number of Schools providing following facilities for access of CWSN –
Facility Number of Schools %
Proper ramps with hand rail 20 100%
Western toilet seat 5 25%
Special furniture in classroom 0 0%
Tricycle 1 5%
Escort 0 0%
Other (Specify)
In all the 20 schools (100%) visited by the MI, there were proper ramps with hand rails. The western toilet was found only in 5 schools out of 20. There was no special furniture provided in the class room for the CWSN to sit. Only in 1 school Tricycle is available and in no other school it was found. There are no escorts available in any schools of Thiruvarur district.

116
III. Open Schooling
Open Schooling System does not prevailing in the state of Tamil Nadu.
3. At State level
1. Whether the State open School is established at the State level? 1. Yes 2. No
2. Whether the State open School has its own district regional centers and study centers?
1. Yes 2. No
3(a) Admission and Re-admission procedure in the State open School.
________________________________________________________________________
(b) Examination & assessment pattern.
________________________________________________________________________
(c) Student support services.
________________________________________________________________________
Comments:
4. Advocacy programme for out of School Students for bringing them back to the School
_____________________________________________________________________________________________
_________________________________________________________
Comments:
5. Methods for identification of the number of out of School Students in the State (household survey etc.)
_____________________________________________________________________________________________
______________________________________________________________
Comments:
6. Identification procedure of out of School Students.
_____________________________________________________________________________________________
______________________________________________________________
Comments:

117
IV. Out of School Students (OoSC)/Dropout Students of Age Group 14-16 years. (At School level)
4. The number, gender and category-wise (SC/ST/Minorities/CWSN) profile of out of School Students
(OoSC)/Dropout Students of age group 14-16 years in preceding session (2012-13).
OoSC Drop out age group of 14-16 years - Thiruvarur District
Category Class Enrolled Boys
Boys drop out
% Enrolled Girls
Girls drop out
% Total Enrolled
Total Drop Out
%
SC IX 123 23 19% 117 7 6% 240 30 13%
SC X 113 13 12% 106 13 12% 219 26 12%
ST IX 0 0 0% 0 0 0% 0 0 0%
ST X 0 0 0% 0 0 0% 0 0 0%
Minority IX 10 1 10% 2 0 0% 12 1 8%
Minority X 8 0 0% 1 0 0% 9 0 0%
Gen & OBC
IX 109 9 8% 85 5 6% 194 14 7%
Gen & OBC
X 120 10 8% 76 4 5% 196 14 7%
Total IX 242 24 10% 204 9 4% 446 33 7%
Total X 241 13 5% 183 14 8% 424 27 6%
CWSN IX 2 2 100% 1 1 100% 3 3 100%
CWSN X 1 1 100% 1 1 100% 2 2 100%
IX X IX X IX X IX X
SC SC ST ST Minority Minority Gen & OBC
Gen & OBC
240 219
0 0 12 9
194 196
30 26 0 0 1 0 14 12
OoSC Drop out age group of 14-‐16 years -‐ Thiruvarur District
Enrolled Drop out

118
5. The separate number of CWSN is included in all categories.
Name of category with higher dropout
The SC community drop outs comprise 13% in class IX and 12% in class X.
Gender with higher dropout
In Gender perspective, dropout rate of boys looks to be little high when compared to Girls 10% of boys and 4% of
Girls are drop outs in class IX. 5% of Boys and 8% of Girls are drop outs in class X.
Class with higher dropout
The dropout rate is 7% is class IX and 6% in class X.
Reasons for dropout
• Economic condition
• Child labor
• Poor health condition
2(a) Efforts being made by School management to bring them back to School and, results thereof during the past one year.
Efforts made –
There are no personal efforts made by the school management to bring them back to School. In certain cases, the community identifies the drop outs and takes effort to enroll the children in school
Class-9 Class-10
No. of drop
out students
No. of drop out
brought back to
School
% No. of drop
out students
No.of drop out brought
back to School
%
33 0 0% 27 0 0%
Comments: In class 9 the total number of school dropout is 33 and in class 10 it is 27. None of the drop out students
was brought back to school.
3. Arrangements made to hold back Students of seasonal migrant families in School.
Arrangement Number of Schools %
Seasonal Hostels 0 0%
Any other arrangement 0 0%
No arrangement 20 100%

119
Comments: There are no special arrangements made at the school level to hold back the students of seasonal migrant
families. The students who migrate also do not inform the school management before leaving the school. This is one
of the major hindrance for the school to trace the school drop outs.
4. If no such arrangement made, whether migration/transfer certificate is issued to such Students by the Schools?
No. of Schools issuing TC
No. of schools Yes No
0 20
% 0% 100%
Comments: In Thiruvarur district no schools have issued Transfer Certificate to the students who migrate. The
schools respond that they couldn’t find out the students who have dropped out. Most of them are seasonal migrants
and no information could be retrieved.
5. Information about any special training interventions meant for the OosC.
No. of Schools
Special trainings started Yes No 0 20
% 0% 100% Name of Trainings
1
2
5(a) Number of enrolled and present students in training programme on the day of visit
Boys Girls Total Enrolled Nil Nil Nil Present Nil Nil Nil
% Nil Nil Nil 5 (b) Training programme is imparted through –
Total No. of School conducting training
Trainers No. of School %
Regular teachers 0 0
NIOS 0 0 SIOS 0 0

120
(c ) Average duration of training programme in days and achievement level of students (on the basis of School
record)
Class Enrolled in Training
Programme
Appeared in Exam
Achievement level Above 60% 45-59% 33-44%
B G B G B G B G B G 9
10 Total
% Comments: There is no training programme conducted for out of school children
3. Equity
I. General Information
At School Level
Category-wise profile of attendance and achievement of students category-wise (SC/ST/Minority/CWSN)
Profiling of attendance and achievement (School result) of School Students in the age group of 14-16 years.
2011-‐12 2012-‐13 2013-‐14
Enrollment and Attendance on day of visit
SC ST MINO. CWSN SC ST MINO. CWSN SC ST MINO. CWSN
B G B G B G B G B G B G B G B G B G B G B G B G
Enrolled for 9th
94 120
0 0 32 42 0 1 113
98
0 0 121
133
3 2 143
136
0 0 28
34
1 1
Avg. % of Attend.
95%
98%
0 0 98 100
0 100
92
95
0 0 89 94 67 100
73
74
0 0 89
94
5 4
Appeared in Exam
92 112
0 0 30 38 0 1 111
91
0 0 118
127
2 2 116
119
0 0 18
30
1 1
% 98%
93%
0%
0%
94%
90%
0%
0%
98%
93%
0%
0%
98%
95%
67%
100%
81%
88%
0%
0%
64%
88%
100%
100%
Above 60%
65 89 0 0 22 26 0 1 75
83
0 0 85 85 2 1 43
51
0 0 9 14
0 0
% 71%
79%
0%
0%
73%
68%
0%
100%
68%
91%
0%
0%
72%
67%
100%
50%
37%
43%
0%
0%
50%
47%
0%
0%
Below 60%
27 23 0 0 8 12 0 0 36
8 0 0 33 42 0 1 73
68
0 0 9 16
1 1
% 29%
21%
0%
0%
27%
32%
0%
0%
32
9%
0%
0%
28%
33%
0%
50%
63
57
0%
0%
50
53
100
100

121
% % % % % % %
Enrolled for 10 th
32 22 0 0 13 16 0 0 82
112
0 0 20 19 0 3 83
98
0 0 20
26
1 0
Avg. % Attend.
100%
100%
0 0 100
100
0 0 95
94
0 0 95 97 0 0 80
83
0 0 90
100
100
0
% 100%
100%
0 0 100
100
0 0 95
94
0 0 95 97 0 0 80
83
0 0 90
100
100
0
Appeared in Exam
28 19 0 0 13 16 0 0 80
109
0 0 21 28 0 0 66
81
0 0 18
25
1 0
% 88%
86%
0%
0%
100%
100%
0%
0%
98%
97%
0%
0%
105%
147%
0%
0%
80%
83%
0%
0%
90%
96%
100%
0%
Above 60%
15 9 0 0 8 15 0 0 28
52
0 0 10 20 0 0 22
22
0 0 6 14
0 0
% 54%
47%
0%
0%
62%
94%
0%
0%
35%
48%
0%
0%
48%
71%
0%
0%
33%
27%
0%
0%
33%
56%
0%
0%
Below 60%
13 10 0 0 5 1 0 0 52
57
0 0 11 8 0 0 44
59
0 0 12
11
1 0
% 46%
53%
0%
0 77%
6%
0 0 65%
54%
0 0 52%
29%
0 0 67%
73%
0 0 68%
44%
0 0
6. Details of specific schemes available in the State for ensuring enrollment of special category Students along
with the assistance provided there under?
There are no specific schemes available in the State for special category students other than one mentioned below.
Name of schemes
SC
2. Girls’ Incentive Scheme
1. To prevent drop outs of SC girl students, the IX th standard unmarried SC girls of
age, less than 16 years are provided with a fixed deposit certificate for Rs. 3000
2.
3.

122
Name of schemes
Name of schemes
Name of schemes
Name of schemes
Category-wise (SC/ST/Minority/CWSN) dropout students in past one year i.e .2012-13
II. Girls Education:
At School/DPO and SPO level
Gender Gap
1. Gender gap in enrollment, attendance, learning achievement and reasons thereof.
Enrollment, Attendance, Achievement level
ST
2. 1. Girls’ Incentive Scheme
To prevent drop outs of ST girl students, the IXth standard unmarried ST girls
of age, less than 16 years are provided with a fixed deposit certificate for Rs.
3000
4.
Minority 1. There are no schemes available in Tamil Nadu government specific to Minority community
2.
Girls
1.
2
3.
CWSN
1. 2. 3.
4. 5. 6.
7. 8. 9.
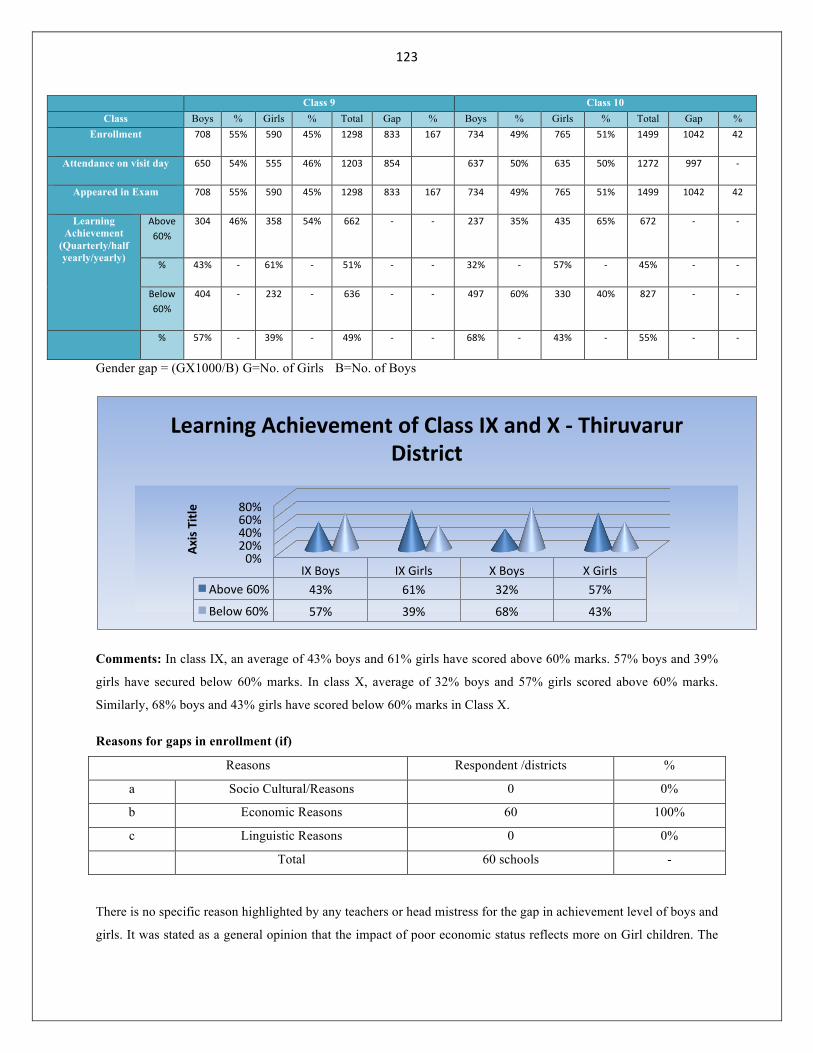
123
Class 9 Class 10 Class Boys % Girls % Total Gap % Boys % Girls % Total Gap %
Enrollment 708 55% 590 45% 1298 833 167 734 49% 765 51% 1499 1042 42
Attendance on visit day 650 54% 555 46% 1203 854 637 50% 635 50% 1272 997 -‐
Appeared in Exam 708 55% 590 45% 1298 833 167 734 49% 765 51% 1499 1042 42
Learning Achievement
(Quarterly/half yearly/yearly)
Above 60%
304 46% 358 54% 662 -‐ -‐ 237 35% 435 65% 672 -‐ -‐
% 43% -‐ 61% -‐ 51% -‐ -‐ 32% -‐ 57% -‐ 45% -‐ -‐
Below 60%
404 -‐ 232 -‐ 636 -‐ -‐ 497 60% 330 40% 827 -‐ -‐
% 57% -‐ 39% -‐ 49% -‐ -‐ 68% -‐ 43% -‐ 55% -‐ -‐
Gender gap = (GX1000/B) G=No. of Girls B=No. of Boys
Comments: In class IX, an average of 43% boys and 61% girls have scored above 60% marks. 57% boys and 39%
girls have secured below 60% marks. In class X, average of 32% boys and 57% girls scored above 60% marks.
Similarly, 68% boys and 43% girls have scored below 60% marks in Class X.
Reasons for gaps in enrollment (if)
Reasons Respondent /districts %
a Socio Cultural/Reasons 0 0%
b Economic Reasons 60 100%
c Linguistic Reasons 0 0%
Total 60 schools -
There is no specific reason highlighted by any teachers or head mistress for the gap in achievement level of boys and
girls. It was stated as a general opinion that the impact of poor economic status reflects more on Girl children. The
0% 20% 40% 60% 80%
IX Boys IX Girls X Boys X Girls Above 60% 43% 61% 32% 57%
Below 60% 57% 39% 68% 43%
Axis Title
Learning Achievement of Class IX and X -‐ Thiruvarur District

124
Girl children also support the parents in house hold activities and also they were given lesser priority in terms of
education when compared to boys. During the discussion the teachers expressed these views regarding education of
girl children.
Reasons for absenteeism (Gap in attendance)
Reasons Respondents (School/district)
%
A Health (own or family members) 4 20%
B Social cultural issues 1 5%
C Sibling Care 0 0%
D Household responsibilities 0 0%
E Family issues / Gone to relatives 0 0%
F Earning for livelihood 10 50%
G Migration 5 25%
H Any other 0 0%
Total 20 100%

125
Comments: The major reasons for absenteeism are earning for livelihood where as 50% of drop out is due to this
factor, next being the migration factor while 25% have left schools, and another 20% children were report various
health problems for dropping schools. In one school, the girl child has left because of social and cultural an issue
which is 5% in Thiruvarur district.
2. Efforts made to address the gender gap attitudinal and physical.
Barriers No. of Schools % Efforts made to address barriers
(a) Physical barriers 0 0% - (b) Attitudinal 0 0% - (c) Linguistic barriers 0 0% - (d) Economic barriers 0 0% -
Comments:
3. Any reduction in enrollment, attendance, learning achievement, and reasons thereof
(b) (i) Reduction in enrollment and reasons thereof.
Social
Group
SC ST MINORITY OBC & GEN TOTAL CWSN
Year B G T B G T B G T B G T B G T B G T
2011-12
2012-13
Gap
2012-13
2013-14
Gap
No data available in the district.
0%
20%
40%
60%
1
Reasons for Long Absenteeism -‐ Thiruvarur District
Health (own or family members)
Social cultural issues
Sibling Care
Household responsibiliZes
Family issues / Gone to relaZves

126
(b)(ii) Reduction in attendance and reasons thereof.
Social
Group
SC ST MINORITY OBC & GEN TOTAL CWSN
Year G T B G T
2011-12
2012-13
2012-13
2013-14
No data available in the district.
(b)(iii) Reduction in achievement level and reasons thereof*.
Social
Group
SC ST MINORITY OBC & GEN TOTAL CWSN
Year B G T B G T B G T B G T B G T B G T
2011-12
2012-13
2012-13
2013-14
No data available in the district.
Comments: There is no data available in the district with regard to reduction in enrollment, attendance and
achievement levels. There are no special efforts made in case of gender gap.
5. Any efforts being made for the counseling of parents to handle the problem of girls. If not why?
No. of Schools
Counseling of parents done Yes No
0 20 % 0% 100%
Comments:
6. Impact of separate hostel and other physical facilities and availability of security on enrollment, attendance
and learning achievement of girls.

127
iv. Number of Schools having facility of separate girls’ hostel in campus or in nearby area.
v. Number of girls residing in girls’ hostel in sample Schools.
vi. Any physical barrier faced by hostellers in their access to School
______________________________________________________________________________
4. Guidance and Counseling
There is no Guidance and Counseling Cell constituted in any of the schools visited in Thiruvarur district.
At School level:
4. Guidance and Counseling Cell been constituted by the School or not. If yes, the available student counselor
ratio:
No. of Schools
Guidance & Counselling Cell Constituted Yes No
0 20 % 0% 100%
Total 0 100
SCR: Student Counselor Ratio
Comments: The Guidance and Counseling cell has not been constituted in any of the schools visited by MI in
Thiruvarur district. The HMs reported that they had been given one day training on guidance and counseling cell.
However, the teachers are not professionally trained to counsel the children.
5. Number of Students being assisted by the cell.
Total Enrollment of Class IX, X in sampled Schools in
district
No. of students assisted by the Cell in total sampled Schools in district
%
- - -
Comments: There is no active counseling assistance happening in the government schools of Thiruvarur district.
The schools are not properly equipped and there is no professional training given to the teachers to handle
counseling for students.
0
0

128
3. The frequent problem areas of the students for which guidance and counseling is being sought.
S.No. Problem areas Responses % 1 Selection of optional subjects after sec. 2 To opt scout/guide/NCC 3 In choosing career 4 Seeking information about entrance exams
to various professional streams
No data available
5. Quality
II. Enabling Conditions : At School level
Availability of following enabling conditions
S. Physical Aspects Total Number of rooms
Number of equipped rooms
%
No. 1 Natural light 200 198 99% 2 Ventilation 200 198 99% 3 Black Board appropriately located in
classroom 200 189 95%
4 Bulb/Tube light /CFL 200 178 89% 5 Fan 200 195 98% 6 Teaching aids 200 180 90%
Comments: Natural light is available in 99% rooms of 20 sampled schools, like wise ventilation exists in 99%
rooms. Blackboards are appropriately located in 95% rooms. Availability of bulbs/tube lights/CFL exists in 89%
rooms in sampled 20 schools. Fan is available in 98% rooms. The teaching aids are available in 90% schools.
The physical aspects are at the satisfactory level in almost all the schools.
1(b) Availability & workability of following material/equipments –
S. No.
Name of Material/Equipment Availability in Number of Schools
Functional in Number of Schools
Number % Number % 1 Teaching aids 20 100% 15 75% 2 Desk-chairs/stools for students (Adequate) 20 100% 20 100% 3 Integrated science lab with equipments and
material 20 100% 0
4 Math kit 20 100% 0 0% 5 Science kit 20 100% 0 0% 6 Computer lab with computers and supportive
devices and internet connection 20 100% 3 15%
7 Art and Craft room 0 0% 0 0% 8 Library with age appropriate books and seating
arrangement 8 40% 8 40%

129
9 TV 0 0% 0 0% 10 Separate Activity room for girls 0 0% 0 0% 11 Audio Equipments 0 0% 0 0% 12 Video Equipments 0 0% 0 0% 13 LCD Projector 0 0% 0 0% 14 Overhead projector 0 0% 0 0% 15 Purified/ Safe Drinking Water 20 100% 20 100% 16 Fire Extinguisher 20 100% 20 100% 17 Auditorium 0 0% 0 0% 18 Staff room 20 100% 20 100% 19 Indoor games room 0 0% 0% 0% 20 N.S.S./NCC/Scout & Guides room 21 Counselor room 0 0% 0 0% 22 First-aid room 0 0% 0 0%
Comments:
2. The number of days, the School functioned during the last academic year? Give reasons for the closure, if
any of the School remains closed for long gaps during last year. Suggestions to avoid repetition of such instances
• No. of Schools remained closed
• Average No. of days, School(s) remained closed in last year
An average of 156 days closed in Thiruvarur district including Saturdays, Sundays and Government
holidays.
• Reasons for the closure
1.
2.
3.
Comments:
3. Number of teachers present in the School (Male & Female, vacancies against sanctioned posts.(In total sampled Schools in district)
Sanctioned Posts (subject-wise)
Number of teachers placed
Total % Number of teachers present in School on
visit day
Vacancies against
sanctioned posts
%
M F M F
190 89 83 172 86% 87 81 18 9%
0
210 days
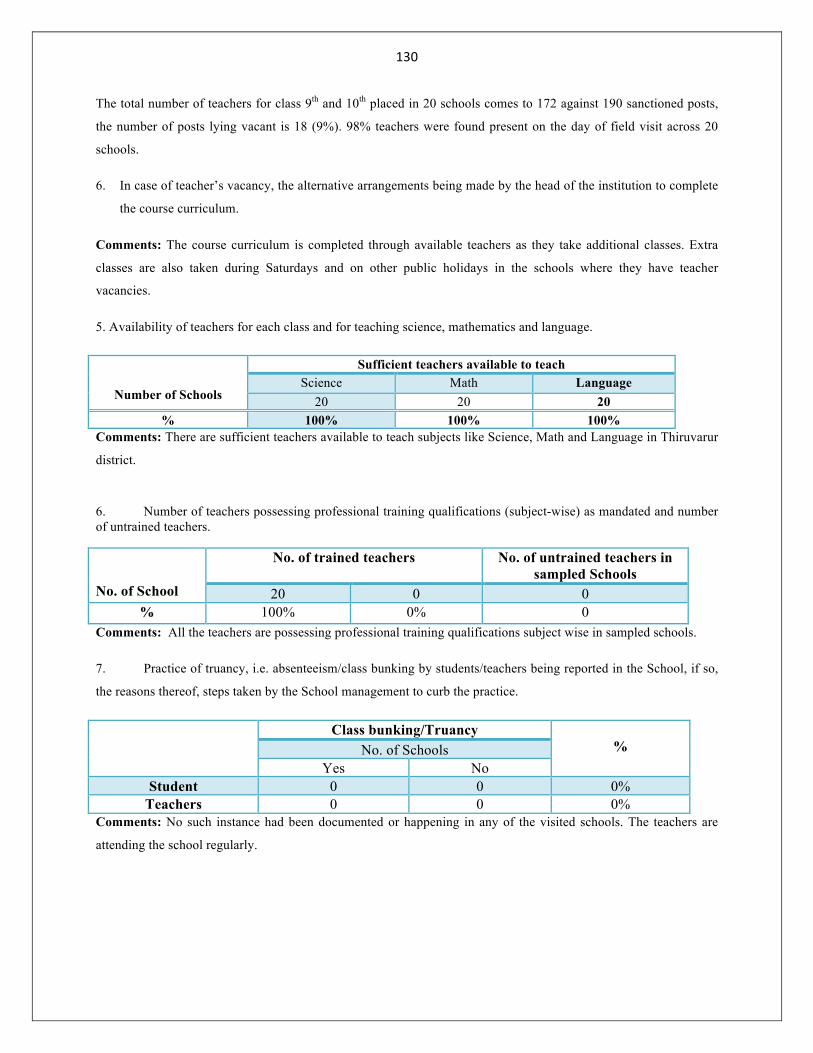
130
The total number of teachers for class 9th and 10th placed in 20 schools comes to 172 against 190 sanctioned posts,
the number of posts lying vacant is 18 (9%). 98% teachers were found present on the day of field visit across 20
schools.
6. In case of teacher’s vacancy, the alternative arrangements being made by the head of the institution to complete
the course curriculum.
Comments: The course curriculum is completed through available teachers as they take additional classes. Extra
classes are also taken during Saturdays and on other public holidays in the schools where they have teacher
vacancies.
5. Availability of teachers for each class and for teaching science, mathematics and language.
Number of Schools
Sufficient teachers available to teach Science Math Language
20 20 20 % 100% 100% 100%
Comments: There are sufficient teachers available to teach subjects like Science, Math and Language in Thiruvarur
district.
6. Number of teachers possessing professional training qualifications (subject-wise) as mandated and number of untrained teachers.
No. of School
No. of trained teachers No. of untrained teachers in sampled Schools
20 0 0 % 100% 0% 0
Comments: All the teachers are possessing professional training qualifications subject wise in sampled schools.
7. Practice of truancy, i.e. absenteeism/class bunking by students/teachers being reported in the School, if so,
the reasons thereof, steps taken by the School management to curb the practice.
Class bunking/Truancy % No. of Schools
Yes No Student 0 0 0%
Teachers 0 0 0% Comments: No such instance had been documented or happening in any of the visited schools. The teachers are
attending the school regularly.

131
8. Policy of teacher recruitment, deployment, training, remuneration and career advancement (At State
level)
Tamil Nadu Teacher Eligibility Test (TET) conducted by Teacher Recruitment Board (TRB) for the recruitment of
teachers for Tamil Nadu Government Schools; they conduct Teachers Eligibility Test for the selection of teachers
for Class I to XII.
II. Teaching Learning Process
1. Maintenance of teacher’s diary including curriculum delivery and lesson Plan etc. by teachers &
countersigned by the Head of the institution regularly.
No. of Schools
Teachers diary maintained Counter sign
Yes No Yes No
20 0 20 0
% 100% 0% 100% 0%
Observation & Comments
The Teacher’s diary is maintained in all the 20 schools and the HM makes countersign every week.
2. Availability of timetable prescribed by the School and followed by the teachers.
No. of Schools
Prescribed time table available Time table followed by teachers Yes No Yes No 20 0 20 0
% 100% 0% 100% 0% Comments: There is a prescribed time table available in all the 20 schools and time table is being followed by all
the teachers without fail. It is being verified by the HM frequently in Thiruvarur district.
3. Are discussions and group team works encouraged as a methodology of teaching for involvement of
Students/students in teaching learning process?
No. of School
Discussion and group team work encouraged Yes No 20 0
% 100% 0% Comments: In case of class IX and X, there is no discussion are group team works encouraged in the class room
activities. The teachers justify that they have a tight schedule to complete the syllabus for each term and there is no
time slot for conducting group discussions or team work.

132
3. a-c Classroom management with reference to seating arrangement of Students.
No. of Schools
Students made to sit in small groups
Students of disadvantaged groups
and Students with disabilities sit
separately or on back benches
Students have role in classroom management
Yes No Yes No Yes No 0 20 0 20 20 0
% 0% 100% 0% 100% 100% 0% Groups
made of Different
Same class
No. of Schools
0 20
% 0% 100% Comments: In case of class IX and X, there are no such activities for the students to sit in small groups. The
students who belong to same class are seated as a group and no groups from different age groups are made to sit
together. No disadvantaged groups are treated indifferently and disabled children are not made to sit separately or on
back benches. They are treated equally in the class room.
5. on site academic support by resource teachers in year 2012-13
Average frequency of visits of resource teachers /Schools
Average time spent by resource teacher/School
Nature of support provided
1. Resource teachers are appointed for 3 months in case if there are slow learners in the school 2. Resource teachers extend their support only to class 9 and not for class 10 3.
Comments: A periodical visit of resource teacher is required both class 9 and 10 since the slow learners if
monitored closely and supported there will be more changes. It needs consideration.
6. Special Teaching for Learning Enhancement:-
Number of Schools, which arranged zero periods, extra classes etc. for academically weaker students –
No. of Schools who arranged zero period, extra class
Yes No 20 0
% 100% 0%

133
Extra classes ran Throughout year Only for one month before exam 20 % 100%
Average days of zero period in a weak
Results thereof 1. Students are showing interest in learning the subject in out of classroom sessions 2. Improvement in the exam scores 3.
Comments:
7. Method/s of Assessment & Evaluation being followed in the School/classroom.
Method/s Response % Continuous and Comprehensive Assessment
Good 100%
Comments: The teachers are encouraged to use Continuous and Comprehensive Assessment method, however they
fell there is no proper training provided to teachers in evaluating the students.
8. Participation level of the CWSN in classroom processes and efforts made to optimize it.
No. of Schools with CWSN % 6 30%
Participation level in class All CWSN participate actively 6 100% Few CWSN participate 0 0% No participation 0 0%
Efforts made to optimize participation of CWSN in class 1 There are no efforts made to optimize participation in class IX and X. But the Primary level CWSN are
handled by resource teachers often. The same teachers extend their support to these high school children. There is no separate staff appointed for Upper primary.
2 3 4
Comments: In all the 6 schools, the CWSN participate actively. They feel very normal and there is no teasing or
bullying by peers.

134
9. Nature of peer interaction with CWSN.
Peer Interaction Number of Schools % Neutral 20 100% Taunting 0 0% Teasing 0 0% Bullying 0 0% Comments: There is no taunting teasing or bullying by peers in any of the schools where CWSN is present. The
children are neutral and the children also support CWSN in educational and other activities.
10. Individualized Educational Plan (IEPs) prepared for CWSN.
No. of Schools with CWSN
6
IEP
Prepared Not prepared
0 6
% 0 100%
Comments: IEP is available in the school only for the classes I to VIII and not available for classes IX and X.
11. Availability of adequate facilities for seating CWSN –
%
Total No. of sampled Schools
No. of Schools with CWSN in samples
20 6 100% 30%
No. of
Schools
No. of Schools with CWSN seating facilities Yes No
0 6 % 0% 100%
Comments: There are no special seating facilities arranged for CWSN in any of the 5 schools.

135
12. Extent and nature of use of ICT devices for teaching and learning of the CWSN.
Equipments
No. of Schools having Facilities
No. of Schools with CWSN having these facilities
No. of Schools making use of ICT
%
LCD Projector 0 0 0 0% Overhead projector 0 0 0 0% Computer & Accessories with net connection
0 0 0 0%
Others 0 0 0 0%
Comments:
There are no ICT devices used for teaching and learning of CWSN in any of the school at high school level. The
computer lab is used only by the higher secondary classes 11th and 12th in case if the students have opted for
computer science as their elective subject.
The teachers were also not trained on handling ICT devices. The class rooms are not properly equipped with ICT
devices for class 9 and 10 in Thiruvarur district.
III. Teachers’ Training
1. Provisions for Training of Teachers
S. No.
Provisions for In-service training Schedule Duration
1 Induction training (Science, Maths, English, `Social Science, Hindi & Sanskrit)
For newly recruited teachers
10 days training programme based on NCF. 2005, content, pedagogy and classroom activities.
2 In-service training –need based 5 days’ training programme in workshop mode in Maths, English, Social Science and Science
From July to December (50% of existing teachers from each district to be covered)
5 days
3 Orientation programme for Head Master/ Principal
As per SPO calendar 3 days
4 Training for newly recruited Head Masters As per SPO calendar 10 days 5 Management training for Head Masters/
Principals From Aug. to January 14 days
6 Workshop for Development of different modules for training
As per SPO calendar 10 days
7 Training of Resource Persons for H.M.’s training
As per SPO calendar
8 Block head-quarters and girls hostels As per SPO calendar 2 hrs. daily after School for 15 days
9 Development and Life skills for girls As per SPO calendar 5 days 10 Sensitization programme (legal (literacy
workshop) As per SPO calendar 1 days
11

136
1(a) Targeted annual Plan prepared by the State for in-service teachers’ training to improve quality and skills – Yes
Comments: The above table gives the information about the training provided to the teachers under RMSA as per
the SPO calendar.
2. Inclusion of trainings for dealing with CWSN, in training programme
Details of in-service training in subjects received by teachers -
No. of Schools whose teachers received training under RMSA
% S.No. Subjects Number of teachers,
received training under RMSA
Average teachers per School who received training
Average Duration
1 Science 15 0 7 days 2 Maths 19 0 7 days 3 English 10 0 7 days 4 Social Science 13 0 7 days 5 Sanskrit 0 0 0 6 Hindi 0 0 0
Total 0 0 0 Inclusion of training
to deal with CWSN 0 0 0
Comments:
There is very few teachers received training under RMSA in Thiruvarur district. 15 teachers have received training
in Science subject, 19 teachers in Maths, 20 teachers in English and 13 teachers in social science subject. Almost all
the training had lasted for 7 days. There was no training session conducted for Inclusion of CWSN.
2 (i)
Need of various trainings expressed by teachers S.
No. Name of Training Number of Schools
expressed the need Frequency Duration
1 Subject based training 20 Annual 4 days 2 Orientation Programme 20 Annual 5 days 3 Innovations’ training 20 Annual 5 days 4 Training for Development of life
skills 20 Annual 5 days
5 Computer training 20 Annual 11 days 6 Scout Masters’ training 0 Annual 7 Disaster Management Training 0 Annual 11 days 8 CWSN 0 9 Any other (mention) - - -

137
Comments: In almost all the sampled schools, teachers expressed that they are in need of periodical subject based
training, various orientation programmes, Innovations training, training for development of life skills and computer
training.
4. Impact of training on the confidence level of the teacher in handling a class with CWSN :
There had been no training provided to teachers on handling CWSN. In most of the cases, the CWSN who complete
VIIIth standard do not continue their education further. It could be due to several reasons but at the school level
there is no special effort taken by the management to continue the education of CWSN. The number vastly reduced
in migration of VIII to IX th standard.
4. Physical availability of adequate and good quality facilities for in-service training with reference to – Facilities Adequate % Inadequate %
Space 20 100% 0 0% Projection 20 100% 0 0% Tools/Modules 20 100% 0 0% Equipments (LCD, Projector, Computer etc.)
20 100% 0 0%
5. Whether training modules are need based or not?
No. of Schools Yes No
20 0
% 100% 0%
Comments:
6. Impact: Use of new technologies like Computer Assisted Learning (CAL), LCD Projector etc. for
imparting lessons in the classroom by teachers.
Total No. of teachers received training No. of teachers using CAL, LCD, etc. teaching
%
57 0 0%
Comments: There are no teachers in 9th and 10th standard use Computer Aided teaching in Thiruvarur District.
There is a computer lab available in all the schools. CAL centers are used by Primary students and higher secondary
children only if they have opted for computer science as elective subject.

138
7. Trainers/Resource persons from following institutions who imparted trainings –
N = (No. of Schools) whose teachers received training from RMSA
S.No. Institutes Number of Respondents % of respondents
1 Secondary Schools 1 5% 2 Higher Secondary Schools 0 3 DIET 1 5% 4 College/University 0 5 SIERT 0 6 IASE 0 7 CTE 0 8 NIC 0 9 Any other institution (mention) 0
10 Total 2 Comments: In almost all the schools teachers have been provided with training on various subjects under RMSA.
The resource persons/trainers are from secondary schools, higher secondary schools, DIET and few training sessions
were conducted by college / university professors.
The secondary grade teachers are not given teachers’ training. The higher secondary teachers and sometimes HMs give the training. Very rarely DIET staff conducts the training.
2. There are no sufficient practical sessions conducted for computer training. The teachers are not getting hands on experience to use computers and devices.
8. Any other issue related with teachers’ training of secondary education.
1. ------------no----------------------------------------------------------------------------------
2. ------------no----------------------------------------------------------------------------------
3. ------------no----------------------------------------------------------------------------------

139
6. CIVIL WORKS
In Thiruvarur district, 2 schools had civil work.
S.N. Name of School Year of establishment Year of construction Remarks 1 Palayakottai 2009-10 2009-10 Final stage 2 Pazhayavalam 2009-10 2009-10 Final stage 3. Availability of class rooms for Class IX & X (Std. Size 20’x24’)
Class Sections Available no. of rooms % Deficit % 9 2 2 100% 0 0%
10 2 2 100% 0 0% *List of sampled Schools with deficit of classrooms is attached
Comments: There are two sections in each class 9th and 10th and available number of rooms are 2 for each class.
There is no deficit of class rooms in any of the schools in Thiruvarur district.
4. Area of the School
No. of Schools having
School Campus School Building Open Space Play Ground Other
20 20 15 0
% 100% 100% 25% 0% Total area (sq.ft)of sampled Schools
5000sq. ft each school
No data No data No data
Avg. (sq.ft) Area 5000 sq.ft No data No data No data II. Design
1. Type of Building –
No. of Schools
Pucca Semi Pucca Kutcha Rented 20 0 0 0
% 100% 0% 0% 0% List of Schools with specified details is attached
Comments: All the 20 schools in Thiruvarur district are running in a pucca school building. However, most of the
class rooms belong to primary or higher secondary classes. Though the schools are upgraded by RMSA they do not
have class rooms allocated for upper primary. There is no separate fund released for construction of class rooms in
many schools except the two schools where civil work is at finishing stage.

140
2. Physical Condition of building -
No. of Schools
Cracks Damp Seepages Damages in Plaster
None
0 0 0 0 0 % 0% 0% 0% 0% 0%
List of Schools with physical condition of building attached
Comments: There are no damages, cracks, damp, and seepages in any of the school building.
3. Any local innovative approaches in School building design
Yes % No %
No. of Schools 0 0% 2
Kind of Innovation No such innovative practices witnessed by the monitoring team
Comments:
4. Availability of Natural Light & Cross ventilation; if not, reasons thereof, and the steps taken by School authorities to rectify it.
No. of Schools
Natural light
Cross ventilation If no, Reasons Steps taken to rectifies
Yes No Yes No 1. 2. 3. 4. 5. 6.
20 0 20 0
% 100% 0% 100% 0%
Comments:
5. Lighting Facility in Classrooms
No. of Schools
Arrangement of lighting facility Yes No 20 0
% 100% 0%
No. of Schools
Functional Not functional Yes No 18 2
% 0% 0% If not functioned, Reasons
1. The lighting is dysfunctional due to construction activities.
2.
3. 4.
Steps taken 1.

141
2.
3. 4.
Supply of electricity
No. of Schools
Continuous Intermittent
20 0
% 100% 0%
Average duration of availability
Comments:
6. Availability and usability of following provision of alternative electric power supply -
Generator Inverter Gobar Gas
Plant
Solar Panels
Wind Electricity
Other
No. of Schools Availability 0 0 0 0 0 0
% 0% 0% 0% 0% 0% 0%
No. of School In working condition
Nil Nil Nil Nil Nil Nil
% Nil Nil Nil Nil Nil Nil
No. of School Usability Nil Nil Nil Nil Nil Nil
% Nil Nil Nil Nil Nil NiL
Comments: There is no alternative electric power supply in any of the schools in Thiruvarur district.
7. (a-b) Library Design - Availability of the Following -
No. of Schools
Sufficient Seating
Space
Proper Light Ventilation Regular Pest Control
Yes No Yes No Yes No Yes No
2 18 0 18 2 18 00 20
% 10% 90% 10% 90% 10% 90% 0% 100%
Comments: There is no proper library setting available in any of the schools.

142
8. (a-d) Laboratory Design
Laboratory Number of Schools (a) Adequate space for Physics, Chemistry,
Biology and other subjects Yes % No % 20 100% 0 0%
(b) Proper height (3 ft.) of Lab. Table 20 100% 0 0% (c) (i) Cross Ventilation 20 100% 0 0%
(ii) Exhaust Fan 20 100% 0 0% (d) Availability of Running Water 15 75% 0 25%
Comments:
The construction of laboratory has not been completed in two of the schools. The availability of running water was
available in 75% schools. The laboratory though available in the higher secondary schools it is not being used by
upper primary children. These children do not have lab activities in their curriculum. The lab is used only XIth
standard students if they have opted for science subjects.
The lab materials are also supplied every year with the same quantity irrespective of the left over materials. The
RMSA district office makes the payment for lab materials directly to the private company that supplies lab
resources. The materials are supplied to all the schools. So, the materials are kept unused in most of the schools as
there is overstock and non-usage. This issue has to be addressed by the district RMSA officials.

143
9. Facilities for Physically Challenged:
(a) Availability of Ramps to access the following
S.No. Ramps to Number of Schools Yes % No %
(i) Entrance of School 18 90% 2 10% (ii) Drinking Water Facility 0 0% 0 0% (iii) Toilet Facility 0 0% 0 0% (iv) Science lab 0 0% 20 100% (v) Computer Lab 0 0% 20 100% (vi) Mathematic Lab 0 0% 20 100% (vii) Library 0 0% 20 100% (viii) Auditorium - - - - (ix) Play Ground - - - -
Comments: The ramps are available only at the school entrance and in front of few class rooms. There are no ramps available for the above mentioned places. However, these places are approachable by physically challenged students. There is no separate library building available in most of the schools.

144
(b) Availability of benches of different height in classrooms –
Bench Availability
Number of Schools
Yes No
19 1 % 95% 5%
There are benches available in schools but not of different height in classrooms.
(c) Ramp’s Condition
Comments: The ramp has been constructed under SSA scheme and not under RMSA scheme. All the schools had
ramp facility. In few schools there are no handrails available.
10. Drinking Water Facility
(a) Source of drinking water
Source Number of Schools %
Supply water Panchayat / Corporation Water 100%
Tube well 11 55%
Dug Well 0 0%
Hand Pump 2 10%
Other -
No source 0 0%
Availability of sufficient water across all the seasons
No. of Schools Water Available
Yes No
Number of Schools with ramps
Adequate Slope
Yes No
20 0
% 100% 0%
Hand rails available 20 0
% 100% 100%

145
20 0 % 100% 0%
Comments: There are water resources available in all the 20 schools. The water is supplied by Panchayat or Municipality. The water is stored in a syntax container and used across.
(b) Water Storage Facility & its condition & cleaning schedule
Type of Facility
No. of
Schools
Condition Cleaning Schedule
No. of Schools
%
Good &
Usable
Damaged not usable
Weekly
Open Tank 0 0 0 Fortnightly 0 0
% Monthly 20 100%
Covered tank 11 0 0 Six Monthly
% 55% 100% 0% Not Definite
ground tank 10 0 1 5% % 10% 10% 0%
Overhead tank 7 0 19 % 35% 35% 95% 95%
(c) Quality of drinking water
No. of Schools
Quality
Satisfactory Not satisfactory
20 0
% 100% 0%
(i) Measures taken by Schools authority to ensure clean drinking water -
Number of Schools
Aqua guard R/o Water Filter Other None 02 0 5 0 0
% 10% 0% 25% 0% 0%

146
(ii) Measures adopted for treatment & testing of water –
Number of Schools with treatment of
water
Bleaching Powder
Chlorine Alum Powder
None Testing of water done
Yes No
0 5 0 0 0 20
% 0% 25% 0% 0% 0% 100%
Comments: The water is being chlorinated by the panchayat/municipal authorities. Despite of it, 5 schools in
Thiruvarur district is using chlorine periodically to ensure cleaning of water. However, the testing of water has not
been done in any of the schools in Thiruvarur district.
There are no measures adopted for treatment & testing of water
(d) Availability of sufficient numbers of drinking water taps -
No. of Schools
Availability of Water taps Yes No 20 0
% 100% 0% Comments:
11. Sanitation Facility –
(a) Availability of adequate numbers of urinals/lavatories students, teachers and others
Users Facility of urinals/lavatories available in Schools
Adequate Number % Inadequate Number % Boys 20 100% 0 0% Girls 20 100% 0 0% CWSN 3 15% 17 85% Teachers 20 100% 0 0% Other workers *List of sampled Schools with shortcomings is attached
Comments: There are no special arrangements made for CWSN with respect to toilet facilities. The number of
CWSN in upper primary is very minimal when compared to primary schools.

147
(b) Maintenance/Cleanliness of toilets and supply of water
No. of Schools
Maintenance Cleanliness Supply of running water
Yes No Yes No Yes No
18 2 2 18 20 0
% 90% 10% 10% 90% 100% 0%
Comments:
There is proper maintenance of toilets in most of the schools. In Thiruvarur district, running water was available in all the toilets but there is no cleanliness.
(c) Availability of Separate Toilets for Girls –
No. of Schools
Separate toilet availability Yes No 20 0
% 100% 0% Safer location of Girls’ toilets
Yes No

148
No. of Schools 20 0 % 100% 0%
Availability of Napkins & Dustbins
No. of Schools
Sanitary Napkins Dustbins Yes No Yes No
0 20 0 20 % 0% 100% 0% 100%
Comments: Napkins & Dustbins are not available in any of the schools in Thiruvarur district, but having only at
upper primary level and there is no these facility for high school level due to no separate building for high school
(d) Provision in toilets for physically challenged students -
No. of Schools
Availability of Provision Yes No
5 15 % 25% 75%
(e) Lavatories’ single pits/double pits attached with septic tank and cleaning of septic tank
No. of Schools
Connectivity of lavatories with Single Pit/Double Pit Lavatories with Septic Tank
Regular cleaning of septic tank
Yes No Yes No 2 18 2 18
% 10% 90% 10% 90% Comments:
There is no any vacancy for scavenger at high school level but they have vacancy at school level not filled by
government
12. Drainage System
(a-c) Availability of drainage facility
No. of Schools
Drainage System available Yes No 20 0
% 100% 0% Type of Drains
Under ground Pucca Covered
Pucca & Open
Kutcha & Open
No. of Schools
20 0 0 0 0
% 100% 0% 0% 0% 0% Structural Condition
Good Bad Damaged Regular Cleaning of drains done in Schools
No. of 20 0 0 0

149
Schools % 100% 0% 0% 0%
Any instance of Water Logging No. of
Schools Yes No
0 20 % 0% 100%
No. of Schools
If, yes, location of Water Logging Wrecked Drains
Entrance Gate
Open Space
Playground Near Toilets
Outside Classrooms/Lab/Lib/Kitchen
0 0 0 0 0 0 0 % 0% 0% 0% 0% 0% 0% 0%
Comments: There is no instance of water logging in any of the schools.

150
13. (a-c) Waste Water treatment/discharge/disposal of solid waste
No. of Schools
Waste Water Treatment & Discharge Arrangement Yes No
0 20 % 0% 100%
No. of Schools
If yes, Type of drainage system Septic Tank Municipal
drain Open field Any other
0 0 0 0 20 % 0% 0% 0% 0% 100%
No. of Schools
Availability of waste Collection facility Yes No
0 20 % 0% 100%
No. of Schools
If yes, Adequate No. of dustbins Yes No
0 20 % 0% 100%
No. of Schools
If yes, Condition of dustbins Usable Not usable
0 20 % 0% 0%
No. of Schools
Availability of facility for treatment of waste Yes No
0 20 % 0% 100%
No. of Schools
Facility for composting of organic waste Yes No
0 20 % 0% 100%
Comments:
There is no waste water treatment/discharge /disposal of solid waste management in any of the schools.

151
14. (A-b) Water & Energy Conservation
Number of Schools
Availability of Water Conservation Measures No Yes 20
0 % 0%
Number of
Schools
Availability of Rain water harvesting system Yes No
5 15 % 25% 75%
Number of
Schools
Condition of Rainwater harvesting system Working Not Working
0 20 % 0% 100%
Number of
Schools
Stored water consumable Yes No 20 0
% 100% 0%
Number of Schools
Lighting facility available Yes No 20 0
% 100% 0% Type Ordinary bulb Ordinary tube CFL None
Number of Schools
0 20 0 0
% 0% 100% 0% 0%
Number of Schools
Teacher’s School management’s awareness about use of renewable sources of energy Yes No
0 20
% 0% 100%
Type of source
Gobar gas Plant Solar energy Wind energy
No. of Schools using
0 0 0
% 0% 0% 0% Comments: There is no awareness created among the school authorities regarding the renewable sources of energy. Other sources of energy like Gobar gas or Solar or Wind energy are not used.
15. (i) (a-b) Safety aspect of Building Design
No. of Schools Govt. Building Rented 20 0
% 100% 0%
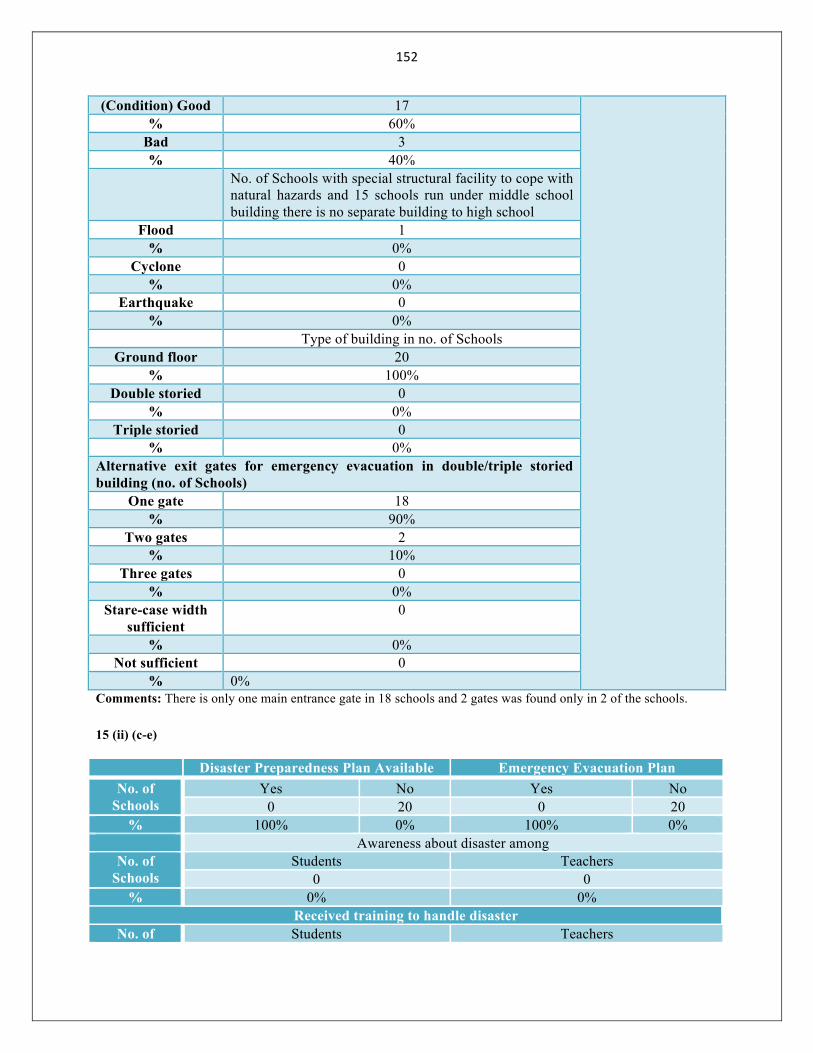
152
(Condition) Good 17 % 60%
Bad 3 % 40%
No. of Schools with special structural facility to cope with natural hazards and 15 schools run under middle school building there is no separate building to high school
Flood 1 % 0%
Cyclone 0 % 0%
Earthquake 0 % 0%
Type of building in no. of Schools Ground floor 20
% 100% Double storied 0
% 0% Triple storied 0
% 0% Alternative exit gates for emergency evacuation in double/triple storied building (no. of Schools)
One gate 18 % 90%
Two gates 2 % 10%
Three gates 0 % 0%
Stare-case width sufficient
0
% 0% Not sufficient 0
% 0% Comments: There is only one main entrance gate in 18 schools and 2 gates was found only in 2 of the schools.
15 (ii) (c-e)
Disaster Preparedness Plan Available Emergency Evacuation Plan No. of
Schools Yes No Yes No
0 20 0 20 % 100% 0% 100% 0%
Awareness about disaster among No. of
Schools Students Teachers
0 0 % 0% 0%
Received training to handle disaster No. of Students Teachers

153
Schools 0 0 % 0% 0%
No. of Schools
The Fire extinguishers are available in HM room and not available in Kitchen or Laboratory.
Kitchen Laboratory 0 0
% 0% 0%
No. of Schools
In working condition In working condition Yes No Yes No 20 0 0 20
% 100% 0% 0% 100% Trained to handle fire extinguisher
No. of Schools
Teachers Students Yes No Yes No
0 20 0 20 % 0% 100% 0 100%
Availability of Contact Numbers of No. of
Schools Ambulance Fire brigade Nearest hospital
Yes No Yes No Yes No 0 20 0 20 0 20
% 0% 100% 0 100% 0 100% Display of Numbers
0 20 0 20 0 20
% 0% 100% 0 0% 0 100% Comments:
Disaster Preparedness Plan is not available in any of the schools, also there is no Emergency Evacuation Plan, there
is no Awareness about disaster among teachers and students. Teachers have not received training to handle disaster
to teachers, Fire extinguishers are available in HM room only and all are in working condition. In most of the
schools, teachers were not given proper training to handle or operate fire extinguishers.

154
III. Schools with ongoing construction activity
1. (a-d) sufficient measures being taken by School authorities to ensure that it does not hamper academic
activities vitiate air, water, land quality etc. in School.
No. of Schools
Ongoing construction activities Yes No
2 18
% 10% 90% Type New School building Strengthening of
existing School Repair works
No. of Schools
2 0 0 0
% 10% 0 0 0
Measures being taken by School authorities
a. Measures being taken to ensure
No. of Schools
Academic activities not hampered due to
construction
Construction activity does not vitiate quality of
Noise pollution in permissible limit
Air Water Land Yes No Yes No Yes No Yes No Yes No
2 0 2 0 2 0 2 0 2 0 % 100% 0% 100
% 0% 100% 0% 100
% 0% 100% 0%
b. Construction material stored appropriately No. of
Schools Yes No
2 0 % 100% 0%
c. Temporary fencing of construction area done No. of
Schools Yes No
0 2 % 0% 100%
Comments:

155
2. (a-b) Procurement aspects
No. of Schools
Same contractor whom the work was
awarded is doing work (a)
Stage of construction work Construction work being
done according to layout Plan
Yes Sublette to other
Foundation level
Plinth level/ DPC
Lintel Roof level
Flooring/plastering Finishing level
Yes No
2 0 0 0 0 0 0 2 2 0 % 100% 0% 0% 0% 0% 0% 0% 100% 100% 0%

156
2(c-g)
h. Number of visits per School of Technical persons and authentication done or instructions given on construction site –
No. of
Schoo
ls
Community
members
through
SMDC
involved in
procureme
nt process
Sub
Committee
(Constructi
on
Committee)
Constituted
A/c Books
Civil Work
(Constructi
on)
maintained/
updated
MB for
Civil
Work
Maintaine
d
Payment
made to
contracto
r in
accordan
ce with
MB
Material
stocked
is in line
with
stock
register
Cheque
issue
register
maintain
ed
Quality up to the mark Physical
existence of
constructio
n material
matches
with entry
made in
stock
register
Constructi
on
Material
Constructi
on work
Yes No Yes No Yes No Ye
s
No Yes N
o
Yes N
o
Yes No Yes No Yes No Yes No
2 0 0 2 0 2 0 2 2 0 2 0 0 2 2 0 2 0 2 0
% 100
%
0% 0% 100% 0 100 0 100
%
100
%
0
%
100
%
0
%
0 10
0
100 0 100
%
0
%
100
%
0%
100% 0%
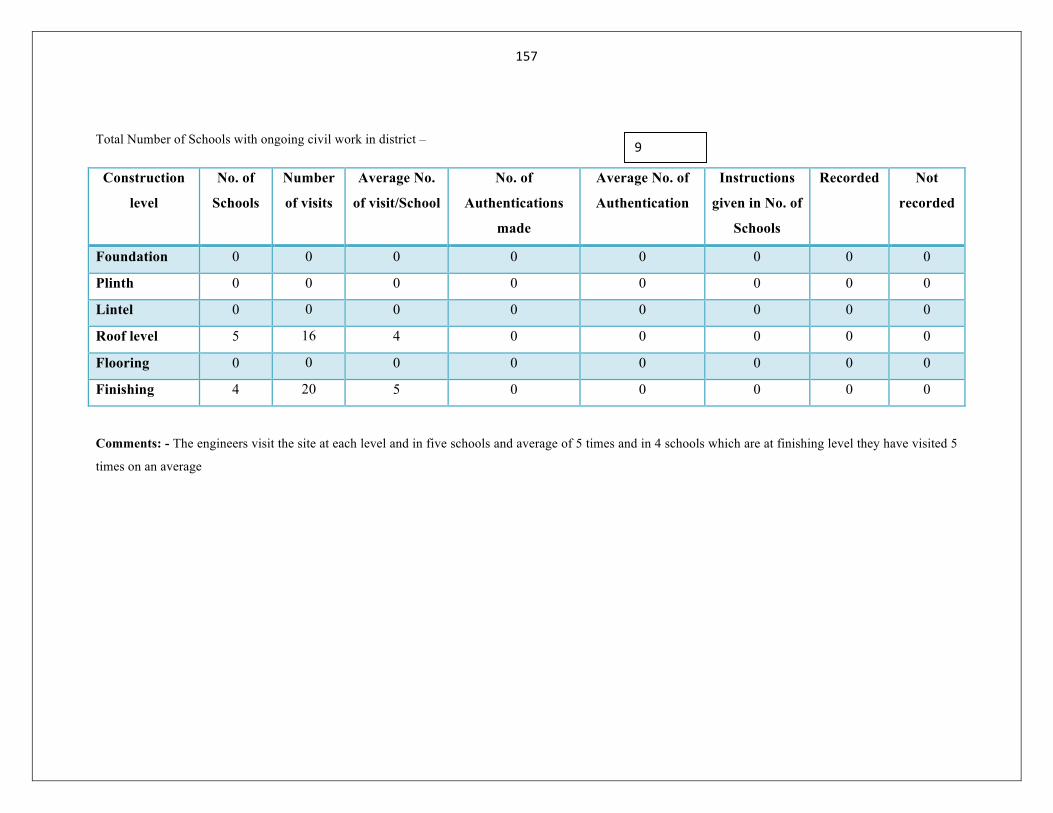
157
Total Number of Schools with ongoing civil work in district –
Construction
level
No. of
Schools
Number
of visits
Average No.
of visit/School
No. of
Authentications
made
Average No. of
Authentication
Instructions
given in No. of
Schools
Recorded Not
recorded
Foundation 0 0 0 0 0 0 0 0
Plinth 0 0 0 0 0 0 0 0
Lintel 0 0 0 0 0 0 0 0
Roof level 5 16 4 0 0 0 0 0
Flooring 0 0 0 0 0 0 0 0
Finishing 4 20 5 0 0 0 0 0
Comments: - The engineers visit the site at each level and in five schools and average of 5 times and in 4 schools which are at finishing level they have visited 5
times on an average
9

158
7. Community Mobilization / Participation -
Total number of SMDC members in sampled Schools of the District
1. (a-c) Familiarity of SMDC members with their roles as notified by the State Government –
No. of School
Level Familiarity with
their roles
% SEMIS DCF
% School Report Card
% SDMC Registe
r
% Guidelines of School
Development Plan
%
Training received by
SMDC Members
Printed copy of guidelines of SMDC made available to
5 members

159
s No. of Schools
members Better Ye
s No Ye
s No
Good 20
100%
20 100%
20 100%
20 100%
20 100%
20 0 20 0
Average
Not familiar
0 0 0 0 0 0 0 0 0 0
Comments: The school report card is being prepared by SSA authorities and not by RMSA. Training has been conducted by RMSA but not effective. There are
only minimum roles assigned to SMDC members. The printed copy of guidelines is available with all SMDC members. The SMDC activities and roles need to
be strengthened and in the meetings only the budget and civil work allocation is being discussed. The other school development plans and execution has to be
discussed.
2. (I) Frequency of SMDC meetings held, issues discussed thereof and average attendance of the SMDC members-
No. of Schools
Meetings held Average Attendance of SMDC members
Monthly Quarterly Six monthly Annually Whenever needed Never 100% 0 15 5 0 0 0
% 0% 75% 25% 0% 0% 0% Issues discussed –
1. Civil work 2. Perspective plan 3. Mainly grants 2(ii) Description of SMDC members –
Members Number Average no of members per School
Average Attendance in recent meeting
Total members 100 5 100% Women members 10 1 100%

160
SC/ST members 4 0.2 100% Selected members 100 5 100% Nominated members 0 0 0% Comments: There is an average of 5 members in SMDC in each school. There are 100 members in the 20 schools visited by the MI. There were only 10
members totally and it comes to an average of 1 women member in each school. Few schools did not have women representation. But there were 2 to 3 women
members in some of the schools. There is very minimum representation of SC/ST members in SMDC. There were 4 members in Thiruvarur district.
2. (I) Roles of SMDC members in monitoring attendance of teachers and students –
No of Schools
Monitoring Attendance of Monitoring Academic Progress of Students Teachers Students
Yes No Yes No Yes No 0 20 0 20 0 20
% 0% 100% 0 100% 0 100% 3(ii) Level of participation of SMDC members in helping School authorities to conduct following activities
No.
of S
choo
ls
Leve
l of P
artic
ipat
ion
RM
SA &
MD
M I
mpl
emen
tatio
n
%
Con
stru
ctio
n w
ork
unde
r RM
SA
%
SAG
Util
izat
ion
%
Free
Tex
t Boo
ks d
istri
butio
n
%
Scho
lars
hips
dis
tribu
tion
%
Prep
arin
g A
WP
& B
%
Stud
ents
Enr
ollm
ent,
Atte
ndan
ce
%
Reg
ular
ity o
f tea
cher
s
%
Run
ning
of d
ay to
day
act
iviti
es o
rgan
isin
g Sc
hool
& c
ultu
ral e
vent
s
%
Hel
p in
pro
vidi
ng S
choo
l fac
ilitie
s
%
Filli
ng o
f DC
F
%
Good 20 0 4 0 20 0 20 0 20 0 20 0 20 0 20 0 20 0 20 0 0 0
Average 0 0 0 0 0 0 0 0 0 0 0 0 0 0 0 0 0 0 0 0 20 100%
Bad 0 0 0 0 0 0 0 0 0 0 0 0 0 0 0 0 0 0 0 0 0 0%
4. Participation of SMDC members in preparation of AWP&B –

161
No. of Schools
Preparation of AWP & B Yes No
0 20 % 0% 100%
Comments: The SMDC members are not involved in the preparation of AWP&B. Instead, the HM who is also one of the members of SMDC prepare the
AWP&B. Later, the Budget is being discussed in the SMDC meetings and get approved.
5. Training received by SMDC members and duration thereof –
No. of Schools
SMDC members received training Total No. of SDMC members
No. of members who received training
Average of training duration in days
Yes No 30 30 20 0 2 days
% 100% 0% 100 100% 100%
6. Schedule of trainings, received by SMDC members, name agency who conducted the trainings, and perception of SMDC members about trainings.
Month and year of training
held
Trainings conducted by Responses about perception of SMDC members regarding trainings Topic, Content, Methodology projection
1. DIET No. of Schools
Good & Useful Average Not Good 2014 2. School HM

162
20 20 0 0
Comments: The SMDC training is conducted by DIET or School HM. The respondents stated that it was Good and Useful in all the 20 schools.
8. MIS (Management Information System) at SPO, DPO and School level
1. Preparation of Master List of all Schools including private in District/State
Name of District visited Thiruvarur …………..
Master List of government and Pvt. Schools Prepared If master list not prepared reasons thereof
Yes No 1. 100% 0% 2.
Name of State Tamil Nadu Tamil Nadu 3. Total No. of
govt. Schools No. of govt. Schools
of which list is prepared
% Total No. of pvt. Schools
No. of pvt. Schools of which list is
prepared
% 4.
District 5. State
Comments: Data not available in the schools.
2. Distribution of DCF for the current year to all Schools in the District
No. of School DCF distributed to all DPOs from SPO Yes No
% 20 0
No. of School DCF distributed all Schools from DPO
Yes NO % 20 0
Comments: DCF distributed all Schools from DPO but not for the current academic year.
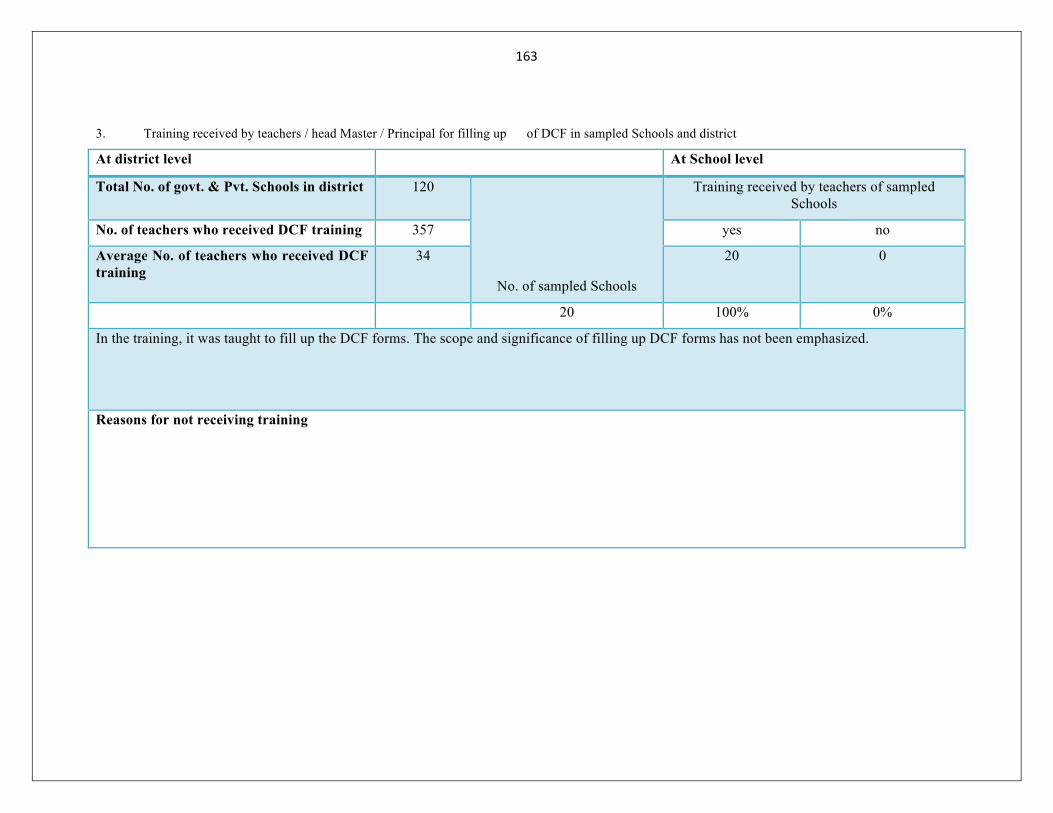
163
3. Training received by teachers / head Master / Principal for filling up of DCF in sampled Schools and district
At district level At School level
Total No. of govt. & Pvt. Schools in district 120
No. of sampled Schools
Training received by teachers of sampled Schools
No. of teachers who received DCF training 357 yes no
Average No. of teachers who received DCF training
34 20 0
20 100% 0%
In the training, it was taught to fill up the DCF forms. The scope and significance of filling up DCF forms has not been emphasized.
Reasons for not receiving training

164
8. Status of receiving of DCF duly filled up from all Schools in the district for the current year i.e. 2013-14 (At district level)
Total no. of Schools in the
district
No. of Schools to which DCF distributed through nodal Schools
No. of Schools from which filled up DCF received
No. of Schools from which filled DCF not received
Reasons for not delay
Govt. Pvt. Total Govt. Pvt. Total Govt. Pvt. Total 1. 2. 3. 4. 5. 6. 7. 8.
71
59 130 71 59 130 0 0 0
Govt.
Pvt.
%
Comments: All the schools in Thiruvarur district has been distributed with DCF forms. 5. Availability of Copy of filled up DCF with School for record and reference
(At School level) No. of Schools
Copy of filled up DCF available Reasons of Non-availability of o/c of DCF Yes No 1. 20 0 2.
% 100% 0% 3. Comments: All the schools have the copy of filled in DCF 6-7 School report card and sample checks
Data entry done School report card generated Sample checking being done Yes No Yes No Yes No
0 20 20 0 0 20 School report card distributed to no. of Schools Finding of sample check
20 0% 0% 0%
Comments: The sample check has not been done due to minimum staff available unlike SSA. Sample checks are done by the SSA field staff and occasionally RMSA officials do the sample check.
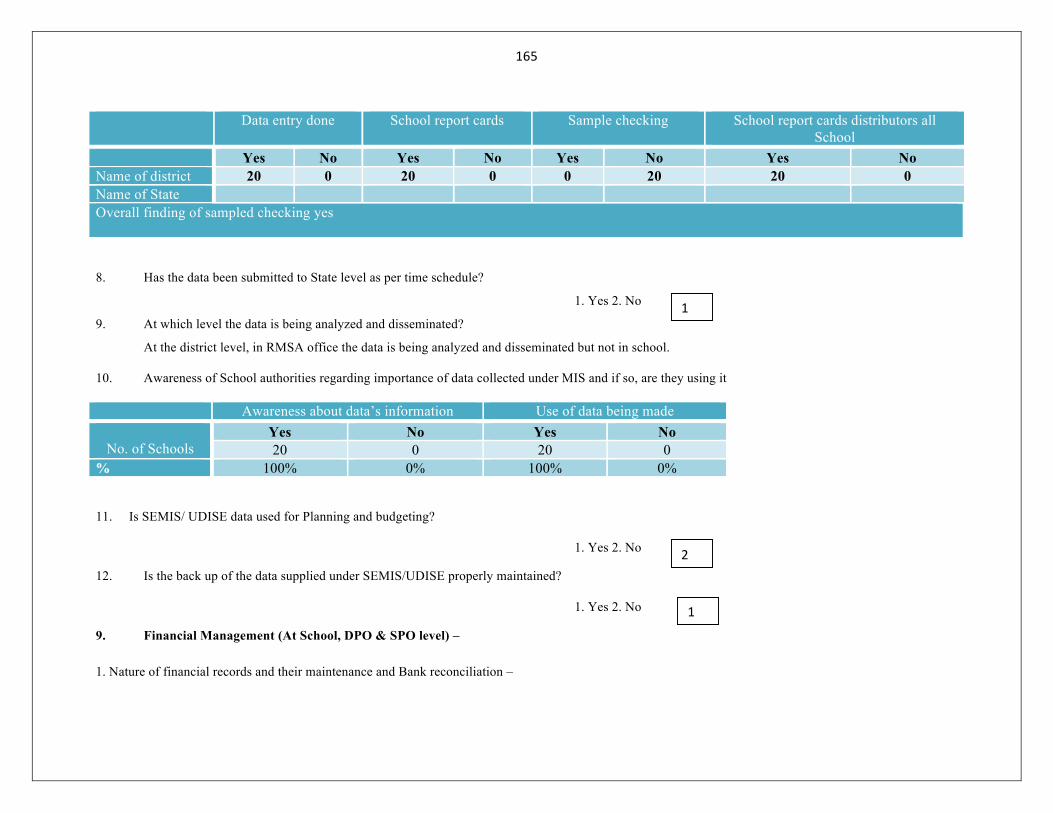
165
Data entry done School report cards Sample checking School report cards distributors all
School Yes No Yes No Yes No Yes No
Name of district 20 0 20 0 0 20 20 0 Name of State Overall finding of sampled checking yes
8. Has the data been submitted to State level as per time schedule?
1. Yes 2. No
9. At which level the data is being analyzed and disseminated?
At the district level, in RMSA office the data is being analyzed and disseminated but not in school.
10. Awareness of School authorities regarding importance of data collected under MIS and if so, are they using it
Awareness about data’s information Use of data being made
No. of Schools Yes No Yes No 20 0 20 0
% 100% 0% 100% 0%
11. Is SEMIS/ UDISE data used for Planning and budgeting?
1. Yes 2. No
12. Is the back up of the data supplied under SEMIS/UDISE properly maintained?
1. Yes 2. No
9. Financial Management (At School, DPO & SPO level) –
1. Nature of financial records and their maintenance and Bank reconciliation –
1
2
1

166
No. of
Schools
Records maintained & updated on daily basis Bank reconciliation done on monthly basis Cash Book
Yes No Yes No 20 0 0 20
% 100% 0% 0 0 DPO 100% 0% 0 0
0 100% 0% 0 0 Comments: all head master says that SG and MRG should given to June onwards till right now late payment and to consume timely credit sc high in the district all schools under RMSA and education rank 6th place
2. Mode of transfer of funds to the SMDC from State/District level –
From DPO to SMDC
Mode of Transfer
Cheque Draft E-transfer
No. of Schools 0 0 20
% 0 0 100%
From SPO to DPO 0 0 20
Comments: All financial transactions are done through banks only

167
3(i) Type of funds/grants received by the sampled Schools and details thereof (financial year 2012-13) –
S.NO. Type of funds/grants No. of Schools As recorded in cash book Amount
Received Total Month of receipt
1. School Annual Grant (SAG)
20 50000/school 20 Not available
2. Minor Repair Grant 20 25000/school 20
3. New School Building Grant (Major grant)
2 50,000,00 50,000,00 Not available
4. Additional classroom /lab etc. construction grant
5. Major repair grant
6. Educational tour grant
7. others
8
9.

168
At District Level
3(ii). Type of funds /grants allocated by the district to Schools
S.No. Name of grant allocated No. of Schools Month of allocation
1 School Annual Grant All the Government and
Government aided schools
in Thiruvarur district
March
2 Minor Repair Grant All the Government and
Government aided schools
except 11 RMSA school in
Thiruvarur district
3 Civil Work 50 lakhs has been
distributed to 2 schools but
the civil work is incomplete
due to insufficient funds

169
At State Level
3(iii). Type of funds /grants allocated by the State to district
S.No. Name of grant allocated No. of districts Month of allocation 1 School Annual Grant No info No info 2 Minor Repair Grant No info No info 3 Civil Work No info No info 4 5 6 7 8 9
10 4. System for drawl and payment of fund from SMDC account –
No. of Schools Cash Cheque Both 0 20 0
% 0% 100% 0% Comments:
5. Sharing of proposal for expenditure and expenditure Statements with community
No. of Schools
Sharing of If yes, details of objections Proposal for expenditure
Expenditure Statements Any objection raised by community about any transaction
Yes No Yes No Yes No 1. 0 20 0 20 0 20 2.
% 0% 100% 0% 100% 0% 100% 3. 4.

170
6. Audit of SMDCs
All SMDCs in State/District are covered by audit 1. Yes 2.No
No. of Schools
Audit carried out YES NO
0 20 % 0% 20%
D.P.O.
No. of Schools
If yes, Audit carried out by Education Deptt. A.G. C.A. Social Audit None
- - - - % - - -
Comments: SMDC audit is not being done on a periodic basis. None of the school has been audited by either education department or AG or CA. Jan Vaachan is
also not happening in any of the school. Social audit has never happened in Thiruvarur district.
7. Social Auditing
Display of financial Information on notice board/wall of the School/office for the purpose of social audit-
No. of Schools
Display of financial information (receipts & payments) and timely entered Yes No
0 20
% 0% 100% D.P.O.
Comments: Social audit is not being done in Thiruvarur district.
2
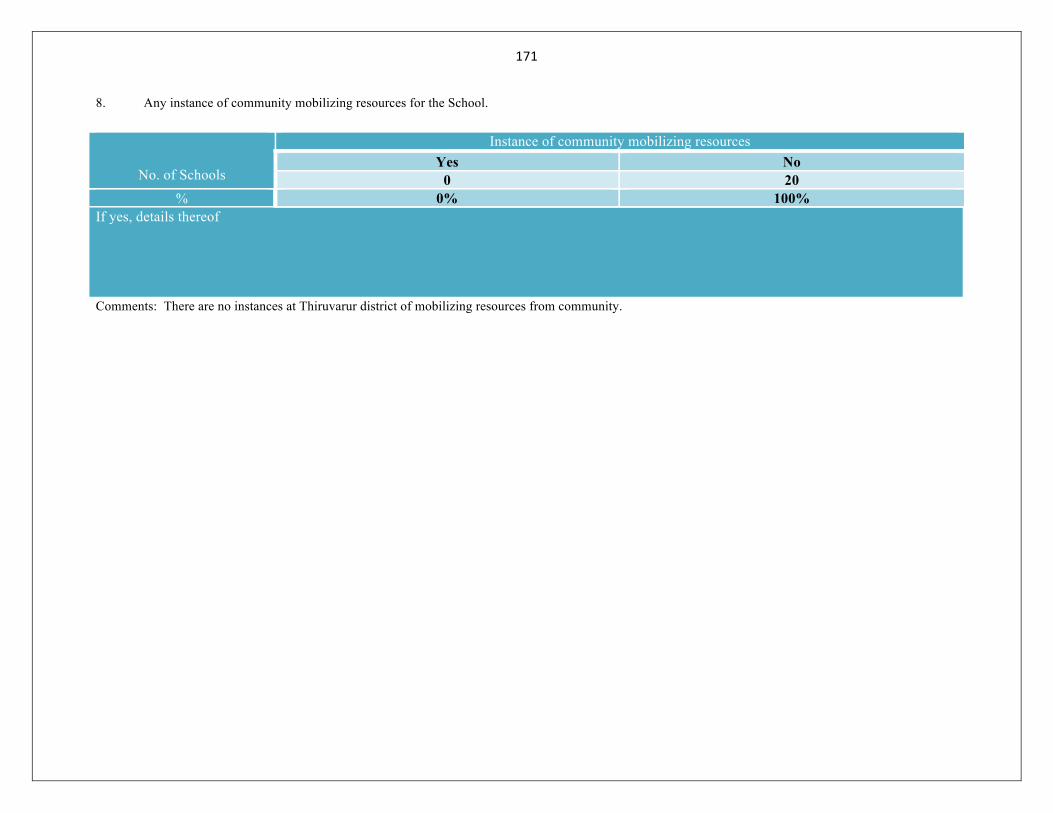
171
8. Any instance of community mobilizing resources for the School.
No. of Schools
Instance of community mobilizing resources Yes No
0 20 % 0% 100%
If yes, details thereof Comments: There are no instances at Thiruvarur district of mobilizing resources from community.

172
9(i). Status of utilization certification and period for which it has been
Submitted from SMDC to DPO
S. No. Name of School Month of submission of
UC
Financial year for which UC is
submitted
1 April, 2014 2013-14
2
3
4
5
9(ii). Status of utilization certificates submitted by SMDCs to DPO (At District Level)
Total No. of Schools
No. of SMDCs from which U.C. is
received
% Period for which U.C. submitted
No. of Schools
No data available

173
9(iii) Status of utilization certificates submitted to SPO from DPOs (from 1st April 2012 to 31st March, 2013) (At State Level)
No. of sampled
DPOs
Name of Funds /Grants
No. of DPOS to
which fund released
Amount of fund
released
Date of release
Amount for which
U.C. received
Amount for which U.C. has not been received
School Annual Grant
Minor repair
work
Major repair
work
Civil work Education Tour Comments: Data not furnished by the State
10. Process of settlement of advance and collection of utilization certificate by SPO and DPO.
(i) Process of settlement of advance and collection of utilization certificate.
--------------------------------------------------------------------------------------------------
--------------------------------------------------------------------------------------------------
(ii) Communication to SMDCs after the settlement of advance has been done by DPO.
1. Yes 2. No
Mode of conveying SMDCs about settlement of advance
11. Financial Statement for SDMC/DPO/SPO (From 1 April 12 to ………….. (date /month of visit).

174
(i)
Name of Unit
A Opening Balance as
on 1st April, 2013
B Funds
received
C=A+B Total Fund available till………
D Expenditure
E=C+D Closing balance including cash in hand as on
……..
Balance in bank
passbook as on
…………… SMDC DPO SPO Comments: Data unavailable.
11 (ii) Detail of expenditure of funds by SMDC in sampled (from 15 April till date) district.
Grant funds S.N
. Name of School SAG Minor Repair Major repair grant Civil work Educational tour
Receipt
Spent
Unspent
balance
Receipt
Spent Unspent
balance
Receipt
Spent
Unspent
balance
Receipt Spent Unspent balance
Receipt
Spent Unspent
balance
1 GHS,KOOTHANUR
50000 50000
0 25000 25000 0 0 0 0
2 GHSS, ERAVANCHERY
50000 50000
0 25000 25000 0 0 0 0
3 GHS,SELLUR
50000 50000
0 25000 25000 0 0 0 0
4 GHS, ATHIKADAI
50000 50000
0 25000 25000 0 0 0 0
5 GHS, MAZHAVARAYANALLUR
50000 50000
0 25000 25000 0 0 0 0
6 GHS ,PALAYAKOTTAI
50000 50000
0 25000 25000 0 0 0 0 5000000
5000000
0
7 ADWHS,SAVALAKARAN
50000 50000
0 25000 25000 0 0 0 0
8 GHSS, IDUMBAVANAM
50000 50000
0 25000 25000 0 0 0 0
9 GHSS, POONTHOTTAM
50000 50000
0 25000 25000 0 0 0 0
10 GHS,SANNANALLUR
50000 50000
0 25000 25000 0 0 0 0
11 GHS, MAPPILAIKUPPAM
50000 50000
0 25000 25000 0 0 0 0 0

175
12 GHS EDAKEELAIYUR
50000 50000
0 25000 25000 0 0 0 0
13 ADWHS ABISEKAKATTALAI
50000 50000
0 25000 25000 0 0 0 0
14 GGHSS THIRUTHURAIPOONDI
50000 50000
0 25000 25000 0 0 0 0
15 GHS , PALAYAVALAM
50000 50000
0 25000 25000 0 0 0 0 5000000
5000000
16 GHS, MANGUDI
50000 50000
0 25000 25000 0 0 0 0
17 GHS, VADAKARAI
50000 50000
0 25000 25000 0 0 0 0
18 ADWHS AMOOR
50000 50000
0 25000 25000 0 0 0 0
19 GHSS,ARITHUVARAMANGALAM
50000 50000
0 25000 25000 0 0 0 0
20 GHS, MUNIYUR
50000 50000
0 25000 25000 0 0 0 0

10. SCHOOL ANNUAL GRANT –
1 (i) Month of receiving School Annual Grant for the financial year 2012-13 in sampled Schools and status of utilization of funds.
S.N. Month of receipt of SAG Number of Schools % 1 No data 20 100 2 3 4 5 Total 2 (i) status of utilization of funds with % and expenditure done as per norms of the scheme- S.N. Name of School Sanctioned
amount Month of
receipt Expenditure till
date % of
expenditure 1 2 3 4 5 2(ii) Status of Utilization of School Annual Grant
Details/No. of Schools
Which were not sanctioned
SAGs
Which were sanctioned but did
not receive SAGs
Which received but did not
spend
2(iii) Utilization of SAG as per norms
SAG funds utilized on works
Number of Schools
%
Funds utilized as per norms in number of Schools
If not utilized as per norms, give reasons
Yes % No % 1. 20 100 20 100 0 1. Comments: data available
11. Minor Repair Grant
1. Receipt of Minor Repair Grant – (For Financial Year 2012-13)
S.N. Name of School Sanctioned amount
Month of receipt
Expenditure till date
% of expenditure
1 2 3 4 Total

177
2(i) Utilization of minor repair grant on repair and white-wash of the School building –
Number of Schools Number % Total No. of Schools who received minor repair grant No 0 Number of Schools utilized the grant on repair and white wash
No 0
Number of Schools who did not utilized fund as per norms No 0 Comments: No data available
2 (ii) Utilization of minor repair grants as per norms
Minor Repair Grant utilized on works
Number of Schools
%
Funds utilized as per norms If not utilized as per norms, give reasons Yes % No %
1. 1. 2. 2. 3. 3. 4. 4. 5. 5. 6. 6. 7. 7. 8. 8. 9. 9. 10. 10 Comments: No split up available

178
12 INNOVATIONS – At SPO/DPO level
In Thiruvarur district, promotion of sports activities is widely seen. The high school students are encouraged to participate in games, competitions and sports. The winners are recognized at the district level and they are given special prizes. Every year in SSLC examination, top 10 SC students are identified at the district level in Thiruvarur and they are honored with special cash prizes.
1. Details of innovative proposals undertaken during the current financial year (At district level)
S. No.
Name of Innovative Proposals Amount of funds sanctioned/released
Stage of Implementation
Comments :
At the district level there are no innovative proposals submitted during the financial year April 2012 to March 2013.
The state project office has recently issued a proposal to all the district level project offices to undertake innovative
projects to monitor and evaluate the effectiveness of scheme. The district CEO assured that innovative proposals
will be undertaken during the next academic year.

179
2. Details of innovative proposals undertaken during the financial year 1st April, 2012 to 31st March, 2013 (At State level)
S. No.
Name of District Name of Innovative Proposals
Amount of funds sanctioned/released
Stage of Implementation
3 (a) If not, the mentions reasons thereof
--------------------------------------------------------------------------------------------------
(b) Effective monitoring and evaluation mechanism for implementation of innovation proposals.
--------------------------------------------------------------------------------------------------
--------------------------------------------------------------------------------------------------
(c) The objectives of innovation proposals being met in districts
(c) At district level
--------------------------------------------------------------------------------------------------
--------------------------------------------------------------------------------------------------
(d) At State Level
--------------------------------------------------------------------------------------------------
--------------------------------------------------------------------------------------------------
(d) Identified any successful elements in innovation proposals, to be scaled up under RMSA
--------------------------------------------------------------------------------------------------
--------------------------------------------------------------------------------------------------
13. INFORMATION ABOUT MMER At DPO and SPO level

180
1(i). The total number of staff sanctioned category wise in DPO under RMSA and the number in position. Thiruvarur District
Name of District________________________________ S. N. Name of Post Sanctioned In position % Vacant %
1 CEO, District Programme Coordinator
1 1 100% 0 0%
2 Assistant District Programme Coordinator (ADPC)
1 1 100% 0 0%
3 Educational District Coordinators (EDCs)
2 2 100% 0 0%
4 Civil Engineers 2 1 50% 1 50% 5 Tally Managers 3 3 100% 0 0% 6 Data Entry Operators 2 2 100% 0 0% 7 Office Assistant (On
special request) 1 1 100% 0 0%
8 9
10 Total 12 12 100% 0 0%
1(ii) the total number of staff sanctioned category wise in SPO under RMSA and the number in position.
S. N. Name of Post Sanctioned In position % Vacant % 1 Project Director 1 1 100% 0 0% 2 JD (Administration) 1 1 100% 0 0%
3 JD (Training) 1 1 100% 0 0% 4 JD (Civil) 1 1 100% 0 0% 5 JD (District level
Coordination 1 1 100% 0 0%
6 Chief Accounts Officer
1 1 100% 0 0%
7 PG Teachers 3 3 100% 0 0% 8 BT level coordinators 2 2 100% 0 0%
9 Superintendents 1 1 100% 0 0% 10 Assistants 2 2 100% 0 0% 11 Tally Managers 1 1 100% 0 0% 12 Data Entry Operators 4 4 100% 0 0%

181
13 Personal Assistants for Director and JD
2 2 100% 0 0%
14 15
Total 21 21 100% 0 0% 1(iii) Action taken to fill up vacancies
There are no vacancies at district level
At district level ……………………………………………………………………………………….
At State level There are no vacancies at state level ………………………………………………………………………….
Comments
2 Personnel working on deputation/contract and their nature of engagement
No. of Personnel on deputation No. of Personnel on contract At DPO SPO At DPO SPO
NIL NIL NIL NIL Nature of engagement
At DPO At SPO At DPO At SPO
Comments:

182
3. Component-wise personnel at State and District level
S.N. Component wise personnel Position in Place Working at State
level Working at district level
1 Finance 2 Civil Work 3 Quality 4 Equity 5 Gender 6 Pedagogy 7 Planning 8 Training
Total 3(i) If component wise personnels are not in place the alternative arrangements made
……………………………………………………..…………………………………………
Comments:
4 If the administrative staff is not in place alternative arrangement adopted
……………………………………………………………………………………………………………….
……………………………………………………………………………………………………………….
Comments:
5 Clarity amongst officials and staff about the objectives, targets and goals of the programme and their role in the management structure.
……………………………………………………………………………………………………………….
Comments:
II. MONITORING STRATEGY
1. (i) Use of monitoring tools/mechanism (reports, visits etc.) to ensure effective implementation of the scheme
………………………………………………….………………………………………
1(ii) Steps taken by DPO & SPO to ensure effective implementation of RMSA
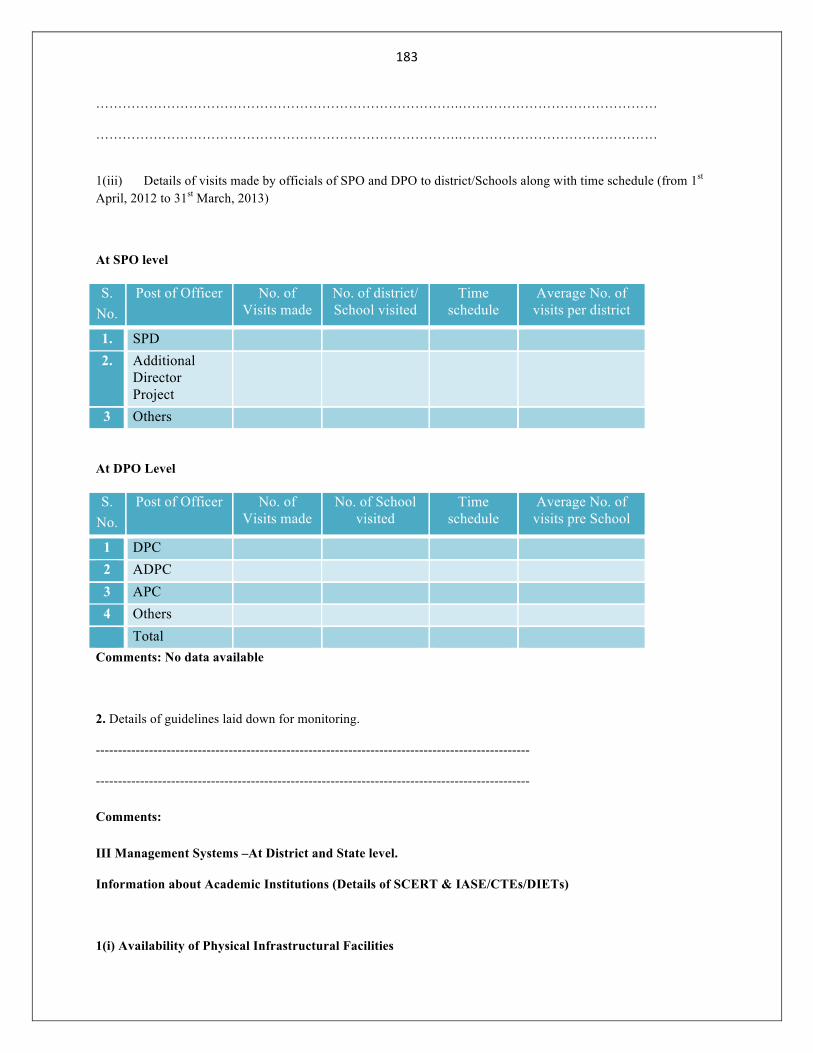
183
……………………………………………………………………….………………………………………
……………………………………………………………………….………………………………………
1(iii) Details of visits made by officials of SPO and DPO to district/Schools along with time schedule (from 1st April, 2012 to 31st March, 2013)
At SPO level
S. No.
Post of Officer No. of Visits made
No. of district/ School visited
Time schedule
Average No. of visits per district
1. SPD 2. Additional
Director Project
3 Others
At DPO Level
S. No.
Post of Officer No. of Visits made
No. of School visited
Time schedule
Average No. of visits pre School
1 DPC 2 ADPC 3 APC 4 Others Total
Comments: No data available
2. Details of guidelines laid down for monitoring.
--------------------------------------------------------------------------------------------------
--------------------------------------------------------------------------------------------------
Comments:
III Management Systems –At District and State level.
Information about Academic Institutions (Details of SCERT & IASE/CTEs/DIETs)
1(i) Availability of Physical Infrastructural Facilities

184
-------------------------------------------------------------------------------------------------- -----------------------------------------
------------------------------------------------------------------------
1(ii) Facilities available in SCERT/SIERT
Staff Sanctioned In position Vacant %
1(iii) Availability of physical Infrastructural Facilities
--------------------------------------------------------------------------------------------------------------------------------------------
------------------------------------------------------------------------------------------------------------------
Comments:
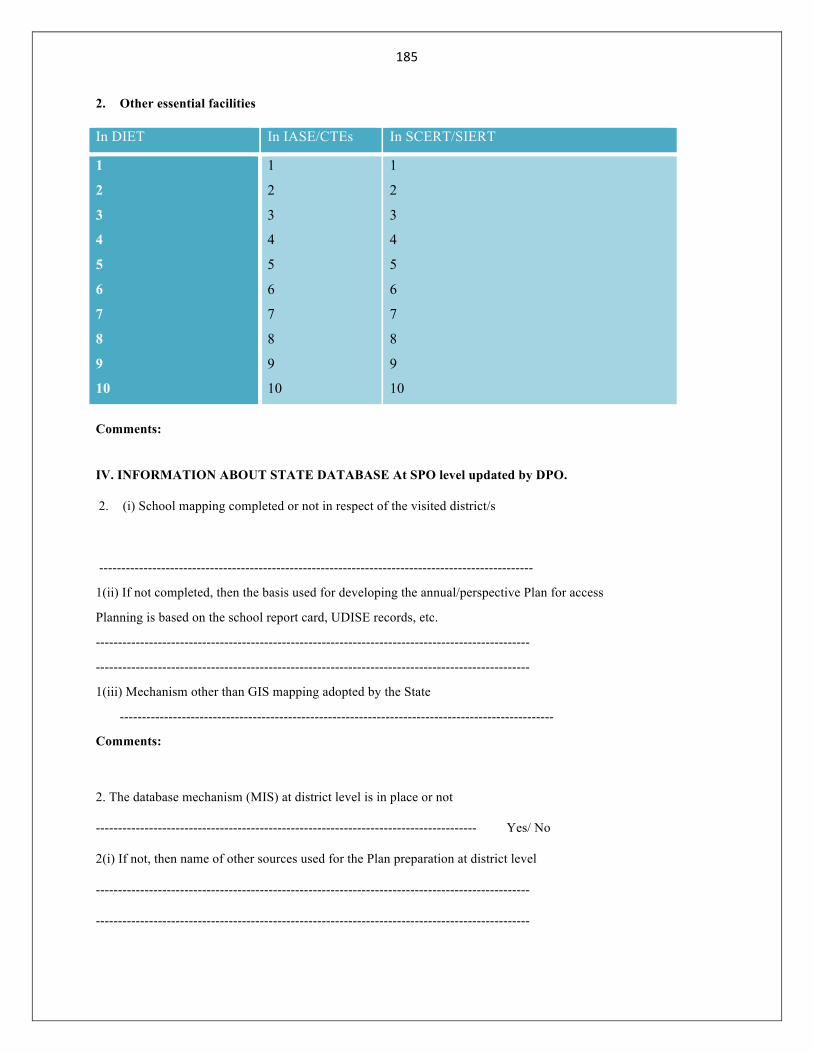
185
2. Other essential facilities
In DIET In IASE/CTEs In SCERT/SIERT
1
2
3
4
5
6
7
8
9
10
1
2
3
4
5
6
7
8
9
10
1
2
3
4
5
6
7
8
9
10
Comments: IV. INFORMATION ABOUT STATE DATABASE At SPO level updated by DPO.
2. (i) School mapping completed or not in respect of the visited district/s
--------------------------------------------------------------------------------------------------
1(ii) If not completed, then the basis used for developing the annual/perspective Plan for access
Planning is based on the school report card, UDISE records, etc.
--------------------------------------------------------------------------------------------------
--------------------------------------------------------------------------------------------------
1(iii) Mechanism other than GIS mapping adopted by the State
--------------------------------------------------------------------------------------------------
Comments:
2. The database mechanism (MIS) at district level is in place or not
-------------------------------------------------------------------------------------- Yes/ No
2(i) If not, then name of other sources used for the Plan preparation at district level
--------------------------------------------------------------------------------------------------
--------------------------------------------------------------------------------------------------

186
Comments:
3. Major issues in collection and compilation of data at district and State level
S. N. District level issues State level issues 1 2 3 4 5 6 7 8
Comments: No major issues V RESEARCH (At district and State level)
There is no detailed information available regarding research at district and state level.
1. Details of research projects undertaken during the year (1st April, 2012 to 31st March, 2013) –
At District Level
S.No. Title of research project Purpose Major findings 1 There is no research and evaluation
carried out at the district level at present.
2
3
4
5
At State Level
S.No. Title of research project Purpose Major findings
1 At state level, MoU has been signed with NUEPA to conduct Annual Plan Action Research on RMSA Implementation in TN. Salem and

187
Theni districts have been taken as pilot district to conduct this research.
2
3
4
5
2. Research Advisory Committee being formed or not
(a) At State level ………………………………………………………………………………………….
(b) At District level ……………………………………………………………………………………….
--------------------------------------------------------------------------------------------------
3. (i) Identification of the kinds of research need was felt and at what level?
--------------------------------------------------------------------------------------------------
--------------------------------------------------------------------------------------------------
4. Action Research is being conducted or not, if yes it is conducted by the teachers or external agencies for finding out solutions to users pertaining to pedagogy and quality –
--------------------------------------------------------------------------------------- Yes/No
--------------------------------------------------------------------------------------------------
4(i) If Yes, Details of action research carried out at district level –
Areas of research
Problem No. of Action Research
conducted in district
Solution Conducted by (Teachers /external agencies)
Pedagogy

188
Quality
4(ii) If Yes, Details of action research carried out at State level –
Areas of research
Problem No. of Action Research
conducted in district
Solution Conducted by (Teachers /external agencies)
Pedagogy
Quality
14. Any other issues relevant to RMSA implementation
MI may give a maximum 2 page note, on any other issues, relevant to RMSA implementation, not covered above.

189
DISTRICT NAGAPATTINAM

190
MONITORING OF RMSA IMPLEMENTATION IN NAGAPATTINAM DISTRICT
1. Planning & Implementation –
At School Level
1. Perspective Plan for the School –
No. of Schools
Plan developed Not developed Yes No 20 0
% 100% 0% If not reasons thereof Comments: Perspective plan has been developed in 100% schools in Nagapattinam district. The perspective plan is
being submitted to the district RMSA office every year. There is a standard format used by all the schools
throughout the district to prepare the perspective plan. The school development plan includes demographic profile of
the area, data regarding nearby schools (including private and aided schools), children at school going age, school
mapping information, etc. The achievements of the school are also included in the perspective plan report.
2. Data base/sources adopted/taken for Planning and Plan preparation at School level other than SEMIS
No. of Schools
Other Data base/sourced adopted If yes names of other sources Yes No
0 20 - % 0% 100%
Comments: In most of the schools, SEMIS data is the only source for planning and plan preparation at the school
level, for some information they are using Census data. The Village Education Records (VER), School Mapping
information are also being used in the perspective plan report.
3. Whether disadvantaged groups have been appropriately factored in the Plan.
No. of Schools
Developed Planning strategy for disadvantaged groups
Yes No
8 12
% 40% 60%
If not reasons thereof
The planning strategy is common to all the students and not specific for disadvantaged groups. In the Perspective plan reports of few schools they have mentioned a statement that there are plans for disadvantaged groups. But there are no specific development plans conceived or mentioned in the plan document.

191
No. of Schools
Convergence approach adopted Yes No 20 0
% 100% 0% Convergence Approach Convergence not adopted
S. No.
Departments No. of Schools
% Reasons thereof
1 Water & Sanitation 20 100% There is no tribal community in Nagapattinam district. There is no direct involvement of Rural and Urban development departments in school development. However, these departments work at the habitation level which indirectly contributes for school development. There is no coordination with PWD for any projects at the school level
2 Social Welfare 18 90% 3 Tribal Development 0 0% 4 Minority Department 6 30% 5 Rural Development 1 5% Urban Development 0 0% 6 Health, Medical and
Family welfare 20 100%
7 Electricity department 20 100% 8 Transport (Roadways) 20 100% 9 Public Works Department 0 0% Problem areas of restructuring on convergence and coordination
Comments: The convergence and coordination with other departments are not made consciously but water and
sanitation department for water needs, social welfare for mid day meal and scholarships, health department for
health check ups, electricity department for EB connections, transport department for free bus pass for students. In
this way, these departments
5. Incorporation of SMDC recommendations in the School Development Plan
No. of Schools
School Development Plan Prepared Recommendations incorporated in School Development Plan
Yes No Yes No
20 0 20 0
% 100% 0% 100% 0%
If not reasons thereof If not reasons thereof
Recommendations given by the SMDC for school development plan.
Comments: There are recommendations documented in minutes of the weekly meeting conducted by SMDC.
10. Roles assigned to the SMDCs for implementing the scheme and to seek help & cooperation in ensuring the execution of following in sampled Schools :

192
S. No Roles Responses regarding assigning roles (No. of Schools)
%
1 Filling of DCF of U-DISE 20 100% 2 Preparation & Implementation of Annual Plan 20 100% 3 Admission of Students to Class-9 0 0% 4 Regular attendance and retention of students 0 0% 5 Regularity & Punctuality in teachers’
attendance 20 100%
6 Civil work 20 100% 7 Providing resources Physical 0 0%
Human 0 0% 8 Organizing cultural, sports events, functions 20 100% 9 Mid-day-meal 20 100%
10 Preparing annual accounts of income & expenditure of SMDC
20 100%
11 Any other 0 0% Comments: In all the 20 schools filling of DCF of U-DISE has been assigned and also preparation and
implementation of Annual Plan. The SMDCs were not assigned any role with respect to Admission of students to
Class – 9, Monitoring regular attendance and retention of students, providing resources, etc. The SMDC is involved
in Civil work in all 20 schools, organizing cultural, sports, events and functions, Mid day meal to some extent and
preparation of annual accounts of income and expenditure.
In case of civil work, the newly upgraded schools are not getting the maintenance grant.
11. Clarity amongst SMDC members about their roles. If yes, detail of steps taken by them accordingly.
No. of Schools
SMDC members are clear about their roles Not clear
20 0 % 100% 0%
S.N. Steps taken by SMDC members accordingly Number of
Schools %
1 Ensuring education facility to dropout Students 11 55% 2 Making society aware of child rights & duties of teachers& parents 0 0% 3 Organizing parents teachers meetings, distribution of report card and
reviewing C.W./H.W. 0 0%
4 Keeping check on private tuitions by teachers, paying attention to academic progress of students
0 0%
5 Identification of CWSN & taking care of availability of facilities to CWSN students
3 15%
6 Paying attention to improvement in regular teaching learning activities. 20 100% 7 Distribution of free text books 20 100% 8 Availability of scholarships on time to students 20 100% 9 Preparing three years’ perspective Plan 20 100%
10 Proper use of funds i.e. SAG & other grants as per norms 0 0%

193
11 Monitoring of minor & major repair work and maintenance of physical infrastructure
0 0%
12 Seeking knowledge and information about income and expenditure of SMDC and supervising the accounts thereof.
20 100%
Comments: In almost all the schools SMDC members have clarity on their roles and responsibilities. Though there
are no steps taken by SMDC members with respect to Ensuring education facility to dropout students, Making
society aware of child rights & duties of teachers & parents, organizing parents teachers meeting, distribution of
report cards and reviewing of CW and HW, keeping check on private tuitions by teachers and paying attention to
academic progress of students.
In most of the schools, SMDC involved in distribution of free text books, availability of scholarships on time to
students , Seeking knowledge and information about income and expenditure of SMDC and supervising the
accounts.
Reasons of ignorance of SMDC members regarding their roles: There is no ignorance of SMDC members but
not involved in activities. There lacks commitment of SMDC members on specific roles and activities.
8.1 Meetings of General Body of School Management and Development Committee-
Meetings of General body held
Number of Schools
Quarterly Half Yearly Annually No meeting held till date
2 18 0 0 % 10% 90% 0% 0%
Comments: The meetings of general body of school management and development committee have been held half
yearly in all the schools except two schools. In these schools, civil work had been done and hence SMDC meeting
conducted quarterly in Nagapattinam district.
8.2 Reasons for not holding last meetings and whether the same has been recorded –
Comments:
Nagapattinam 2. At District level – Name of District ………………………………………………………….
1. District level Plan has been prepared or not. Yes………………………………………………………………………………………………………………. 2(a) Whether District Plan adopted a convergence approach with following department.
(1. Yes 2. No)

194
u. Water & Sanitation
v. Social Welfare
w. Tribal Development
x. Minority department
y. Rural Development
z. Urban Development
aa. Medical Health & Family
bb. welfare
cc. PWD
dd. Transportation (Roadways)
Comments: As per the information provided by the CEO, they have adopted a convergence approach with other
departments such as water and sanitation, social welfare, health department and transportation.
2(b) any problem areas of restructuring on convergence and co-ordination
There are no problems mentioned by the district officials in areas of restructuring on convergence and coordination.
Comments
3. Methods adopted for regular monitoring of Perspective Plan and AWP&B
There is no clear method adopted for regular monitoring of Perspective Plan and AWP &B The school HM holds the responsibility to monitor the perspective plan. The RMSA officials often make Visit to schools to monitor the activities. _____________________________________________________________________________
At State level
1. Involvement of State Level Planning team in the preparation and finalization of District Level Plans1. Yes 2. No
4. Does the State Plan reflect the Planning needs at School and District Level?
Partially it reflects the planning needs.
3. Regular monitoring of Planning & implementation of the programme at State level, if not reasons thereof.
The SPD office conducts monthly review meetings to review the monitoring status of all districts.
ADPCs (Assistant District Programme Coordinators) from all the districts attend this review meeting
1
2
0
1
2
2
1
1
2
-
2

195
at the state office to update the status of monitoring conducted at the district level. The DPCs, ADPCs,
Coordinators at the district level have shared the responsibility of monitoring the RMSA
implementation by visiting the schools in person.
---------------------------------------------------------------------------------------------------------------------
Comments
4. Any separate strategies for naxalite/extremist affected districts prepared at the State/district level in consultation with the district authority?
2 1. Yes 2. No
If not, why? There are no naxalite/extremist affected districts.
2. ACCESS
I. Physical Access – At School and Habitation’s
1. Names Category of the Schools visited
S.N. Categories Number of Schools % 1 EBB 2 10% 2 Urban 2 10% 3 CWSN (Minimum 3 CWSN) 3 15% 4 Higher Gender gap 3 15% 5 SC/ST/Minority students abundance 4 20% 6 Low retention rate/Higher dropout rate 0 0% 7 Schools situated in habitation with large number of OoSC 2 10% 8 Low academic achievements 2 10% 9 Schools situated in habitation of seasonal migrants 0 0%
10 Urban Schools with most students of deprived sections 0 0% 11 Forest/Mountain/Remote/Desert area 0 0% 12 Flood/natural calamity prone area 0 0% 13 Ongoing civil work 2 10% 14 School with girls hostel 0 0% 15 None 0 0%
Comments: *List of name of Schools is attached
The schools were selected in almost all the categories except few of the above mentioned list. There were two
Economically Backward Blocks (EBB) denoted in Nagapattinam district. They were two schools from urban area, 3
schools with minimum 3 CWSN (15%), 4 schools with higher proportion of SC/ST/Minority students (20%), 2
schools situated in with large number of out of school children (10%), 2 schools with low academic achievements
(10%), 2 schools with ongoing civil work (10%).
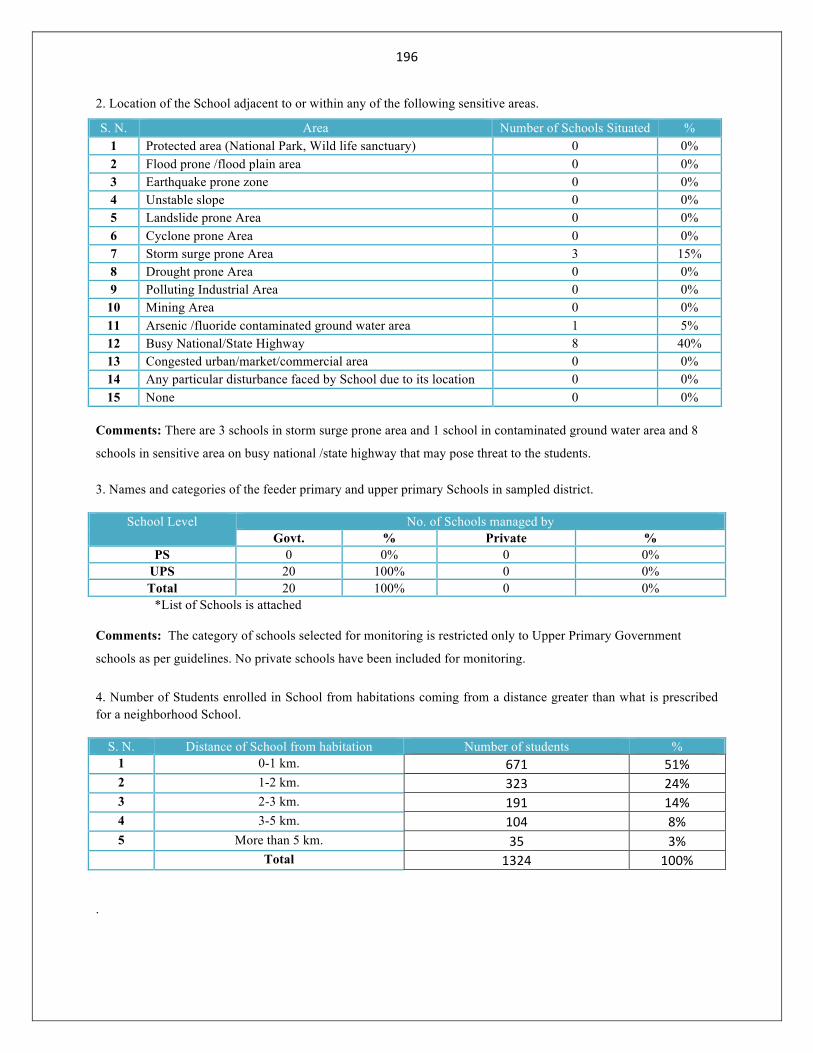
196
2. Location of the School adjacent to or within any of the following sensitive areas.
S. N. Area Number of Schools Situated % 1 Protected area (National Park, Wild life sanctuary) 0 0% 2 Flood prone /flood plain area 0 0% 3 Earthquake prone zone 0 0% 4 Unstable slope 0 0% 5 Landslide prone Area 0 0% 6 Cyclone prone Area 0 0% 7 Storm surge prone Area 3 15% 8 Drought prone Area 0 0% 9 Polluting Industrial Area 0 0%
10 Mining Area 0 0% 11 Arsenic /fluoride contaminated ground water area 1 5% 12 Busy National/State Highway 8 40% 13 Congested urban/market/commercial area 0 0% 14 Any particular disturbance faced by School due to its location 0 0% 15 None 0 0%
Comments: There are 3 schools in storm surge prone area and 1 school in contaminated ground water area and 8
schools in sensitive area on busy national /state highway that may pose threat to the students.
3. Names and categories of the feeder primary and upper primary Schools in sampled district.
School Level No. of Schools managed by Govt. % Private %
PS 0 0% 0 0% UPS 20 100% 0 0% Total 20 100% 0 0%
*List of Schools is attached
Comments: The category of schools selected for monitoring is restricted only to Upper Primary Government
schools as per guidelines. No private schools have been included for monitoring.
4. Number of Students enrolled in School from habitations coming from a distance greater than what is prescribed for a neighborhood School.
S. N. Distance of School from habitation Number of students % 1 0-1 km. 671 51% 2 1-2 km. 323 24% 3 2-3 km. 191 14% 4 3-5 km. 104 8% 5 More than 5 km. 35 3%
Total 1324 100% .

197
Comments: 13. In the total survey of 20 schools in Nagapattinam district, most of the children have access to upper primary
schools. There were 671 students (51%) reside within 0-1 km distance, 323 children (24% ) from the distance of
1-2 km, 191 children (14%) from 2-3 km distance, 104 students (8%) from 3-5 km distance. 35 students (3%)
come from distance more than 5 km.
14. The students commute to school in public transport and Tamil Nadu government has provided with free bus
pass.
15. The students depend only on public transport and there is no other mode of transport available or affordable for
children.
5. Presence of any natural or man-made barrier that poses any problem for the Students in accessing the School.
No. of Schools
Yes No
0 20 % 0% 100%
If yes mention them
Comments: There was no major man-made or natural barriers in Nagapattinam district.
6. Name and Distance of the nearest secondary School (Govt. /Pvt.) from the habitation the School is located
at, and catchment area of the School.
Distance from School/Catchment area Total
No. of Schools Less than 1 km. 1-3 km. 3-5 km. More than 5 km.
0 10 4 6 20 % 0% 50% 20% 30% 100%
*List of Schools is attached
Comments: From the sampled schools, there are no schools having the proximity of reaching Higher secondary
school at a distance within 1 km, 10 schools can access secondary school at a distance of 1-3 km (50%) where as 4
schools are situated with the nearest higher secondary school at a distance of 3-5 km. 6 schools have their nearest
secondary school at a distance more than 5 km.

198
7.Any special arrangement like transportation facility or residential facility made available for the benefit of
students.
Facility Provided by number of Schools %
Transport facility 0 0% Residential facility 0 0%
Comments: Students are commuting to school in public transport only and they are distributed with free travel bus
pass. No other special arrangement like transportation facility or residential facility made available for
students.
II Social Access
1. Pattern of population of the habitation and enrollment in the School –
1. (A) Social category-wise population of Students of age group 14-16 years in the habitation.
Population Pattern of Habitation
Category 14-16 Age
Boys % Girls % Total %
SC
ST
Minority
General
Total
*There is no data available with the school or at the district office.
1. (b) If data of category-wise population of Students of age group 14-16 years is not available then approximation of families of various categories residing in habitation of Schools -
Category No. of Schools responded % SC 5 25% ST 0 0%
Minority 3 15% General 2 10%
All Categories 10 50%
Comments: The SMDC members and the school HM agreed in 5 schools (25%) that there are SC children in
abundance and they live with poor economic condition. There are minority children in 3 schools (15%) in
Nagapattinam district.

199
(c ) Share of SC,ST, Minority, and BPL families’ Girls-boys in enrollment is proportionate to their share in population of the habitation/neighborhood or not.
No. of Schools
Proportionate yes no 20 0
% 100% 0%
If not, reasons thereof ………………………………………………………………………
Comments:
.(a) Class wise, Social Category wise *B-Boy, G-Girl, E-enrolled, P-present
Group IX X Total
SC Boys Enrolled 373 333 706 Boys Present 328 295 623 Girls Enrolled 250 238 488 Girls Present 192 198 390 Total Enrolled 623 571 1194 Total Present 520 493 1013
ST Boys Enrolled 4 0 4 Boys Present 3 0 3 Girls Enrolled 2 0 2 Girls Present 2 0 2
Total Enrolled 6 0 Total Present 5 0 5
Minority Boys Enrolled 8 17 25 Boys Present 6 13 19 Girls Enrolled 18 15 33 Girls Present 12 10 22 Total Enrolled 26 32 58 Total Present 18 23 41
Gen & Others Boys Enrolled 522 580 1102 Boys Present 498 545 1043 Girls Enrolled 272 332 604 Girls Present 258 301 559 Total Enrolled 794 912 1706 Total Present 756 846 1602
Total Boys Enrolled 915 947 1862 Boys Present 835 853 1688

200
Girls Enrolled 814 917 1731 Girls Present 724 810 1534 Total Enrolled 1729 1864 3593 Total Present 1559 1663 3222
CWSN Boys Enrolled 6 2 8 Boys Present 6 2 0 Girls Enrolled 2 0 0 Girls Present 2 0 2 Total Enrolled 8 2 0 Total Present 8 2 0
2(b) *Enrollment and attendance of students of economically backward background on the day of field visit
(based on BPL Card)
Data not available
2 (c) Any major variations in the pattern of attendance in respect of SC, ST, Minority, Girl Students and Students from BPL background and reasons thereof
Whether above schemes ensure convergence with provisions of RMSA?
1. Yes 2. No
Comments:
4. Any overt or covert, manifest or subtle discrimination against Students of any social group or community
by the teachers or peers is observed in School, and the efforts made to minimize it.
No. of Schools
Discrimination No discrimination By teachers By peers
No discriminatory practices seen inside the school campus however it exists in the community
No such practices seen
100%
Comments: There are no discriminatory practices seen inside the school premises however during discussion with
the community they shared discrimination exist in the community.
2

201
Efforts made to minimize discrimination
There are no discriminatory practices seen inside the school campus anywhere in Nagapattinam district.
5. Do the overall conditions prevalent in Schools facilitating access of CWSN to secondary Schools. If not,
the details of obstructions and barriers.
Number of Schools providing following facilities for access of CWSN –
Facility Number of Schools %
Proper ramps with hand rail 20 100%
Western toilet seat 3 15%
Special furniture in classroom 0 0%
Tricycle 0 0%
Escort 0 0%
Other (Specify)
In all the 20 schools (100%) visited by the MI, there were proper ramps with hand rails. The western toilet was found only in 3 schools out of 20 (15%). There was no special furniture provided in the class room for the CWSN to sit. There are no other facilities available in any of the high schools for CWSN.
III. Open Schooling
Open Schooling System does not prevailing in the state of Tamil Nadu.
3. At State level
1. Whether the State open School is established at the State level? 1. Yes 2. No
2. Whether the State open School has its own district regional centers and study centers?
1. Yes 2. No
3(a) Admission and Re-admission procedure in the State open School.
________________________________________________________________________
(b) Examination & assessment pattern.
________________________________________________________________________

202
(c) Student support services.
________________________________________________________________________
Comments:
4. Advocacy programme for out of School Students for bringing them back to the School
_____________________________________________________________________________________________
_________________________________________________________
Comments:
5. Methods for identification of the number of out of School Students in the State (household survey etc.)
_____________________________________________________________________________________________
______________________________________________________________
Comments:
6. Identification procedure of out of School Students.
_____________________________________________________________________________________________
______________________________________________________________
Comments:
IV. Out of School Students (OoSC)/Dropout Students of Age Group 14-16 years. (At School level)
7. The number, gender and category-wise (SC/ST/Minorities/CWSN) profile of out of School Students
(OoSC)/Dropout Students of age group 14-16 years in preceding session (2012-13).
OoSC Drop out age group of 14-16 years - Nagapattinam District
Category Class Enrolled Boys
Boys drop out
% Enrolled Girls
Girls drop out
% Total Enrolled
Total Drop Out
%
SC IX 116 15 13% 99 13 13% 215 28 13%
SC X 120 18 15% 78 12 28% 198 30 15%
ST IX 0 0 0% 1 1 100% 1 1 100%
ST X 0 0 0% 0 0 0% 0 0 0%
Minority IX 30 3 10% 5 1 20% 35 4 11%
Minority X 23 4 17% 12 4 33% 35 8 23%

203
Gen & OBC
IX 89 8 9% 46 5 11% 135 13 10%
Gen & OBC
X 76 10 13% 58 4 7% 134 14 10%
Total IX 235 26 11% 151 20 13% 386 46 12%
Total X 219 32 15% 148 30 20% 367 62 14%
CWSN IX 19 4 21% 1 1 100% 20 5 25%
CWSN X 9 2 22% 0 0 0% 9 2 22%
8. The separate number of CWSN is included in all categories.
Name of category with higher dropout
The SC community drop outs comprise 13% in class IX and 20% in class X. Minority drop out rate comes to 11% in
class IX and 15% in class X. In total, there are 12% drop outs in class IX and 14% in class X.
Gender with higher dropout
In Gender perspective, dropout rate of boys looks to be little high when compared to Girls 10% of boys and 4% of
Girls are drop outs in class IX. 11% of Boys and 13% of Girls are drop outs in class X.
Class with higher dropout
The dropout rate is 12% in class IX and 14% in class X.
0
50
100
150
200
250
SC -‐ IX SC -‐ X ST -‐ IX ST -‐ X Minority-‐ IX
Minority -‐ X
Gen & OBC-‐ IX
Gen & OBC -‐ X
Total Enrolled 215 198 1 0 35 35 135 134
Total Drop Out 28 30 1 0 4 8 13 14
Axis Title
OoSC Drop out age group of 14-‐16 years -‐ Nagapa@nam District

204
Reasons for dropout
• Economic condition
• Child labor
• Poor health condition
2(a) Efforts being made by School management to bring them back to School and, results thereof during the past one year.
Efforts made –
There are no personal efforts made by the school management to bring them back to School. In certain cases, the community identifies the drop outs and takes effort to enroll the children in school
Class-9 Class-10
No. of drop
out students
No. of drop out
brought back to
School
% No. of drop
out students
No.of drop out brought
back to School
%
46 0 0% 52 0 0%
Comments: In class 9 the total number of school dropout is 46 and in class 10 it is 52. None of the drop out students
was brought back to school.
3. Arrangements made to hold back Students of seasonal migrant families in School.
Arrangement Number of Schools %
Seasonal Hostels 0 0%
Any other arrangement 0 0%
No arrangement 20 100%
Comments: There are no special arrangements made at the school level to hold back the students of seasonal migrant
families. The students who migrate also do not inform the school management before leaving the school. This is one
of the major hindrance for the school to trace the school drop outs.
4. If no such arrangement made, whether migration/transfer certificate is issued to such Students by the Schools?
No. of Schools issuing TC
No. of schools Yes No
0 20
% 0% 100%

205
Comments: In Nagapattinam district no schools have issued Transfer Certificate to the students who migrate. The
schools respond that they couldn’t find out the students who have dropped out. Most of them are seasonal migrants
and no information could be retrieved.
5. Information about any special training interventions meant for the OosC.
No. of Schools
Special trainings started Yes No 0 20
% 0% 100% Name of Trainings
1
2
5(a) Number of enrolled and present students in training programme on the day of visit
Boys Girls Total Enrolled Nil Nil Nil Present Nil Nil Nil
% Nil Nil Nil 5 (b) Training programme is imparted through –
Total No. of School conducting training
Trainers No. of School %
Regular teachers 0 0
NIOS 0 0 SIOS 0 0
(c ) Average duration of training programme in days and achievement level of students (on the basis of School
record)
Class Enrolled in Training
Programme
Appeared in Exam
Achievement level Above 60% 45-59% 33-44%
B G B G B G B G B G 9
10 Total
% Comments: There is no training programme conducted for out of school children

206
3. Equity
I. General Information
At School Level
Category-wise profile of attendance and achievement of students category-wise (SC/ST/Minority/CWSN)
Profiling of attendance and achievement (School result) of School Students in the age group of 14-16 years.
2011-‐12 2012-‐13 2013-‐14
Enrollment and Attendance on day of visit
SC ST MINO. CWSN SC ST MINO. CWSN SC ST MINO. CWSN
B G B G B G B G B G B G B G B G B G B G B G B G
Enrolled for 9th
110
100
2 1 30
5 19
1 115
101
0 1 28
6 12
2 116
99 0 1 30
5 19 1
Avg. % of Attend.
96%
89%
99%
94%
90%
91%
92%
90%
96%
89%
0%
0%
90%
94%
91%
100%
96%
89%
0 0% 90%
94%
91%
100%
Appeared in Exam
106
89
2 1 26
3 16
1 107
88
0 0 21
5 8 2 109
84 0 0 22
4 15 1
% 96%
89%
100%
100%
87%
60%
84%
100%
93%
87%
0%
0%
75%
83%
67%
100%
94%
85%
0%
0% 73%
80%
79%
100%
Above 60%
49
54
0 0 11
1 5 0 42
54
0 0 9 3 4 1 39
60 0 0 12
2 6 1
% 46%
61%
0%
0%
42%
33%
31%
0%
39%
61%
0%
0%
43%
60%
50%
50%
36%
43%
0%
0% 50%
47%
0%
0%
Below 60%
57
35
2 1 15
2 11
1 65
34
0 0 12
2 4 1 70
24 0 0 10
2 9 0
% 54%
39%
100%
100%
58%
67%
69%
100%
61%
39%
0%
0%
57%
40%
50%
50%
64%
57%
0%
0% 50%
53%
100%
100%
Enrolled for 10 th
134
86
0 0 32
13
8 3 117
82
0 0 32
15
8 2 120
78 0 0 23
12 9 2
Avg. % Attend.
94%
89%
0 0 92%
89%
93%
91%
94%
89%
0%
0%
90%
88%
91%
96%
94%
89%
0 0 90%
88%
91%
96%
Appeared in Exam
122
77
0 0 30
12
7 2 109
79
0 0 26
9 6 2 117
75 0 0 19
8 7 2
% 91%
96%
0%
0%
83%
67%
78%
100%
93%
96%
0%
0%
81%
60%
75%
100%
98%
96%
0%
0% 83%
67%
78%
100%

207
Above 60%
94
68
0 0 14
9 2 1 79
46
0 0 18
3 2 1 68
66 0 0 6 4 3 1
% 77%
88%
0%
0%
47%
75%
29%
50%
72%
58%
0%
0%
69%
33%
33%
50%
58%
88%
0%
0% 32%
50%
43%
50%
Below 60%
28
9 0 0 16
3 5 1 30
33
0 0 8 6 4 1 49
9 0 0 13
4 4 1
% 23%
12%
0%
0%
53%
25%
71%
50%
28%
42%
0%
0%
31%
67%
67%
50%
42%
12%
0%
0% 68%
50%
57%
50%
Details of specific schemes available in the State for ensuring enrollment of special category Students along with
the assistance provided there under?
There are no specific schemes available in the State for special category students other than one mentioned below.
Name of schemes
Name of schemes
SC
(2. Girls’ Incentive Scheme
2. To prevent drop outs of SC girl students, the IX th standard unmarried SC girls of
age, less than 16 years are provided with a fixed deposit certificate for Rs. 3000
2.
3.
ST
4. 1. Girls’ Incentive Scheme
To prevent drop outs of ST girl students, the IXth standard unmarried ST girls
of age, less than 16 years are provided with a fixed deposit certificate for Rs.
3000
4.

208
Name of schemes
Name of schemes
Category-wise (SC/ST/Minority/CWSN) dropout students in past one year i.e .2012-13
II. Girls Education:
At School/DPO and SPO level
Gender Gap
1. Gender gap in enrollment, attendance, learning achievement and reasons thereof.
Enrollment, Attendance, Achievement level
Class 9 Class 10
Class Boys % Girls % Total Gap % Boys % Girls % Total Gap %
Enrollment 165 61% 106 39% 271 642 152 62% 92 38% 244 605
Attendance on visit day 162 62% 99 38% 261 149 62% 90 38% 239 -‐
Appeared in Exam 146 62% 89 38% 235 610 143 63% 85 37% 228 594
Learning Achievement
(Quarterly/half yearly/yearly)
Above 60% 57 48% 63 53% 120 -‐ -‐ 77 52% 71 48% 148 -‐ -‐
% 39% 71% -‐ 51% -‐ -‐ 54% -‐ 84% -‐ 65% -‐ -‐
Below 60% 89 26 -‐ 115 -‐ -‐ 66 60% 14 80 -‐ -‐
% 61% 29% 49% 46% 16% 35%
Gender gap = (GX1000/B) G=No. of Girls B=No. of Boys
Minority 1. There are no schemes available in Tamil Nadu government specific to Minority community
2.
Girls
1.
2
3.
CWSN
1. 2. 3.
4. 5. 6.
7. 8. 9.

209
Reasons for gaps in enrollment (if)
Reasons Respondent /districts %
a Socio Cultural/Reasons 0%
b Economic Reasons 100%
c Linguistic Reasons 0 0%
Total -
There is no specific reason highlighted by any teachers or head mistress for the gap in achievement level of boys and
girls. It was stated as a general opinion that the impact of poor economic status reflects more on Girl children. The
Girl children also support the parents in house hold activities and also they were given lesser priority in terms of
education when compared to boys. During the discussion the teachers expressed these views regarding education of
girl children.
Reasons for absenteeism (Gap in attendance)
Reasons Respondents (School/district)
%
A Health (own or family members) 0 0%
B Social cultural issues 0 0%
C Sibling Care 0 0%
D Household responsibilities 0 0%
E Family issues / Gone to relatives 0 0%
F Earning for livelihood 14 70%
G Migration 6 30
H Any other 0 0%
Total 20 100%
Comments: The major reasons for absenteeism are earning for livelihood where as 70% of drop out is due to this
factor, next being the migration factor while 30% have left schools.
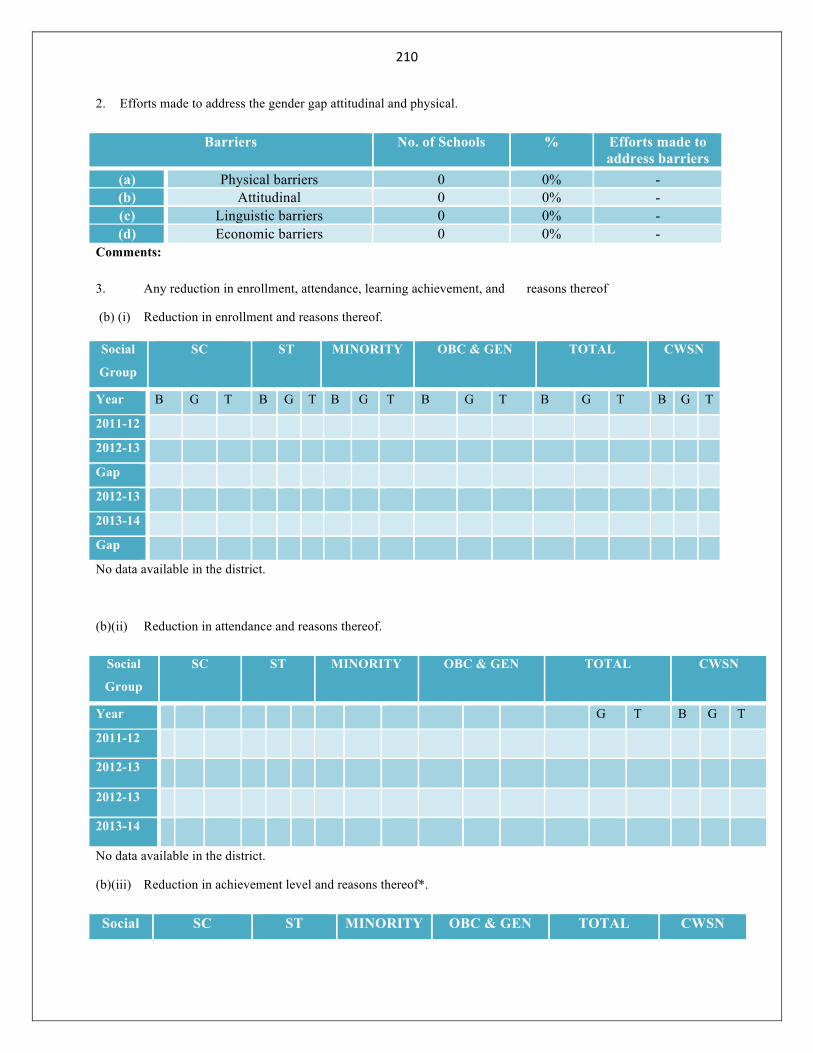
210
2. Efforts made to address the gender gap attitudinal and physical.
Barriers No. of Schools % Efforts made to address barriers
(a) Physical barriers 0 0% - (b) Attitudinal 0 0% - (c) Linguistic barriers 0 0% - (d) Economic barriers 0 0% -
Comments:
3. Any reduction in enrollment, attendance, learning achievement, and reasons thereof
(b) (i) Reduction in enrollment and reasons thereof.
Social
Group
SC ST MINORITY OBC & GEN TOTAL CWSN
Year B G T B G T B G T B G T B G T B G T
2011-12
2012-13
Gap
2012-13
2013-14
Gap
No data available in the district.
(b)(ii) Reduction in attendance and reasons thereof.
Social
Group
SC ST MINORITY OBC & GEN TOTAL CWSN
Year G T B G T
2011-12
2012-13
2012-13
2013-14
No data available in the district.
(b)(iii) Reduction in achievement level and reasons thereof*.
Social SC ST MINORITY OBC & GEN TOTAL CWSN

211
Group
Year B G T B G T B G T B G T B G T B G T
2011-12
2012-13
2012-13
2013-14
No data available in the district.
Comments: There is no data available in the district with regard to reduction in enrollment, attendance and
achievement levels. There are no special efforts made in case of gender gap.
5. Any efforts being made for the counseling of parents to handle the problem of girls. If not why?
No. of Schools
Counseling of parents done Yes No
0 20 % 0% 100%
Comments: No, there is no counseling cell constituted in Nagapattinam district.
6. Impact of separate hostel and other physical facilities and availability of security on enrollment, attendance
and learning achievement of girls.
vii. Number of Schools having facility of separate girls’ hostel in campus or in nearby area.
viii. Number of girls residing in girls’ hostel in sample Schools.
ix. Any physical barrier faced by hostellers in their access to School
______________________________________________________________________________
0
0

212
4. Guidance and Counseling
There is no Guidance and Counseling Cell constituted in any of the schools visited in Nagapattinam district.
At School level:
9. Guidance and Counseling Cell been constituted by the School or not. If yes, the available student counselor
ratio:
No. of Schools
Guidance & Counselling Cell Constituted Yes No
0 20 % 0% 100%
Total 0 100
SCR: Student Counselor Ratio

213
Comments: The Guidance and Counseling cell has not been constituted in any of the schools visited by MI in
Nagapattinam district. The HMs reported that they had been given one day training on guidance and counseling cell.
However, the teachers are not professionally trained to counsel the children.
10. Number of Students being assisted by the cell.
Total Enrollment of Class IX, X in sampled Schools in
district
No. of students assisted by the Cell in total sampled Schools in district
%
- - -
Comments: There is no active counseling assistance happening in the government schools of Nagapattinam district.
The schools are not properly equipped and there is no professional training given to the teachers to handle
counseling for students.
3. The frequent problem areas of the students for which guidance and counseling is being sought.
S.No. Problem areas Responses % 1 Selection of optional subjects after sec. 2 To opt scout/guide/NCC 3 In choosing career 4 Seeking information about entrance exams
to various professional streams
No data available

214
5. Quality
III. Enabling Conditions : At School level
Availability of following enabling conditions
S. Physical Aspects Total Number of rooms
Number of equipped rooms
%
No. 1 Natural light 200 200 100% 2 Ventilation 200 200 100% 3 Black Board appropriately located in
classroom 200 198 99%
4 Bulb/Tube light /CFL 200 200 100% 5 Fan 200 198 98% 6 Teaching aids 200 150 75%
Comments: Natural light is available in 100% rooms of 20 sampled schools, like wise ventilation exists in 100%
rooms. Blackboards are appropriately located in 99% rooms. Availability of bulbs/tube lights/CFL exists in 100%
rooms in sampled 20 schools. Fan is available in 98% rooms. The teaching aids are available in 75% schools.
The physical aspects are at the satisfactory level in almost all the schools.
1(b) Availability & workability of following material/equipments –
S. No.
Name of Material/Equipment Availability in Number of Schools
Functional in Number of Schools
Number % Number % 1 Teaching aids 20 100% 15 75% 2 Desk-chairs/stools for students (Adequate) 20 100% 20 100% 3 Integrated science lab with equipments and
material 20 100% 0
4 Math kit 20 100% 0 0% 5 Science kit 20 100% 0 0% 6 Computer lab with computers and supportive
devices and internet connection 20 100% 20 100%
7 Art and Craft room 0 0% 0 0% 8 Library with age appropriate books and seating
arrangement 5 20% 4 80%
9 TV 20 100% 5 20% 10 Separate Activity room for girls 0 0% 0 0% 11 Audio Equipments 0 0% 0 0% 12 Video Equipments 0 0% 0 0% 13 LCD Projector 0 0% 0 0% 14 Overhead projector 0 0% 0 0% 15 Purified/ Safe Drinking Water 20 100% 20 100% 16 Fire Extinguisher 20 100% 20 100% 17 Auditorium 0 0% 0 0% 18 Staff room 20 100% 20 100%

215
19 Indoor games room 0 0% 0% 0% 20 N.S.S./NCC/Scout & Guides room 21 Counselor room 0 0% 0 0% 22 First-aid room 0 0% 0 0%
Comments:
2. The number of days, the School functioned during the last academic year? Give reasons for the closure, if
any of the School remains closed for long gaps during last year. Suggestions to avoid repetition of such instances
• No. of Schools remained closed
• Average No. of days, School(s) remained closed in last year
An average of 154 days closed in Nagapattinam district including Saturdays, Sundays and Government
holidays.
• Reasons for the closure
1. Additional days of closure in Nagapattinam district are due to cyclone.
0
210 days

216
2.
3.
Comments:
3. Number of teachers present in the School (Male & Female, vacancies against sanctioned posts.(In total sampled Schools in district)
Sanctioned Posts (subject-wise)
Number of teachers placed
Total % Number of teachers present in School on
visit day
Vacancies against
sanctioned posts
%
M F M F
152 68 75 143 97% 65 72 9 6% Comments:
The total number of teachers for class 9th and 10th placed in 20 schools comes to 143 against 152 sanctioned posts,
the number of posts lying vacant is 9 (6%). 96% teachers were found present on the day of field visit across 20
schools.
11. In case of teacher’s vacancy, the alternative arrangements being made by the head of the institution to complete
the course curriculum.
Comments: The course curriculum is completed through available teachers as they take additional classes. Extra
classes are also taken during Saturdays and on other public holidays in the schools where they have teacher
vacancies.
5. Availability of teachers for each class and for teaching science, mathematics and language.
Number of Schools
Sufficient teachers available to teach Science Math Language
20 20 20 % 100% 100% 100%
Comments: There are sufficient teachers available to teach subjects like Science, Math and Language in
Nagapattinam district.
6. Number of teachers possessing professional training qualifications (subject-wise) as mandated and number of untrained teachers.
No. of School
No. of trained teachers No. of untrained teachers in sampled Schools
20 0 0 % 100% 0% 0
Comments: All the teachers are possessing professional training qualifications subject wise in sampled schools.

217
7. Practice of truancy, i.e. absenteeism/class bunking by students/teachers being reported in the School, if so,
the reasons thereof, steps taken by the School management to curb the practice.
Class bunking/Truancy % No. of Schools
Yes No Student 0 0 0%
Teachers 0 0 0% Comments: No such instance had been documented or happening in any of the visited schools. The teachers are
attending the school regularly.
8. Policy of teacher recruitment, deployment, training, remuneration and career advancement (At State
level)
Tamil Nadu Teacher Eligibility Test (TET) conducted by Teacher Recruitment Board (TRB) for the recruitment of
teachers for Tamil Nadu Government Schools; they conduct Teachers Eligibility Test for the selection of teachers
for Class I to XII.
II. Teaching Learning Process
1. Maintenance of teacher’s diary including curriculum delivery and lesson Plan etc. by teachers &
countersigned by the Head of the institution regularly.
No. of Schools
Teachers diary maintained Counter sign
Yes No Yes No
20 0 20 0
% 100% 0% 100% 0%
Observation & Comments

218
The Teacher’s diary is maintained in all the 20 schools and the HM makes countersign every week.
2. Availability of timetable prescribed by the School and followed by the teachers.
No. of Schools
Prescribed time table available Time table followed by teachers Yes No Yes No 20 0 20 0
% 100% 0% 100% 0% Comments: There is a prescribed time table available in all the 20 schools and time table is being followed by all
the teachers without fail. It is being verified by the HM frequently in Nagapattinam district.
3. Are discussions and group team works encouraged as a methodology of teaching for involvement of
Students/students in teaching learning process?
No. of School
Discussion and group team work encouraged Yes No 20 0
% 100% 0%

219
Comments: In case of class IX and X, there is no discussion are group team works encouraged in the class room
activities. The teachers justify that they have a tight schedule to complete the syllabus for each term and there is no
time slot for conducting group discussions or team work.
5. a-c Classroom management with reference to seating arrangement of Students.
No. of Schools
Students made to sit in small groups
Students of disadvantaged groups
and Students with disabilities sit
separately or on back benches
Students have role in classroom management
Yes No Yes No Yes No 0 20 0 20 20 0
% 0% 100% 0% 100% 100% 0% Groups
made of Different
Same class
No. of Schools
0 20
% 0% 100% Comments: In case of class IX and X, there are no such activities for the students to sit in small groups. The
students who belong to same class are seated as a group and no groups from different age groups are made to sit
together. No disadvantaged groups are treated indifferently and disabled children are not made to sit separately or on
back benches. They are treated equally in the class room.
5. on site academic support by resource teachers in year 2012-13
Average frequency of visits of resource teachers /Schools
Average time spent by resource teacher/School
Nature of support provided
4. Resource teachers are appointed for 3 months in case if there are slow learners in the school 5. Resource teachers extend their support only to class 9 and not for class 10 6.
Comments: A periodical visit of resource teacher is required both class 9 and 10 since the slow learners if
monitored closely and supported there will be more changes. It needs consideration.
6. Special Teaching for Learning Enhancement:-
Number of Schools, which arranged zero periods, extra classes etc. for academically weaker students –

220
No. of Schools who arranged zero period, extra class
Yes No 20 0
% 100% 0% Extra classes ran
Throughout year Only for one month before exam 20 % 100%
Average days of zero period in a weak
Results thereof 5. Students are showing interest in learning the subject in out of classroom sessions 6. Improvement in the exam scores 7.
Comments:
7. Method/s of Assessment & Evaluation being followed in the School/classroom.
Method/s Response % Continuous and Comprehensive Assessment
Good 100%
Comments: The teachers are encouraged to use Continuous and Comprehensive Assessment method, however they
fell there is no proper training provided to teachers in evaluating the students.
8. Participation level of the CWSN in classroom processes and efforts made to optimize it.
No. of Schools with CWSN % 5 25%
Participation level in class All CWSN participate actively 5 100% Few CWSN participate 0 0% No participation 0 0%
Efforts made to optimize participation of CWSN in class 1 There are no efforts made to optimize participation in class IX and X. But the Primary level CWSN are
handled by resource teachers often. The same teachers extend their support to these high school children. There is no separate staff appointed for Upper primary.
2 3 4
Comments: In all the 5 schools, the CWSN participate actively. They feel very normal and there is no teasing or
bullying by peers.

221
9. Nature of peer interaction with CWSN.
Peer Interaction Number of Schools % Neutral 5 100% Taunting 0 0% Teasing 0 0% Bullying 0 0% Comments: There is no taunting teasing or bullying by peers in any of the schools where CWSN is present. The
children are neutral and the children also support CWSN in educational and other activities.
10. Individualized Educational Plan (IEPs) prepared for CWSN.
No. of Schools with CWSN
5
IEP
Prepared Not prepared
0 6
% 0 100%
Comments: IEP is available in the school only for the classes I to VIII and not available for classes IX and X.
11. Availability of adequate facilities for seating CWSN –
%
Total No. of sampled Schools
No. of Schools with CWSN in samples
20 5 100% 25%
No. of
Schools
No. of Schools with CWSN seating facilities Yes No
0 5 % 0% 100%
Comments: There are no special seating facilities arranged for CWSN in any of the 5 schools.

222
12. Extent and nature of use of ICT devices for teaching and learning of the CWSN.
Equipments
No. of Schools having Facilities
No. of Schools with CWSN having these facilities
No. of Schools making use of ICT
%
LCD Projector 0 0 0 0% Overhead projector 0 0 0 0% Computer & Accessories with net connection
0 0 0 0%
Others 0 0 0 0%
Comments:
There are no ICT devices used for teaching and learning of CWSN in any of the school at high school level. The
computer lab is used only by the higher secondary classes 11th and 12th in case if the students have opted for
computer science as their elective subject.
The teachers were also not trained on handling ICT devices. The class rooms are not properly equipped with ICT
devices for class 9 and 10 in Nagapattinam district.
III. Teachers’ Training
1. Provisions for Training of Teachers
S. No.
Provisions for In-service training Schedule Duration
1 Induction training (Science, Maths, English, `Social Science, Hindi & Sanskrit)
For newly recruited teachers
10 days training programme based on NCF. 2005, content, pedagogy and classroom activities.
2 In-service training –need based 5 days’ training programme in workshop mode in Maths, English, Social Science and Science
From July to December (50% of existing teachers from each district to be covered)
5 days
3 Orientation programme for Head Master/ Principal
As per SPO calendar 3 days
4 Training for newly recruited Head Masters As per SPO calendar 10 days 5 Management training for Head Masters/
Principals From Aug. to January 14 days
6 Workshop for Development of different modules for training
As per SPO calendar 10 days
7 Training of Resource Persons for H.M.’s training
As per SPO calendar
8 Block head-quarters and girls hostels As per SPO calendar 2 hrs. daily after School for 15 days
9 Development and Life skills for girls As per SPO calendar 5 days 10 Sensitization programme (legal (literacy
workshop) As per SPO calendar 1 days

223
1(a) Targeted annual Plan prepared by the State for in-service teachers’ training to improve quality and skills – Yes
Comments: The above table gives the information about the training provided to the teachers under RMSA as per
the SPO calendar.
2. Inclusion of trainings for dealing with CWSN, in training programme
Details of in-service training in subjects received by teachers -
No. of Schools whose teachers received training under RMSA
% S.No. Subjects Number of teachers,
received training under RMSA
Average teachers per School who received training
Average Duration
1 Science 14 0 7 days 2 Maths 10 0 7 days 3 English 12 0 7 days 4 Social Science 8 0 7 days 5 Sanskrit 0 0 0 6 Hindi 0 0 0
Total 0 0 0 Inclusion of training
to deal with CWSN 0 0 0
Comments:
There is very few teachers received training under RMSA in Nagapattinam district. 14 teachers have received
training in Science subject, 10 teachers in Maths, 12 teachers in English and 8 teachers in social science subject.
Almost all the training had lasted for 7 days. There was no training session conducted for Inclusion of CWSN.
2 (i)
Need of various trainings expressed by teachers S.
No. Name of Training Number of Schools
expressed the need Frequency Duration
1 Subject based training 20 Annual 4 days 2 Orientation Programme 20 Annual 5 days 3 Innovations’ training 20 Annual 5 days 4 Training for Development of life
skills 20 Annual 5 days
5 Computer training 20 Annual 11 days 6 Scout Masters’ training 0 Annual 7 Disaster Management Training 0 Annual 11 days 8 CWSN 0 9 Any other (mention) - - -

224
Comments: In almost all the sampled schools, teachers expressed that they are in need of periodical subject based
training, various orientation programmes, Innovations training, training for development of life skills and computer
training.
8. Impact of training on the confidence level of the teacher in handling a class with CWSN :
There had been no training provided to teachers on handling CWSN. In most of the cases, the CWSN who complete
VIIIth standard do not continue their education further. It could be due to several reasons but at the school level
there is no special effort taken by the management to continue the education of CWSN. The number vastly reduced
in migration of VIII to IX th standard.
4. Physical availability of adequate and good quality facilities for in-service training with reference to – Facilities Adequate % Inadequate %
Space 20 100% 0 0% Projection 20 100% 0 0% Tools/Modules 20 100% 0 0% Equipments (LCD, Projector, Computer etc.)
20 100% 0 0%
5. Whether training modules are need based or not?
No. of Schools Yes No
20 0
% 100% 0%
Comments:
6. Impact: Use of new technologies like Computer Assisted Learning (CAL), LCD Projector etc. for
imparting lessons in the classroom by teachers.
Total No. of teachers received training No. of teachers using CAL, LCD, etc. teaching
%
44 0 0%
Comments: 44 teachers had been given training on using CAL, LCD, etc. But, there are no teachers in 9th and 10th
standard use Computer Aided teaching in Nagapattinam District. There is a computer lab available in all the schools.
CAL centers are used by Primary students and higher secondary children only if they have opted for computer
science as elective subject.
7. Trainers/Resource persons from following institutions who imparted trainings –
N = (No. of Schools) whose teachers received training from RMSA

225
S.No. Institutes Number of Respondents % of respondents
1 Secondary Schools 1 5% 2 Higher Secondary Schools 0 3 DIET 1 5% 4 College/University 0 5 SIERT 0 6 IASE 0 7 CTE 0 8 NIC 0 9 Any other institution (mention) 0
10 Total 2 Comments: In almost all the schools teachers have been provided with training on various subjects under RMSA.
The resource persons/trainers are from secondary schools, higher secondary schools, DIET and few training sessions
were conducted by college / university professors.
The secondary grade teachers are not given teachers’ training. The higher secondary teachers and sometimes HMs give the training. Very rarely DIET staff conducts the training.
2. There are no sufficient practical sessions conducted for computer training. The teachers are not getting hands on experience to use computers and devices.
8. Any other issue related with teachers’ training of secondary education.
1. ------------no----------------------------------------------------------------------------------
2. ------------no----------------------------------------------------------------------------------
3. ------------no----------------------------------------------------------------------------------
6. CIVIL WORKS
In Nagapattinam district, 2 schools had civil work.
S.N. Name of School Year of establishment Year of construction Remarks 1 Agaraperunthottam 2009-10 2012-13 Completed 2 Vellapallam Meenavar
Colony 2009-10 2014 On-going
3. Availability of class rooms for Class IX & X (Std. Size 20’x24’)
Class Sections Available no. of rooms % Deficit % 9 2 2 100% 0 0%
10 2 2 100% 0 0% *List of sampled Schools with deficit of classrooms is attached

226
Comments: There are two sections in each class 9th and 10th and available number of rooms are 2 for each class.
There is no deficit of class rooms in any of the schools in Nagapattinam district.
4. Area of the School
No. of Schools having
School Campus School Building Open Space Play Ground Other
20 20 18 0
% 100% 100% 90% 0% Total area (sq.ft)of sampled Schools
5000sq. ft each school
No data No data No data
Avg. (sq.ft) Area 5000 sq.ft No data No data No data II. Design
1. Type of Building –
No. of Schools
Pucca Semi Pucca Kutcha Rented 20 0 0 0
% 100% 0% 0% 0% List of Schools with specified details is attached
Comments: All the 20 schools in Nagapattinam district are running in a pucca school building. However, most of the
class rooms belong to primary or higher secondary classes. Though the schools are upgraded by RMSA they do not
have class rooms allocated for upper primary. There is no separate fund released for construction of class rooms in
many schools except the two schools where civil work is at finishing stage.
2. Physical Condition of building -
No. of Schools
Cracks Damp Seepages Damages in Plaster
None
0 0 0 0 0 % 0% 0% 0% 0% 0%
List of Schools with physical condition of building attached
Comments: There are no damages, cracks, damp, and seepages in any of the school building.
3. Any local innovative approaches in School building design
Yes % No %
No. of Schools 0 0% 2
Kind of Innovation No such innovative practices witnessed by the monitoring team
Comments:
4. Availability of Natural Light & Cross ventilation; if not, reasons thereof, and the steps taken by School authorities to rectify it.

227
No. of Schools
Natural light
Cross ventilation If no, Reasons Steps taken to rectifies
Yes No Yes No 1. 2. 3. 4. 5. 6.
20 0 20 0
% 100% 0% 100% 0%
Comments:
5. Lighting Facility in Classrooms
No. of Schools
Arrangement of lighting facility Yes No 20 0
% 100% 0%
No. of Schools
Functional Not functional Yes No 18 2
% 0% 0% If not functioned, Reasons
1. The lighting is dysfunctional due to construction activities.
2.
3. 4.
Steps taken 1.
2.
3. 4.
Supply of electricity
No. of Schools
Continuous Intermittent
20 0
% 100% 0%
Average duration of availability
Comments:

228
6. Availability and usability of following provision of alternative electric power supply -
Generator Inverter Gobar Gas
Plant
Solar Panels
Wind Electricity
Other
No. of Schools Availability 0 0 0 0 0 0
% 0% 0% 0% 0% 0% 0%
No. of School In working condition
Nil Nil Nil Nil Nil Nil
% Nil Nil Nil Nil Nil Nil
No. of School Usability Nil Nil Nil Nil Nil Nil
% Nil Nil Nil Nil Nil NiL
Comments: There is no alternative electric power supply in any of the schools in Nagapattinam district.
7. (a-b) Library Design - Availability of the Following -
No. of Schools
Sufficient Seating
Space
Proper Light Ventilation Regular Pest Control
Yes No Yes No Yes No Yes No
0 20 0 20 0 20 0 2
% 0% 100% 0% 100% 0% 100% 0% 100%
Comments: There is no proper library setting available in any of the schools. The books are found in cupboard and
the children are not encouraged to read books. It will be good if there is a separate period allocated in the time table
for Library hour. The books are not being read by the children in Nagapattinam
8. (a-d) Laboratory Design
Laboratory Number of Schools (a) Adequate space for Physics, Chemistry,
Biology and other subjects Yes % No % 20 100% 0 0%
(b) Proper height (3 ft.) of Lab. Table 20 100% 0 0% (c) (i) Cross Ventilation 20 100% 0 0%
(ii) Exhaust Fan 20 100% 0 0% (d) Availability of Running Water 20 100% 0 0%

229
The construction of laboratory has not been completed in two of the schools. The availability of running water was
available in 100% schools. The laboratory though available in the higher secondary schools it is not being used by
upper primary children. The lab is used only XIth standard students and occasionally by class X students.
The lab materials are also supplied every year with the same quantity irrespective of the left over materials. The
RMSA district office makes the payment for lab materials directly to the private company that supplies lab
resources. The materials are supplied to all the schools. So, the materials are kept unused in most of the schools as
there is overstock and non-usage. This issue has to be addressed by the district RMSA officials.

230
9. Facilities for Physically Challenged:
(a) Availability of Ramps to access the following
S.No. Ramps to Number of Schools Yes % No %
(i) Entrance of School 20 100% 0 0% (ii) Drinking Water Facility 20 100% 0 0% (iii) Toilet Facility 15 75% 5 25% (iv) Science lab 0 0% 20 100% (v) Computer Lab 0 0% 20 100% (vi) Mathematic Lab 0 0% 20 100% (vii) Library 0 0% 20 100% (viii) Auditorium - - - - (ix) Play Ground - - - -
Comments: The ramps are available only at the school entrance and in front of few class rooms. There are no ramps available for the above mentioned places. However, these places are approachable by physically challenged students. There is no separate library building available in most of the schools.

231
(b) Availability of benches of different height in classrooms –
Bench Availability
Number of Schools
Yes No
0 20 % 0% 100%
There are benches available in schools but not of different height in classrooms.
(c) Ramp’s Condition
Comments: The ramp has been constructed under SSA scheme and not under RMSA scheme. All the schools had
ramp facility. In few schools there are no handrails available.
10. Drinking Water Facility
(a) Source of drinking water
Source Number of Schools %
Supply water Panchayat / Corporation Water 100%
Tube well 20 100%
Dug Well 0 0%
Hand Pump 1 5%
Other -
No source 0 0%
Availability of sufficient water across all the seasons
No. of Schools Water Available
Yes No
Number of Schools with ramps
Adequate Slope
Yes No
20 0
% 100% 0%
Hand rails available 19 95%
% 100% 100%

232
20 0 % 100% 0%
Comments: There are water resources available in all the 20 schools. The water is supplied by Panchayat or Municipality. The water is stored in a syntax container and used across.
(b) Water Storage Facility & its condition & cleaning schedule
Type of Facility
No. of
Schools
Condition Cleaning Schedule
No. of Schools
%
Good &
Usable
Damaged not usable
Weekly
Open Tank 0 0 0 Fortnightly 0 0
% Monthly 20 100%
Covered tank 0 0 0 Six Monthly
% 0 0% 0% Not Definite
ground tank 0 0 0 % 0%
Overhead tank 20 0 0 % 100% 0% 0% 95%
(c) Quality of drinking water
No. of Schools
Quality
Satisfactory Not satisfactory
20 0
% 100% 0%
(i) Measures taken by Schools authority to ensure clean drinking water -
Number of Schools
Aqua guard R/o Water Filter Other None 02 0 5 0 0
% 10% 0% 25% 0% 0% (ii) Measures adopted for treatment & testing of water –
Number of Schools with treatment of
water
Bleaching Powder
Chlorine Alum Powder
None Testing of water done
Yes No
0 3 0 0 0 20
% 0% 15% 0% 0% 0% 100%
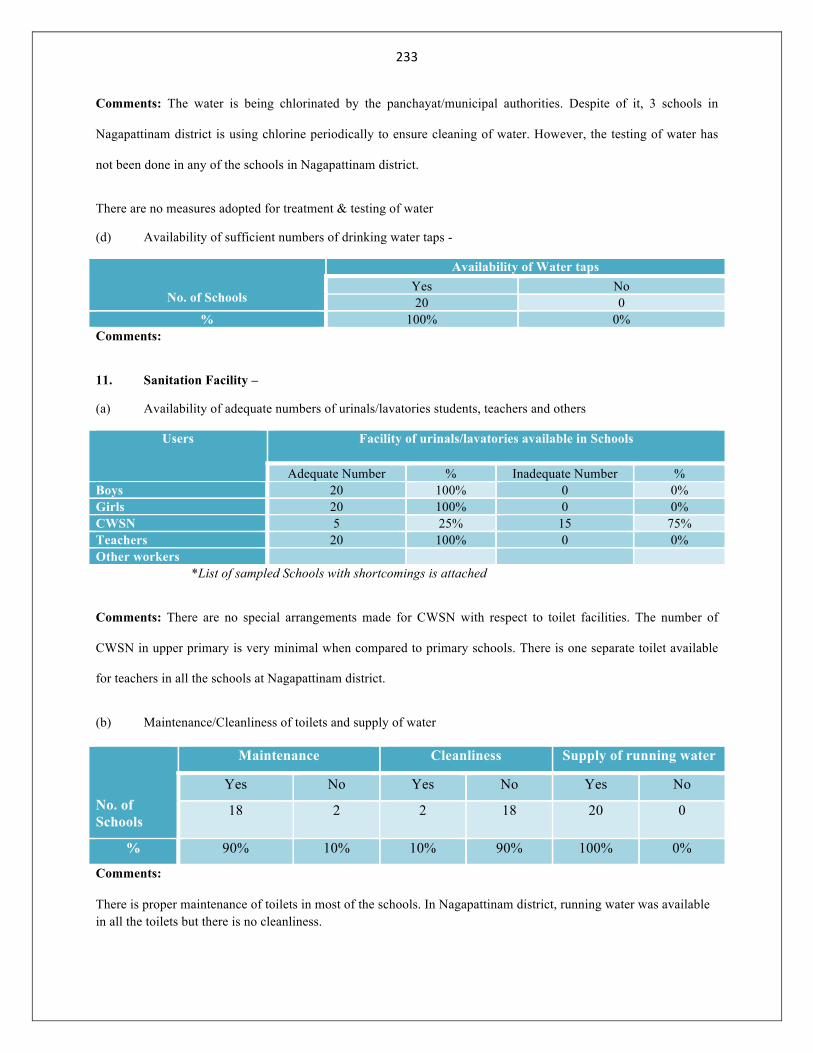
233
Comments: The water is being chlorinated by the panchayat/municipal authorities. Despite of it, 3 schools in
Nagapattinam district is using chlorine periodically to ensure cleaning of water. However, the testing of water has
not been done in any of the schools in Nagapattinam district.
There are no measures adopted for treatment & testing of water
(d) Availability of sufficient numbers of drinking water taps -
No. of Schools
Availability of Water taps Yes No 20 0
% 100% 0% Comments:
11. Sanitation Facility –
(a) Availability of adequate numbers of urinals/lavatories students, teachers and others
Users Facility of urinals/lavatories available in Schools
Adequate Number % Inadequate Number % Boys 20 100% 0 0% Girls 20 100% 0 0% CWSN 5 25% 15 75% Teachers 20 100% 0 0% Other workers *List of sampled Schools with shortcomings is attached
Comments: There are no special arrangements made for CWSN with respect to toilet facilities. The number of
CWSN in upper primary is very minimal when compared to primary schools. There is one separate toilet available
for teachers in all the schools at Nagapattinam district.
(b) Maintenance/Cleanliness of toilets and supply of water
No. of Schools
Maintenance Cleanliness Supply of running water
Yes No Yes No Yes No
18 2 2 18 20 0
% 90% 10% 10% 90% 100% 0%
Comments:
There is proper maintenance of toilets in most of the schools. In Nagapattinam district, running water was available in all the toilets but there is no cleanliness.

234
(c) Availability of Separate Toilets for Girls –
No. of Schools
Separate toilet availability Yes No 20 0
% 100% 0% Safer location of Girls’ toilets
No. of Schools
Yes No 20 0
% 100% 0%
Availability of Napkins & Dustbins
No. of Schools
Sanitary Napkins Dustbins Yes No Yes No
0 20 0 20 % 0% 100% 0% 100%
Comments: Napkins & Dustbins are not available in any of the schools in Nagapattinam district, but having only at
upper primary level and there is no these facility for high school level due to no separate building for high school
(d) Provision in toilets for physically challenged students -
No. of Schools
Availability of Provision Yes No
7 13 % 35% 65%
(e) Lavatories’ single pits/double pits attached with septic tank and cleaning of septic tank
No. of Schools
Connectivity of lavatories with Single Pit/Double Pit Lavatories with Septic Tank
Regular cleaning of septic tank
Yes No Yes No 20 0 20 0
% 100% 0% 100% 0% Comments:
There is no any vacancy for scavenger at high school level but they have vacancy at school level not filled by
government
12. Drainage System
(a-c) Availability of drainage facility
No. of Schools
Drainage System available Yes No 20 0
% 100% 0% Type of Drains
Under ground Pucca Covered
Pucca & Open
Kutcha & Open
No. of 20 0 0 0 0

235
Schools % 100% 0% 0% 0% 0%
Structural Condition
Good Bad Damaged Regular Cleaning of drains done in Schools
No. of Schools
20 0 0 0
% 100% 0% 0% 0% Any instance of Water Logging
No. of Schools
Yes No 0 20
% 0% 100% No. of Schools
If, yes, location of Water Logging Wrecked Drains
Entrance Gate
Open Space
Playground Near Toilets
Outside Classrooms/Lab/Lib/Kitchen
0 0 0 0 0 0 0 % 0% 0% 0% 0% 0% 0% 0%
Comments: There is no instance of water logging in any of the schools.

236
13. (a-c) Waste Water treatment/discharge/disposal of solid waste
No. of Schools
Waste Water Treatment & Discharge Arrangement Yes No
0 20 % 0% 100%
No. of Schools
If yes, Type of drainage system Septic Tank Municipal
drain Open field Any other
0 0 0 0 20 % 0% 0% 0% 0% 100%
No. of Schools
Availability of waste Collection facility Yes No
0 20 % 0% 100%
No. of Schools
If yes, Adequate No. of dustbins Yes No
0 20 % 0% 100%
No. of Schools
If yes, Condition of dustbins Usable Not usable
0 20 % 0% 0%
No. of Schools
Availability of facility for treatment of waste Yes No
0 20 % 0% 100%
No. of Schools
Facility for composting of organic waste Yes No
0 20 % 0% 100%
Comments:
There is no waste water treatment/discharge /disposal of solid waste management in any of the schools.
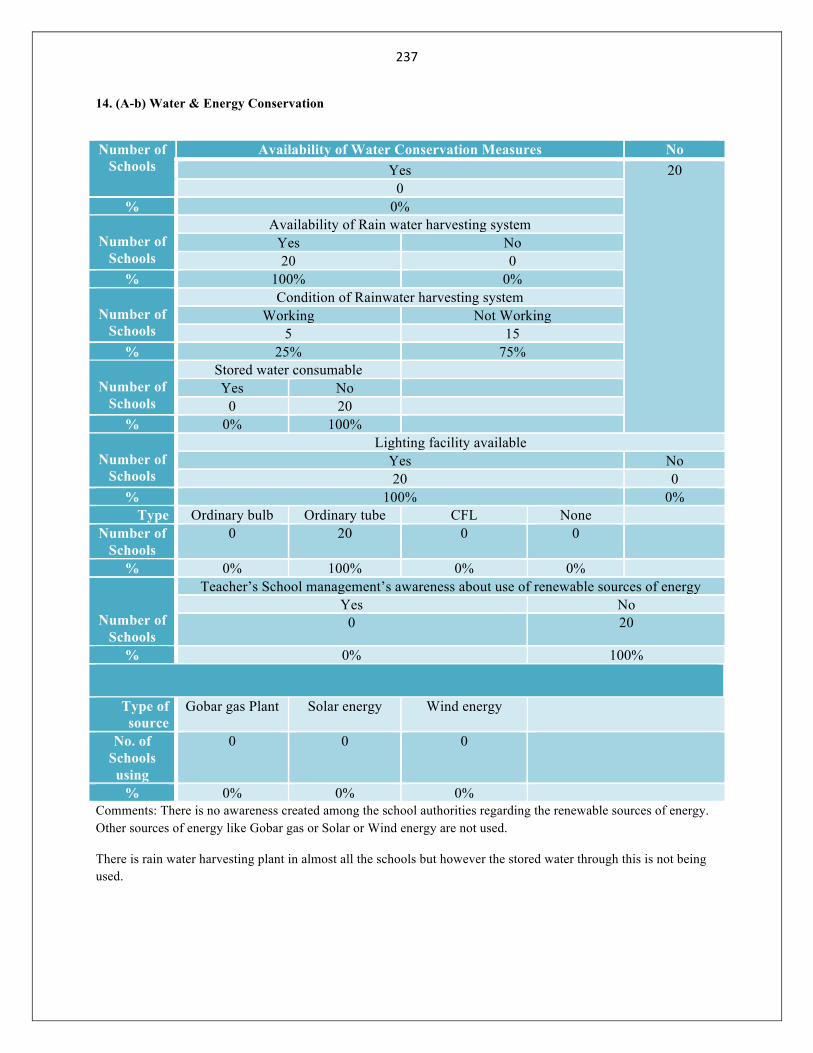
237
14. (A-b) Water & Energy Conservation
Number of Schools
Availability of Water Conservation Measures No Yes 20
0 % 0%
Number of
Schools
Availability of Rain water harvesting system Yes No 20 0
% 100% 0%
Number of Schools
Condition of Rainwater harvesting system Working Not Working
5 15 % 25% 75%
Number of
Schools
Stored water consumable Yes No
0 20 % 0% 100%
Number of
Schools
Lighting facility available Yes No 20 0
% 100% 0% Type Ordinary bulb Ordinary tube CFL None
Number of Schools
0 20 0 0
% 0% 100% 0% 0%
Number of Schools
Teacher’s School management’s awareness about use of renewable sources of energy Yes No
0 20
% 0% 100%
Type of source
Gobar gas Plant Solar energy Wind energy
No. of Schools using
0 0 0
% 0% 0% 0% Comments: There is no awareness created among the school authorities regarding the renewable sources of energy. Other sources of energy like Gobar gas or Solar or Wind energy are not used.
There is rain water harvesting plant in almost all the schools but however the stored water through this is not being used.

238
15. (i) (a-b) Safety aspect of Building Design
No. of Schools Govt. Building Rented 20 0
% 100% 0% (Condition) Good 18
% 90% Bad 2 % 10%
No. of Schools with special structural facility to cope with natural hazards and 15 schools run under middle school building there is no separate building to high school
Flood 0 % 0%
Cyclone 0 % 0%
Earthquake 0 % 0%
Type of building in no. of Schools Ground floor 15
% 75% Double storied 5
% 25% Triple storied 0
% 0% Alternative exit gates for emergency evacuation in double/triple storied building (no. of Schools)
One gate 20 % 100%
Two gates 0 % 0%
Three gates 0 % 0%
Stare-case width sufficient
0
% 0% Not sufficient 0
% 0% Comments: There is only one main entrance gate in all the 20 schools in Nagapattinam district. Though there are
two gates available in few schools it is not in usable condition. They keep it locked and use only single gate.
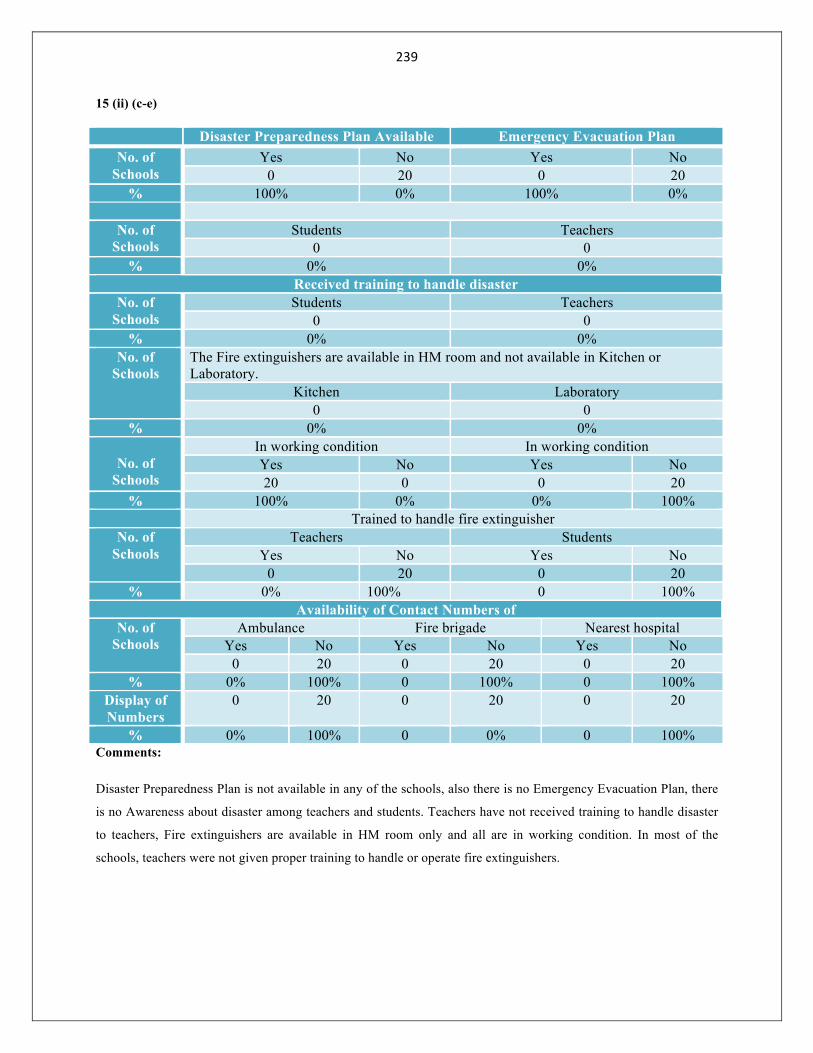
239
15 (ii) (c-e)
Disaster Preparedness Plan Available Emergency Evacuation Plan No. of
Schools Yes No Yes No
0 20 0 20 % 100% 0% 100% 0%
No. of
Schools Students Teachers
0 0 % 0% 0%
Received training to handle disaster No. of
Schools Students Teachers
0 0 % 0% 0%
No. of Schools
The Fire extinguishers are available in HM room and not available in Kitchen or Laboratory.
Kitchen Laboratory 0 0
% 0% 0%
No. of Schools
In working condition In working condition Yes No Yes No 20 0 0 20
% 100% 0% 0% 100% Trained to handle fire extinguisher
No. of Schools
Teachers Students Yes No Yes No
0 20 0 20 % 0% 100% 0 100%
Availability of Contact Numbers of No. of
Schools Ambulance Fire brigade Nearest hospital
Yes No Yes No Yes No 0 20 0 20 0 20
% 0% 100% 0 100% 0 100% Display of Numbers
0 20 0 20 0 20
% 0% 100% 0 0% 0 100% Comments:
Disaster Preparedness Plan is not available in any of the schools, also there is no Emergency Evacuation Plan, there
is no Awareness about disaster among teachers and students. Teachers have not received training to handle disaster
to teachers, Fire extinguishers are available in HM room only and all are in working condition. In most of the
schools, teachers were not given proper training to handle or operate fire extinguishers.
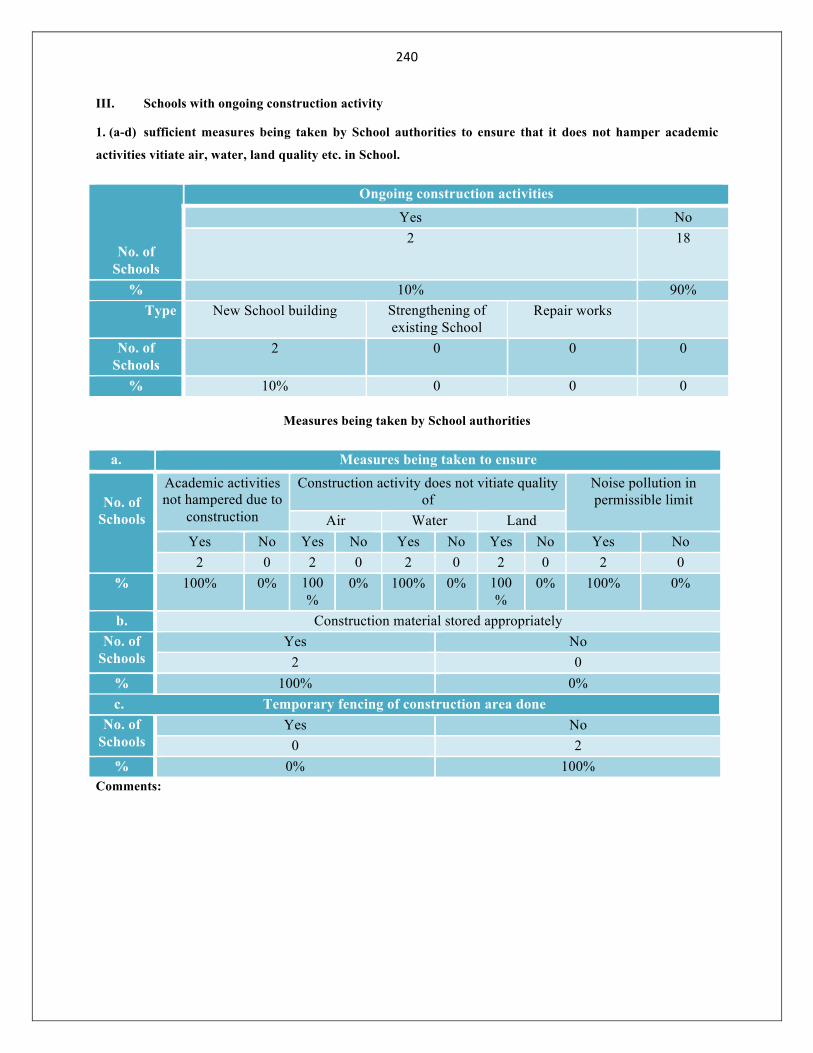
240
III. Schools with ongoing construction activity
1. (a-d) sufficient measures being taken by School authorities to ensure that it does not hamper academic
activities vitiate air, water, land quality etc. in School.
No. of Schools
Ongoing construction activities Yes No
2 18
% 10% 90% Type New School building Strengthening of
existing School Repair works
No. of Schools
2 0 0 0
% 10% 0 0 0
Measures being taken by School authorities
a. Measures being taken to ensure
No. of Schools
Academic activities not hampered due to
construction
Construction activity does not vitiate quality of
Noise pollution in permissible limit
Air Water Land Yes No Yes No Yes No Yes No Yes No
2 0 2 0 2 0 2 0 2 0 % 100% 0% 100
% 0% 100% 0% 100
% 0% 100% 0%
b. Construction material stored appropriately No. of
Schools Yes No
2 0 % 100% 0%
c. Temporary fencing of construction area done No. of
Schools Yes No
0 2 % 0% 100%
Comments:

241
2. (a-b) Procurement aspects
No. of Schools
Same contractor whom the work was
awarded is doing work (a)
Stage of construction work Construction work being
done according to layout Plan
Yes Sublette to other
Foundation level
Plinth level/ DPC
Lintel Roof level
Flooring/plastering Finishing level
Yes No
2 0 0 0 0 0 0 2 2 0 % 100% 0% 0% 0% 0% 0% 0% 100% 100% 0%

2(c-g)
h. Number of visits per School of Technical persons and authentication done or instructions given on
construction site –
No.
of
Sc
ho
ols
Comm
unity
membe
rs
throug
h
SMDC
involve
d in
procure
ment
process
Sub
Commi
ttee
(Constr
uction
Commi
ttee)
Constit
uted
A/c
Books
Civil
Work
(Constr
uction)
maintai
ned/
updated
MB
for
Civil
Work
Maint
ained
Paym
ent
made
to
contra
ctor in
accor
dance
with
MB
Mater
ial
stocke
d is in
line
with
stock
regist
er
Chequ
e issue
registe
r
maint
ained
Quality up to
the mark
Physica
l
existenc
e of
constru
ction
materia
l
matche
s with
entry
made in
stock
register
Constr
uction
Materi
al
Constr
uction
work
Y
es
No Y
es
No Ye
s
No Y
es
N
o
Y
es
N
o
Y
es
N
o
Y
es
N
o
Y
es
N
o
Ye
s
N
o
Y
es
No
2 0 0 2 0 2 0 2 2 0 2 0 0 2 2 0 2 0 2 0
% 10
0
%
0
%
0
%
10
0%
0 10
0
0 10
0
%
10
0
%
0
%
10
0
%
0
%
0 1
0
0
10
0
0 10
0
%
0
%
10
0
%
0%
100% 0%
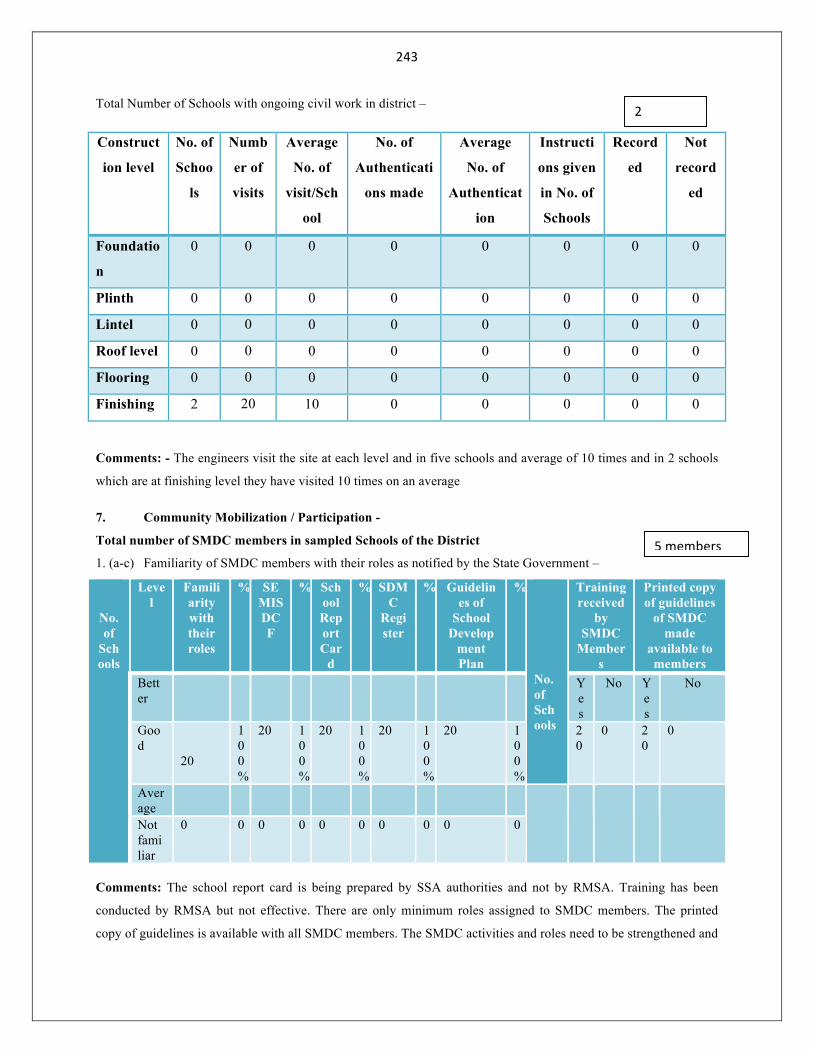
243
Total Number of Schools with ongoing civil work in district –
Construct
ion level
No. of
Schoo
ls
Numb
er of
visits
Average
No. of
visit/Sch
ool
No. of
Authenticati
ons made
Average
No. of
Authenticat
ion
Instructi
ons given
in No. of
Schools
Record
ed
Not
record
ed
Foundatio
n
0 0 0 0 0 0 0 0
Plinth 0 0 0 0 0 0 0 0
Lintel 0 0 0 0 0 0 0 0
Roof level 0 0 0 0 0 0 0 0
Flooring 0 0 0 0 0 0 0 0
Finishing 2 20 10 0 0 0 0 0
Comments: - The engineers visit the site at each level and in five schools and average of 10 times and in 2 schools
which are at finishing level they have visited 10 times on an average
7. Community Mobilization / Participation -
Total number of SMDC members in sampled Schools of the District
1. (a-c) Familiarity of SMDC members with their roles as notified by the State Government –
No. of
Schools
Level
Familiarity with their roles
% SEMIS DCF
% School Report Car
d
% SDMC
Register
% Guidelines of
School Develop
ment Plan
% No. of Schools
Training received
by SMDC
Members
Printed copy of guidelines
of SMDC made
available to members
Better
Yes
No Yes
No
Good
20
100%
20 100%
20 100%
20 100%
20 100%
20
0 20
0
Average
Not familiar
0 0 0 0 0 0 0 0 0 0
Comments: The school report card is being prepared by SSA authorities and not by RMSA. Training has been
conducted by RMSA but not effective. There are only minimum roles assigned to SMDC members. The printed
copy of guidelines is available with all SMDC members. The SMDC activities and roles need to be strengthened and
5 members
2

244
in the meetings only the budget and civil work allocation is being discussed. The other school development plans
and execution has to be discussed.
2. (I) Frequency of SMDC meetings held, issues discussed thereof and average attendance of the SMDC members-
No. of Schools
Meetings held Average Attendance of
SMDC members Monthly Quarterly Six
monthly Annually Whenever
needed Never 100%
0 2 18 0 0 0 % 0% 90% 10% 0% 0% 0%
Issues discussed –
1. Civil work 2. Perspective plan 3. Mainly grants 2(ii) Description of SMDC members –
Members Number Average no of members per School
Average Attendance in recent meeting
Total members 100 5 100% Women members 10 1 100% SC/ST members 4 0.2 100% Selected members 100 5 100% Nominated members 0 0 0% Comments: There is an average of 5 members in SMDC in each school. There are 100 members in the 20 schools
visited by the MI. There were only 10 members totally and it comes to an average of 1 women member in each
school. Few schools did not have women representation. But there were 2 to 3 women members in some of the
schools. There is very minimum representation of SC/ST members in SMDC. There were 4 members in
Nagapattinam district.
3. (I) Roles of SMDC members in monitoring attendance of teachers and students –
No of Schools
Monitoring Attendance of Monitoring Academic Progress of Students Teachers Students
Yes No Yes No Yes No 0 20 0 20 0 20
% 0% 100% 0 100% 0 100% 3(ii) Level of participation of SMDC members in helping School authorities to conduct following activities

245
No.
of S
choo
ls
Leve
l of P
artic
ipat
ion
RM
SA &
MD
M I
mpl
emen
tatio
n
%
Con
stru
ctio
n w
ork
unde
r RM
SA
%
SAG
Util
izat
ion
%
Free
Tex
t Boo
ks d
istri
butio
n
%
Scho
lars
hips
dis
tribu
tion
%
Prep
arin
g A
WP
& B
%
Stud
ents
Enr
ollm
ent,
Atte
ndan
ce
%
Reg
ular
ity o
f tea
cher
s
%
Run
ning
of d
ay to
day
act
iviti
es o
rgan
isin
g Sc
hool
& c
ultu
ral e
vent
s
%
Hel
p in
pro
vidi
ng S
choo
l fac
ilitie
s
%
Filli
ng o
f DC
F
%
Good 20 0 4 0 20 0 20 0 20 0 20 0 20 0 20 0 20 0 20 0 0 0
Average 0 0 0 0 0 0 0 0 0 0 0 0 0 0 0 0 0 0 0 0 20 100%
Bad 0 0 0 0 0 0 0 0 0 0 0 0 0 0 0 0 0 0 0 0 0 0%
4. Participation of SMDC members in preparation of AWP&B –
No. of Schools
Preparation of AWP & B Yes No
0 20 % 0% 100%
Comments: The SMDC members are not involved in the preparation of AWP&B. Instead, the HM who is also one
of the members of SMDC prepare the AWP&B. Later, the Budget is being discussed in the SMDC meetings and get
approved.
5. Training received by SMDC members and duration thereof –
No. of Schools
SMDC members received training
Total No. of SDMC
members
No. of members who received
training
Average of training duration
in days
Yes No 30 30 20 0 2 days
% 100% 0% 100 100% 100%

246
6. Schedule of trainings, received by SMDC members, name agency who conducted the trainings, and perception of SMDC members about trainings.
Month and year of training held
Trainings conducted by Responses about perception of SMDC members regarding trainings Topic, Content, Methodology
projection 3. DIET
No. of Schools
Good & Useful
Average Not Good 2014 4. School HM
20 20 0 0
Comments: The SMDC training is conducted by DIET or School HM. The respondents stated that it was Good and Useful in all the 20 schools.
8. MIS (Management Information System) at SPO, DPO and School level
1. Preparation of Master List of all Schools including private in District/State
Name of District visited
Nagapattinam …………..
Master List of government and Pvt. Schools Prepared If master list not prepared reasons
thereof
Yes No 1. 100% 0% 2.
Name of State Tamil Nadu
Tamil Nadu 3.
Total No. of govt. Schools
No. of govt. Schools of
which list is prepared
% Total No. of pvt.
Schools
No. of pvt. Schools of
which list is prepared
% 4.
District 5. State
Comments: Data not available in the schools.
2. Distribution of DCF for the current year to all Schools in the District
No. of School DCF distributed to all DPOs from SPO Yes No
% 20 0
No. of School DCF distributed all Schools from DPO Yes NO
% 20 0 Comments: DCF distributed all Schools from DPO but not for the current academic year.

247
3. Training received by teachers / head Master / Principal for filling up of DCF in sampled Schools and district
At district level At School level
Total No. of govt. & Pvt. Schools in district
98
No. of sampled Schools
Training received by teachers of sampled Schools
No. of teachers who received DCF training
121 yes no
Average No. of teachers who received DCF training
12 20 0
20 100% 0%
In the training, it was taught to fill up the DCF forms. The scope and significance of filling up DCF forms has not been emphasized.
Reasons for not receiving training
12. Status of receiving of DCF duly filled up from all Schools in the district for the current year i.e. 2013-14 (At district level)
Total no. of Schools in the district
No. of Schools to which DCF distributed through nodal Schools
No. of Schools from which filled up DCF
received
No. of Schools from which filled DCF
not received
Reasons for not delay
Govt. Pvt. Total Govt. Pvt. Total Govt. Pvt. Total 1. 2. 3. 4. 5. 6. 7. 8.
68
30 98 68 30 98 0 0 0
Govt.
Pvt.
%
Comments: All the schools in Nagapattinam district has been distributed with DCF forms.
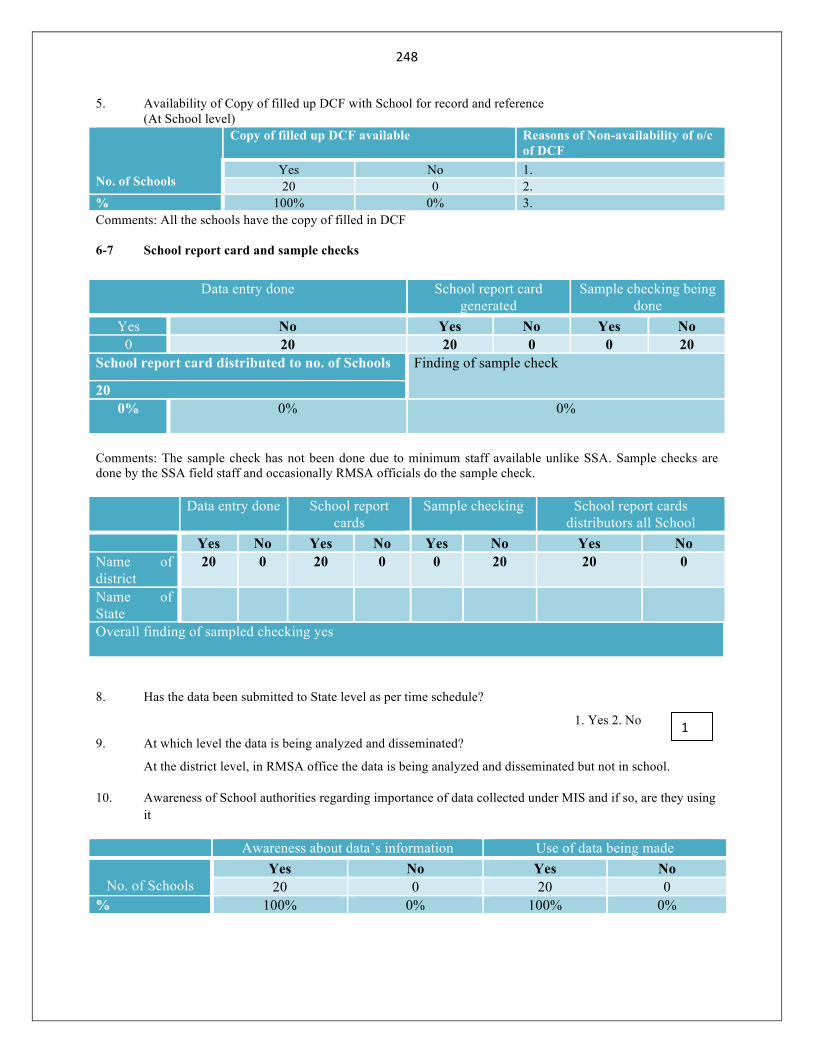
248
5. Availability of Copy of filled up DCF with School for record and reference (At School level)
No. of Schools
Copy of filled up DCF available Reasons of Non-availability of o/c of DCF
Yes No 1. 20 0 2.
% 100% 0% 3. Comments: All the schools have the copy of filled in DCF 6-7 School report card and sample checks
Data entry done School report card generated
Sample checking being done
Yes No Yes No Yes No 0 20 20 0 0 20
School report card distributed to no. of Schools Finding of sample check
20 0% 0% 0%
Comments: The sample check has not been done due to minimum staff available unlike SSA. Sample checks are done by the SSA field staff and occasionally RMSA officials do the sample check.
Data entry done School report cards
Sample checking School report cards distributors all School
Yes No Yes No Yes No Yes No Name of district
20 0 20 0 0 20 20 0
Name of State
Overall finding of sampled checking yes
8. Has the data been submitted to State level as per time schedule?
1. Yes 2. No
9. At which level the data is being analyzed and disseminated?
At the district level, in RMSA office the data is being analyzed and disseminated but not in school.
10. Awareness of School authorities regarding importance of data collected under MIS and if so, are they using it
Awareness about data’s information Use of data being made
No. of Schools Yes No Yes No 20 0 20 0
% 100% 0% 100% 0%
1

249
11. Is SEMIS/ UDISE data used for Planning and budgeting?
1. Yes 2. No
12. Is the back up of the data supplied under SEMIS/UDISE properly maintained?
1. Yes 2. No
9. Financial Management (At School, DPO & SPO level) –
1. Nature of financial records and their maintenance and Bank reconciliation –
No. of
Schools
Records maintained & updated on daily basis Bank reconciliation done on monthly basis Cash Book
Yes No Yes No 20 0 0 20
% 100% 0% 0 0 DPO 100% 0% 0 0
0 100% 0% 0 0 Comments: all head master says that SG and MRG should given to June onwards till right now late payment and to consume timely credit sc high in the district all schools under RMSA and education rank 6th place
2. Mode of transfer of funds to the SMDC from State/District level –
From DPO to SMDC
Mode of Transfer
Cheque Draft E-transfer
No. of Schools 0 0 20
% 0 0 100%
From SPO to DPO 0 0 20
Comments: All financial transactions are done through banks only
3(i) Type of funds/grants received by the sampled Schools and details thereof (financial year 2012-13) –
S.NO. Type of funds/grants No. of Schools As recorded in cash book Amount
Received Total Month of receipt
1. School Annual Grant (SAG)
20 50000/school 20 Not available
2. Minor Repair Grant 20 25000/school 20
3. New School Building Grant (Major grant)
2 50,000,00 50,000,00 Not available
4. Additional classroom /lab etc. construction grant
5. Major repair grant
2
1

250
6. Educational tour grant
7. others
8
9.
At District Level
3(ii). Type of funds /grants allocated by the district to Schools
S.No. Name of grant allocated No. of Schools Month of allocation
1 School Annual Grant All the
Government and
Government aided
schools in
Nagapattinam
district
March
2 Minor Repair Grant Minor Repair
Grant has not been
distributed to 8
schools in
Nagapattinam
district
3 Civil Work 50 lakhs has been
distributed to 2
schools but the
civil work is
incomplete due to
insufficient funds

251
At State Level
3(iii). Type of funds /grants allocated by the State to district
S.No. Name of grant allocated No. of districts Month of allocation 1 School Annual Grant No info No info 2 Minor Repair Grant No info No info 3 Civil Work No info No info 4 5 6 7 8 9
10 4. System for drawl and payment of fund from SMDC account –
No. of Schools Cash Cheque Both 0 20 0
% 0% 100% 0% Comments:
5. Sharing of proposal for expenditure and expenditure Statements with community
No. of Schools
Sharing of If yes, details of objections Proposal for
expenditure Expenditure Statements
Any objection raised by community about any
transaction Yes No Yes No Yes No 1.
0 20 0 20 0 20 2. % 0% 100% 0% 100% 0% 100% 3.
4. Comments :
6. Audit of SMDCs
All SMDCs in State/District are covered by audit 1. Yes 2.No
No. of Schools
Audit carried out YES NO
0 20 % 0% 20%
D.P.O.
No. of Schools
If yes, Audit carried out by Education Deptt. A.G. C.A. Social Audit None
- - - - % - - -
2

252
Comments: SMDC audit is not being done on a periodic basis. None of the school has been audited by either
education department or AG or CA. Jan Vaachan is also not happening in any of the school. Social audit has never
happened in Nagapattinam district.
7. Social Auditing
Display of financial Information on notice board/wall of the School/office for the purpose of social audit-
No. of Schools
Display of financial information (receipts & payments) and timely entered
Yes No 0 20
% 0% 100% D.P.O.
Comments: Social audit is not being done in Nagapattinam district.
8. Any instance of community mobilizing resources for the School.
No. of Schools
Instance of community mobilizing resources Yes No
0 20 % 0% 100%
9(i). Status of utilization certification and period for which it has been
Submitted from SMDC to DPO
S. No. Name of School Month of submission of
UC
Financial year for which UC is
submitted
1 April, 2014 2013-14
2
3
4
5
9(ii). Status of utilization certificates submitted by SMDCs to DPO (At District Level)
Total No. of Schools
No. of SMDCs from which U.C. is
received
% Period for which U.C. submitted
No. of Schools

253
No data available
9(iii) Status of utilization certificates submitted to SPO from DPOs (from 1st April 2012 to 31st March, 2013) (At
State Level)
No. of sampled
DPOs
Name of Funds /Grants
No. of DPOS to
which fund released
Amount of fund
released
Date of release
Amount for which
U.C. received
Amount for which U.C. has not been received
School Annual Grant
Minor repair
work
Major repair
work
Civil work Education Tour Comments: Data not furnished by the State
10. Process of settlement of advance and collection of utilization certificate by SPO and DPO.
(i) Process of settlement of advance and collection of utilization certificate.
--------------------------------------------------------------------------------------------------
--------------------------------------------------------------------------------------------------
(ii) Communication to SMDCs after the settlement of advance has been done by DPO.
1. Yes 2. No
Mode of conveying SMDCs about settlement of advance
12. Financial Statement for SDMC/DPO/SPO (From 1 April 12 to ………….. (date /month of visit).
(i)

254
Name of Unit
A Opening Balance as
on 1st April, 2013
B Funds
received
C=A+B Total Fund available till………
D Expenditure
E=C+D Closing balance including cash in hand as on
……..
Balance in bank
passbook as on
…………… SMDC DPO SPO Comments: Data unavailable.
11 (ii) Detail of expenditure of funds by SMDC in sampled (from 15 April till date) district.
Grant funds
S.N.
Name of School
SAG Minor Repair Major repair grant Civil work Educational tour
Receipt
Spent
Unspent
balance
Receipt
Spent
Unspent
balance
Receipt
Spent
Unspent
balance
Receipt
Spent
Unspent
balance
Receipt
Spent
Unspent
balance
1 GHS, Thirupoondi North
50000
50000
0 25000
25000
0 0 0 0
2 GHS, Vezhuthamavadi West
50000
50000
0 25000
25000
0 0 0 0
3 GHS, Sattiyakudi
50000
50000
0 25000
25000
0 0 0 0
4 GHS, Kilvelur
50000
50000
0 25000
25000
0 0 0 0
5 GHS, Kodakkaramoolai
50000
50000
0 25000
25000
0 0 0 0
6 GHS, Thandavankulam
50000
50000
0 25000
25000
0 0 0 0 0
7 GHS, Mappadukai
50000
50000
0 25000
25000
0 0 0 0
8 GHS, Kalankudi
50000
50000
0 25000
25000
0 0 0 0
9 GHS, Nagoor
50000
50000
0 25000
25000
0 0 0 0
10 GHS, Pappakoil
50000
50000
0 25000
25000
0 0 0 0
11 GHS, Vaithiyanathapuram
50000
50000
0 25000
25000
0 0 0 0 0
12 GHS, Chinnangudi
50000
50000
0 25000
25000
0 0 0 0
13 GHS, Agaraperunthottam
50000
50000
0 25000
25000
0 0 0 0 5000000
5000000
14 GHS, Thiruvali
50000
50000
0 25000
25000
0 0 0 0
15 GHS, Vellapallam Meenavar Colony
50000
50000
0 25000
25000
0 0 0 0 5000000
5000000

255
16 GHS, Naluvethapathi
50000
50000
0 25000
25000
0 0 0 0
17 GHS,
Panangudi Samathuvapuram
50000
50000
0 25000
25000
0 0 0 0
18 GHS
Thittacheri 50000
50000
0 25000
25000
0 0 0 0
19 GHS, Nagakudiyan
50000
50000
0 25000
25000
0 0 0 0
20 GHS,
Kadinalvayal
50000
50000
0 25000
25000
0 0 0 0
SCHOOL ANNUAL GRANT –
1 (i) Month of receiving School Annual Grant for the financial year 2012-13 in sampled Schools and status of utilization of funds.
S.N. Month of receipt of SAG Number of Schools % 1 No data 20 100 2 3 4 5 Total 2 (i) status of utilization of funds with % and expenditure done as per norms of the scheme- S.N. Name of School Sanctioned
amount Month of
receipt Expenditure till
date % of
expenditure 1 2 3 4 5 2(ii) Status of Utilization of School Annual Grant
Details/No. of Schools
Which were not sanctioned
SAGs
Which were sanctioned but did
not receive SAGs
Which received but did not
spend
2(iii) Utilization of SAG as per norms
SAG funds utilized on works
Number of Schools
%
Funds utilized as per norms in number of Schools
If not utilized as per norms, give reasons
Yes % No %

256
1. 20 100 20 100 0 1. Comments: data available
11. Minor Repair Grant
1. Receipt of Minor Repair Grant – (For Financial Year 2012-13)
S.N. Name of School Sanctioned amount
Month of receipt
Expenditure till date
% of expenditure
1 2 3 4 Total
2(i) Utilization of minor repair grant on repair and white-wash of the School building –
Number of Schools Number % Total No. of Schools who received minor repair grant No 0 Number of Schools utilized the grant on repair and white wash
No 0
Number of Schools who did not utilized fund as per norms No 0 Comments: No data available
2 (ii) Utilization of minor repair grants as per norms
Minor Repair Grant utilized on works
Number of Schools
%
Funds utilized as per norms If not utilized as per norms, give reasons Yes % No %
1. 1. 2. 2. 3. 3. 4. 4. 5. 5. 6. 6. 7. 7. 8. 8. 9. 9. 10. 10 Comments: No split up available

257
12 INNOVATIONS – At SPO/DPO level
In Nagapattinam district, promotion of sports activities is widely seen. The high school students are encouraged to participate in games, competitions and sports. The winners are recognized at the district level and they are given special prizes. Every year in SSLC examination, top 10 SC students are identified at the district level in Nagapattinam and they are honored with special cash prizes.
1. Details of innovative proposals undertaken during the current financial year (At district level)
S. No.
Name of Innovative Proposals Amount of funds sanctioned/released
Stage of Implementation
Comments :
At the district level there are no innovative proposals submitted during the financial year April 2012 to March 2013.
The state project office has recently issued a proposal to all the district level project offices to undertake innovative
projects to monitor and evaluate the effectiveness of scheme. The district CEO assured that innovative proposals
will be undertaken during the next academic year.
3. Details of innovative proposals undertaken during the financial year 1st April, 2012 to 31st March, 2013 (At State level)

258
S. No.
Name of District Name of Innovative Proposals
Amount of funds sanctioned/released
Stage of Implementation
3 (a) If not, the mentions reasons thereof
--------------------------------------------------------------------------------------------------
(b) Effective monitoring and evaluation mechanism for implementation of innovation proposals.
--------------------------------------------------------------------------------------------------
--------------------------------------------------------------------------------------------------
(c) The objectives of innovation proposals being met in districts
(e) At district level
--------------------------------------------------------------------------------------------------
--------------------------------------------------------------------------------------------------
(f) At State Level
--------------------------------------------------------------------------------------------------
--------------------------------------------------------------------------------------------------
(d) Identified any successful elements in innovation proposals, to be scaled up under RMSA
--------------------------------------------------------------------------------------------------
--------------------------------------------------------------------------------------------------
13. INFORMATION ABOUT MMER At DPO and SPO level
1(i). The total number of staff sanctioned category wise in DPO under RMSA and the number in position. Nagapattinam District

259
Name of District________________________________ S. N. Name of Post Sanctioned In position % Vacant %
1 CEO, District Programme Coordinator
1 1 100% 0 0%
2 Assistant District Programme Coordinator (ADPC)
1 1 100% 0 0%
3 Educational District Coordinators (EDCs)
2 2 100% 0 0%
4 Civil Engineers 2 1 50% 1 50% 5 Tally Managers 3 3 100% 0 0% 6 Data Entry Operators 2 2 100% 0 0% 7 Office Assistant (On
special request) 1 1 100% 0 0%
8 9
10 Total 12 12 100% 0 0%
1(ii) the total number of staff sanctioned category wise in SPO under RMSA and the number in position.
S. N. Name of Post Sanctioned In position % Vacant % 1 Project Director 1 1 100% 0 0% 2 JD (Administration) 1 1 100% 0 0%
3 JD (Training) 1 1 100% 0 0% 4 JD (Civil) 1 1 100% 0 0% 5 JD (District level
Coordination 1 1 100% 0 0%
6 Chief Accounts Officer
1 1 100% 0 0%
7 PG Teachers 3 3 100% 0 0% 8 BT level coordinators 2 2 100% 0 0%
9 Superintendents 1 1 100% 0 0% 10 Assistants 2 2 100% 0 0% 11 Tally Managers 1 1 100% 0 0% 12 Data Entry Operators 4 4 100% 0 0%
13 Personal Assistants for Director and JD
2 2 100% 0 0%
14 15

260
Total 21 21 100% 0 0% 1(iii) Action taken to fill up vacancies
There are no vacancies at district level
At district level ……………………………………………………………………………………….
At State level There are no vacancies at state level ………………………………………………………………………….
Comments
2 Personnel working on deputation/contract and their nature of engagement
No. of Personnel on deputation No. of Personnel on contract At DPO SPO At DPO SPO
NIL NIL NIL NIL Nature of engagement
At DPO At SPO At DPO At SPO
Comments:
3. Component-wise personnel at State and District level
S.N. Component wise personnel Position in Place Working at State
level Working at district level
1 Finance 2 Civil Work 3 Quality 4 Equity 5 Gender 6 Pedagogy

261
7 Planning 8 Training
Total 3(i) If component wise personnels are not in place the alternative arrangements made
……………………………………………………..…………………………………………
Comments:
4 If the administrative staff is not in place alternative arrangement adopted
……………………………………………………………………………………………………………….
……………………………………………………………………………………………………………….
Comments:
5 Clarity amongst officials and staff about the objectives, targets and goals of the programme and their role in the management structure.
……………………………………………………………………………………………………………….
Comments:
II. MONITORING STRATEGY
1. (i) Use of monitoring tools/mechanism (reports, visits etc.) to ensure effective implementation of the scheme
………………………………………………….………………………………………
1(ii) Steps taken by DPO & SPO to ensure effective implementation of RMSA
……………………………………………………………………….………………………………………
……………………………………………………………………….………………………………………
1(iii) Details of visits made by officials of SPO and DPO to district/Schools along with time schedule (from 1st April, 2012 to 31st March, 2013)
At SPO level

262
S. No.
Post of Officer No. of Visits made
No. of district/ School visited
Time schedule
Average No. of visits per district
1. SPD 2. Additional
Director Project
3 Others
At DPO Level
S. No.
Post of Officer No. of Visits made
No. of School visited
Time schedule
Average No. of visits pre School
1 DPC 2 ADPC 3 APC 4 Others Total
Comments: No data available
2. Details of guidelines laid down for monitoring.
--------------------------------------------------------------------------------------------------
--------------------------------------------------------------------------------------------------
Comments:
III Management Systems –At District and State level.
Information about Academic Institutions (Details of SCERT & IASE/CTEs/DIETs)
1(i) Availability of Physical Infrastructural Facilities
-------------------------------------------------------------------------------------------------- -----------------------------------------
------------------------------------------------------------------------
1(ii) Facilities available in SCERT/SIERT
Staff Sanctioned In position Vacant %

263
1(iii) Availability of physical Infrastructural Facilities
--------------------------------------------------------------------------------------------------------------------------------------------
------------------------------------------------------------------------------------------------------------------
Comments:
3. Other essential facilities
In DIET In IASE/CTEs In SCERT/SIERT
1
2
3
4
5
6
7
8
9
10
1
2
3
4
5
6
7
8
9
10
1
2
3
4
5
6
7
8
9
10
Comments:

264
IV. INFORMATION ABOUT STATE DATABASE At SPO level updated by DPO.
3. (i) School mapping completed or not in respect of the visited district/s
--------------------------------------------------------------------------------------------------
1(ii) If not completed, then the basis used for developing the annual/perspective Plan for access
Planning is based on the school report card, UDISE records, etc.
--------------------------------------------------------------------------------------------------
--------------------------------------------------------------------------------------------------
1(iii) Mechanism other than GIS mapping adopted by the State
--------------------------------------------------------------------------------------------------
Comments:
2. The database mechanism (MIS) at district level is in place or not
-------------------------------------------------------------------------------------- Yes/ No
2(i) If not, then name of other sources used for the Plan preparation at district level
--------------------------------------------------------------------------------------------------
--------------------------------------------------------------------------------------------------
Comments:
3. Major issues in collection and compilation of data at district and State level
S. N. District level issues State level issues 1 2 3 4 5 6 7 8
Comments: No major issues V RESEARCH (At district and State level)
There is no detailed information available regarding research at district and state level.

265
1. Details of research projects undertaken during the year (1st April, 2012 to 31st March, 2013) –
At District Level
S.No. Title of research project Purpose Major findings 1 There is no research and evaluation
carried out at the district level at present.
2
3
4
5
At State Level
S.No. Title of research project Purpose Major findings
1 At state level, MoU has been signed with NUEPA to conduct Annual Plan Action Research on RMSA Implementation in TN. Salem and Theni districts have been taken as pilot district to conduct this research.
2
3
4
5
2. Research Advisory Committee being formed or not
(a) At State level ………………………………………………………………………………………….
(b) At District level ……………………………………………………………………………………….

266
--------------------------------------------------------------------------------------------------
3. (i) Identification of the kinds of research need was felt and at what level?
--------------------------------------------------------------------------------------------------
--------------------------------------------------------------------------------------------------
4. Action Research is being conducted or not, if yes it is conducted by the teachers or external agencies for finding out solutions to users pertaining to pedagogy and quality –
--------------------------------------------------------------------------------------- Yes/No
--------------------------------------------------------------------------------------------------
4(i) If Yes, Details of action research carried out at district level –
Areas of research
Problem No. of Action Research
conducted in district
Solution Conducted by (Teachers /external agencies)
Pedagogy
Quality
4(ii) If Yes, Details of action research carried out at State level –
Areas of research
Problem No. of Action Research
conducted in district
Solution Conducted by (Teachers /external agencies)
Pedagogy
267
14. Any other issues relevant to RMSA implementation
MI may give a maximum 2 page note, on any other issues, relevant to RMSA implementation, not covered above.

268
RMSA Monitoring @ Thanjavur District -‐ Selected Schools
Sl.No Dise Code District Name
Block Name School Name
1 33210202110 Thanjavur Thanjavur Rural GHS, Pillayarpatti 2 33210300603 Thanjavur Thiruvaiyaru GHS, Vanarangudi 3 33210302405 Thanjavur Thiruvaiyaru GHS, Mohamed Bunder 4 33210400704 Thanjavur Budalur GHS, Indalur 5 33210502905 Thanjavur Orathanadu GHS, Naduvoor 6 33210504410 Thanjavur Orathanadu GHS, Sadayarkoil 7 33210602203 Thanjavur Thiruvonam GHS, Kattathi
Unjiyaviduthi 8 33210602902 Thanjavur Thiruvonam GHS, Sillathur 9 33210702604 Thanjavur Kumbakonam GHS, Neerathanallur 10 33210704902 Thanjavur Kumbakonam GHS, Cholapuram West 11 33210801905 Thanjavur Papanasam GHS, Vanniyadi 12 33210900307 Thanjavur Ammapettai GHS, Annappanpettai 13 33210900506 Thanjavur Ammapettai GHS, Arunthavapuram 14 33211001304 Thanjavur Papanasam GHS, Vannakudi 15 33211004403 Thanjavur Thiruvidaimarudur GHS, Thukkachi 16 33211100103 Thanjavur Thiruppanandal GHS, Aralur 17 33211103803 Thanjavur Thiruppanandal GHS, Chitridaiyanallur 18 33211402502 Thanjavur Peravurani GHS, Sengamangalam 19 33211403504 Thanjavur Peravurani GHS, Vattathikottai 20 33211505102 Thanjavur Sethubavachatram GHS, Muthukadu

269
RASHTRIYA MADHYAMIK SHIKSHA ABHIYAN THIRUVARUR DISTRICT
GOVERNMENT SCHOOL LIST (2013-‐14) S. No.
BLOCK NAME U-‐DISE CODE
NAME OF THE SCHOOL
1 KODAVASAL 33200201202 GHS,KOOTHANUR 2 KODAVASAL 33200201503 GHSS, ERAVANCHERY 3 KORADACHERY 33200302102 GHS,SELLUR 4 KORADACHERY 33200302803 GHS, ATHIKADAI 5 KOTTUR 33200802102 GHS, MAZHAVARAYANALLUR 6 KOTTUR 33200802702 GHS ,PALAYAKOTTAI 7 MANNARGUDI 33200603902 ADWHS,SAVALAKARAN 8 MUTHUPETTAI 33201000402 GHSS, IDUMBAVANAM 9 NANNILAM 33200402805 GHSS, POONTHOTTAM 10 NANNILAM 33200405318 GHS,SANNANALLUR 11 NANNILAM 33200404505 GHS, MAPPILAIKUPPAM 12 NEEDAMANGALAM 33200700903 GHS EDAKEELAIYUR 13 THIRUTHURAIPOONDI 33200903306 ADWHS ABISEKAKATTALAI 14 THIRUTHURAIPOONDI 33200903314 GGHSS THIRUTHURAIPOONDI 15 TIRUVARUR 33200501802 GHS , PALAYAVALAM 16 TIRUVARUR 33200501403 GHS, MANGUDI 17 TIRUVARUR 33200503702 GHS, VADAKARAI 18 TIRUVARUR 33200500504 ADWHS AMOOR 19 VALANGAIMAN 33200101002 GHSS,ARITHUVARAMANGALAM 20 VALANGAIMAN 33200102402 GHS, MUNIYUR

270
RMSA MONITORING -‐ SCHOOL LIST -‐ NAGAPATTINAM DISTRICT
Sl.No Block Name School Name 1 Keezhaiyur GHS, Thirupoondi North 2 Keezhaiyur GHS, Vezhuthamavadi West 3 Kilvelur GHS, Sattiyakudi 4 Kilvelur GHS, Kilvelur 5 Kollidam GHS, Kodakkaramoolai 6 Kollidam GHS, Thandavankulam 7 Mayiladuthurai GHS, Mappadukai 8 Mayiladuthurai GHS, Kalankudi 9 Nagapattinam GHS, Nagoor 10 Nagapattinam GHS, Pappakoil 11 Sembanar Koil GHS, Vaithiyanathapuram 12 Sembanar Koil GHS, Chinnangudi 13 Sirkali GHS, Agaraperunthottam 14 Sirkali GHS, Thiruvali 15 Thalaiyaru GHS, Vellapallam Meenavar Colony 16 Thalaiyaru GHS, Naluvethapathi 17 Thirumarugal GHS, Panangudi Samathuvapuram 18 Thirumarugal GHS Thittacheri 19 Vedaranyam GHS, Nagakudiyan 20 Vedaranyam GHS, Kadinalvayal


![INDEX [rmsaindia.gov.in]rmsaindia.gov.in/administrator/components/com_monitoring/files/87b... · INDEX Sr. No. Components ... Transportation (Roadways) ... The data entry on the school](https://img.pdfslide.us/doc/110x75/5b85f3917f8b9a3a608bc67d/index-index-sr-no-components-transportation-roadways-the-data.jpg)