Embed Size (px)
Citation preview
Page 1/22
Arsenic Speciation in Rice, Mechanisms and AssociatedHealth Risk Through Rice Consumption in VariousDistricts of Khyber Pakhtunkhwa, PakistanTasneem Sarwar
University of PeshawarSardar Khan
University of PeshawarSaid Muhammad
University of PeshawarJaved Nawab ( [email protected] )
University of SwatShehla Amin
University of PeshawarJanas Khan
University of PeshawarAdnan Sarwar
Pak International Medical CollegeQing Huang
Hainan University
Research Article
Keywords: Arsenic, speciation, rice, soil, non-cancer risk, cancer risk
Posted Date: July 29th, 2021
DOI: https://doi.org/10.21203/rs.3.rs-262560/v1
License: This work is licensed under a Creative Commons Attribution 4.0 International License. Read FullLicense
Page 2/22
AbstractArsenic (As) is one of the toxic metalloids therefore can cause health risk in the consumers through consumptionof contaminated food and rice. The current study focused on As speciation in rice, bioavailability, mechanismsand its potential human health risk. For this purpose, rice and soil samples were collected from 16 differentdistricts (non-mining and mining) of Khyber Pakhtunkhwa (Pakistan). Soil physicochemical characteristic such astexture, electrical conductivity (EC), organic matter (OM), pH, iron (Fe) and phosphorus (P) were determined. Totalarsenic (AsT) concentrations were analyzed using ICP-MS, while the arsenite (As3+), arsenate (As5+), arsenobetine(BAs), dimethylarsenic (DMA) and monomethyl arsenic (MMA) were determined by HPLC–ICP-MS method.Results showed the highest AsT (0.28 mg/kg) was observed in the rice samples of DI Khan District and lowest(0.06 mg/kg) in Shangla District. However, these �ndings were found within the permissible limits set by variousauthorities. Furthermore, results showed higher concentrations of inorganic As (Asi) than organic As (Aso) speciesin rice. The estimated daily intake (EDI) and incremental lifetime cancer risk (ILTCR) were used to evaluate thepotential human health risk for As consumption in rice. Results revealed that the rice samples collected from thedistrict having mining activities had higher value of As (0.28 mg/kg of AsT) as compared to non-mining (0.072mg/kg of AsT). The highest ILTCR value (0.00196) was observed for rice collected from mining districts. Thisstudy revealed that mining activities have great in�uence on the As contamination of soil and grown rice. Thisstudy recommends the soil amendment in districts having mining activities to lower As availability in soil and itsbioaccumulation in growing rice that will help to keep lower the potential risk.
IntroductionArsenic (As) is carcinogenic in nature (Rehman et al. 2019) and considered as one of the most readily availableand harmful metalloids (Mitra et al. 2020); Garbinski et al. 2019). It ranked at 20th position in abundance amongelements found on our Earth and present in soil, water and living organism (Mitra et al. 2020). The As release intothe environment from both the geogenic sources such as denudation of bedrocks and ore deposit (Kumar et al.2016; Sathe and Mahanta 2019) and anthropogenic activities including mining, agrochemicals, industriale�uents and emission (Muhammad et al. 2010; Gan et al. 2019). Once As is released into the environment, itcould easily �nd ways to water (Rehman et al. 2019). When the water contaminated with As is used for irrigationpurposes such as in rice �elds it is deposited in soil (Huhmann et al. 2019; Upadhyay et al. 2019). Paddy soils arenaturally rich in As (Kato et al. 2019) that further aggravated by contaminated water irrigation (Gan et al. 2019).
The As mobilization and bioavailability were in�uenced by several factors including speciation, pH, reducingenvironment (Eh), Fe (iron) (Yamaguchi et al. 2011) and its uptake in the rhizosphere of soil-plant system (Anawaret al. 2018; Kowalczyk and Latowski 2018). Flooded paddies soils had the characteristics that resulted in themobilization of As, thus enhancing its bioavailability and uptake in rice plant (Yamaguchi et al. 2011).Furthermore, there are a number of characteristics (both biological and physical) of soil and rice, also its chemicalcharacteristics have a great in�uence on the bioavailability of As in soil. The uptake and toxicity of As varies withvarieties of rice (Aqeel et al. 2014; Pravalprukskul et al. 2018). The Asi species may be converted into organicarsenic (Aso) species through methylation governed by microbes’ actions in the paddy �eld (Zhu et al. 2017; Afrozet al. 2019). Tetramethylarsonium (TMA) was mostly found in rice grain of China emanating from thecontaminated paddy soil that had average account 5.9% of the total arsenic (AsT) concentration (Meharg andZhao 2012). It is because of the anoxic environment of the paddies in which rice is grown, rice can uptake
Page 3/22
As3+ more e�ciently than other cereals (Williams et al. 2007). Accumulation capability of rice to store As is almostdouble than other grain plants like barley and wheat (Su et al. 2010). The contamination of As in rice plant andgrains result in food chain contamination and could pose serious public health concern (Lei et al. 2013).
The exposure of As (Long-term exposure) contamination through water and food lead to a wide range of lesionssuch as melanosis, leucomelanosis and keratosis (Rahman et al. 2009b). Higher As contamination results in highblood pressure, neurological effects, obstetric problems, diabetes mellitus, respiratory diseases and blooddiseases such as cancers mostly skin, bladder and lungs (Ahmed et al. 2016). Prolong exposure of As is not onlycarcinogenic, but it may also disturb nervous system (O’Bryant et al. 2011; Mundey et al. 2013), respiratory system(Parvez et al. 2013; Recio-Vega et al. 2014) also immune system (Martin-Chouly et al. 2011; Srivastava et al.2013). The excessive As in the body of human may also alter the reproductive system functioning (Davila-Esqueda et al. 2012; Shen et al. 2013).
Earlier research studies have been conducted on the As poisoning in water of Pakistan (Mosood et al. 2019) andKohistan region of Khyber Pakhtunkhwa (Muhammad et al. 2010) and Dera Ghazi Khan (Malana and Khosa2011) also Peshawar district (Khan et al. 2015), in rice and wheat (Rasheed et al., 2017) and As speciation invegetables of southern districts of Pakistan (Rehman et al. 2016). However, no systematic study conducted toinvestigate the speciation in rice, mechanisms involved in the formation of these species and their uptake by therice and its associated human health risk. This study will determine As speciation not only in rice but also soil ofthe same sites so that it shows the mechanisms involved in its bioavailability and uptake by rice plant. This studywill also evaluate the potential chronic risk and cancer risk associated with the ingestion of As contaminated rice.
Materials And Methods2.1 Study area
Khyber Pakhtunkhwa is situated in the NW region of the Pakistan 34.9526° N, 72.3311° E along the internationalborder with Afghanistan (Claus et al. 2003). The climate of Khyber Pakhtunkhwa differs vastly ranging from DeraIsmail Khan, (the hottest place) to skurdo (the coldest place). Due to unlimited diversity in soil and climate, KhyberPakhtunkhwa produces more than 42 crops; most popular are wheat, maize, rice, barley, tobacco, rape andmustard, sugarcane, groundnut, pulses, fruits and vegetables. Rice production in Khyber pakhtunkhwa accordingto the 2013-2014 government report is; Peshawar 340, Charsadda 114, Mardan 1739, Swabi 348, Hangu 201,Mansehra 2320, Batgram 1816, Malakand 4960, Swat 5559, Bunir 214, Shangla 1452, Dir lower 4278, Dir uppr4250, Chitral 1809, DI Khan 12554 and Bannu 2209.
The research work was carried out in the selected districts of Khyber Pakhtunkhwa (Banu, Buner, Battagram,Charsadda, Dera Ismail Khan, Chitral, Hangu, Malakand, Mardan, Mansehra, Swabi, Peshwar, Swat, Shangla, DirLower and Dir Upper) which are rice producing areas as shown in the location map (SI). The sites were selectedon the basis of rice production in each district and low rice production sites were excluded. Whole study area wasdivided into two groups mining and non-mining. This was done so as to study the effect of mining activities onthe As contamination in both soil and rice.
2.2 Samples collection and pre-treatment
Page 4/22
Rice grain samples (1 kg) were collected in polyethene zip-bags from the �eld having replicates (n=6-10) in eachstudy area district. From base of each uprooted rice, surface soil (0-15 cm) samples were collected in polyethenezip-bags and numbered accordingly. Global position system (GPS, Garman eTrex 30) was used to measure thelatitudes and longitudes of each selected sampling points. All rice (n=135) and soil samples (n=135) were takento laboratory for further analytical procedures.
2.3 Soil characteristics
Physiochemical characteristics including electric Conductivity (EC), pH, Organic Matter (OM), Iron (Fe),Phosphorus (P) and texture were measured according to standard procedures (Table 1). Soil EC and pH weremeasured in solution of soil and deionized water (1:2.5) with Accumet XL 60 meter equipped both electrodes (pHand EC) (Muhammad et al. 2011). Mastersizer 2000 (Malvern Instruments Ltd, UK) was used to determine the soilparticle size (sand, silt and clay) according to operational manual of the instrument. The quanti�ed data wasconverted into percentage (Li et al., 2018). Weight-loss procedure was used to analyze OM in soil samples (Roperet al., 2019). The concentration of iron (Fe) and phosphourse (P) were measured according to the procedureadopted from the (Kumar et al. 2011) and (Khan et al. 2016).
2.4 Digestion of soil and rice grains
Soil and rice samples were dried in air powdered and passed over 2mm mesh and oven dried. Soil samples weregrounded manually with the help of mortar and pestle while rice samples were powdered with Vibrating disc mill(Fritsch, Germany). For the digestion of soil, samples weight 0.2 g were taken and 5 mL HCl (hydrochloric acid(12.0 mol/L)) and 5 mL HNO3 (nitric acid (15.2 mol/L)) was added, the samples were left overnight at room
temperature and then digested with the help of block digester at 100oC for 1 h, followed by at 120oC for 1 h, andlastly at 140oC for 4 h.
Rice samples were digested by taking 0.2 g of rice grain samples and 2 mL of HNO3 was added and left overnight.Followed by the addition of 2 mL of H2O2 (hydrogen peroxide) was added, and the samples were digested usinga microwave accelerated reaction system (CEM-Mars,Version 194A05, USA). Initially temperature was raised to550C for 10 min, then raised to 750C for 10 min, and lastly to 950C for 30 min, and then the samples were cooledat room temperature. The 0.22 μm membrane was used to �lter the digested samples and de-ionized water wasadded to dilute the samples and make it up till 50 mL. ICP-MS (Agilent Technologies, 7500 CX, USA) was used toanalyze AsT concentrations while Fe was determined with (AAS atomic absorption spectrometer (Perkin Elmer,AAS-PEA-700) and P was determined with ICP-OES (Perkin Elmer Optima 7000 DV, USA) (Khan et al. 2014).
For the extraction and quanti�cation of As species ((AsIII), (AsV), (DMA), (MMA) and (BAs)), 200 mg of powderedrice samples were placed in 50 ml polypropylene tubes and 10 ml of 1% (v/v) HNO3 was added to them. For thesample extraction, Microwave assisted digestion technique was used (Jia et al. 2012). Different species of As inthe extracts were analyzed with the help of HPLC–ICP-MS. The selected arsenic species were separated with thehelp of an anion-exchange column (PRP X-100, Hamilton Company, USA) with the mobile phase of 10 mM(NH4)2HPO4 and 10 mM NH4NO3 (pH 6.2). Total Asi was calculated as the sum of AsIII and AsV, while totalAso was calculated as the sum of MMA, DMA and BAs. The extraction e�ciency was 83.8 to 87.9% (SI) of theseAs species from reference material (mentioned in Sec 2.5) which is considered as satisfactory. The detectionlimits for As species ranged from 0.1 to 0.3 μg/kg. For the method validation, the sample solution obtained from
Page 5/22
digestion in microwave oven was selected due to the lesser time consumption involved and the lower blankvalues. The analytical method validation was performed by considering the LOD. All the analytical methods andvalidation is carried out according to Magnusson (2014) guidelines.
2.5 Precision and accuracy
For the veri�cation of accuracy of the data standards and blanks run on column at the start and with regular 10samples interval. Soil and rice �our certi�ed reference materials (GBW07406-GSS-6 and GBW-10045) were usedto verify the extraction e�ciency and As species stability. These certi�ed reference materials were dried at 50oCfor 6 h before microwave digestion. Thus, As content was not affected by the low temperature treatment. HNO3
(2% of the concentrated acid (65%)) and Milli-Q water were used to wash glass wares and plastic bottles properly.The recovery rates from reference materials were in the range of 92.1 ± 6.3 to 101.3 ± 8.3 %.
2.6 Dietary intake and risk assessment
2.6.1 Calculation of Estimated Daily intake
Estimated daily intake was calculated by the expression suggested by Khan et al. 2014
Where;
EF = exposure frequency (365 days per year)
ED = exposure duration (70 years)
BW = average body weight (73 Kg) and
LE = life expectancy (25550 days) (Zhuang et al. 2009; Li et al. 2011).
Cm = concentration of the heavy metal i.e As.
IRrice = Rice intake rate (398.3 g/adult person/day) (Zheng et al. 2007).
2.6.2 Incremental Lifetime Cancer risk
The ILTCR (Incremental lifetime cancer risk) for Asi was calculated using the equation (USEPA, 2010; Li et al.2009):
Where;
CSF = Cancer slop factor (1.5 mg/kg/d) (USEPA 2010).
Page 6/22
2.7 Statistical analysis
Data were analyzed using computer software's like MS Excel (O�ce 2013) and SPSS 11.5, Sigma plot 10.0 for�gures and Arc GIS ver. 10.5 for maps were used.
Results3.1 Physical and chemical characteristics of Soil
Results of the texture shows that soil varied from sandy loam to loamy sand (Table 1). Higher EC value wasmeasured for Mansehra (7.53 mS/cm) and lower in Upper Dir (0.77 mS/cm). Highest soil OM was observed in DIKhan (4.7%) and lower in Lower Dir (2.0%). Maximum pH value was observed for Banu (8.1) and minimum for DIKhan (7.4). Low pH of the DI soil could be attributed to higher OM. Higher values of P were found in DI Khan (0.47g/kg) and lower in Charsadda (0.15 g/kg) and that of Fe were in Upper Dir (3.37 g/kg) and lower in Charsadda(2.06 g/kg).
3.2 Arsenic in soil
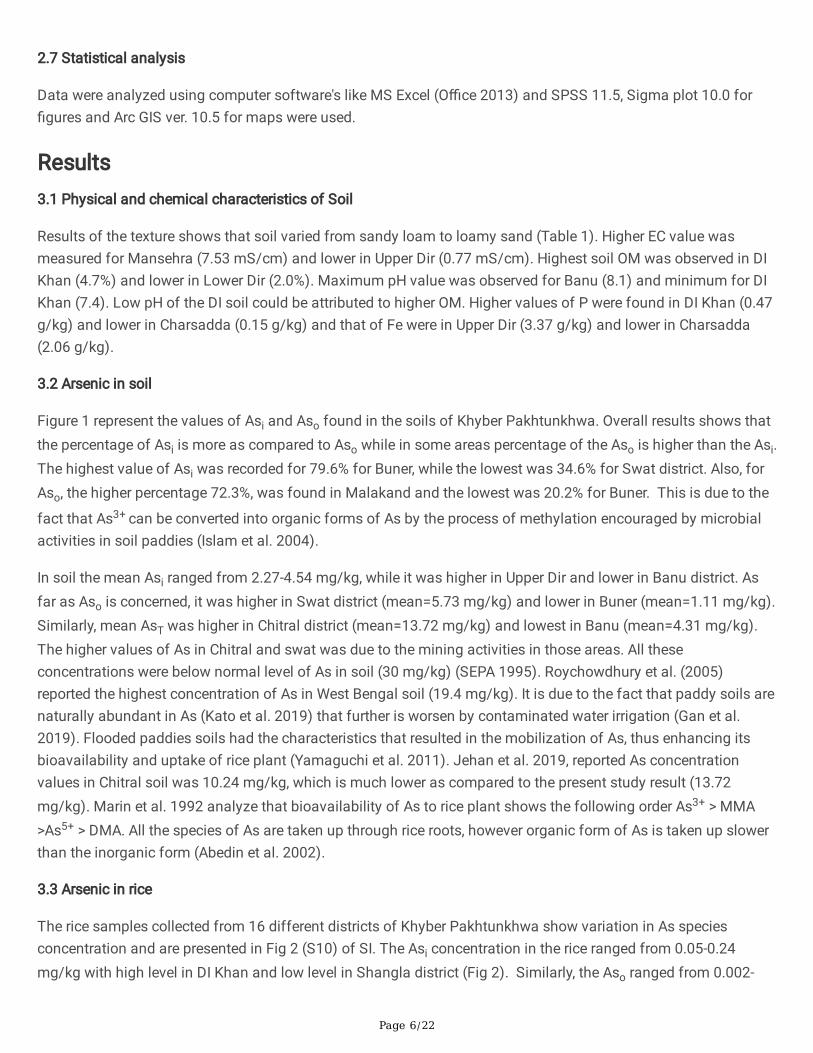
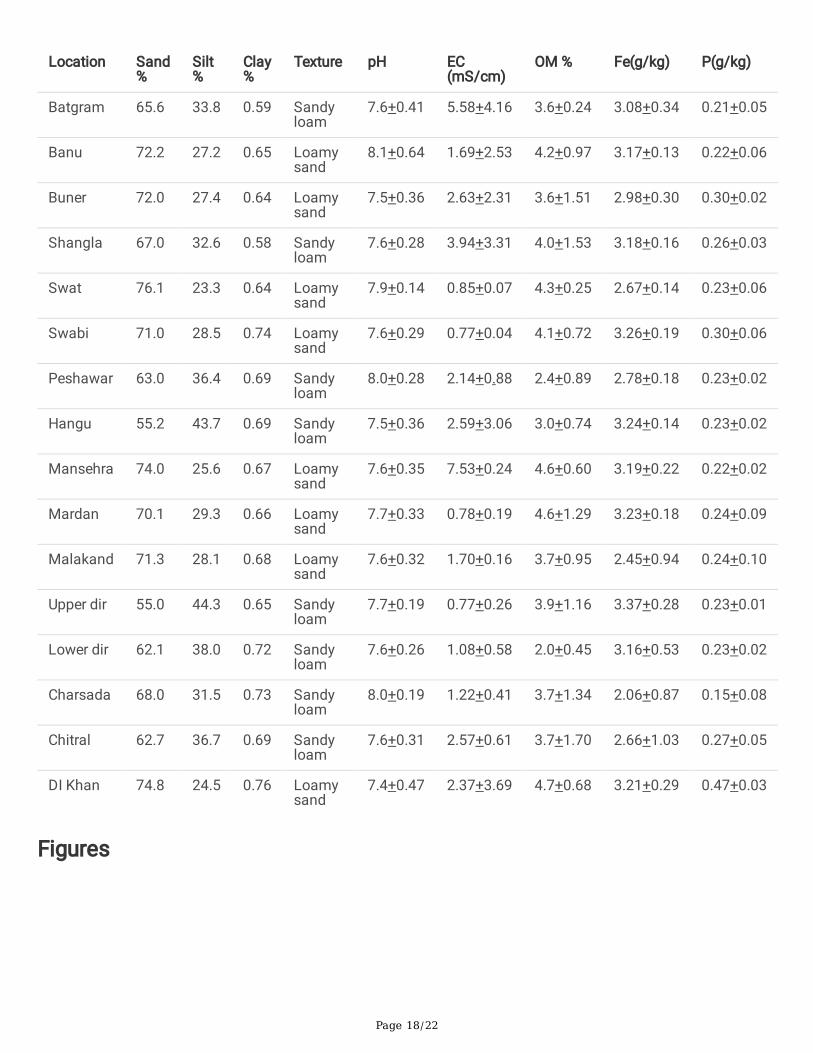
Figure 1 represent the values of Asi and Aso found in the soils of Khyber Pakhtunkhwa. Overall results shows thatthe percentage of Asi is more as compared to Aso while in some areas percentage of the Aso is higher than the Asi.The highest value of Asi was recorded for 79.6% for Buner, while the lowest was 34.6% for Swat district. Also, forAso, the higher percentage 72.3%, was found in Malakand and the lowest was 20.2% for Buner. This is due to the
fact that As3+ can be converted into organic forms of As by the process of methylation encouraged by microbialactivities in soil paddies (Islam et al. 2004).
In soil the mean Asi ranged from 2.27-4.54 mg/kg, while it was higher in Upper Dir and lower in Banu district. Asfar as Aso is concerned, it was higher in Swat district (mean=5.73 mg/kg) and lower in Buner (mean=1.11 mg/kg).Similarly, mean AsT was higher in Chitral district (mean=13.72 mg/kg) and lowest in Banu (mean=4.31 mg/kg).The higher values of As in Chitral and swat was due to the mining activities in those areas. All theseconcentrations were below normal level of As in soil (30 mg/kg) (SEPA 1995). Roychowdhury et al. (2005)reported the highest concentration of As in West Bengal soil (19.4 mg/kg). It is due to the fact that paddy soils arenaturally abundant in As (Kato et al. 2019) that further is worsen by contaminated water irrigation (Gan et al.2019). Flooded paddies soils had the characteristics that resulted in the mobilization of As, thus enhancing itsbioavailability and uptake of rice plant (Yamaguchi et al. 2011). Jehan et al. 2019, reported As concentrationvalues in Chitral soil was 10.24 mg/kg, which is much lower as compared to the present study result (13.72mg/kg). Marin et al. 1992 analyze that bioavailability of As to rice plant shows the following order As3+ > MMA>As5+ > DMA. All the species of As are taken up through rice roots, however organic form of As is taken up slowerthan the inorganic form (Abedin et al. 2002).
3.3 Arsenic in rice
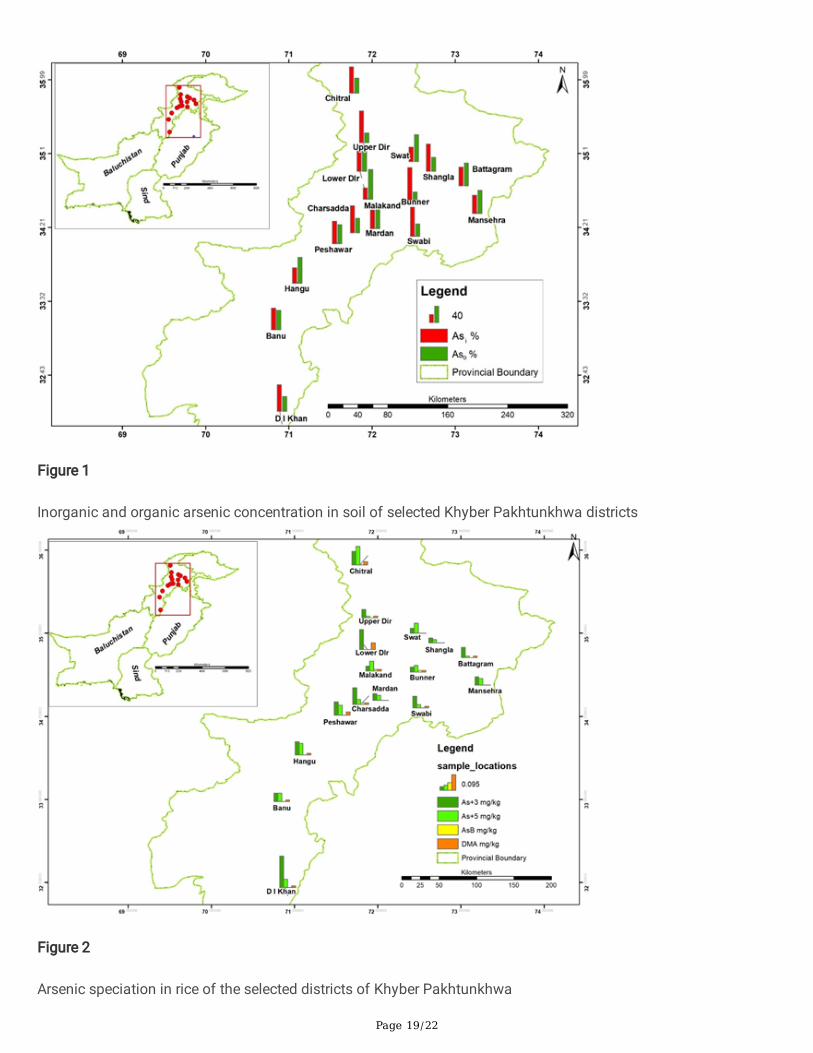
The rice samples collected from 16 different districts of Khyber Pakhtunkhwa show variation in As speciesconcentration and are presented in Fig 2 (S10) of SI. The Asi concentration in the rice ranged from 0.05-0.24mg/kg with high level in DI Khan and low level in Shangla district (Fig 2). Similarly, the Aso ranged from 0.002-
Page 7/22
0.02 mg/kg with maximum concentration in Charsadda and minimun in Mardan. Also, the AsT was ranged 0.06-0.28 mg/kg, which was higher in DI Khan and lower in Shangla.
Flooded rice paddies has the characteristics of reducing environment, and this anoxic condition enhances theavailability and mobility of As3+ as compared to that of As5+, because of the process of dissolution of Fe (Niazi etal. 2011; Shakoor et al. 2018). Earlier studies showed that Asi and DMA were the most common species of Asdetected in rice (Meharg et al., 2009; Zhu et al. 2008), while MMA occurred rarely with low content (Zhao et al.2013b). Wu et al. 2019) also found similar result that the concentration of different species of As (As3+, As5+, andDMA) dominates in rice grains, but, no MMA was found in the samples of rice. For AsT the highest concentrationwas in DI Khan rice 0.28 mg/kg and lower in Shangla rice 0.062 mg/kg, which is much less than the studyconducted by Jehan et al. 2019 (3.33 mg/kg). The studies had explained that in Pakistan the rice are cultivated inpaddy soils that could possible host higher As concentration (Kato et al. 2019). Also, this contamination increasesbecause of irrigation of soil with As-contaminated water irrigation (Gan et al. 2019). Another reason may be thecapacity of rice to accumulate As double than other grains i.e. wheat and barley (Jehan et al. 2019; Mitani et al.2009; Ma et al. 2008). Selenite and selenate are found to facilitate the arsenate adsorption by paddy soil also theyinhibited the uptake of arsenate by rice roots. Further selenate has stronger inhibition on iAs transfer factors thanselenite (Pokhrel et al. 2020).
Numerous researches on speciation of As in South and South East Asia found Asi which is highly toxic constituteabout 42%-91% of AsT in rice while in America rice, the major specie of As is DMA (Schoof et al. 1999; Meharg etal. 2009). Other researches also showed that Asi (75%-90%) is high in different products of rice such as, baby rice,rice crackers, breakfast cereals, rice milk, and other products of rice (Sun et al. 2009).
3.4 Relation of Arsenic and soil physicochemical characteristics
Clayey and silty soils have �ner texture, more surface area and higher As scavenging capability as compared tosandy soils, which is because of the Fe oxides presence. Hence, clayey soils plants show less toxic effects of As;As phytotoxicity is �ve times high in loamy and sandy soils (Quazi et al. 2011).
The highest OM value is present in soils containing dolomite, while those with greater pyrite and phyllosilicateslevels showed very less OM content. The results shown that samples with higher OM content, displayed lower Ascontent. Soil OM is responsible for the mobility of As also its complexes (soluble or insoluble) and chemicalnature (William et al. 2011). Pikaray et al. (2005) testi�ed that solubility of As decreased in soils with high value ofOM, which affect its accessibility to plant, as OM has a high a�nity for sorption of As because of the formation ofdifferent OM complex. However, on the other side, there is a positive correlation between As accumulation and soilOM in rice grain (Jia et al. 2013). OM increase in the soil can increase the As mobility with the help of increasingmicrobial activities and by decreasing redox potential of the soil (Turpeinen et al. 1999), which is a favorablecondition for the reduction of Fe-oxyhydroxides which is linked to OM (Reza et al. 2010).
The highest adsorption was nearby pH 7 (Miyatake and Hayashi 2011). Tabassum et al. 2018 and Bibi et al.(2015b) presented strong positive correlation of As contents with pH, in Rawalpindi and Hasilpur areas. Theleaching of As also its speciation depends upon the soil pH, therefore the availability of As as well as its solubilitydepends on soil pH (Chatterjee et al. 2013; Quazi et al. 2011). Some researches (Signes-Pastor et al.2007) showed that the uptake and accumulation of As by rice plant is affected by both low and high pH. Thereason may be that at low pH (pH < 5), Fe-oxyhydroxide compounds which are As-binding species, becoming
Page 8/22
highly soluble and increase the uptake of As by plants. Bhattacharya et al. 2010 also supported the negativerelationship between soil pH and As concentration in rice. On the other hand, many authors supported the idea ofa positive relationship between soil pH and As accumulation (Ahmed et al. 2011; Campbel et al. 1985). increasingsoil pH (such as pH 8.5) rises the negative surface charges (hydroxyl ions), which facilitates As desorption fromFe-oxides that leads to mobilization of As in the root, which, in turn, increases accumulation of As in the plant(Ahmed et al. 2011). As the pH decreases As3+ solubility increases with the soil pH range (pH 3-9), whereas in thecase of As5+ this pattern is reversed. In �ooded paddy soils As3+ predominates. In this regard, for the current study,a decrease in soil pH can enhance the mobility of soil As, which gives the reason why we observed almost equalconcentrations of As in rice grain irrespective of the levels of soil As (Sahoo and Kim 2013).
By the application of external P, the uptake of As is reduced and the toxicity symptoms of As5+ alleviates. Differentresearches (Pigna et al. 2010; Rahman and Hasegawa 2011) have described that with the increasing P value innutrient solution, decreases As5+ uptake by the rice plant. In plant physiology and biochemistry, P plays asigni�cant role (Shin et al. 2004). In As contaminated soil, there are some properties such as As concentration insoil solution, application of phosphatic fertilizers and other soil physicochemical properties control As uptake byrice plant (Geng et al. 2005; Farooq et al. 2016; Liu et al. 2004) described that if there is su�cient P in soil it willresult in less Fe-plaques formation on the rice roots, while the lack of P in the soil solution enhances the plaqueformation on the rice roots. Less amount of P in plant tissues can be useful in increasing oxygen transportation inrice roots (Kirk and Van Du 1997) which may encourage Fe plaque formation on the rice roots. Several studiessupported the idea of application of phosphate to soil, lowers the As content in Fe-plaques leading to increase insolubility of As and bioavailability to the soil rhizosphere (Azam et al. 2016; Smith et al. 2002).
The Matsumoto et al. (2015) investigated that if the rice �eld is amended with Fe-oxide and metallic Fe, it willreduce As content in rice grain by 47% and 51%, respectively. This may be due to the fact that As binds with Fe-(hydr)/oxides in soil (Inskeep et al. 2002) which has a great effect on the mobility of As in soil solution (Marin etal. 1993). The strong a�nity of Fe (an essential mineral of plants) towards As helps to decrease the As adsorptionin rice (Yamane 1989; Nath et al. 2014). Some of the effects by the application of external Fe and its compoundsin soil include: (i) Fe (Fe-oxide) deposits around rice roots reduces the uptake of As in rice roots, (ii) the co-precipitation of Fe and As enhances and (iii) it reduces the desorption of soluble As because of the adsorption ofAs5+ on the surface of Fe. Anaerobic condition for rice cultivation encourage the Fe-plaque formation around theroots of the rice plant (Armstrong 1964). Ferrihydrate (63%), siderite (5%) and goethite (32%) constitute Fe-plague(Hansel et al. 2002). The concentration of free Fe around the rice roots also rises its concentration in therhizosphere that further lowers uptake of As in rice plants (Geng et al. 2005; Syu et al. 2014). Fe-plaques has higha�nity towards As5+, therefore it plays an important part in decreasing the As uptake in rice. For the sequestrationof As, Fe-plague is probably the best solution which ultimatle reduces the transport of As from roots to shoot inrice plant (Liu et al. 2004). Leonardite had a higher e�ciency to adsorb As than biochar’s because of the ironcontents in leonardite which strongly bind to As anions (Dolphen and Thiravetyan 2019).
3.5 Comparison of As level in rice of mining and non-mining areas
One of the most important human activities that contaminate our environment with As is mining (Williams et al.2009). Due to the presence of As in many minerals and other human activities such as mining, As-contaminatedwaste water irrigation, fertilizers and pesticides application containing As, As became one of the most commoncontaminants affecting human health via food chains (Zhu et al. 2014). As is present naturally in many ores such
Page 9/22
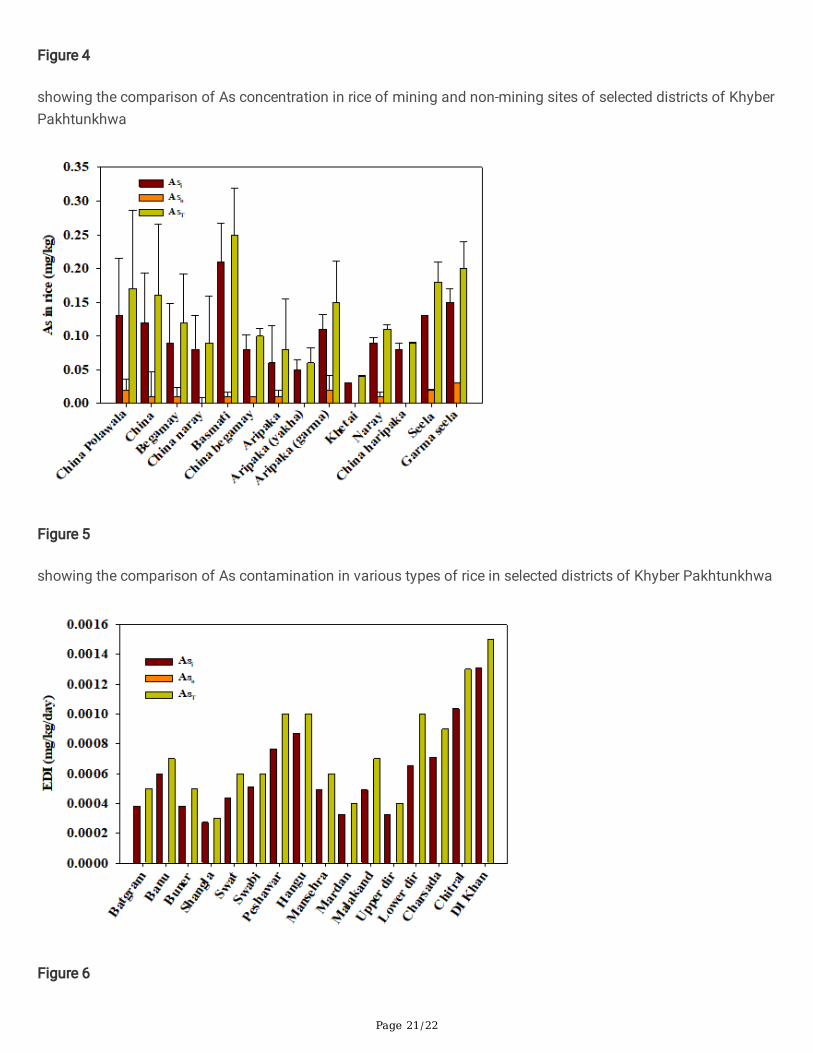
as Cu, Pb, Au and Zn ores. Therefore, in mine impacted areas, As is found in soils at higher levels, posing a risk tonot only human health but also ecosystem health (Li et al. 2014). Current study reported high Asi, Aso and AsT inmining areas. In non-mining areas, the Asi concentration is higher in Peshawar (0.14 mg/kg) and while lower inMardan (0.06 mg/ kg). Aso was higher in Charsadda (0.02 mg/kg) while lower in Mardan (0.002 mg/kg). While theconcentration of AsT is higher in Peshawar (0.018 mg/kg) and lower in Mardan (0.07 mg/kg). By comparing theseresults with the mining areas result it was concluded that for Asi the highest value was detected in rice grown in DIKhan (0.24 mg/kg) and lowest in Shangla (0.05 mg/kg). For Aso the maximum concentration was detected in therice of Lower Dir 0.03 mg/kg while the lowest concentration was found in Shangla (0.002 mg/kg). For AsT highestvalue is (0.28 mg/kg) in rice of DI Khan while lowest value is (0.06 mg/kg) in Shangla rice as shown in Fig 3. Theoverall results depicted that the highest values for the species of As as well as the AsT was in the rice of miningareas such as DI Khan. But there are some non-mining areas such as (Peshawar AsT= 0.18 mg/kg) which shows alittle higher concentration than the mining areas (Buner AsT =0.09 mg/kg, Shangla AsT = 0.06 mg/kg and UpperDir AsT = 0.08 mg/kg). The reason behind this may be due to higher level of pollution in Peshawar district. Thisgap need to be �lled through further research that why non mining areas show higher concentration of As than themining areas.
Both the natural and anthropogenic activities are the sources of As (Duan et al. 2013). Among the natural sources,volcanism and bed rocks weathering are important while among anthropogenic sources, metal mining andsmelting, the use of As-pesticides, herbicides, feed additives, wood preservatives and irrigation with As-contaminated water are important sources that results in elevated levels of As in soil (Zhao et al. 2009). One ofthe main pathways of human exposure to As is the transport of As in soil-plant systems (Dave 2013). Most of thesamples in mining sites shows a higher trend of As and its different species as compared to non-mining sites. Theconcentration of As in soil of mining area was higher (0.624 mg/kg) than the non-mining area (0.096 mg/kg) inHunan Province, China (Zhu et al. 2008). As is a natural constituent some ores such as ores of Cu, Pb, Zn, and Au.This is the reason why As is mostly found at elevated levels, in mining areas soils posing a risk to health of bothecosystem and human (Li et al. 2014). None of the district of the study area exceeds the acceptable range (0.5mg/kg) of AsT by (WHO 2011). Kwon et al., 2017 also stated that the values of As was high (0.247 mg/kg) in therice of mining areas of Korea as compared to other lands.
3.6 As concentration in different rice types of Khyber Pakhtunkhwa
Arsenic concentration in different types of rice are presented in Fig 4, which shows that Asi is higher in basmatirice type (0.21 mg/kg) while low in khetai rice (0.03 mg/kg). Aso higher concentration was found in garmaseela (0.3 mg/kg) while lower in china haripaka, china naray and khetai (0.00 mg/kg). Also the AsT concentrationwas high in basmati rice type (0.25 mg/kg) as compare to others, while lowest in Khetai rice (0.04 mg/kg). Anoverall assessment of As concentration was as follow; Asi basmati > garma seela > china polawal/ seela > china >aripaka (garma) > begamay/ naray > china naray/ china haripaka/ china begamay > aripaka > aripaka (yakha)khetai. Aso, garma seela > seela/ aripaka (garma) / china polawala > china / begamay/ basmati/ china begamay/aripaka/ naray/ aripaka (yakha)/ china naray/ khetai/ china haripaka. AsT, Basmati > garma seela > seela > chinapolawala > china > aripaka (garma) > begamay > naray > china begamay > china haripaka > china naray > aripaka> aripaka (yakha) > khetai. Previous �ndings revealed that the average As values in American rice type (whiteBasmati) from Texas was (0.26 ± 0.08 mg/kg) (Zavala and Duxbury 2008).
Page 10/22
3.7 Chronic Health Risk Assessment
3.7.1 Estimation of EDI
The local people were assumed to consume the local rice. In Pakistan, per capita consumption of rice is very lowonly 20.8 kg due to high cost of rice (Bashir et al. 2010). The mean estimated daily intake (EDI) and its standarddeviation of Asi through rice consumption ranged from lowest 0.000273 mg/kg/day in Shangla to highest0.00131mg/kg/day in DI Khan (Fig. 5). While, the estimated daily intake of Aso through rice consumption were
ranged from 1.09x10⁻⁵ mg/kg/day in Mardan to 2.03x10⁻⁴ mg/kg/day in Lower Dir. Also, estimated daily intake forAsT showed that it was lower in Shangla (0.0003 mg/kg/day) higher in DI Khan (0.0015 mg/kg/day).
Previous �ndings indicate that EDI values for AsT were equivalent to those values calculated in Bangladesh rice
(5.00×10⁻²–5.00×10⁻¹ mg/kg/day), Vietnam (1.1 × 10⁻³ –4.3 × 10⁻³ mg/kg/day) and Turkey (2.3×10⁻⁵–5.21×10⁻³
mg/kg/day) (Caylak 2012; Karim 2000; Nguyen et al. 2009).
3.7.2 Cancer Risk Assessment
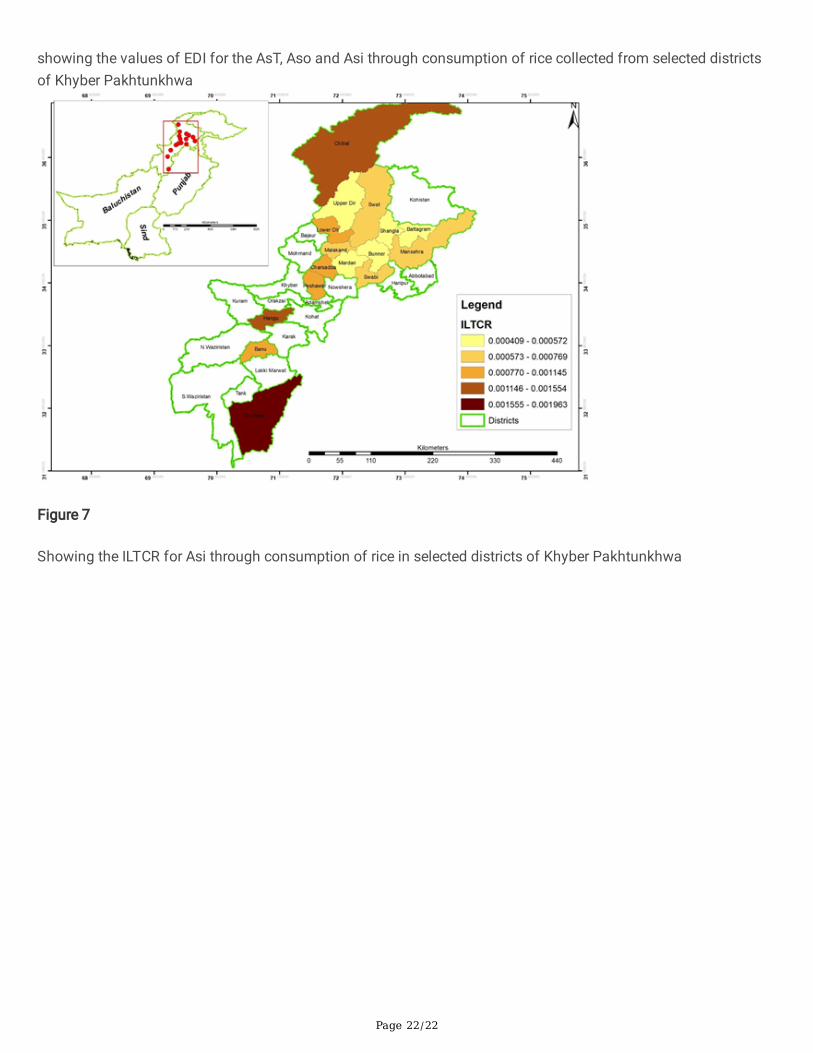
The cancer risk was calculated by the formula of ILTCR, which is attained by multiplying EDI of Asi with the CSFwhich is 1.5 for AsT. The ILTCR risk calculated was high for DI Khan district (1.9E-3 mg/kg/day). The lowestcalculated cancer risk was for district Shangla (4.1E-4 mg/kg/day) as shown in Fig 6. Earlier risk assessments forAs exposure via Indian rice consumption described risk results almost similar to this study using Indian intakevalues i.e. 7 adults in population of 10,000 (Meharg et al. 2009; Mondal and Polya 2008). In Bangladesh, studies(Meharg et al. 2009) also report same levels of cancer risk (with 19, 22 men and women 423 in10, 000 population)in adults.
ConclusionThe As speciation in rice plays an essential role in evaluating the human’s toxicity. This study has focused on Asspeciation in rice, mechanism and the factors that can effect As uptake by rice. High rice consumption is themajor exposure pathway of As in human beings. The rice in Pakistan is cultivated in paddy soils, which is one ofthe reason of As uptake by rice plants. The As3+ is the most toxic specie of As, which is highly carcinogenic innature. Different factors such as redox Fe-Plague effect, pH, OM effect, soil texture effect, phosphate, As bond toFe-Mn oxides, irrigation practices, seasonal variations and the genotype effect could affect the bioavailability andsolubility of As in rice plants. These factors resulted in increasing or decreasing the As uptake by rice plant. Thetotal level of soil As and rice As samples ranged from 13.72 mg/kg to 4.31 mg/kg and 0.28 mg/kg to 0.06 mg/kgrespectively. The study analysis showed that there are mainly 5 As species (As(III), DMA, MMA, As(V) and BAs) inthe rice samples, with Asi form being the most abundant and toxic species with concentrations of 0.23 mg/kg to0.04 mg/kg. The hazardous effect of As on Khyber Pakhtunkhwa people cannot be neglected. The people ofKhyber Pakhtunkhwa are at risk of exposure to adverse effects of As. Based on our study results, along with therisk assessment, we concluded that the values of ILTCR ranged from 4.1E-4 mg/kg/day to1.9E-3 mg/kg/d. Whilethe said results are boosting further �eld research studies are needed to explore the sources of As contaminationin rice paddies. Also factors that are responsible for the higher level of As in rice grown in non-mining areas.
Declarations
Page 11/22
Acknowledgments
Higher Education Commission (HEC) of Pakistan is highly acknowledged for �nancial support.
Funding; this study was funded by HEC
Con�icts of interest/Competing interests; No con�ict of interest.
Availability of data and material; all data and materials as well as software application or custom code supportthe published claims and comply with �eld standards.
Code availability; (software application or custom code)
Authors' contributions;
Tasneem Sarwar: Data collection, writing, methodology. Sardar Khan & Huang Qing: Supervision, editing,conceptualization. Javed Nawab & Said Muhammad: Reviewing and Editing. Shehla Amin: data collection. JanasKhan: software, visualization.
Ethics approval; NA
Consent to participate; NA
Consent for publication; NA
References1. Abedin MJ, Feldmann J, Meharg AA (2002) Uptake kinetics of arsenic species in rice plants. Plant physiol
128(3), 1120-1128.
2. Afroz H, Su S, Carey M, Meharg AA, Meharg C (2019) Inhibition of Microbial Methylation via arsM in theRhizosphere: Arsenic Speciation in the Soil to Plant Continuum. Env. Sci.Technol, 53(7), 3451-3463.
3. Ahmed MK, Shaheen N, Islam MS, Habibullah-Al-Mamun M, Islam S, Islam MM, Bhattacharjee L (2016) Acomprehensive assessment of arsenic in commonly consumed foodstuffs to evaluate the potential healthrisk in Bangladesh. Sci total environ, 544, 125-133.
4. Ahmed ZU, Panaullah GM, Gauch H, McCouch SR, Tyagi W, Kabir MS, Duxbury JM (2011) Genotype andenvironment effects on rice (Oryza sativa L.) grain arsenic concentration in Bangladesh. Plant Soil, 338(1-2),367-382.
5. Anawar HM, Rengel Z, Damon P, Tibbett M, (2018) Arsenic-phosphorus interactions in the soil-plant-microbesystem: dynamics of uptake, suppression and toxicity to plants. Environ. pollut. 233, 1003-1012.
�. Aqeel M, Maah M, Yusoff I, (2014) Soil Contamination, Risk Assessment and Remediation. Environ. RiskAssess. Soil Cont. 3-56.
7. Ashraf MA, Maah MJ, Yusoff I (2014) Soil contamination, risk assessment and remediation. Environ. RiskAssess. Soil Cont, 3-56.
�. Azad MAK, Islam MN, Alam A, Mahmud H, Islam M, Karim MR, Rahman M (2009) Arsenic uptake andphytotoxicity of T-aman rice (Oryza sativa L.) grown in the As-amended soil of Bangladesh. Environmentalist.29(4), 436-440.
Page 12/22
9. Azam SMGG, Sarker TC, Naz S (2016) Factors affecting the soil arsenic bioavailability, accumulation in riceand risk to human health: a review. Toxicol mech method. 26(8), 565-579.
10. Bhattacharya P, Samal A, Majumdar J, Santra S (2010) Accumulation of arsenic and its distribution in riceplant (Oryza sativa L.) in Gangetic West Bengal, India. paddy water environ 8(1), 63-70.
11. Bibi M, Hashmi MZ, Malik RN (2015) Human exposure to arsenic in groundwater from Lahore district,Pakistan. Environ. Toxicol. Pharmacol. 39(1), 42-52.
12. Bogdan K, Schenk MK (2009) Evaluation of soil characteristics potentially affecting arsenic concentration inpaddy rice (Oryza sativa L.). Environ. pollut., 157(10), 2617-2621.
13. Caylak E (2012) Health risk assessment for arsenic in water sources of Cankiri Province of Turkey. Clean–Soil, Air, Water, 40(7), 728-734.
14. Chakraborti D, Rahman MM, Paul K, Chowdhury UK, Sengupta MK, Lodh D, Mukherjee S C (2002) Arseniccalamity in the Indian subcontinent: what lessons have been learned? Talanta, 58(1), 3-22.
15. Chatterjee S, Datta S, Mallick PH, Mitra A, Veer V, Mukhopadhyay SK (2013) Use of wetland plants inbioaccumulation of heavy metals Plant-based remediation processes (pp. 117-139): Springer.
1�. Cozzolino V, Pigna M, Di Meo V, Caporale AG, Violante A, Meharg AA (2010) In�uence of phosphate additionon the arsenic uptake by wheat (Triticum durum) grown in arsenic polluted soils. Fresenius environmentalbulletin, 19(5), 838-845.
17. Dávila-Esqueda ME, Jiménez-Capdeville ME, Delgado JM, De la Cruz E, Aradillas-García C, Jiménez-Suárez V,Llerenas JR (2012) Effects of arsenic exposure during the pre-and postnatal development on the puberty offemale offspring. Exp toxicol pathol. , 64(1-2), 25-30.
1�. Dembitsky VM, Rezanka T (2003) Natural occurrence of arseno compounds in plants, lichens, fungi, algalspecies, and microorganisms. Plant Science, 165(6), 1177-1192.
19. Dolphen R, Thiravetyan P 2019 Reducing arsenic in rice grains by leonardite and arsenic–resistantendophytic bacteria. Chemosphere, 223, 448-454.
20. Fu Y, Chen M, Bi X, He Y, Ren L, Xiang W, Ma Z (2011) Occurrence of arsenic in brown rice and its relationshipto soil properties from Hainan Island, China. Environ. pollut., 159(7), 1757-1762.
21. Gan Y, Huang X, Li S, Liu N, Li YC, Freidenreich A, Dai J (2019) Source quanti�cation and potential risk ofmercury, cadmium, arsenic, lead, and chromium in farmland soils of Yellow River Delta. J. Clean. Prod. 221,98-107.
22. Garbinski LD, Rosen BP, Chen J (2019) Pathways of arsenic uptake and e�ux. Environ. Int.126, 585-597.
23. Geng C-N, Zhu Y-G, Liu W-J, Smith SE (2005) Arsenate uptake and translocation in seedlings of twogenotypes of rice is affected by external phosphate concentrations. Aquat. Bot. 83(4), 321-331.
24. Huhmann B, Harvey CF, Uddin A, Choudhury I, Ahmed KM, Duxbury JM, Ellis T, van Geen A, (2019) Inversion ofHigh-Arsenic Soil for Improved Rice Yield in Bangladesh. Environ sci technol 53, 3410-3418.
25. Islam FS, Gault AG, Boothman C, Polya DA, Charnock JM, Chatterjee D, Lloyd JR (2004) Role of metal-reducing bacteria in arsenic release from Bengal delta sediments. Nature, 430(6995), 68.
2�. Islam M, Jahiruddin M, Islam S (2004) Assessment of arsenic in the water-soil-plant systems in Gangetic�oodplains of Bangladesh. Asian J. Plant Sci, 3(4), 489-493.
27. Izah SC, Chakrabarty N, Srivastav AL (2016) A review on heavy metal concentration in potable water sourcesin Nigeria: Human health effects and mitigating measures. Expos Health, 8(2), 285-304.
Page 13/22
2�. Jang Y, Somanna Y, Kim H (2016) Source, distribution, toxicity and remediation of arsenic in theenvironment–a review. Int. J. Appl. Environ. Sci 11(2), 559-581.
29. Jehan N, Waqas M, Khan MA, Muhammad J (2019) Arsenic concentration in paddy soil and its accumulationin rice: a health risk Assessment. JHES 52(1), 27.
30. Jia Y, Huang H, Sun G-X, Zhao F-J, Zhu Y-G. (2012) Pathways and relative contributions toarsenic volatilization from rice plants and paddy soil. Environ Sci Technol, 46, 8090–6.
31. Jia Y, Sun GX, Huang H, Zhu YG (2013) Biogas slurry application elevated arsenic accumulation in rice plantthrough increased arsenic release and methylation in paddy soil. Plant soil, 365(1-2), 387-396.
32. Joint F, Additives WECF, Organization WH (2011) Safety evaluation of certain contaminants in food: preparedby the Seventy-second meeting of the Joint FAO/WHO Expert Committee on Food Additives (JECFA).
33. Karim MM (2000) Arsenic in groundwater and health problems in Bangladesh. Water Res. 34(1), 304-310.
34. Kato LS, Fernandes EADN, Raab A, Bacchi MA, Feldmann J (2019). Arsenic and cadmium contents inBrazilian rice from different origins can vary more than two orders of magnitude. Food chem 286, 644-650.
35. Kato LS, Fernandes EADN, Raab A, Bacchi MA, Feldmann J, (2019) Arsenic and cadmium contents inBrazilian rice from different origins can vary more than two orders of magnitude. Food chem 286, 644-650.
3�. Khan KS, Mack R, Castillo X, Kaiser M, Joergensen RG (2016) Microbial biomass, fungal and bacterialresidues, and their relationships to the soil organic matter C/N/P/S ratios. Geoderma, 271, 115-123.
37. Khan S, Cao Q, Zheng YM, Huang YZ, Zhu YG, (2008) Health risks of heavy metals in contaminated soils andfood crops irrigated with wastewater in Beijing, China. Environ. Pollut. 152, 686–692.
3�. Khan S, Rauf R, Muhammad S, Qasim M, Din I (2016) Arsenic and heavy metals health risk assessmentthrough drinking water consumption in the Peshawar District, Pakistan. Human and ecological riskassessment: Int. J. Res., 22(3), 581-596.
39. Khan S, Rehman S, Khan AZ, Khan MA, Shah MT, (2010) Soil and vegetables enrichment with heavy metalsfrom geological sources in Gilgit, northern Pakistan. Ecotoxicol. Environ. Saf. 73, 1820–1827.
40. Khan S, Reid B J, Li G, Zhu YG (2014) Application of biochar to soil reduces cancer risk via rice consumption:a case study in Miaoqian village, Longyan, China. Environ. Int.68, 154-161.
41. Kowalczyk A, Latowski D, (2018) Role of Plant-Microorganism Interactions in Plant Tolerance to Arsenic.Mechanisms of Arsenic Toxicity and Tolerance in Plants. Springer, pp. 219-237.
42. Kumar M, Rahman MM, Ramanathan A, Naidu R (2016) Arsenic and other elements in drinking water anddietary components from the middle Gangetic plain of Bihar, India: health risk index. Sci total environ, 539,125-134.
43. Kwon JC, Nejad ZD, Jung MC (2017) Arsenic and heavy metals in paddy soil and polished rice contaminatedby mining activities in Korea. Catena, 148, 92-100.
44. Li RY, Stroud JL, Ma JF, Mcgrath SP, Zhao FJ. (2009) Mitigation of arsenic accumulation in rice with watermanagement and silicon fertilizers. Environ Sci Technol, 43, 3778–83.
45. Li J, Dong F, Lu Y, Yan Q, Shim H (2014) Mechanisms controlling arsenic uptake in rice grown in miningimpacted regions in South China. PloS one, 9(9).
4�. Magnusson, B., 2014. The �tness for purpose of analytical methods: a laboratory guide to method validationand related topics (2014).
Page 14/22
47. Ma L, Wang L, Jia Y, Yang Z (2016) Arsenic speciation in locally grown rice grains from Hunan Province,China: Spatial distribution and potential health risk. Sci total environ, 557, 438-444.
4�. Malana MA, Khosa MA (2011) Groundwater pollution with special focus on arsenic, Dera Ghazi Khan-Pakistan. J. Saudi Chem. Soc.15(1), 39-47.
49. Marin A, Masscheleyn P, Patrick W (1992) The in�uence of chemical form and concentration of arsenic onrice growth and tissue arsenic concentration. Plant and Soil, 139(2), 175-183.
50. Martin-Chouly C, Morzadec C, Bonvalet M, Galibert M-D, Fardel O, Vernhet L (2011) Inorganic arsenic altersexpression of immune and stress response genes in activated primary human T lymphocytes. Mol.Immunol.48(6-7), 956-965.
51. Masood N, Farooqi A, Zafar MI (2019) Health risk assessment of arsenic and other potentially toxic elementsin drinking water from an industrial zone of Gujrat, Pakistan: a case study. environ monit assess. 191(2), 95.
52. Mataveli LR V, Buzzo ML, Arauz LJ D, Carvalho MDF H, Arakaki EEK, Matsuzaki R, Tiglea P (2016). Totalarsenic, cadmium, and lead determination in Brazilian rice samples using ICP-MS. J Anal Methods Chem,2016.
53. Meharg AA, Rahman MM (2003) Arsenic contamination of Bangladesh paddy �eld soils: implications for ricecontribution to arsenic consumption. Env. Sci. Technol 37(2), 229-234.
54. Meharg AA, Williams PN, Adomako E, Lawgali YY, Deacon C, Villada A, Feldmann J (2009) Geographicalvariation in total and inorganic arsenic content of polished (white) rice. Env. Sci. Technol 43(5), 1612-1617.
55. Meharg AA, Zhao F-J, (2012) Strategies for producing low arsenic rice. Arsenic & Rice. Springer, pp. 139-151.
5�. Mitani N, Chiba Y, Yamaji N, Ma JF (2009) Identi�cation and characterization of maize and barley Lsi2-likesilicon e�ux transporters reveals a distinct silicon uptake system from that in rice. Plant Cell. 21(7), 2133-2142.
57. Mitra A, Chatterjee S, Gupta DK, (2020) Environmental Arsenic Exposure and Human Health Risk. ArsenicWater Resources Contamination. Springer, pp. 103-129.
5�. Mondal D, Polya DA (2008) Rice is a major exposure route for arsenic in Chakdaha block, Nadia district, WestBengal, India: A probabilistic risk assessment. J. Appl. Geochem. 23(11), 2987-2998.
59. Muhammad S, Shah MT, Khan S (2010) Arsenic health risk assessment in drinking water and sourceapportionment using multivariate statistical techniques in Kohistan region, northern Pakistan. Food chemtoxicol48(10), 2855-2864.
�0. Muhammad S, Shah MT, Khan S, (2011) Heavy metal concentrations in soil and wild plants growing aroundPb–Zn sul�de terrain in the Kohistan region, northern Pakistan. microchem j. 99, 67-75.
�1. Nguyen VA, Bang S, Viet PH, Kim K-W (2009) Contamination of groundwater and risk assessment for arsenicexposure in Ha Nam province, Vietnam. Environ. Int.35(3), 466-472.
�2. O’Bryant SE, Edwards M, Menon C, Gong G, Barber R (2011) Long-term low-level arsenic exposure isassociated with poorer neuropsychological functioning: a Project frontier study. International journal ofenvironmental research and public health, 8(3), 861-874.
�3. Paikaray S, Banerjee S, Mukherji S (2005) Sorption of arsenic onto Vindhyan shales: Role of pyrite andorganic carbon. Curr. Sci. 1580-1585.
�4. Parvez F, Chen Y, Yunus M, Olopade C, Segers S, Slavkovich V, Islam T (2013) Arsenic exposure and impairedlung function. Findings from a large population-based prospective cohort study. Am J Resp Crit Care
Page 15/22
Med. 188(7), 813-819.
�5. Pfeifer H, Beatrizotti G, Berthoud J, De Rossa M, Girardet A, Jäggli M, Schlegel C (2002) Natural arsenic-contamination of surface and ground waters in Southern Switzerland. Bulletin appl. Geol. 7, 83-105.
��. Pizarro I, Gómez M, Palacios MA, Cámara C (2003). Evaluation of stability of arsenic species in rice. Anal.Bioanal. Chem., 376(1), 102-109.
�7. Pokhrel GR, Wang KT, Zhuang H, Wu Y, Chen W, Lan Y, Yang G (2020) Effect of selenium in soil on the toxicityand uptake of arsenic in rice plant. Chemosphere, 239, 124712.
��. Pravalprukskul P, Aung MT, Wichelns D (2018) Arsenic in rice: state of knowledge and perceptions inCambodia.
�9. Quazi S, Datta R, Sarkar D (2011) Effects of soil types and forms of arsenical pesticide on rice growth anddevelopment. Int. J. of Env. Sci. Technol. 8(3), 445-460.
70. Rahaman S, Sinha AC, Mukhopadhyay D (2011) Effect of water regimes and organic matters on transport ofarsenic in summer rice (Oryza sativa L.). J. Environ Sci. 23(4), 633-639.
71. Rahman MA, Rahman A, Khan MZK, Renzaho AM (2018) Human health risks and socio-economicperspectives of arsenic exposure in Bangladesh: A scoping review. Ecotox environ safe. 150, 335-343.
72. Rahman MM, Ng JC, Naidu R (2009) Chronic exposure of arsenic via drinking water and its adverse healthimpacts on humans. Environ. Geochem. Health, 31(1), 189-200.
73. Rasool A, Farooqi A, Xiao T, Masood S, Kamran MA (2016) Elevated levels of arsenic and trace metals indrinking water of Tehsil Mailsi, Punjab, Pakistan. J. Geochem. Explor. 169, 89-99
74. Recio‐Vega R, Gonzalez‐Cortes T, Olivas‐Calderon E, Lantz RC, Gandol� AJ, Alba CGD (2015) In utero andearly childhood exposure to arsenic decreases lung function in children. J. appl. Toxicol. 35(4), 358-366.
75. Rehman U, Khan S, Muhammad S (2019) Ingestion of Arsenic-Contaminated Drinking Water Leads to HealthRisk and Traces in Human Biomarkers (Hair, Nails, Blood, and Urine), Pakistan. Expos Health, 1-12.
7�. Rehman ZU, Khan S, Qin K, Brusseau ML, Shah MT, Din I (2016) Quanti�cation of inorganic arsenic exposureand cancer risk via consumption of vegetables in southern selected districts of Pakistan. Sci total environ,550, 321-329.
77. Reza AS, Jean J-S, Yang H-J, Lee M-K, Woodall B, Liu C-C, Luo S-D (2010) Occurrence of arsenic in coresediments and groundwater in the Chapai-Nawabganj District, northwestern Bangladesh. Water Research,44(6), 2021-2037.
7�. Roper WR, Robarge WP, Osmond DL, Heitman JL (2019) Comparing Four Methods of Measuring Soil OrganicMatter in North Carolina Soils. soil sci soc am j 83(2), 466-474.
79. Rosen BP, Liu Z (2009) Transport pathways for arsenic and selenium: a mini review. Environ. Int.35(3), 512-515.
�0. Roychowdhury T, Tokunaga H, Uchino T, Ando M (2005) Effect of arsenic-contaminated irrigation water onagricultural land soil and plants in West Bengal, India. Chemosphere, 58(6), 799-810.
�1. Samal AC (2005) An investigation on accumulation of arsenic in ecosystem of Gangetic West Bengal andassessment of potential health risk. Ph. D Thesis, University of Kalyani.
�2.
�3. Sanz E, Munoz-Olivas R, Camara C, Sengupta MK, & Ahamed S (2007). Arsenic speciation in rice, straw, soil,hair and nails samples from the arsenic-affected areas of Middle and Lower Ganga plain. J ENVIRON SCI
Page 16/22
HEAL A, 42(12), 1695-1705.
�4. Sathe SS, Mahanta C, (2019) Groundwater �ow and arsenic contamination transport modeling for a multiaquifer terrain: Assessment and mitigation strategies. J. environ manage231, 166-181.
�5. Schoof R, Yost L, Eickhoff J, Crecelius E, Cragin D, Meacher D, Menzel D (1999) A market basket survey ofinorganic arsenic in food. Food chem toxicol37(8), 839-846.
��. Sharma S, Kaur I, Nagpal AK (2017) Assessment of arsenic content in soil, rice grains and groundwater andassociated health risks in human population from Ropar wetland, India, and its vicinity. Environ. Sci. Pollut.Res, 24(23), 18836-18848.
�7. Shen H, Xu W, Zhang J, Chen M, Martin FL, Xia Y, Zhu Y-G (2013) Urinary metabolic biomarkers link oxidativestress indicators associated with general arsenic exposure to male infertility in a Han Chinese population.Env. Sci. Technol 47(15), 8843-8851.
��. Signes-Pastor A, Burló F, Mitra K, Carbonell-Barrachina A (2007) Arsenic biogeochemistry as affected byphosphorus fertilizer addition, redox potential and pH in a west Bengal (India) soil. Geoderma, 137(3-4), 504-510.
�9. Smith AH, Hopenhayn-Rich C, Bates MN, Goeden HM, Hertz-Picciotto I, Duggan HM, Smith MT (1992) Cancerrisks from arsenic in drinking water. Environ. Health Perspect. 97, 259-267.
90. Srivastava PK, Vaish A, Dwivedi S, Chakrabarty D, Singh N, Tripathi RD (2011) Biological removal of arsenicpollution by soil fungi. Sci total environ, 409(12), 2430-2442.
91. Srivastava RK, Li C, Chaudhary SC, Ballestas ME, Elmets CA, Robbins DJ, Bickers DR (2013) Unfolded proteinresponse (UPR) signaling regulates arsenic trioxide-mediated macrophage innate immune functiondisruption. Toxicol. Appl. Pharmacol. 272(3), 879-887.
92. Su YH, McGrath SP, Zhao FJ (2010) Rice is more e�cient in arsenite uptake and translocation than wheat andbarley. Plant Soil, 328(1-2), 27-34.
93. Sun G-X, Williams PN, Zhu Y-G, Deacon C, Carey A-M, Raab A, Meharg AA (2009) Survey of arsenic and itsspeciation in rice products such as breakfast cereals, rice crackers and Japanese rice condiments. Environ.Int.35(3), 473-475.
94. Tabassum RA, Shahid M, Dumat C, Niazi NK, Khalid S, Shah NS, Khalid S (2019) Health risk assessment ofdrinking arsenic-containing groundwater in Hasilpur, Pakistan: effect of sampling area, depth, andsource. Environ. Sci. Pollut. Res 26(20), 20018-20029.
95. Turpeinen R, Pantsar-Kallio M, Häggblom M, Kairesalo T (1999) In�uence of microbes on the mobilization,toxicity and biomethylation of arsenic in soil. Sci total environ, 236(1-3), 173-180. doi: 10.1016/S0048-9697(99)00269-7
9�. Upadhyay MK, Majumdar A, Barla A, Bose S, Srivastava S, (2019) An assessment of arsenic hazard ingroundwater–soil–rice system in two villages of Nadia district, West Bengal, India. Env. Geochem Health, 1-15.
97. USEPA (United States Environmental Protection Agency) Toxicological review of inorganic arsenic. Draftdocument. EPA/635/R-10/001. Washington, DC, USA: USEPA; (2010) p. 575
9�. Wang S, Mulligan CN (2006) Occurrence of arsenic contamination in Canada: sources, behavior anddistribution. Sci total environ, 366(2-3), 701-721.
99. Williams PN, Zhang H, Davison W, Meharg AA, Hossain M, Norton GJ, Islam MR (2011) Organic Matter SolidPhase Interactions Are Critical for Predicting Arsenic Release and Plant Uptake in Bangladesh Paddy Soils.
Page 17/22
Env. Sci. Technol 45(14), 6080-6087.
100. Wu T-L, Cui X-D, Cui P-X, Ata-Ul-Karim ST, Sun Q, Liu C, Wang Y-J (2019) Speciation and location of arsenicand antimony in rice samples around antimony mining area. Environ. pollut..
101. Yamaguchi N, Nakamura T, Dong D, Takahashi Y, Amachi S, Makino T (2011) Arsenic release from �oodedpaddy soils is in�uenced by speciation, Eh, pH, and iron dissolution. Chemosphere, 83(7), 925-932.
102. Zavala YJ, Duxbury JM (2008) Arsenic in rice: I. Estimating normal levels of total arsenic in rice grain. Env.Sci. Technol 42(10), 3856-3860.
103. Zhang X, Zhong T, Chen D, Cheng M, Liu L, Zhang X, Li X (2016) Assessment of arsenic (As) occurrence inarable soil and its related health risk in China. Env. geochem health, 38(3), 691-702.
104. Zhao F-J, Zhu Y-G, Meharg AA (2013) Methylated arsenic species in rice: geographical variation, origin, anduptake mechanisms. Env. Sci. Technol 47(9), 3957-3966.
105. Zheng N, Wang QC, Zhang XW, Zheng DM, Zhang ZS, Zhang SQ. Population health risk due to dietary intakeof heavy metals in the industrial area of Huludao City, China. Sci Tot Environ 2007;387:96–104.
10�. Zhu Y-G, Sun G-X, Lei M, Teng M, Liu Y-X, Chen N-C, Raab A (2008) High percentage inorganic arsenic contentof mining impacted and nonimpacted Chinese rice. Env. Sci. Technol 42(13), 5008-5013.
107. Zhu Y-G, Xue X-M, Kappler A, Rosen BP, Meharg AA, (2017) Linking genes to microbial biogeochemicalcycling: lessons from arsenic. Environ Sci Technol. 51, 7326-7339.
TablesTable 1. Physiochemical properties of soil in the selected districts of Khyber Pakhtunkhwa
Page 18/22
Location Sand%
Silt%
Clay%
Texture pH EC(mS/cm)
OM % Fe(g/kg) P(g/kg)
Batgram 65.6 33.8 0.59 Sandyloam
7.6+0.41 5.58+4.16 3.6+0.24 3.08+0.34 0.21+0.05
Banu 72.2 27.2 0.65 Loamysand
8.1+0.64 1.69+2.53 4.2+0.97 3.17+0.13 0.22+0.06
Buner 72.0 27.4 0.64 Loamysand
7.5+0.36 2.63+2.31 3.6+1.51 2.98+0.30 0.30+0.02
Shangla 67.0 32.6 0.58 Sandyloam
7.6+0.28 3.94+3.31 4.0+1.53 3.18+0.16 0.26+0.03
Swat 76.1 23.3 0.64 Loamysand
7.9+0.14 0.85+0.07 4.3+0.25 2.67+0.14 0.23+0.06
Swabi 71.0 28.5 0.74 Loamysand
7.6+0.29 0.77+0.04 4.1+0.72 3.26+0.19 0.30+0.06
Peshawar 63.0 36.4 0.69 Sandyloam
8.0+0.28 2.14+0.88 2.4+0.89 2.78+0.18 0.23+0.02
Hangu 55.2 43.7 0.69 Sandyloam
7.5+0.36 2.59+3.06 3.0+0.74 3.24+0.14 0.23+0.02
Mansehra 74.0 25.6 0.67 Loamysand
7.6+0.35 7.53+0.24 4.6+0.60 3.19+0.22 0.22+0.02
Mardan 70.1 29.3 0.66 Loamysand
7.7+0.33 0.78+0.19 4.6+1.29 3.23+0.18 0.24+0.09
Malakand 71.3 28.1 0.68 Loamysand
7.6+0.32 1.70+0.16 3.7+0.95 2.45+0.94 0.24+0.10
Upper dir 55.0 44.3 0.65 Sandyloam
7.7+0.19 0.77+0.26 3.9+1.16 3.37+0.28 0.23+0.01
Lower dir 62.1 38.0 0.72 Sandyloam
7.6+0.26 1.08+0.58 2.0+0.45 3.16+0.53 0.23+0.02
Charsada 68.0 31.5 0.73 Sandyloam
8.0+0.19 1.22+0.41 3.7+1.34 2.06+0.87 0.15+0.08
Chitral 62.7 36.7 0.69 Sandyloam
7.6+0.31 2.57+0.61 3.7+1.70 2.66+1.03 0.27+0.05
DI Khan 74.8 24.5 0.76 Loamysand
7.4+0.47 2.37+3.69 4.7+0.68 3.21+0.29 0.47+0.03
Figures
Page 19/22
Figure 1
Inorganic and organic arsenic concentration in soil of selected Khyber Pakhtunkhwa districts
Figure 2
Arsenic speciation in rice of the selected districts of Khyber Pakhtunkhwa
Page 20/22
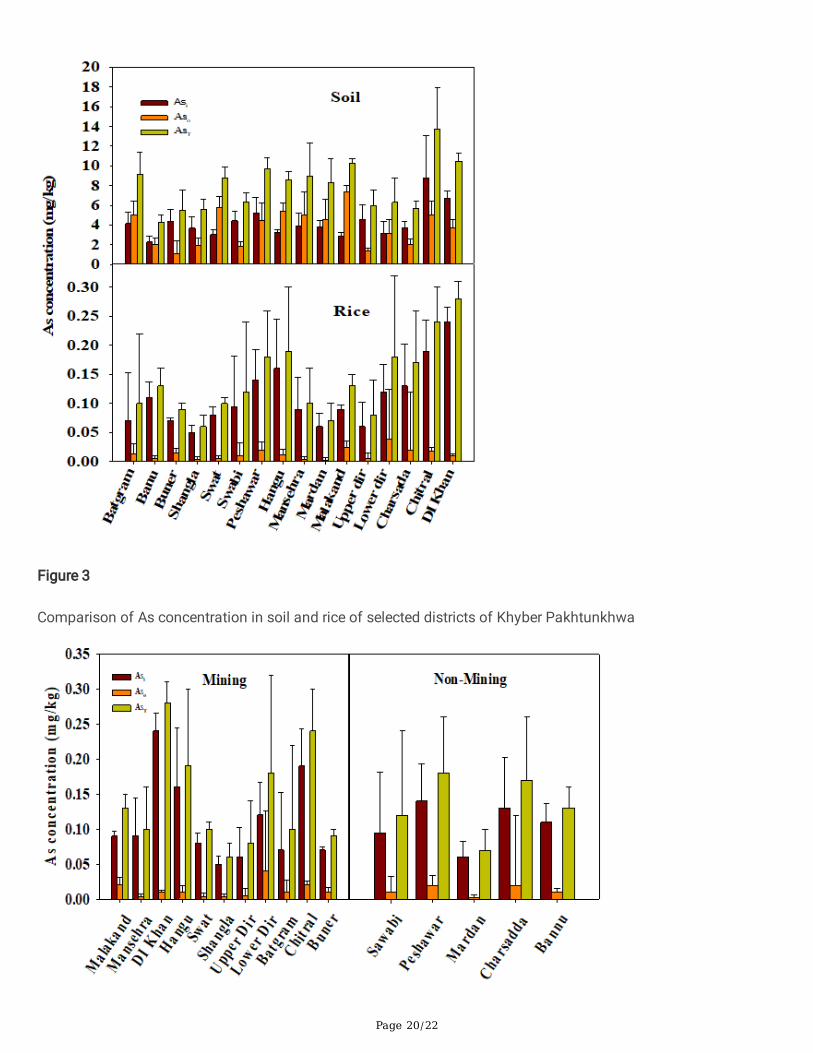
Figure 3
Comparison of As concentration in soil and rice of selected districts of Khyber Pakhtunkhwa
Page 21/22
Figure 4
showing the comparison of As concentration in rice of mining and non-mining sites of selected districts of KhyberPakhtunkhwa
Figure 5
showing the comparison of As contamination in various types of rice in selected districts of Khyber Pakhtunkhwa
Figure 6
Page 22/22
showing the values of EDI for the AsT, Aso and Asi through consumption of rice collected from selected districtsof Khyber Pakhtunkhwa
Figure 7
Showing the ILTCR for Asi through consumption of rice in selected districts of Khyber Pakhtunkhwa
![THE 1[KHYBER PAKHTUNKHWA] FINANCE ACT, 2007. …kp.gov.pk/uploads/2016/02/48._Finance_Act,_2007_.pdfTHE 1[KHYBER PAKHTUNKHWA] FINANCE ACT, 2007. (2[KHYBER PAKHTUNKHWA] ACT NO.II OF](https://img.pdfslide.us/doc/110x75/5e96b310754c26601908b211/the-1khyber-pakhtunkhwa-finance-act-2007-kpgovpkuploads20160248financeact2007pdf.jpg)

![THE 1[KHYBER PAKHTUNKHWA] 2[KHYBER PAKHTUNKHWA ...kp.gov.pk/uploads/2016/02/9._Khyber_Pakhtunkhwa_Development_Authority... · the 4[khyber pakhtunkhwa] 5[khyber pakhtunkhwa] development](https://img.pdfslide.us/doc/110x75/5d4e38ea88c99321748bb540/the-1khyber-pakhtunkhwa-2khyber-pakhtunkhwa-kpgovpkuploads2016029khyberpakhtunkhwadevelopmentauthority.jpg)

![THE KHYBER PAKHTUNKHWA PUBLIC PRIVATE ... - …...the Khyber Pakhtunkhwa in the Gazette of Khyber Pakhtunkhwa (Extraordinary),dated the 7th April,2014]. AN ACT to provide for the participation](https://img.pdfslide.us/doc/110x75/5e87dfce3492033642686624/the-khyber-pakhtunkhwa-public-private-the-khyber-pakhtunkhwa-in-the-gazette.jpg)