Embed Size (px)
Citation preview

District Skill Gap Study for the State of Uttarakhand
2
Table of contents
1. Introduction ................................................................................................................. 13 1.1 Background ........................................................................................................... 13 1.2 Scope of work ........................................................................................................ 13 1.3 Key definitions used in the report ............................................................................. 13 1.4 Our approach and methodology ............................................................................... 14 1.5 Limitations ............................................................................................................. 15 1.6 About this report ..................................................................................................... 15
2. Socio-economic profile of Uttarakhand ........................................................................... 16 2.1 Macro-economic overview ....................................................................................... 16 2.2 Demographic profile ............................................................................................... 17 2.3 Economic sectors overview ..................................................................................... 19
Further analysis for the three sectors is given in the subsequent sections. ............................. 20 2.3.1 Primary sector .................................................................................................... 20 2.3.2 Secondary sector ............................................................................................... 20 2.3.3 Tertiary sector .................................................................................................... 23
2.4 Infrastructure ......................................................................................................... 24 2.4.1 Physical infrastructure & connectivity .................................................................... 24 2.4.2 Industrial infrastructure ........................................................................................ 26 2.4.3 Social infrastructure ............................................................................................ 27
2.5 Labor market overview and key Government policies ................................................. 30 2.6 Other Skill Development Programs ........................................................................... 35 2.7 Migration in Uttarakhand ......................................................................................... 36
3. Skill gap scenario for Uttarakhand .................................................................................. 42 3.1 Human resource requirement .................................................................................. 42 3.2 Human resource supply .......................................................................................... 59 3.3 Estimating the gaps in Human resource demand and supply ....................................... 61
4. Stakeholders perspective : Available opportunities and issues to be addressed ................... 64 5. Recommendations and Action Plan ................................................................................ 76
5.1 Government .......................................................................................................... 76 5.1.1 Strengthening the Institutional Mechanism ............................................................. 76 5.1.2 Set up of multi-purpose centers for skill development .............................................. 80 5.1.3 Giving a boost to the local economy in hilly region .................................................. 81
5.2 Training providers................................................................................................... 81 5.3 Industry ................................................................................................................. 82 5.4 NSDC ................................................................................................................... 84
6. District Level Skill Gap Assessment ................................................................................ 88 6.1 Almora .................................................................................................................. 88 6.2 Bageshwar ............................................................................................................ 99 6.3 Chamoli .............................................................................................................. 109 6.4 Champawat ......................................................................................................... 119 6.5 Dehradun ............................................................................................................ 131 6.6 Nainital ............................................................................................................... 140 6.7 Haridwar ............................................................................................................. 149 6.8 Pauri Garhwal ...................................................................................................... 159 6.9 Pithoragarh ......................................................................................................... 169 6.10 Udham Singh Nagar ............................................................................................. 180 6.11 Rudra Prayag ...................................................................................................... 189 6.12 Tehri Garhwal ...................................................................................................... 199 6.13 Uttarkashi ............................................................................................................ 209
District Skill Gap Study for the State of Uttarakhand
3
1. Annexure I: List of Respondents .................................................................................. 219 2. Annexure II – Details of Institutions where focused group discussions were carried out. ..... 222 3. Annexure III : HR requirements (demand) for each Districts and sectors – 2012 ................ 224 4. Annexure IV : HR requirements (demand) for each Districts and sectors - 2017................. 226
District Skill Gap Study for the State of Uttarakhand
4
List of Tables
Table 1: Socio economic indicators of the State ......................................................................................... 17
Table 2: District wise comparison on various indicators ............................................................................. 18
Table 3: Major Manufacturing industries in Uttarakhand ............................................................................ 21
Table 4: Large scale industries in Uttarakhand........................................................................................... 21
Table 5: Micro, Small, and Medium Enterprises in Uttarakhand ................................................................. 22
Table 6: Trend of tourist arrival in Uttarakhand vis-a-vis India ................................................................... 23
Table 7: Road infrastructure in Uttarakhand ............................................................................................... 24
Table 8: Education Infrastructure (Number of Institutes) ............................................................................ 27
Table 9: Enrolments in Primary and Upper Primary School ....................................................................... 28
Table 10: Student’s enrollment in Polytechnic and ITIs .............................................................................. 28
Table 11: Performance against Health indicators ....................................................................................... 30
Table 12: Share of employment by broad industry group (2010-2011) ...................................................... 30
Table 13 : Percentage of workers engaged in secondary and tertiary sectors ........................................... 31
Table 14: Government promoted skill development schemes .................................................................... 36
Table 15: Percentage of migrants to total population 2001 ........................................................................ 37
Table 16: Percentage distribution of the streams of migration 0-9 years 2001 .......................................... 37
Table 17: Percentage distribution of reasons for migration by sex for duration 0-9 years 2001 ................ 38
Table 18: District wise number of Migrants per 1,000 populations ............................................................. 38
Table 19: Sector wise break up of total human resource requirement ....................................................... 43
Table 20: Skill level wise break up for growth sector .................................................................................. 44
Table 21: Sector Share in Incremental human resource requirement ........................................................ 48
Table 22: HR requirements (demand) for each Districts and sectors - 2022 ............................................. 57
Table 23: District wise labor force supply ................................................................................................... 59
Table 24: Incremental labor supply (District and skill wise) ........................................................................ 60
Table 25: Mismatch between demand and supply (2012 – 2022) .............................................................. 62
Table 26: Incremental human resource requirement (skill category wise) ................................................. 62
Table 27: District wise stakeholder’s perspective ....................................................................................... 69
Table 28: Location for setting up multi-purpose centers ............................................................................. 80
Table 29: Focus sectors for training providers ............................................................................................ 82
Table 30: Priority sectors having potential for growth in future ................................................................... 83
Table 31: Top five Districts showing Human Resource Requirement ........................................................ 84
Table 32: Action Plan for NSDC ................................................................................................................. 84
Table 33: Potential growth sectors in different Districts and skill Requirement .......................................... 85
Table 34 : District wise Growth Areas ......................................................................................................... 86
Table 35: Administrative profile of Almora .................................................................................................. 88
Table 36: Socio economic indicators for Almora ........................................................................................ 89
Table 37: Estimated workforce distribution in Almora ................................................................................. 91
Table 38: Incremental Human Resource Demand in Almora ..................................................................... 92
Table 39: Incremental Demand-Supply Gap in Almora .............................................................................. 93
Table 40: School Education Infrastructure in Almora ................................................................................. 94
Table 41: Industrial Training infrastructure in Almora ................................................................................. 94
Table 42: Sectors and skill requirement ...................................................................................................... 97
Table 43: Administrative profile of Bageshwar............................................................................................ 99
Table 44: Socio economic indicators of Bageshwar ................................................................................. 100
Table 45: Key recommendations from NABARD ...................................................................................... 101
Table 46: Types of Industry currently operating in the District.................................................................. 102
District Skill Gap Study for the State of Uttarakhand
5
Table 47: Estimated workforce distribution in Bageshwar ........................................................................ 103
Table 48: Incremental Human Resource Demand in Bageshwar ............................................................. 104
Table 49: Incremental Demand-Supply Gap in Bageshwar ...................................................................... 105
Table 50: School infrastructure in Bageshwar .......................................................................................... 106
Table 51: Industrial Training infrastructure in Bageshwar ........................................................................ 106
Table 52: Student Strength of Government colleges in Bageshwar for the year 2011-12 ....................... 106
Table 53: Sectors and skill requirement .................................................................................................... 108
Table 54: Administrative profile of Chamoli .............................................................................................. 109
Table 55: Socio economic indicators of Chamoli ...................................................................................... 110
Table 56: Tourist spots and pilgrimage centers in Chamoli ...................................................................... 112
Table 57: Estimated workforce distribution in Chamoli ............................................................................. 112
Table 58: Incremental Human Resource Demand in Chamoli ................................................................. 113
Table 59: Incremental Demand-Supply Gap in Chamoli .......................................................................... 114
Table 60: School education infrastructure in Chamoli .............................................................................. 115
Table 61: Industrial Training infrastructure in Chamoli ............................................................................. 115
Table 62: Sector and skill requirement ..................................................................................................... 117
Table 63: Administrative profile of Champawat ........................................................................................ 119
Table 64: Socio economic indicators for Champawat ............................................................................... 120
Table 65: Estimated workforce distribution in Champawat ....................................................................... 123
Table 66: Incremental Human Resource Demand in Champawat ........................................................... 123
Table 67: Incremental Demand-Supply Gap in Champawat .................................................................... 125
Table 68: School education infrastructure in Champawat ....................................................................... 125
Table 69: Student Strength of Government colleges in Champawat for the year 2011-12 ...................... 126
Table 70: Industrial Training infrastructure in Champawat ....................................................................... 126
Table 71: Sectors and skill requirement .................................................................................................... 129
Table 72: Administrative profile of Dehradun ............................................................................................ 131
Table 73: Socio economic indicators for Dehradun .................................................................................. 132
Table 74: Estimated workforce distribution in Dehradun .......................................................................... 134
Table 75: Incremental Human Resource Demand in Dehradun ............................................................... 134
Table 76: Incremental Demand-Supply Gap in Dehradun ........................................................................ 136
Table 77: School education infrastructure in Dehradun ........................................................................... 136
Table 78: Industrial Training infrastructure in Dehradun ........................................................................... 137
Table 79: Sector and skill requirement ..................................................................................................... 138
Table 80: Administrative profile of Nainital ................................................................................................ 140
Table 81: Socio economic indicators for Nainital ...................................................................................... 141
Table 82: Estimated workforce distribution in Nainital .............................................................................. 144
Table 83: Incremental Human Resource Demand in Nainital ................................................................... 144
Table 84: Incremental Demand-Supply Gap in Nainital ............................................................................ 145
Table 85: School education infrastructure in Nainital .............................................................................. 146
Table 86: Industrial Training infrastructure in Nainital .............................................................................. 146
Table 87: Sectors and skill requirement .................................................................................................... 148
Table 88: Administrative profile of Haridwar ............................................................................................. 149
Table 89: Socio economic indicators for Haridwar ................................................................................... 150
Table 90: Estimated workforce distribution in Haridwar ............................................................................ 152
Table 91: Incremental Human Resource Demand in Haridwar ................................................................ 153
Table 92: Incremental Demand-Supply Gap in Haridwar ......................................................................... 154
Table 93: School education infrastructure in Haridwar ............................................................................ 155
Table 94: Industrial Training infrastructure in Haridwar ............................................................................ 155
District Skill Gap Study for the State of Uttarakhand
6
Table 95: Sectors and skill requirement .................................................................................................... 158
Table 96: Administrative profile of Pauri Garhwal ..................................................................................... 159
Table 97: Socio economic indicators for Pauri Garhwal ........................................................................... 160
Table 98: Estimated workforce distribution in Pauri Garhwal ................................................................... 162
Table 99: Incremental Human Resource Demand in Pauri Garhwal ........................................................ 163
Table 100: Incremental Demand-Supply Gap in Pauri Garhwal ............................................................... 164
Table 101: School Education Infrastructure in Pauri Garhwal .................................................................. 165
Table 102: Key ITI indicators in Pauri Garhwal......................................................................................... 165
Table 103: Sectors and skill requirement .................................................................................................. 167
Table 104: Administrative profile of Pithoragarh ....................................................................................... 169
Table 105: Socio economic indicators for Pithoragarh ............................................................................. 170
Table 106: Registered MSME’s for the Year 2010-11 .............................................................................. 172
Table 107: Estimated workforce distribution in Pithoragarh ..................................................................... 172
Table 108: Incremental Human Resource Demand in Pithoragarh .......................................................... 173
Table 109: Incremental Demand-Supply Gap in Pithoragarh ................................................................... 174
Table 110: School education infrastructure in Pithoragarh ....................................................................... 175
Table 111: Student Strength of Government colleges in Pithoragarh for the year 2011-12 ..................... 175
Table 112: Industrial Training infrastructure in Pithoragarh ...................................................................... 176
Table 113: Horticulture activities in the Pithoragarh ................................................................................. 177
Table 114: Key recommendations from NABARD .................................................................................... 177
Table 115: List of Minerals available in Pithoragarh ................................................................................. 178
Table 116: Sector and skill requirement ................................................................................................... 179
Table 117: Administrative profile of Udham Singh Nagar ......................................................................... 180
Table 118: Socio economic indicators for Udham Singh Nagar ............................................................... 181
Table 119: Estimated workforce distribution in Uddham Singh Nagar ..................................................... 183
Table 120: Incremental Human Resource Demand in Udham Singh Nagar ............................................ 183
Table 121: Incremental Demand-Supply Gap in Uddham Singh Nagar ................................................... 184
Table 122: School Education Infrastructure in Uddham Singh Nagar ...................................................... 185
Table 123: Industrial Training infrastructure in Uddham Singh Nagar ...................................................... 185
Table 124: Sector and skill requirement ................................................................................................... 187
Table 125: Administrative profile of Rudra Prayag ................................................................................... 189
Table 126: Socio economic indicators for Rudraprayag ........................................................................... 190
Table 127: Area, Production and Productivity of Main crops in Rudraprayag (2011-12) ......................... 191
Table 128: Estimated workforce distribution in Rudraprayag ................................................................... 192
Table 129: Incremental Human Resource Demand in Rudraprayag ........................................................ 193
Table 130: Incremental Demand-Supply Gap in Rudraprayag ................................................................. 194
Table 131: School education infrastructure in Rudraprayag .................................................................... 194
Table 132: Student Strength of Government colleges in Rudraprayag for the year 2010-11 .................. 195
Table 133: Industrial Training infrastructure in Rudraprayag .................................................................... 195
Table 100: Sectors and skill requirement .................................................................................................. 197
Table 135: Administrative profile of Tehri Garhwal ................................................................................... 199
Table 136: Socio economic indicators for Tehri Garhwal ......................................................................... 200
Table 137: Key tourist attraction in Tehri Garhwal .................................................................................... 202
Table 138: Estimated workforce distribution in Tehri Garhwal ................................................................. 202
Table 139: Incremental Human Resource Demand in Tehri Garhwal ...................................................... 203
Table 140: Incremental Demand-Supply Gap in Tehri Garhwal ............................................................... 204
Table 141: School education infrastructure in Tehri Garhwal District ...................................................... 205
Table 142: Industrial Training infrastructure in Tehri Garhwal District ...................................................... 205
District Skill Gap Study for the State of Uttarakhand
7
Table 143: Sector and skill requirement ................................................................................................... 207
Table 144: Administrative profile of Uttarkashi ......................................................................................... 209
Table 145: Socio economic indicators for Uttarkashi ................................................................................ 210
Table 146: Estimated workforce distribution in Uttarkashi ........................................................................ 212
Table 147: Incremental Human Resource Demand in Uttarkashi ............................................................ 213
Table 148: Incremental Demand-Supply Gap in Uttarkashi ..................................................................... 214
Table 149: School education infrastructure in Uttarkashi District ............................................................ 215
Table 150: Industrial Training infrastructure in Uttarkashi District ............................................................ 215
Table 151: Sectors and skill requirement .................................................................................................. 217
District Skill Gap Study for the State of Uttarakhand
8
List of Abbreviations and Acronyms
AEZ Agriculture Economic Zone
ADM Assistant District Magistrate
APEDA Agricultural and Processed Food Products Export Development Authority
B.Ed. Bachelor of Education
BBA Bachelor of Business Administration
BHEL Baharat Heavy Electrical Limited
BPO Business Process Outsourcing
CAGR Compounded Annual Growth Rate
CMH Commission on Macroeconomic and Health
CNC Computer Numerical Control
COE Center for Excellence
CONCOR Container Corporation of India Ltd
CST Central Sales tax
DAO District Agriculture Officer
DHE Directorate of Higher education
DIC District Information Center
DLCU District Level Coordination Units
DSTO District Statistical Organization
GDDP Gross District Domestic Product
GoI Government of India
GSDP Gross State Domestic Product
HYV High Yielding Variety
IGNFA Indira Gandhi National Forest Academy
IHM Institute of Hotel Management
IIEs Industrial Estates
ISDS Integrated Skill Development Scheme
ITDA Information Technology Development Agency
ITI Industrial Training Institute
JNNURM Jawaharlal Nehru National Urban Renewal Mission
KGCCI Kumaun Garhwal Chambers of Commerce and Industries
KPO Knowledge Process Outsourcing
KVK Krishi Vigyan Kendra
LBSNAA Lal Bahadur Shahstri National Academy of Administration
LMIS Labor Management Information System
MBA Master of Business Administration
MCA Master of Computer Analysis
District Skill Gap Study for the State of Uttarakhand
9
MIS Management Information System
MNPB Natural Medicinal Plant Board
MoFPI Ministry of Food Processing Industry
MOHRD Ministry of Human Resource Development
MSME Micro Small and Medium Enterprise
NA Not Applicable
NABARD National Bank for Agriculture and Rural Development
NCSD National Council on Skill Development
NCVT National Council for Vocational Training
NeGP National e-Governance Plan
NHB National Horticulture Board
NSDC National Skills Development Corporation
NSDCB National Skill Development Co-ordination Board
NSSO National Sample Survey Organization
NTFP Non Timber Forest Produce
OBC Other Backward Class
PM&M Pithoragarh Magnesite & Mineral’s
PMGSY Padhan Mantri Gram Sadak Yojna
PPP Public Private Partnership
REGP Rural Employment Generation Programme
SAZ Special Agriculture Zones
SC Schedule Caste
SCVT State Council for Vocational Training
SDC Skill Development Cell
SDTCs Skill Development Training Centres
SGRY Sampoorna Grameen Rozgar Yojana
SGSY Swarnjayanti Gram Swarozgar Yojana
SHG Self Help Groups
SIDCUL State Infrastructure and Industrial Development Corporation of Uttarakhand Limited
SSI Small Scale Industries
ST Schedule Tribe
TOT Training of Trainers
TRYSEM Training of Rural Youth for Self-Employment
UCDF Uttarakhand Co-operative Dairy Federation
UNDP United Nations Development Program
UOCB Uttarakhand Organic Commodity Board
USDS Uttarakhand Skill Development Society
District Skill Gap Study for the State of Uttarakhand
10
VT Vocational Training
VTC Vocational Training Centers
VTIP Vocational Training Improvement Programme
VTP Vocational Training Providers
WTO World Trade Organization
District Skill Gap Study for the State of Uttarakhand
11
Disclaimer
National Skill Development Corporation engaged Ernst & Young LLP (erstwhile known as Ernst & Young
Private Limited) to prepare this report, which is based on independent research and analysis done by
Ernst & Young LLP. This report is not based or derived from any other report or research paper. Any
similarity with any other paper may purely be a co-incidence.
All rights reserved. All copyright in this report and related works is solely and exclusively owned by
National Skill Development Corporation. The same may not be reproduced, wholly or in part in any
material form (including photocopying or storing it in any medium by electronic means and whether or not
transiently or incidentally to some other use of this presentation), modified or in any manner
communicated to any third party except with the written approval of National Skill Development
Corporation.
This report is for information purposes only. While due care has been taken during the compilation of this
report to ensure that the information is accurate to the best of Ernst & Young LLP’s and National Skill
Development Corporation’s knowledge and belief, the content is not to be construed in any manner
whatsoever as a substitute for professional advice. Ernst & Young LLP and National Skill Development
Corporation neither recommend nor endorse any specific products or services that may have been
mentioned in this report and nor do they assume any liability or responsibility for the outcome of decisions
taken as a result of any reliance placed in this report.
Neither Ernst & Young LLP nor National Skill Development Corporation shall be liable for any direct or
indirect damages that may arise due to any act or omission on the part of the user due to any reliance
placed or guidance taken from any portion of this report.
District Skill Gap Study for the State of Uttarakhand
12
Acknowledgement
We are grateful to the Government of Uttarakhand and its various departments for their contribution
towards the successful completion of the study. Our special thanks to the Mr. Shailesh Bagauli, IAS and
Mr. D.C. Gupta, who extended support to the team and facilitated our interactions with the departments.
We acknowledge with gratitude the support provided by the skill Training Institutions, NGOs, Industry
Representatives and the youth of the State for their contribution towards the study
We would like to thank all industry partners, training partners for their active participation. This study
would not have been possible without their efforts in sharing their experiences.
In addition, we convey our gratitude to all those who have, in some way or other, contributed towards the
completion of this study.
District Skill Gap Study for the State of Uttarakhand
13
1. Introduction
1.1 Background1
The National Skill Development Corporation (‘NSDC’) was set up as part of the Government’s
coordinated action in the skills space with the specific target of skilling/up-skilling 150 million people by
2022, mainly by fostering private sector initiatives in this area. In order to achieve this target NSDC has
been working on three key mandates:
► Create: Proactively catalyze creation of large, quality vocational training institutions;
► Fund: Reduce risk by providing patient capital and improve returns by providing viability gap funding;
► Enable: Facilitate the creation of support systems required for skill development.
Developing a research base is one of the critical activities and NSDC has undertaken Sector Skill Gap
Studies for the 20 high priority sectors. In addition District skill gap studies have been commissioned for
various States for use by different stakeholders like State Governments, training organisations, industry
associations, trainees etc.
As part of its research activities, NSDC now intends to undertake District wise skill gap study for the State
of Uttarakhand.
1.2 Scope of work
The study included a review of the following at an overall State and for all Districts of the State:
► Socio-economic profile – demography, economic profile of District by industry, State of education;
► Identify developmental opportunities keeping in mind factor endowments and stakeholder
perspectives;
► Identify specific developmental initiatives/projects which have an impact on employment generation;
► Articulate aspirations of the youth;
► Identify the current and future (2012 to 2021) skills and manpower requirements by industry and
estimate the gap that exists;
► Study the existing vocational training infrastructure both in the private sector and the Government
domain;
► Identify current schemes and programmes relating to skill development and their achievements /
challenges;
► Suggest suitable interventions/recommendations to address the skills gap
o Recommendations have to be specific and actionable;
o Recommendations should also include specific initiatives that NSDC can take based on the
mandate of the organization;
► Create an action plan with indicative timelines;
1.3 Key definitions used in the report
Minimally Skilled Manpower: Minimally skill category includes literates without education level, and
having qualification up to 10
th Standard or below;
1
Terms of reference for District skill gap study for the State of Uttarakhand.
District Skill Gap Study for the State of Uttarakhand
14
Semi -Skilled Manpower: Semi skill category 10+2 or equivalent and vocationally trained;
Skilled Manpower: Skilled Manpower includes technical diploma, degree and above
Human Resource Requirement: Refers to the projected human resource requirement at different skill
level across Districts and NSDC growth sectors;
Human Resource Availability: Refers to the availability of the labor force at its composition as per skill
category based on level of education, population growth rate, working age population, labor force
participation and enrollment.
1.4 Our approach and methodology
The study was performed in three interrelated stages as specified below:
Stage I: Preparatory/Planning
► Inception meeting with NSDC to develop common understanding of the engagement, seek
suggestions on the methodology and work-plan;
► Discussion on support required from NSDC and the State Government particularly in coordinating
with the Government officials at the State and District level;
► Collection of existing secondary literature/data available on labor market, existing State Government
policies, growth potential of different sectors (primary, secondary and tertiary) and skill development
in Uttarakhand;
► Introduction of engagement manager and other team members to the State Government; finalize
engagement protocols.
Stage II: Field visit and data analysis
► The overall project team was sub-divided into five separate groups who undertook field visit to all
Districts and collected information through semi structured interviews and focus group discussions.
List of people which were consulted during this study has been provided in Annexure 1.
► Methodology: This entailed the following activities:
• Human resource requirement (demand): To estimate the total requirement of labor work
force, key trades were identified and the trades were prioritized based on its potential to absorb
labor work force. The projection of future workforce requirements for the identified sectors (till
2022) was done sector wise and skill wise. The study involved identification of employment
potential in various sectors and analysis of employment and investment trends in these sectors.
While doing the projections, we considered the policy environment and other factors that could
accelerate the growth thereby enhancing the workforce requirement.
• Human resource availability (supply): District wise population data for 2011 was multiplied
by labor force participation rate to arrive at the labor force in each District which was further
classified into different skill categories based on education levels in each District. In addition
enrolments and students in the system data at different educational levels were factored in.
Additional labor supply was forecasted (2012-2022) to grow at District level historical student
growth rates at each education level. The additional supply for each forecast year was used to
compute total supply for 2012-2022.
• Skill gap analysis: Human resource demand-supply gap has been computed by taking
difference of demand and supply numbers for each skill category for the period 2012-2022.
District Skill Gap Study for the State of Uttarakhand
15
Stage III: Reporting
► Presentation of key findings and recommendations to NSDC and the Steering Committee;
► Submission of draft report along with the recommendations;
► Finalization of report post discussion with NSDC.
1.5 Limitations
Ernst and Young would like to draw attention to the following limitations in respect this engagement:
► It is possible that a number of individuals have acquired skills through traditional means (family) or
learnt through experience. Since the numbers of individuals in this category are not available, we
have not included this in our analysis.
► The available data sources like Economic Census of Uttarakhand 2005 provide information either by
different occupation establishments or by qualification. The information related to jobs by
skill/designation is not available through such reliable sources.
► It was a challenge to undertake secondary data analysis since there was paucity of data – both
current and past. In addition, many a times there was a mismatch between data on a particular
indicator taken from two different sources, even though we have tried use the most reliable data
source, however we do not take any responsibility in any way whatsoever to any person in respect of
errors in this report, arising from incorrect information provided by the different data sources.
► There is a huge potential for the tourism sector in the State, however the recent calamity may have
an impact on the overall projected numbers. The field work and analysis for the report was completed
by February 2013 before the calamity.
1.6 About this report
The main body of this document is organized into the following Chapters (excluding this):
► Chapter 2 titled ‘Socio-economic profile of Uttarakhand’ provides a macroeconomic overview,
economic sectors overview and infrastructure overview along with the key policies and initiatives
taken by the State Government in the recent past;
► Chapter 3 titled ‘Skill gap scenario for Uttarakhand’ provides District wise human resource
requirement ( sector and skill category wise), District wise supply of human resource and analysis of
gap;
► Chapter 4 titled ‘Stakeholders Perspective’ provides District wise overview of the key growth sectors
shared by various stakeholders, key challenges and support required;
► Chapter 5 titled ‘Recommendations and Action Plan’ provides our recommendations and road map for
the State Government, training providers, industry and NSDC;
District Skill Gap Study for the State of Uttarakhand
16
2. Socio-economic profile of Uttarakhand
2.1 Macro-economic overview
Source: Maps of India
Uttarakhand was carved out of the State of Uttar Pradesh on 9th November 2000 and was the 27th State
of India. It is strategically located at the foothills of the Himalayan range. Forming the northern part of the
country, it shares its boundary with China, Tibet in the north, Himachal Pradesh in the west and north-
west, Gangetic plains of Uttar Pradesh in the south and Nepal in the east. The total geographic area2
of
the State is 53,483 sq. km (1.63 percent of India) with a total population of 1.01 Crore. Dehradun is the
capital of the State.
The State of Uttarakhand is a rich repository of natural resources with plenty of water resources, glaciers,
and dense forests. It is endowed with around 175 rare species of aromatic and medicinal plants3
. Rich in
natural resources, the State has almost all major climatic zones, making it suitable for a variety of
commercial opportunities in horticulture and floriculture activities. The mainstay of the economy is
agriculture as more than 75 percent of the total population depends on agriculture for their livelihood.
Uttarakhand holds immense importance as a religious place and experiences vast inflow of domestic as
well as international tourists. Badrinath, Kedarnath, Gangotri, Yamunotri and Haridwar attract regular
religious tourists which significantly add to the State economy. The State is divided into two regions i.e.
Garhwal and Kumaon and comprises 13 Districts out of which four Districts are in the plains and the other
nine are in the hills.
2
http://www.census2011.co.in/census/state/districtlist/uttarakhand.html 3
http://www.phdcci.in/admin/userfiles/file/Research-Bureau/Uttarakhand.pdf
District Skill Gap Study for the State of Uttarakhand
17
2.2 Demographic profile
Table 1: Socio economic indicators of the State
Population Uttarakhand India Source
Area (in Sq. Km) 53,483 32,87,240 http://www.census2011.co.in/states.php
Percentage share of State Geographical area
1.63% N.A N.A
Total population (in lakh) 101.17 12,101.93 Census 2011 (provisional data)
Total population (Male) (in lakh) 51.54 6,237.24 http://censusindia.gov.in/2011-prov-results/indiaatglance.html
Total population (Female) (in lakh) 49.63 5,865.70 http://censusindia.gov.in/2011-prov-results/indiaatglance.html
States share in total population 0.83% N.A N.A
Density of population 189 382 http://censusindia.gov.in/2011-prov-results/indiaatglance.html
Decadal growth of population (2001-2011)
19.17% 17.64% http://censusindia.gov.in/2011-prov-results/indiaatglance.html
Urban population (in lakh)/Percentage 30,91169/ 30.55%
3,771,06/ 31.16%
http://indiafacts.in/india-census-2011/urban-rural-population-o-india/
Rural Population (in lakh)/Percentage 70,25,583/
69.45% 8,330,87 /68.84%
http://indiafacts.in/india-census-2011/urban-rural-population-o-india/
Scheduled Caste population percentage of State population
17.90% 16.2% Census 2001
Schedule Tribe population percentage of State population
3% 8.2% Census 2001
Sex ratio 963 940 http://censusindia.gov.in/2011-prov-results/indiaatglance.html
As per the census 2011 (provisional data) the total population of Uttarakhand is 1.01 Crore, making it the
20th most populated State in India (comprising of 0.83% of the country’s population). During the last
decade (2001-2011), the population of Uttarakhand grew at 19.17 percent which is higher than the
national average of 17.6 percent. Though there has been a rapid increase in population, the density of
population is 189 per sq.km which is below the national average of 382 per sq.km.
According to Census 2001, the socially backward classes such as Scheduled Caste (‘SC’) and Scheduled
Tribes (’ST’) represent 17.9 percent and 3 percent of the State population respectively. The sex ratio was
unfavorable at 963 females per 1,000 males, though it is still higher than India’s sex ratio of 940.
The literacy rate in the State has seen an upward trend from 71.62 percent in 2001 to 79.63 percent in
2011. Female literacy stands at 70.70 percent and male literacy at 88.33 percent. The following Table 2
provides an overall District wise comparison on various indicators such as population, population density,
sex ratio, female population, literacy rate and decadal growth rate.
District Skill Gap Study for the State of Uttarakhand
18
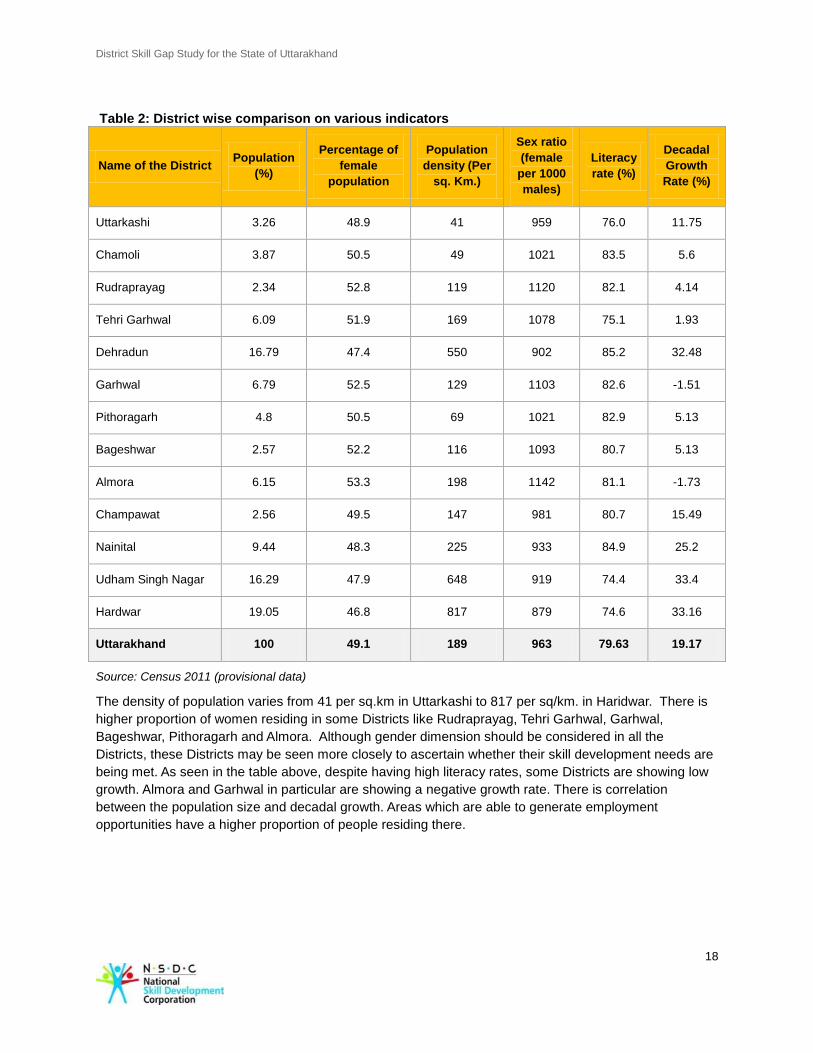
Table 2: District wise comparison on various indicators
Name of the District Population
(%)
Percentage of
female
population
Population
density (Per
sq. Km.)
Sex ratio
(female
per 1000
males)
Literacy
rate (%)
Decadal
Growth
Rate (%)
Uttarkashi 3.26 48.9 41 959 76.0 11.75
Chamoli 3.87 50.5 49 1021 83.5 5.6
Rudraprayag 2.34 52.8 119 1120 82.1 4.14
Tehri Garhwal 6.09 51.9 169 1078 75.1 1.93
Dehradun 16.79 47.4 550 902 85.2 32.48
Garhwal 6.79 52.5 129 1103 82.6 -1.51
Pithoragarh 4.8 50.5 69 1021 82.9 5.13
Bageshwar 2.57 52.2 116 1093 80.7 5.13
Almora 6.15 53.3 198 1142 81.1 -1.73
Champawat 2.56 49.5 147 981 80.7 15.49
Nainital 9.44 48.3 225 933 84.9 25.2
Udham Singh Nagar 16.29 47.9 648 919 74.4 33.4
Hardwar 19.05 46.8 817 879 74.6 33.16
Uttarakhand 100 49.1 189 963 79.63 19.17
Source: Census 2011 (provisional data)
The density of population varies from 41 per sq.km in Uttarkashi to 817 per sq/km. in Haridwar. There is
higher proportion of women residing in some Districts like Rudraprayag, Tehri Garhwal, Garhwal,
Bageshwar, Pithoragarh and Almora. Although gender dimension should be considered in all the
Districts, these Districts may be seen more closely to ascertain whether their skill development needs are
being met. As seen in the table above, despite having high literacy rates, some Districts are showing low
growth. Almora and Garhwal in particular are showing a negative growth rate. There is correlation
between the population size and decadal growth. Areas which are able to generate employment
opportunities have a higher proportion of people residing there.
District Skill Gap Study for the State of Uttarakhand
19
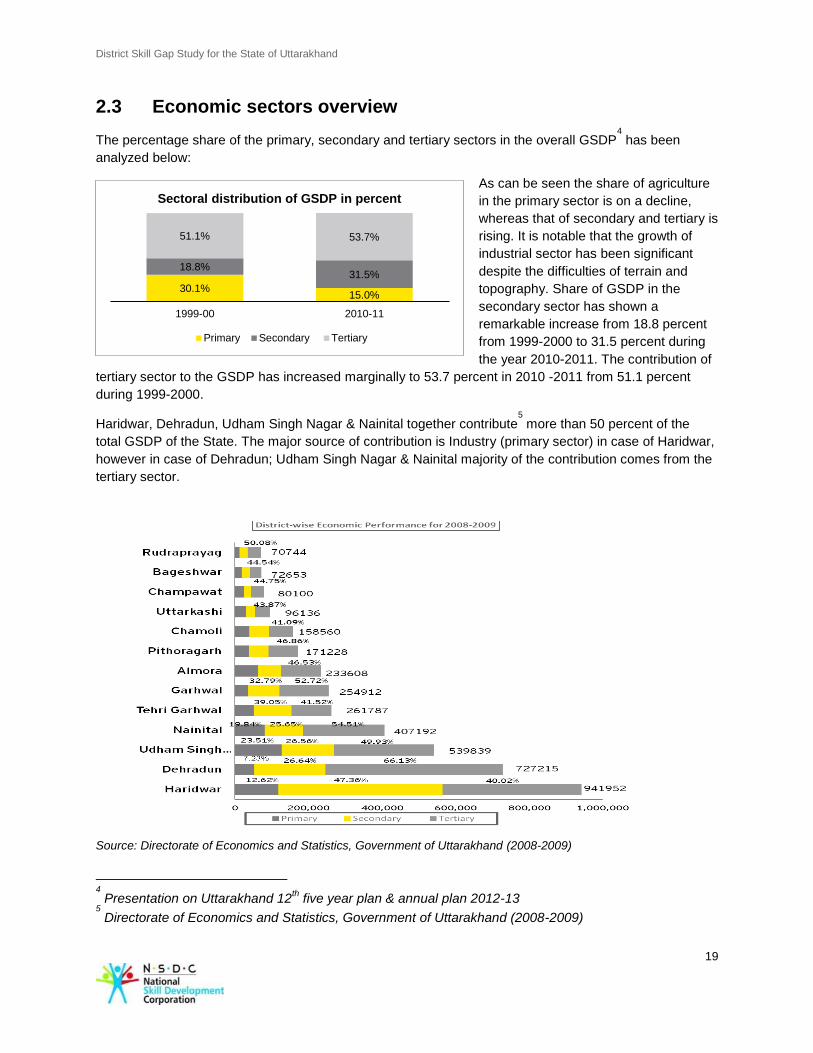
2.3 Economic sectors overview
The percentage share of the primary, secondary and tertiary sectors in the overall GSDP4
has been
analyzed below:
As can be seen the share of agriculture
in the primary sector is on a decline,
whereas that of secondary and tertiary is
rising. It is notable that the growth of
industrial sector has been significant
despite the difficulties of terrain and
topography. Share of GSDP in the
secondary sector has shown a
remarkable increase from 18.8 percent
from 1999-2000 to 31.5 percent during
the year 2010-2011. The contribution of
tertiary sector to the GSDP has increased marginally to 53.7 percent in 2010 -2011 from 51.1 percent
during 1999-2000.
Haridwar, Dehradun, Udham Singh Nagar & Nainital together contribute5
more than 50 percent of the
total GSDP of the State. The major source of contribution is Industry (primary sector) in case of Haridwar,
however in case of Dehradun; Udham Singh Nagar & Nainital majority of the contribution comes from the
tertiary sector.
Source: Directorate of Economics and Statistics, Government of Uttarakhand (2008-2009)
4
Presentation on Uttarakhand 12th five year plan & annual plan 2012-13
5
Directorate of Economics and Statistics, Government of Uttarakhand (2008-2009)
30.1% 15.0%
18.8% 31.5%
51.1% 53.7%
1999-00 2010-11
Sectoral distribution of GSDP in percent
Primary Secondary Tertiary
District Skill Gap Study for the State of Uttarakhand
20
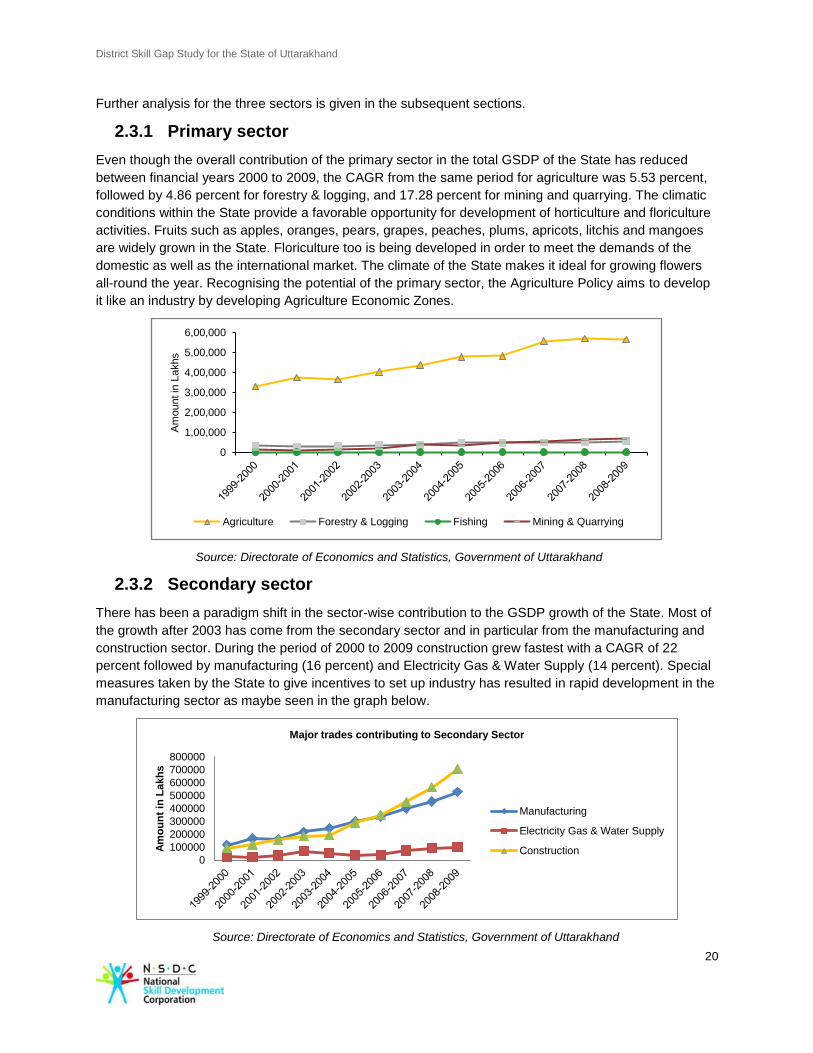
Further analysis for the three sectors is given in the subsequent sections.
2.3.1 Primary sector
Even though the overall contribution of the primary sector in the total GSDP of the State has reduced
between financial years 2000 to 2009, the CAGR from the same period for agriculture was 5.53 percent,
followed by 4.86 percent for forestry & logging, and 17.28 percent for mining and quarrying. The climatic
conditions within the State provide a favorable opportunity for development of horticulture and floriculture
activities. Fruits such as apples, oranges, pears, grapes, peaches, plums, apricots, litchis and mangoes
are widely grown in the State. Floriculture too is being developed in order to meet the demands of the
domestic as well as the international market. The climate of the State makes it ideal for growing flowers
all-round the year. Recognising the potential of the primary sector, the Agriculture Policy aims to develop
it like an industry by developing Agriculture Economic Zones.
Source: Directorate of Economics and Statistics, Government of Uttarakhand
2.3.2 Secondary sector
There has been a paradigm shift in the sector-wise contribution to the GSDP growth of the State. Most of
the growth after 2003 has come from the secondary sector and in particular from the manufacturing and
construction sector. During the period of 2000 to 2009 construction grew fastest with a CAGR of 22
percent followed by manufacturing (16 percent) and Electricity Gas & Water Supply (14 percent). Special
measures taken by the State to give incentives to set up industry has resulted in rapid development in the
manufacturing sector as maybe seen in the graph below.
Source: Directorate of Economics and Statistics, Government of Uttarakhand
0
1,00,000
2,00,000
3,00,000
4,00,000
5,00,000
6,00,000
Am
ount in
Lakhs
Agriculture Forestry & Logging Fishing Mining & Quarrying
0
100000
200000
300000
400000
500000
600000
700000
800000
Am
ou
nt
in L
akh
s
Major trades contributing to Secondary Sector
Manufacturing
Electricity Gas & Water Supply
Construction
District Skill Gap Study for the State of Uttarakhand
21
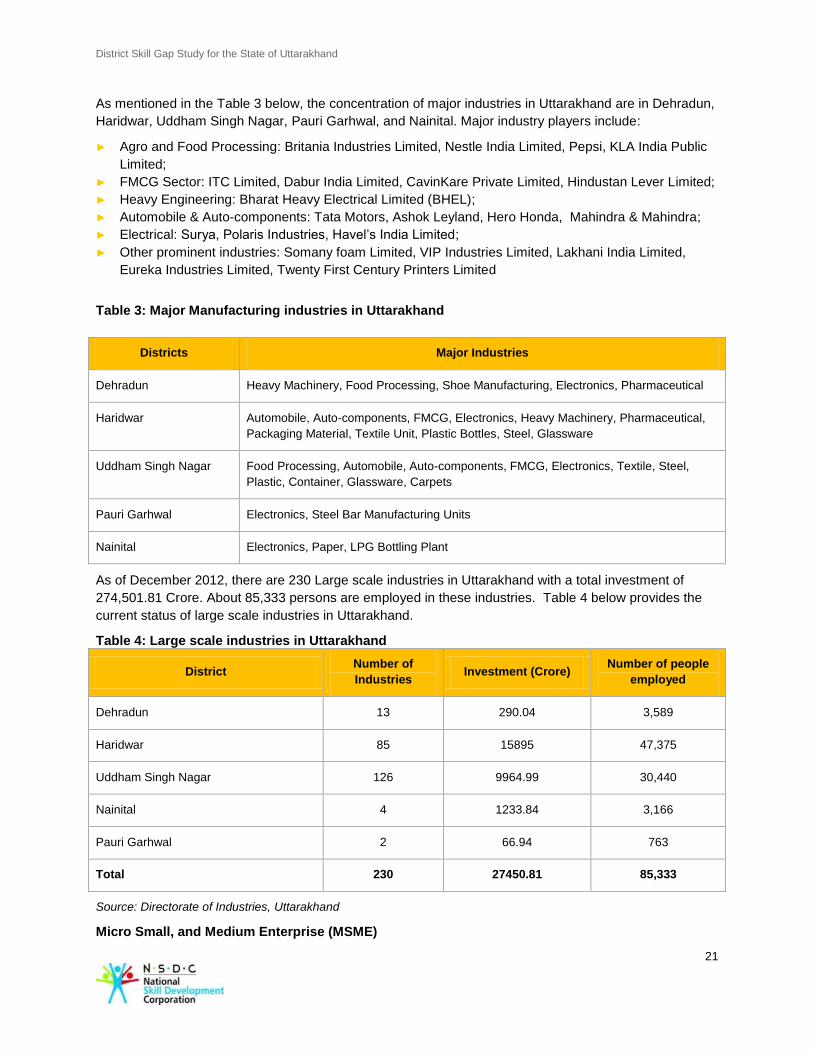
As mentioned in the Table 3 below, the concentration of major industries in Uttarakhand are in Dehradun,
Haridwar, Uddham Singh Nagar, Pauri Garhwal, and Nainital. Major industry players include:
► Agro and Food Processing: Britania Industries Limited, Nestle India Limited, Pepsi, KLA India Public
Limited;
► FMCG Sector: ITC Limited, Dabur India Limited, CavinKare Private Limited, Hindustan Lever Limited;
► Heavy Engineering: Bharat Heavy Electrical Limited (BHEL);
► Automobile & Auto-components: Tata Motors, Ashok Leyland, Hero Honda, Mahindra & Mahindra;
► Electrical: Surya, Polaris Industries, Havel’s India Limited;
► Other prominent industries: Somany foam Limited, VIP Industries Limited, Lakhani India Limited,
Eureka Industries Limited, Twenty First Century Printers Limited
Table 3: Major Manufacturing industries in Uttarakhand
Districts Major Industries
Dehradun Heavy Machinery, Food Processing, Shoe Manufacturing, Electronics, Pharmaceutical
Haridwar Automobile, Auto-components, FMCG, Electronics, Heavy Machinery, Pharmaceutical,
Packaging Material, Textile Unit, Plastic Bottles, Steel, Glassware
Uddham Singh Nagar Food Processing, Automobile, Auto-components, FMCG, Electronics, Textile, Steel,
Plastic, Container, Glassware, Carpets
Pauri Garhwal Electronics, Steel Bar Manufacturing Units
Nainital Electronics, Paper, LPG Bottling Plant
As of December 2012, there are 230 Large scale industries in Uttarakhand with a total investment of
274,501.81 Crore. About 85,333 persons are employed in these industries. Table 4 below provides the
current status of large scale industries in Uttarakhand.
Table 4: Large scale industries in Uttarakhand
District Number of
Industries Investment (Crore)
Number of people
employed
Dehradun 13 290.04 3,589
Haridwar 85 15895 47,375
Uddham Singh Nagar 126 9964.99 30,440
Nainital 4 1233.84 3,166
Pauri Garhwal 2 66.94 763
Total 230 27450.81 85,333
Source: Directorate of Industries, Uttarakhand
Micro Small, and Medium Enterprise (MSME)
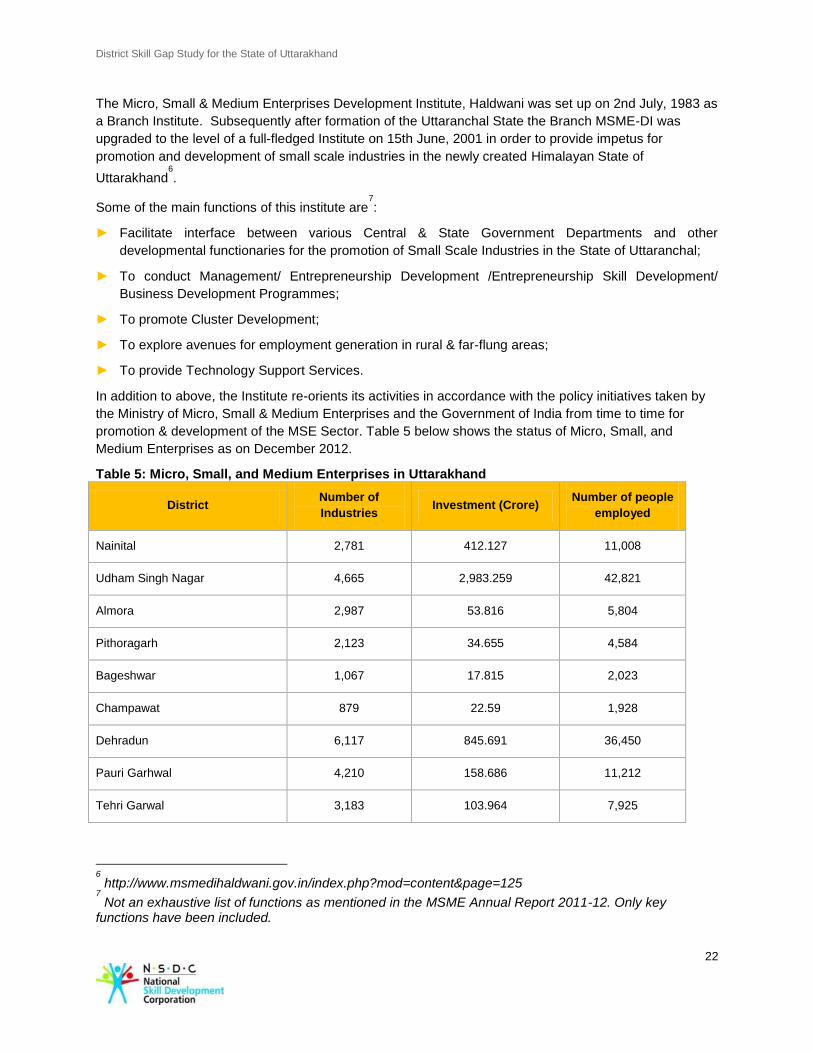
District Skill Gap Study for the State of Uttarakhand
22
The Micro, Small & Medium Enterprises Development Institute, Haldwani was set up on 2nd July, 1983 as
a Branch Institute. Subsequently after formation of the Uttaranchal State the Branch MSME-DI was
upgraded to the level of a full-fledged Institute on 15th June, 2001 in order to provide impetus for
promotion and development of small scale industries in the newly created Himalayan State of
Uttarakhand6
.
Some of the main functions of this institute are7
:
► Facilitate interface between various Central & State Government Departments and other
developmental functionaries for the promotion of Small Scale Industries in the State of Uttaranchal;
► To conduct Management/ Entrepreneurship Development /Entrepreneurship Skill Development/
Business Development Programmes;
► To promote Cluster Development;
► To explore avenues for employment generation in rural & far-flung areas;
► To provide Technology Support Services.
In addition to above, the Institute re-orients its activities in accordance with the policy initiatives taken by
the Ministry of Micro, Small & Medium Enterprises and the Government of India from time to time for
promotion & development of the MSE Sector. Table 5 below shows the status of Micro, Small, and
Medium Enterprises as on December 2012.
Table 5: Micro, Small, and Medium Enterprises in Uttarakhand
District Number of
Industries Investment (Crore)
Number of people
employed
Nainital 2,781 412.127 11,008
Udham Singh Nagar 4,665 2,983.259 42,821
Almora 2,987 53.816 5,804
Pithoragarh 2,123 34.655 4,584
Bageshwar 1,067 17.815 2,023
Champawat 879 22.59 1,928
Dehradun 6,117 845.691 36,450
Pauri Garhwal 4,210 158.686 11,212
Tehri Garwal 3,183 103.964 7,925
6
http://www.msmedihaldwani.gov.in/index.php?mod=content&page=125 7
Not an exhaustive list of functions as mentioned in the MSME Annual Report 2011-12. Only key functions have been included.
District Skill Gap Study for the State of Uttarakhand
23
District Number of
Industries Investment (Crore)
Number of people
employed
Chamoli 2,410 45.047 4,456
Uttarakashi 3,242 40.983 5,280
Rudrprayag 1,194 40.093 2,781
Haridwar 6,834 3,240.69 54,005
Total 41,692 7,999.419 190,277
Source: Directorate of Industries, Uttarakhand
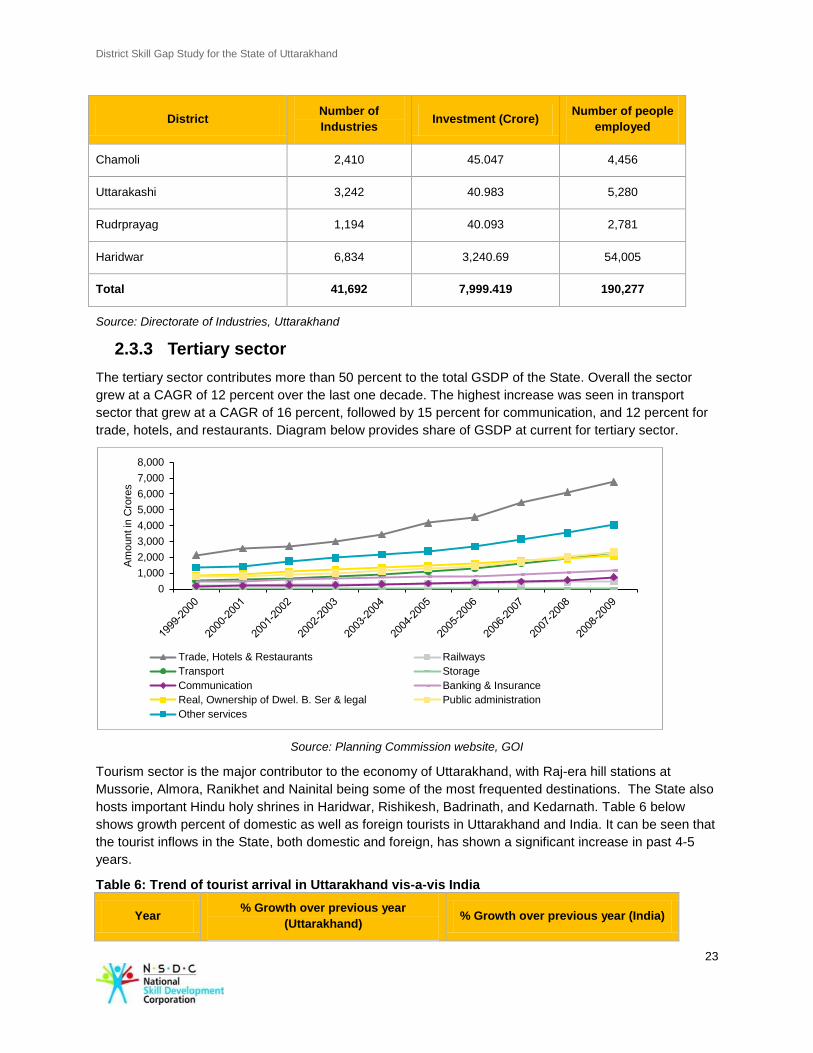
2.3.3 Tertiary sector
The tertiary sector contributes more than 50 percent to the total GSDP of the State. Overall the sector
grew at a CAGR of 12 percent over the last one decade. The highest increase was seen in transport
sector that grew at a CAGR of 16 percent, followed by 15 percent for communication, and 12 percent for
trade, hotels, and restaurants. Diagram below provides share of GSDP at current for tertiary sector.
Source: Planning Commission website, GOI
Tourism sector is the major contributor to the economy of Uttarakhand, with Raj-era hill stations at
Mussorie, Almora, Ranikhet and Nainital being some of the most frequented destinations. The State also
hosts important Hindu holy shrines in Haridwar, Rishikesh, Badrinath, and Kedarnath. Table 6 below
shows growth percent of domestic as well as foreign tourists in Uttarakhand and India. It can be seen that
the tourist inflows in the State, both domestic and foreign, has shown a significant increase in past 4-5
years.
Table 6: Trend of tourist arrival in Uttarakhand vis-a-vis India
Year % Growth over previous year
(Uttarakhand) % Growth over previous year (India)
0
1,000
2,000
3,000
4,000
5,000
6,000
7,000
8,000
Am
ount in
Cro
res
Trade, Hotels & Restaurants Railways
Transport Storage
Communication Banking & Insurance
Real, Ownership of Dwel. B. Ser & legal Public administration
Other services
District Skill Gap Study for the State of Uttarakhand
24
Domestic International Domestic International
2007 14.4 10.3 13.9 14.3
2008 4.1 5.4 6.9 4.0
2009 0.4 5.7 18.8 -2.2
2010 33.8 15.4 10.7 11.8
Sources: Ministry of Tourism, Uttarakhand, and Indiastats.com
As per the published figure by Ministry of Tourism for the year 2010, the State has improved its rank from
8th to 7
th in case of domestic tourists, whereas it stands 16
th in terms of foreign tourist inflows. With the
development of physical infrastructure, the services sector of the State is expected to grow in the coming
years. There is a high dependence of people on public administrative services.
2.4 Infrastructure
The development of infrastructure is vital for industrial growth and overall development of the State. Some
of the key infrastructural issues that need attention in the context of skill development are industrial
infrastructure, social infrastructure like education and health, transportation and communication facilities,
and urban infrastructure.
2.4.1 Physical infrastructure & connectivity
Developing the physical infrastructure is very important for the overall development of the State. The
approved outlay for infrastructural development in the State has increased from Rs.1,982.93 Crore in
2010-11 to Rs. 2,345.28 Crore in 2011-128
. The Government of Uttarakhand has identified physical
infrastructure as one of the thrust areas that has potential to generate large scale employment and
promote a favorable business environment.
Road connectivity
The State has given continuous priority to develop roads in order to improve connectivity and ensure
safety since roads are the main means of transportation in the State. In the last ten years, the length and
quality of the roads has improved. Along the hill road, drainage and parapet facilities have been provided;
additionally most of the roads have been widened and beautified. All these have improved the travel
conditions and have increased tourism activities in the State. However, still there is a lot to be done to
improve the hilly and rural regions. Table 7 below provides an overview of the road infrastructure within
the State:
Table 7: Road infrastructure in Uttarakhand
8
Presentation on Uttarakhand 12th five year plan & annual plan 2011-12
Road category (2011-12) Length in Kms
National Highway 2,042
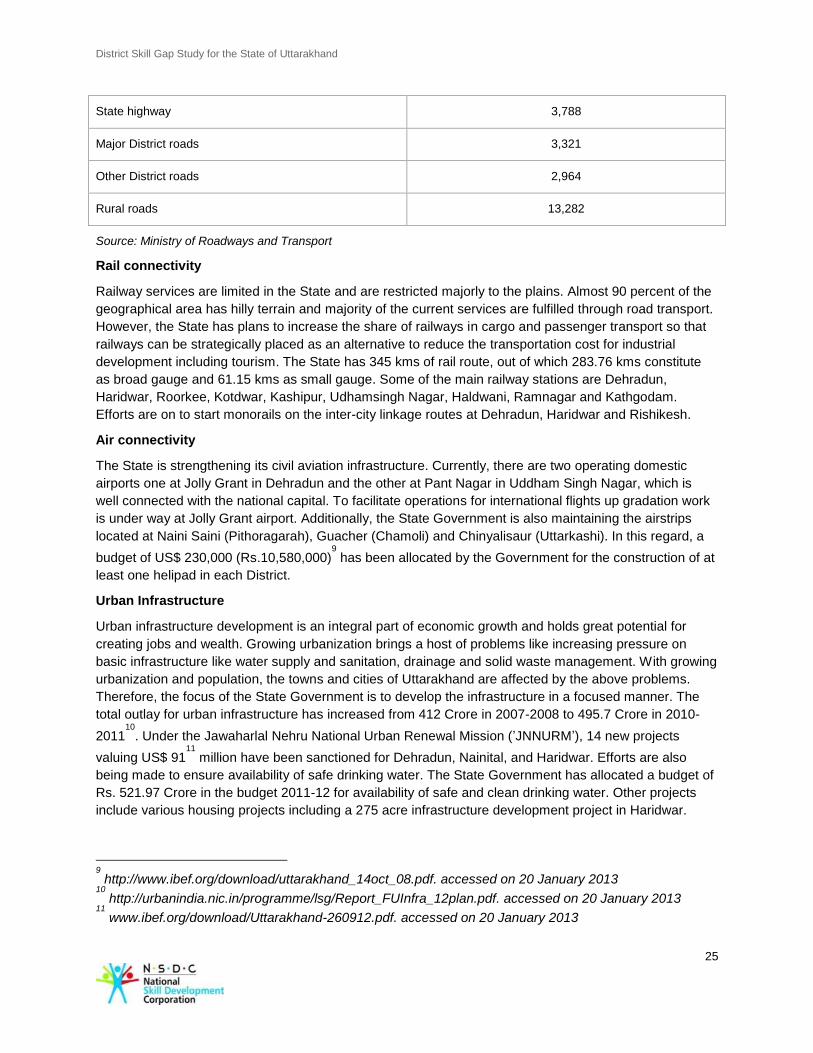
District Skill Gap Study for the State of Uttarakhand
25
Source: Ministry of Roadways and Transport
Rail connectivity
Railway services are limited in the State and are restricted majorly to the plains. Almost 90 percent of the
geographical area has hilly terrain and majority of the current services are fulfilled through road transport.
However, the State has plans to increase the share of railways in cargo and passenger transport so that
railways can be strategically placed as an alternative to reduce the transportation cost for industrial
development including tourism. The State has 345 kms of rail route, out of which 283.76 kms constitute
as broad gauge and 61.15 kms as small gauge. Some of the main railway stations are Dehradun,
Haridwar, Roorkee, Kotdwar, Kashipur, Udhamsingh Nagar, Haldwani, Ramnagar and Kathgodam.
Efforts are on to start monorails on the inter-city linkage routes at Dehradun, Haridwar and Rishikesh.
Air connectivity
The State is strengthening its civil aviation infrastructure. Currently, there are two operating domestic
airports one at Jolly Grant in Dehradun and the other at Pant Nagar in Uddham Singh Nagar, which is
well connected with the national capital. To facilitate operations for international flights up gradation work
is under way at Jolly Grant airport. Additionally, the State Government is also maintaining the airstrips
located at Naini Saini (Pithoragarah), Guacher (Chamoli) and Chinyalisaur (Uttarkashi). In this regard, a
budget of US$ 230,000 (Rs.10,580,000)9
has been allocated by the Government for the construction of at
least one helipad in each District.
Urban Infrastructure
Urban infrastructure development is an integral part of economic growth and holds great potential for
creating jobs and wealth. Growing urbanization brings a host of problems like increasing pressure on
basic infrastructure like water supply and sanitation, drainage and solid waste management. With growing
urbanization and population, the towns and cities of Uttarakhand are affected by the above problems.
Therefore, the focus of the State Government is to develop the infrastructure in a focused manner. The
total outlay for urban infrastructure has increased from 412 Crore in 2007-2008 to 495.7 Crore in 2010-
201110
. Under the Jawaharlal Nehru National Urban Renewal Mission (’JNNURM’), 14 new projects
valuing US$ 9111
million have been sanctioned for Dehradun, Nainital, and Haridwar. Efforts are also
being made to ensure availability of safe drinking water. The State Government has allocated a budget of
Rs. 521.97 Crore in the budget 2011-12 for availability of safe and clean drinking water. Other projects
include various housing projects including a 275 acre infrastructure development project in Haridwar.
9
http://www.ibef.org/download/uttarakhand_14oct_08.pdf. accessed on 20 January 2013 10
http://urbanindia.nic.in/programme/lsg/Report_FUInfra_12plan.pdf. accessed on 20 January 2013 11
www.ibef.org/download/Uttarakhand-260912.pdf. accessed on 20 January 2013
State highway 3,788
Major District roads 3,321
Other District roads 2,964
Rural roads 13,282
District Skill Gap Study for the State of Uttarakhand
26
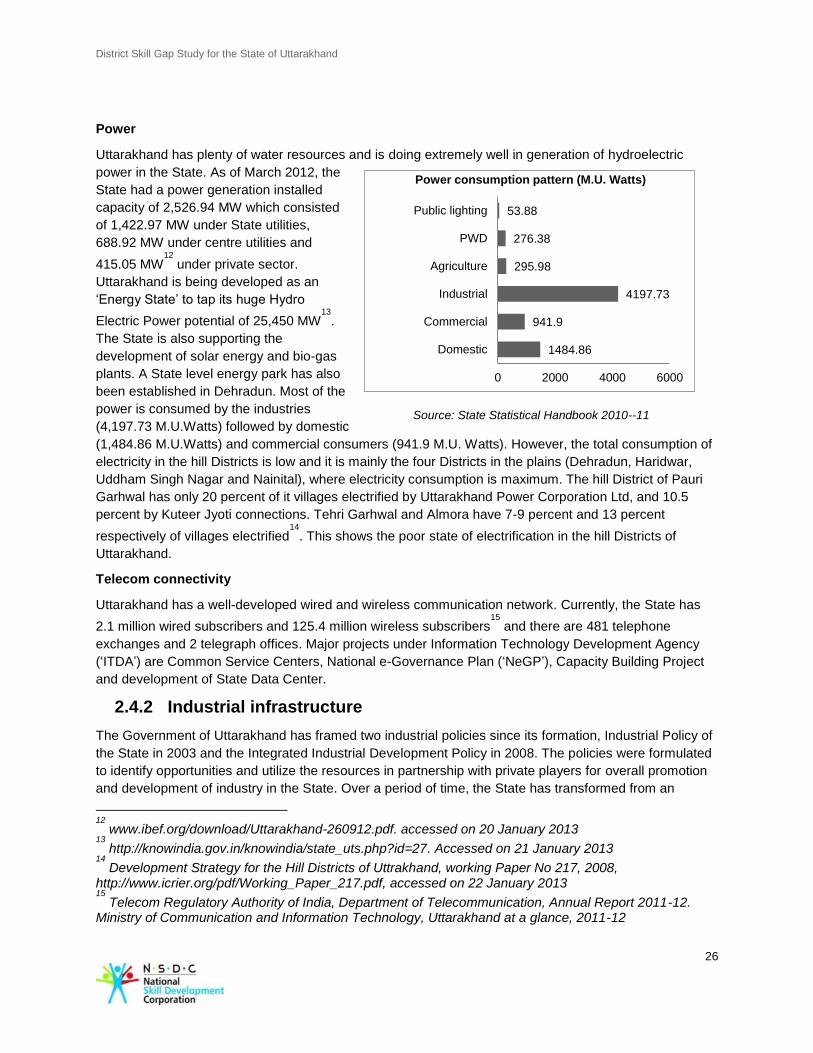
Power
Uttarakhand has plenty of water resources and is doing extremely well in generation of hydroelectric
power in the State. As of March 2012, the
State had a power generation installed
capacity of 2,526.94 MW which consisted
of 1,422.97 MW under State utilities,
688.92 MW under centre utilities and
415.05 MW12
under private sector.
Uttarakhand is being developed as an
‘Energy State’ to tap its huge Hydro
Electric Power potential of 25,450 MW13
.
The State is also supporting the
development of solar energy and bio-gas
plants. A State level energy park has also
been established in Dehradun. Most of the
power is consumed by the industries
(4,197.73 M.U.Watts) followed by domestic
(1,484.86 M.U.Watts) and commercial consumers (941.9 M.U. Watts). However, the total consumption of
electricity in the hill Districts is low and it is mainly the four Districts in the plains (Dehradun, Haridwar,
Uddham Singh Nagar and Nainital), where electricity consumption is maximum. The hill District of Pauri
Garhwal has only 20 percent of it villages electrified by Uttarakhand Power Corporation Ltd, and 10.5
percent by Kuteer Jyoti connections. Tehri Garhwal and Almora have 7-9 percent and 13 percent
respectively of villages electrified14
. This shows the poor state of electrification in the hill Districts of
Uttarakhand.
Telecom connectivity
Uttarakhand has a well-developed wired and wireless communication network. Currently, the State has
2.1 million wired subscribers and 125.4 million wireless subscribers15
and there are 481 telephone
exchanges and 2 telegraph offices. Major projects under Information Technology Development Agency
(‘ITDA’) are Common Service Centers, National e-Governance Plan (‘NeGP’), Capacity Building Project
and development of State Data Center.
2.4.2 Industrial infrastructure
The Government of Uttarakhand has framed two industrial policies since its formation, Industrial Policy of
the State in 2003 and the Integrated Industrial Development Policy in 2008. The policies were formulated
to identify opportunities and utilize the resources in partnership with private players for overall promotion
and development of industry in the State. Over a period of time, the State has transformed from an
12
www.ibef.org/download/Uttarakhand-260912.pdf. accessed on 20 January 2013 13
http://knowindia.gov.in/knowindia/state_uts.php?id=27. Accessed on 21 January 2013 14
Development Strategy for the Hill Districts of Uttrakhand, working Paper No 217, 2008, http://www.icrier.org/pdf/Working_Paper_217.pdf, accessed on 22 January 2013 15
Telecom Regulatory Authority of India, Department of Telecommunication, Annual Report 2011-12. Ministry of Communication and Information Technology, Uttarakhand at a glance, 2011-12
1484.86
941.9
4197.73
295.98
276.38
53.88
0 2000 4000 6000
Domestic
Commercial
Industrial
Agriculture
PWD
Public lighting
Power consumption pattern (M.U. Watts)
Source: State Statistical Handbook 2010--11
District Skill Gap Study for the State of Uttarakhand
27
agrarian State into a hub of industrial activity. The State has successfully developed three Integrated
Industrial Estates (‘IIEs’) at Haridwar, Pant Nagar and Sitarganj with a Pharma city at Selequi, an IT Park
at Sahastradhara in Dehradun and a Growth Centre at Siggadi in Kotdwar16
.
State Infrastructure and Industrial Development Corporation of Uttarakhand Ltd (‘SIDCUL’) was
incorporated in the year 2002 to promote industrial development in the State. It provides financial
assistance to industries in the form of debt, equity, venture capital and Joint Venture. SIDCUL facilitates
the management and implementation of the projects and acts as a single-window system to expedite
project clearance. Some of the key financial incentives provided by the SIDCUL are as follows17
:
► 100 percent Income-tax exemption for first 5 years and 30 percent for next 5 years for the companies
and 25 percent for others which comes in production by 31st March 2012;
► Capital investment subsidy @15 percent with maximum of Rs. 30 Lakhs (Rs. 3 million) which
companies comes in production by 31st March 2013;
► Exemption from entry tax on Plant & Machinery for setting up industry or undertaking substantial
expansion and modernization;
► 100 percent central excise exemption for ten years on items other than those mentioned in the
negative list in the concessional industrial package announced by the Central Government.
2.4.3 Social infrastructure
Education
As per census 2011 (provisional data) the literacy rate of Uttarakhand stands at 79.60 percent which is
higher than the national average of 74 percent18
. Uttarakhand is ranked 12th in the literacy rate in the
country and is better than the developed States such as Punjab and Gujarat19
. Uttarakhand is well known
for its boarding schools and is home to a number of technical education institutes. There are 107
colleges, 13 Universities, 3 Deemed Universities and the reputed Indian Institute of Technology in
Roorkee. Other important institutes of higher learning are GB Pant Engineering College, Pauri and
Kumaon Engineering College, Forest Research Institute, Birla Institute of Applied Science, and Nainital
College of Engineering.
The existing education infrastructure in the State has been summarized in the Table 8 below:
Table 8: Education Infrastructure (Number of Institutes)
16
PHD Research Bureau, www.phdcci.in/admin/userfiles/file/Research-Bureau/Uttarakhand.pdf, accessed on 14 January 2013 17
http://www.sidcul.com/Industrialpolicies/Fiscal.aspx. accessed 20 January 2013 18
PHD Research Bureau, www.phdcci.in/admin/userfiles/file/Research-Bureau/Uttarakhand.pdf, accessed on 14 January 2013 19
PHD Research Bureau, www.phdcci.in/admin/userfiles/file/Research-Bureau/Uttarakhand.pdf, accessed on 14 January 2013
Educational infrastructure details (2010-2011)
Primary schools 15,746
District Skill Gap Study for the State of Uttarakhand
28
Source: Directorate of Economics and Statistics, Uttarakhand
Primary and Upper Primary Education
As can be seen from the Table 9 below, enrolment percentages in Government Management School is
better than the Private Management School. Girl’s enrolment percentage in Primary School is low in
comparison to Upper Primary School level.
Table 9: Enrolments in Primary and Upper Primary School
Enrolment Primary Upper Primary
% Enrolment in Government Management Schools 66.85 60.92
% Enrolment in Private Management Schools 30.56 37.07
% Girls Enrolment 9.86 48.66
Source: Flash Statistics, 2011-2012
Further analysis of the institutions which students can access and their intake capacity is given below:
Table 10: Student’s enrollment in Polytechnic and ITIs
District
Total Institutes Enrolment
Polytechnics -
Technical teaching
institutes
Industrial
Training Institutes
(ITI) students
Polytechnics -
Technical teaching
institutes
Industrial
Training Institutes
(ITI) students
Uttarkashi 1 6 483 207
Chamoli 2 8 170 353
Rudrprayag 2 4 48 156
Tehri Garwal 1 12 248 449
Secondary schools 4,379
Senior Secondary schools 2,740
Colleges 107
Universities 13
Deemed Universities 3
Industrial Training Institutes 115
Polytechnics 40
Indian Institute of Technology 1
District Skill Gap Study for the State of Uttarakhand
29
Dehradun 5 8 947 1043
Pauri Garhwal 7 17 1526 650
Pithoragarh 4 8 192 396
Champawat 1 5 185 304
Almora 6 16 542 704
Bageshwar 2 4 153 66
Nainital 3 10 1118 743
Udham Singh Nagar 3 10 1784 747
Haridwar 1 7 334 342
Total 38 115 7730 6160
Source: District: At a Glance of respective Districts of Garhwal Division/ Sankhyikiya Patrika: Kumaun Mandal.
Some of the existing trades offered in the Polytechnics are Chemical Engineering, Chemical Technology
(rubber, plastic, paint), Civil Engineering, Computer Science, Electrical Engineering, Electronics
Engineering, Electronics and Communication Engineering, Information Technology, Interior Design and
Decoration, Mechanical Engineering, Agriculture Engineering, Modern office management and
secretarial, Pharmacy and Computer Application.
There are 115 ITI’s of which 36 are under Public Private Partnership. Some of the existing trades offered
in these institutes are on Fitter, Turner, Machinist, Electronic, Motor Mechanic, Plumber, Wireman, Radio
& TV, Data Entry Operator, Cutting & Sewing, Horticulture, Craftsmen Food Production, Weaving of
Woolen Fabric, and Steno Hindi.
Health
The significance of investing in health to support economic development and reduce poverty has been
recognized by the World Health Organization’s Commission on Macroeconomic and Health (‘CMH’) in the
Indian Health Report. As of March 2011, the State20
had 275 Primary Health Centers, 55 Community
Health Centers, 12 District Level Hospital, and 8193 beds in Government hospitals. Morbidity and
mortality rates are important indicators of health status and Uttarakhand has performed reasonably well
on these health indicators in comparison to the rest of the States. The Infant Mortality Rate is 38 per
1,000 as compared to 50 the national average. The birth rate is 19.3 per 1,000 and death rate is 7.3 per
1,000 people. However, Uttarakhand needs to improve the per capita expenditure on health since the per
capita expenditure on health within the State is almost two-third of the nation average 1,20121
.
20
Directorate of Economics and Statistics, Government of Uttarakhand 21
Annual report to people on health September 2010 & PHD Research Bureau – Uttarakhand State Profile
District Skill Gap Study for the State of Uttarakhand
30
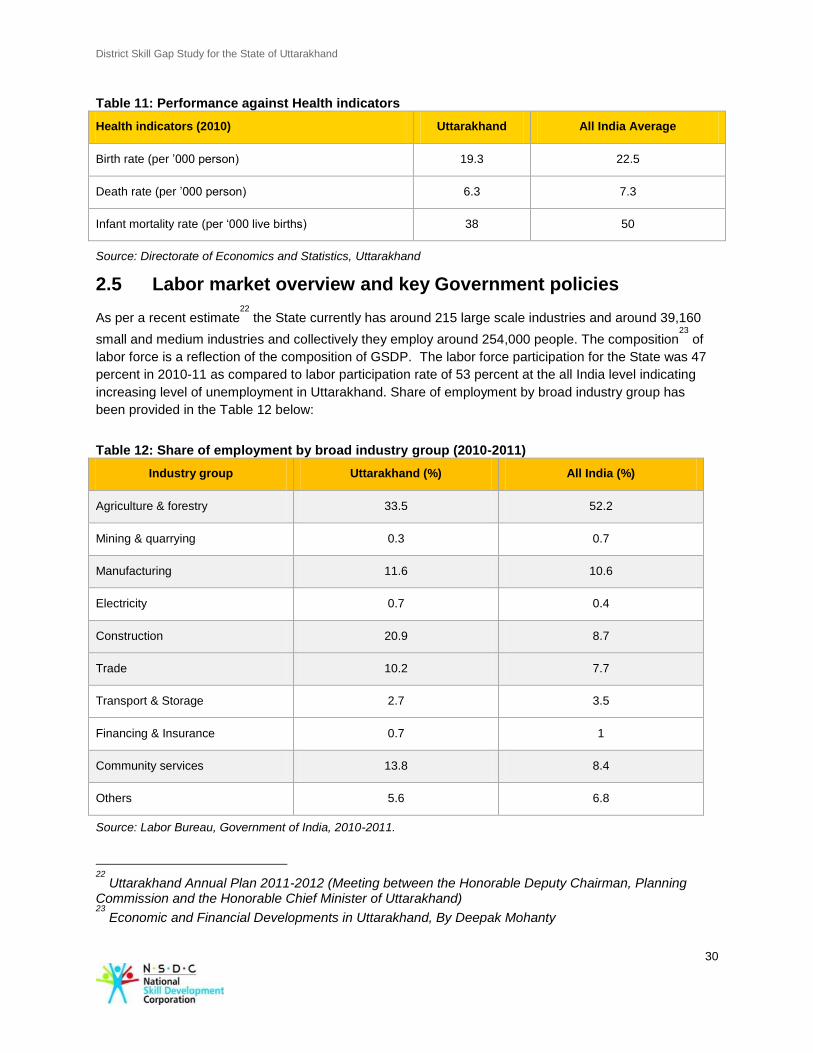
Table 11: Performance against Health indicators
Health indicators (2010) Uttarakhand All India Average
Birth rate (per ’000 person) 19.3 22.5
Death rate (per ’000 person) 6.3 7.3
Infant mortality rate (per ‘000 live births) 38 50
Source: Directorate of Economics and Statistics, Uttarakhand
2.5 Labor market overview and key Government policies
As per a recent estimate22
the State currently has around 215 large scale industries and around 39,160
small and medium industries and collectively they employ around 254,000 people. The composition23
of
labor force is a reflection of the composition of GSDP. The labor force participation for the State was 47
percent in 2010-11 as compared to labor participation rate of 53 percent at the all India level indicating
increasing level of unemployment in Uttarakhand. Share of employment by broad industry group has
been provided in the Table 12 below:
Table 12: Share of employment by broad industry group (2010-2011)
Industry group Uttarakhand (%) All India (%)
Agriculture & forestry 33.5 52.2
Mining & quarrying 0.3 0.7
Manufacturing 11.6 10.6
Electricity 0.7 0.4
Construction 20.9 8.7
Trade 10.2 7.7
Transport & Storage 2.7 3.5
Financing & Insurance 0.7 1
Community services 13.8 8.4
Others 5.6 6.8
Source: Labor Bureau, Government of India, 2010-2011.
22
Uttarakhand Annual Plan 2011-2012 (Meeting between the Honorable Deputy Chairman, Planning Commission and the Honorable Chief Minister of Uttarakhand) 23
Economic and Financial Developments in Uttarakhand, By Deepak Mohanty
District Skill Gap Study for the State of Uttarakhand
31
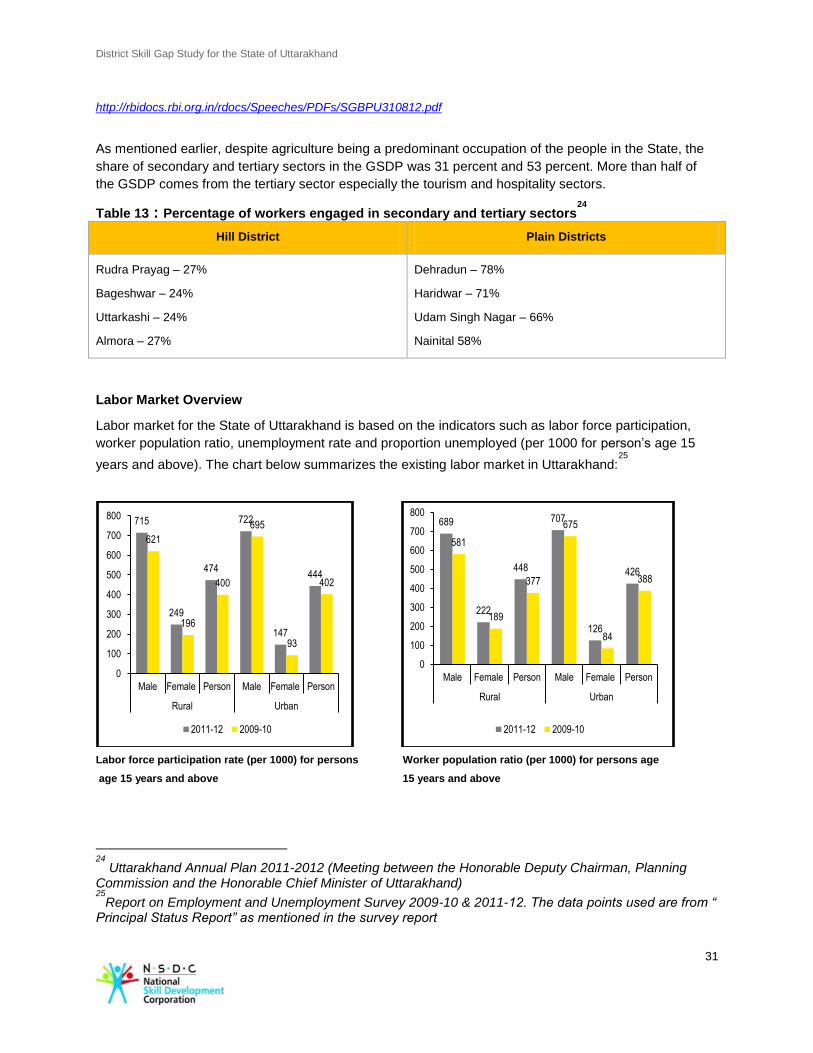
http://rbidocs.rbi.org.in/rdocs/Speeches/PDFs/SGBPU310812.pdf
As mentioned earlier, despite agriculture being a predominant occupation of the people in the State, the
share of secondary and tertiary sectors in the GSDP was 31 percent and 53 percent. More than half of
the GSDP comes from the tertiary sector especially the tourism and hospitality sectors.
Table 13 : Percentage of workers engaged in secondary and tertiary sectors24
Hill District Plain Districts
Rudra Prayag – 27%
Bageshwar – 24%
Uttarkashi – 24%
Almora – 27%
Dehradun – 78%
Haridwar – 71%
Udam Singh Nagar – 66%
Nainital 58%
Labor Market Overview
Labor market for the State of Uttarakhand is based on the indicators such as labor force participation,
worker population ratio, unemployment rate and proportion unemployed (per 1000 for person’s age 15
years and above). The chart below summarizes the existing labor market in Uttarakhand:25
Labor force participation rate (per 1000) for persons Worker population ratio (per 1000) for persons age
age 15 years and above 15 years and above
24
Uttarakhand Annual Plan 2011-2012 (Meeting between the Honorable Deputy Chairman, Planning Commission and the Honorable Chief Minister of Uttarakhand) 25
Report on Employment and Unemployment Survey 2009-10 & 2011-12. The data points used are from “ Principal Status Report” as mentioned in the survey report
715
249
474
722
147
444
621
196
400
695
93
402
0
100
200
300
400
500
600
700
800
Male Female Person Male Female Person
Rural Urban
2011-12 2009-10
689
222
448
707
126
426
581
189
377
675
84
388
0
100
200
300
400
500
600
700
800
Male Female Person Male Female Person
Rural Urban
2011-12 2009-10
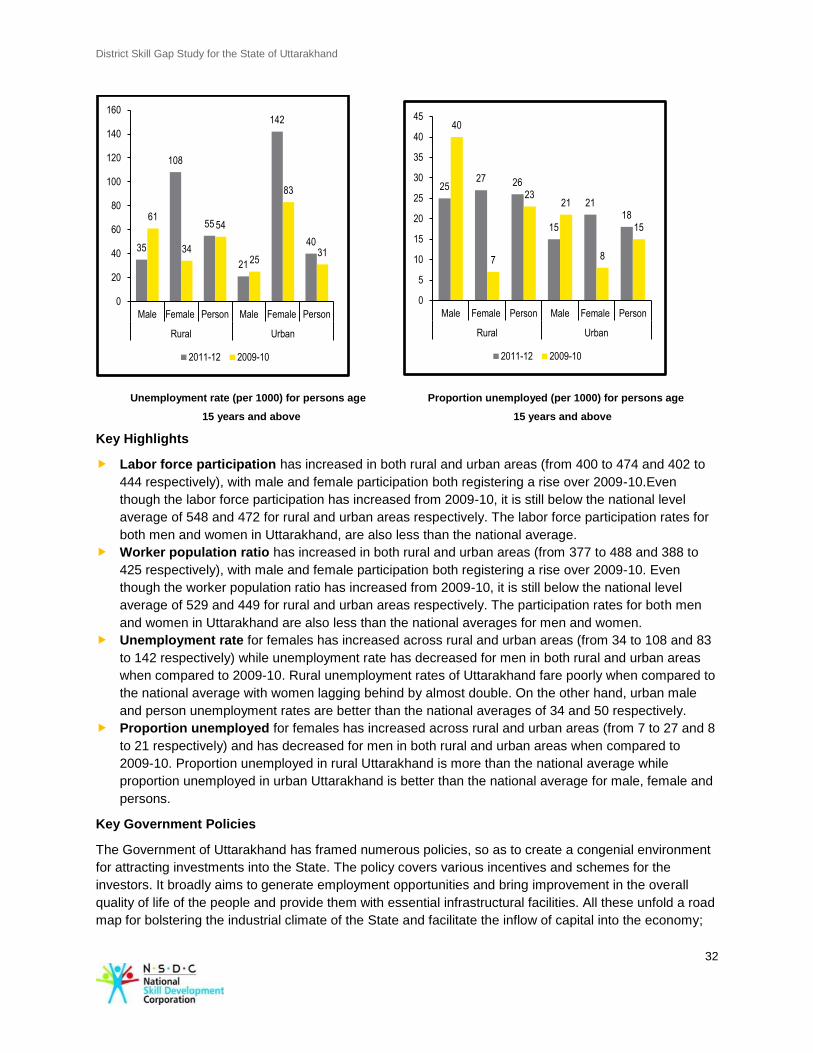
District Skill Gap Study for the State of Uttarakhand
32
Unemployment rate (per 1000) for persons age Proportion unemployed (per 1000) for persons age
15 years and above 15 years and above
Key Highlights
Labor force participation has increased in both rural and urban areas (from 400 to 474 and 402 to
444 respectively), with male and female participation both registering a rise over 2009-10.Even
though the labor force participation has increased from 2009-10, it is still below the national level
average of 548 and 472 for rural and urban areas respectively. The labor force participation rates for
both men and women in Uttarakhand, are also less than the national average.
Worker population ratio has increased in both rural and urban areas (from 377 to 488 and 388 to
425 respectively), with male and female participation both registering a rise over 2009-10. Even
though the worker population ratio has increased from 2009-10, it is still below the national level
average of 529 and 449 for rural and urban areas respectively. The participation rates for both men
and women in Uttarakhand are also less than the national averages for men and women.
Unemployment rate for females has increased across rural and urban areas (from 34 to 108 and 83
to 142 respectively) while unemployment rate has decreased for men in both rural and urban areas
when compared to 2009-10. Rural unemployment rates of Uttarakhand fare poorly when compared to
the national average with women lagging behind by almost double. On the other hand, urban male
and person unemployment rates are better than the national averages of 34 and 50 respectively.
Proportion unemployed for females has increased across rural and urban areas (from 7 to 27 and 8
to 21 respectively) and has decreased for men in both rural and urban areas when compared to
2009-10. Proportion unemployed in rural Uttarakhand is more than the national average while
proportion unemployed in urban Uttarakhand is better than the national average for male, female and
persons.
Key Government Policies
The Government of Uttarakhand has framed numerous policies, so as to create a congenial environment
for attracting investments into the State. The policy covers various incentives and schemes for the
investors. It broadly aims to generate employment opportunities and bring improvement in the overall
quality of life of the people and provide them with essential infrastructural facilities. All these unfold a road
map for bolstering the industrial climate of the State and facilitate the inflow of capital into the economy;
35
108
55
21
142
40
61
34
54
25
83
31
0
20
40
60
80
100
120
140
160
Male Female Person Male Female Person
Rural Urban
2011-12 2009-10
25 27 26
15
21 18
40
7
23 21
8
15
0
5
10
15
20
25
30
35
40
45
Male Female Person Male Female Person
Rural Urban
2011-12 2009-10
District Skill Gap Study for the State of Uttarakhand
33
the major being the State Industrial Policy, Information Technology Policy and Biotechnology Policy. A
brief snapshot of the same has been provided below:
State Industrial Policy 2003 and 2008
The State Industrial Policy of 2003 aimed to provide a comprehensive investor friendly framework to
ensure rapid and sustainable industrial development in Uttarakhand. The thrust of the policy was to
generate additional employment opportunities and to increase the State Domestic Product. The policy
aims to promote Public Private Partnership in development and management of infrastructure like
industrial estates, special economic zones, theme parks, tourist destinations, airports and power projects.
Additionally, the policy focused on promoting small scale industries, cottage, khadi and village industries,
handicrafts and the silk and handloom sector. It emphasized technological up gradation, and
modernization of common facilities, improvement in product design and development of marketing
support to make the products globally competitive and remunerative. Some of highlights of the State
Industrial Policy of 2003 are26
:
New small-scale industrial units will be provided interest relief on loans at the rate of 3 percent annual
relief;
The same applies to existing small scale industries which have expanded at least 25 percent;
Small scale industries being opened in regions 3,000 feet above sea level and higher and thrust
industries will be given the advantage of a 5percent waiver on the annual interest on loans;
Sick units will be supported by waiving 3 percent of the annual interest on loans with the objective to
revive these units;
Ropeways, amusement parks and multiplexes will be exempted from entertainment tax for 3 to 5
years;
Tourism elevated to the status of an industry;
Support for patent registration, ISO certification, and pollution control equipment;
Small scale industries will get priority in the State purchase for buying and pricing, while large and
medium industries will get purchase precedence.
Subsequently, the State launched the Integrated Industrial Development Policy in 2008. The policy aimed
to speed up development in remote and hilly Districts of Uttarakhand. The policy focuses on
entrepreneurial development through market linkage and provides financial support to upcoming
entrepreneurs.
Tourism Policy
Uttarakhand has immense tourism potential with its unique natural offerings, picturesque locations,
snowcapped mountains, lush green valleys and cool climate with hospitable people. However, its
potential has not been tapped sufficiently. There is a huge infrastructural gap and lack of well-coordinated
efforts between public and private players in marketing Uttarakhand as a tourist hot spot. To address the
prevailing problems of inadequate infrastructure, investment and limited public private sector participation,
the tourism policy of Uttarakhand was brought out in 2001. The following were the objectives of the policy:
► Place Uttarakhand on the tourism map of the world as one of the leading tourist destinations and to
make Uttarakhand synonymous with tourism;
► Develop manifold tourism related resources of the State in an eco-friendly manner, with the active
participation of the private sector and the local host communities;
26
www.ibef.org/download%5CUttarakhand_14Oct_08.pdf
District Skill Gap Study for the State of Uttarakhand
34
► Develop tourism as a major source of employment and income/revenue generation and as a pivot of
the economic and social development in the State.
The Uttarakhand Tourism Development Master Plan 2007-2022 identifies a number of areas that need to
be focused upon to develop the potential of the tourism sector in the State. According to the plan
infrastructure development, connectivity, sanitation, local participation, creating awareness through
effective marketing, simplification of institutional framework and participation of the private sector are
important areas to be strengthened in order to develop a strong eco system for the sector. There is now
an urgency to do so after the recent natural disaster in the state.
Information Technology Policy 2006
Information Technology (‘IT’) and IT enabled services have been accorded industry status by the State
Government of Uttarakhand. The State meets the entire prerequisite for developing as a preferred
destination for IT & ITES in Dehradun. Land use, conversion charges are being softened for the
promotion of IT in the State. Various exemptions including stamp duty concession are being provided to
IT industry established in the IT parks and industrial estates. The IT policy of the State aims to attain the
following objective:
► Upgrade and develop manpower skills required for the Information Technology industry and to
accelerate the use of Information Technology in schools, colleges and other educational institutions
with a view to providing skills and knowledge to the youth so as to render them fit for employment in
this industry.
► Encourage the use of IT in Government not only as a tool for management and decision support
systems, but also re-engineer the processes to provide a more efficient, transparent accountable and
responsive Government to its citizens.
► Upgrade the quality of life of citizens of the State by facilitating easy access to consumer applications
of Information Technology.
► Encourage private sector initiatives for the development of world class IT infrastructure adequate for
the needs of citizens, industry and Government.
Agriculture
Agriculture is one of the key sectors of Uttarakhand’s economy and contributes 15.50 percent27
to the
GSDP (FY2009) of the State. The natural habitat is ideal for agriculture and it employs three-fourth 28
of
the State’s population. While the Government is focused on increasing the industrial base of the District,
there is continuous effort to promote agriculture and allied sectors in the State which has grown 1.98
percent from 2001 to 2009. The Government has set up four Agri Export Zones in the State under the
Central Governments AEZ Schemes, to boost agro food processing for litchi, horticulture, herbs,
medicinal plants and basmati rice. Additionally the Ministry of Food Processing Industry (‘MoFPI’)
provides higher incentives to the agro processing unit since the State comes in the category of difficult
areas for food processing.
In 2011 the Government approved the APMC Act that allowed private players to enter the agriculture
market and also set up the private mandis. In the same year the State Government also put in place
policies to promote special agriculture zones (‘SAZ’), to set up micro and small enterprises in the
agriculture sector, while also giving units special incentives like availability of 24-hour power supply and
27
Directorate of Economics and Statistics, Uttarakhand . 28
Ministry of Agriculture, Directorate of Economics and Statistics, Uttarakhand .
District Skill Gap Study for the State of Uttarakhand
35
free soil tests, special collection and processing centres for the benefit of farmers. Given that landholding
in the State is very small, the Government is encouraging farmers to consolidate land by waiving off
stamp duty for farmers wanting to purchase lands adjacent to their existing fields. State Government is
also providing subsidy for projects under various schemes of Agricultural and Processed Food Products
Export Development Authority (‘APEDA’), National Horticulture Board (‘NHB’), Ministry of Food
Processing Industry ‘(MoFPI’) and the Natural Medicinal Plant Board (‘NMPB’).
Biotechnology Policy
The policy was announced with a vision to deploy, use, exploit and leverage the biotechnology as a
useful tool for translating bio-wealth into economic wealth on one hand and preserving the same on the
other. To attain this overall goal, the objectives of the policy are29
:-
► To map the rich Biodiversity of the State, including land races and lesser known crops and create
exhaustive/extensive data base to enable ex situ & in situ conservation, scientific management and
prevent reckless exploitation.
► To intensify the R & D work in potential areas of Biotechnology and upgrade the infrastructure of R &
D institutions to generate quality research and to foster industry linkages.
► To promote the human resource development in this field through up gradation of the existing as well
as and setting up of new educational institutions.
► In the realm of Plant Biotechnology, leverage on the existing knowledge base to promote research,
which meets the needs of Indian farmers becoming competitive and enable them to take advantage
of what are today closely held technologies.
► To promote medicinal and aromatic plants/herbs of which abundance is found in Uttaranchal to
enable their natural growth as well as scientific promotion of the pharmaceuticals, nutraceuticals and
such other industries. To encourage the entire spectrum from low-end industries which are capable of
going to the farmer’s field to the highest end?
► To spread awareness about the investment opportunities, in Biotechnology and allied sectors, in the
State of Uttaranchal.
► To this end proactively promote setting up of Biotechnology industries in the State whether in an
Industrial Estate mode or dispersed in smaller pockets throughout the State, and to outline a set of
incentives and concessions for the BT industry to attract investment.
► To provide a suitable institutional framework this is a mix of the best available talents, with proactive
Governmental support and facilitation.
2.6 Other Skill Development Programs
India is considered as one of the few countries, where the working age population will be far in excess of
those dependent on them and this will continue for at least three decades till 2040.30
In recognition of this
need, apart from the State Government, the Central Government and concerned ministries have taken
several steps for skilling the manpower through different programs, which are presented in the Table 14
below:
29
http://business.gov.in/investment_incentives/investment_policies_uk.php. Accessed on February 07 2013. 30
http://www.skilldevelopment.gov.in/skill-landscape-in-india
District Skill Gap Study for the State of Uttarakhand
36
Table 14: Government promoted skill development schemes
Ministry/Department Schemes/Programs/Institutions Key Points
Ministry of Agriculture Rastriya Krishi Vikas Yojana, Big Dairy
Scheme for Dairy Entrepreneurs,
Swarn Jayanti Gram Swarojgaar
Yojana
Focuses on training farmers, encourages
dairy entrepreneurs and provides them
with initial financial assistance at
concessional interest rates
Ministry of Labour &
Employment
Rural Employment Generation
Programme (REGP)
Sampoorna Grameen Rozgar Yojana
(SGRY)
Training of Rural Youth for Self-
Employment (TRYSEM)
Skills are made bankable and individuals
are enabled to convert their knowledge
and skills, through Testing and
Certification, into higher diplomas and
degrees and learner can pay the skill
provider
directly.
Ministry of Textiles Integrated Skill Development Scheme
(ISDS) implemented by Lakshmi
Cotsyn Limited
Caters to skilled manpower needs of
Textile and related segments through skill
development training programmes.
Envisages participation of training
institutes associated with the Ministry and
the private sector as implementing
agencies.
MMSME – Development
Institute, Haldwani
Skill development initiatives of DC-
MSME implemented through MSME
Development Institutes
Engaged in promotion & development of
Micro, Small and Medium Enterprises in
the State of Uttarakhand, about 2321
persons were trained in 2011-12
Ministry of Rural
Development
Swarnjayanti Gram Swarozgar Yojana
(SGSY)
Focus is on SC/ST, women and disabled
poor
Ministry of Tourism-
Development
Uttarakhand Tourism Development
Master Plan
Provision of a strategic spatial planning
framework for improved tourism
2.7 Migration in Uttarakhand
The study team had proposed to analyse the available data in the State to identify pockets of migration in
the State and the destination where a majority of individuals migrate. The team did not find detailed
information with respect to migration in the State, therefore, a review of available literature was done to
develop a perspective on migration in the State. NSSO Study on migration undertaken in 2007-08 shows
some trends on migration across all States. The findings reveal the following:
► Migration is higher among those with higher literacy levels than those with less or no literacy.
► Men migrate largely to seek employment opportunities whereas most women migrate when they get
District Skill Gap Study for the State of Uttarakhand
37
married.
► While migrants from rural areas engage in self-employment, the urban migrants engage in salaried
jobs.
► The proportion of short term migration in rural areas was more than those in urban areas. Migrants
from urban areas migrate for longer duration or permanently whereas migrants from rural areas return
to their native place after few years.
► Those who migrate do contribute to the State economy because it was found that the families spend
more money on household expenditure, well invest more and repay their debts wherever required.
The findings pertaining to Uttarakhand provide evidence that about greater migration in the State than the
national average. At the time of study 28 out of 1,000 households had migrated during the last 365 days
as compared to a corresponding national figure which was found to be 19. There is a significant
migration from rural to rural areas 595 per 1,000 than rural to urban which were 144 per 1,000. The most
common reason for migration is search for employment followed by movement of parent or earning family
member. While there is significant out migration, there is in migration too, thus making the net migration
rate as 38 per 1,000.
A study of Migration and Workforce Participation in the Himalayan States by R. Lusome and R.B.Bhagat
shows that with the exception of Jammu & Kashmir, the proportion of migrants is higher in the three
Himalayan States i.e. Himachal Pradesh, Sikkim and Uttarakhand (Table 15).
Table 15: Percentage of migrants to total population 2001
States/country Total Population (in
millions)
Total Migrants (in
millions)
% of migrants to total
population
India 1,028.6 314.5 30.6
Jammu & Kashmir 10.1 1.8 17.8
Himachal Pradesh 6.1 2.2 36.1
Sikkim 0.54 0.19 34.6
Uttarakhand 8.5 3.1 36.2
While within the State a higher proportion of individuals migrate within the District, when compared to the
national figures (Table 16), there is significantly higher migration taking place at the interstate level than
the national average.
Table 16: Percentage distribution of the streams of migration 0-9 years 2001
Streams of Migration India Uttarakhand
Intra-District 55.0 44.7
Inter-District 27.1 19.3
Interstate 17.1 33.3
International 0.8 2.7
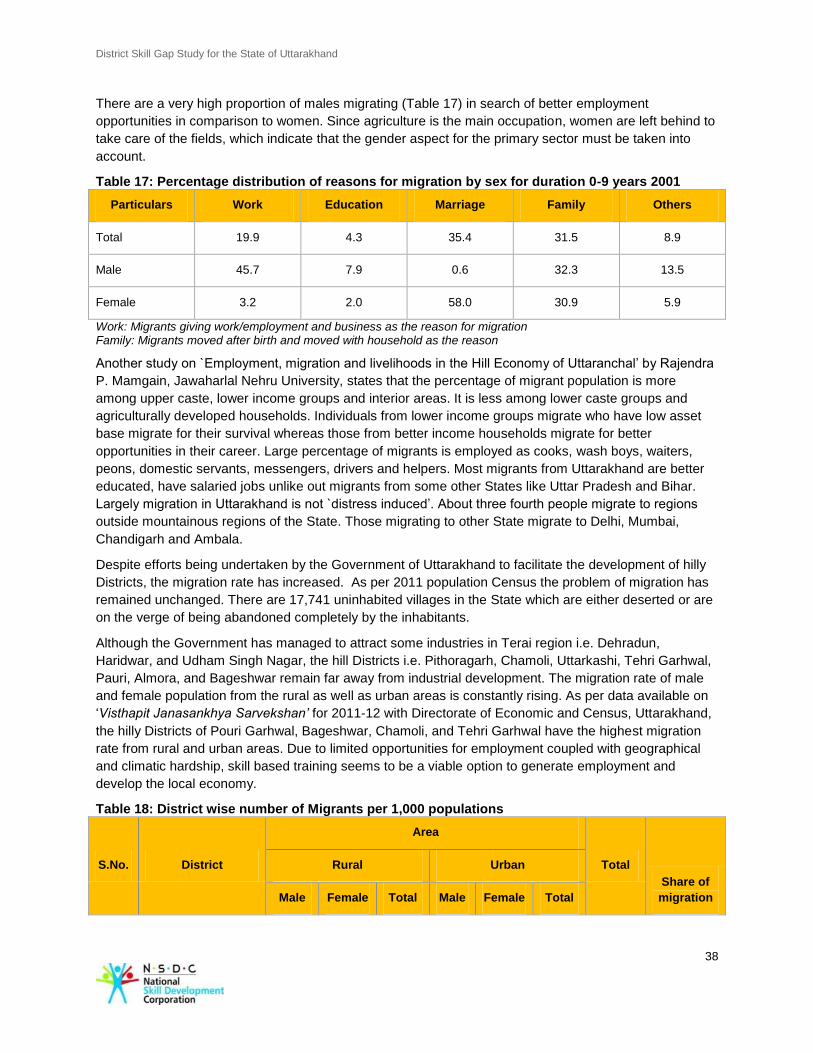
District Skill Gap Study for the State of Uttarakhand
38
There are a very high proportion of males migrating (Table 17) in search of better employment
opportunities in comparison to women. Since agriculture is the main occupation, women are left behind to
take care of the fields, which indicate that the gender aspect for the primary sector must be taken into
account.
Table 17: Percentage distribution of reasons for migration by sex for duration 0-9 years 2001
Particulars Work Education Marriage Family Others
Total 19.9 4.3 35.4 31.5 8.9
Male 45.7 7.9 0.6 32.3 13.5
Female 3.2 2.0 58.0 30.9 5.9
Work: Migrants giving work/employment and business as the reason for migration Family: Migrants moved after birth and moved with household as the reason
Another study on `Employment, migration and livelihoods in the Hill Economy of Uttaranchal’ by Rajendra
P. Mamgain, Jawaharlal Nehru University, states that the percentage of migrant population is more
among upper caste, lower income groups and interior areas. It is less among lower caste groups and
agriculturally developed households. Individuals from lower income groups migrate who have low asset
base migrate for their survival whereas those from better income households migrate for better
opportunities in their career. Large percentage of migrants is employed as cooks, wash boys, waiters,
peons, domestic servants, messengers, drivers and helpers. Most migrants from Uttarakhand are better
educated, have salaried jobs unlike out migrants from some other States like Uttar Pradesh and Bihar.
Largely migration in Uttarakhand is not `distress induced’. About three fourth people migrate to regions
outside mountainous regions of the State. Those migrating to other State migrate to Delhi, Mumbai,
Chandigarh and Ambala.
Despite efforts being undertaken by the Government of Uttarakhand to facilitate the development of hilly
Districts, the migration rate has increased. As per 2011 population Census the problem of migration has
remained unchanged. There are 17,741 uninhabited villages in the State which are either deserted or are
on the verge of being abandoned completely by the inhabitants.
Although the Government has managed to attract some industries in Terai region i.e. Dehradun,
Haridwar, and Udham Singh Nagar, the hill Districts i.e. Pithoragarh, Chamoli, Uttarkashi, Tehri Garhwal,
Pauri, Almora, and Bageshwar remain far away from industrial development. The migration rate of male
and female population from the rural as well as urban areas is constantly rising. As per data available on
‘Visthapit Janasankhya Sarvekshan’ for 2011-12 with Directorate of Economic and Census, Uttarakhand,
the hilly Districts of Pouri Garhwal, Bageshwar, Chamoli, and Tehri Garhwal have the highest migration
rate from rural and urban areas. Due to limited opportunities for employment coupled with geographical
and climatic hardship, skill based training seems to be a viable option to generate employment and
develop the local economy.
Table 18: District wise number of Migrants per 1,000 populations
S.No. District
Area
Total
Share of
migration
Rural Urban
Male Female Total Male Female Total
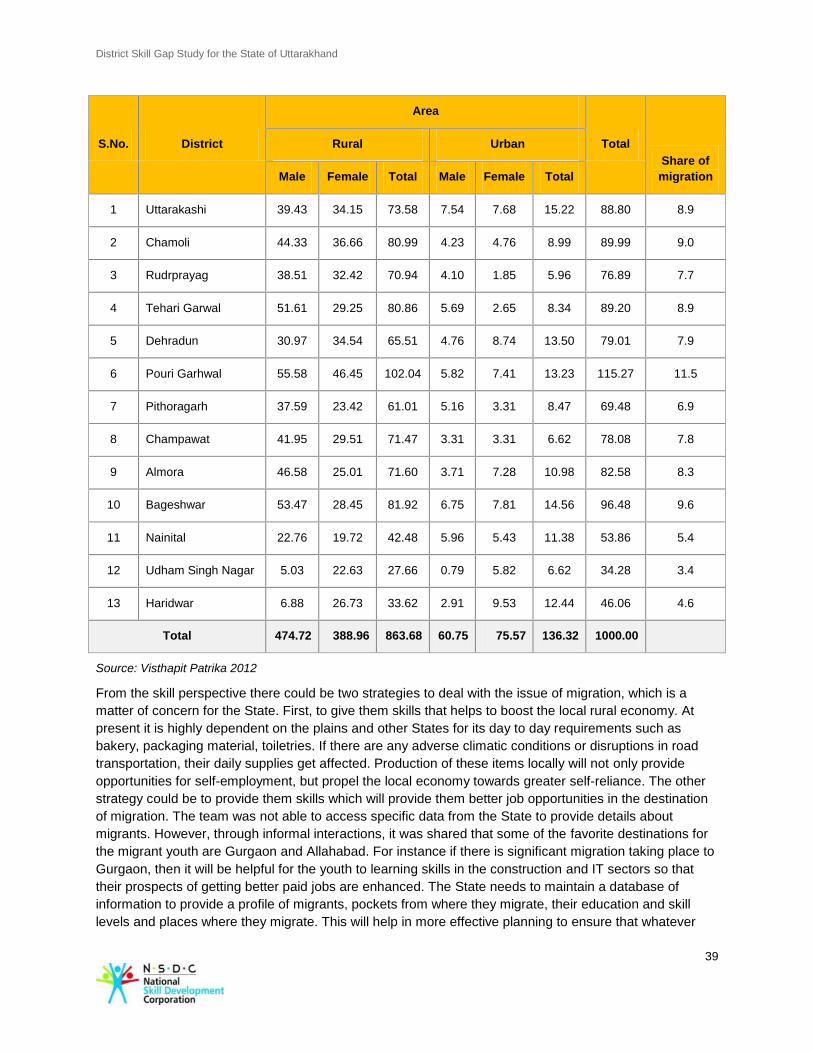
District Skill Gap Study for the State of Uttarakhand
39
S.No. District
Area
Total
Share of
migration
Rural Urban
Male Female Total Male Female Total
1 Uttarakashi 39.43 34.15 73.58 7.54 7.68 15.22 88.80 8.9
2 Chamoli 44.33 36.66 80.99 4.23 4.76 8.99 89.99 9.0
3 Rudrprayag 38.51 32.42 70.94 4.10 1.85 5.96 76.89 7.7
4 Tehari Garwal 51.61 29.25 80.86 5.69 2.65 8.34 89.20 8.9
5 Dehradun 30.97 34.54 65.51 4.76 8.74 13.50 79.01 7.9
6 Pouri Garhwal 55.58 46.45 102.04 5.82 7.41 13.23 115.27 11.5
7 Pithoragarh 37.59 23.42 61.01 5.16 3.31 8.47 69.48 6.9
8 Champawat 41.95 29.51 71.47 3.31 3.31 6.62 78.08 7.8
9 Almora 46.58 25.01 71.60 3.71 7.28 10.98 82.58 8.3
10 Bageshwar 53.47 28.45 81.92 6.75 7.81 14.56 96.48 9.6
11 Nainital 22.76 19.72 42.48 5.96 5.43 11.38 53.86 5.4
12 Udham Singh Nagar 5.03 22.63 27.66 0.79 5.82 6.62 34.28 3.4
13 Haridwar 6.88 26.73 33.62 2.91 9.53 12.44 46.06 4.6
Total 474.72 388.96 863.68 60.75 75.57 136.32 1000.00
Source: Visthapit Patrika 2012
From the skill perspective there could be two strategies to deal with the issue of migration, which is a
matter of concern for the State. First, to give them skills that helps to boost the local rural economy. At
present it is highly dependent on the plains and other States for its day to day requirements such as
bakery, packaging material, toiletries. If there are any adverse climatic conditions or disruptions in road
transportation, their daily supplies get affected. Production of these items locally will not only provide
opportunities for self-employment, but propel the local economy towards greater self-reliance. The other
strategy could be to provide them skills which will provide them better job opportunities in the destination
of migration. The team was not able to access specific data from the State to provide details about
migrants. However, through informal interactions, it was shared that some of the favorite destinations for
the migrant youth are Gurgaon and Allahabad. For instance if there is significant migration taking place to
Gurgaon, then it will be helpful for the youth to learning skills in the construction and IT sectors so that
their prospects of getting better paid jobs are enhanced. The State needs to maintain a database of
information to provide a profile of migrants, pockets from where they migrate, their education and skill
levels and places where they migrate. This will help in more effective planning to ensure that whatever
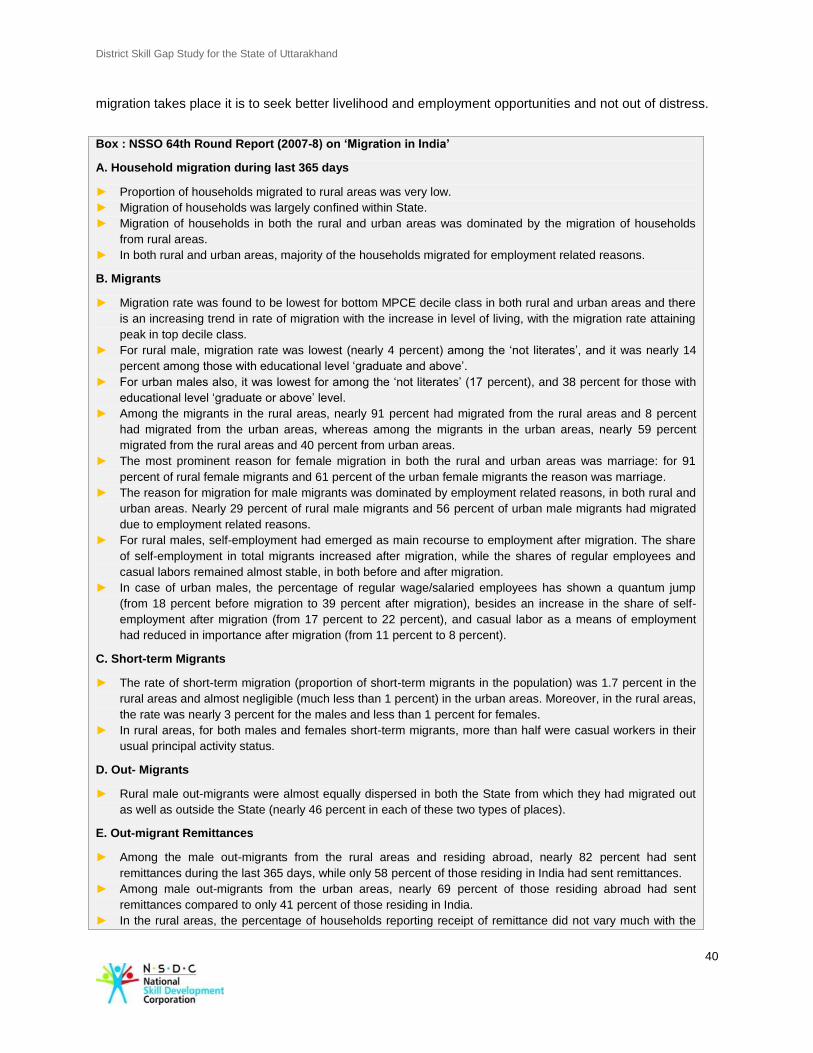
District Skill Gap Study for the State of Uttarakhand
40
migration takes place it is to seek better livelihood and employment opportunities and not out of distress.
Box : NSSO 64th Round Report (2007-8) on ‘Migration in India’
A. Household migration during last 365 days
► Proportion of households migrated to rural areas was very low.
► Migration of households was largely confined within State.
► Migration of households in both the rural and urban areas was dominated by the migration of households
from rural areas.
► In both rural and urban areas, majority of the households migrated for employment related reasons.
B. Migrants
► Migration rate was found to be lowest for bottom MPCE decile class in both rural and urban areas and there
is an increasing trend in rate of migration with the increase in level of living, with the migration rate attaining
peak in top decile class.
► For rural male, migration rate was lowest (nearly 4 percent) among the ‘not literates’, and it was nearly 14
percent among those with educational level ‘graduate and above’.
► For urban males also, it was lowest for among the ‘not literates’ (17 percent), and 38 percent for those with
educational level ‘graduate or above’ level.
► Among the migrants in the rural areas, nearly 91 percent had migrated from the rural areas and 8 percent
had migrated from the urban areas, whereas among the migrants in the urban areas, nearly 59 percent
migrated from the rural areas and 40 percent from urban areas.
► The most prominent reason for female migration in both the rural and urban areas was marriage: for 91
percent of rural female migrants and 61 percent of the urban female migrants the reason was marriage.
► The reason for migration for male migrants was dominated by employment related reasons, in both rural and
urban areas. Nearly 29 percent of rural male migrants and 56 percent of urban male migrants had migrated
due to employment related reasons.
► For rural males, self-employment had emerged as main recourse to employment after migration. The share
of self-employment in total migrants increased after migration, while the shares of regular employees and
casual labors remained almost stable, in both before and after migration.
► In case of urban males, the percentage of regular wage/salaried employees has shown a quantum jump
(from 18 percent before migration to 39 percent after migration), besides an increase in the share of self-
employment after migration (from 17 percent to 22 percent), and casual labor as a means of employment
had reduced in importance after migration (from 11 percent to 8 percent).
C. Short-term Migrants
► The rate of short-term migration (proportion of short-term migrants in the population) was 1.7 percent in the
rural areas and almost negligible (much less than 1 percent) in the urban areas. Moreover, in the rural areas,
the rate was nearly 3 percent for the males and less than 1 percent for females.
► In rural areas, for both males and females short-term migrants, more than half were casual workers in their
usual principal activity status.
D. Out- Migrants
► Rural male out-migrants were almost equally dispersed in both the State from which they had migrated out
as well as outside the State (nearly 46 percent in each of these two types of places).
E. Out-migrant Remittances
► Among the male out-migrants from the rural areas and residing abroad, nearly 82 percent had sent
remittances during the last 365 days, while only 58 percent of those residing in India had sent remittances.
► Among male out-migrants from the urban areas, nearly 69 percent of those residing abroad had sent
remittances compared to only 41 percent of those residing in India.
► In the rural areas, the percentage of households reporting receipt of remittance did not vary much with the
District Skill Gap Study for the State of Uttarakhand
41
increase in MPCE.
► In urban areas, the percentage of households which received remittances from its former members during
the last 365 had increased significantly with the increase in MPCE.
► Average annual household consumer expenditure was nearly Rs. 38,000 for all rural households compared
to nearly Rs. 41,000 for rural households receiving remittances.
► Average annual household consumer expenditure nearly Rs. 65,000 for all urban households compared to
nearly Rs. 80,000 for the urban households receiving remittances.
► Household consumer expenditure in both rural and urban areas was the prime use of the remittances. Nearly
95 percent of the households in the rural areas and 93 percent of the households in the urban areas had
used remittances for household consumer expenditure purpose.
Nearly 10 percent of the households in the rural areas had used remittances for ‘debt repayment’ and nearly 13
percent of the households in the urban areas had used remittances for ‘saving/investment’
Conclusion
In conclusion one may say that Uttarakhand has the advantage of high education levels, rich natural
resources embedded in the forest cover which forms about 62 percent31
of the total area. While the State
has a high growth rate of 8.8 percent32
, the advantages of economic growth is not evenly distributed.
There is a vast difference between the hilly Districts and those in the plains. There are constraints of
access due to poor road connectivity and electricity shortage despite the fact that hydroelectricity is found
in abundance in the State. The electricity generated is not sufficient to meet the increasing demand and
also affects setting up of small and medium industries in the hilly Districts. The distance between the
resources and market has not been bridged to the extent that economic growth is more evenly
distributed.
The State has given several incentives to the industrial sector by giving tax exemption for 10 years. This
has resulted in several industries coming up. However, it remains to be seen whether this momentum
would be retained once this period comes to an end. Besides the industrial boom it is largely restricted to
3 Districts (Dehradun, Hardwar and Udham Singh Nagar). This is resulting in significant migration among
its population in other Districts where secondary sector has not shown sufficient growth. The services
sector has shown maximum growth and is likely to grow at a higher level than the other two sectors.
Upcoming service sectors are – Construction, Retail and Transportation and Warehousing and Education
for which the State needs to prepare itself.
The following Sections on the report examine the skill gaps across different Districts more closely by
analyzing the existing data and perceptions of different stakeholders.
31
http://www.fsi.org.in/cover_2011/uttarakhand.pdf 32
Uttarakhand 12th five year plan & annual plan 2012-13
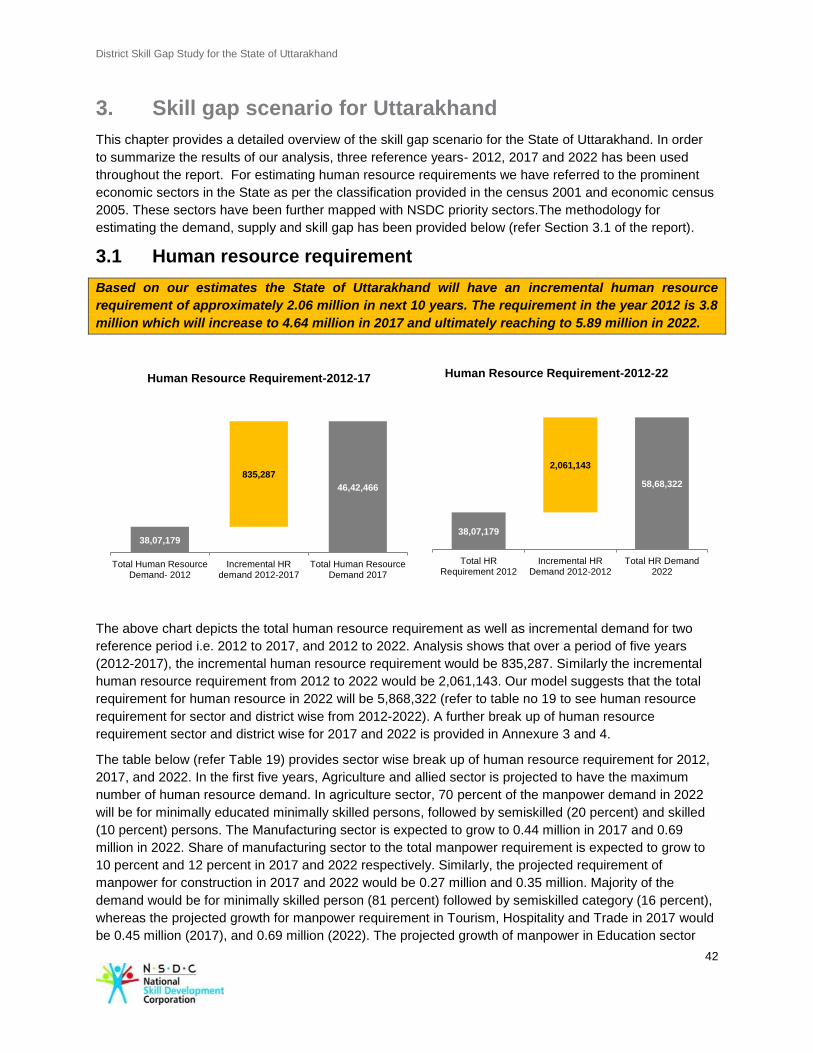
District Skill Gap Study for the State of Uttarakhand
42
38,07,179
58,68,322
2,061,143
Total HRRequirement 2012
Incremental HRDemand 2012-2012
Total HR Demand2022
Human Resource Requirement-2012-22
3. Skill gap scenario for Uttarakhand
This chapter provides a detailed overview of the skill gap scenario for the State of Uttarakhand. In order
to summarize the results of our analysis, three reference years- 2012, 2017 and 2022 has been used
throughout the report. For estimating human resource requirements we have referred to the prominent
economic sectors in the State as per the classification provided in the census 2001 and economic census
2005. These sectors have been further mapped with NSDC priority sectors.The methodology for
estimating the demand, supply and skill gap has been provided below (refer Section 3.1 of the report).
3.1 Human resource requirement
Based on our estimates the State of Uttarakhand will have an incremental human resource
requirement of approximately 2.06 million in next 10 years. The requirement in the year 2012 is 3.8
million which will increase to 4.64 million in 2017 and ultimately reaching to 5.89 million in 2022.
The above chart depicts the total human resource requirement as well as incremental demand for two
reference period i.e. 2012 to 2017, and 2012 to 2022. Analysis shows that over a period of five years
(2012-2017), the incremental human resource requirement would be 835,287. Similarly the incremental
human resource requirement from 2012 to 2022 would be 2,061,143. Our model suggests that the total
requirement for human resource in 2022 will be 5,868,322 (refer to table no 19 to see human resource
requirement for sector and district wise from 2012-2022). A further break up of human resource
requirement sector and district wise for 2017 and 2022 is provided in Annexure 3 and 4.
The table below (refer Table 19) provides sector wise break up of human resource requirement for 2012,
2017, and 2022. In the first five years, Agriculture and allied sector is projected to have the maximum
number of human resource demand. In agriculture sector, 70 percent of the manpower demand in 2022
will be for minimally educated minimally skilled persons, followed by semiskilled (20 percent) and skilled
(10 percent) persons. The Manufacturing sector is expected to grow to 0.44 million in 2017 and 0.69
million in 2022. Share of manufacturing sector to the total manpower requirement is expected to grow to
10 percent and 12 percent in 2017 and 2022 respectively. Similarly, the projected requirement of
manpower for construction in 2017 and 2022 would be 0.27 million and 0.35 million. Majority of the
demand would be for minimally skilled person (81 percent) followed by semiskilled category (16 percent),
whereas the projected growth for manpower requirement in Tourism, Hospitality and Trade in 2017 would
be 0.45 million (2017), and 0.69 million (2022). The projected growth of manpower in Education sector
38,07,179
46,42,466
835,287
Total Human ResourceDemand- 2012
Incremental HRdemand 2012-2017
Total Human ResourceDemand 2017
Human Resource Requirement-2012-17
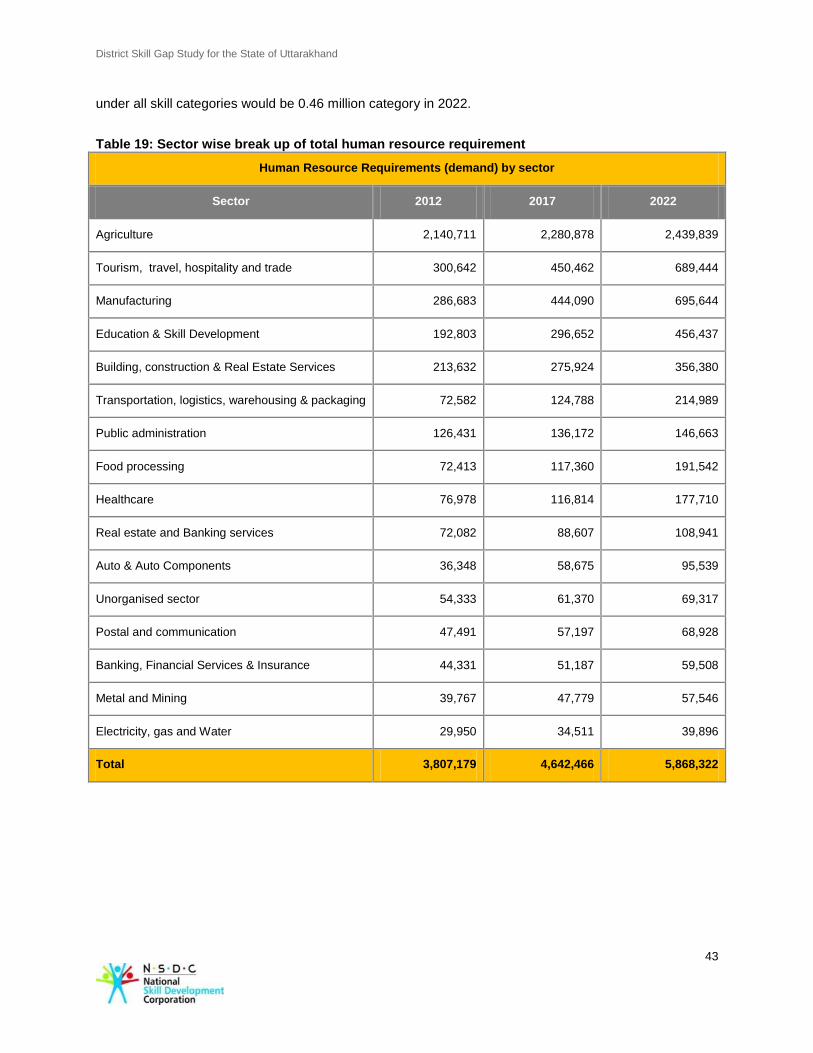
District Skill Gap Study for the State of Uttarakhand
43
under all skill categories would be 0.46 million category in 2022.
Table 19: Sector wise break up of total human resource requirement
Human Resource Requirements (demand) by sector
Sector 2012 2017 2022
Agriculture 2,140,711 2,280,878 2,439,839
Tourism, travel, hospitality and trade 300,642 450,462 689,444
Manufacturing 286,683 444,090 695,644
Education & Skill Development 192,803 296,652 456,437
Building, construction & Real Estate Services 213,632 275,924 356,380
Transportation, logistics, warehousing & packaging 72,582 124,788 214,989
Public administration 126,431 136,172 146,663
Food processing 72,413 117,360 191,542
Healthcare 76,978 116,814 177,710
Real estate and Banking services 72,082 88,607 108,941
Auto & Auto Components 36,348 58,675 95,539
Unorganised sector 54,333 61,370 69,317
Postal and communication 47,491 57,197 68,928
Banking, Financial Services & Insurance 44,331 51,187 59,508
Metal and Mining 39,767 47,779 57,546
Electricity, gas and Water 29,950 34,511 39,896
Total 3,807,179 4,642,466 5,868,322
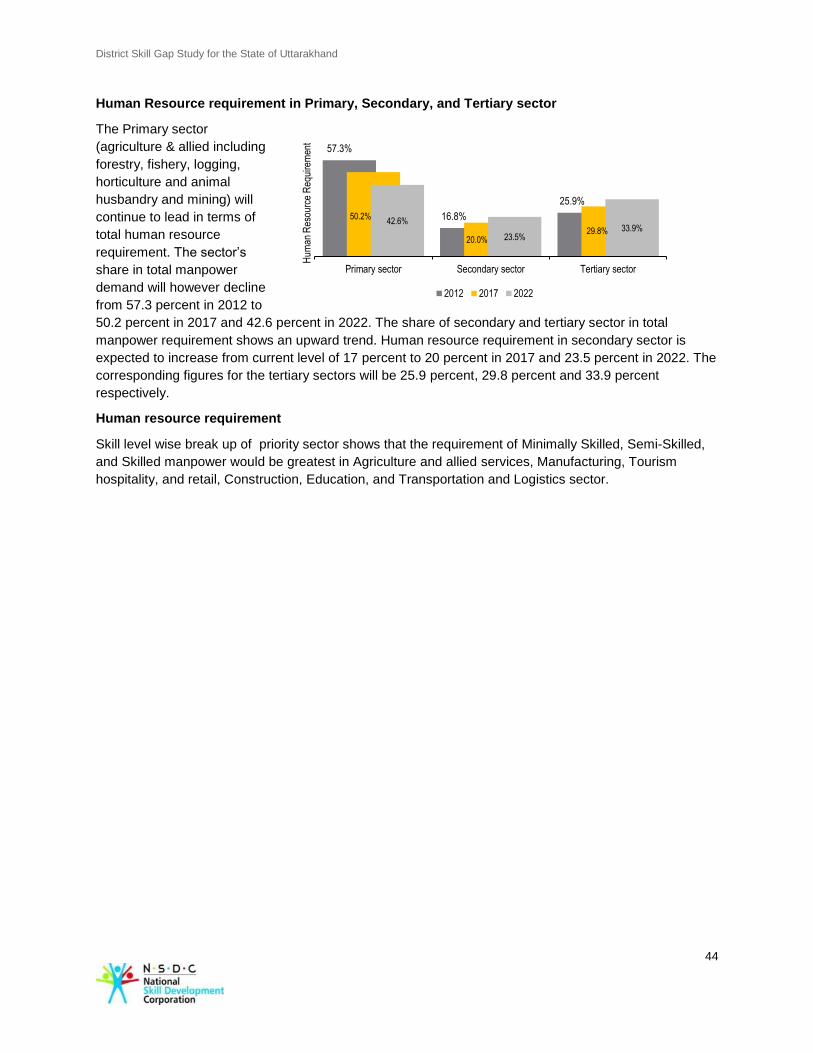
District Skill Gap Study for the State of Uttarakhand
44
Human Resource requirement in Primary, Secondary, and Tertiary sector
The Primary sector
(agriculture & allied including
forestry, fishery, logging,
horticulture and animal
husbandry and mining) will
continue to lead in terms of
total human resource
requirement. The sector’s
share in total manpower
demand will however decline
from 57.3 percent in 2012 to
50.2 percent in 2017 and 42.6 percent in 2022. The share of secondary and tertiary sector in total
manpower requirement shows an upward trend. Human resource requirement in secondary sector is
expected to increase from current level of 17 percent to 20 percent in 2017 and 23.5 percent in 2022. The
corresponding figures for the tertiary sectors will be 25.9 percent, 29.8 percent and 33.9 percent
respectively.
Human resource requirement
Skill level wise break up of priority sector shows that the requirement of Minimally Skilled, Semi-Skilled,
and Skilled manpower would be greatest in Agriculture and allied services, Manufacturing, Tourism
hospitality, and retail, Construction, Education, and Transportation and Logistics sector.
57.3%
16.8%
25.9%
50.2%
20.0% 29.8%
42.6%
23.5% 33.9%
Primary sector Secondary sector Tertiary sector
Hum
an R
esou
rce
Req
uire
men
t
2012 2017 2022
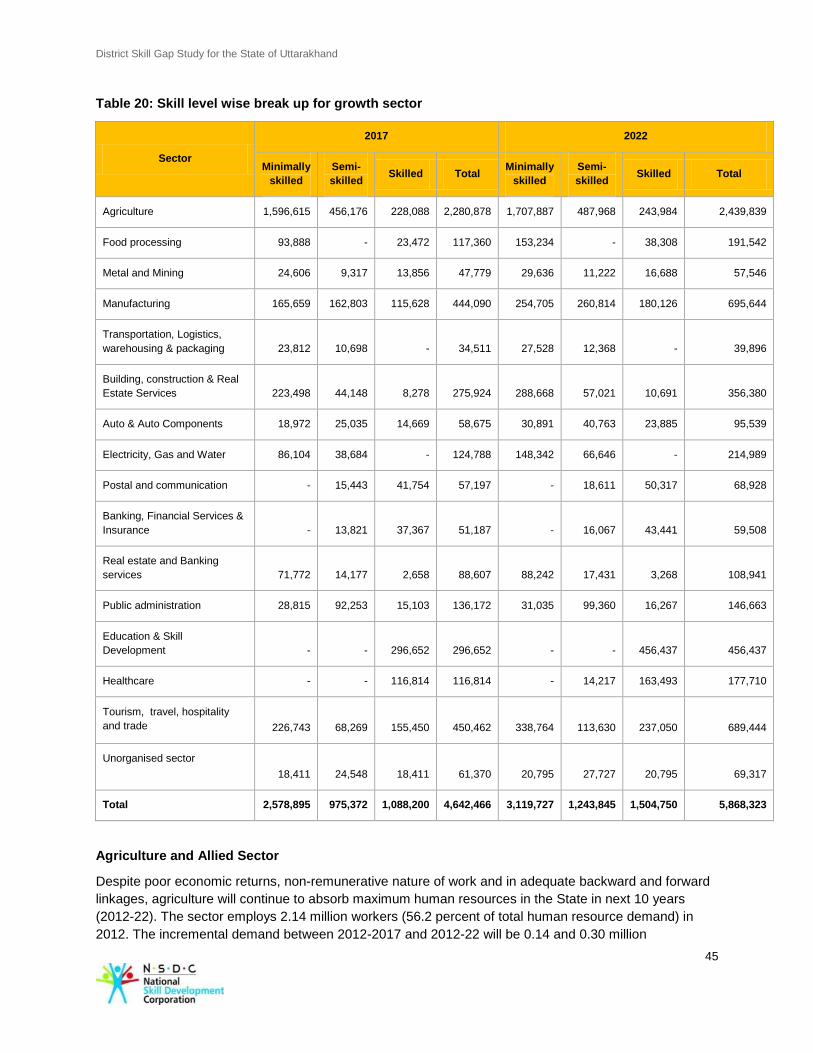
District Skill Gap Study for the State of Uttarakhand
45
Table 20: Skill level wise break up for growth sector
Sector
2017 2022
Minimally
skilled
Semi-
skilled Skilled Total
Minimally
skilled
Semi-
skilled Skilled Total
Agriculture 1,596,615 456,176 228,088 2,280,878 1,707,887 487,968 243,984 2,439,839
Food processing 93,888 - 23,472 117,360 153,234 - 38,308 191,542
Metal and Mining 24,606 9,317 13,856 47,779 29,636 11,222 16,688 57,546
Manufacturing 165,659 162,803 115,628 444,090 254,705 260,814 180,126 695,644
Transportation, Logistics,
warehousing & packaging 23,812 10,698 - 34,511 27,528 12,368 - 39,896
Building, construction & Real
Estate Services 223,498 44,148 8,278 275,924 288,668 57,021 10,691 356,380
Auto & Auto Components 18,972 25,035 14,669 58,675 30,891 40,763 23,885 95,539
Electricity, Gas and Water 86,104 38,684 - 124,788 148,342 66,646 - 214,989
Postal and communication - 15,443 41,754 57,197 - 18,611 50,317 68,928
Banking, Financial Services &
Insurance - 13,821 37,367 51,187 - 16,067 43,441 59,508
Real estate and Banking
services 71,772 14,177 2,658 88,607 88,242 17,431 3,268 108,941
Public administration 28,815 92,253 15,103 136,172 31,035 99,360 16,267 146,663
Education & Skill
Development - - 296,652 296,652 - - 456,437 456,437
Healthcare - - 116,814 116,814 - 14,217 163,493 177,710
Tourism, travel, hospitality
and trade 226,743 68,269 155,450 450,462 338,764 113,630 237,050 689,444
Unorganised sector
18,411 24,548 18,411 61,370 20,795 27,727 20,795 69,317
Total 2,578,895 975,372 1,088,200 4,642,466 3,119,727 1,243,845 1,504,750 5,868,323
Agriculture and Allied Sector
Despite poor economic returns, non-remunerative nature of work and in adequate backward and forward
linkages, agriculture will continue to absorb maximum human resources in the State in next 10 years
(2012-22). The sector employs 2.14 million workers (56.2 percent of total human resource demand) in
2012. The incremental demand between 2012-2017 and 2012-22 will be 0.14 and 0.30 million
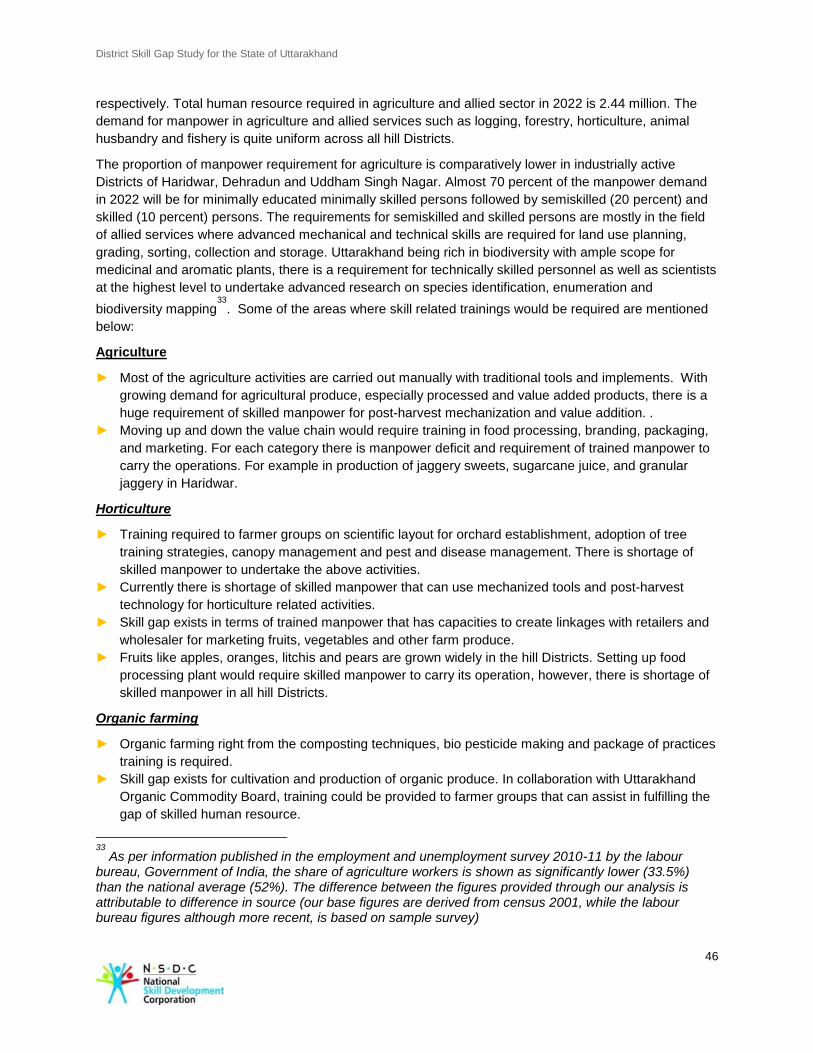
District Skill Gap Study for the State of Uttarakhand
46
respectively. Total human resource required in agriculture and allied sector in 2022 is 2.44 million. The
demand for manpower in agriculture and allied services such as logging, forestry, horticulture, animal
husbandry and fishery is quite uniform across all hill Districts.
The proportion of manpower requirement for agriculture is comparatively lower in industrially active
Districts of Haridwar, Dehradun and Uddham Singh Nagar. Almost 70 percent of the manpower demand
in 2022 will be for minimally educated minimally skilled persons followed by semiskilled (20 percent) and
skilled (10 percent) persons. The requirements for semiskilled and skilled persons are mostly in the field
of allied services where advanced mechanical and technical skills are required for land use planning,
grading, sorting, collection and storage. Uttarakhand being rich in biodiversity with ample scope for
medicinal and aromatic plants, there is a requirement for technically skilled personnel as well as scientists
at the highest level to undertake advanced research on species identification, enumeration and
biodiversity mapping33
. Some of the areas where skill related trainings would be required are mentioned
below:
Agriculture
► Most of the agriculture activities are carried out manually with traditional tools and implements. With
growing demand for agricultural produce, especially processed and value added products, there is a
huge requirement of skilled manpower for post-harvest mechanization and value addition. .
► Moving up and down the value chain would require training in food processing, branding, packaging,
and marketing. For each category there is manpower deficit and requirement of trained manpower to
carry the operations. For example in production of jaggery sweets, sugarcane juice, and granular
jaggery in Haridwar.
Horticulture
► Training required to farmer groups on scientific layout for orchard establishment, adoption of tree
training strategies, canopy management and pest and disease management. There is shortage of
skilled manpower to undertake the above activities.
► Currently there is shortage of skilled manpower that can use mechanized tools and post-harvest
technology for horticulture related activities.
► Skill gap exists in terms of trained manpower that has capacities to create linkages with retailers and
wholesaler for marketing fruits, vegetables and other farm produce.
► Fruits like apples, oranges, litchis and pears are grown widely in the hill Districts. Setting up food
processing plant would require skilled manpower to carry its operation, however, there is shortage of
skilled manpower in all hill Districts.
Organic farming
► Organic farming right from the composting techniques, bio pesticide making and package of practices
training is required.
► Skill gap exists for cultivation and production of organic produce. In collaboration with Uttarakhand
Organic Commodity Board, training could be provided to farmer groups that can assist in fulfilling the
gap of skilled human resource.
33
As per information published in the employment and unemployment survey 2010-11 by the labour bureau, Government of India, the share of agriculture workers is shown as significantly lower (33.5%) than the national average (52%). The difference between the figures provided through our analysis is attributable to difference in source (our base figures are derived from census 2001, while the labour bureau figures although more recent, is based on sample survey)
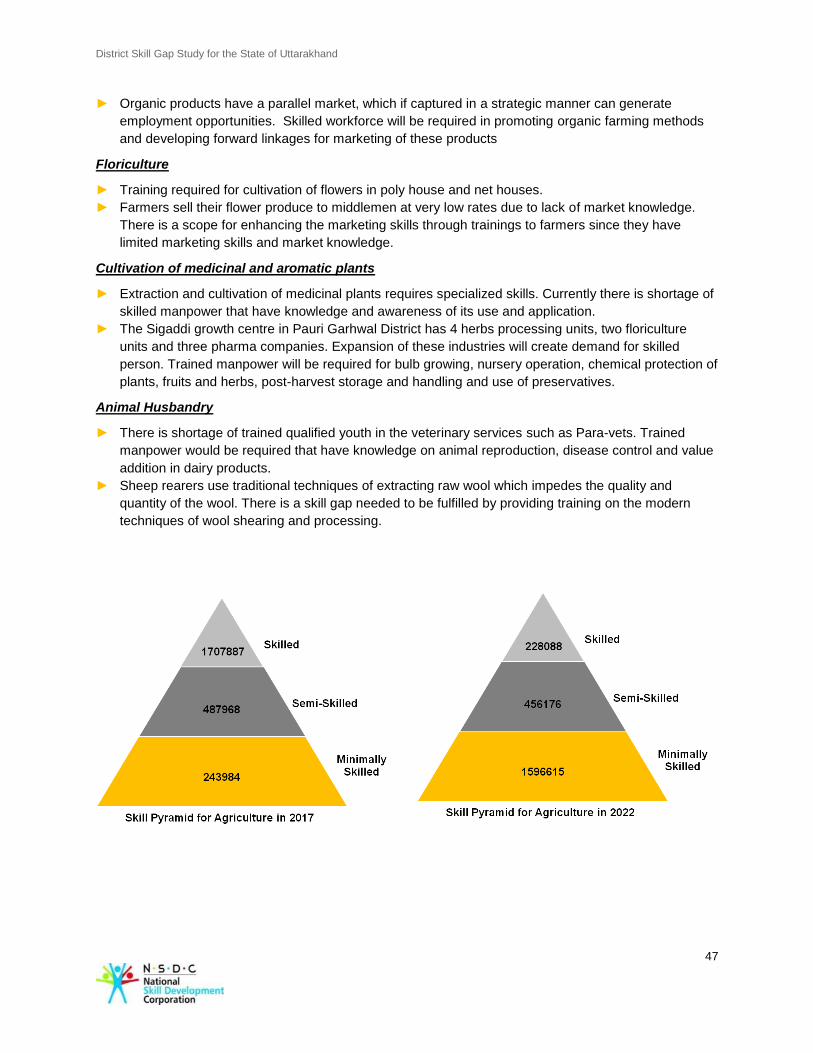
District Skill Gap Study for the State of Uttarakhand
47
► Organic products have a parallel market, which if captured in a strategic manner can generate
employment opportunities. Skilled workforce will be required in promoting organic farming methods
and developing forward linkages for marketing of these products
Floriculture
► Training required for cultivation of flowers in poly house and net houses.
► Farmers sell their flower produce to middlemen at very low rates due to lack of market knowledge.
There is a scope for enhancing the marketing skills through trainings to farmers since they have
limited marketing skills and market knowledge.
Cultivation of medicinal and aromatic plants
► Extraction and cultivation of medicinal plants requires specialized skills. Currently there is shortage of
skilled manpower that have knowledge and awareness of its use and application.
► The Sigaddi growth centre in Pauri Garhwal District has 4 herbs processing units, two floriculture
units and three pharma companies. Expansion of these industries will create demand for skilled
person. Trained manpower will be required for bulb growing, nursery operation, chemical protection of
plants, fruits and herbs, post-harvest storage and handling and use of preservatives.
Animal Husbandry
► There is shortage of trained qualified youth in the veterinary services such as Para-vets. Trained
manpower would be required that have knowledge on animal reproduction, disease control and value
addition in dairy products.
► Sheep rearers use traditional techniques of extracting raw wool which impedes the quality and
quantity of the wool. There is a skill gap needed to be fulfilled by providing training on the modern
techniques of wool shearing and processing.
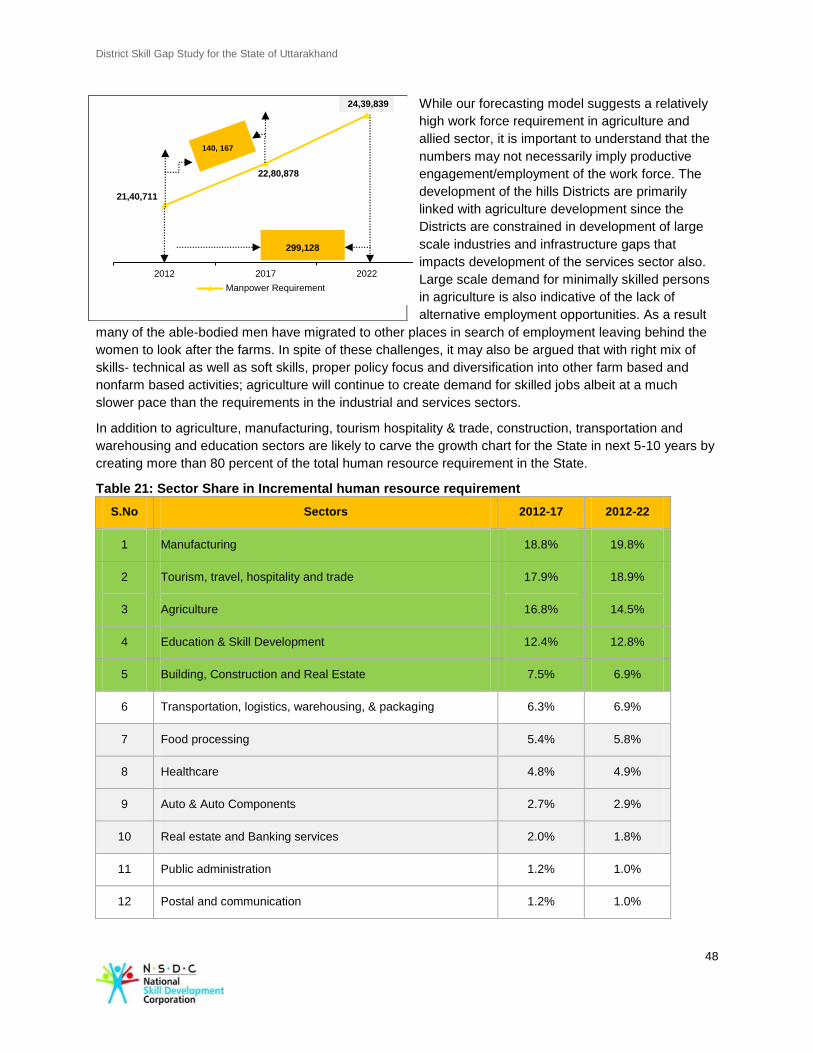
District Skill Gap Study for the State of Uttarakhand
48
While our forecasting model suggests a relatively
high work force requirement in agriculture and
allied sector, it is important to understand that the
numbers may not necessarily imply productive
engagement/employment of the work force. The
development of the hills Districts are primarily
linked with agriculture development since the
Districts are constrained in development of large
scale industries and infrastructure gaps that
impacts development of the services sector also.
Large scale demand for minimally skilled persons
in agriculture is also indicative of the lack of
alternative employment opportunities. As a result
many of the able-bodied men have migrated to other places in search of employment leaving behind the
women to look after the farms. In spite of these challenges, it may also be argued that with right mix of
skills- technical as well as soft skills, proper policy focus and diversification into other farm based and
nonfarm based activities; agriculture will continue to create demand for skilled jobs albeit at a much
slower pace than the requirements in the industrial and services sectors.
In addition to agriculture, manufacturing, tourism hospitality & trade, construction, transportation and
warehousing and education sectors are likely to carve the growth chart for the State in next 5-10 years by
creating more than 80 percent of the total human resource requirement in the State.
Table 21: Sector Share in Incremental human resource requirement
S.No Sectors 2012-17 2012-22
1 Manufacturing 18.8% 19.8%
2 Tourism, travel, hospitality and trade 17.9% 18.9%
3 Agriculture 16.8% 14.5%
4 Education & Skill Development 12.4% 12.8%
5 Building, Construction and Real Estate 7.5% 6.9%
6 Transportation, logistics, warehousing, & packaging 6.3% 6.9%
7 Food processing 5.4% 5.8%
8 Healthcare 4.8% 4.9%
9 Auto & Auto Components 2.7% 2.9%
10 Real estate and Banking services 2.0% 1.8%
11 Public administration 1.2% 1.0%
12 Postal and communication 1.2% 1.0%
21,40,711
22,80,878
24,39,839
2012 2017 2022
Manpower Requirement
140, 167
(16.8%)
299,128
(14.5%)
District Skill Gap Study for the State of Uttarakhand
49
S.No Sectors 2012-17 2012-22
13 Metal and Mining 1.0% 0.9%
14 Unorganized Sector 0.8% 0.7%
15 Banking, Financial Services and Insurance 0.8% 0.7%
16 Electricity, Gas and Water 0.5% 0.5%
Manufacturing sector
The manufacturing sector has witnessed a rapid growth in the State during the last decade due to
favorable industrial and tax policy and setting up of the SIDCUL that has been playing a pioneering role in
promoting industrial activities in the State. In comparison to other Indian States, Uttarakhand tops the
chart by registering 30 percent annual growth in manufacturing amounting to 21 percent of the State GDP
in 2009-1034
. As per our analysis manufacturing will remain a focused sector in terms of the requirement
of skilled manpower in the next ten years. This is however based on the assumption that the current tax
and other regulatory industrial packages will continue to be provided by the State Government.
As per our findings, the total human resource requirement for manufacturing sector in 2012 is
approximately 0.28 million, which is expected to grow to 0.44 million in 2017 and 0.69 million in 2022. The
share of manufacturing sector in total manpower requirement is 8 percent in 2012, gradually increasing to
10 percent and 12 percent in 2017 and 2022 respectively. The skill pyramid for manufacturing sector (for
year 2022) shows 37 percent human resource requirement at the minimally and semi-skilled level and 26
percent at the top level. During next 10 years, 0.4 million incremental manpower requirement will be
created in the State. This will include demand for 0.18 million skilled manpower, 0.26 million semi-skilled,
and 0.25 million minimally skilled manpower. Major demand for skilled categories (excluding minimally
skilled) is expected to be generated in Dehradun (11.8 percent), Haridwar (21.8 percent), and Udham
Singh Nagar (22.6 percent). Some of the areas that require skill based training are mentioned below:
Automobile and auto parts35
► There is shortage of skilled manpower in most of the industries. Skill like fitters, electricians, turners,
motor mechanic would be in demand in future. Currently, the present lots of students passing out
from ITIs and VTs have limited exposure in operating CNC functional machines.
► Skill development and upgradtion in automobile repair is required. Currently, the students lack
practical exposure and end up doing low paid job in garage and workshops.
► Industry representatives shared that there is a need to upgrade existing courses, course material,
curriculum and structure of courses, with more focus on practical experience than theoretical
knowledge.
Manufacturing industry36
34
Source: http://www.indicus.net/media/index.php/newspaper/1789-growing-pains 35
Automobile and auto component industries include those involved in production, assembling and processing, and sale of automobiles and auto components.
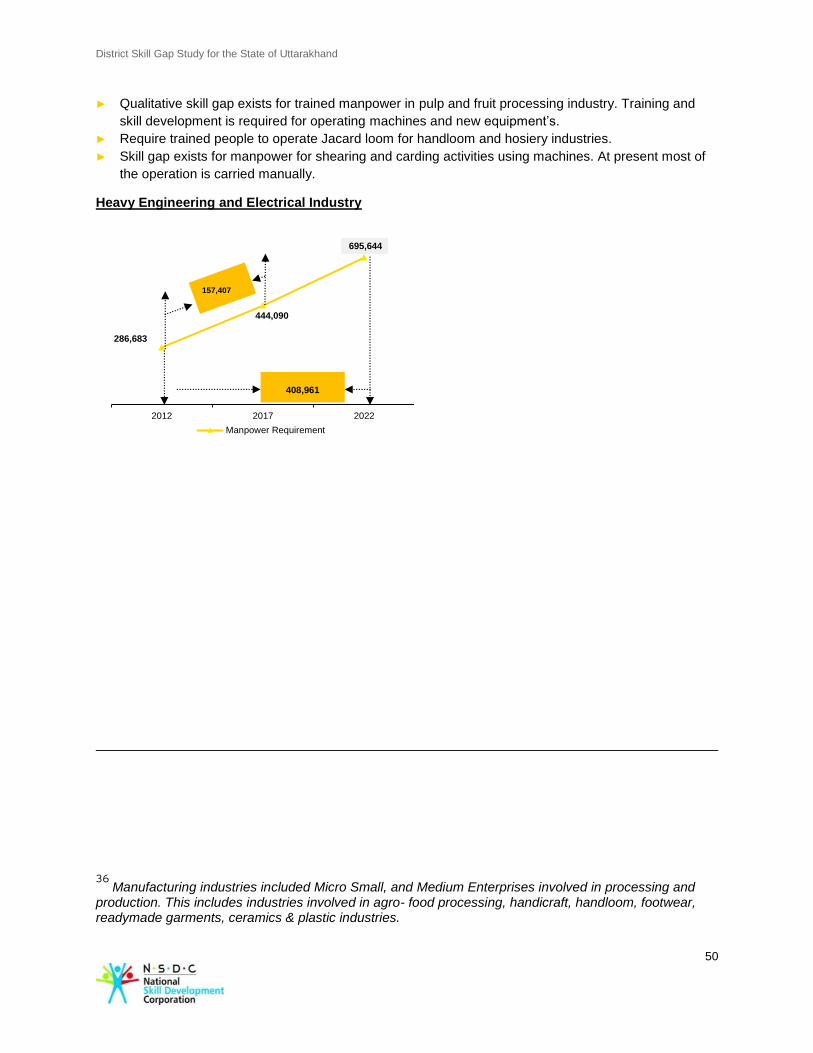
District Skill Gap Study for the State of Uttarakhand
50
► Qualitative skill gap exists for trained manpower in pulp and fruit processing industry. Training and
skill development is required for operating machines and new equipment’s.
► Require trained people to operate Jacard loom for handloom and hosiery industries.
► Skill gap exists for manpower for shearing and carding activities using machines. At present most of
the operation is carried manually.
Heavy Engineering and Electrical Industry
36
Manufacturing industries included Micro Small, and Medium Enterprises involved in processing and production. This includes industries involved in agro- food processing, handicraft, handloom, footwear, readymade garments, ceramics & plastic industries.
286,683
444,090
695,644
2012 2017 2022
Manpower Requirement
157,407
(18.8%)
(16.8%)
408,961
(19.8%)
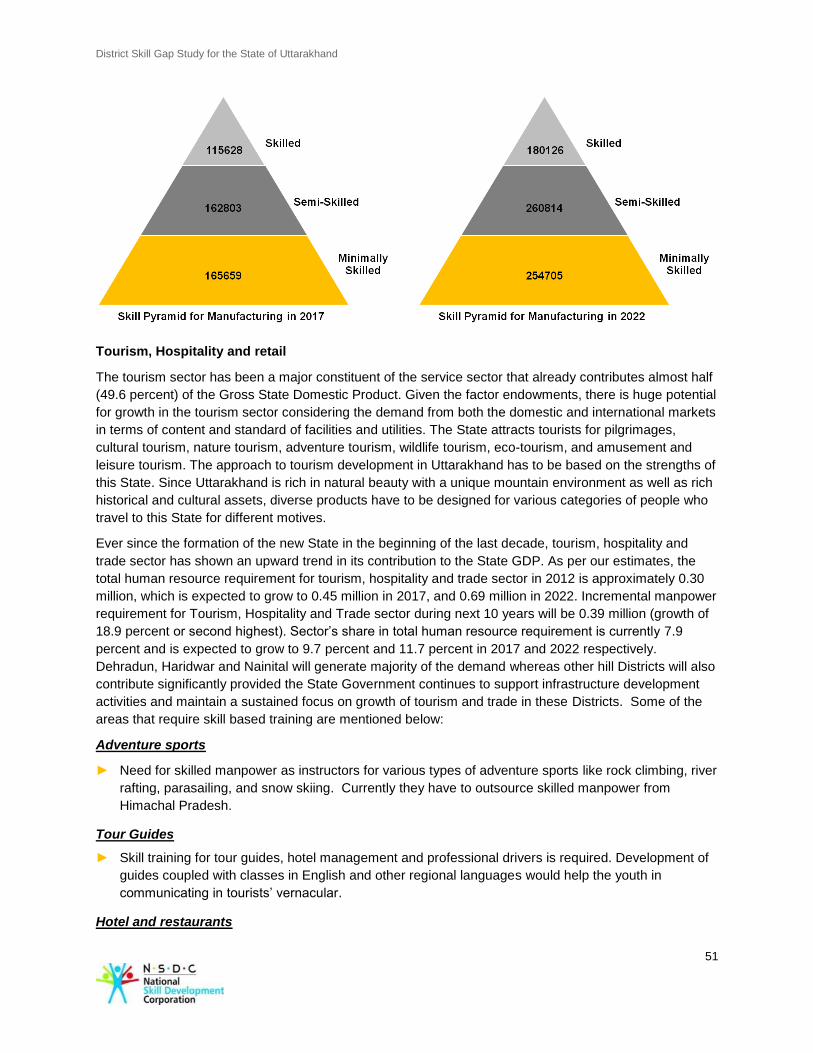
District Skill Gap Study for the State of Uttarakhand
51
Tourism, Hospitality and retail
The tourism sector has been a major constituent of the service sector that already contributes almost half
(49.6 percent) of the Gross State Domestic Product. Given the factor endowments, there is huge potential
for growth in the tourism sector considering the demand from both the domestic and international markets
in terms of content and standard of facilities and utilities. The State attracts tourists for pilgrimages,
cultural tourism, nature tourism, adventure tourism, wildlife tourism, eco-tourism, and amusement and
leisure tourism. The approach to tourism development in Uttarakhand has to be based on the strengths of
this State. Since Uttarakhand is rich in natural beauty with a unique mountain environment as well as rich
historical and cultural assets, diverse products have to be designed for various categories of people who
travel to this State for different motives.
Ever since the formation of the new State in the beginning of the last decade, tourism, hospitality and
trade sector has shown an upward trend in its contribution to the State GDP. As per our estimates, the
total human resource requirement for tourism, hospitality and trade sector in 2012 is approximately 0.30
million, which is expected to grow to 0.45 million in 2017, and 0.69 million in 2022. Incremental manpower
requirement for Tourism, Hospitality and Trade sector during next 10 years will be 0.39 million (growth of
18.9 percent or second highest). Sector’s share in total human resource requirement is currently 7.9
percent and is expected to grow to 9.7 percent and 11.7 percent in 2017 and 2022 respectively.
Dehradun, Haridwar and Nainital will generate majority of the demand whereas other hill Districts will also
contribute significantly provided the State Government continues to support infrastructure development
activities and maintain a sustained focus on growth of tourism and trade in these Districts. Some of the
areas that require skill based training are mentioned below:
Adventure sports
► Need for skilled manpower as instructors for various types of adventure sports like rock climbing, river
rafting, parasailing, and snow skiing. Currently they have to outsource skilled manpower from
Himachal Pradesh.
Tour Guides
► Skill training for tour guides, hotel management and professional drivers is required. Development of
guides coupled with classes in English and other regional languages would help the youth in
communicating in tourists’ vernacular.
Hotel and restaurants
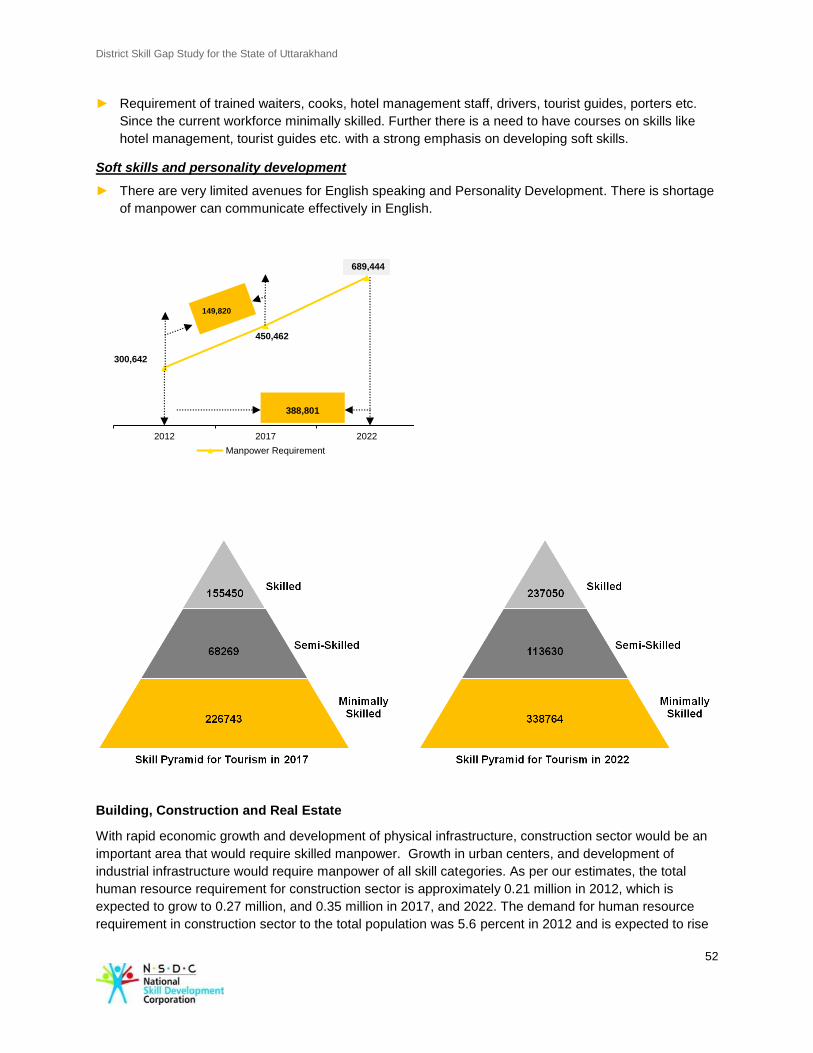
District Skill Gap Study for the State of Uttarakhand
52
► Requirement of trained waiters, cooks, hotel management staff, drivers, tourist guides, porters etc.
Since the current workforce minimally skilled. Further there is a need to have courses on skills like
hotel management, tourist guides etc. with a strong emphasis on developing soft skills.
Soft skills and personality development
► There are very limited avenues for English speaking and Personality Development. There is shortage
of manpower can communicate effectively in English.
Building, Construction and Real Estate
With rapid economic growth and development of physical infrastructure, construction sector would be an
important area that would require skilled manpower. Growth in urban centers, and development of
industrial infrastructure would require manpower of all skill categories. As per our estimates, the total
human resource requirement for construction sector is approximately 0.21 million in 2012, which is
expected to grow to 0.27 million, and 0.35 million in 2017, and 2022. The demand for human resource
requirement in construction sector to the total population was 5.6 percent in 2012 and is expected to rise
300,642
450,462
689,444
2012 2017 2022
Manpower Requirement
149,820
(17.9%)
(16.8%)
388,801
(18.9%)
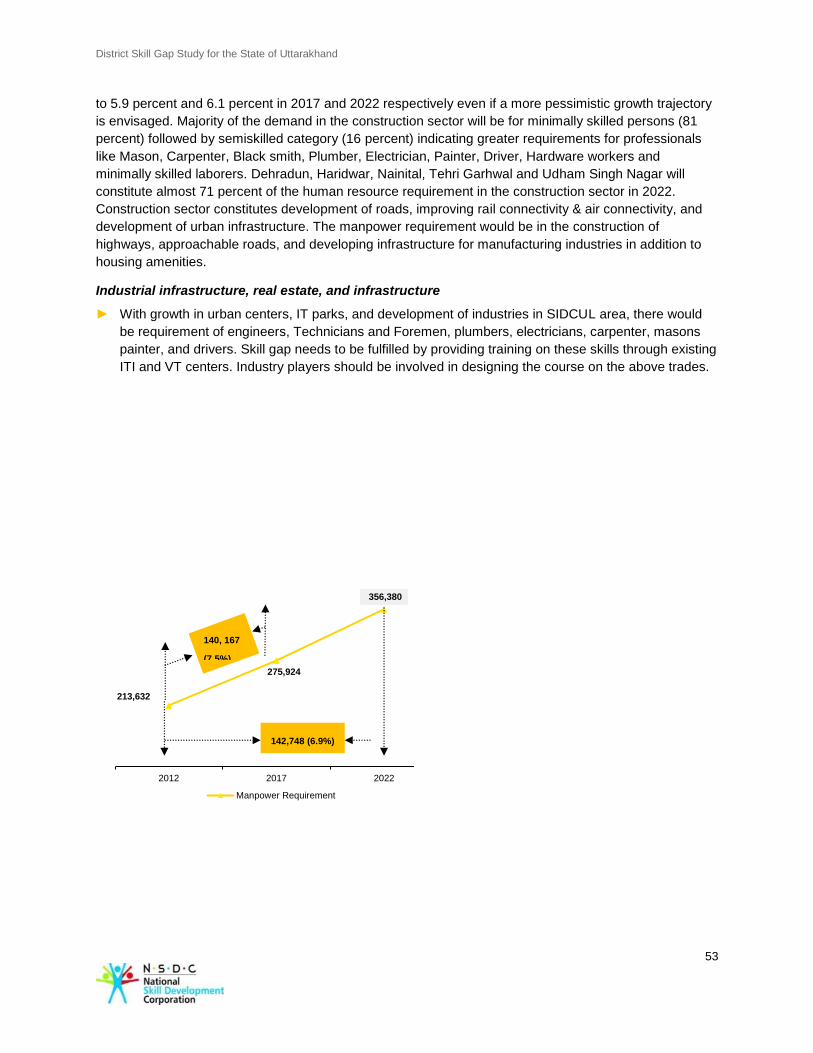
District Skill Gap Study for the State of Uttarakhand
53
to 5.9 percent and 6.1 percent in 2017 and 2022 respectively even if a more pessimistic growth trajectory
is envisaged. Majority of the demand in the construction sector will be for minimally skilled persons (81
percent) followed by semiskilled category (16 percent) indicating greater requirements for professionals
like Mason, Carpenter, Black smith, Plumber, Electrician, Painter, Driver, Hardware workers and
minimally skilled laborers. Dehradun, Haridwar, Nainital, Tehri Garhwal and Udham Singh Nagar will
constitute almost 71 percent of the human resource requirement in the construction sector in 2022.
Construction sector constitutes development of roads, improving rail connectivity & air connectivity, and
development of urban infrastructure. The manpower requirement would be in the construction of
highways, approachable roads, and developing infrastructure for manufacturing industries in addition to
housing amenities.
Industrial infrastructure, real estate, and infrastructure
► With growth in urban centers, IT parks, and development of industries in SIDCUL area, there would
be requirement of engineers, Technicians and Foremen, plumbers, electricians, carpenter, masons
painter, and drivers. Skill gap needs to be fulfilled by providing training on these skills through existing
ITI and VT centers. Industry players should be involved in designing the course on the above trades.
213,632
275,924
356,380
2012 2017 2022
Manpower Requirement
140, 167
(7.5%)
142,748 (6.9%)
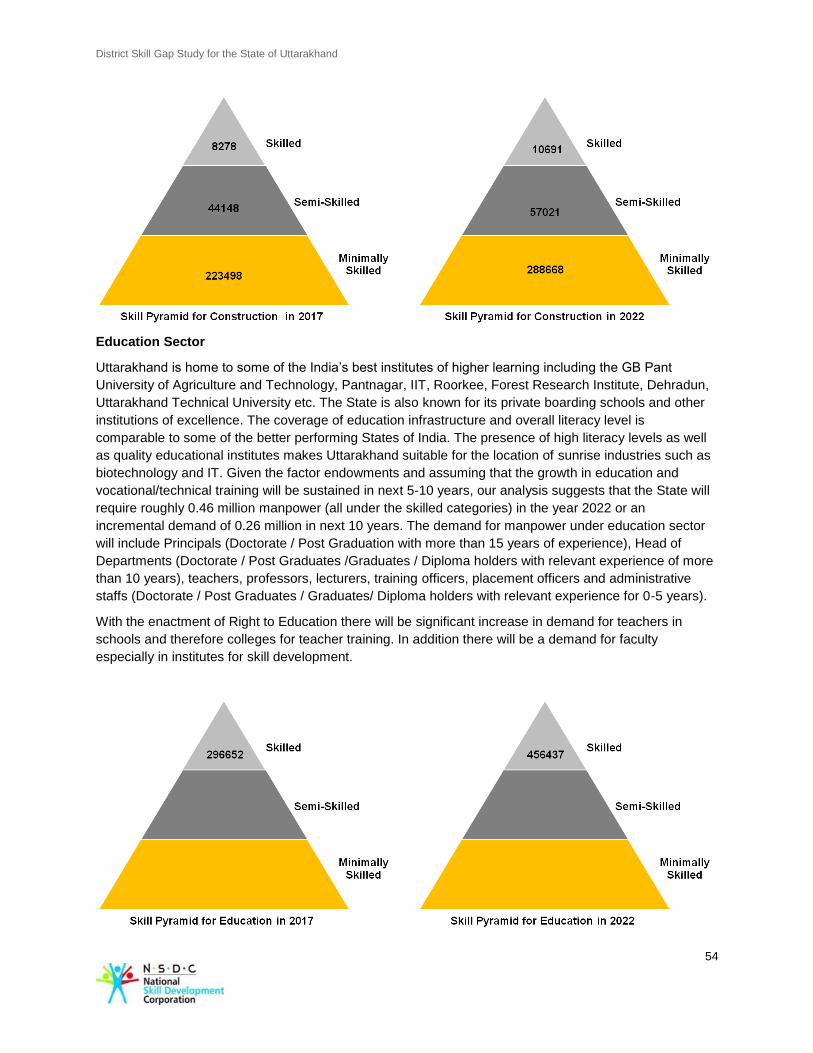
District Skill Gap Study for the State of Uttarakhand
54
Education Sector
Uttarakhand is home to some of the India’s best institutes of higher learning including the GB Pant
University of Agriculture and Technology, Pantnagar, IIT, Roorkee, Forest Research Institute, Dehradun,
Uttarakhand Technical University etc. The State is also known for its private boarding schools and other
institutions of excellence. The coverage of education infrastructure and overall literacy level is
comparable to some of the better performing States of India. The presence of high literacy levels as well
as quality educational institutes makes Uttarakhand suitable for the location of sunrise industries such as
biotechnology and IT. Given the factor endowments and assuming that the growth in education and
vocational/technical training will be sustained in next 5-10 years, our analysis suggests that the State will
require roughly 0.46 million manpower (all under the skilled categories) in the year 2022 or an
incremental demand of 0.26 million in next 10 years. The demand for manpower under education sector
will include Principals (Doctorate / Post Graduation with more than 15 years of experience), Head of
Departments (Doctorate / Post Graduates /Graduates / Diploma holders with relevant experience of more
than 10 years), teachers, professors, lecturers, training officers, placement officers and administrative
staffs (Doctorate / Post Graduates / Graduates/ Diploma holders with relevant experience for 0-5 years).
With the enactment of Right to Education there will be significant increase in demand for teachers in
schools and therefore colleges for teacher training. In addition there will be a demand for faculty
especially in institutes for skill development.
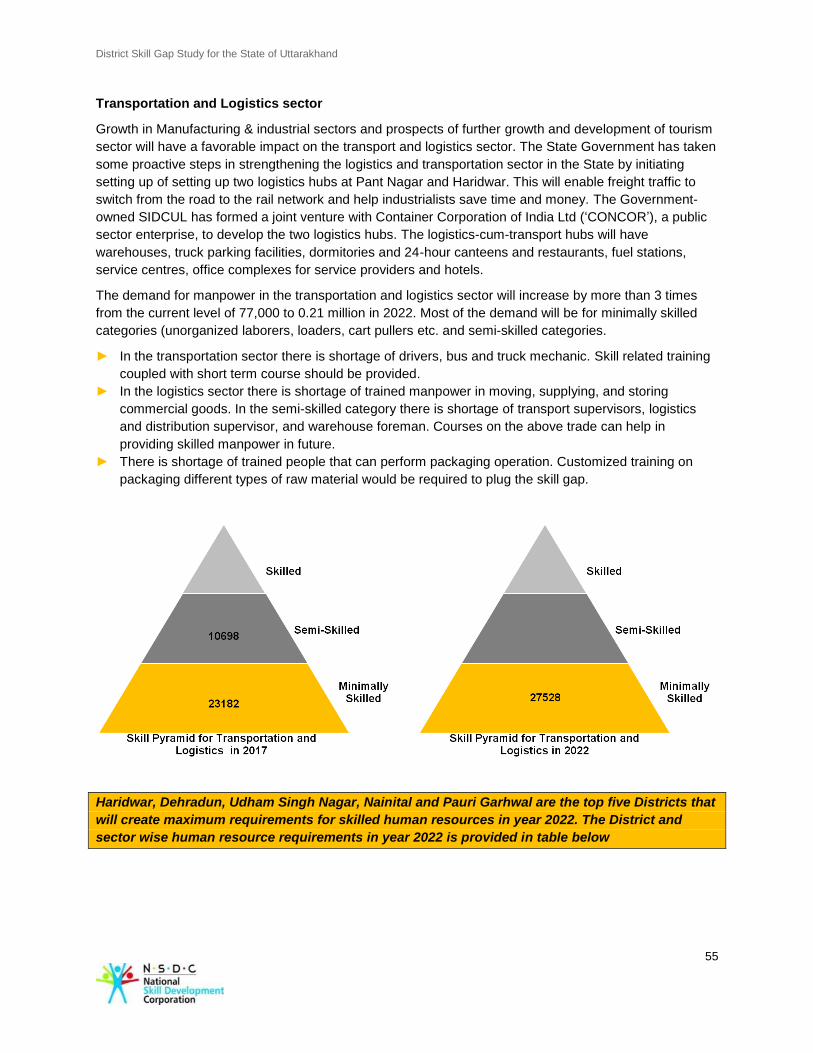
District Skill Gap Study for the State of Uttarakhand
55
Transportation and Logistics sector
Growth in Manufacturing & industrial sectors and prospects of further growth and development of tourism
sector will have a favorable impact on the transport and logistics sector. The State Government has taken
some proactive steps in strengthening the logistics and transportation sector in the State by initiating
setting up of setting up two logistics hubs at Pant Nagar and Haridwar. This will enable freight traffic to
switch from the road to the rail network and help industrialists save time and money. The Government-
owned SIDCUL has formed a joint venture with Container Corporation of India Ltd (‘CONCOR’), a public
sector enterprise, to develop the two logistics hubs. The logistics-cum-transport hubs will have
warehouses, truck parking facilities, dormitories and 24-hour canteens and restaurants, fuel stations,
service centres, office complexes for service providers and hotels.
The demand for manpower in the transportation and logistics sector will increase by more than 3 times
from the current level of 77,000 to 0.21 million in 2022. Most of the demand will be for minimally skilled
categories (unorganized laborers, loaders, cart pullers etc. and semi-skilled categories.
► In the transportation sector there is shortage of drivers, bus and truck mechanic. Skill related training
coupled with short term course should be provided.
► In the logistics sector there is shortage of trained manpower in moving, supplying, and storing
commercial goods. In the semi-skilled category there is shortage of transport supervisors, logistics
and distribution supervisor, and warehouse foreman. Courses on the above trade can help in
providing skilled manpower in future.
► There is shortage of trained people that can perform packaging operation. Customized training on
packaging different types of raw material would be required to plug the skill gap.
Haridwar, Dehradun, Udham Singh Nagar, Nainital and Pauri Garhwal are the top five Districts that
will create maximum requirements for skilled human resources in year 2022. The District and
sector wise human resource requirements in year 2022 is provided in table below
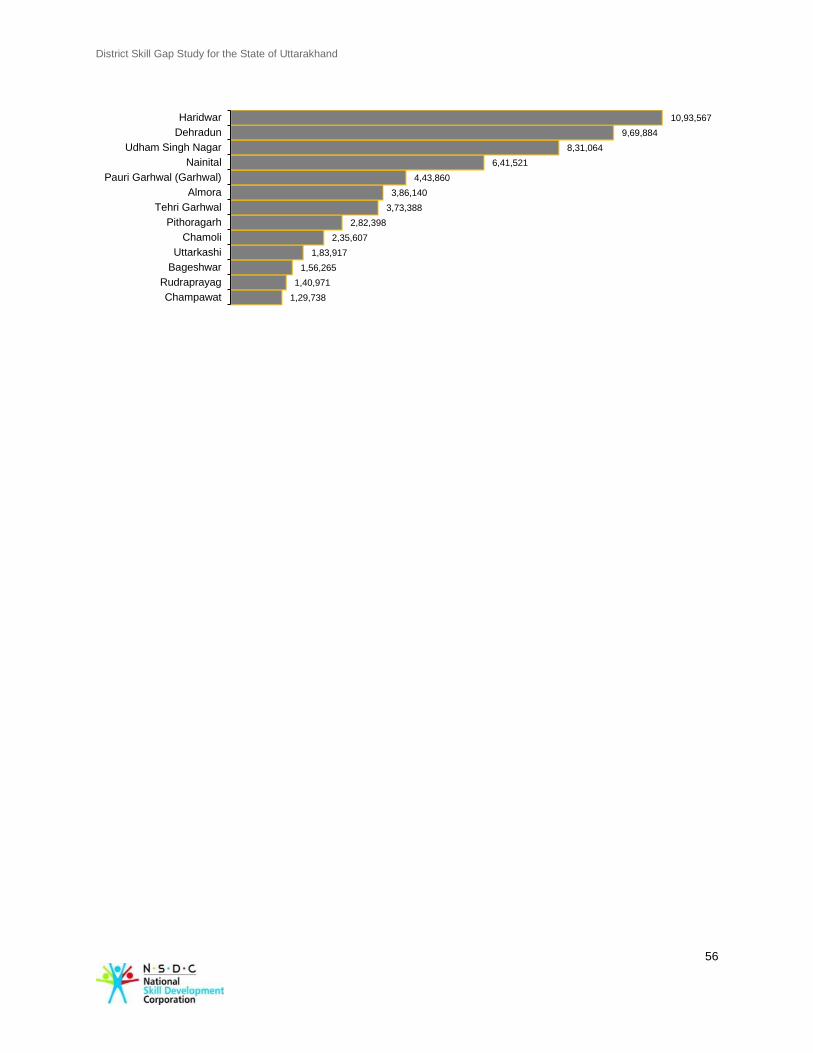
District Skill Gap Study for the State of Uttarakhand
56
1,29,738
1,40,971
1,56,265
1,83,917
2,35,607
2,82,398
3,73,388
3,86,140
4,43,860
6,41,521
8,31,064
9,69,884
10,93,567
Champawat
Rudraprayag
Bageshwar
Uttarkashi
Chamoli
Pithoragarh
Tehri Garhwal
Almora
Pauri Garhwal (Garhwal)
Nainital
Udham Singh Nagar
Dehradun
Haridwar
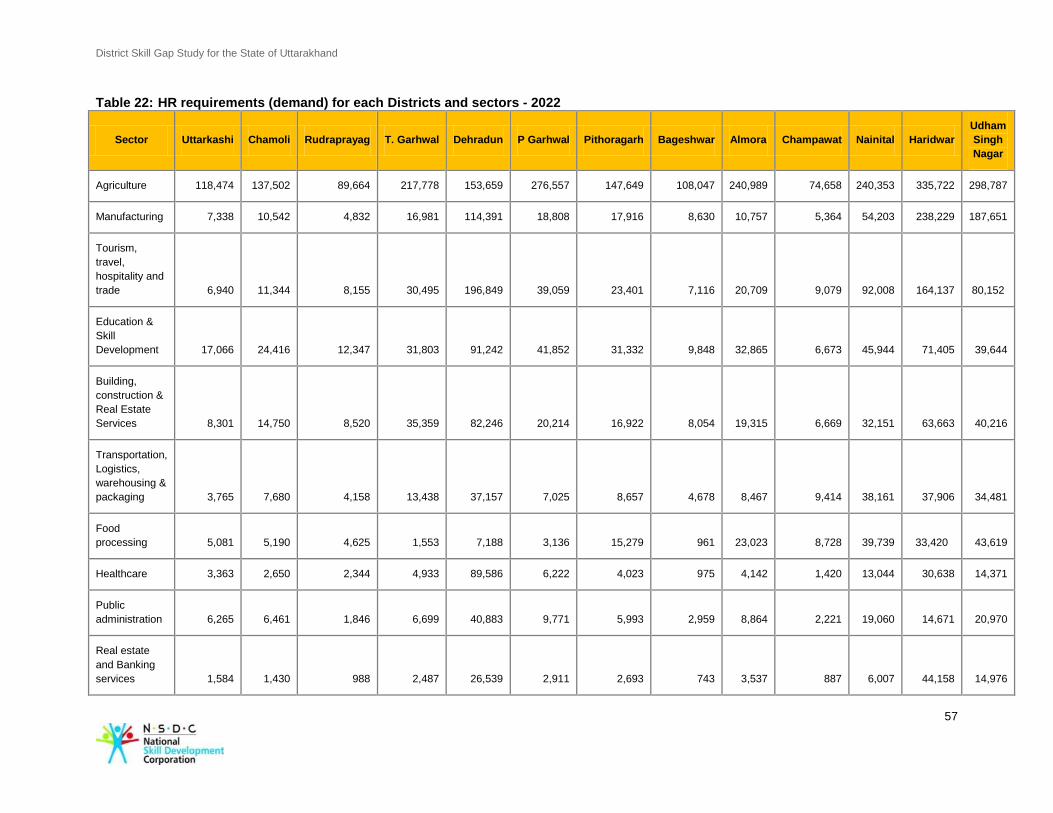
District Skill Gap Study for the State of Uttarakhand
57
Table 22: HR requirements (demand) for each Districts and sectors - 2022
Sector Uttarkashi Chamoli Rudraprayag T. Garhwal Dehradun P Garhwal Pithoragarh Bageshwar Almora Champawat Nainital Haridwar
Udham
Singh
Nagar
Agriculture 118,474 137,502 89,664 217,778 153,659 276,557 147,649 108,047 240,989 74,658 240,353 335,722 298,787
Manufacturing 7,338 10,542 4,832 16,981 114,391 18,808 17,916 8,630 10,757 5,364 54,203 238,229 187,651
Tourism,
travel,
hospitality and
trade 6,940 11,344 8,155 30,495 196,849 39,059 23,401 7,116 20,709 9,079 92,008 164,137 80,152
Education &
Skill
Development 17,066 24,416 12,347 31,803 91,242 41,852 31,332 9,848 32,865 6,673 45,944 71,405 39,644
Building,
construction &
Real Estate
Services 8,301 14,750 8,520 35,359 82,246 20,214 16,922 8,054 19,315 6,669 32,151 63,663 40,216
Transportation,
Logistics,
warehousing &
packaging 3,765 7,680 4,158 13,438 37,157 7,025 8,657 4,678 8,467 9,414 38,161 37,906 34,481
Food
processing 5,081 5,190 4,625 1,553 7,188 3,136 15,279 961 23,023 8,728 39,739 33,420 43,619
Healthcare 3,363 2,650 2,344 4,933 89,586 6,222 4,023 975 4,142 1,420 13,044 30,638 14,371
Public
administration 6,265 6,461 1,846 6,699 40,883 9,771 5,993 2,959 8,864 2,221 19,060 14,671 20,970
Real estate
and Banking
services 1,584 1,430 988 2,487 26,539 2,911 2,693 743 3,537 887 6,007 44,158 14,976
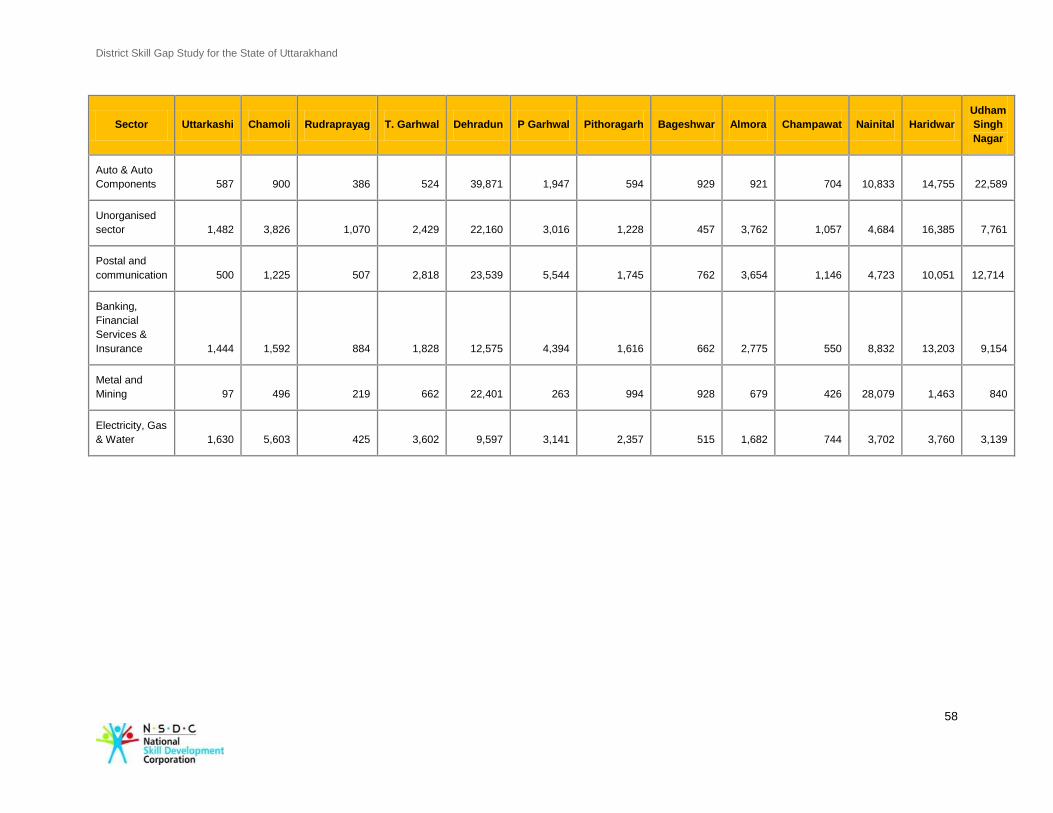
District Skill Gap Study for the State of Uttarakhand
58
Sector Uttarkashi Chamoli Rudraprayag T. Garhwal Dehradun P Garhwal Pithoragarh Bageshwar Almora Champawat Nainital Haridwar
Udham
Singh
Nagar
Auto & Auto
Components 587 900 386 524 39,871 1,947 594 929 921 704 10,833 14,755 22,589
Unorganised
sector 1,482 3,826 1,070 2,429 22,160 3,016 1,228 457 3,762 1,057 4,684 16,385 7,761
Postal and
communication 500 1,225 507 2,818 23,539 5,544 1,745 762 3,654 1,146 4,723 10,051 12,714
Banking,
Financial
Services &
Insurance 1,444 1,592 884 1,828 12,575 4,394 1,616 662 2,775 550 8,832 13,203 9,154
Metal and
Mining 97 496 219 662 22,401 263 994 928 679 426 28,079 1,463 840
Electricity, Gas
& Water 1,630 5,603 425 3,602 9,597 3,141 2,357 515 1,682 744 3,702 3,760 3,139
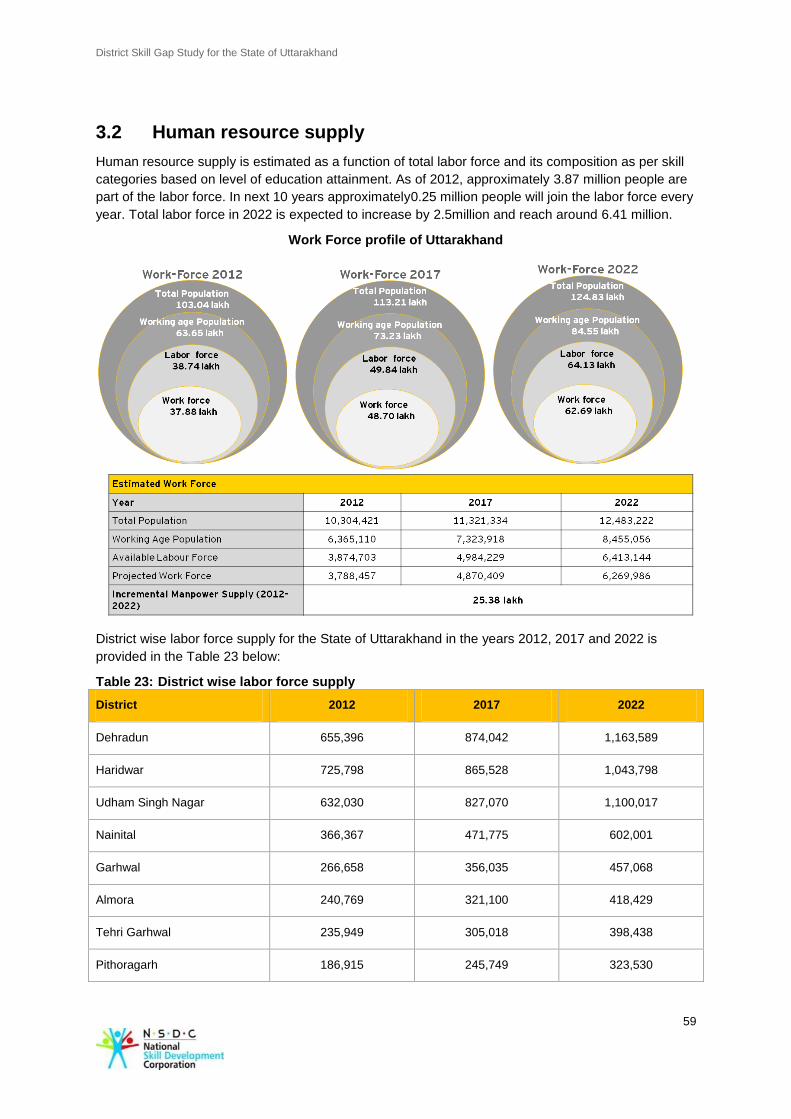
District Skill Gap Study for the State of Uttarakhand
59
3.2 Human resource supply
Human resource supply is estimated as a function of total labor force and its composition as per skill
categories based on level of education attainment. As of 2012, approximately 3.87 million people are
part of the labor force. In next 10 years approximately0.25 million people will join the labor force every
year. Total labor force in 2022 is expected to increase by 2.5million and reach around 6.41 million.
Work Force profile of Uttarakhand
District wise labor force supply for the State of Uttarakhand in the years 2012, 2017 and 2022 is
provided in the Table 23 below:
Table 23: District wise labor force supply
District 2012 2017 2022
Dehradun 655,396 874,042 1,163,589
Haridwar 725,798 865,528 1,043,798
Udham Singh Nagar 632,030 827,070 1,100,017
Nainital 366,367 471,775 602,001
Garhwal 266,658 356,035 457,068
Almora 240,769 321,100 418,429
Tehri Garhwal 235,949 305,018 398,438
Pithoragarh 186,915 245,749 323,530
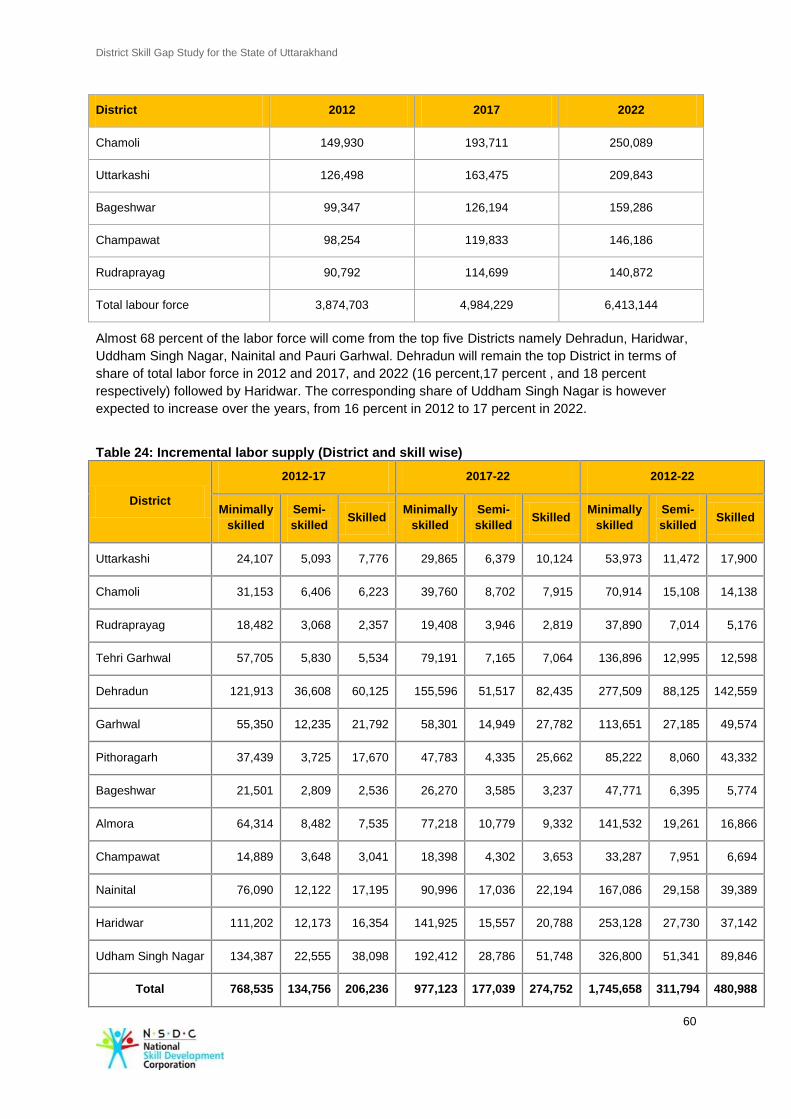
District Skill Gap Study for the State of Uttarakhand
60
District 2012 2017 2022
Chamoli 149,930 193,711 250,089
Uttarkashi 126,498 163,475 209,843
Bageshwar 99,347 126,194 159,286
Champawat 98,254 119,833 146,186
Rudraprayag 90,792 114,699 140,872
Total labour force 3,874,703 4,984,229 6,413,144
Almost 68 percent of the labor force will come from the top five Districts namely Dehradun, Haridwar,
Uddham Singh Nagar, Nainital and Pauri Garhwal. Dehradun will remain the top District in terms of
share of total labor force in 2012 and 2017, and 2022 (16 percent,17 percent , and 18 percent
respectively) followed by Haridwar. The corresponding share of Uddham Singh Nagar is however
expected to increase over the years, from 16 percent in 2012 to 17 percent in 2022.
Table 24: Incremental labor supply (District and skill wise)
District
2012-17 2017-22 2012-22
Minimally
skilled
Semi-
skilled Skilled
Minimally
skilled
Semi-
skilled Skilled
Minimally
skilled
Semi-
skilled Skilled
Uttarkashi 24,107 5,093 7,776 29,865 6,379 10,124 53,973 11,472 17,900
Chamoli 31,153 6,406 6,223 39,760 8,702 7,915 70,914 15,108 14,138
Rudraprayag 18,482 3,068 2,357 19,408 3,946 2,819 37,890 7,014 5,176
Tehri Garhwal 57,705 5,830 5,534 79,191 7,165 7,064 136,896 12,995 12,598
Dehradun 121,913 36,608 60,125 155,596 51,517 82,435 277,509 88,125 142,559
Garhwal 55,350 12,235 21,792 58,301 14,949 27,782 113,651 27,185 49,574
Pithoragarh 37,439 3,725 17,670 47,783 4,335 25,662 85,222 8,060 43,332
Bageshwar 21,501 2,809 2,536 26,270 3,585 3,237 47,771 6,395 5,774
Almora 64,314 8,482 7,535 77,218 10,779 9,332 141,532 19,261 16,866
Champawat 14,889 3,648 3,041 18,398 4,302 3,653 33,287 7,951 6,694
Nainital 76,090 12,122 17,195 90,996 17,036 22,194 167,086 29,158 39,389
Haridwar 111,202 12,173 16,354 141,925 15,557 20,788 253,128 27,730 37,142
Udham Singh Nagar 134,387 22,555 38,098 192,412 28,786 51,748 326,800 51,341 89,846
Total 768,535 134,756 206,236 977,123 177,039 274,752 1,745,658 311,794 480,988
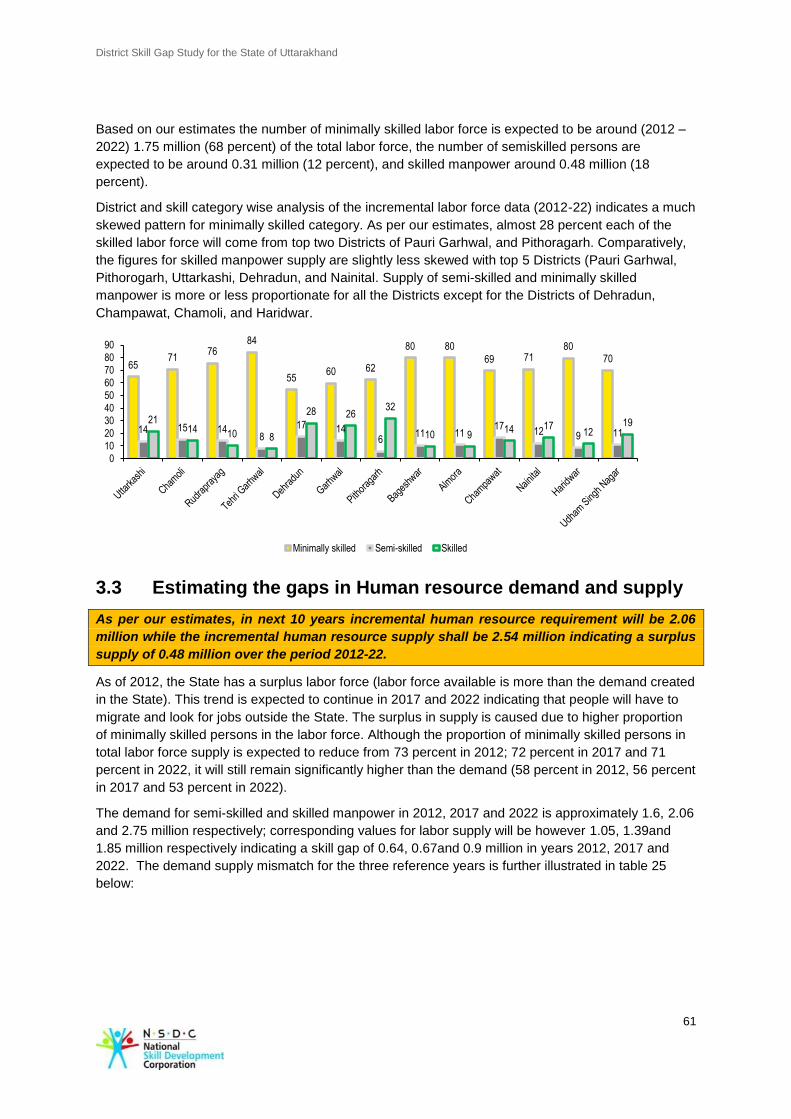
District Skill Gap Study for the State of Uttarakhand
61
Based on our estimates the number of minimally skilled labor force is expected to be around (2012 –
2022) 1.75 million (68 percent) of the total labor force, the number of semiskilled persons are
expected to be around 0.31 million (12 percent), and skilled manpower around 0.48 million (18
percent).
District and skill category wise analysis of the incremental labor force data (2012-22) indicates a much
skewed pattern for minimally skilled category. As per our estimates, almost 28 percent each of the
skilled labor force will come from top two Districts of Pauri Garhwal, and Pithoragarh. Comparatively,
the figures for skilled manpower supply are slightly less skewed with top 5 Districts (Pauri Garhwal,
Pithorogarh, Uttarkashi, Dehradun, and Nainital. Supply of semi-skilled and minimally skilled
manpower is more or less proportionate for all the Districts except for the Districts of Dehradun,
Champawat, Chamoli, and Haridwar.
3.3 Estimating the gaps in Human resource demand and supply
As per our estimates, in next 10 years incremental human resource requirement will be 2.06
million while the incremental human resource supply shall be 2.54 million indicating a surplus
supply of 0.48 million over the period 2012-22.
As of 2012, the State has a surplus labor force (labor force available is more than the demand created
in the State). This trend is expected to continue in 2017 and 2022 indicating that people will have to
migrate and look for jobs outside the State. The surplus in supply is caused due to higher proportion
of minimally skilled persons in the labor force. Although the proportion of minimally skilled persons in
total labor force supply is expected to reduce from 73 percent in 2012; 72 percent in 2017 and 71
percent in 2022, it will still remain significantly higher than the demand (58 percent in 2012, 56 percent
in 2017 and 53 percent in 2022).
The demand for semi-skilled and skilled manpower in 2012, 2017 and 2022 is approximately 1.6, 2.06
and 2.75 million respectively; corresponding values for labor supply will be however 1.05, 1.39and
1.85 million respectively indicating a skill gap of 0.64, 0.67and 0.9 million in years 2012, 2017 and
2022. The demand supply mismatch for the three reference years is further illustrated in table 25
below:
65 71
76 84
55 60 62
80 80
69 71 80
70
14 15 14 8
17 14 6
11 11 17
12 9 11
21 14 10 8
28 26 32
10 9 14 17
12 19
0
10
20
30
40
50
60
70
80
90
Minimally skilled Semi-skilled Skilled
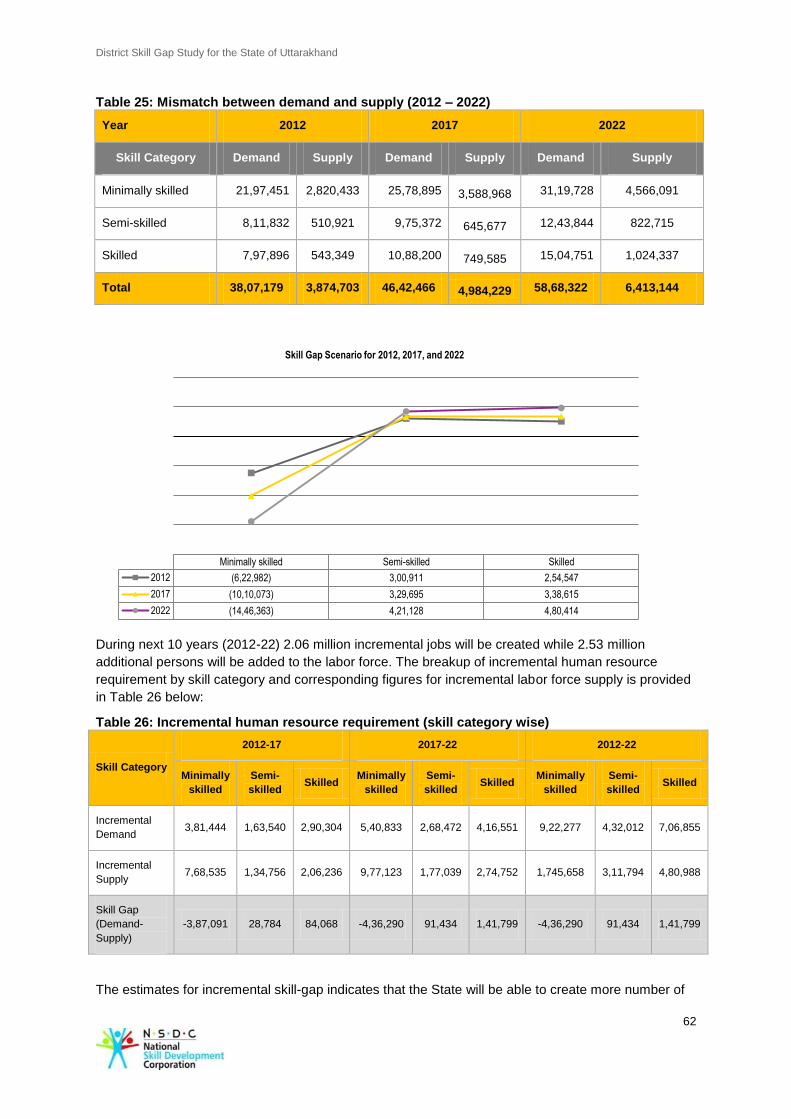
District Skill Gap Study for the State of Uttarakhand
62
Table 25: Mismatch between demand and supply (2012 – 2022)
Year 2012 2017 2022
Skill Category Demand Supply Demand Supply Demand Supply
Minimally skilled 21,97,451 2,820,433 25,78,895 3,588,968 31,19,728 4,566,091
Semi-skilled 8,11,832 510,921 9,75,372 645,677 12,43,844 822,715
Skilled 7,97,896 543,349 10,88,200 749,585 15,04,751 1,024,337
Total 38,07,179 3,874,703 46,42,466 4,984,229 58,68,322 6,413,144
During next 10 years (2012-22) 2.06 million incremental jobs will be created while 2.53 million
additional persons will be added to the labor force. The breakup of incremental human resource
requirement by skill category and corresponding figures for incremental labor force supply is provided
in Table 26 below:
Table 26: Incremental human resource requirement (skill category wise)
Skill Category
2012-17 2017-22 2012-22
Minimally
skilled
Semi-
skilled Skilled
Minimally
skilled
Semi-
skilled Skilled
Minimally
skilled
Semi-
skilled Skilled
Incremental
Demand 3,81,444 1,63,540 2,90,304 5,40,833 2,68,472 4,16,551 9,22,277 4,32,012 7,06,855
Incremental
Supply 7,68,535 1,34,756 2,06,236 9,77,123 1,77,039 2,74,752 1,745,658 3,11,794 4,80,988
Skill Gap
(Demand-
Supply)
-3,87,091 28,784 84,068 -4,36,290 91,434 1,41,799 -4,36,290 91,434 1,41,799
The estimates for incremental skill-gap indicates that the State will be able to create more number of
Minimally skilled Semi-skilled Skilled
2012 (6,22,982) 3,00,911 2,54,547
2017 (10,10,073) 3,29,695 3,38,615
2022 (14,46,363) 4,21,128 4,80,414
Skill Gap Scenario for 2012, 2017, and 2022
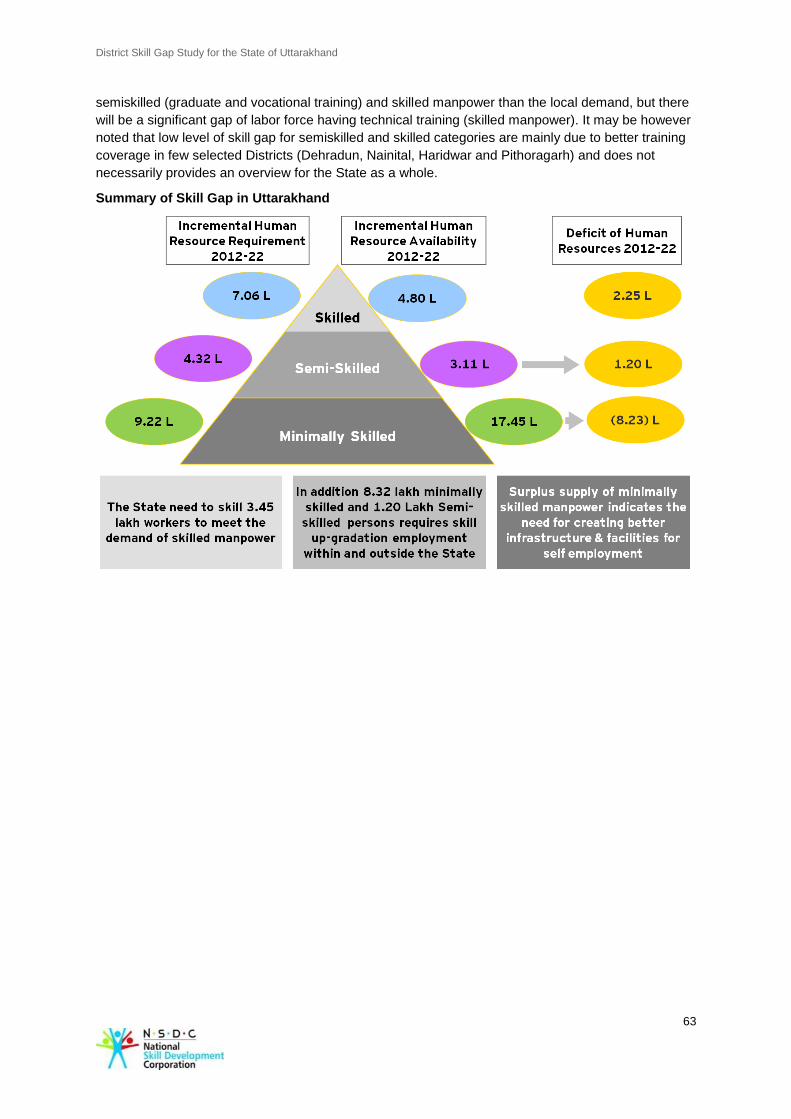
District Skill Gap Study for the State of Uttarakhand
63
semiskilled (graduate and vocational training) and skilled manpower than the local demand, but there
will be a significant gap of labor force having technical training (skilled manpower). It may be however
noted that low level of skill gap for semiskilled and skilled categories are mainly due to better training
coverage in few selected Districts (Dehradun, Nainital, Haridwar and Pithoragarh) and does not
necessarily provides an overview for the State as a whole.
Summary of Skill Gap in Uttarakhand
District Skill Gap Study for the State of Uttarakhand
64
4. Stakeholders perspective : Available opportunities
and issues to be addressed
During the course of this study extensive interactions were held with different stakeholders in all the
Districts. Their perceptions based on their experience and observations are important to note. This
section of the report collates their views. The responses received have been analysed for the three
sectors i.e. primary, secondary and tertiary. A District wise analysis has also been done to get
desegregated view of available opportunities in each District.
Primary Sector
Most of the land in the State is covered with forest; there is scope of diversifying agriculture pattern,
which can create employment in horticulture, floriculture, organic produce, and animal husbandry.
Based on the discussion with District level officials, it was found that there is shortage of skilled
manpower and inadequate infrastructure that hinders the growth and scalability of agriculture
diversification. The areas which were identified which could be considered for skill development:
► The climate of Uttarakhand spans across different agro-climatic zones making it conducive for
growing flowers. As an alternative to traditional farming there is great interest among the local
youth to purse floriculture. They need field based demonstration on flower cultivation which will
help them pursue it at a scale and derive economic benefits.
► Although the Krishi Vigyan Kendras provide regular training and extension services, these are not
enough due to insufficient numbers of agriculture scientists. By improving the present
infrastructure and providing training to trainers can help in bridging the technological gap on new
methods of agriculture farming and extension services.
► It is important to develop the capacities of women, who are primarily involved in agriculture and
have an important role to play in the economy especially in the hilly regions. They will be able to
increase agricultural productivity if given training. Some areas which may be considered for
training are irrigation practice, fertilizer intake, seed selection etc.
► Training on organic farming has enormous scope in the entire hill Districts. For example in
Rudrapryag District there is high demand for organic produce but the supply is less. Spreading
awareness among the farmers and providing them with training on farming techniques will
generate interest and attract the agrarian population towards commercialization of organic
produce. Skill development was required in organic farming methods, sorting, grading and
processing of food products.
► Since there is availability of large quantities of seasonal fruits and vegetables training maybe
given in areas like fruit pulp processing and production of vegetables in poly houses. Inadequate
post-harvest technology (processing, grading, processing, and packaging) provides enough
opportunity to develop appropriate infrastructure and organize customized training programmers
in collaboration with ITIs.
► There is plenty of opportunity to set up orchard farming in the State, but the farmers do not have
enough capacity to scale up cultivation. They may be provided technical training on soil
preparation, selection of agri-inputs, crop rotation, and harvesting technique. In addition, they also
require skills in marketing and developing linkages for better returns.
► Dairy operation including animal husbandry operations can be scaled up in the State provided
there is adequate infrastructural and investment support. There is shortage of skilled manpower
that can perform dairy operations in an integrated manner. At present there is shortage of milch
animals, and milk produced is consumed at a subsistence level. There is scope to provide training
to farmers on breed improvement, fodder management, and taking care of the health of animals.
District Skill Gap Study for the State of Uttarakhand
65
► Uttarakhand Tea Development Board has been working on tea cultivation and processing
(inorganic and organic tea) on more than 700 hectares37
of land in the hilly Districts of
Uttarakhand. There can be an increase in the tea plantation by making use of fallow and
cultivable vacant land. As per the vision of Uttarakhand Tea Development Board it proposes to
bring 9000 hectares of land under tea plantation. This will require skilling people in the area of tea
cultivation and processing.
► There are certain other State level corporations /federations with similar potential for expansion
These include:
Tarai Development Corporation: The main objective of Tarai Development Corporation is to
make available improved quality seeds, to help farmers improve their productivity and also
improve their economic status;
Uttarakhand State Organic Certification Agency: The agency provides affordable organic
inspection and certification service in the State;
Uttarakhand Co-operative Dairy Federation Ltd: Uttarakhand Co-operative Dairy
Federation Ltd. (UCDF Ltd.) is the apex federation of District milk cooperative unions in the
State of Uttarakhand established for the successful implementation of the dairy programme in
the State, for the socio-economic upliftment of the poor remote areas by providing them a
milk market at reasonable price;
Some challenges faced by the sector from the perspective of the stakeholders are as follows:
► Non existence of forward and backward linkages for herbal and aromatic plants.
► Lack of marketing opportunities and facilities like mandis and 'saras kendras' limits the farmers
from large scale production.
► Lack of proper infrastructure such as commercially sized coops or quality feed, fodder depot for
poultry and dairy farming.
► Marketing and selling of fruits and vegetables is unorganized and generally involves middlemen.
► Unavailability of cold storage facility creates hindrance in promotion of forward linkages.
► Limited value addition to fruits, vegetables and spices post-harvest, resulting in lesser revenues
for the farmers.
► Lack of superior quality breeds and inadequate facility of fodder production and distribution.
► Unavailability of timely vaccines and skilled staff capable of managing dairy development.
Secondary Sector
The growing secondary sector is finding it challenging to source skilled human resource. The
industries flourishing in the SIDCUL area require skilled manpower to cater to their business process.
At present, the demand for skilled electrician, fitters, welders, motor mechanist, and machinist is not
being fulfilled by the existing ITIs and other technical institutes. As an example in Sigaddi growth
center, the local industries are finding it very challenging to find skilled and minimally skilled labor. In
order to promote employment opportunities for the people of Uttarakhand, the Government has
introduced a condition that the companies setting base in Siggadi need to recruit 70 percent of its
workforce from the State. The IT companies are struggling to find candidates who have secured first
division in class 10, Diploma or polytechnic. Some potential areas where skill development is required
are mentioned below:
Automobile and engineering
Automobile industries have major presence in the State and employ most of the skilled manpower
from existing vocational training centers and ITIs. Industry representatives shared that the current
work-force are trained but not skilled enough to handle new machinery. They stressed the need to
37
http://utdb.uk.gov.in/pages/display/59-tea-estates-gardens--
District Skill Gap Study for the State of Uttarakhand
66
align the current courses with the demand of industries and train people on Computer Numerical
Control (CNC) machines. At present there is shortage of skilled people that can operate these
machines. New training modules need to be designed for electricians, mechanics, welders, fitters and
plumbers. In addition to this, the student intake capacity of those ITIs should be enhanced, which
have been upgraded under programmes like Vocational Training Improvement Programme (VTIP)
and Public Private Partnership (PPP). This may be done by increasing the hostel facilities and
creating awareness among youth of the hills to opt for the courses and benefit from the opportunities
offered.
Agro - food processing
Given the major scope for food and vegetable processing, there is a need for training on food
processor induction skill set, machine operator skills and food production supervisor skills. Lack of
skilled manpower and infrastructural support makes it difficult to scale up production. There is scope
to train people in collaboration with public and private technical institutes. Food processing industries
from other parts of the country can assist the District level industrial centers and vocational institutes
in training people. Existing ITIs and training centers should offer specific skills related to food
processing.
Handloom and wool processing industries
Khadi and handloom industries face challenges in promotion of khadi products due to old design
which are being produced using old machines. Training may be given on ‘jacquard looms’ that are
compatible with the latest design trends. At present there is shortage of trained workforce to operate
these machines. Other aspects that require training includes marketing skills for khadi products. As an
example Almora District has presence of River View Khadi and Handloom Factory that can be
strengthened by providing infrastructural and training support from Village Industries Commission of
India. Major challenges in the promotion of this sector were felt due to redundant technologies in
production and little innovation in designs. It was shared that the factory still relied on ‘khaddi’
machines whereas new improved technologies like ‘jacquard looms’ were in the market.
Wool industry has not been developed in an integrated manner in Uttarakhand. Industry
representatives feel that there is gap in skilled manpower for processing raw wool to final product.
Presently, the sheep are reared locally without using any carding and cleaning machines. There is
ample opportunity to provide training on mechanized shearing, cleaning and spinning. At present
there is shortage of skilled manpower to carry to carry the above process. Training in these areas
could be introduced through different streams - existing skill development programmes, NGO
programmes. Associated skills related to marketing, entrepreneurial development maybe given by
setting up community colleges for which support is being given by the Central Government also.
Some barriers in development of the secondary sector are as follows:
► Low awareness levels and lack of skill in food processing technology.
► There is a shortage of a common facility center for wool processing and cleaning.
► Tools used in the Handicraft industry are outdated; production is primarily through traditional
technology.
► People involved in handicraft lack formal skills, ideas for innovation and market linkages thereby
limiting the reach of their products.
► Current workforce lack skill in operating new machines operated by the industries.
Tertiary Sector
Tourism and Hospitality management
While Tourism sector offers tremendous employment opportunities, it is yet to achieve its full potential,
which is why it does not offer year round employment to the local population. Among several
measures required to promote the sector, the most significant one is infrastructure development.
District Skill Gap Study for the State of Uttarakhand
67
Tourist zones in the State need to be properly connected through roads, rails, and airports; ensure
availability of electricity and internet connectivity. The variety of tourism options (religious, adventure,
cultural) are unique to this State which should be publicized.
There is insufficient availability of trained work-force in the hospitality sector. The State has shortage
of trained cooks, waiters, front office staff, tourist guides to cater to the requirements of domestic as
well as international tourists for which training facilities are needed. The existing educational and
technical institutes lack trained faculty. Courses on tourism and hotel management can be introduced
in the existing polytechnic colleges to retain high school pass outs within the Districts.
Adventure Sports like river rafting, parasailing, snow skiing, rock climbing and bungee jumping could
be developed on a much higher scale to tap the interest of the youth aside of their traditional
inclinations. The Department of Tourism has proposed gliding points in Chandak, Munakot and Dwaj.
Training may be provided for adventure sports instructors, tour guides, and trained drivers. Skill based
training opportunities also exists for training wildlife guides and nature interpreters. Nehru Institute of
Mountaineering (NIIM) is the only institute in the State that offers training on adventure sports. The
tourism board strongly feels the shortage of skilled manpower as instructors for various adventure
sports. Presently, either instructors are sourced from Himachal Pradesh or they have to hire students
from NIIM. Given the demand for adventure sports, there is requirement for setting institutes like NIIM
that can provide training on a plethora of outdoor sports activities.
Business Process Outsourcing (BPOs)/Knowledge Process Outsourcing (KPOs)
There is scope of providing training for service industries like BPO, KPO, insurance, and retail in the
hilly Districts of Uttarakhand. At present the demand for skilled manpower for these industries is
sourced from other States. Existing colleges, vocational training centers and ITIs can offer a short
term courses to train people on these services.
Employment of ex-service men
A number of people from the State join forces. Since the retirement age of the service men is less a
large number of them can be usefully employed. The team found an ex-service man imparting training
in an ITI. The Principal of the ITI shared that since they have practical experience also, they become
very good trainers. Since there is a shortage of faculty, the y can be usefully employed to meet the
demand.
Some challenges faced by people engaged with this sector are as follows:
1. Poor condition of the trekking paths, insufficient shelter points, and lack of trained nature and trek
guides affects tourism industry in the State.
2. Problem of migration to industrial belts such as Haridwar, Uddham Singh Nagar, and Dehradun.
3. Shortage of English teachers and soft skill service providers in the hilly Districts.
Perspective of the Youth
Youth were important respondents in the study. The team made additional efforts to meet with youth
groups in all the Districts. However, their perceptions are very important, therefore warrant a separate
mention also. Some common perceptions shared by the youth groups are mentioned below.
1. While the data suggests that majority of the population is engaged in the primary sector, a
discussion with the youth groups reflected that they were not very enthused to continue with
agriculture and allied areas. They appeared to be more keen on technology based skills. This
trend is noticeable and in the view of some adults, although literacy levels are improving,
traditional knowledge is getting eroded since the youth is not very interested in pursuing it.
2. Their inclination is more towards pursuing service oriented courses. They are keen to acquire soft
skills – especially English speaking - that will help them with their preparation for competitive
examinations and also jobs. A number of students expressed that the courses offered in their
respective colleges need to become applied courses so that these will help them get jobs.
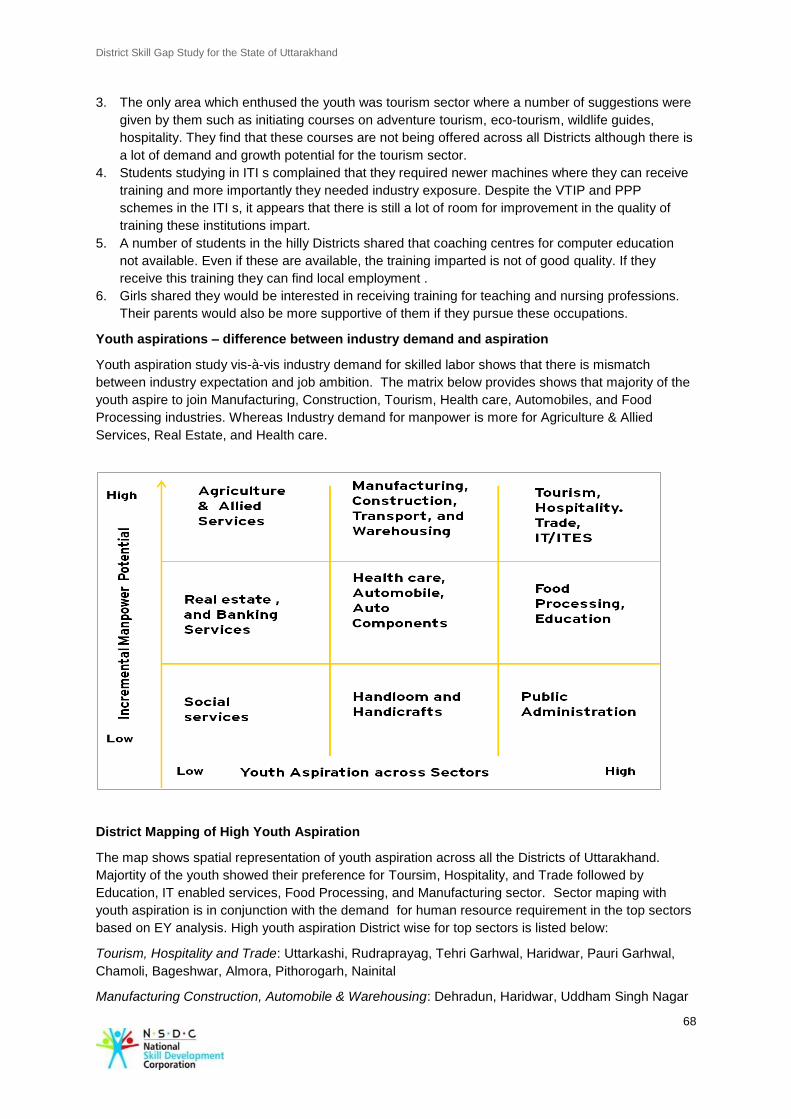
District Skill Gap Study for the State of Uttarakhand
68
3. The only area which enthused the youth was tourism sector where a number of suggestions were
given by them such as initiating courses on adventure tourism, eco-tourism, wildlife guides,
hospitality. They find that these courses are not being offered across all Districts although there is
a lot of demand and growth potential for the tourism sector.
4. Students studying in ITI s complained that they required newer machines where they can receive
training and more importantly they needed industry exposure. Despite the VTIP and PPP
schemes in the ITI s, it appears that there is still a lot of room for improvement in the quality of
training these institutions impart.
5. A number of students in the hilly Districts shared that coaching centres for computer education
not available. Even if these are available, the training imparted is not of good quality. If they
receive this training they can find local employment .
6. Girls shared they would be interested in receiving training for teaching and nursing professions.
Their parents would also be more supportive of them if they pursue these occupations.
Youth aspirations – difference between industry demand and aspiration
Youth aspiration study vis-à-vis industry demand for skilled labor shows that there is mismatch
between industry expectation and job ambition. The matrix below provides shows that majority of the
youth aspire to join Manufacturing, Construction, Tourism, Health care, Automobiles, and Food
Processing industries. Whereas Industry demand for manpower is more for Agriculture & Allied
Services, Real Estate, and Health care.
District Mapping of High Youth Aspiration
The map shows spatial representation of youth aspiration across all the Districts of Uttarakhand.
Majortity of the youth showed their preference for Toursim, Hospitality, and Trade followed by
Education, IT enabled services, Food Processing, and Manufacturing sector. Sector maping with
youth aspiration is in conjunction with the demand for human resource requirement in the top sectors
based on EY analysis. High youth aspiration District wise for top sectors is listed below:
Tourism, Hospitality and Trade: Uttarkashi, Rudraprayag, Tehri Garhwal, Haridwar, Pauri Garhwal,
Chamoli, Bageshwar, Almora, Pithorogarh, Nainital
Manufacturing Construction, Automobile & Warehousing: Dehradun, Haridwar, Uddham Singh Nagar
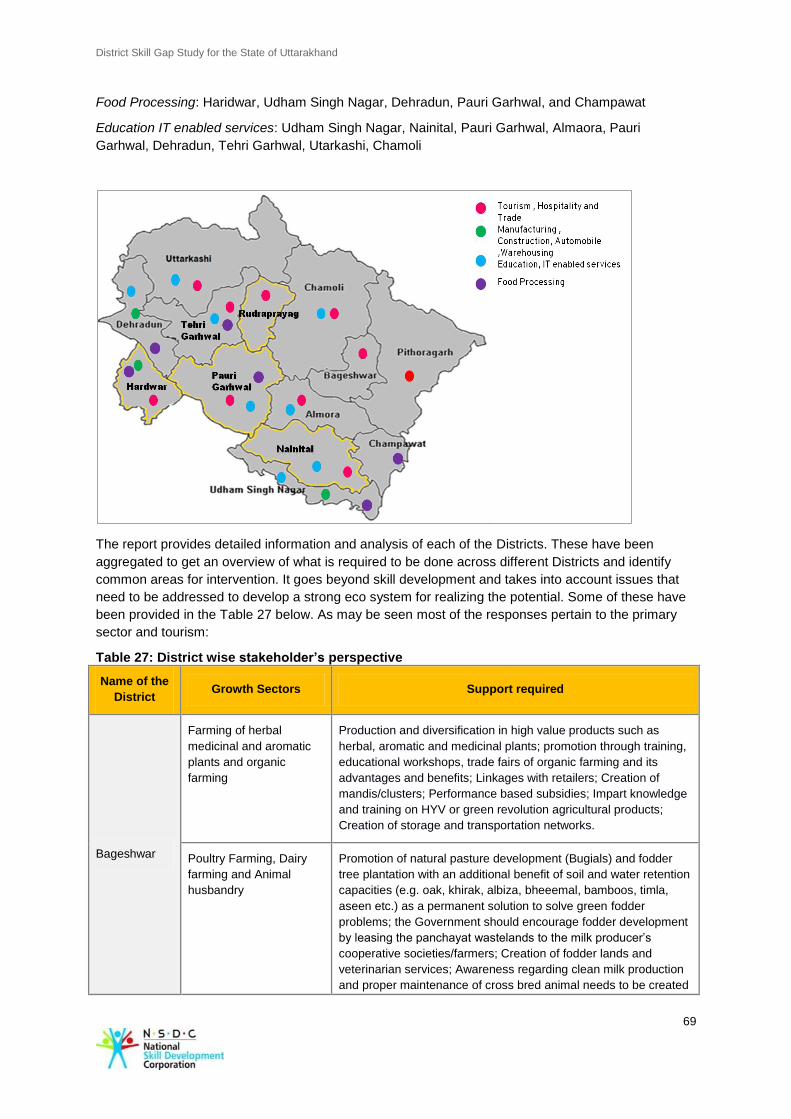
District Skill Gap Study for the State of Uttarakhand
69
Food Processing: Haridwar, Udham Singh Nagar, Dehradun, Pauri Garhwal, and Champawat
Education IT enabled services: Udham Singh Nagar, Nainital, Pauri Garhwal, Almaora, Pauri
Garhwal, Dehradun, Tehri Garhwal, Utarkashi, Chamoli
The report provides detailed information and analysis of each of the Districts. These have been
aggregated to get an overview of what is required to be done across different Districts and identify
common areas for intervention. It goes beyond skill development and takes into account issues that
need to be addressed to develop a strong eco system for realizing the potential. Some of these have
been provided in the Table 27 below. As may be seen most of the responses pertain to the primary
sector and tourism:
Table 27: District wise stakeholder’s perspective
Name of the
District Growth Sectors Support required
Bageshwar
Farming of herbal
medicinal and aromatic
plants and organic
farming
Production and diversification in high value products such as
herbal, aromatic and medicinal plants; promotion through training,
educational workshops, trade fairs of organic farming and its
advantages and benefits; Linkages with retailers; Creation of
mandis/clusters; Performance based subsidies; Impart knowledge
and training on HYV or green revolution agricultural products;
Creation of storage and transportation networks.
Poultry Farming, Dairy
farming and Animal
husbandry
Promotion of natural pasture development (Bugials) and fodder
tree plantation with an additional benefit of soil and water retention
capacities (e.g. oak, khirak, albiza, bheeemal, bamboos, timla,
aseen etc.) as a permanent solution to solve green fodder
problems; the Government should encourage fodder development
by leasing the panchayat wastelands to the milk producer’s
cooperative societies/farmers; Creation of fodder lands and
veterinarian services; Awareness regarding clean milk production
and proper maintenance of cross bred animal needs to be created
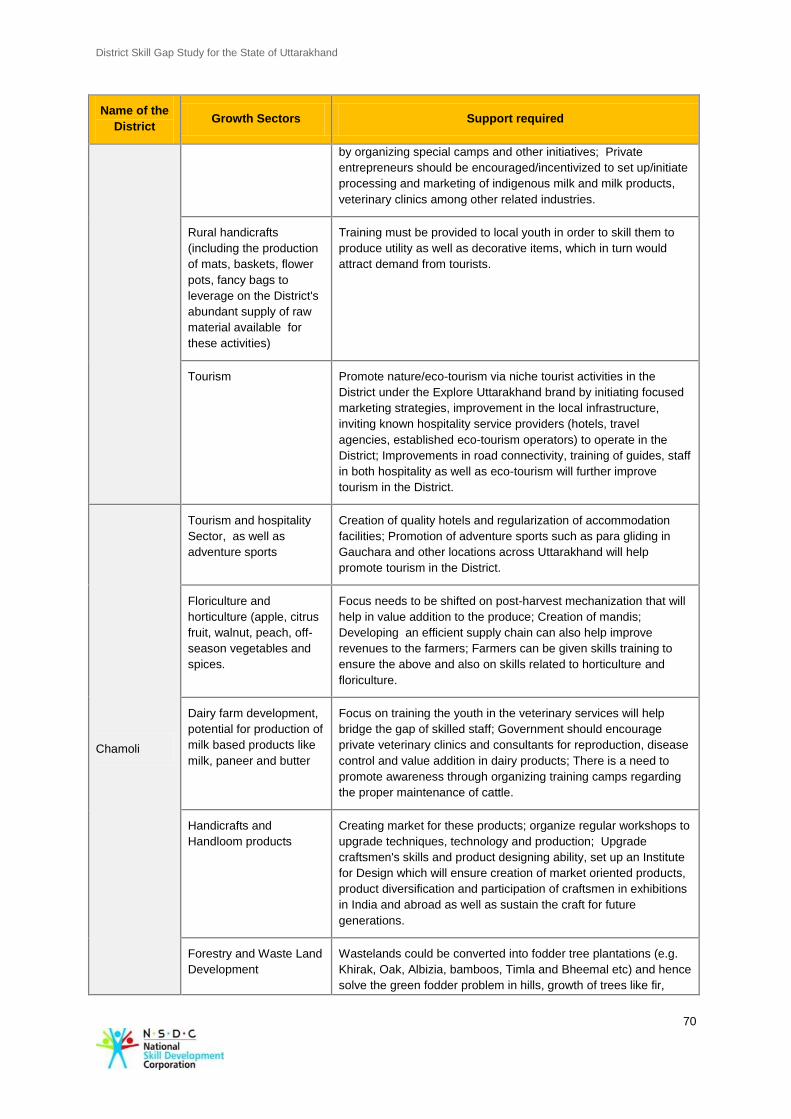
District Skill Gap Study for the State of Uttarakhand
70
Name of the
District Growth Sectors Support required
by organizing special camps and other initiatives; Private
entrepreneurs should be encouraged/incentivized to set up/initiate
processing and marketing of indigenous milk and milk products,
veterinary clinics among other related industries.
Rural handicrafts
(including the production
of mats, baskets, flower
pots, fancy bags to
leverage on the District's
abundant supply of raw
material available for
these activities)
Training must be provided to local youth in order to skill them to
produce utility as well as decorative items, which in turn would
attract demand from tourists.
Tourism Promote nature/eco-tourism via niche tourist activities in the
District under the Explore Uttarakhand brand by initiating focused
marketing strategies, improvement in the local infrastructure,
inviting known hospitality service providers (hotels, travel
agencies, established eco-tourism operators) to operate in the
District; Improvements in road connectivity, training of guides, staff
in both hospitality as well as eco-tourism will further improve
tourism in the District.
Chamoli
Tourism and hospitality
Sector, as well as
adventure sports
Creation of quality hotels and regularization of accommodation
facilities; Promotion of adventure sports such as para gliding in
Gauchara and other locations across Uttarakhand will help
promote tourism in the District.
Floriculture and
horticulture (apple, citrus
fruit, walnut, peach, off-
season vegetables and
spices.
Focus needs to be shifted on post-harvest mechanization that will
help in value addition to the produce; Creation of mandis;
Developing an efficient supply chain can also help improve
revenues to the farmers; Farmers can be given skills training to
ensure the above and also on skills related to horticulture and
floriculture.
Dairy farm development,
potential for production of
milk based products like
milk, paneer and butter
Focus on training the youth in the veterinary services will help
bridge the gap of skilled staff; Government should encourage
private veterinary clinics and consultants for reproduction, disease
control and value addition in dairy products; There is a need to
promote awareness through organizing training camps regarding
the proper maintenance of cattle.
Handicrafts and
Handloom products
Creating market for these products; organize regular workshops to
upgrade techniques, technology and production; Upgrade
craftsmen's skills and product designing ability, set up an Institute
for Design which will ensure creation of market oriented products,
product diversification and participation of craftsmen in exhibitions
in India and abroad as well as sustain the craft for future
generations.
Forestry and Waste Land
Development
Wastelands could be converted into fodder tree plantations (e.g.
Khirak, Oak, Albizia, bamboos, Timla and Bheemal etc) and hence
solve the green fodder problem in hills, growth of trees like fir,
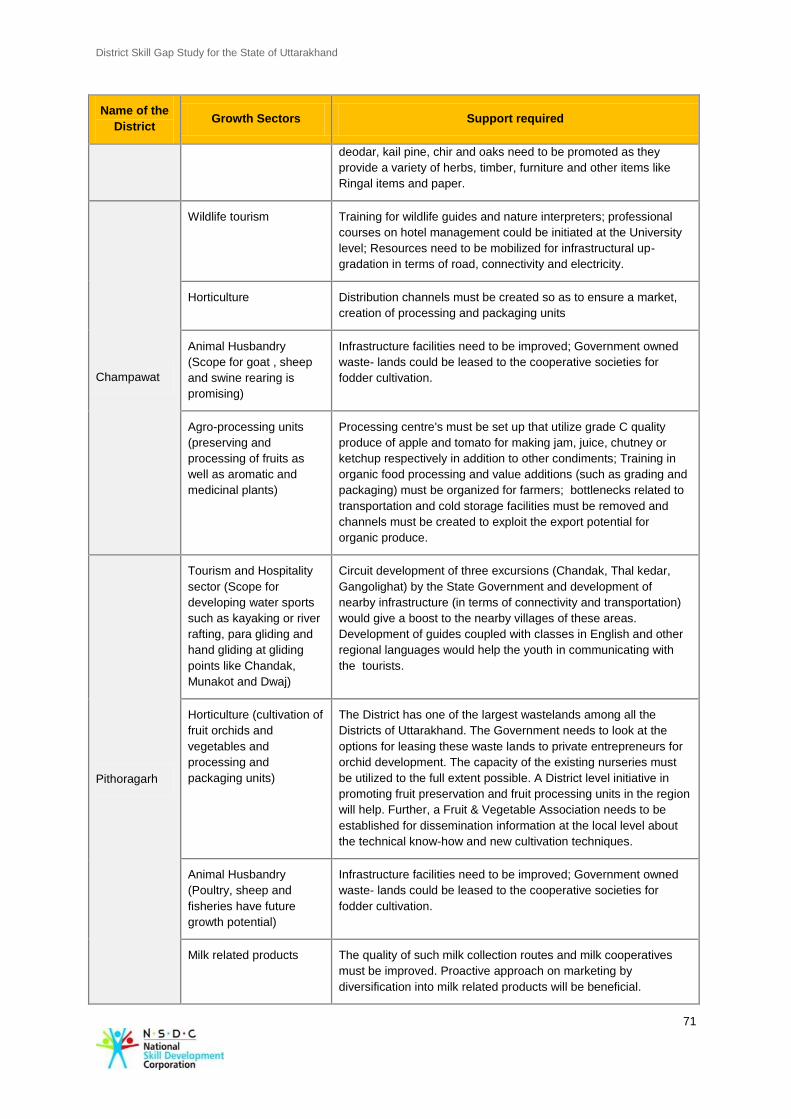
District Skill Gap Study for the State of Uttarakhand
71
Name of the
District Growth Sectors Support required
deodar, kail pine, chir and oaks need to be promoted as they
provide a variety of herbs, timber, furniture and other items like
Ringal items and paper.
Champawat
Wildlife tourism Training for wildlife guides and nature interpreters; professional
courses on hotel management could be initiated at the University
level; Resources need to be mobilized for infrastructural up-
gradation in terms of road, connectivity and electricity.
Horticulture Distribution channels must be created so as to ensure a market,
creation of processing and packaging units
Animal Husbandry
(Scope for goat , sheep
and swine rearing is
promising)
Infrastructure facilities need to be improved; Government owned
waste- lands could be leased to the cooperative societies for
fodder cultivation.
Agro-processing units
(preserving and
processing of fruits as
well as aromatic and
medicinal plants)
Processing centre's must be set up that utilize grade C quality
produce of apple and tomato for making jam, juice, chutney or
ketchup respectively in addition to other condiments; Training in
organic food processing and value additions (such as grading and
packaging) must be organized for farmers; bottlenecks related to
transportation and cold storage facilities must be removed and
channels must be created to exploit the export potential for
organic produce.
Pithoragarh
Tourism and Hospitality
sector (Scope for
developing water sports
such as kayaking or river
rafting, para gliding and
hand gliding at gliding
points like Chandak,
Munakot and Dwaj)
Circuit development of three excursions (Chandak, Thal kedar,
Gangolighat) by the State Government and development of
nearby infrastructure (in terms of connectivity and transportation)
would give a boost to the nearby villages of these areas.
Development of guides coupled with classes in English and other
regional languages would help the youth in communicating with
the tourists.
Horticulture (cultivation of
fruit orchids and
vegetables and
processing and
packaging units)
The District has one of the largest wastelands among all the
Districts of Uttarakhand. The Government needs to look at the
options for leasing these waste lands to private entrepreneurs for
orchid development. The capacity of the existing nurseries must
be utilized to the full extent possible. A District level initiative in
promoting fruit preservation and fruit processing units in the region
will help. Further, a Fruit & Vegetable Association needs to be
established for dissemination information at the local level about
the technical know-how and new cultivation techniques.
Animal Husbandry
(Poultry, sheep and
fisheries have future
growth potential)
Infrastructure facilities need to be improved; Government owned
waste- lands could be leased to the cooperative societies for
fodder cultivation.
Milk related products The quality of such milk collection routes and milk cooperatives
must be improved. Proactive approach on marketing by
diversification into milk related products will be beneficial.
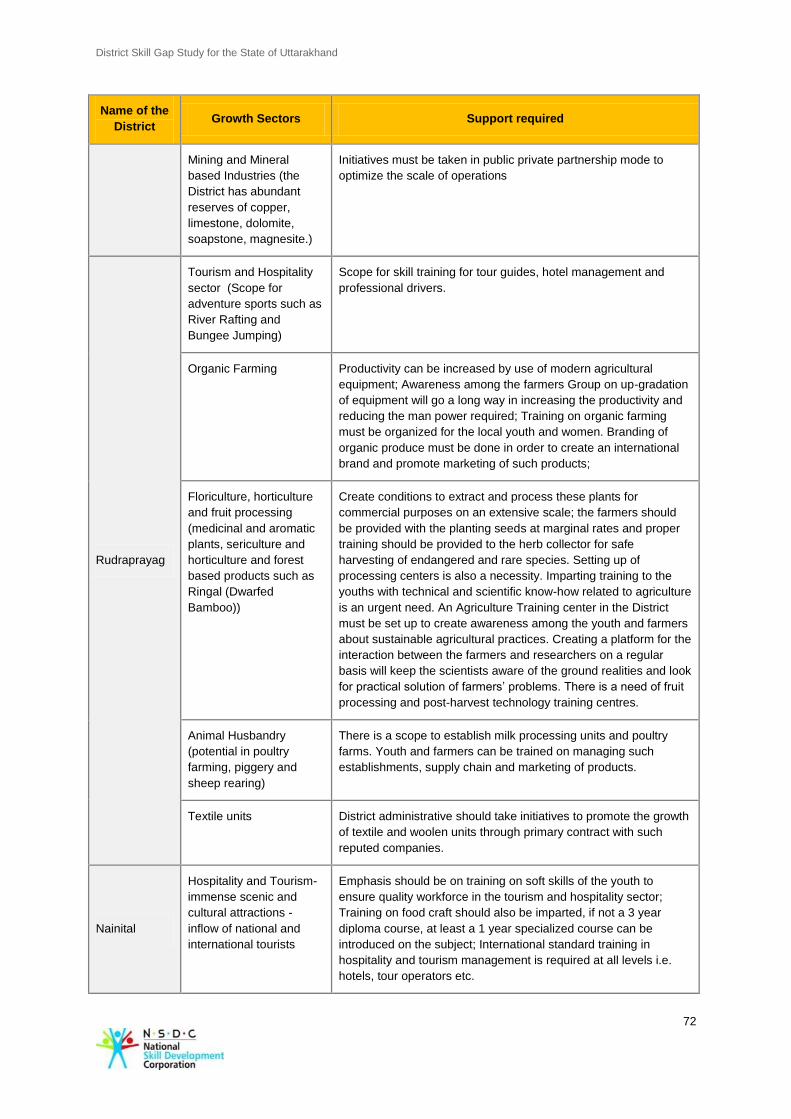
District Skill Gap Study for the State of Uttarakhand
72
Name of the
District Growth Sectors Support required
Mining and Mineral
based Industries (the
District has abundant
reserves of copper,
limestone, dolomite,
soapstone, magnesite.)
Initiatives must be taken in public private partnership mode to
optimize the scale of operations
Rudraprayag
Tourism and Hospitality
sector (Scope for
adventure sports such as
River Rafting and
Bungee Jumping)
Scope for skill training for tour guides, hotel management and
professional drivers.
Organic Farming Productivity can be increased by use of modern agricultural
equipment; Awareness among the farmers Group on up-gradation
of equipment will go a long way in increasing the productivity and
reducing the man power required; Training on organic farming
must be organized for the local youth and women. Branding of
organic produce must be done in order to create an international
brand and promote marketing of such products;
Floriculture, horticulture
and fruit processing
(medicinal and aromatic
plants, sericulture and
horticulture and forest
based products such as
Ringal (Dwarfed
Bamboo))
Create conditions to extract and process these plants for
commercial purposes on an extensive scale; the farmers should
be provided with the planting seeds at marginal rates and proper
training should be provided to the herb collector for safe
harvesting of endangered and rare species. Setting up of
processing centers is also a necessity. Imparting training to the
youths with technical and scientific know-how related to agriculture
is an urgent need. An Agriculture Training center in the District
must be set up to create awareness among the youth and farmers
about sustainable agricultural practices. Creating a platform for the
interaction between the farmers and researchers on a regular
basis will keep the scientists aware of the ground realities and look
for practical solution of farmers’ problems. There is a need of fruit
processing and post-harvest technology training centres.
Animal Husbandry
(potential in poultry
farming, piggery and
sheep rearing)
There is a scope to establish milk processing units and poultry
farms. Youth and farmers can be trained on managing such
establishments, supply chain and marketing of products.
Textile units District administrative should take initiatives to promote the growth
of textile and woolen units through primary contract with such
reputed companies.
Nainital
Hospitality and Tourism-
immense scenic and
cultural attractions -
inflow of national and
international tourists
Emphasis should be on training on soft skills of the youth to
ensure quality workforce in the tourism and hospitality sector;
Training on food craft should also be imparted, if not a 3 year
diploma course, at least a 1 year specialized course can be
introduced on the subject; International standard training in
hospitality and tourism management is required at all levels i.e.
hotels, tour operators etc.
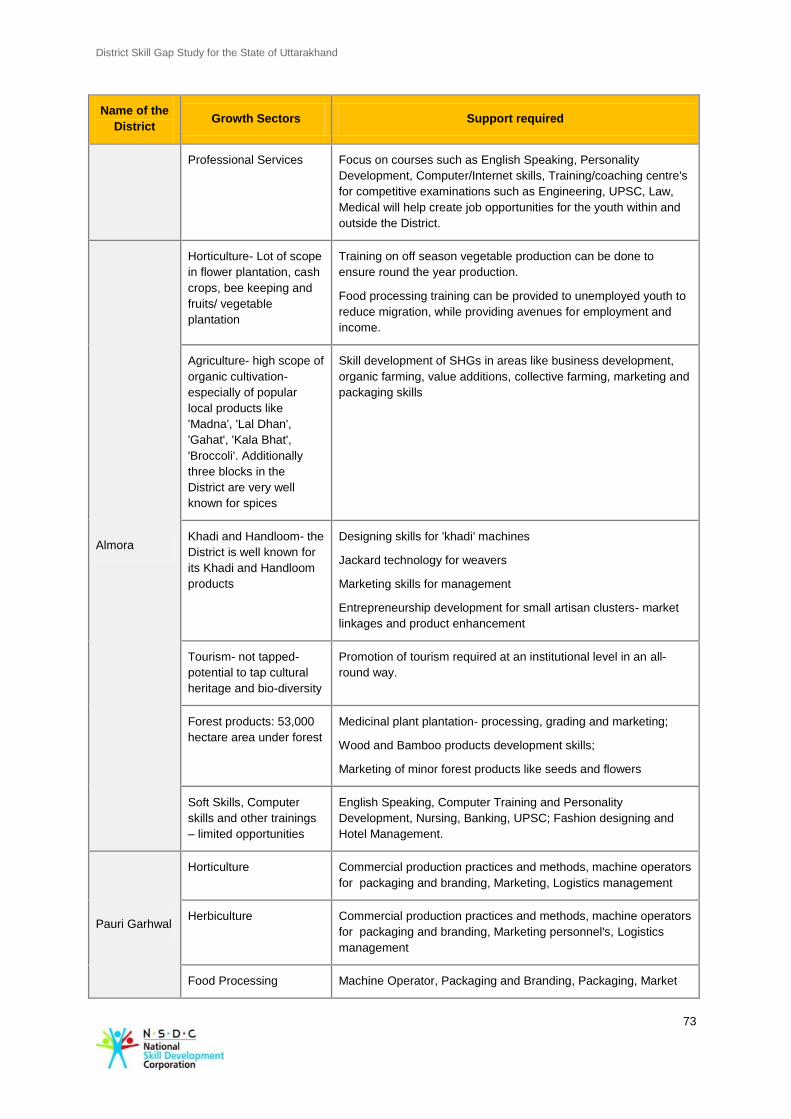
District Skill Gap Study for the State of Uttarakhand
73
Name of the
District Growth Sectors Support required
Professional Services Focus on courses such as English Speaking, Personality
Development, Computer/Internet skills, Training/coaching centre's
for competitive examinations such as Engineering, UPSC, Law,
Medical will help create job opportunities for the youth within and
outside the District.
Almora
Horticulture- Lot of scope
in flower plantation, cash
crops, bee keeping and
fruits/ vegetable
plantation
Training on off season vegetable production can be done to
ensure round the year production.
Food processing training can be provided to unemployed youth to
reduce migration, while providing avenues for employment and
income.
Agriculture- high scope of
organic cultivation-
especially of popular
local products like
'Madna', 'Lal Dhan',
'Gahat', 'Kala Bhat',
'Broccoli'. Additionally
three blocks in the
District are very well
known for spices
Skill development of SHGs in areas like business development,
organic farming, value additions, collective farming, marketing and
packaging skills
Khadi and Handloom- the
District is well known for
its Khadi and Handloom
products
Designing skills for 'khadi' machines
Jackard technology for weavers
Marketing skills for management
Entrepreneurship development for small artisan clusters- market
linkages and product enhancement
Tourism- not tapped-
potential to tap cultural
heritage and bio-diversity
Promotion of tourism required at an institutional level in an all-
round way.
Forest products: 53,000
hectare area under forest
Medicinal plant plantation- processing, grading and marketing;
Wood and Bamboo products development skills;
Marketing of minor forest products like seeds and flowers
Soft Skills, Computer
skills and other trainings
– limited opportunities
English Speaking, Computer Training and Personality
Development, Nursing, Banking, UPSC; Fashion designing and
Hotel Management.
Pauri Garhwal
Horticulture Commercial production practices and methods, machine operators
for packaging and branding, Marketing, Logistics management
Herbiculture Commercial production practices and methods, machine operators
for packaging and branding, Marketing personnel's, Logistics
management
Food Processing Machine Operator, Packaging and Branding, Packaging, Market
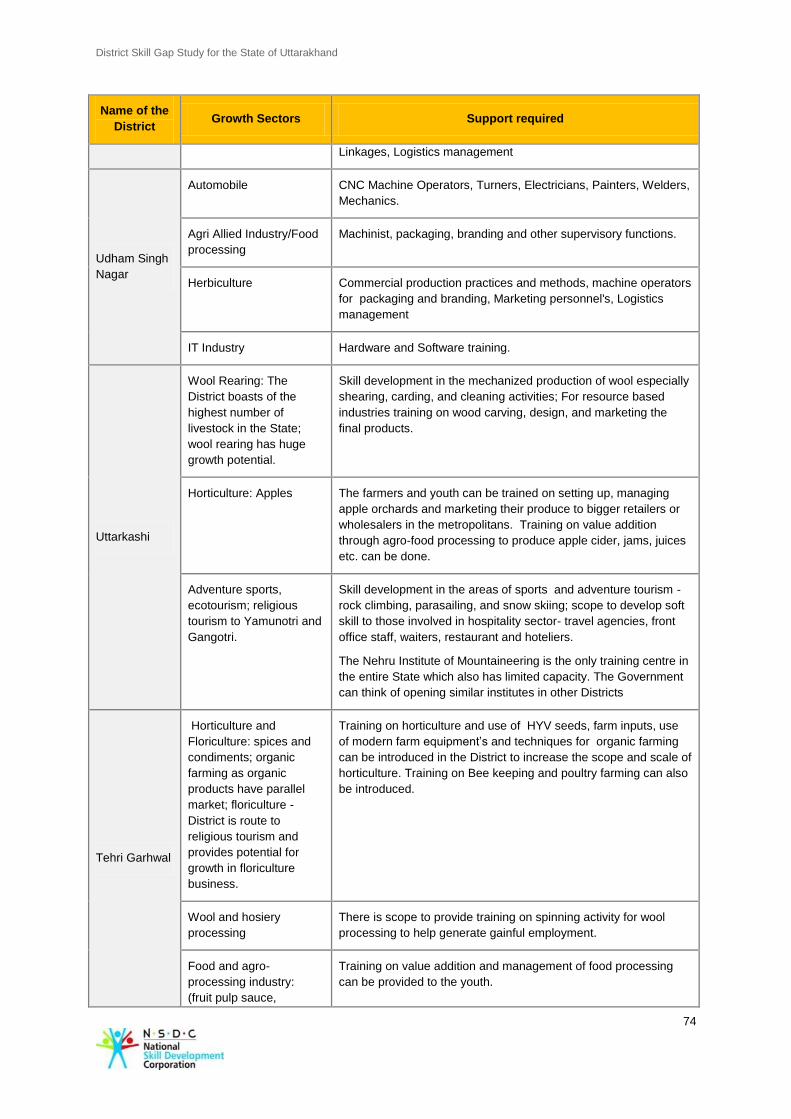
District Skill Gap Study for the State of Uttarakhand
74
Name of the
District Growth Sectors Support required
Linkages, Logistics management
Udham Singh
Nagar
Automobile CNC Machine Operators, Turners, Electricians, Painters, Welders,
Mechanics.
Agri Allied Industry/Food
processing
Machinist, packaging, branding and other supervisory functions.
Herbiculture Commercial production practices and methods, machine operators
for packaging and branding, Marketing personnel's, Logistics
management
IT Industry Hardware and Software training.
Uttarkashi
Wool Rearing: The
District boasts of the
highest number of
livestock in the State;
wool rearing has huge
growth potential.
Skill development in the mechanized production of wool especially
shearing, carding, and cleaning activities; For resource based
industries training on wood carving, design, and marketing the
final products.
Horticulture: Apples The farmers and youth can be trained on setting up, managing
apple orchards and marketing their produce to bigger retailers or
wholesalers in the metropolitans. Training on value addition
through agro-food processing to produce apple cider, jams, juices
etc. can be done.
Adventure sports,
ecotourism; religious
tourism to Yamunotri and
Gangotri.
Skill development in the areas of sports and adventure tourism -
rock climbing, parasailing, and snow skiing; scope to develop soft
skill to those involved in hospitality sector- travel agencies, front
office staff, waiters, restaurant and hoteliers.
The Nehru Institute of Mountaineering is the only training centre in
the entire State which also has limited capacity. The Government
can think of opening similar institutes in other Districts
Tehri Garhwal
Horticulture and
Floriculture: spices and
condiments; organic
farming as organic
products have parallel
market; floriculture -
District is route to
religious tourism and
provides potential for
growth in floriculture
business.
Training on horticulture and use of HYV seeds, farm inputs, use
of modern farm equipment’s and techniques for organic farming
can be introduced in the District to increase the scope and scale of
horticulture. Training on Bee keeping and poultry farming can also
be introduced.
Wool and hosiery
processing
There is scope to provide training on spinning activity for wool
processing to help generate gainful employment.
Food and agro-
processing industry:
(fruit pulp sauce,
Training on value addition and management of food processing
can be provided to the youth.
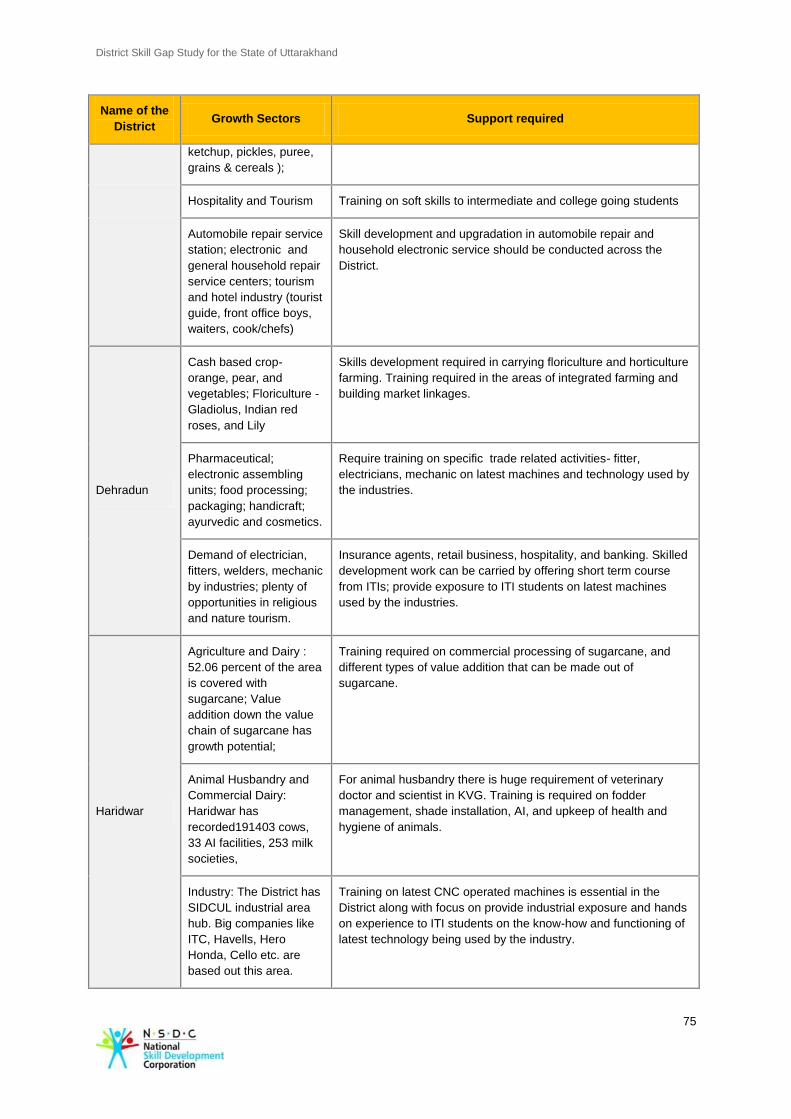
District Skill Gap Study for the State of Uttarakhand
75
Name of the
District Growth Sectors Support required
ketchup, pickles, puree,
grains & cereals );
Hospitality and Tourism Training on soft skills to intermediate and college going students
Automobile repair service
station; electronic and
general household repair
service centers; tourism
and hotel industry (tourist
guide, front office boys,
waiters, cook/chefs)
Skill development and upgradation in automobile repair and
household electronic service should be conducted across the
District.
Dehradun
Cash based crop-
orange, pear, and
vegetables; Floriculture -
Gladiolus, Indian red
roses, and Lily
Skills development required in carrying floriculture and horticulture
farming. Training required in the areas of integrated farming and
building market linkages.
Pharmaceutical;
electronic assembling
units; food processing;
packaging; handicraft;
ayurvedic and cosmetics.
Require training on specific trade related activities- fitter,
electricians, mechanic on latest machines and technology used by
the industries.
Demand of electrician,
fitters, welders, mechanic
by industries; plenty of
opportunities in religious
and nature tourism.
Insurance agents, retail business, hospitality, and banking. Skilled
development work can be carried by offering short term course
from ITIs; provide exposure to ITI students on latest machines
used by the industries.
Haridwar
Agriculture and Dairy :
52.06 percent of the area
is covered with
sugarcane; Value
addition down the value
chain of sugarcane has
growth potential;
Training required on commercial processing of sugarcane, and
different types of value addition that can be made out of
sugarcane.
Animal Husbandry and
Commercial Dairy:
Haridwar has
recorded191403 cows,
33 AI facilities, 253 milk
societies,
For animal husbandry there is huge requirement of veterinary
doctor and scientist in KVG. Training is required on fodder
management, shade installation, AI, and upkeep of health and
hygiene of animals.
Industry: The District has
SIDCUL industrial area
hub. Big companies like
ITC, Havells, Hero
Honda, Cello etc. are
based out this area.
Training on latest CNC operated machines is essential in the
District along with focus on provide industrial exposure and hands
on experience to ITI students on the know-how and functioning of
latest technology being used by the industry.
District Skill Gap Study for the State of Uttarakhand
76
5. Recommendations and Action Plan
The analysis presented in the preceding sections identifies some areas where skills can be imparted.
Secondary data analysis shows that the top 6 sectors that are likely to require skilled people in order
of priority are manufacturing; tourism, hospitality and Trade; Agriculture and allied services,
Education, Construction and Transportation and warehousing. In addition, primary research has
further identified requirements of people which help to identify areas for skill development more
specifically.
Before discussing the recommendations the following realities about the State need to be taken into
account:
The literacy levels of the population are high but non availability of livelihood options are
compelling people to migrate to other Districts/States/countries.
Majority of its population (75 percent) is still dependent on agriculture but due to small and
scattered landholdings productivity of agriculture is not high. Traditional agriculture does not seem
to be the lead sector in the coming years.
As a result of migration from the hilly areas, women play a significant role in engaging in
agriculture. Therefore the gender aspect especially for developing the primary sector gains
importance.
Uttarakhand was the first State to declare itself an organic State. An Organic Board was also
formed to promote organic farming. This a USP of the State which can be further strengthened.
The local economy is mostly dependent on the plains and the neighboring States, which makes
the people in hilly Districts less self-reliant.
Despite, progress made the infrastructure is not very well developed. Since availability of good
infrastructure provides an enabling environment, this aspect warrants greater attention.
There is a perception that the existing training institutes, the ITI s in particular, lack mountainous
specificities.
There is abundance of aromatic and medicinal plants. About 175 species have been identified in
the State which is indicative of its rich resource base which can be leveraged.
These are important aspects to be borne in mind while planning for skill development. The
recommendations have been categorized for different stakeholders who would have the responsibility
or mandate towards skill development.
► Government of Uttarakhand;
► Training providers;
► Industry and;
► NSDC
5.1 Government
5.1.1 Strengthening the Institutional Mechanism
In order to consolidate its existing State level activities and approach the issue of skill development in
a consolidated and comprehensive manner, the Government has formed a society called Uttarakhand
Skill Development Society (‘USDS’).
The Objectives of USDS are as follows:
► To promote development of skills as laid down under the charter of the National Skill
Development Mission;
► To organise capacity building programmes for skill development programmes;
District Skill Gap Study for the State of Uttarakhand
77
► To collaborate with the National Council on Skill Development (NCSD), National Skill
Development Co-ordination Board (NSDCB), and National Skill Development Corporation (NSDC)
with the objective of optimizing resources for rapid and sustained skill development among the
people of the Uttarakhand State;
► To co-operate with other departments and educational institutions in the State and/or any part of
the country having objects wholly or partly similar to those of the society by in such manner as
may be conducive to their common object;
► Create and support infrastructure both physical and human for facilitating a pool of resource
persons for skill development in the State;
► Priority shall be accorded to imparting skill development training and upgrading skills of Self Help
Groups active in State;
► To establish Skill Development Cell (SDC) in State capital and Skill Development Training
Centres (SDTCs) in various parts of the State;
► To conduct and support Research and Development in the Skill Development Sector to learn from
innovative and emerging trends globally for improving livelihoods;
► To develop and support projects on Skill Development in traditional as well as sunrise sectors;
► To document and evaluate existing training / skill development and vocational training
programmes and recommend phasing out of out-dated programmes and to introduce new trades;
► To evaluate skills of existing trainers and arrange for upgrading/ re skilling through Training of
Trainers (TOT) programme;
► To organise and support special capacity building programmes for the physically and mentally
challenged persons;
► To sponsor identified persons/ groups, including SHGs, for special capacity building programmes
outside the State in India and abroad;
► To employ persons qualified to perform functions to enable the society to achieve its aims and
objectives;
► To accord a high priority to skill development programmes for weaker section of State as well as
women’s economic development programs;
► To accord priority to skill development and capacity building in new and emerging sunrise sectors;
► To aim at improving livelihoods by enhancing earning capacities through skills development;
► To promote SHGs particularly Women-led SHGs;
► To arrange for dissemination of technical know-how in respect of the industries, trade and
business as necessary;
► To frame the first rules and bye-laws of the Society with the approval of the State Government.
The society may from time to time make new or additional rules or may amend or repeal the rules
with the concurrence of the State Government;
► To take such action incidental, ancillary or conductive to the attainment of the object Stated above
or any other similar object, as per requirement prescribed by the National Council on Skill
Development and the Government of the Uttarakhand.
The functions outlined above are quite elaborate. An institutional mechanism has been created to
operationalise the Society. The structure is as follows:
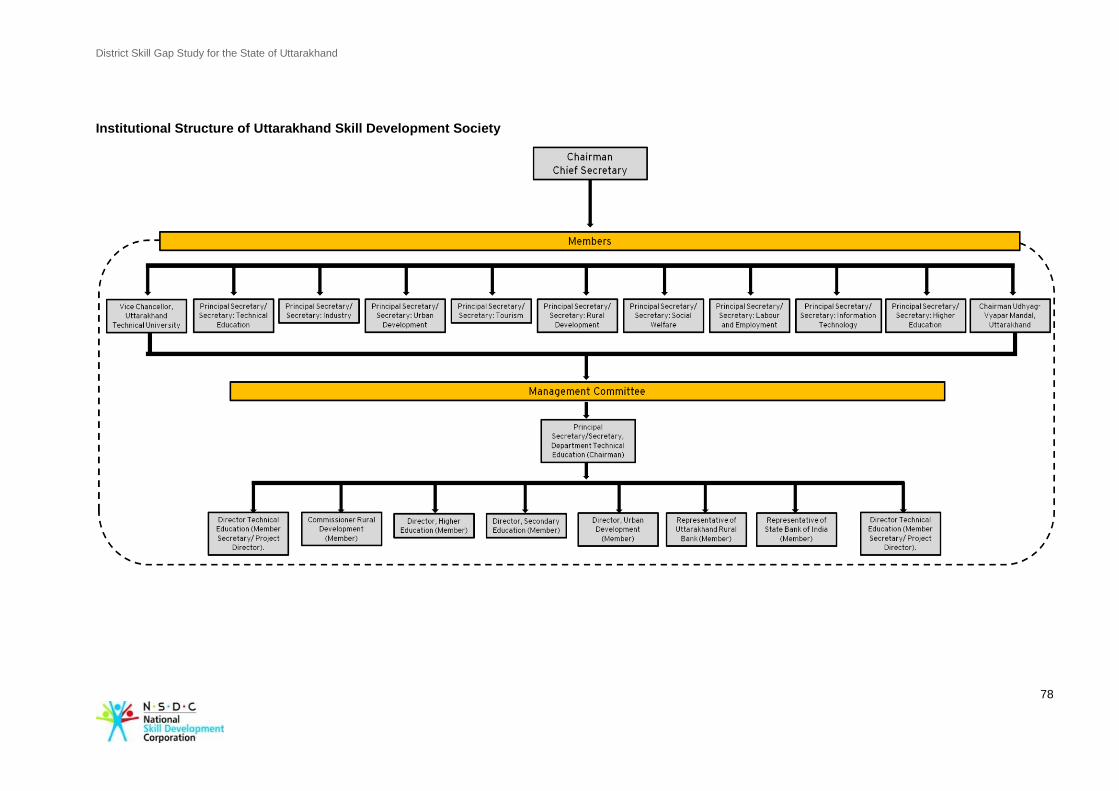
District Skill Gap Study for the State of Uttarakhand
78
Institutional Structure of Uttarakhand Skill Development Society

District Skill Gap Study for the State of Uttarakhand
79
It is quite advantageous that the institutional mechanism to promote skill development in a
comprehensive manner is already in place. As next steps, the following suggestions maybe
considered by the State Government.
1 The core functions of USDS may include the following:
It should be developed as a one stop shop for skill development from where all related
information related to schemes, training providers can be accessed. It will also have a
Labour Management Information System (LMIS) which will provide more specific
information related to availability of skill sets in different Districts.
Develop a five year perspective in developing eco system for skill development based on
existing policies, capacity for skill development and identified gap areas. Follow it up with
annual plans and allocate adequate human and financial resources.
Strengthen partnership among NGOs, private agencies, education institutions, training
providers and NSDC. Also define the expected role of these institutions in the overall
implementation and monitoring of activities;
Bring about convergence between USDS with other State Government Departments and
Authorities working on livelihood and entrepreneurship development;
Quality control of the training imparted by different stakeholders.
2 Programme Design: Skill development should be seen in conjunction with school education and
livelihood promotion. Although the strategies required to strengthen these areas would be
different but these are part of the same continuum, therefore need to work in close coordination
with each other. The programme design should incorporate the following elements :
Pre skill development stage : Awareness creation at the school level, camps for
information dissemination and assessment for aptitude
Create a panel of vocational training providers who can be engaged at a short notice
whenever a need is identified.
Strong linkage with livelihood programme – self-employment, employment and
entrepreneurship.
Employment Exchanges to be revamped so that these become a hub of interaction
between job seekers and job providers; set up information kiosks providing real time
information about availability of jobs, sources from where resources can be mobilized for
self-employment or setting up an enterprise.
Create institutional mechanism at the State as well as District level to roll out the skill
development programme and strengthen the eco system at both levels.
Make use of technology to increase the outreach especially to remote areas and where
there is shortage of faculty.
3 Oversight & monitoring mechanisms:
Identify the information needed at various levels within the society and accordingly design
the Management Information System to capture and consolidate the information. The
quality of available data has scope for improvement. It will help in evidence based
planning.
Create District Level Coordination Units (DLCU) to strengthen the field level ownership,
implementation and monitoring and reporting. Suggested structure of DLCU along with
indicative roles and responsibilities have been provided in the table below:
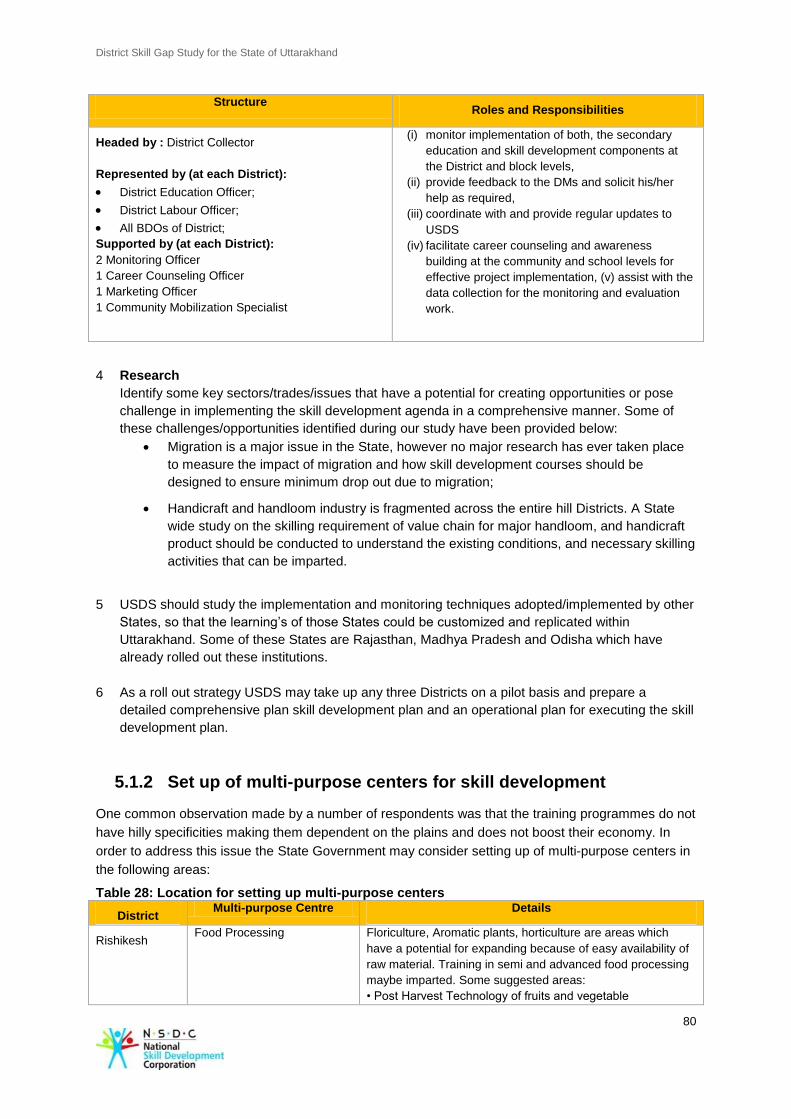
District Skill Gap Study for the State of Uttarakhand
80
Structure Roles and Responsibilities
Headed by : District Collector
Represented by (at each District):
District Education Officer;
District Labour Officer;
All BDOs of District;
Supported by (at each District):
2 Monitoring Officer
1 Career Counseling Officer
1 Marketing Officer
1 Community Mobilization Specialist
(i) monitor implementation of both, the secondary
education and skill development components at
the District and block levels,
(ii) provide feedback to the DMs and solicit his/her
help as required,
(iii) coordinate with and provide regular updates to
USDS
(iv) facilitate career counseling and awareness
building at the community and school levels for
effective project implementation, (v) assist with the
data collection for the monitoring and evaluation
work.
4 Research
Identify some key sectors/trades/issues that have a potential for creating opportunities or pose
challenge in implementing the skill development agenda in a comprehensive manner. Some of
these challenges/opportunities identified during our study have been provided below:
Migration is a major issue in the State, however no major research has ever taken place
to measure the impact of migration and how skill development courses should be
designed to ensure minimum drop out due to migration;
Handicraft and handloom industry is fragmented across the entire hill Districts. A State
wide study on the skilling requirement of value chain for major handloom, and handicraft
product should be conducted to understand the existing conditions, and necessary skilling
activities that can be imparted.
5 USDS should study the implementation and monitoring techniques adopted/implemented by other
States, so that the learning’s of those States could be customized and replicated within
Uttarakhand. Some of these States are Rajasthan, Madhya Pradesh and Odisha which have
already rolled out these institutions.
6 As a roll out strategy USDS may take up any three Districts on a pilot basis and prepare a
detailed comprehensive plan skill development plan and an operational plan for executing the skill
development plan.
5.1.2 Set up of multi-purpose centers for skill development
One common observation made by a number of respondents was that the training programmes do not
have hilly specificities making them dependent on the plains and does not boost their economy. In
order to address this issue the State Government may consider setting up of multi-purpose centers in
the following areas:
Table 28: Location for setting up multi-purpose centers
District Multi-purpose Centre Details
Rishikesh Food Processing Floriculture, Aromatic plants, horticulture are areas which
have a potential for expanding because of easy availability of
raw material. Training in semi and advanced food processing
maybe imparted. Some suggested areas:
• Post Harvest Technology of fruits and vegetable
District Skill Gap Study for the State of Uttarakhand
81
• Techniques of food preservation
• Quality analysis of food products
• Food packaging Labeling
• Food laws and regulations
Sorting and dehydration of medicinal and aromatic herbs.
Almora Handloom and Woolen Women need support to enhance their existing skills in design
development/diversification, use of modern looms, dyeing.
Uttarkashi Tourism/Mountaineering Capacity of the existing Nehru Institute for Mountaineering
should be enhanced so that more youth can receive training
in adventure tourism and other areas where the institute
imparts training and it is very well received.
5.1.3 Giving a boost to the local economy in hilly region
Interactions with various stakeholders revealed that that people in the hilly region largely depend on
the plains and other States for small requirements of daily living. Several such examples were given
of local people having to purchase fodder for animals, confectionery items like bread, biscuits from the
plains. Whenever the weather is bad connectivity the supply of goods is affected. It will go a long way
if the existing schemes are used to provide training is areas like confectionery, hospitality to run
dhabas hygienically, toiletries, packaging material etc. which help them in their daily lives.
In addition a comprehensive training should be offered to the youth for the primary sector. It was
shared that imparting training in animal husbandry has not been too successful since the trained
persons are not able to find employment or adequate returns when they are self-employed. Giving an
integrated training to them in areas like para vets, poly house construction, nursery set up, irrigation
management, rainwater harvesting will increase the employability of youth. This will also be a very
good option for creating employment opportunities for women.
5.2 Training providers
Training providers can play a role by responding to request for training or taking a proactive role by
identifying opportunities for imparting training. Many-a-times training providers find it difficult to source
students usually because courses offered do not take into account their aptitude or lack of
preparedness for the jobs offered subsequent to the training. The training providers need to have a
better connect with the communities to understand what they want and at the same time gradually
gives them exposure to new avenues. Some of these areas in which the training providers can
intervene are as follows:
► Reach out to youth by way of melas/camps for career counseling and guidance to ensure they
have adequate knowledge of the different trades available to him/her based on their education
qualification, growth opportunities within and outside the State to ensure there is minimum training
dropouts;
► Effectively capture and communicate the aspirations of youth groups to the Government so that
need based skill development plans or area specific courses could be developed and
implemented by the Government;
► Develop special up-skilling and behavioral training programs for the existing trainers of the ITIs
and polytechnics. The ex-service men can be a very good resource to be tapped in the State as
faculty at the ITI s and Skill Development Centres;
► While training centres with capacity for large student intake should be developed, keeping in mind
the terrain of the State where large size villages are not very commonly found, opportunities
should be created to increase the outreach of programmes to hamlets and small villages by
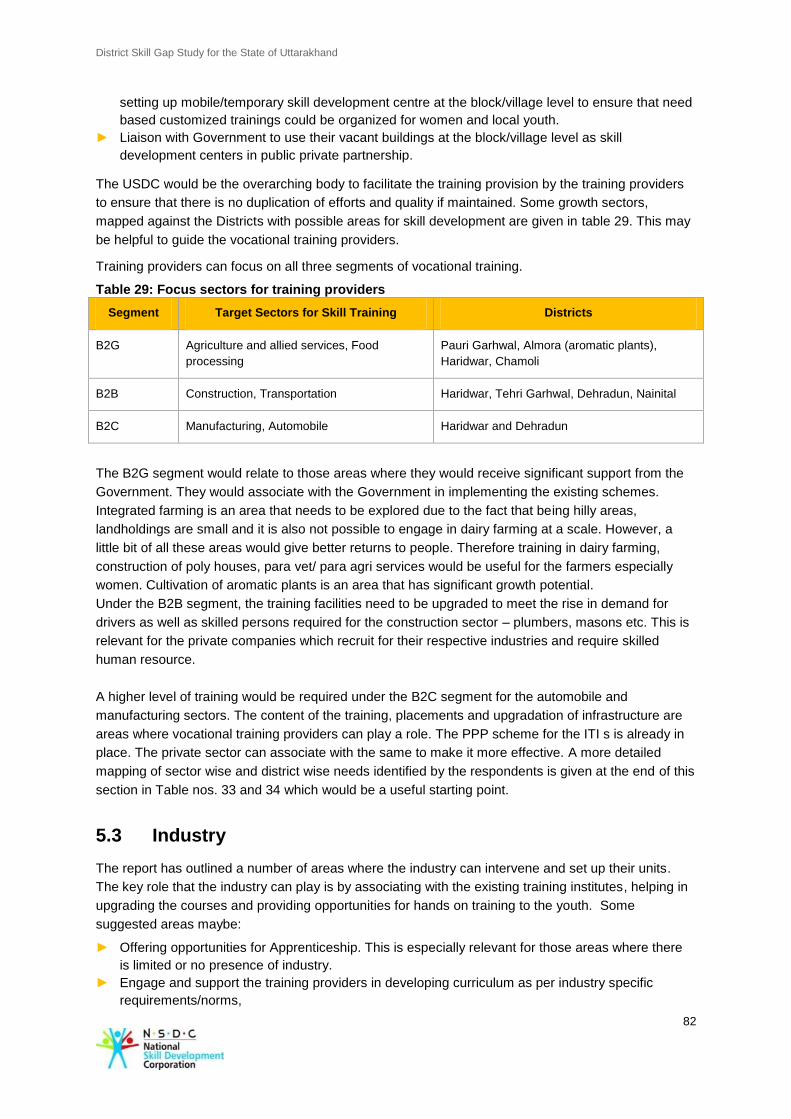
District Skill Gap Study for the State of Uttarakhand
82
setting up mobile/temporary skill development centre at the block/village level to ensure that need
based customized trainings could be organized for women and local youth.
► Liaison with Government to use their vacant buildings at the block/village level as skill
development centers in public private partnership.
The USDC would be the overarching body to facilitate the training provision by the training providers
to ensure that there is no duplication of efforts and quality if maintained. Some growth sectors,
mapped against the Districts with possible areas for skill development are given in table 29. This may
be helpful to guide the vocational training providers.
Training providers can focus on all three segments of vocational training.
Table 29: Focus sectors for training providers
Segment Target Sectors for Skill Training Districts
B2G Agriculture and allied services, Food
processing
Pauri Garhwal, Almora (aromatic plants),
Haridwar, Chamoli
B2B Construction, Transportation Haridwar, Tehri Garhwal, Dehradun, Nainital
B2C Manufacturing, Automobile Haridwar and Dehradun
The B2G segment would relate to those areas where they would receive significant support from the
Government. They would associate with the Government in implementing the existing schemes.
Integrated farming is an area that needs to be explored due to the fact that being hilly areas,
landholdings are small and it is also not possible to engage in dairy farming at a scale. However, a
little bit of all these areas would give better returns to people. Therefore training in dairy farming,
construction of poly houses, para vet/ para agri services would be useful for the farmers especially
women. Cultivation of aromatic plants is an area that has significant growth potential.
Under the B2B segment, the training facilities need to be upgraded to meet the rise in demand for
drivers as well as skilled persons required for the construction sector – plumbers, masons etc. This is
relevant for the private companies which recruit for their respective industries and require skilled
human resource.
A higher level of training would be required under the B2C segment for the automobile and
manufacturing sectors. The content of the training, placements and upgradation of infrastructure are
areas where vocational training providers can play a role. The PPP scheme for the ITI s is already in
place. The private sector can associate with the same to make it more effective. A more detailed
mapping of sector wise and district wise needs identified by the respondents is given at the end of this
section in Table nos. 33 and 34 which would be a useful starting point.
5.3 Industry
The report has outlined a number of areas where the industry can intervene and set up their units.
The key role that the industry can play is by associating with the existing training institutes, helping in
upgrading the courses and providing opportunities for hands on training to the youth. Some
suggested areas maybe:
► Offering opportunities for Apprenticeship. This is especially relevant for those areas where there
is limited or no presence of industry.
► Engage and support the training providers in developing curriculum as per industry specific
requirements/norms,
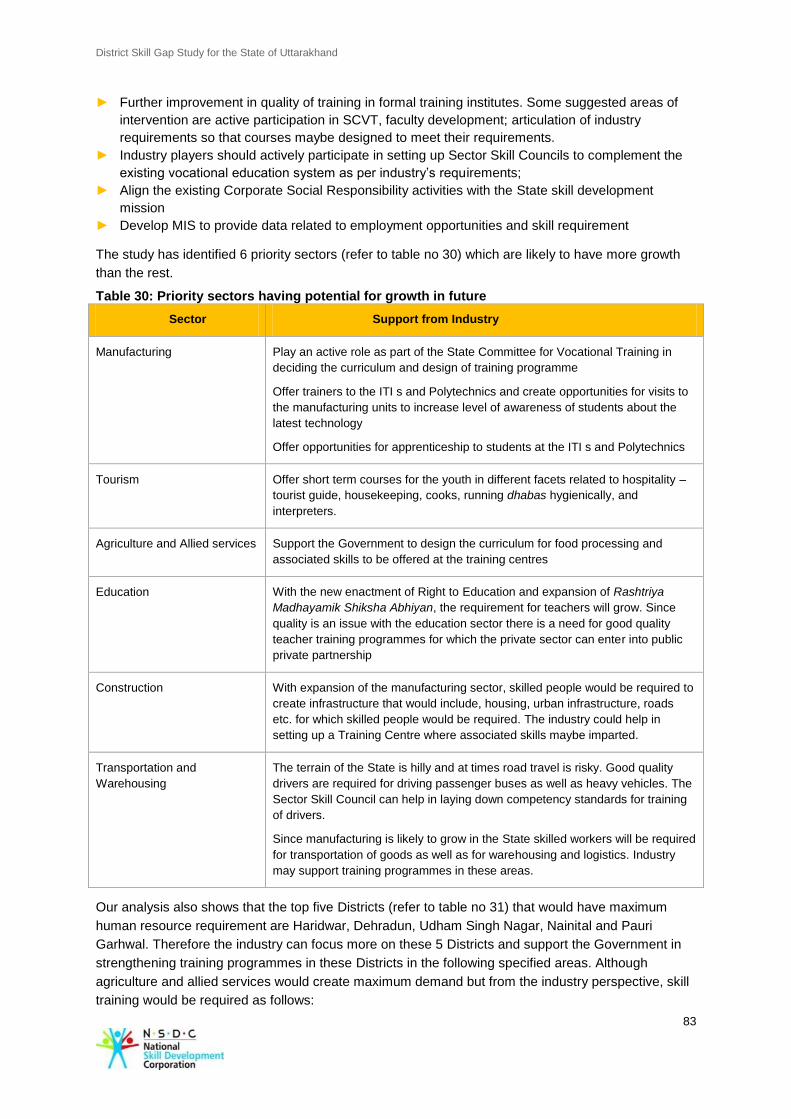
District Skill Gap Study for the State of Uttarakhand
83
► Further improvement in quality of training in formal training institutes. Some suggested areas of
intervention are active participation in SCVT, faculty development; articulation of industry
requirements so that courses maybe designed to meet their requirements.
► Industry players should actively participate in setting up Sector Skill Councils to complement the
existing vocational education system as per industry’s requirements;
► Align the existing Corporate Social Responsibility activities with the State skill development
mission
► Develop MIS to provide data related to employment opportunities and skill requirement
The study has identified 6 priority sectors (refer to table no 30) which are likely to have more growth
than the rest.
Table 30: Priority sectors having potential for growth in future
Sector Support from Industry
Manufacturing Play an active role as part of the State Committee for Vocational Training in
deciding the curriculum and design of training programme
Offer trainers to the ITI s and Polytechnics and create opportunities for visits to
the manufacturing units to increase level of awareness of students about the
latest technology
Offer opportunities for apprenticeship to students at the ITI s and Polytechnics
Tourism Offer short term courses for the youth in different facets related to hospitality –
tourist guide, housekeeping, cooks, running dhabas hygienically, and
interpreters.
Agriculture and Allied services Support the Government to design the curriculum for food processing and
associated skills to be offered at the training centres
Education With the new enactment of Right to Education and expansion of Rashtriya
Madhayamik Shiksha Abhiyan, the requirement for teachers will grow. Since
quality is an issue with the education sector there is a need for good quality
teacher training programmes for which the private sector can enter into public
private partnership
Construction With expansion of the manufacturing sector, skilled people would be required to
create infrastructure that would include, housing, urban infrastructure, roads
etc. for which skilled people would be required. The industry could help in
setting up a Training Centre where associated skills maybe imparted.
Transportation and
Warehousing
The terrain of the State is hilly and at times road travel is risky. Good quality
drivers are required for driving passenger buses as well as heavy vehicles. The
Sector Skill Council can help in laying down competency standards for training
of drivers.
Since manufacturing is likely to grow in the State skilled workers will be required
for transportation of goods as well as for warehousing and logistics. Industry
may support training programmes in these areas.
Our analysis also shows that the top five Districts (refer to table no 31) that would have maximum
human resource requirement are Haridwar, Dehradun, Udham Singh Nagar, Nainital and Pauri
Garhwal. Therefore the industry can focus more on these 5 Districts and support the Government in
strengthening training programmes in these Districts in the following specified areas. Although
agriculture and allied services would create maximum demand but from the industry perspective, skill
training would be required as follows:
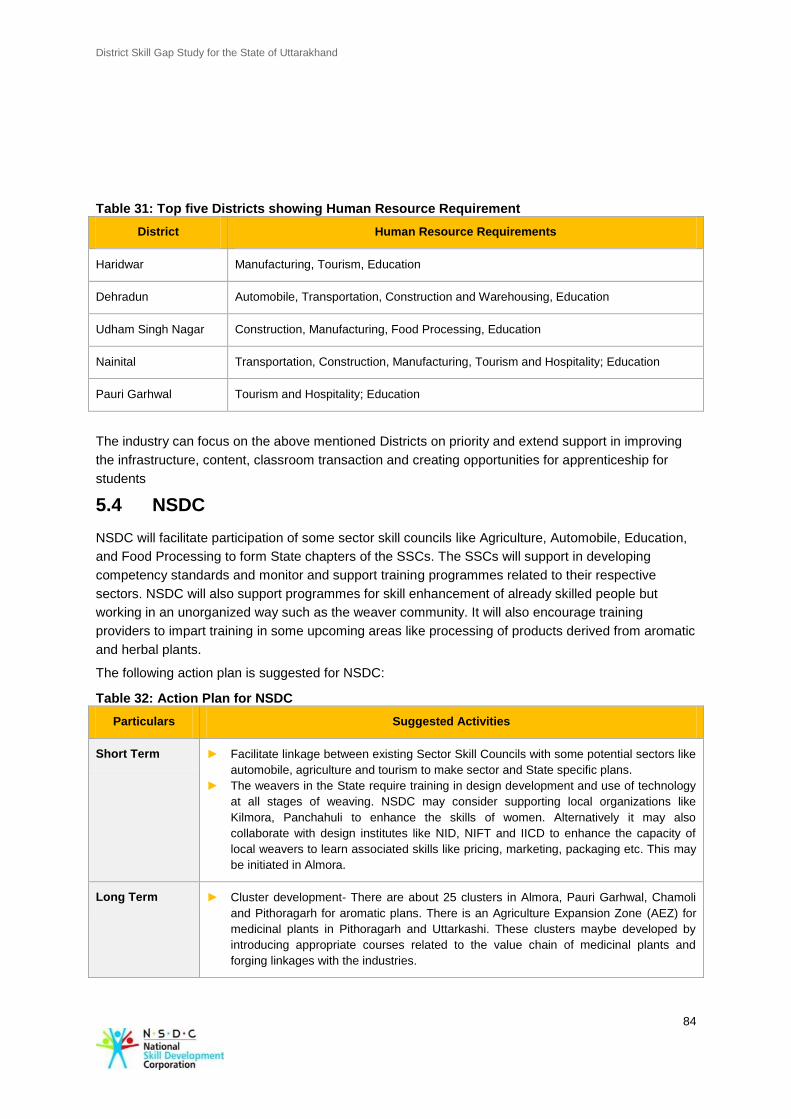
District Skill Gap Study for the State of Uttarakhand
84
Table 31: Top five Districts showing Human Resource Requirement
District Human Resource Requirements
Haridwar Manufacturing, Tourism, Education
Dehradun Automobile, Transportation, Construction and Warehousing, Education
Udham Singh Nagar Construction, Manufacturing, Food Processing, Education
Nainital Transportation, Construction, Manufacturing, Tourism and Hospitality; Education
Pauri Garhwal Tourism and Hospitality; Education
The industry can focus on the above mentioned Districts on priority and extend support in improving
the infrastructure, content, classroom transaction and creating opportunities for apprenticeship for
students
5.4 NSDC
NSDC will facilitate participation of some sector skill councils like Agriculture, Automobile, Education,
and Food Processing to form State chapters of the SSCs. The SSCs will support in developing
competency standards and monitor and support training programmes related to their respective
sectors. NSDC will also support programmes for skill enhancement of already skilled people but
working in an unorganized way such as the weaver community. It will also encourage training
providers to impart training in some upcoming areas like processing of products derived from aromatic
and herbal plants.
The following action plan is suggested for NSDC:
Table 32: Action Plan for NSDC
Particulars Suggested Activities
Short Term ► Facilitate linkage between existing Sector Skill Councils with some potential sectors like
automobile, agriculture and tourism to make sector and State specific plans.
► The weavers in the State require training in design development and use of technology
at all stages of weaving. NSDC may consider supporting local organizations like
Kilmora, Panchahuli to enhance the skills of women. Alternatively it may also
collaborate with design institutes like NID, NIFT and IICD to enhance the capacity of
local weavers to learn associated skills like pricing, marketing, packaging etc. This may
be initiated in Almora.
Long Term ► Cluster development- There are about 25 clusters in Almora, Pauri Garhwal, Chamoli
and Pithoragarh for aromatic plans. There is an Agriculture Expansion Zone (AEZ) for
medicinal plants in Pithoragarh and Uttarkashi. These clusters maybe developed by
introducing appropriate courses related to the value chain of medicinal plants and
forging linkages with the industries.
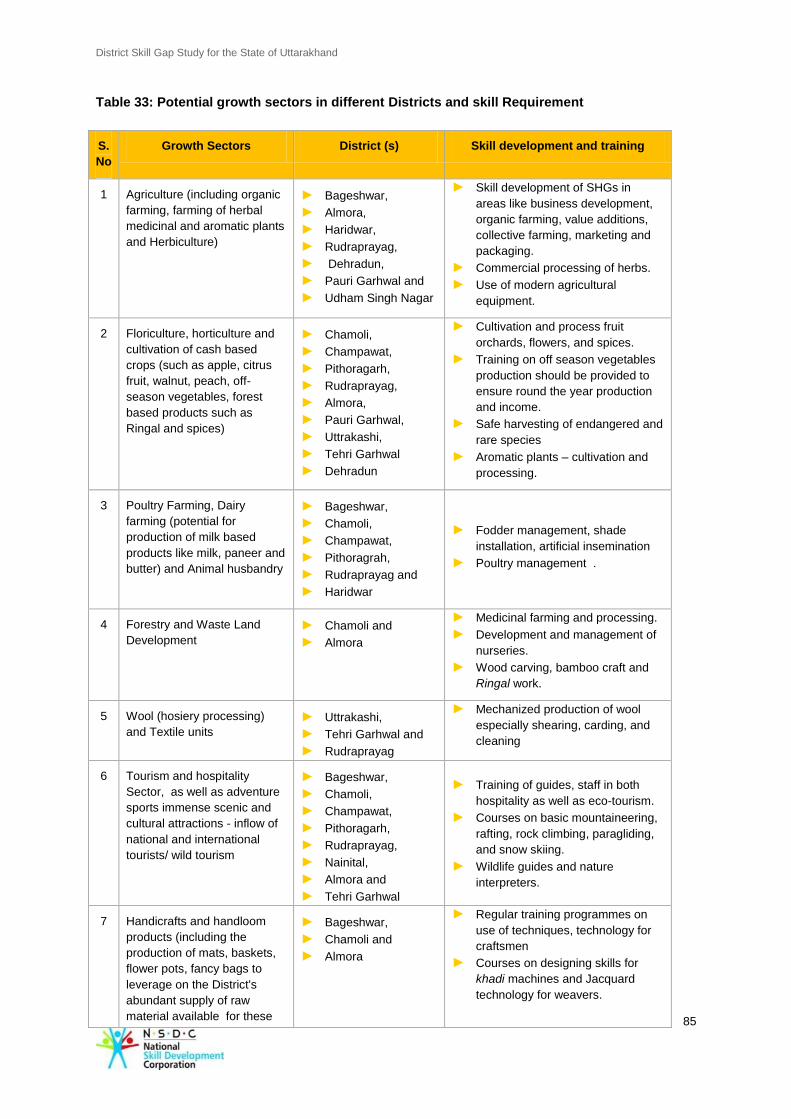
District Skill Gap Study for the State of Uttarakhand
85
Table 33: Potential growth sectors in different Districts and skill Requirement
S.
No
Growth Sectors District (s) Skill development and training
1 Agriculture (including organic
farming, farming of herbal
medicinal and aromatic plants
and Herbiculture)
► Bageshwar,
► Almora,
► Haridwar,
► Rudraprayag,
► Dehradun,
► Pauri Garhwal and
► Udham Singh Nagar
► Skill development of SHGs in
areas like business development,
organic farming, value additions,
collective farming, marketing and
packaging.
► Commercial processing of herbs.
► Use of modern agricultural
equipment.
2 Floriculture, horticulture and
cultivation of cash based
crops (such as apple, citrus
fruit, walnut, peach, off-
season vegetables, forest
based products such as
Ringal and spices)
► Chamoli,
► Champawat,
► Pithoragarh,
► Rudraprayag,
► Almora,
► Pauri Garhwal,
► Uttrakashi,
► Tehri Garhwal
► Dehradun
► Cultivation and process fruit
orchards, flowers, and spices.
► Training on off season vegetables
production should be provided to
ensure round the year production
and income.
► Safe harvesting of endangered and
rare species
► Aromatic plants – cultivation and
processing.
3 Poultry Farming, Dairy
farming (potential for
production of milk based
products like milk, paneer and
butter) and Animal husbandry
► Bageshwar,
► Chamoli,
► Champawat,
► Pithoragrah,
► Rudraprayag and
► Haridwar
► Fodder management, shade
installation, artificial insemination
► Poultry management .
4 Forestry and Waste Land
Development
► Chamoli and
► Almora
► Medicinal farming and processing.
► Development and management of
nurseries.
► Wood carving, bamboo craft and
Ringal work.
5 Wool (hosiery processing)
and Textile units
► Uttrakashi,
► Tehri Garhwal and
► Rudraprayag
► Mechanized production of wool
especially shearing, carding, and
cleaning
6 Tourism and hospitality
Sector, as well as adventure
sports immense scenic and
cultural attractions - inflow of
national and international
tourists/ wild tourism
► Bageshwar,
► Chamoli,
► Champawat,
► Pithoragarh,
► Rudraprayag,
► Nainital,
► Almora and
► Tehri Garhwal
► Training of guides, staff in both
hospitality as well as eco-tourism.
► Courses on basic mountaineering,
rafting, rock climbing, paragliding,
and snow skiing.
► Wildlife guides and nature
interpreters.
7 Handicrafts and handloom
products (including the
production of mats, baskets,
flower pots, fancy bags to
leverage on the District's
abundant supply of raw
material available for these
► Bageshwar,
► Chamoli and
► Almora
► Regular training programmes on
use of techniques, technology for
craftsmen
► Courses on designing skills for
khadi machines and Jacquard
technology for weavers.
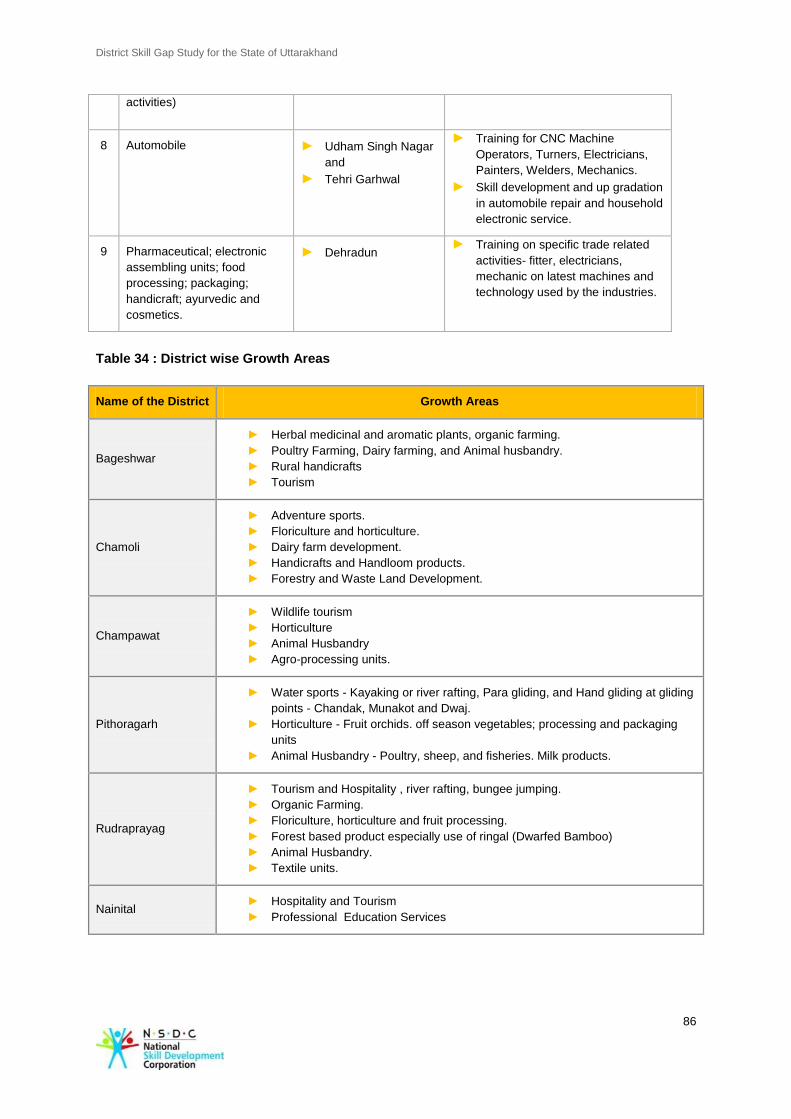
District Skill Gap Study for the State of Uttarakhand
86
Table 34 : District wise Growth Areas
Name of the District Growth Areas
Bageshwar
► Herbal medicinal and aromatic plants, organic farming.
► Poultry Farming, Dairy farming, and Animal husbandry.
► Rural handicrafts
► Tourism
Chamoli
► Adventure sports.
► Floriculture and horticulture.
► Dairy farm development.
► Handicrafts and Handloom products.
► Forestry and Waste Land Development.
Champawat
► Wildlife tourism
► Horticulture
► Animal Husbandry
► Agro-processing units.
Pithoragarh
► Water sports - Kayaking or river rafting, Para gliding, and Hand gliding at gliding
points - Chandak, Munakot and Dwaj.
► Horticulture - Fruit orchids. off season vegetables; processing and packaging
units
► Animal Husbandry - Poultry, sheep, and fisheries. Milk products.
Rudraprayag
► Tourism and Hospitality , river rafting, bungee jumping.
► Organic Farming.
► Floriculture, horticulture and fruit processing.
► Forest based product especially use of ringal (Dwarfed Bamboo)
► Animal Husbandry.
► Textile units.
Nainital ► Hospitality and Tourism
► Professional Education Services
activities)
8 Automobile ► Udham Singh Nagar
and
► Tehri Garhwal
► Training for CNC Machine
Operators, Turners, Electricians,
Painters, Welders, Mechanics.
► Skill development and up gradation
in automobile repair and household
electronic service.
9 Pharmaceutical; electronic
assembling units; food
processing; packaging;
handicraft; ayurvedic and
cosmetics.
► Dehradun ► Training on specific trade related
activities- fitter, electricians,
mechanic on latest machines and
technology used by the industries.
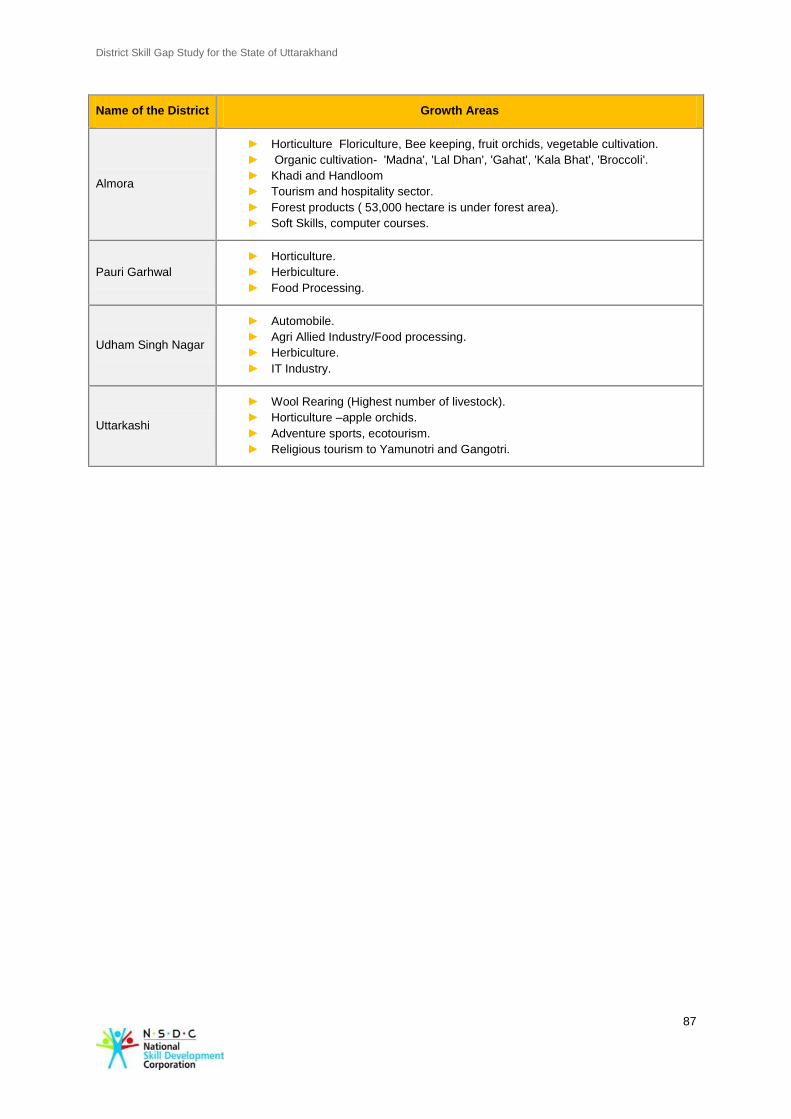
District Skill Gap Study for the State of Uttarakhand
87
Name of the District Growth Areas
Almora
► Horticulture Floriculture, Bee keeping, fruit orchids, vegetable cultivation.
► Organic cultivation- 'Madna', 'Lal Dhan', 'Gahat', 'Kala Bhat', 'Broccoli'.
► Khadi and Handloom
► Tourism and hospitality sector.
► Forest products ( 53,000 hectare is under forest area).
► Soft Skills, computer courses.
Pauri Garhwal
► Horticulture.
► Herbiculture.
► Food Processing.
Udham Singh Nagar
► Automobile.
► Agri Allied Industry/Food processing.
► Herbiculture.
► IT Industry.
Uttarkashi
► Wool Rearing (Highest number of livestock).
► Horticulture –apple orchids.
► Adventure sports, ecotourism.
► Religious tourism to Yamunotri and Gangotri.
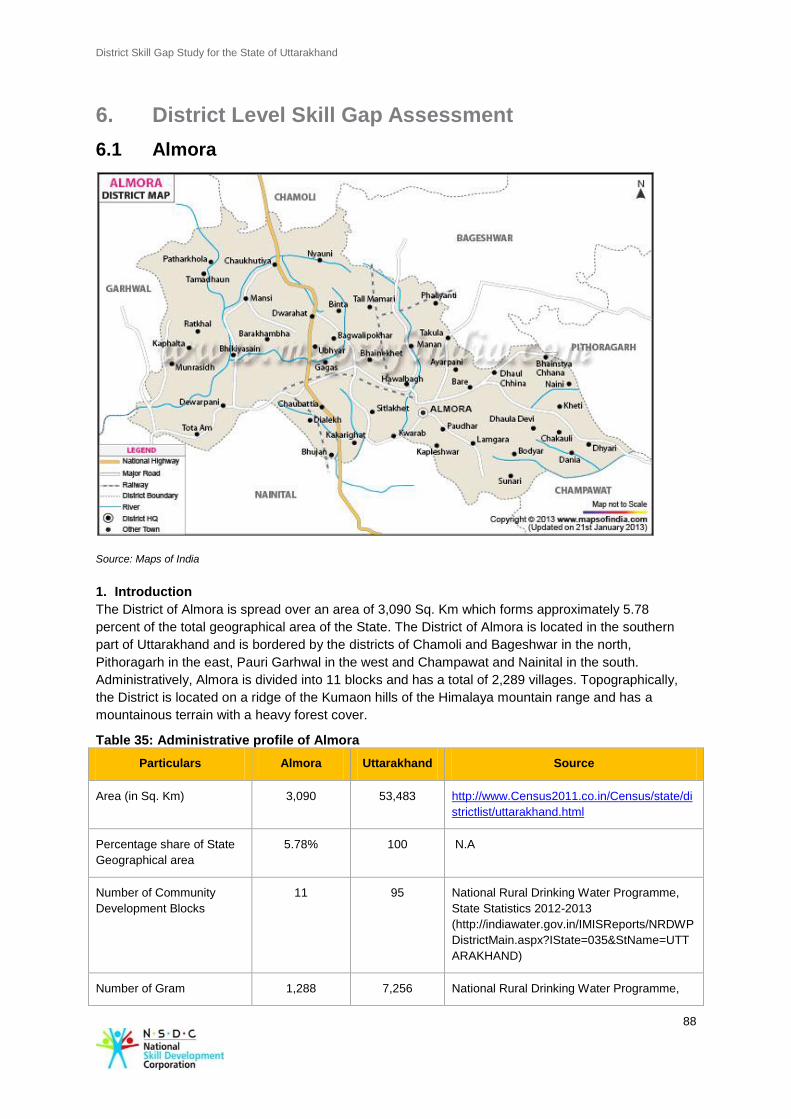
District Skill Gap Study for the State of Uttarakhand
88
6. District Level Skill Gap Assessment
6.1 Almora
Source: Maps of India
1. Introduction
The District of Almora is spread over an area of 3,090 Sq. Km which forms approximately 5.78
percent of the total geographical area of the State. The District of Almora is located in the southern
part of Uttarakhand and is bordered by the districts of Chamoli and Bageshwar in the north,
Pithoragarh in the east, Pauri Garhwal in the west and Champawat and Nainital in the south.
Administratively, Almora is divided into 11 blocks and has a total of 2,289 villages. Topographically,
the District is located on a ridge of the Kumaon hills of the Himalaya mountain range and has a
mountainous terrain with a heavy forest cover.
Table 35: Administrative profile of Almora
Particulars Almora Uttarakhand Source
Area (in Sq. Km) 3,090 53,483 http://www.Census2011.co.in/Census/state/di
strictlist/uttarakhand.html
Percentage share of State
Geographical area
5.78% 100 N.A
Number of Community
Development Blocks
11 95 National Rural Drinking Water Programme,
State Statistics 2012-2013
(http://indiawater.gov.in/IMISReports/NRDWP
DistrictMain.aspx?IState=035&StName=UTT
ARAKHAND)
Number of Gram 1,288 7,256 National Rural Drinking Water Programme,
District Skill Gap Study for the State of Uttarakhand
89
Particulars Almora Uttarakhand Source
Panchayats State Statistics 2012-2013
(http://indiawater.gov.in/IMISReports/NRDWP
DistrictMain.aspx?IState=035&StName=UTT
ARAKHAND)
Total number of inhabited
villages
2,289 16,793 http://www.Censusindia.gov.in/2011-prov-
results/paper2/data_files/uttrakhand/8-
adminunit-60-61.pdf
2. Demography
Almora is home to 6.15 percent of the total population of the State and with its 6.22 Lakh inhabitants,
it is the sixth most populated District of the State. Almora has witnessed the lowest decadal growth
rate in population in the entire State, decreasing by 1.73 percent (2011). Approximately, 89.98 percent
of the population lives in rural areas. According to Census 2001, the socially backward classes such
as Scheduled Caste (‘SC’) and Scheduled Tribes (’ST’) represent 22.23 percent and 0.34 percent of
the District population respectively.
According to Census 2001, the sex ratio in Almora was favorable at 1,145 females per 1,000 males.
However, as per Census 2011 (provisional data) there has been a marginal drop in the sex ratio from
1,145 to 1,142, which is still much higher than the State’s sex ratio of 963 and India’s sex ratio of 940.
As per Census 2011 (provisional data), Almora has a total population of 621,927 of which males and
females were 290,414 and 331,513 respectively. There has been a decrement of 1.37 percent in the
total population compared to the population as per Census 2001 that stood at 294,984 for males and
37,882 for females. The Census 2011 (provisional data) suggests a population density of 198 in 2011
making Almora the fifth most densely populated District of Uttarakhand.
Table 36: Socio economic indicators for Almora
Population Almora Uttarakhand Source
Total population (in Lakh) 6.22 101.17 Census 2011 (provisional data)
Total population (Male) (in Lakh) 2.90 51.54 Census 2011 (provisional data)
Total population (Female) (in Lakh) 3.32 49.63 Census 2011 (provisional data)
District share in State's population 6.15%
N.A N.A
Density of population 198 189 Census 2011 (provisional data)
Decadal growth of population (2001-
2011) -1.73% 19.17% Census 2011 (provisional data)
Percentage of urban population 10.02% 30.55% Census 2011 (provisional data)
Scheduled Caste population percentage
of State population 22.23% 17.90% Census 2001
Schedule Tribe population percentage of
State population 0. 34% 3% Census 2001
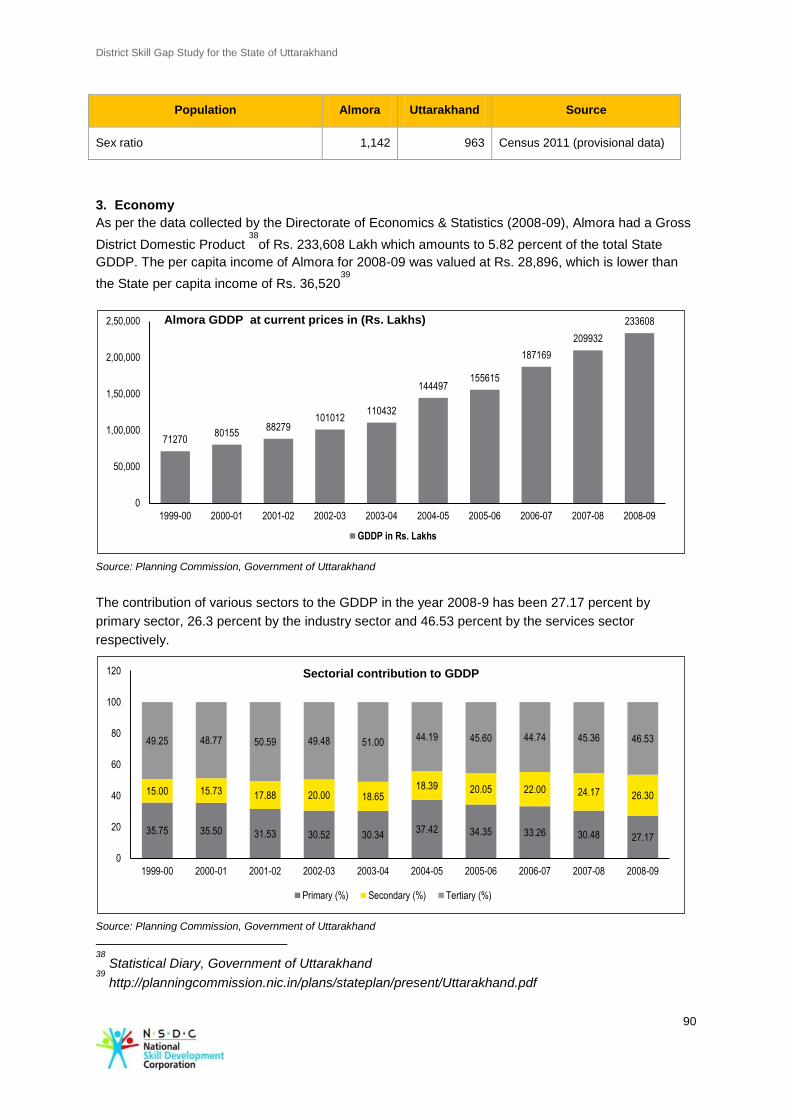
District Skill Gap Study for the State of Uttarakhand
90
Population Almora Uttarakhand Source
Sex ratio 1,142 963 Census 2011 (provisional data)
3. Economy
As per the data collected by the Directorate of Economics & Statistics (2008-09), Almora had a Gross
District Domestic Product 38
of Rs. 233,608 Lakh which amounts to 5.82 percent of the total State
GDDP. The per capita income of Almora for 2008-09 was valued at Rs. 28,896, which is lower than
the State per capita income of Rs. 36,52039
Source: Planning Commission, Government of Uttarakhand
The contribution of various sectors to the GDDP in the year 2008-9 has been 27.17 percent by
primary sector, 26.3 percent by the industry sector and 46.53 percent by the services sector
respectively.
Source: Planning Commission, Government of Uttarakhand
38
Statistical Diary, Government of Uttarakhand 39
http://planningcommission.nic.in/plans/stateplan/present/Uttarakhand.pdf
35.75 35.50 31.53 30.52 30.34 37.42 34.35 33.26 30.48 27.17
15.00 15.73 17.88 20.00 18.65 18.39 20.05 22.00 24.17 26.30
49.25 48.77 50.59 49.48 51.00 44.19 45.60 44.74 45.36 46.53
0
20
40
60
80
100
120
1999-00 2000-01 2001-02 2002-03 2003-04 2004-05 2005-06 2006-07 2007-08 2008-09
Sectorial contribution to GDDP
Primary (%) Secondary (%) Tertiary (%)
71270 80155
88279 101012
110432
144497 155615
187169
209932
233608
0
50,000
1,00,000
1,50,000
2,00,000
2,50,000
1999-00 2000-01 2001-02 2002-03 2003-04 2004-05 2005-06 2006-07 2007-08 2008-09
Almora GDDP at current prices in (Rs. Lakhs)
GDDP in Rs. Lakhs
District Skill Gap Study for the State of Uttarakhand
91
Primary Sector
Agriculture is the primary source of livelihood for people in the District; however, as cultivable land is
less, agriculture is majorly undertaken for sustenance. Currently, out of the total geographical land
area of 3,139 square kilometers only 17.11 percent of land is cultivable land. The net sown area in the
District is 79,540 hectares. In the upper slopes, grains like millets and mandua are mostly cultivated
while in the lower slopes wheat is the primary crop with a gross cropped area of 40,367 hectares.
Apart from wheat, other major crops include mandua, rice, pulses and millets with a total cultivated
area of 37,204, 17,970, 6,270 and 17,312 hectares respectively. In addition, Almora has 993 hectares
of land under cultivation for oilseeds.
The topography and weather of Almora were noted to be highly conducive for horticulture and allied
activities as a large land area of the District is sloping. Tarikhet, Dwarhat, Chaukhutia, Sult, Syaldey
and Bhikiasen blocks of the District, are particularly suitable for the cultivation of mangoes, lemons
and bananas. Areas 1,200 meters above sea level are also highly suitable for growing winter fruits like
apples, pears, plums, walnuts, apricots, almonds; seasonal vegetables and medicinal plants.
Secondary Sector
Almora is connected by road to important cities such as Delhi, Lucknow, and Nainital etc. through a
good network of State Highway. The District however does not have railway connectivity. It also has
easy access to water sources through rivers Koshi and Sayal.
However, given the decrease in agricultural productivity in the District and high migration of youth, a
high potential was seen in the development of small and cottage industries sector. The main industrial
activities in this District include wool-based products, flour mills, screen printing, copper products,
ready-made garments, hosiery products and mat-making; among others.
Tertiary Sector
In the District of Almora, tourism facilities, allied activities and services have a great scope. Within the
tertiary sector services like; hotels/ motels, roadside dhabas, mobile recharge services, cyber cafes,
milk parlours, small road transport services (Bus/Taxis), motor garage, tyre retreading, small shops,
tour guides and meditation centres etc. are present. Tourism is dependent on such service oriented
sector that employs a large number of people. The District is known for religious tourism, eco-tourism
and adventure tourism. However, there is a lack of fundamental services related to tourism such as
quality restaurants, fast-food centres, motor workshops, and souvenir shops etc.
As a part of its endeavor to promote tourism in the State, the Government of Uttarakhand has initiated
the Veer Chandra Singh Garhwal Self-Employment Scheme wherein unemployed youth are provided
loans for tourism related service provision.
4. Workforce distribution
The total population of Almora in 2012 was 6.20 Lakhs which is expected to reduce to 6.15 Lakhs by
2017 and further reduce to 6.10 Lakhs by 2022. As per our research methodology, the incremental
manpower supply will be about 1.77 Lakhs by 2022.
Table 37: Estimated workforce distribution in Almora
Year 2012 2017 2022
Total population 6,20,844 6,15,455 6,10,112
Working age population 3,85,272 4,09,405 4,35,049
Labour force 2,40,769 3,21,100 4,18,429
District Skill Gap Study for the State of Uttarakhand
92
Work force 2,34,108 3,08,621 4,06,852
Incremental Manpower supply
80,331 177,659
As per the table 38 below, incremental demand for human resource in 2022 for top five sectors would
be in Agriculture (0.21 Lakhs), Education and Skill Development (0.18 Lakhs), Food Processing (0.15
Lakhs), Tourism, travel, hospitality & trade (0.09 Lakhs), and Building, Construction & Real Estate
Services (0.07 Lakhs). The demand for semi-skilled and skilled manpower by 2017 would be 0.05
Lakhs, and 0.13 Lakhs. Similar demand for semi-skilled and skilled manpower by 2022 is expected to
be 0.07 Lakhs, and 0.19 Lakhs. Table 38: Incremental Human Resource Demand in Almora
Sector Total
Incremental demand: 2012-2017 Incremental demand 2017-
2022
Minimally
skilled
Semi-
skilled Skilled
Minimal
ly
skilled
Semi-
skilled Skilled
Agriculture 21,051 7,200 2,057 1,029 7,536 2,153 1,077
Food processing 15,037 4,459 - 1,115 7,571 - 1,893
Metal and Mining - - - - - - -
Manufacturing 3,751 863 327 486 1,069 405 602
Electricity, Gas and
Water 149 50 22 - 52 24 -
Building, Construction &
Real Estate Services 7,731 2,733 540 101 3,529 697 131
Auto & Auto Components 438 59 78 46 82 108 63
Tourism, travel,
hospitality & trade 9964 1500 1053 1276 2209 1901 2024
Transportation, logistics,
warehousing &
packaging
5,828 1,441 647 - 2,581 1,160 -
Postal and
communication 1,627 - 188 507 - 252 681
Banking, Financial
Services & Insurance 966 - 117 315 - 144 390
Real estate and Banking
services 931 348 69 13 406 80 15
Public administration 1,224 125 399 65 134 430 70
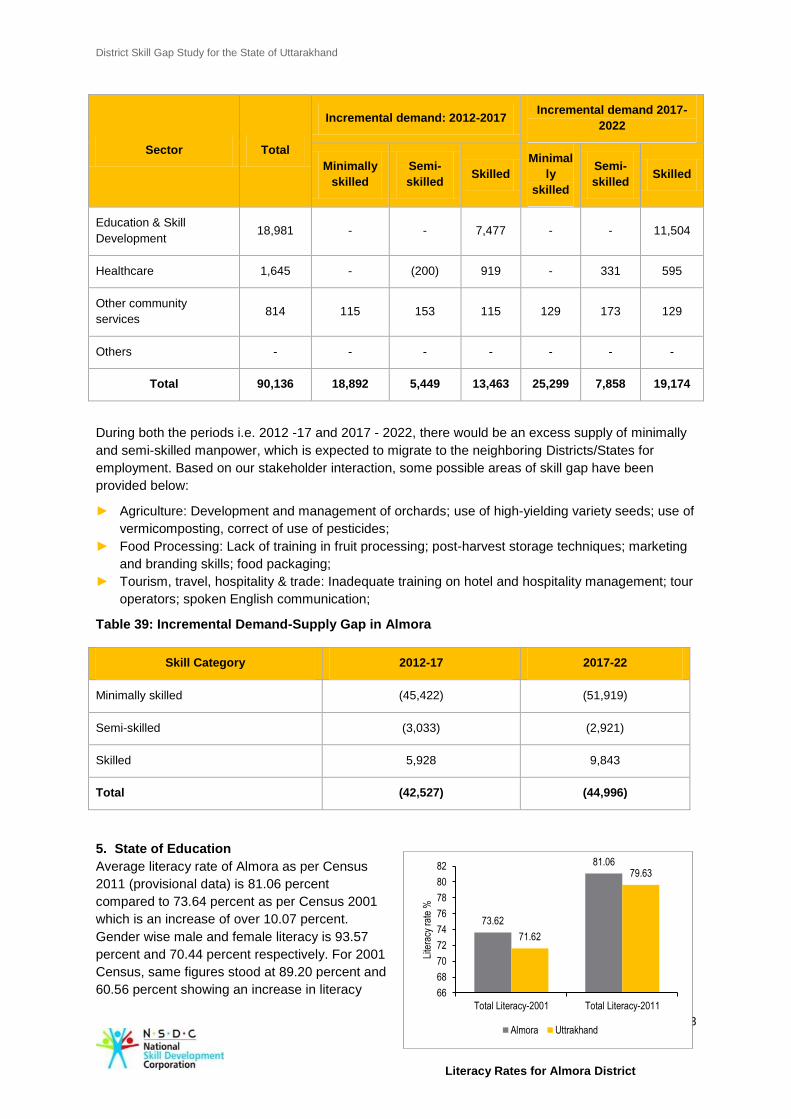
District Skill Gap Study for the State of Uttarakhand
93
Literacy Rates for Almora District
Sector Total
Incremental demand: 2012-2017 Incremental demand 2017-
2022
Minimally
skilled
Semi-
skilled Skilled
Minimal
ly
skilled
Semi-
skilled Skilled
Education & Skill
Development 18,981 - - 7,477 - - 11,504
Healthcare 1,645 - (200) 919 - 331 595
Other community
services 814 115 153 115 129 173 129
Others - - - - - - -
Total 90,136 18,892 5,449 13,463 25,299 7,858 19,174
During both the periods i.e. 2012 -17 and 2017 - 2022, there would be an excess supply of minimally
and semi-skilled manpower, which is expected to migrate to the neighboring Districts/States for
employment. Based on our stakeholder interaction, some possible areas of skill gap have been
provided below:
► Agriculture: Development and management of orchards; use of high-yielding variety seeds; use of
vermicomposting, correct of use of pesticides;
► Food Processing: Lack of training in fruit processing; post-harvest storage techniques; marketing
and branding skills; food packaging;
► Tourism, travel, hospitality & trade: Inadequate training on hotel and hospitality management; tour
operators; spoken English communication;
Table 39: Incremental Demand-Supply Gap in Almora
Skill Category 2012-17 2017-22
Minimally skilled (45,422) (51,919)
Semi-skilled (3,033) (2,921)
Skilled 5,928 9,843
Total (42,527) (44,996)
5. State of Education
Average literacy rate of Almora as per Census
2011 (provisional data) is 81.06 percent
compared to 73.64 percent as per Census 2001
which is an increase of over 10.07 percent.
Gender wise male and female literacy is 93.57
percent and 70.44 percent respectively. For 2001
Census, same figures stood at 89.20 percent and
60.56 percent showing an increase in literacy
73.62
81.06
71.62
79.63
66
68
70
72
74
76
78
80
82
Total Literacy-2001 Total Literacy-2011
Lite
racy
rat
e %
Almora Uttrakhand
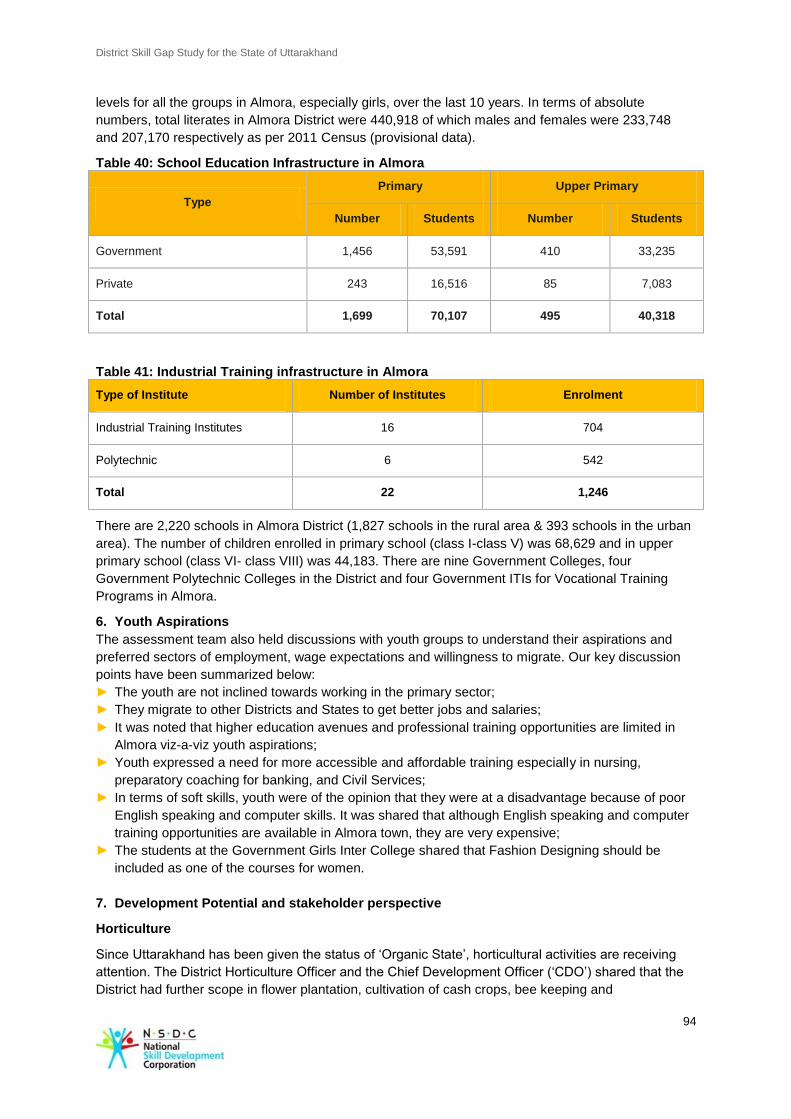
District Skill Gap Study for the State of Uttarakhand
94
levels for all the groups in Almora, especially girls, over the last 10 years. In terms of absolute
numbers, total literates in Almora District were 440,918 of which males and females were 233,748
and 207,170 respectively as per 2011 Census (provisional data).
Table 40: School Education Infrastructure in Almora
Type
Primary Upper Primary
Number Students Number Students
Government 1,456 53,591 410 33,235
Private 243 16,516 85 7,083
Total 1,699 70,107 495 40,318
Table 41: Industrial Training infrastructure in Almora
Type of Institute Number of Institutes Enrolment
Industrial Training Institutes 16 704
Polytechnic 6 542
Total 22 1,246
There are 2,220 schools in Almora District (1,827 schools in the rural area & 393 schools in the urban
area). The number of children enrolled in primary school (class I-class V) was 68,629 and in upper
primary school (class VI- class VIII) was 44,183. There are nine Government Colleges, four
Government Polytechnic Colleges in the District and four Government ITIs for Vocational Training
Programs in Almora.
6. Youth Aspirations
The assessment team also held discussions with youth groups to understand their aspirations and
preferred sectors of employment, wage expectations and willingness to migrate. Our key discussion
points have been summarized below:
► The youth are not inclined towards working in the primary sector;
► They migrate to other Districts and States to get better jobs and salaries;
► It was noted that higher education avenues and professional training opportunities are limited in
Almora viz-a-viz youth aspirations;
► Youth expressed a need for more accessible and affordable training especially in nursing,
preparatory coaching for banking, and Civil Services;
► In terms of soft skills, youth were of the opinion that they were at a disadvantage because of poor
English speaking and computer skills. It was shared that although English speaking and computer
training opportunities are available in Almora town, they are very expensive;
► The students at the Government Girls Inter College shared that Fashion Designing should be
included as one of the courses for women.
7. Development Potential and stakeholder perspective
Horticulture
Since Uttarakhand has been given the status of ‘Organic State’, horticultural activities are receiving
attention. The District Horticulture Officer and the Chief Development Officer (‘CDO’) shared that the
District had further scope in flower plantation, cultivation of cash crops, bee keeping and
District Skill Gap Study for the State of Uttarakhand
95
fruits/vegetable plantation. While the department is working on the promotion of these potential
opportunities, challenges were felt in the protection of horticultural produce. Trainings imparted by the
Krishi Vigyan Kendras and Pant University have not been very successful because of insufficient
number of trainers and disinterest among the youth.
Destruction of plantations by wild animals including monkeys and pigs was reportedly very common.
Due to the loss caused, people were hesitant in investing in such plantations. It was envisaged that
the horticulture sector could gain momentum if trainings and thrust is given to off-season vegetable
production. For this, training in poly-house production of vegetables is necessary. Also, value addition
through food processing is considered crucial. Currently there are no food processing units in the
District. Trainings for food processing and packaging along with those in growing/protecting
horticulture crops is requisite for tapping the benefits from this sector. For an increase in horticultural
productivity, trainings in scientific management of orchards are also needed40
.
Agriculture
Across the District of Almora, almost 72 percent of the population largely depends on agriculture for
their livelihood41.
The main agricultural produce in the District is rice, wheat, maize, millets, lentils and
soya bean. Improvement in irrigation facilities, use of modern technology, improvement of water
conservation and irrigation infrastructure, use of high-yielding variety seeds, use of vermicomposting,
correct of use of pesticides and lastly a commercial approach to agriculture; was noted to be
imperative for improving the agricultural productivity in the District.
The District had high scope for organic cultivation- especially of popular local products like 'Madna',
'Lal Dhan', 'Gahat', 'Kala Bhat', and 'Broccoli'. Three blocks in the District were renowned for spices.
The officers felt that the District could benefit greatly through investment in these organic products
especially given the recent popularity of organic food and the promotion of Uttarakhand state as
organically producing State. The Department of Agriculture places emphasis on bio-composting for
organic cultivation and currently 1,810 hectares of land was under such cultivation. The Department
has plans to expand this to 4,000 additional hectares.
Migration of the youth is high in the District which is a deterrent in introducing new cultivation
technologies in agriculture. Also, farmers have small and scattered land holdings where it is difficult to
achieve economies of scale. Though the department has formed farmer Self Help Groups (‘SHGs’),
they are scattered given the mountainous terrain of the District. This is an impediment in collectivizing
the SHGs for business development and training purposes. The officers were of the opinion that
despite its potential, the agriculture sector was unable to achieve its due in economic contribution to
the District revenue, due to lack of marketing opportunities. Reportedly, there were no platforms like
organized ‘mandis’ for sale of produce. In terms of infrastructure, there was seen a need to develop
mandis and 'Saras Kendra' like facilities in the District.
The department organizes almost 100 trainings annually with fifty people each, at the village level for
farmers. Nevertheless, these trainings were primarily on growth techniques and soil conservation; and
motivation and extension. A need was felt to train local farmers and farmer SHGs in skills like
business development, organic farming, collective farming, marketing and packaging skills.
Forest products
The District has almost 53,000 hectare area under forests. As of now, the people of the District
depend on forests mainly for fire wood, fodder, medicinal plants and timber. The Department of
Forests is looking at afforestation of cultivable barren land in Ringal, Bamboo, and Bhimal etc. The
40
http://zpdk.org.in/sites/default/files/Districtprofile(2-2-10).pdf 41
NABARD, Uttarakhand Regional Office, “Potential Linked Credit Plan for XII Five Year Plan (2012- 13 to 2016-17) With Specific Reference to 2013-14”.
District Skill Gap Study for the State of Uttarakhand
96
Chief Forest Officer shared that such abundant natural resource have great commercial potential for
medicinal plant plantations and production of wood and bamboo based artifacts and products.
To tap forest resources, it was opined that training in processing, grading and marketing of medicinal
plants is requisite for the people of Almora. Through such value additions, it is envisaged that a higher
value may be received for medicinal plants which are being marketed raw as of now. Also, given the
high volumes of wood and bamboo in the region, skills of making wood and bamboo artifacts and
products will be beneficial for the people specially since Almora is a tourist hotspot and sale of such
locally produced products has a great prospect. Lastly, marketing of minor forest products like seeds
and flowers was seen to have potential scope. Marketing and packaging skills of women’s groups was
shared to be imperative in this regard.
Industry
The District Industries Department is focusing on developing artisan clusters across the District,
especially in the handicraft, food processing, candle and incense stick making, and knit-wear making
skills. Through its Entrepreneurship Development Programme, the department provides trainings to
youth from time to time. However, it is noted that there is a significant gap particularly in terms of
developing market linkages and product enhancement in the entrepreneurship development for small
artisan clusters. Also, it was shared that most artisan clusters are scattered across the region which is
another hindrance to the Programme but the Department is working with the view of organising these
clusters for better capacity building, product enhancement and developing marketing linkages for
these clusters.
Khadi and Handloom
The District is well known for its Khadi and Handloom products. The District houses the River View
Khadi and Handloom Factory of the Khadi & Village Industries Commission of India. Given the niche
market for Khadi products, this factory had been showing growth in the past. However, over the years
there have been challenges to keep up with the growth pattern.
Major challenges in the promotion of this sector were felt due to redundant technologies in production
and little innovation in designs. It was shared that the factory still relied on ‘Khadi’ machines whereas
new improved technologies like ‘Jacquardlooms’ were in the market. Further, it was shared that the
department faces a lack of manpower since the Government was not announcing vacancies and
many positions remained vacant. Also, it was reported that the factory faces a lack of marketing
platforms. Khadi products were sold only through the shops owned by the Khadi Board which were
few and far between.
In terms of training requirements, designing skills for 'Khadi' machines was seen as a priority need for
the artisans. Also, both in terms of infrastructure and training, introduction of the Jacquard technology
for weavers was noted to be imperative. Also with a view of popularity of the Khadi and Handloom
products of the District, the students at the Government Girls Inter College and the Principal of the
Government Polytechnic College in Almora shared that Fashion designing was a viable course that
should be included in the Polytechnic Curriculum.
Lastly and importantly, for the promotion of Khadi products and sales promotion, training on marketing
skills was emphasized on for management of the factory and others in the State.
Tourism
Despite being the urban centre for many neighboring tourist destinations, the potential of Almora’s rich
cultural heritage and bio-diversity has not been sufficiently tapped. The reason for this is the seasonal
nature of tourism in its current form. Given the harsh weather conditions and susceptibility to
landslides and earthquakes, tourism was primarily limited to the summer months. However, it was
shared that with due investment in tourism promotion and infrastructure development, great value
could be achieved through this sector. There are hotels and resorts in the District, however the
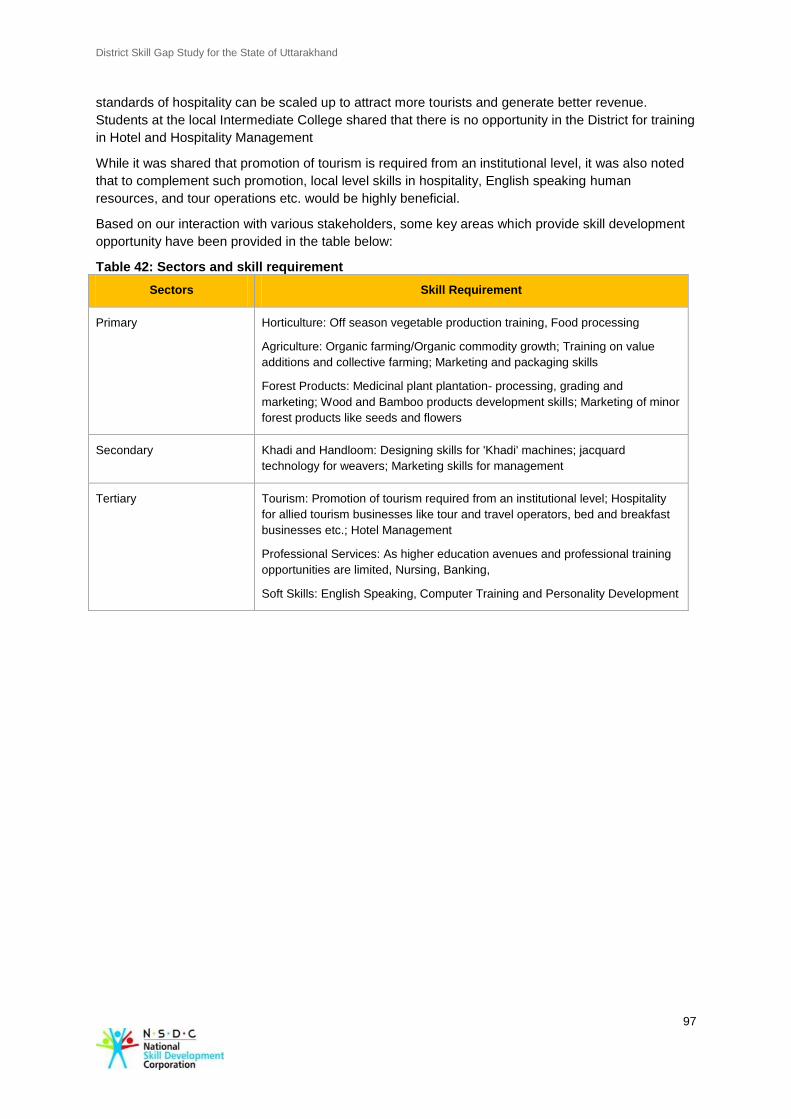
District Skill Gap Study for the State of Uttarakhand
97
standards of hospitality can be scaled up to attract more tourists and generate better revenue.
Students at the local Intermediate College shared that there is no opportunity in the District for training
in Hotel and Hospitality Management
While it was shared that promotion of tourism is required from an institutional level, it was also noted
that to complement such promotion, local level skills in hospitality, English speaking human
resources, and tour operations etc. would be highly beneficial.
Based on our interaction with various stakeholders, some key areas which provide skill development
opportunity have been provided in the table below:
Table 42: Sectors and skill requirement
Sectors Skill Requirement
Primary Horticulture: Off season vegetable production training, Food processing
Agriculture: Organic farming/Organic commodity growth; Training on value
additions and collective farming; Marketing and packaging skills
Forest Products: Medicinal plant plantation- processing, grading and
marketing; Wood and Bamboo products development skills; Marketing of minor
forest products like seeds and flowers
Secondary Khadi and Handloom: Designing skills for 'Khadi' machines; jacquard
technology for weavers; Marketing skills for management
Tertiary Tourism: Promotion of tourism required from an institutional level; Hospitality
for allied tourism businesses like tour and travel operators, bed and breakfast
businesses etc.; Hotel Management
Professional Services: As higher education avenues and professional training
opportunities are limited, Nursing, Banking,
Soft Skills: English Speaking, Computer Training and Personality Development
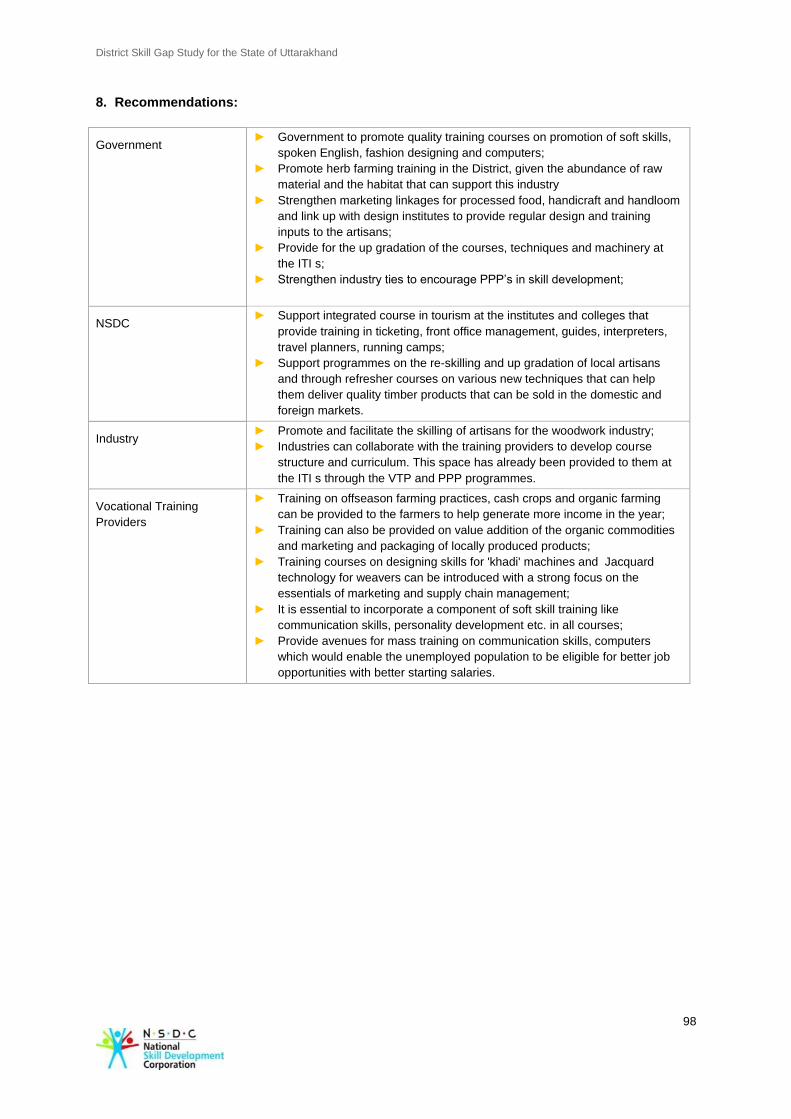
District Skill Gap Study for the State of Uttarakhand
98
8. Recommendations:
Government ► Government to promote quality training courses on promotion of soft skills,
spoken English, fashion designing and computers;
► Promote herb farming training in the District, given the abundance of raw
material and the habitat that can support this industry
► Strengthen marketing linkages for processed food, handicraft and handloom
and link up with design institutes to provide regular design and training
inputs to the artisans;
► Provide for the up gradation of the courses, techniques and machinery at
the ITI s;
► Strengthen industry ties to encourage PPP’s in skill development;
NSDC ► Support integrated course in tourism at the institutes and colleges that
provide training in ticketing, front office management, guides, interpreters,
travel planners, running camps;
► Support programmes on the re-skilling and up gradation of local artisans
and through refresher courses on various new techniques that can help
them deliver quality timber products that can be sold in the domestic and
foreign markets.
Industry ► Promote and facilitate the skilling of artisans for the woodwork industry;
► Industries can collaborate with the training providers to develop course
structure and curriculum. This space has already been provided to them at
the ITI s through the VTP and PPP programmes.
Vocational Training
Providers
► Training on offseason farming practices, cash crops and organic farming
can be provided to the farmers to help generate more income in the year;
► Training can also be provided on value addition of the organic commodities
and marketing and packaging of locally produced products;
► Training courses on designing skills for 'khadi' machines and Jacquard
technology for weavers can be introduced with a strong focus on the
essentials of marketing and supply chain management;
► It is essential to incorporate a component of soft skill training like
communication skills, personality development etc. in all courses;
► Provide avenues for mass training on communication skills, computers
which would enable the unemployed population to be eligible for better job
opportunities with better starting salaries.
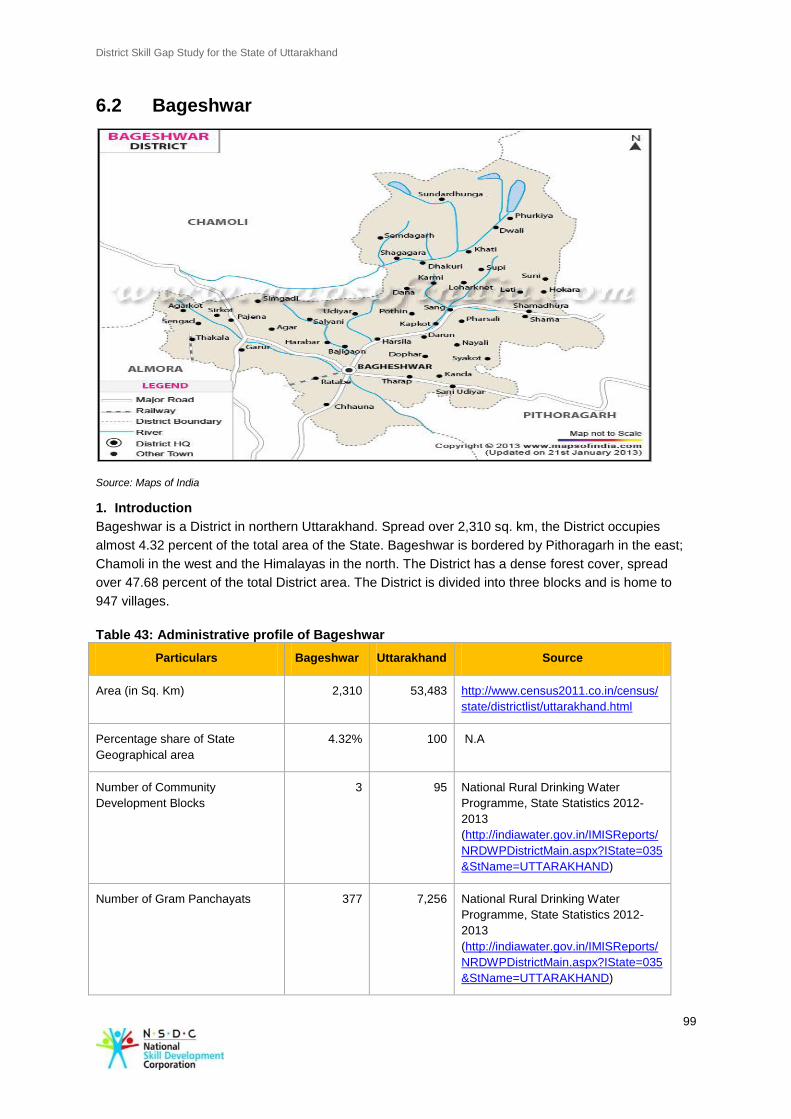
District Skill Gap Study for the State of Uttarakhand
99
6.2 Bageshwar
Source: Maps of India
1. Introduction
Bageshwar is a District in northern Uttarakhand. Spread over 2,310 sq. km, the District occupies
almost 4.32 percent of the total area of the State. Bageshwar is bordered by Pithoragarh in the east;
Chamoli in the west and the Himalayas in the north. The District has a dense forest cover, spread
over 47.68 percent of the total District area. The District is divided into three blocks and is home to
947 villages.
Table 43: Administrative profile of Bageshwar
Particulars Bageshwar Uttarakhand Source
Area (in Sq. Km) 2,310 53,483 http://www.census2011.co.in/census/
state/districtlist/uttarakhand.html
Percentage share of State
Geographical area
4.32% 100 N.A
Number of Community
Development Blocks
3 95 National Rural Drinking Water
Programme, State Statistics 2012-
2013
(http://indiawater.gov.in/IMISReports/
NRDWPDistrictMain.aspx?IState=035
&StName=UTTARAKHAND)
Number of Gram Panchayats 377 7,256 National Rural Drinking Water
Programme, State Statistics 2012-
2013
(http://indiawater.gov.in/IMISReports/
NRDWPDistrictMain.aspx?IState=035
&StName=UTTARAKHAND)
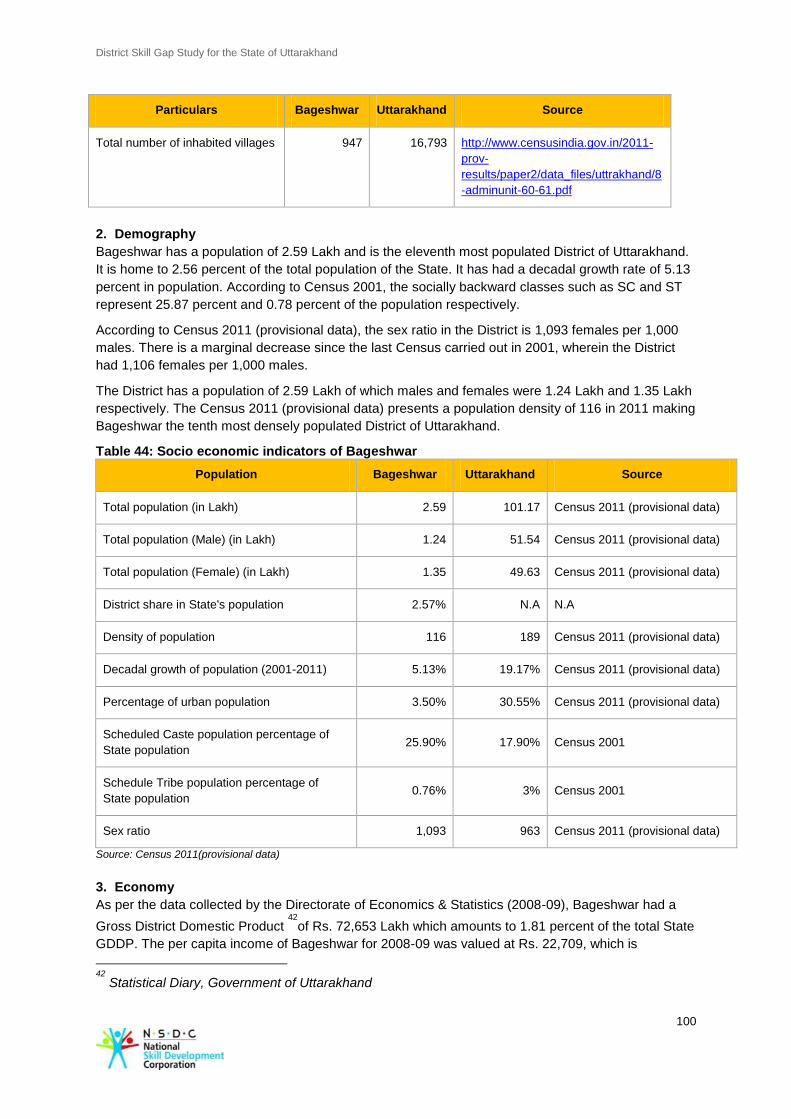
District Skill Gap Study for the State of Uttarakhand
100
Particulars Bageshwar Uttarakhand Source
Total number of inhabited villages 947 16,793 http://www.censusindia.gov.in/2011-
prov-
results/paper2/data_files/uttrakhand/8
-adminunit-60-61.pdf
2. Demography
Bageshwar has a population of 2.59 Lakh and is the eleventh most populated District of Uttarakhand.
It is home to 2.56 percent of the total population of the State. It has had a decadal growth rate of 5.13
percent in population. According to Census 2001, the socially backward classes such as SC and ST
represent 25.87 percent and 0.78 percent of the population respectively.
According to Census 2011 (provisional data), the sex ratio in the District is 1,093 females per 1,000
males. There is a marginal decrease since the last Census carried out in 2001, wherein the District
had 1,106 females per 1,000 males.
The District has a population of 2.59 Lakh of which males and females were 1.24 Lakh and 1.35 Lakh
respectively. The Census 2011 (provisional data) presents a population density of 116 in 2011 making
Bageshwar the tenth most densely populated District of Uttarakhand.
Table 44: Socio economic indicators of Bageshwar
Population Bageshwar Uttarakhand Source
Total population (in Lakh) 2.59 101.17 Census 2011 (provisional data)
Total population (Male) (in Lakh) 1.24 51.54 Census 2011 (provisional data)
Total population (Female) (in Lakh) 1.35 49.63 Census 2011 (provisional data)
District share in State's population 2.57% N.A N.A
Density of population 116 189 Census 2011 (provisional data)
Decadal growth of population (2001-2011) 5.13% 19.17% Census 2011 (provisional data)
Percentage of urban population 3.50% 30.55% Census 2011 (provisional data)
Scheduled Caste population percentage of
State population 25.90% 17.90% Census 2001
Schedule Tribe population percentage of
State population 0.76% 3% Census 2001
Sex ratio 1,093 963 Census 2011 (provisional data)
Source: Census 2011(provisional data)
3. Economy
As per the data collected by the Directorate of Economics & Statistics (2008-09), Bageshwar had a
Gross District Domestic Product 42
of Rs. 72,653 Lakh which amounts to 1.81 percent of the total State
GDDP. The per capita income of Bageshwar for 2008-09 was valued at Rs. 22,709, which is
42
Statistical Diary, Government of Uttarakhand
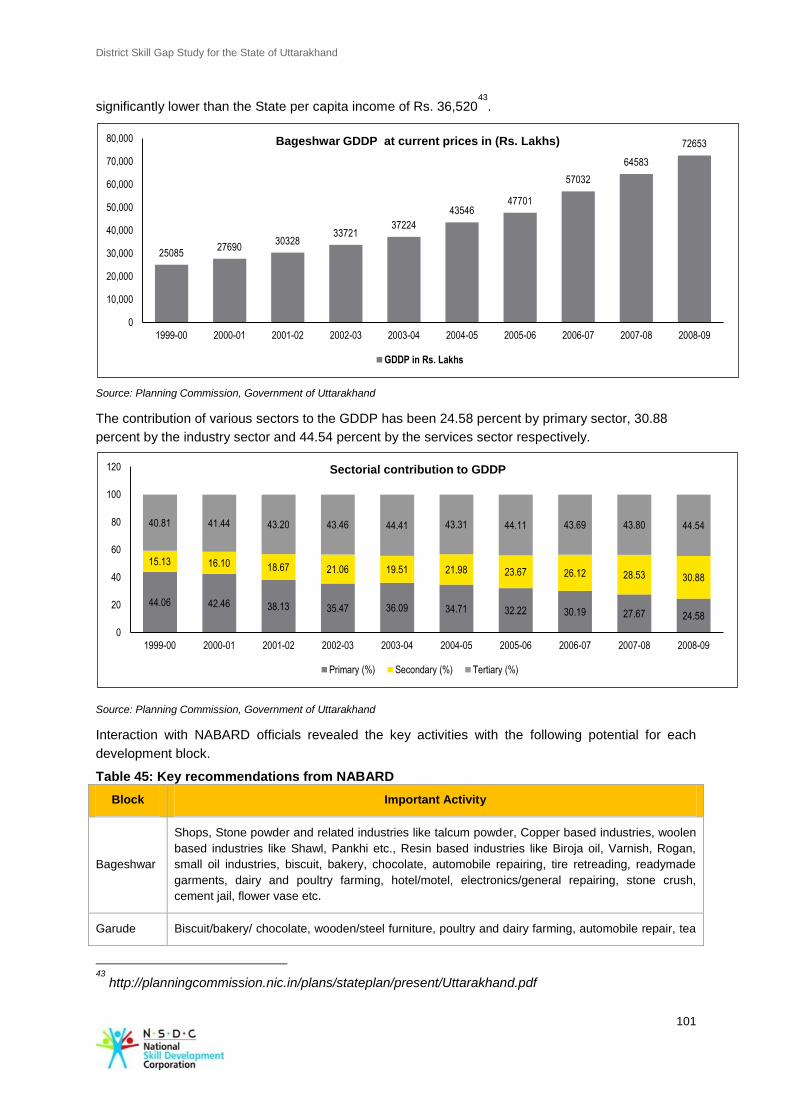
District Skill Gap Study for the State of Uttarakhand
101
significantly lower than the State per capita income of Rs. 36,52043
.
Source: Planning Commission, Government of Uttarakhand
The contribution of various sectors to the GDDP has been 24.58 percent by primary sector, 30.88
percent by the industry sector and 44.54 percent by the services sector respectively.
Source: Planning Commission, Government of Uttarakhand
Interaction with NABARD officials revealed the key activities with the following potential for each
development block.
Table 45: Key recommendations from NABARD
Block Important Activity
Bageshwar
Shops, Stone powder and related industries like talcum powder, Copper based industries, woolen
based industries like Shawl, Pankhi etc., Resin based industries like Biroja oil, Varnish, Rogan,
small oil industries, biscuit, bakery, chocolate, automobile repairing, tire retreading, readymade
garments, dairy and poultry farming, hotel/motel, electronics/general repairing, stone crush,
cement jail, flower vase etc.
Garude Biscuit/bakery/ chocolate, wooden/steel furniture, poultry and dairy farming, automobile repair, tea
43
http://planningcommission.nic.in/plans/stateplan/present/Uttarakhand.pdf
25085 27690
30328 33721
37224
43546 47701
57032
64583
72653
0
10,000
20,000
30,000
40,000
50,000
60,000
70,000
80,000
1999-00 2000-01 2001-02 2002-03 2003-04 2004-05 2005-06 2006-07 2007-08 2008-09
Bageshwar GDDP at current prices in (Rs. Lakhs)
GDDP in Rs. Lakhs
44.06 42.46 38.13 35.47 36.09 34.71 32.22 30.19 27.67 24.58
15.13 16.10 18.67 21.06 19.51 21.98 23.67 26.12 28.53 30.88
40.81 41.44 43.20 43.46 44.41 43.31 44.11 43.69 43.80 44.54
0
20
40
60
80
100
120
1999-00 2000-01 2001-02 2002-03 2003-04 2004-05 2005-06 2006-07 2007-08 2008-09
Sectorial contribution to GDDP
Primary (%) Secondary (%) Tertiary (%)
District Skill Gap Study for the State of Uttarakhand
102
Block Important Activity
processing, fragrances and medicine oil, eco-tourism, hotel/motel, restaurant, transport, resin
based industries like Biroja oil, varnish, rogan, and readymade garments.
Kapkota
Shops, stone powder and related industries like talcum powder, copper based industries, woolen
based industries like shawl, pankhi etc., Regaal work like tokari, doormat, kandi, parsh, medicine
plant processing, biscuit/bakery/ chocolate, wooden/steel furniture, poultry and dairy farming, eco-
tourism etc.
Primary Sector
Bageshwar is not considered a highly agrarian District, especially due to the fact that farmers only
produce at subsistence level and that agriculture is impeded by the presence of a large number of
wild animals venturing into the District. Only 3.035 percent of the total workforce is engaged in
agricultural activities.
As per recent data44
provided by the District Agriculture Officer (‘DAO’), only 16.76 percent of the total
geographical area is cultivable. Production is mainly of wheat and rice which is the major crops
constituting 14.01 ton/hectare and 14.22 ton/hectare respectively.
Majority of the cultivable land is held by small farmers with scattered land holdings and there is
existence of terrace farming due to a hilly geographical terrain. In terms of productivity, the other main
crops are Potato, Ginger, Rajma and Pulses. Use of fertilizers is at its bare minimum in the District.
The District also houses a number of tribal’s who live in relatively remote areas and are generally
involved in production of mats, baskets, flower pots, fancy bags and other low skill jobs. The area has
an abundant supply of raw materials for these activities such as Ringal (Dwarf Bamboo) and Oak
trees.
Secondary Sector
Due to its hilly terrain, the District fails to cater to large industries, which usually require large flat
lands. As per the data provided by the District Industries Center (‘DIC’) for 2012-13, currently there
are 1,067 small industries with investment of approximately Rs. 16.10 crore and approximately 2,005
workers have been employed, details of which have been provided in the table 46 below:
Table 46: Types of Industry currently operating in the District
44
Data for the financial year 2012-13
S.No. Types of industries No. of Units
1. Food & Beverages 265
2. Ready-made garments & tailoring 157
3. Wooden products 15
4. Paper products 1
5. PCO media 34
6. Chemical 12
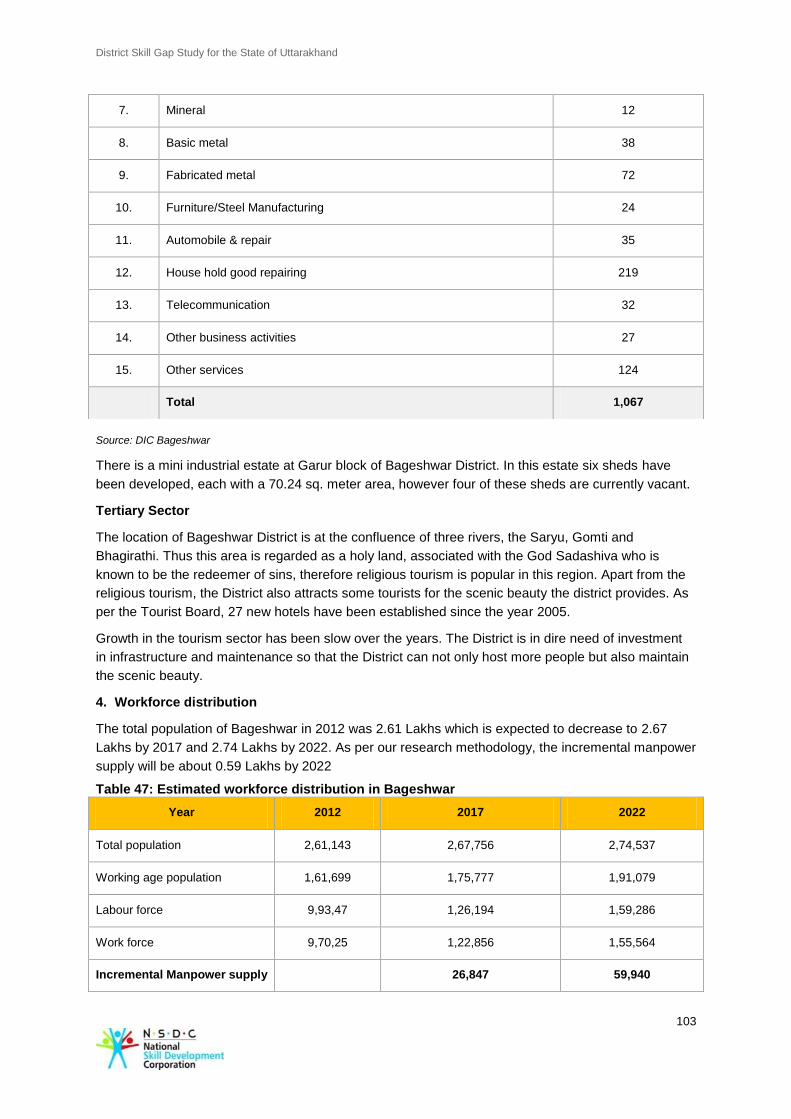
District Skill Gap Study for the State of Uttarakhand
103
Source: DIC Bageshwar
There is a mini industrial estate at Garur block of Bageshwar District. In this estate six sheds have
been developed, each with a 70.24 sq. meter area, however four of these sheds are currently vacant.
Tertiary Sector
The location of Bageshwar District is at the confluence of three rivers, the Saryu, Gomti and
Bhagirathi. Thus this area is regarded as a holy land, associated with the God Sadashiva who is
known to be the redeemer of sins, therefore religious tourism is popular in this region. Apart from the
religious tourism, the District also attracts some tourists for the scenic beauty the district provides. As
per the Tourist Board, 27 new hotels have been established since the year 2005.
Growth in the tourism sector has been slow over the years. The District is in dire need of investment
in infrastructure and maintenance so that the District can not only host more people but also maintain
the scenic beauty.
4. Workforce distribution
The total population of Bageshwar in 2012 was 2.61 Lakhs which is expected to decrease to 2.67
Lakhs by 2017 and 2.74 Lakhs by 2022. As per our research methodology, the incremental manpower
supply will be about 0.59 Lakhs by 2022
Table 47: Estimated workforce distribution in Bageshwar
Year 2012 2017 2022
Total population 2,61,143 2,67,756 2,74,537
Working age population 1,61,699 1,75,777 1,91,079
Labour force 9,93,47 1,26,194 1,59,286
Work force 9,70,25 1,22,856 1,55,564
Incremental Manpower supply
26,847 59,940
7. Mineral 12
8. Basic metal 38
9. Fabricated metal 72
10. Furniture/Steel Manufacturing 24
11. Automobile & repair 35
12. House hold good repairing 219
13. Telecommunication 32
14. Other business activities 27
15. Other services 124
Total 1,067
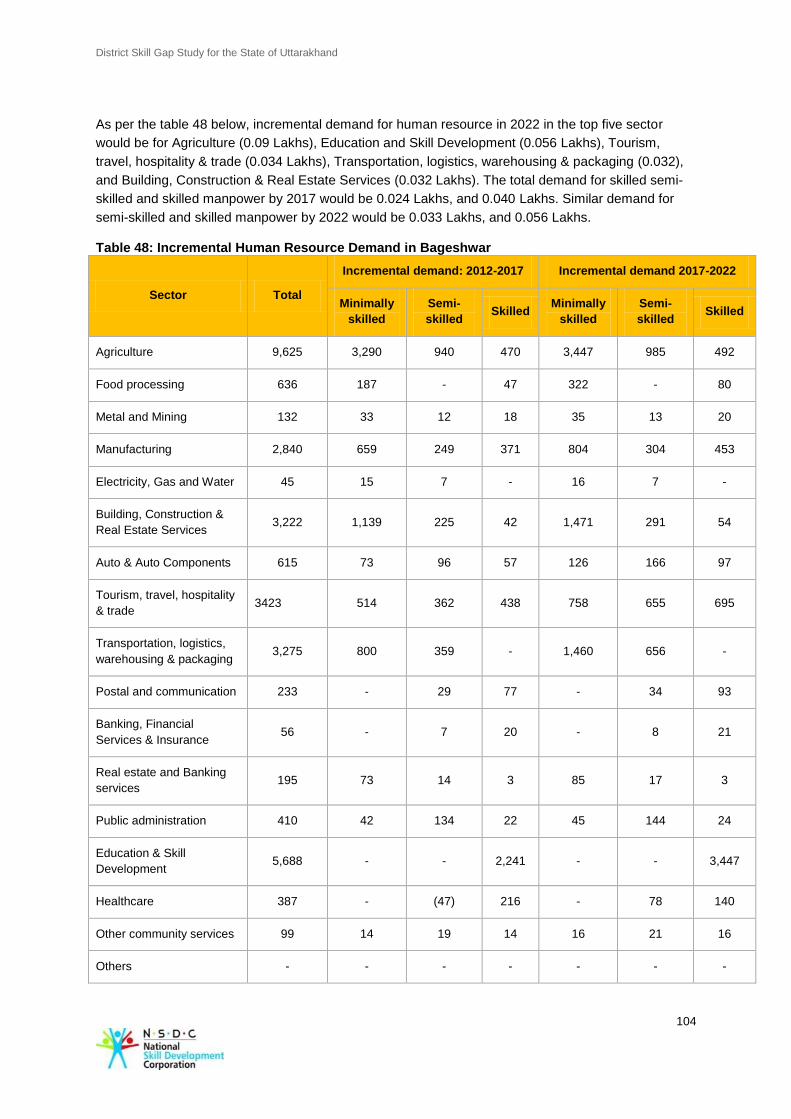
District Skill Gap Study for the State of Uttarakhand
104
As per the table 48 below, incremental demand for human resource in 2022 in the top five sector
would be for Agriculture (0.09 Lakhs), Education and Skill Development (0.056 Lakhs), Tourism,
travel, hospitality & trade (0.034 Lakhs), Transportation, logistics, warehousing & packaging (0.032),
and Building, Construction & Real Estate Services (0.032 Lakhs). The total demand for skilled semi-
skilled and skilled manpower by 2017 would be 0.024 Lakhs, and 0.040 Lakhs. Similar demand for
semi-skilled and skilled manpower by 2022 would be 0.033 Lakhs, and 0.056 Lakhs. Table 48: Incremental Human Resource Demand in Bageshwar
Sector Total
Incremental demand: 2012-2017 Incremental demand 2017-2022
Minimally
skilled
Semi-
skilled Skilled
Minimally
skilled
Semi-
skilled Skilled
Agriculture 9,625 3,290 940 470 3,447 985 492
Food processing 636 187 - 47 322 - 80
Metal and Mining 132 33 12 18 35 13 20
Manufacturing 2,840 659 249 371 804 304 453
Electricity, Gas and Water 45 15 7 - 16 7 -
Building, Construction &
Real Estate Services 3,222 1,139 225 42 1,471 291 54
Auto & Auto Components 615 73 96 57 126 166 97
Tourism, travel, hospitality
& trade 3423 514 362 438 758 655 695
Transportation, logistics,
warehousing & packaging 3,275 800 359 - 1,460 656 -
Postal and communication 233 - 29 77 - 34 93
Banking, Financial
Services & Insurance 56 - 7 20 - 8 21
Real estate and Banking
services 195 73 14 3 85 17 3
Public administration 410 42 134 22 45 144 24
Education & Skill
Development 5,688 - - 2,241 - - 3,447
Healthcare 387 - (47) 216 - 78 140
Other community services 99 14 19 14 16 21 16
Others - - - - - - -
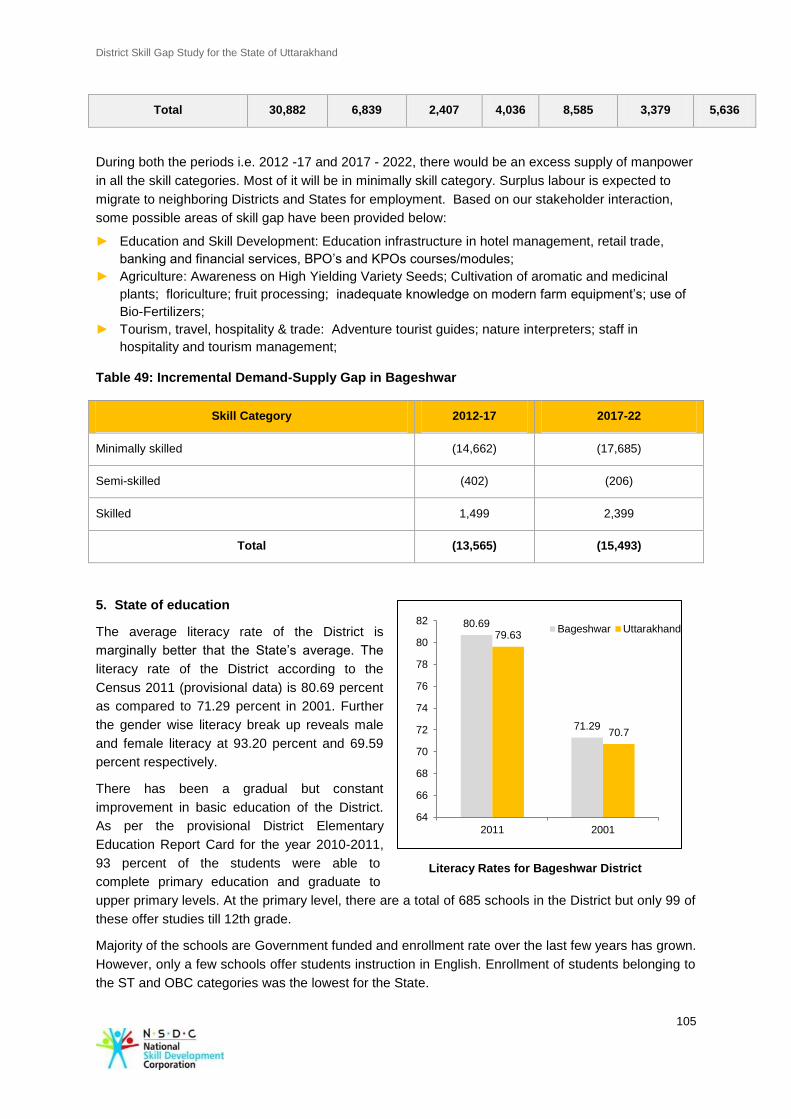
District Skill Gap Study for the State of Uttarakhand
105
80.69
71.29
79.63
70.7
64
66
68
70
72
74
76
78
80
82
2011 2001
Bageshwar Uttarakhand
Literacy Rates for Bageshwar District
Total 30,882 6,839 2,407 4,036 8,585 3,379 5,636
During both the periods i.e. 2012 -17 and 2017 - 2022, there would be an excess supply of manpower
in all the skill categories. Most of it will be in minimally skill category. Surplus labour is expected to
migrate to neighboring Districts and States for employment. Based on our stakeholder interaction,
some possible areas of skill gap have been provided below:
► Education and Skill Development: Education infrastructure in hotel management, retail trade,
banking and financial services, BPO’s and KPOs courses/modules;
► Agriculture: Awareness on High Yielding Variety Seeds; Cultivation of aromatic and medicinal
plants; floriculture; fruit processing; inadequate knowledge on modern farm equipment’s; use of
Bio-Fertilizers;
► Tourism, travel, hospitality & trade: Adventure tourist guides; nature interpreters; staff in
hospitality and tourism management;
Table 49: Incremental Demand-Supply Gap in Bageshwar
Skill Category 2012-17 2017-22
Minimally skilled (14,662) (17,685)
Semi-skilled (402) (206)
Skilled 1,499 2,399
Total (13,565) (15,493)
5. State of education
The average literacy rate of the District is
marginally better that the State’s average. The
literacy rate of the District according to the
Census 2011 (provisional data) is 80.69 percent
as compared to 71.29 percent in 2001. Further
the gender wise literacy break up reveals male
and female literacy at 93.20 percent and 69.59
percent respectively.
There has been a gradual but constant
improvement in basic education of the District.
As per the provisional District Elementary
Education Report Card for the year 2010-2011,
93 percent of the students were able to
complete primary education and graduate to
upper primary levels. At the primary level, there are a total of 685 schools in the District but only 99 of
these offer studies till 12th grade.
Majority of the schools are Government funded and enrollment rate over the last few years has grown.
However, only a few schools offer students instruction in English. Enrollment of students belonging to
the ST and OBC categories was the lowest for the State.
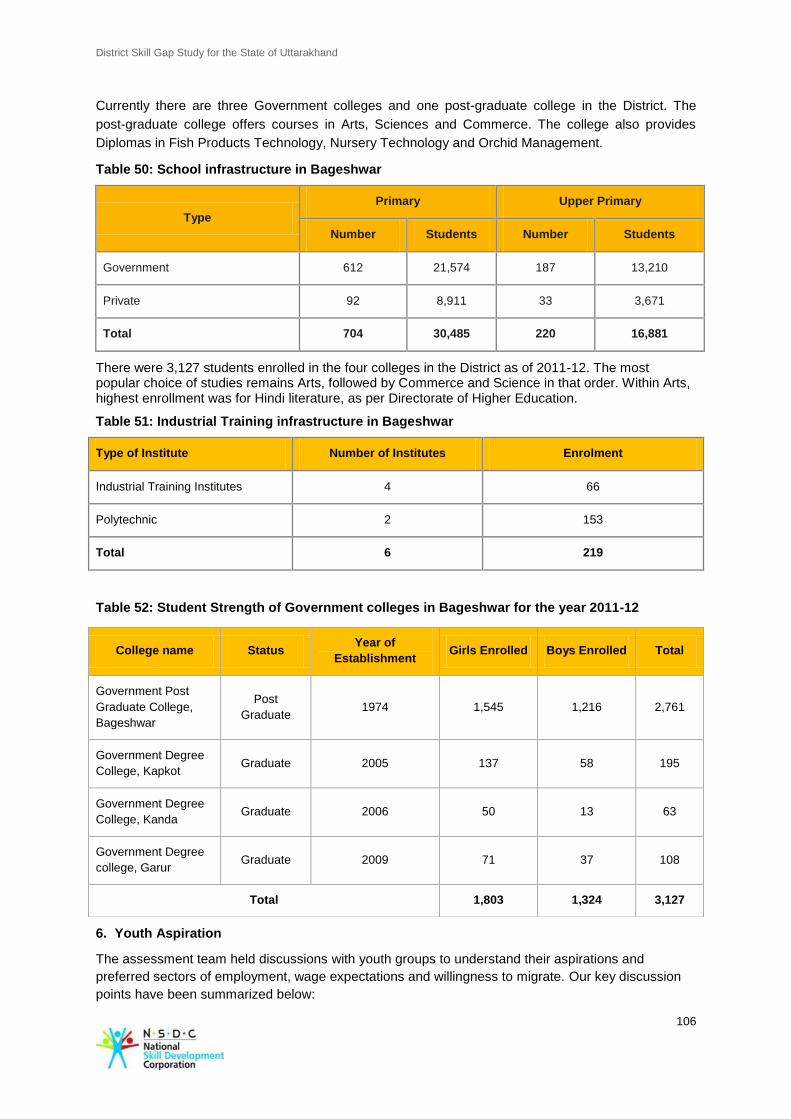
District Skill Gap Study for the State of Uttarakhand
106
Currently there are three Government colleges and one post-graduate college in the District. The
post-graduate college offers courses in Arts, Sciences and Commerce. The college also provides
Diplomas in Fish Products Technology, Nursery Technology and Orchid Management.
Table 50: School infrastructure in Bageshwar
Type
Primary Upper Primary
Number Students Number Students
Government 612 21,574 187 13,210
Private 92 8,911 33 3,671
Total 704 30,485 220 16,881
There were 3,127 students enrolled in the four colleges in the District as of 2011-12. The most popular choice of studies remains Arts, followed by Commerce and Science in that order. Within Arts, highest enrollment was for Hindi literature, as per Directorate of Higher Education.
Table 51: Industrial Training infrastructure in Bageshwar
Type of Institute Number of Institutes Enrolment
Industrial Training Institutes 4 66
Polytechnic 2 153
Total 6 219
Table 52: Student Strength of Government colleges in Bageshwar for the year 2011-12
6. Youth Aspiration
The assessment team held discussions with youth groups to understand their aspirations and
preferred sectors of employment, wage expectations and willingness to migrate. Our key discussion
points have been summarized below:
College name Status Year of
Establishment Girls Enrolled Boys Enrolled Total
Government Post
Graduate College,
Bageshwar
Post
Graduate 1974 1,545 1,216 2,761
Government Degree
College, Kapkot Graduate 2005 137 58 195
Government Degree
College, Kanda Graduate 2006 50 13 63
Government Degree
college, Garur Graduate 2009 71 37 108
Total 1,803 1,324 3,127
District Skill Gap Study for the State of Uttarakhand
107
► The youth of the District, shared that they are not aware of career counseling and assistance
available to them through the Government;
► Majority of the youth are interested in traditional employment opportunities such as the armed
forces or Government jobs;
► Many, who were aware of newer avenues, were not satisfied with the current VTPs, ITIs and
training institutions. They cited issues regarding high fees, poor placements, lack of adequate
infrastructure and proper faculty and the type and number of courses offered in these institutions;
► As per the data from the District Statistical Office, 9.65 percent of population has migrated to
other states for employment and other reasons. Evidently, skill requirements with respect to
vocational skills need to be enhanced in the District in keeping with the growing industrial
demands in the State.
7. Development potential and stakeholder perception
Agriculture/Horticulture
It was shared that migration of men-folk from Bageshwar was high. As a whole, agricultural production
in the District can be characterized by low productivity, shortage of inputs and lack of marketing,
which is the reason why the District is primarily involved in subsistence production which is not
commercially driven. Bageshwar also lacks quality mandis. This hampers the sale of agricultural
production, thereby limiting farmers to only sell within the community or harvest for their own
purposes.
However, the District has a wide range of flora and fauna that can be harnessed into the primary
sector, but the lack of knowledge, skill and training, impedes this potential. Herbal, medicinal and
aromatic plants, which can be easily grown in these parts, are not being explored.
The District’s potential in horticulture can be tapped through awareness and capacity building on
promotion of high-value herbal, medicinal and aromatic plants and produce, through trade fairs,
workshops, training programs and educational seminars on the benefits of producing these higher
value agricultural products. It is also imperative to build the farmers’ capacities to create linkages with
retailers in both herbal plants and normal vegetable and agricultural produce.
From an infrastructure point of view, it is important to develop mandis that are competitive and at par
with national standards. This can be done through the cluster approach, wherein mandis can be given
to certain clusters for their operation and maintenance. Also, development and awareness on
extension services, financial services, upgraded production processes and packaging is required.
Tourism
While Bageshwar does attract some tourists, it is primarily only in the religious tourism category.
Tourism, mostly domestic, is extremely seasonal and with more popular destinations like Rishikesh
and Haridwar, attracts far fewer people than the District has the potential for.
With more effective branding of popular tourist sites (especially in terms of nature/eco-tourism), a
more coherent marketing strategy and better hospitality and general infrastructure, the District can
become a popular tourist destination. There have been a number of plans that have been initiated by
the Government of Uttarakhand for the development tourism in the region. These projects supported
by organizations like United Nations Development Program (‘UNDP’) or World Trade Organization
(‘WTO’) has started only recently, and will take some time to show results.
There is a need for improvement of infrastructure and concepts like wildlife tourism, eco-tourism,
adventure tourism, cultural tourism and nature tourism need to be promoted. From a skill development
perspective, professional training of staff and entrepreneurs in hospitality and tourism management is
required to cater to both domestic and international tourists.
District Skill Gap Study for the State of Uttarakhand
108
Based on our interaction with various stakeholders, some key areas which provide skill development
opportunity have been provided in the table below:
Table 53: Sectors and skill requirement
Sector Skill Requirements
Primary Production and diversification in high value products like herbal, aromatic and
medicinal plants, promotion through training, educational workshops, trade
fairs of organic farming and its advantages and benefits, linkages with retailers,
creation of mandis/clusters, performance based subsidies, impart knowledge
and training on high yielding varieties or green revolution agricultural products.
Creation of fodder lands, veterinarian services, storage and transportation
networks.
Tertiary Potential areas for development are hotel, resorts, repair services for
automobiles, adventure sports, establishment of ropeways, denting painting of
motor vehicles, body making of automobiles, and tire retreading works.
8. Recommendations
Government ► Focus on introducing schemes to promote handicrafts, medicinal herb
nurseries and herb processing plants.
► Encourage fodder development and provide training on fodder variety, and
agronomic practices by leasing the panchayat wastelands to the milk
producer’s cooperative societies/farmers.
NSDC ► Support programme to impart skills related to the processing of aromatic
plants.
Industry ► Improved involvement of Industry associations from within and outside the
District should be encouraged to generate employment and provide
placement opportunities for skilled individuals.
► Industries can collaborate with the exiting training providers to develop
course structure and curriculum.
► Given the abundance of natural herbs the pharma industry can train
farmers, unemployed youth and women on the processing and packaging
activities.
► Provide opportunities for on the job training to the youth receiving training.
Vocational Training
Providers
► Provide avenues for mass training on communication skills, computers
which would enable the unemployed population to be eligible for better job
opportunities.
► VTC in the District should introduce short term training programmes on
handicrafts, hotel management related skills including culinary,
housekeeping, waiter, bartending etc.,
► It is essential to incorporate a component of soft skill training like
communication skills, personality development etc. in all courses.
► Focus to be shifted to practical experience, rather than theoretical
knowledge, by increasing the scope and relevance for "On the Job"
training.
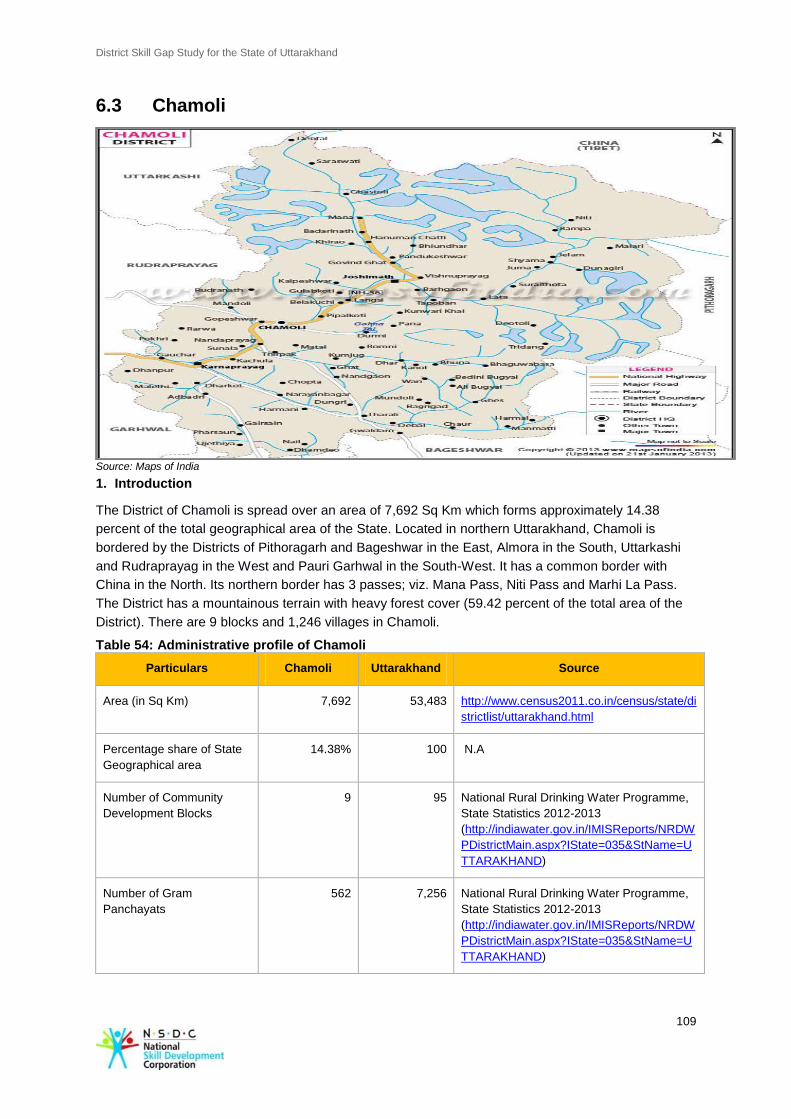
District Skill Gap Study for the State of Uttarakhand
109
6.3 Chamoli
Source: Maps of India
1. Introduction
The District of Chamoli is spread over an area of 7,692 Sq Km which forms approximately 14.38
percent of the total geographical area of the State. Located in northern Uttarakhand, Chamoli is
bordered by the Districts of Pithoragarh and Bageshwar in the East, Almora in the South, Uttarkashi
and Rudraprayag in the West and Pauri Garhwal in the South-West. It has a common border with
China in the North. Its northern border has 3 passes; viz. Mana Pass, Niti Pass and Marhi La Pass.
The District has a mountainous terrain with heavy forest cover (59.42 percent of the total area of the
District). There are 9 blocks and 1,246 villages in Chamoli.
Table 54: Administrative profile of Chamoli
Particulars Chamoli Uttarakhand Source
Area (in Sq Km) 7,692 53,483 http://www.census2011.co.in/census/state/di
strictlist/uttarakhand.html
Percentage share of State
Geographical area
14.38% 100 N.A
Number of Community
Development Blocks
9 95 National Rural Drinking Water Programme,
State Statistics 2012-2013
(http://indiawater.gov.in/IMISReports/NRDW
PDistrictMain.aspx?IState=035&StName=U
TTARAKHAND)
Number of Gram
Panchayats
562 7,256 National Rural Drinking Water Programme,
State Statistics 2012-2013
(http://indiawater.gov.in/IMISReports/NRDW
PDistrictMain.aspx?IState=035&StName=U
TTARAKHAND)
District Skill Gap Study for the State of Uttarakhand
110
Particulars Chamoli Uttarakhand Source
Total number of inhabited
villages
1,246 16,793 http://www.censusindia.gov.in/2011-prov-
results/paper2/data_files/uttrakhand/8-
adminunit-60-61.pdf
2. Demography
Chamoli is home to 3.86 percent of the total population of the State. With its 3.91 Lakh inhabitants it is
the ninth most populated District of the State. It has had a decadal growth rate in population of 5.6
percent. According to Census 2001, the socially disadvantaged groups such as SC and ST
represented 18.24 percent and 4.09 percent of the population respectively.
As per Census 2011 (provisional data), Chamoli shows a healthy sex ratio of 1,021 females per 1,000
males, which is much higher than the State’s sex ratio of 963 females per 1,000 males. The Census
2011 (provisional data) shows a population density of 49 per sq. km which makes it the second least
densely populated District of Uttarakhand.
Table 55: Socio economic indicators of Chamoli
Population Chamoli Uttarakhand Source
Total population (in Lakh) 3.91 101.17 Census 2011 (provisional data)
Total population (Male) (in Lakh) 1.94 51.54 Census 2011 (provisional data)
Total population (Female) (in Lakh) 1.97 49.63 Census 2011 (provisional data)
District share in State's population 3.87% N.A N.A
Density of population 49 189 Census 2011 (provisional data)
Decadal growth of population (2001-
2011) 5.6% 19.17% Census 2011 (provisional data)
Percentage of urban population 15.11% 30.55% Census 2011(provisional data)
Scheduled Caste population
percentage of State population 18.2% 17.90% Census 2001
Schedule Tribe population percentage
of State population 4.09% 3% Census 2001
Sex ratio 1,021 963 Census 2011 (provisional data)
3. Economy As per the data collected by the Directorate of Economics & Statistics (2008-09), Chamoli had a
Gross District Domestic Product 45
of Rs. 158,560 Lakhs which amounts to 3.95 percent of the total State DDP. The per capita income of Chamoli for 2008-09 was valued at Rs. 32,038, which is lower
than the State per capita income of Rs. 36,52046
.
45
Statistical Diary, Government of Uttarakhand 46
http://planningcommission.nic.in/plans/stateplan/present/Uttarakhand.pdf
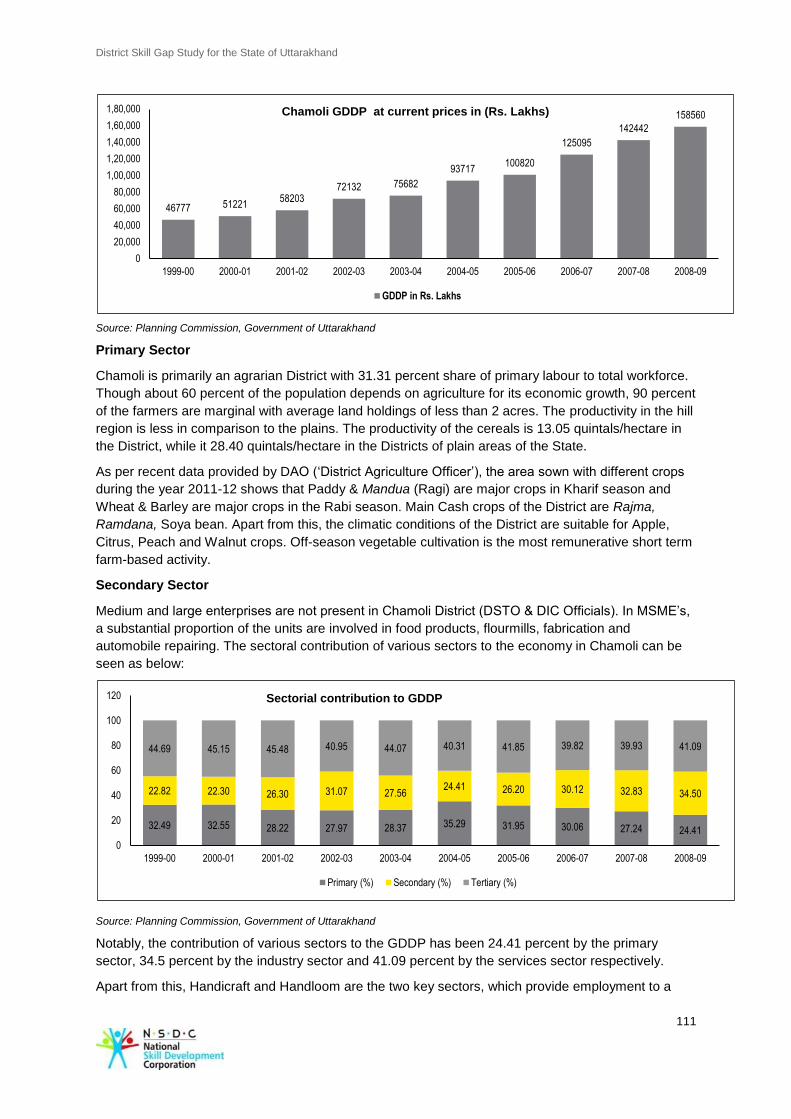
District Skill Gap Study for the State of Uttarakhand
111
Source: Planning Commission, Government of Uttarakhand
Primary Sector
Chamoli is primarily an agrarian District with 31.31 percent share of primary labour to total workforce.
Though about 60 percent of the population depends on agriculture for its economic growth, 90 percent
of the farmers are marginal with average land holdings of less than 2 acres. The productivity in the hill
region is less in comparison to the plains. The productivity of the cereals is 13.05 quintals/hectare in
the District, while it 28.40 quintals/hectare in the Districts of plain areas of the State.
As per recent data provided by DAO (‘District Agriculture Officer’), the area sown with different crops
during the year 2011-12 shows that Paddy & Mandua (Ragi) are major crops in Kharif season and
Wheat & Barley are major crops in the Rabi season. Main Cash crops of the District are Rajma,
Ramdana, Soya bean. Apart from this, the climatic conditions of the District are suitable for Apple,
Citrus, Peach and Walnut crops. Off-season vegetable cultivation is the most remunerative short term
farm-based activity.
Secondary Sector
Medium and large enterprises are not present in Chamoli District (DSTO & DIC Officials). In MSME’s,
a substantial proportion of the units are involved in food products, flourmills, fabrication and
automobile repairing. The sectoral contribution of various sectors to the economy in Chamoli can be
seen as below:
Source: Planning Commission, Government of Uttarakhand
Notably, the contribution of various sectors to the GDDP has been 24.41 percent by the primary
sector, 34.5 percent by the industry sector and 41.09 percent by the services sector respectively.
Apart from this, Handicraft and Handloom are the two key sectors, which provide employment to a
46777 51221 58203
72132 75682
93717 100820
125095
142442
158560
0
20,000
40,000
60,000
80,000
1,00,000
1,20,000
1,40,000
1,60,000
1,80,000
1999-00 2000-01 2001-02 2002-03 2003-04 2004-05 2005-06 2006-07 2007-08 2008-09
Chamoli GDDP at current prices in (Rs. Lakhs)
GDDP in Rs. Lakhs
32.49 32.55 28.22 27.97 28.37 35.29 31.95 30.06 27.24 24.41
22.82 22.30 26.30 31.07 27.56 24.41 26.20 30.12 32.83 34.50
44.69 45.15 45.48 40.95 44.07 40.31 41.85 39.82 39.93 41.09
0
20
40
60
80
100
120
1999-00 2000-01 2001-02 2002-03 2003-04 2004-05 2005-06 2006-07 2007-08 2008-09
Sectorial contribution to GDDP
Primary (%) Secondary (%) Tertiary (%)
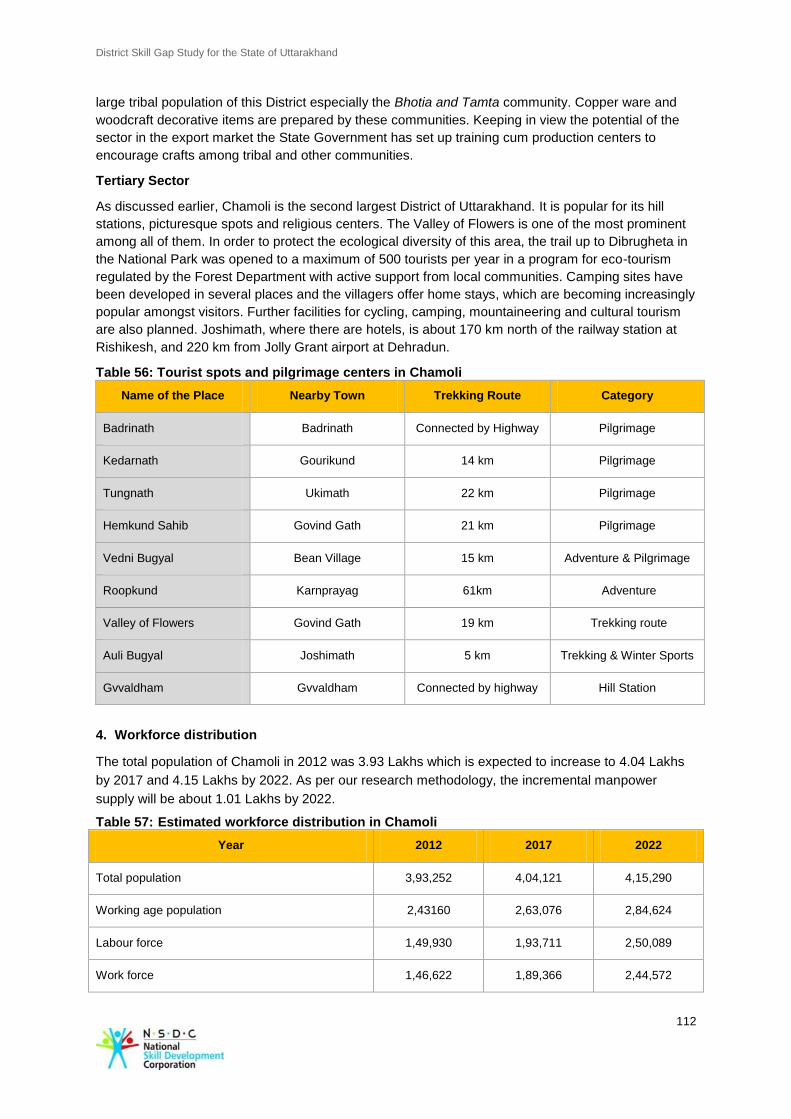
District Skill Gap Study for the State of Uttarakhand
112
large tribal population of this District especially the Bhotia and Tamta community. Copper ware and
woodcraft decorative items are prepared by these communities. Keeping in view the potential of the
sector in the export market the State Government has set up training cum production centers to
encourage crafts among tribal and other communities.
Tertiary Sector
As discussed earlier, Chamoli is the second largest District of Uttarakhand. It is popular for its hill
stations, picturesque spots and religious centers. The Valley of Flowers is one of the most prominent
among all of them. In order to protect the ecological diversity of this area, the trail up to Dibrugheta in
the National Park was opened to a maximum of 500 tourists per year in a program for eco-tourism
regulated by the Forest Department with active support from local communities. Camping sites have
been developed in several places and the villagers offer home stays, which are becoming increasingly
popular amongst visitors. Further facilities for cycling, camping, mountaineering and cultural tourism
are also planned. Joshimath, where there are hotels, is about 170 km north of the railway station at
Rishikesh, and 220 km from Jolly Grant airport at Dehradun.
Table 56: Tourist spots and pilgrimage centers in Chamoli
Name of the Place Nearby Town Trekking Route Category
Badrinath Badrinath Connected by Highway Pilgrimage
Kedarnath Gourikund 14 km Pilgrimage
Tungnath Ukimath 22 km Pilgrimage
Hemkund Sahib Govind Gath 21 km Pilgrimage
Vedni Bugyal Bean Village 15 km Adventure & Pilgrimage
Roopkund Karnprayag 61km Adventure
Valley of Flowers Govind Gath 19 km Trekking route
Auli Bugyal Joshimath 5 km Trekking & Winter Sports
Gvvaldham Gvvaldham Connected by highway Hill Station
4. Workforce distribution
The total population of Chamoli in 2012 was 3.93 Lakhs which is expected to increase to 4.04 Lakhs
by 2017 and 4.15 Lakhs by 2022. As per our research methodology, the incremental manpower
supply will be about 1.01 Lakhs by 2022.
Table 57: Estimated workforce distribution in Chamoli
Year 2012 2017 2022
Total population 3,93,252 4,04,121 4,15,290
Working age population 2,43160 2,63,076 2,84,624
Labour force 1,49,930 1,93,711 2,50,089
Work force 1,46,622 1,89,366 2,44,572
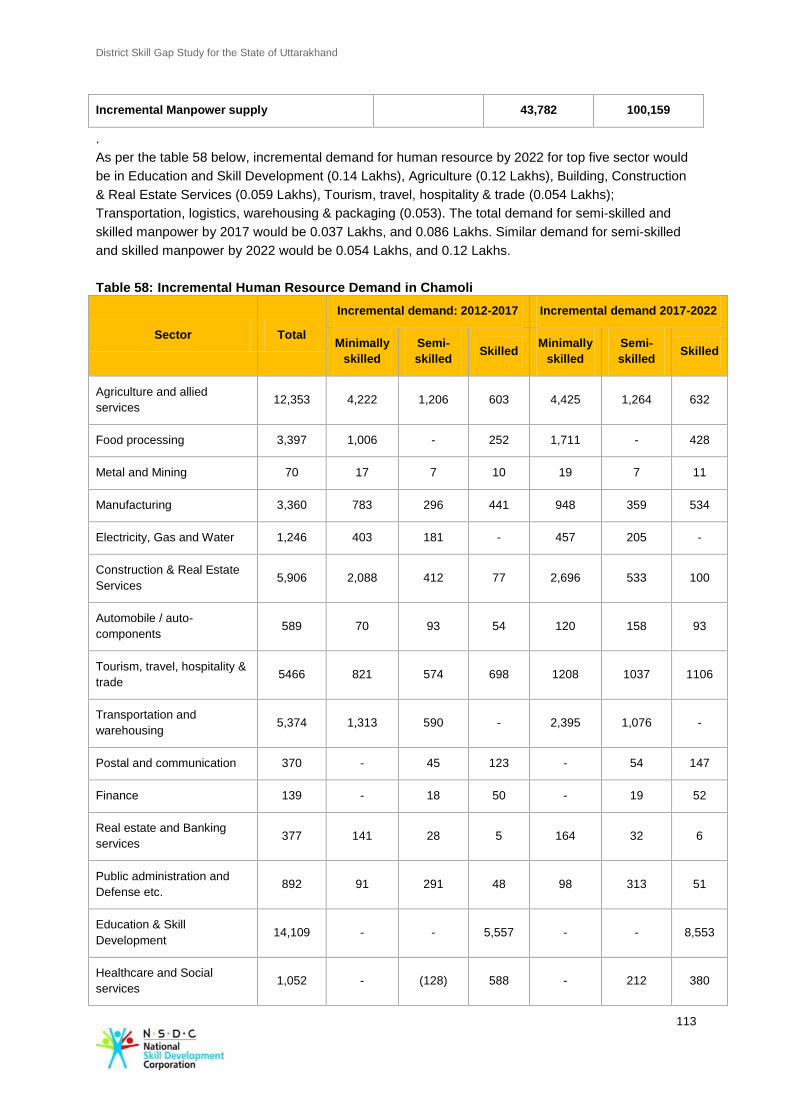
District Skill Gap Study for the State of Uttarakhand
113
Incremental Manpower supply
43,782 100,159
.
As per the table 58 below, incremental demand for human resource by 2022 for top five sector would
be in Education and Skill Development (0.14 Lakhs), Agriculture (0.12 Lakhs), Building, Construction
& Real Estate Services (0.059 Lakhs), Tourism, travel, hospitality & trade (0.054 Lakhs);
Transportation, logistics, warehousing & packaging (0.053). The total demand for semi-skilled and
skilled manpower by 2017 would be 0.037 Lakhs, and 0.086 Lakhs. Similar demand for semi-skilled
and skilled manpower by 2022 would be 0.054 Lakhs, and 0.12 Lakhs.
Table 58: Incremental Human Resource Demand in Chamoli
Sector Total
Incremental demand: 2012-2017 Incremental demand 2017-2022
Minimally
skilled
Semi-
skilled Skilled
Minimally
skilled
Semi-
skilled Skilled
Agriculture and allied
services 12,353 4,222 1,206 603 4,425 1,264 632
Food processing 3,397 1,006 - 252 1,711 - 428
Metal and Mining 70 17 7 10 19 7 11
Manufacturing 3,360 783 296 441 948 359 534
Electricity, Gas and Water 1,246 403 181 - 457 205 -
Construction & Real Estate
Services 5,906 2,088 412 77 2,696 533 100
Automobile / auto-
components 589 70 93 54 120 158 93
Tourism, travel, hospitality &
trade 5466 821 574 698 1208 1037 1106
Transportation and
warehousing 5,374 1,313 590 - 2,395 1,076 -
Postal and communication 370 - 45 123 - 54 147
Finance 139 - 18 50 - 19 52
Real estate and Banking
services 377 141 28 5 164 32 6
Public administration and
Defense etc. 892 91 291 48 98 313 51
Education & Skill
Development 14,109 - - 5,557 - - 8,553
Healthcare and Social
services 1,052 - (128) 588 - 212 380
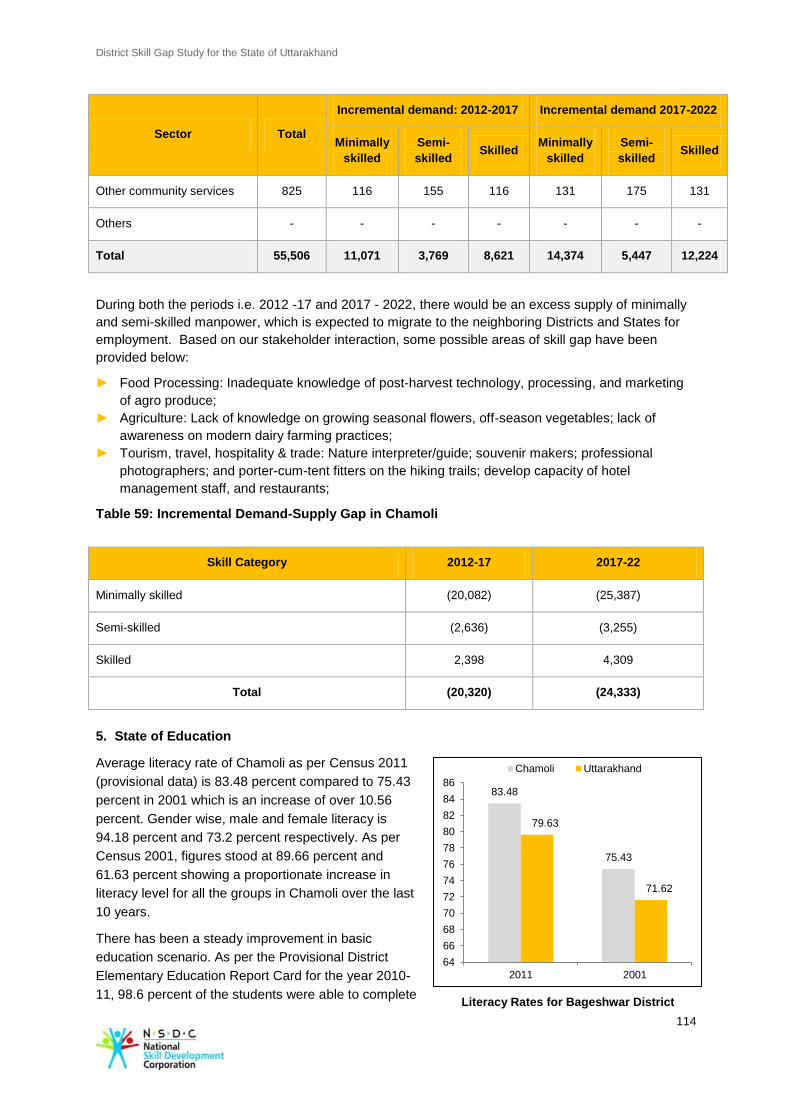
District Skill Gap Study for the State of Uttarakhand
114
Literacy Rates for Bageshwar District
Sector Total
Incremental demand: 2012-2017 Incremental demand 2017-2022
Minimally
skilled
Semi-
skilled Skilled
Minimally
skilled
Semi-
skilled Skilled
Other community services 825 116 155 116 131 175 131
Others - - - - - - -
Total 55,506 11,071 3,769 8,621 14,374 5,447 12,224
During both the periods i.e. 2012 -17 and 2017 - 2022, there would be an excess supply of minimally
and semi-skilled manpower, which is expected to migrate to the neighboring Districts and States for
employment. Based on our stakeholder interaction, some possible areas of skill gap have been
provided below:
► Food Processing: Inadequate knowledge of post-harvest technology, processing, and marketing
of agro produce;
► Agriculture: Lack of knowledge on growing seasonal flowers, off-season vegetables; lack of
awareness on modern dairy farming practices;
► Tourism, travel, hospitality & trade: Nature interpreter/guide; souvenir makers; professional
photographers; and porter-cum-tent fitters on the hiking trails; develop capacity of hotel
management staff, and restaurants;
Table 59: Incremental Demand-Supply Gap in Chamoli
Skill Category 2012-17 2017-22
Minimally skilled (20,082) (25,387)
Semi-skilled (2,636) (3,255)
Skilled 2,398 4,309
Total (20,320) (24,333)
5. State of Education
Average literacy rate of Chamoli as per Census 2011
(provisional data) is 83.48 percent compared to 75.43
percent in 2001 which is an increase of over 10.56
percent. Gender wise, male and female literacy is
94.18 percent and 73.2 percent respectively. As per
Census 2001, figures stood at 89.66 percent and
61.63 percent showing a proportionate increase in
literacy level for all the groups in Chamoli over the last
10 years.
There has been a steady improvement in basic
education scenario. As per the Provisional District
Elementary Education Report Card for the year 2010-
11, 98.6 percent of the students were able to complete
83.48
75.43
79.63
71.62
64
66
68
70
72
74
76
78
80
82
84
86
2011 2001
Chamoli Uttarakhand
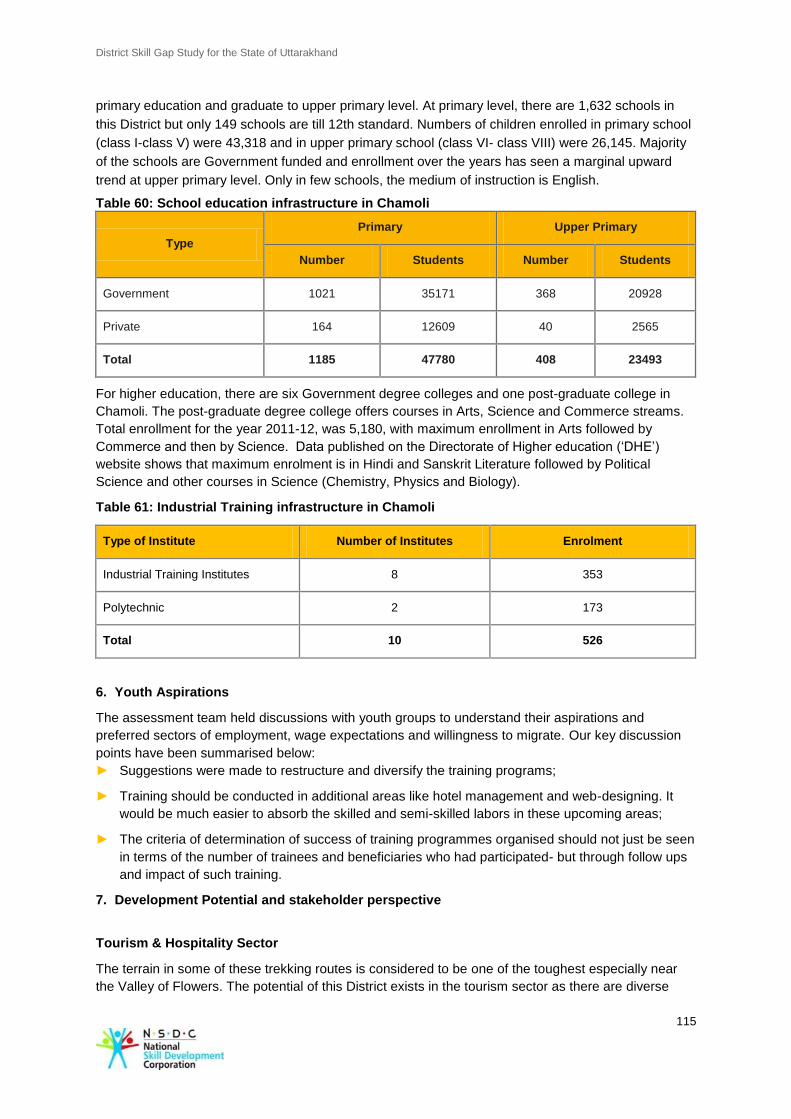
District Skill Gap Study for the State of Uttarakhand
115
primary education and graduate to upper primary level. At primary level, there are 1,632 schools in
this District but only 149 schools are till 12th standard. Numbers of children enrolled in primary school
(class I-class V) were 43,318 and in upper primary school (class VI- class VIII) were 26,145. Majority
of the schools are Government funded and enrollment over the years has seen a marginal upward
trend at upper primary level. Only in few schools, the medium of instruction is English.
Table 60: School education infrastructure in Chamoli
Type
Primary Upper Primary
Number Students Number Students
Government 1021 35171 368 20928
Private 164 12609 40 2565
Total 1185 47780 408 23493
For higher education, there are six Government degree colleges and one post-graduate college in
Chamoli. The post-graduate degree college offers courses in Arts, Science and Commerce streams.
Total enrollment for the year 2011-12, was 5,180, with maximum enrollment in Arts followed by
Commerce and then by Science. Data published on the Directorate of Higher education (‘DHE’)
website shows that maximum enrolment is in Hindi and Sanskrit Literature followed by Political
Science and other courses in Science (Chemistry, Physics and Biology).
Table 61: Industrial Training infrastructure in Chamoli
Type of Institute Number of Institutes Enrolment
Industrial Training Institutes 8 353
Polytechnic 2 173
Total 10 526
6. Youth Aspirations
The assessment team held discussions with youth groups to understand their aspirations and
preferred sectors of employment, wage expectations and willingness to migrate. Our key discussion
points have been summarised below:
► Suggestions were made to restructure and diversify the training programs;
► Training should be conducted in additional areas like hotel management and web-designing. It
would be much easier to absorb the skilled and semi-skilled labors in these upcoming areas;
► The criteria of determination of success of training programmes organised should not just be seen
in terms of the number of trainees and beneficiaries who had participated- but through follow ups
and impact of such training.
7. Development Potential and stakeholder perspective
Tourism & Hospitality Sector
The terrain in some of these trekking routes is considered to be one of the toughest especially near
the Valley of Flowers. The potential of this District exists in the tourism sector as there are diverse

District Skill Gap Study for the State of Uttarakhand
116
natures of attractions, i.e. religious as well as for adventures.
Poor condition of the trekking paths, insufficient shelter points, lack of trained nature and trek guides,
difficult terrain for Trekkers (the mule and trekkers path coincide and the trek generally remains
littered) are some of the key reasons due to which the region still remains underdeveloped.
A District level initiative on development of quality hotels and regularization of accommodation
facilities in terms of grading as per the facilities offered will help in standardizing the quality of
hotels/lodges.
Apart from the direct benefits from building new infrastructure, indirect effects will also accrue to the
economy as tourism has strong forward, backward and lateral linkages with other sectors of the
economy. This could easily generate demands for snack/ tea shops, restaurants, photography,
printing and publishing work (brochures, booklets, pamphlets), trek equipment (shoes, raincoats,
sticks) etc.
All this will need training for nature interpreter/guide, souvenir makers, professional photographers
and porter-cum-tent fitters on the hiking trails.
Agriculture, Horticulture and Floriculture
Most of the farm activities are done manually on the traditional lines with the help of animal driven
implements. Use of heavy equipment’s is not feasible due to terrace farming and scattered land
holdings. Thus, focus needs to be shifted on post-harvest mechanization that will help in value
addition of the produce. The storage capacity for the produce needs to be upgraded from present, 10
seed go downs/ fertilizer depots, 52 rural go downs and one Food Corporation of India go down.
Fruits, vegetable and spices are available in abundance here but there is negligible post-harvest value
addition. Agro-processing activities are mainly for wheat grinding (flour mills) and fruit processing
(jam, jelly, pickle, potato chips etc.). However, the marketing of fruits and vegetables is unorganized
and all the produce is generally sold through middlemen. Thus, farmers generally don’t get the fair
price for their produce.
Development of opportunities by crop diversification in horticulture and floriculture would be highly
beneficial. Apples, citrus, walnuts, peaches, off-season vegetables, spices, are some of the crops
suitable for this kind of climate. The existing farmer’s cooperatives need to have focused training on
marketing of agro processed products.
Chamoli District produces costly flowers like lily, lotus, rose, sunflower, rhododendron, etc. The World
heritage site “Valley of Flowers” is located in this District. These flowers have huge demand in cities
like Dehradun, Delhi, and Srinagar (Uttarakhand), etc. The local farmers sell their flower produce to
the middlemen at very low rates due to lack of market knowledge. There is a scope for enhancing the
marketing skills through trainings to farmers since they have limited marketing skills and market
knowledge.
Animal Husbandry
As already mentioned, majority of the people in this region are small and marginal farmers. Dairy
animals were noted to provide additional income to them. Currently, dairy is derived primarily from
cows and buffaloes. Like other Districts of Uttarakhand, the productivity in terms of milk is low in this
District as well. However, there is a potential for use of smaller animals like sheep, pigs, etc.
Sheep rearers in Chamoli use traditional techniques of extracting raw wool from the sheep which
impedes the quality and quantity of the wool. Therefore, since the wool does not meet the quality
standards possible through mechanized shearing, the sheep rearers are not able to get the best
prices for it. Consequently, there is a skill gap needed to be fulfilled by providing training on the
modern techniques of wool shearing and processing.
Further training of qualified youth in the veterinary services as para-vets, will help in meeting shortage
District Skill Gap Study for the State of Uttarakhand
117
of skilled staff in animal care. State officials should encourage private veterinary clinics and
consultants for providing knowledge and training on animal reproduction, disease control and value
addition in dairy products.
Handicrafts and Handlooms
A majority of the Bhotia community living in the District are involved in the woolen industry. The
process of weaving, finishing and partially merchandising wool products is practiced by the female
members of the households. They generally produce shawl, garments, blankets, rugs and carpets.
The raw material for the wool is sheared from the sheep. They sell their produce to small retail shops
locally but find it difficult to find bigger and more lucrative markets due to the lack of branding and/or
focused marketing efforts. So even though all these hand-made products represent the rich heritage
of Garhwal, a lot of its potential remains untapped due to lack of marketing skills.
In order to promote handicrafts, the Government recently identified six clusters in the State famous for
handicrafts for ages. One of them is Chinka cluster, which is administered by the Chamoli District.
Under this cluster, several facilities like yarn depots and common facility centres are available.
Meetings are arranged between the exporters and artisans and several workshops are conducted for
improving the productivity and capacity. But a lot of work needs to be done in ensuring an assured
market for these products. The tools and equipment’s are also based on very old and traditional
techniques leading to higher cost of production; thereby causing difficulties in the sale of the final
products.
Therefore, there emerges a need for trainings to upgrade the technology and production techniques.
There is need for upgrading their skills, product diversifications, product designing, market oriented
products, participation in exhibitions in India and abroad.
The designs which are used to make these products are outdated and the cost of making these
traditional designs is also high. Setting up of an Institute of Design, which can work with these artisans
will help in imparting technological skills to the artisans.
During our discussion with the officials at DIC, Chamoli regarding existing training programs (which
are funded by the State and MSME, GoI) following concerns were shared:
► Sourcing of trainees is a major concern since it was reported that most trainings organized by the
DIC were attended by the same participants.
► There hasn’t been any evaluation of the programmes which are being conducted to follow up and
ascertain the impact of the trainings.
Based on our interaction with various stakeholders, some key areas which provide skill development
opportunity have been provided in the table below:
Table 62: Sector and skill requirement
Sector Skill Requirements
Primary Crop diversification in horticulture and floriculture has a potential. Skills for food
processing and marketing of organic farming products need to be honed.
Sheep rearing with modern techniques is critical to leverage on existing Animal
Husbandry activities within the District.
Secondary Improvisation of designs and technology used in handloom products especially
those produced by the Bhotia community. Branding and Marketing skills to be
able to develop forward linkages.
Tertiary Tourism has strong potential with a number of hill stations, picturesque spots
and religious centres and the presence of Valley of Flowers in the District.
Hotel Management Hospitality related skills will be beneficial in Customer
District Skill Gap Study for the State of Uttarakhand
118
Servicing, Tour Guiding, Adventure Sports, etc.
8. Recommendations
Government ► Skilling infrastructure in the identified six clusters for Handicrafts in District
needs to be strengthened. Government should promote training on
product diversification, product design, and skill upgradation of artisans
and traditional handicraft workers
► Curriculum development of ITI courses on Horticulture, Floriculture to
meet the demand for skilled manpower in the District,
NSDC ► Support KVK to provide training in use of modern farm equipment’s,
technology, and farming practices.
► Extend support to VTP on training related to wool production, food
processing technology, and post-harvest technology
Industry ► Major hospitality firms in the State and the country should be encouraged
to set up properties to help promote the District as a tourist destination.
This provides opportunities for introducing various skilling programs for
cooks, waiters, house-keeping and other hotel/ restaurant management
roles.
Vocational Training
Providers
► Training on new methods, techniques, and mechanization in farming.
Encouraging value addition to herb cultivation.
► Training on new methods, techniques, and mechanization in the hosiery
and wool industry.
► It is essential to incorporate a component of soft skill training like
communication skills, personality development etc. in all courses.
► Incorporate practical training as a substantial part of the existing
curriculum of technical courses.
► Skilling and up gradation of existing skills related to automobile repair and
household electronic service can be provided.
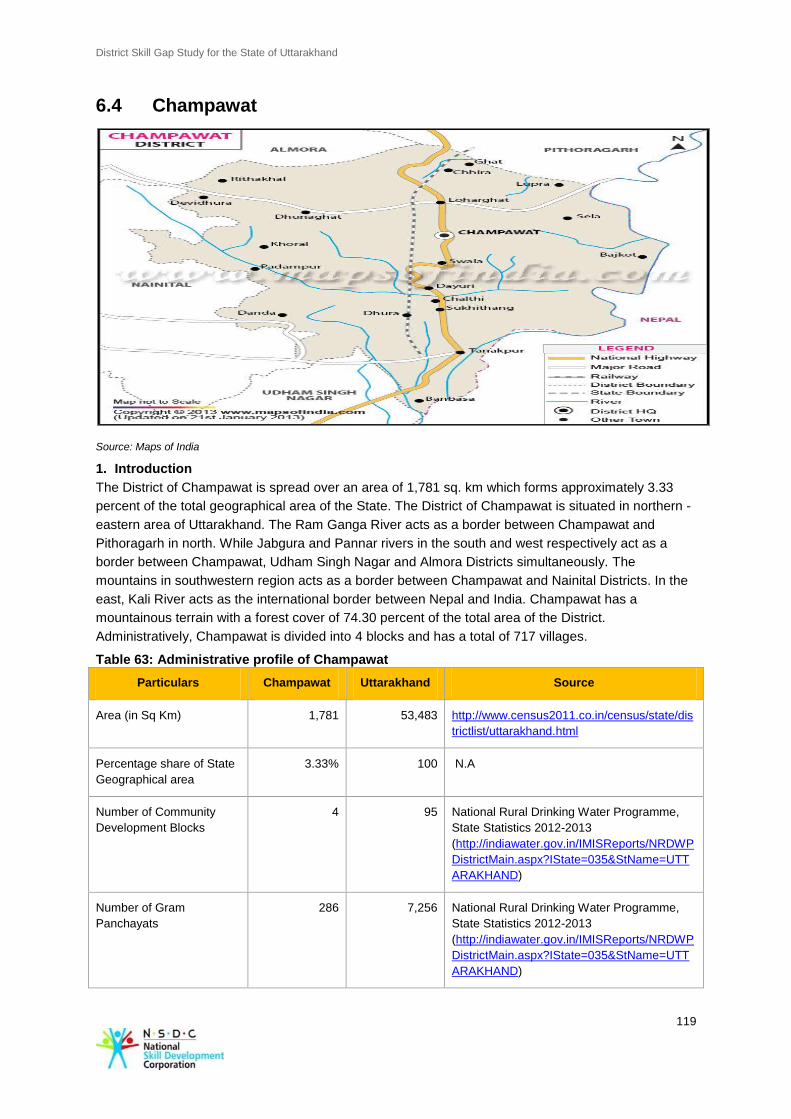
District Skill Gap Study for the State of Uttarakhand
119
6.4 Champawat
Source: Maps of India
1. Introduction
The District of Champawat is spread over an area of 1,781 sq. km which forms approximately 3.33
percent of the total geographical area of the State. The District of Champawat is situated in northern -
eastern area of Uttarakhand. The Ram Ganga River acts as a border between Champawat and
Pithoragarh in north. While Jabgura and Pannar rivers in the south and west respectively act as a
border between Champawat, Udham Singh Nagar and Almora Districts simultaneously. The
mountains in southwestern region acts as a border between Champawat and Nainital Districts. In the
east, Kali River acts as the international border between Nepal and India. Champawat has a
mountainous terrain with a forest cover of 74.30 percent of the total area of the District.
Administratively, Champawat is divided into 4 blocks and has a total of 717 villages.
Table 63: Administrative profile of Champawat
Particulars Champawat Uttarakhand Source
Area (in Sq Km) 1,781 53,483 http://www.census2011.co.in/census/state/dis
trictlist/uttarakhand.html
Percentage share of State
Geographical area
3.33% 100 N.A
Number of Community
Development Blocks
4 95 National Rural Drinking Water Programme,
State Statistics 2012-2013
(http://indiawater.gov.in/IMISReports/NRDWP
DistrictMain.aspx?IState=035&StName=UTT
ARAKHAND)
Number of Gram
Panchayats
286 7,256 National Rural Drinking Water Programme,
State Statistics 2012-2013
(http://indiawater.gov.in/IMISReports/NRDWP
DistrictMain.aspx?IState=035&StName=UTT
ARAKHAND)
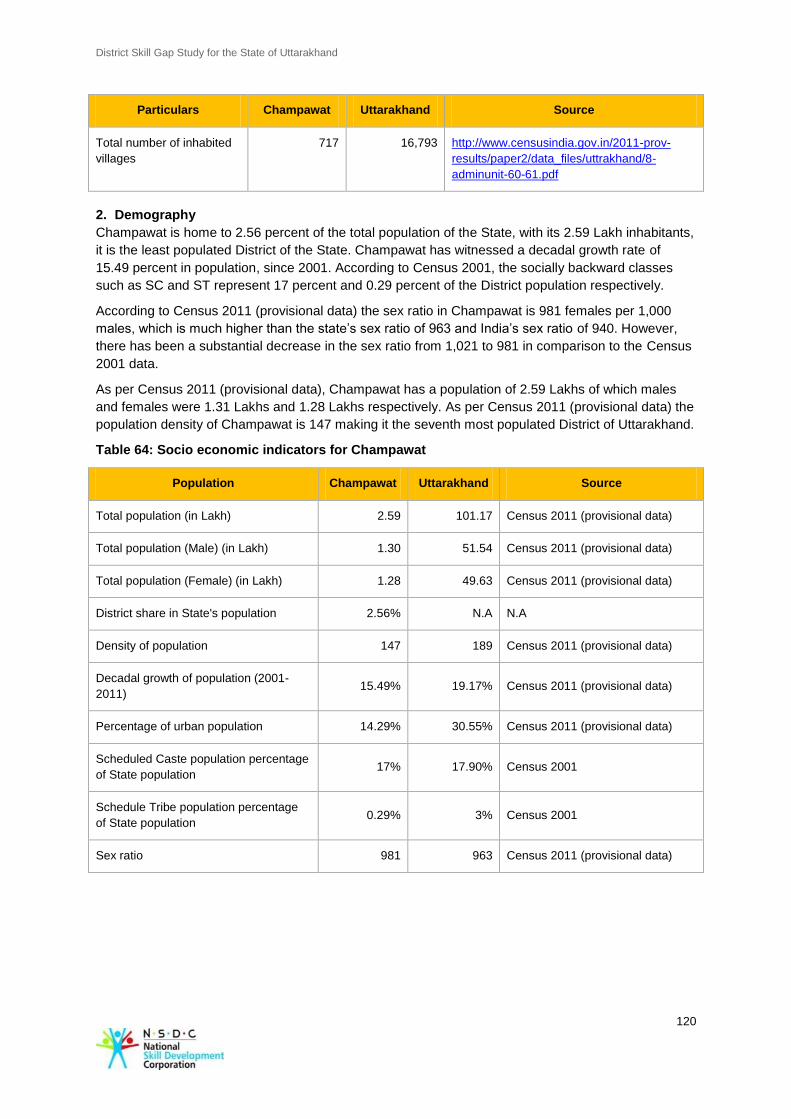
District Skill Gap Study for the State of Uttarakhand
120
Particulars Champawat Uttarakhand Source
Total number of inhabited
villages
717 16,793 http://www.censusindia.gov.in/2011-prov-
results/paper2/data_files/uttrakhand/8-
adminunit-60-61.pdf
2. Demography
Champawat is home to 2.56 percent of the total population of the State, with its 2.59 Lakh inhabitants,
it is the least populated District of the State. Champawat has witnessed a decadal growth rate of
15.49 percent in population, since 2001. According to Census 2001, the socially backward classes
such as SC and ST represent 17 percent and 0.29 percent of the District population respectively.
According to Census 2011 (provisional data) the sex ratio in Champawat is 981 females per 1,000
males, which is much higher than the state’s sex ratio of 963 and India’s sex ratio of 940. However,
there has been a substantial decrease in the sex ratio from 1,021 to 981 in comparison to the Census
2001 data.
As per Census 2011 (provisional data), Champawat has a population of 2.59 Lakhs of which males
and females were 1.31 Lakhs and 1.28 Lakhs respectively. As per Census 2011 (provisional data) the
population density of Champawat is 147 making it the seventh most populated District of Uttarakhand.
Table 64: Socio economic indicators for Champawat
Population Champawat Uttarakhand Source
Total population (in Lakh) 2.59 101.17 Census 2011 (provisional data)
Total population (Male) (in Lakh) 1.30 51.54 Census 2011 (provisional data)
Total population (Female) (in Lakh) 1.28 49.63 Census 2011 (provisional data)
District share in State's population 2.56% N.A N.A
Density of population 147 189 Census 2011 (provisional data)
Decadal growth of population (2001-
2011) 15.49% 19.17% Census 2011 (provisional data)
Percentage of urban population 14.29% 30.55% Census 2011 (provisional data)
Scheduled Caste population percentage
of State population 17% 17.90% Census 2001
Schedule Tribe population percentage
of State population 0.29% 3% Census 2001
Sex ratio 981 963 Census 2011 (provisional data)
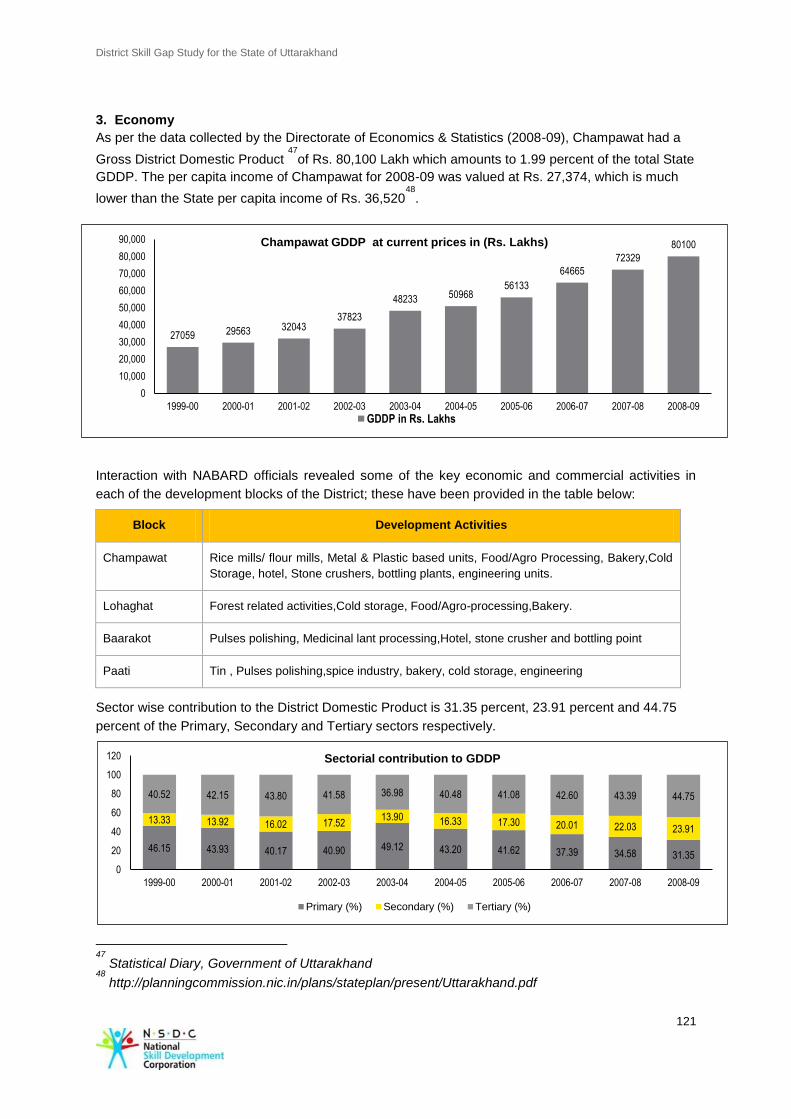
District Skill Gap Study for the State of Uttarakhand
121
3. Economy
As per the data collected by the Directorate of Economics & Statistics (2008-09), Champawat had a
Gross District Domestic Product 47
of Rs. 80,100 Lakh which amounts to 1.99 percent of the total State
GDDP. The per capita income of Champawat for 2008-09 was valued at Rs. 27,374, which is much
lower than the State per capita income of Rs. 36,52048
.
Interaction with NABARD officials revealed some of the key economic and commercial activities in
each of the development blocks of the District; these have been provided in the table below:
Block Development Activities
Champawat Rice mills/ flour mills, Metal & Plastic based units, Food/Agro Processing, Bakery,Cold
Storage, hotel, Stone crushers, bottling plants, engineering units.
Lohaghat Forest related activities,Cold storage, Food/Agro-processing,Bakery.
Baarakot Pulses polishing, Medicinal lant processing,Hotel, stone crusher and bottling point
Paati Tin , Pulses polishing,spice industry, bakery, cold storage, engineering
Sector wise contribution to the District Domestic Product is 31.35 percent, 23.91 percent and 44.75
percent of the Primary, Secondary and Tertiary sectors respectively.
47
Statistical Diary, Government of Uttarakhand 48
http://planningcommission.nic.in/plans/stateplan/present/Uttarakhand.pdf
46.15 43.93 40.17 40.90 49.12 43.20 41.62 37.39 34.58 31.35
13.33 13.92 16.02 17.52 13.90 16.33 17.30 20.01 22.03 23.91
40.52 42.15 43.80 41.58 36.98 40.48 41.08 42.60 43.39 44.75
0
20
40
60
80
100
120
1999-00 2000-01 2001-02 2002-03 2003-04 2004-05 2005-06 2006-07 2007-08 2008-09
Sectorial contribution to GDDP
Primary (%) Secondary (%) Tertiary (%)
27059 29563 32043 37823
48233 50968 56133
64665
72329
80100
0
10,000
20,000
30,000
40,000
50,000
60,000
70,000
80,000
90,000
1999-00 2000-01 2001-02 2002-03 2003-04 2004-05 2005-06 2006-07 2007-08 2008-09
Champawat GDDP at current prices in (Rs. Lakhs)
GDDP in Rs. Lakhs
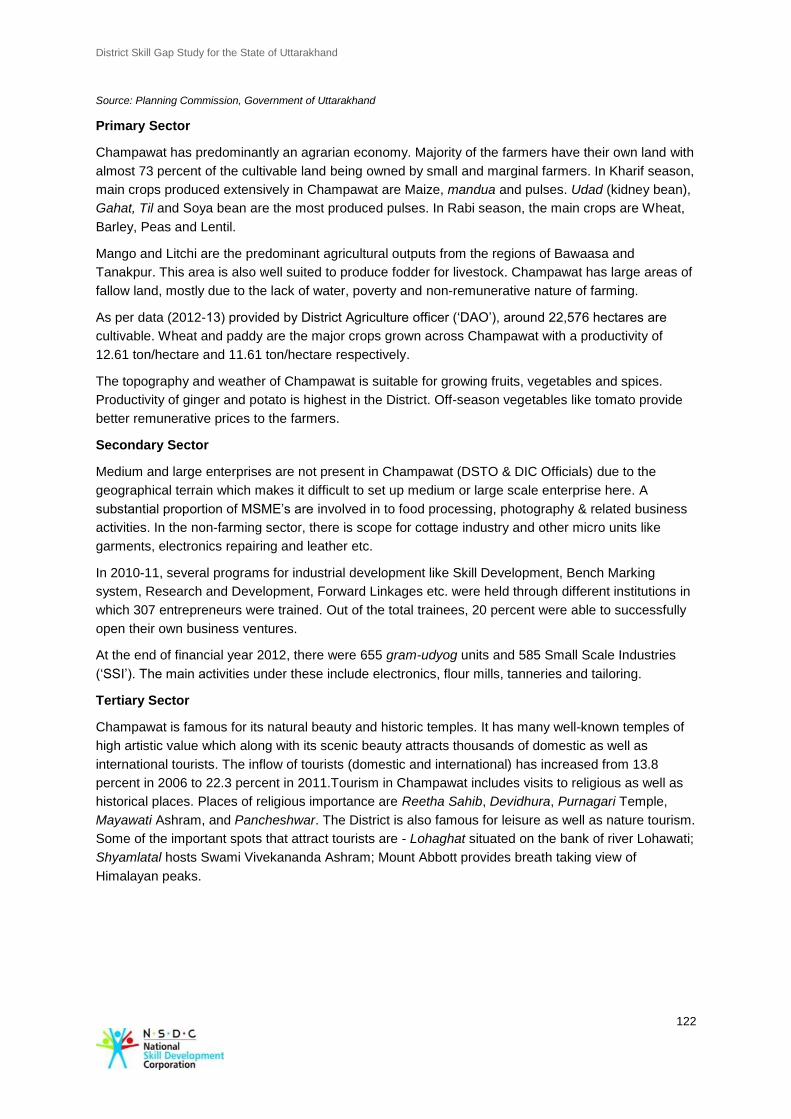
District Skill Gap Study for the State of Uttarakhand
122
Source: Planning Commission, Government of Uttarakhand
Primary Sector
Champawat has predominantly an agrarian economy. Majority of the farmers have their own land with
almost 73 percent of the cultivable land being owned by small and marginal farmers. In Kharif season,
main crops produced extensively in Champawat are Maize, mandua and pulses. Udad (kidney bean),
Gahat, Til and Soya bean are the most produced pulses. In Rabi season, the main crops are Wheat,
Barley, Peas and Lentil.
Mango and Litchi are the predominant agricultural outputs from the regions of Bawaasa and
Tanakpur. This area is also well suited to produce fodder for livestock. Champawat has large areas of
fallow land, mostly due to the lack of water, poverty and non-remunerative nature of farming.
As per data (2012-13) provided by District Agriculture officer (‘DAO’), around 22,576 hectares are
cultivable. Wheat and paddy are the major crops grown across Champawat with a productivity of
12.61 ton/hectare and 11.61 ton/hectare respectively.
The topography and weather of Champawat is suitable for growing fruits, vegetables and spices.
Productivity of ginger and potato is highest in the District. Off-season vegetables like tomato provide
better remunerative prices to the farmers.
Secondary Sector
Medium and large enterprises are not present in Champawat (DSTO & DIC Officials) due to the
geographical terrain which makes it difficult to set up medium or large scale enterprise here. A
substantial proportion of MSME’s are involved in to food processing, photography & related business
activities. In the non-farming sector, there is scope for cottage industry and other micro units like
garments, electronics repairing and leather etc.
In 2010-11, several programs for industrial development like Skill Development, Bench Marking
system, Research and Development, Forward Linkages etc. were held through different institutions in
which 307 entrepreneurs were trained. Out of the total trainees, 20 percent were able to successfully
open their own business ventures.
At the end of financial year 2012, there were 655 gram-udyog units and 585 Small Scale Industries
(‘SSI’). The main activities under these include electronics, flour mills, tanneries and tailoring.
Tertiary Sector
Champawat is famous for its natural beauty and historic temples. It has many well-known temples of
high artistic value which along with its scenic beauty attracts thousands of domestic as well as
international tourists. The inflow of tourists (domestic and international) has increased from 13.8
percent in 2006 to 22.3 percent in 2011.Tourism in Champawat includes visits to religious as well as
historical places. Places of religious importance are Reetha Sahib, Devidhura, Purnagari Temple,
Mayawati Ashram, and Pancheshwar. The District is also famous for leisure as well as nature tourism.
Some of the important spots that attract tourists are - Lohaghat situated on the bank of river Lohawati;
Shyamlatal hosts Swami Vivekananda Ashram; Mount Abbott provides breath taking view of
Himalayan peaks.
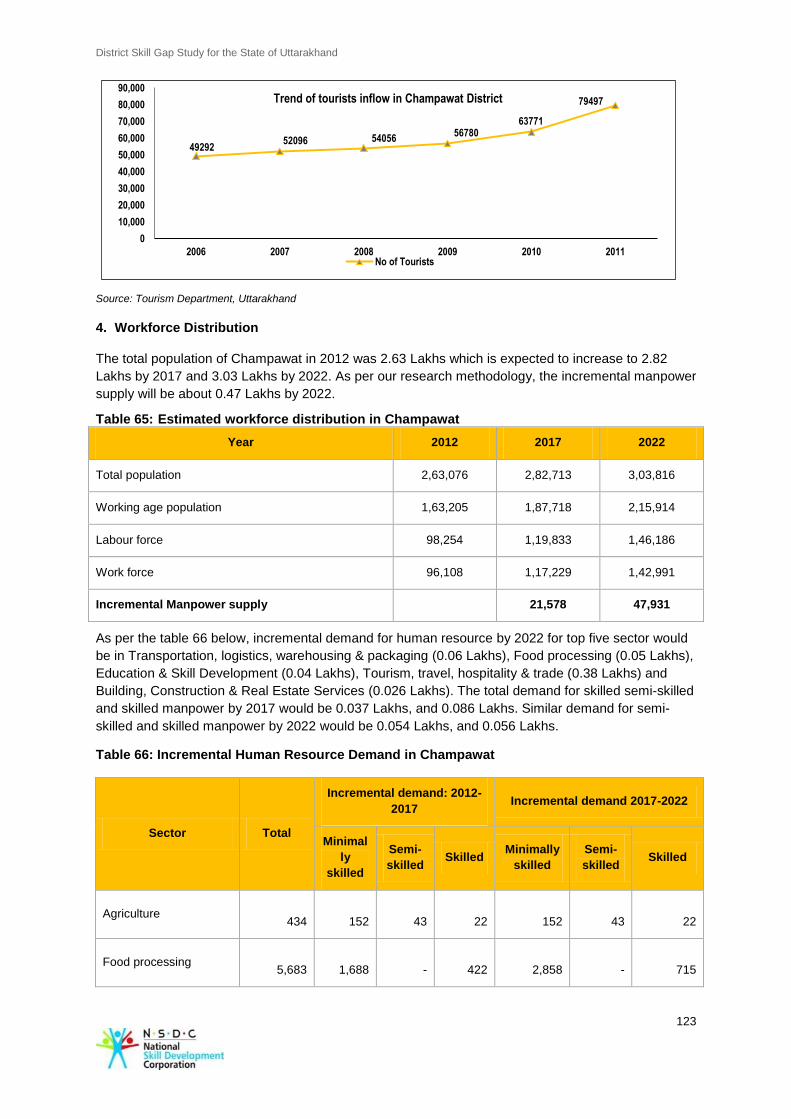
District Skill Gap Study for the State of Uttarakhand
123
Source: Tourism Department, Uttarakhand
4. Workforce Distribution The total population of Champawat in 2012 was 2.63 Lakhs which is expected to increase to 2.82
Lakhs by 2017 and 3.03 Lakhs by 2022. As per our research methodology, the incremental manpower
supply will be about 0.47 Lakhs by 2022.
Table 65: Estimated workforce distribution in Champawat
Year 2012 2017 2022
Total population 2,63,076 2,82,713 3,03,816
Working age population 1,63,205 1,87,718 2,15,914
Labour force 98,254 1,19,833 1,46,186
Work force 96,108 1,17,229 1,42,991
Incremental Manpower supply
21,578 47,931
As per the table 66 below, incremental demand for human resource by 2022 for top five sector would
be in Transportation, logistics, warehousing & packaging (0.06 Lakhs), Food processing (0.05 Lakhs),
Education & Skill Development (0.04 Lakhs), Tourism, travel, hospitality & trade (0.38 Lakhs) and
Building, Construction & Real Estate Services (0.026 Lakhs). The total demand for skilled semi-skilled
and skilled manpower by 2017 would be 0.037 Lakhs, and 0.086 Lakhs. Similar demand for semi-
skilled and skilled manpower by 2022 would be 0.054 Lakhs, and 0.056 Lakhs.
Table 66: Incremental Human Resource Demand in Champawat
Sector Total
Incremental demand: 2012-
2017 Incremental demand 2017-2022
Minimal
ly
skilled
Semi-
skilled Skilled
Minimally
skilled
Semi-
skilled Skilled
Agriculture
434
152
43
22
152
43
22
Food processing
5,683
1,688
-
422
2,858
-
715
49292 52096 54056
56780 63771
79497
0
10,000
20,000
30,000
40,000
50,000
60,000
70,000
80,000
90,000
2006 2007 2008 2009 2010 2011
Trend of tourists inflow in Champawat District
No of Tourists
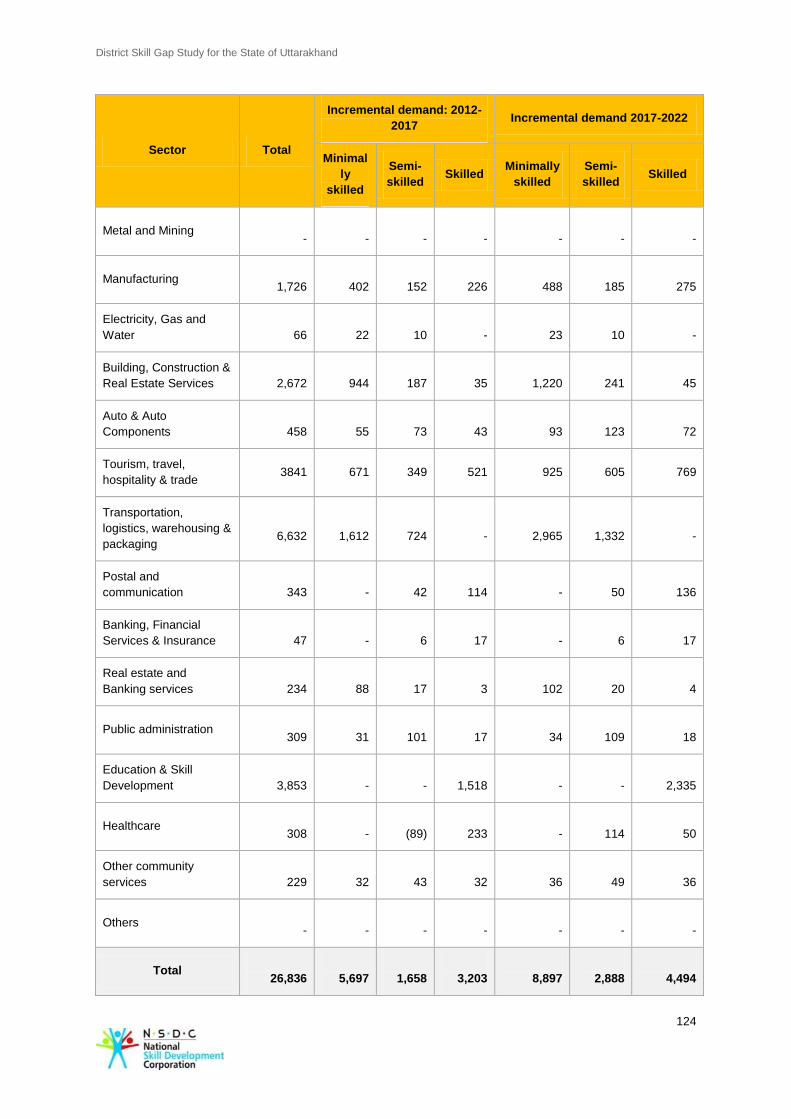
District Skill Gap Study for the State of Uttarakhand
124
Sector Total
Incremental demand: 2012-
2017 Incremental demand 2017-2022
Minimal
ly
skilled
Semi-
skilled Skilled
Minimally
skilled
Semi-
skilled Skilled
Metal and Mining
-
-
-
-
-
-
-
Manufacturing
1,726
402
152
226
488
185
275
Electricity, Gas and
Water
66
22
10
-
23
10
-
Building, Construction &
Real Estate Services
2,672
944
187
35
1,220
241
45
Auto & Auto
Components
458
55
73
43
93
123
72
Tourism, travel,
hospitality & trade 3841 671 349 521 925 605 769
Transportation,
logistics, warehousing &
packaging
6,632
1,612
724
-
2,965
1,332
-
Postal and
communication
343
-
42
114
-
50
136
Banking, Financial
Services & Insurance
47
-
6
17
-
6
17
Real estate and
Banking services
234
88
17
3
102
20
4
Public administration
309
31
101
17
34
109
18
Education & Skill
Development
3,853
-
-
1,518
-
-
2,335
Healthcare
308
-
(89)
233
-
114
50
Other community
services
229
32
43
32
36
49
36
Others
-
-
-
-
-
-
-
Total
26,836
5,697
1,658
3,203
8,897
2,888
4,494
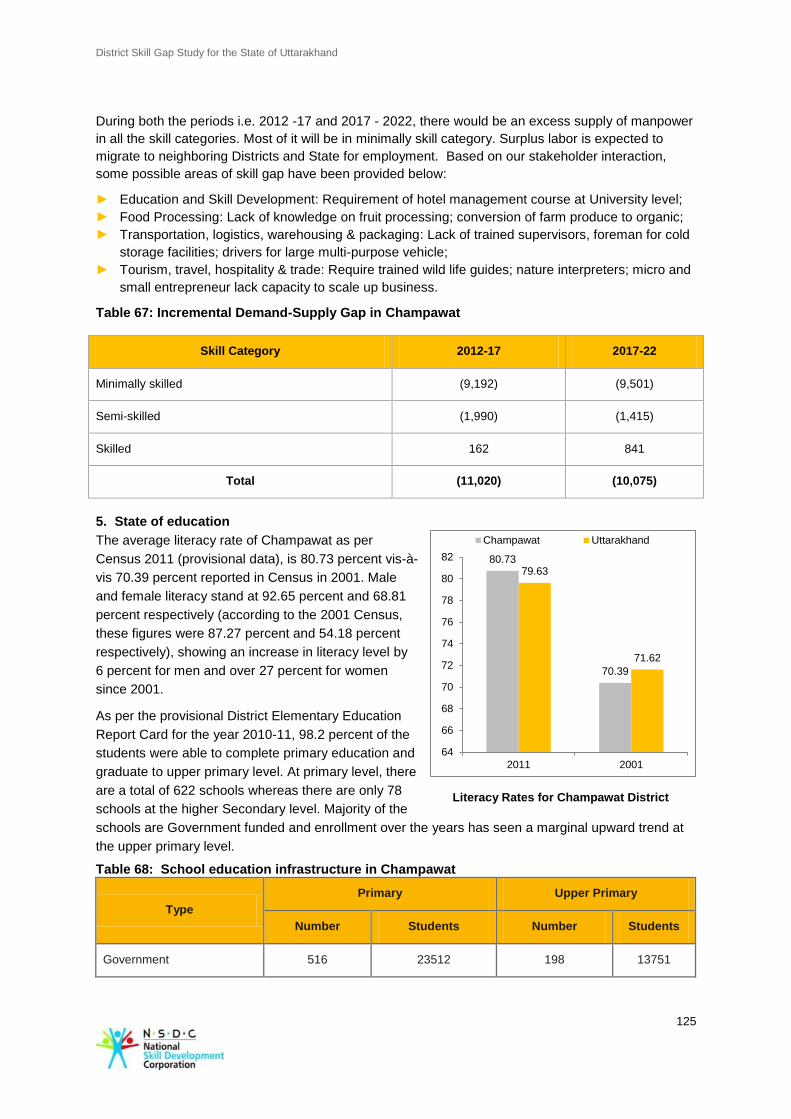
District Skill Gap Study for the State of Uttarakhand
125
80.73
70.39
79.63
71.62
64
66
68
70
72
74
76
78
80
82
2011 2001
Champawat Uttarakhand
During both the periods i.e. 2012 -17 and 2017 - 2022, there would be an excess supply of manpower
in all the skill categories. Most of it will be in minimally skill category. Surplus labor is expected to
migrate to neighboring Districts and State for employment. Based on our stakeholder interaction,
some possible areas of skill gap have been provided below:
► Education and Skill Development: Requirement of hotel management course at University level;
► Food Processing: Lack of knowledge on fruit processing; conversion of farm produce to organic;
► Transportation, logistics, warehousing & packaging: Lack of trained supervisors, foreman for cold
storage facilities; drivers for large multi-purpose vehicle;
► Tourism, travel, hospitality & trade: Require trained wild life guides; nature interpreters; micro and
small entrepreneur lack capacity to scale up business.
Table 67: Incremental Demand-Supply Gap in Champawat
Skill Category 2012-17 2017-22
Minimally skilled (9,192) (9,501)
Semi-skilled (1,990) (1,415)
Skilled 162 841
Total (11,020) (10,075)
5. State of education
The average literacy rate of Champawat as per
Census 2011 (provisional data), is 80.73 percent vis-à-
vis 70.39 percent reported in Census in 2001. Male
and female literacy stand at 92.65 percent and 68.81
percent respectively (according to the 2001 Census,
these figures were 87.27 percent and 54.18 percent
respectively), showing an increase in literacy level by
6 percent for men and over 27 percent for women
since 2001.
As per the provisional District Elementary Education
Report Card for the year 2010-11, 98.2 percent of the
students were able to complete primary education and
graduate to upper primary level. At primary level, there
are a total of 622 schools whereas there are only 78
schools at the higher Secondary level. Majority of the
schools are Government funded and enrollment over the years has seen a marginal upward trend at
the upper primary level.
Table 68: School education infrastructure in Champawat
Type
Primary Upper Primary
Number Students Number Students
Government 516 23512 198 13751
Literacy Rates for Champawat District
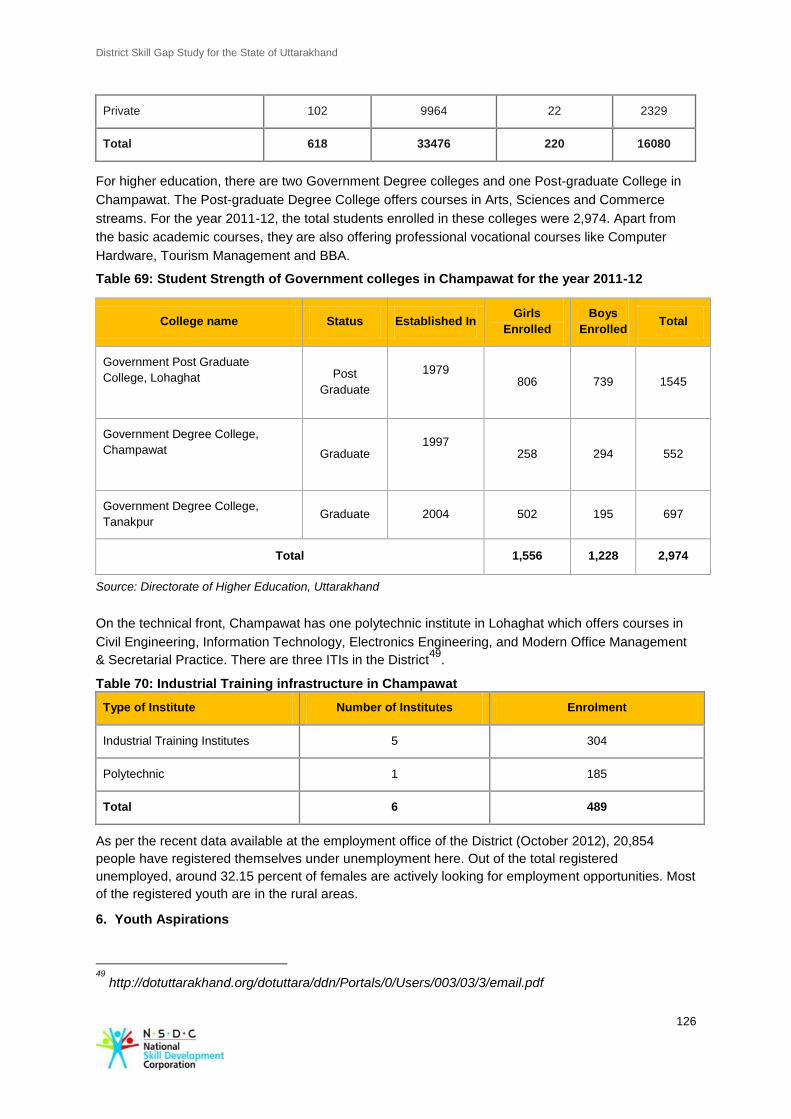
District Skill Gap Study for the State of Uttarakhand
126
Private 102 9964 22 2329
Total 618 33476 220 16080
For higher education, there are two Government Degree colleges and one Post-graduate College in
Champawat. The Post-graduate Degree College offers courses in Arts, Sciences and Commerce
streams. For the year 2011-12, the total students enrolled in these colleges were 2,974. Apart from
the basic academic courses, they are also offering professional vocational courses like Computer
Hardware, Tourism Management and BBA.
Table 69: Student Strength of Government colleges in Champawat for the year 2011-12
Source: Directorate of Higher Education, Uttarakhand
On the technical front, Champawat has one polytechnic institute in Lohaghat which offers courses in
Civil Engineering, Information Technology, Electronics Engineering, and Modern Office Management
& Secretarial Practice. There are three ITIs in the District49
.
Table 70: Industrial Training infrastructure in Champawat
Type of Institute Number of Institutes Enrolment
Industrial Training Institutes 5 304
Polytechnic 1 185
Total 6 489
As per the recent data available at the employment office of the District (October 2012), 20,854
people have registered themselves under unemployment here. Out of the total registered
unemployed, around 32.15 percent of females are actively looking for employment opportunities. Most
of the registered youth are in the rural areas.
6. Youth Aspirations
49
http://dotuttarakhand.org/dotuttara/ddn/Portals/0/Users/003/03/3/email.pdf
College name Status Established In Girls
Enrolled
Boys
Enrolled Total
Government Post Graduate
College, Lohaghat
Post
Graduate
1979
806 739 1545
Government Degree College,
Champawat
Graduate 1997
258 294 552
Government Degree College,
Tanakpur Graduate 2004 502 195 697
Total 1,556 1,228 2,974
District Skill Gap Study for the State of Uttarakhand
127
The assessment team also held discussions with youth groups to understand their aspirations and
preferred sectors of employment, willingness to migrate, training etc. Our key discussion points have
been summarised below:
Youth foresee a lot of employment potential in industries related to tourism.
Majority of the youth prefer to migrate to other plain areas of the District where the demand isn’t
completely seasonal.
During our interaction with the youth, it was suggested that courses in the Government universities
need to be restructured keeping in line with the demand-based employment opportunities in the
District.
7. Development potential and stakeholder perspective
As per discussions with concerned stakeholders (Additional District Magistrate, District Industrial
Center, District Rural Development Authority, and District Statistical Officer) in the District, following
sectors have growth potential in Champawat:
Tourism & Hospitality Sector
As discussed earlier, Champawat is known for its scenic beauty. In the past decade, tourism as an
industry has provided different avenues of employment. In the service sector, hotels, cyber cafes,
motels, yoga meditation centers and tourist guides services have been promising.
Although there has been an increase in the number of hotels, motels and resorts over the last few
years, the quality has remained sub-standard. This is due to the fact that as the industry is seasonal in
nature, it hasn’t been able to attract quality skilled labour. There is no institute or organization in
Champawat providing any type of training on hotel management or related courses. Training related
to hotel management can be provided to stop the seasonal migration. Professional courses on hotel
management could be initiated at University level.
In Champawat, the focus has been on cultural tourism but there is also scope for wildlife tourism.
Training for wildlife guides and nature interpreters’ could be the key area to focus in the near future.
Resources need to be mobilized for infrastructure up-gradation in terms of road, connectivity and
electricity.
Horticulture
Around the valley region of Champawat, cultivation of tropical fruits like mango, litchi, lemon and
banana is very economical. In the dense forest areas, there is availability of medicinal and aromatic
plants but so far the investments are at a very small scale by some companies like Dabur and
Hamdard. The local population can avail the benefits of the available natural resources if awareness
is created on the identification and use of herbs and how value added products can get them better
returns.
Agro-Seasonal Zone Fruits cultivated in that zone
Low range (1000 meters and below) Mango, litchi, wood apple , lemon and its kinds, papaya,
grapes and banana
Medium range (Between 1000 and 2500) meters Pear, plum, almonds, Peach, walnut and pomegranate
High range (2500 meters and above) Apple, pear, cherry, almonds, chestnut and apricot
At present, there are six Government nurseries which provide seed and fertilizers to the farmers on a
regular basis. Capacity utilization is inadequate and unavailability of cold storage facility creates
hindrance in promotion of forward linkages (i.e. Agro-based industries).
District Skill Gap Study for the State of Uttarakhand
128
Training and skill development in processing and packaging units for fruits like almonds, peaches,
apples, etc. in Champawat will help in providing employment opportunities.
Animal Husbandry (Dairy)
Dairy, poultry farming and sheep rearing are the prominent animal husbandry activities in the District.
However, local breeds of dairy animals aren’t considered that productive. Thus, the focus has shifted
to buffaloes and sankar breed of cows. Champawat is very rich in flora and fauna and a huge
availabilty of the greenland gives scope for goat and sheep rearing. The training on skill development
in the processing of good quality wool can fetch a good price for the locals.
Farm mechanization is close to negligible in this District. Therefore, the farmers are also dependent
on dairy animals for agriculture related activities. Further, cow-dung is used for the production of bio-
gas used as cooking gas. There is a bio-gas development and training Center in Dehradun but there
are no such centres in this District. In Champawat, use of Bio-gas is not prevalent due to the fact that
there is abundance of cooking wood. However, the potential of setting up bio gas plants is huge due
to the availability of cow dung and the availability of farm waste. Setting up a District level training
centre would be beneficial as there is a need to organize workshops for the rural people regarding the
economic and environmental benefits by using renewable sources of energy.
There are climatic differences within the District itself as the Terai region is comapratively very hot as
compared to the rest of the hilly regions of the District. Thus, a training for the Hotel entrepreneurs
regarding the use of solar water heaters particulary in the Terai area could possibly help in skill
development of the locals which can be extensively used as cost saving technique.
Agro- Processing Units
As already discussed, size of land holdings is small in the District and the produce is generally for
subsistence and local markets. Thus, the scale of agro processing units is small and totally
unorganized. There exists a huge potential in preserving and processing of fruits and aromatic and
medicinal plants.
As per our interaction with the farmers (individuals and small groups), it was mentioned that most of
the fruits and vegetables are graded manually in terms of color, shape and appearance. Grades are
assigned as A, B and C (order from high quality to low quality). Grade A and B for apples and
tomatoes are generally sold very quickly in the mandi but the grade C quality produce doesen’t have
many buyers. Some of the challenges faced are:
No initiatives have been taken for the development of the processing units
Sub-standard transportation and cold storage facilities
Lack of training in the organic food processing units
With the above challenges faced following are the recommendations based on the potential available:
► Food processing centres could be set up for jams and juices for fruits and chatni & ketchup for
tomatoes. The necessary skills should also be developed for the same.
► The usage of fertilizer in Champawat is one of the lowest among all Districts in the State. Organic
produce generally gets better remunerative prices in the international market, so by improving on
infrastructure bottlenecks and inculcating marketing and business development skills, export
potential can be availed.
► A State level initiative coupled with strengthening of infrastructure and training in organic food
processing is required to integrate the farmers through SHGs for generating extra surplus for
international produce.
Other Services
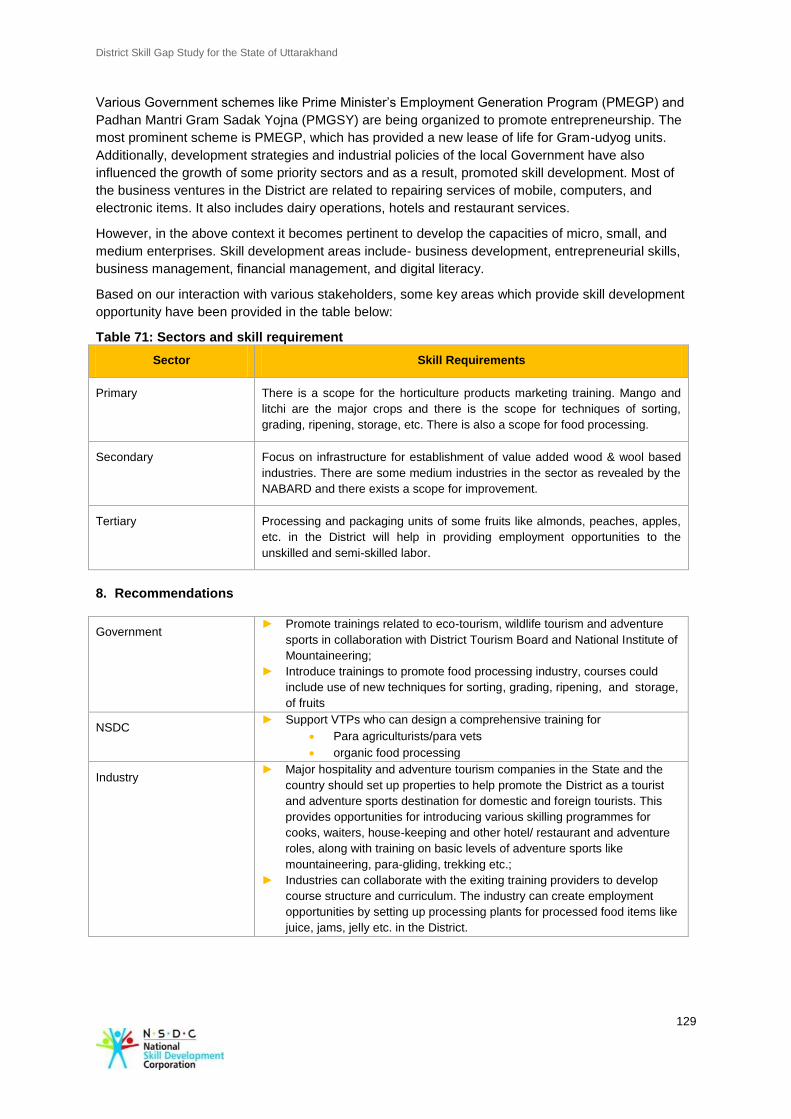
District Skill Gap Study for the State of Uttarakhand
129
Various Government schemes like Prime Minister’s Employment Generation Program (PMEGP) and
Padhan Mantri Gram Sadak Yojna (PMGSY) are being organized to promote entrepreneurship. The
most prominent scheme is PMEGP, which has provided a new lease of life for Gram-udyog units.
Additionally, development strategies and industrial policies of the local Government have also
influenced the growth of some priority sectors and as a result, promoted skill development. Most of
the business ventures in the District are related to repairing services of mobile, computers, and
electronic items. It also includes dairy operations, hotels and restaurant services.
However, in the above context it becomes pertinent to develop the capacities of micro, small, and
medium enterprises. Skill development areas include- business development, entrepreneurial skills,
business management, financial management, and digital literacy.
Based on our interaction with various stakeholders, some key areas which provide skill development
opportunity have been provided in the table below:
Table 71: Sectors and skill requirement
Sector Skill Requirements
Primary There is a scope for the horticulture products marketing training. Mango and
litchi are the major crops and there is the scope for techniques of sorting,
grading, ripening, storage, etc. There is also a scope for food processing.
Secondary Focus on infrastructure for establishment of value added wood & wool based
industries. There are some medium industries in the sector as revealed by the
NABARD and there exists a scope for improvement.
Tertiary Processing and packaging units of some fruits like almonds, peaches, apples,
etc. in the District will help in providing employment opportunities to the
unskilled and semi-skilled labor.
8. Recommendations
Government ► Promote trainings related to eco-tourism, wildlife tourism and adventure
sports in collaboration with District Tourism Board and National Institute of
Mountaineering;
► Introduce trainings to promote food processing industry, courses could
include use of new techniques for sorting, grading, ripening, and storage,
of fruits
NSDC ► Support VTPs who can design a comprehensive training for
Para agriculturists/para vets
organic food processing
Industry ► Major hospitality and adventure tourism companies in the State and the
country should set up properties to help promote the District as a tourist
and adventure sports destination for domestic and foreign tourists. This
provides opportunities for introducing various skilling programmes for
cooks, waiters, house-keeping and other hotel/ restaurant and adventure
roles, along with training on basic levels of adventure sports like
mountaineering, para-gliding, trekking etc.;
► Industries can collaborate with the exiting training providers to develop
course structure and curriculum. The industry can create employment
opportunities by setting up processing plants for processed food items like
juice, jams, jelly etc. in the District.
District Skill Gap Study for the State of Uttarakhand
130
Vocational Training
Providers
► VTC in the District should introduce short term training programmes on
basic levels of adventure sports, hotel management/ tourism related skills
including culinary, housekeeping, waiter, bartending, trekking guides etc.;
► The VTCs can also train the forest dwellers to become wildlife guides and
caretakers, so that they can be formally appointed on Government
payrolls.
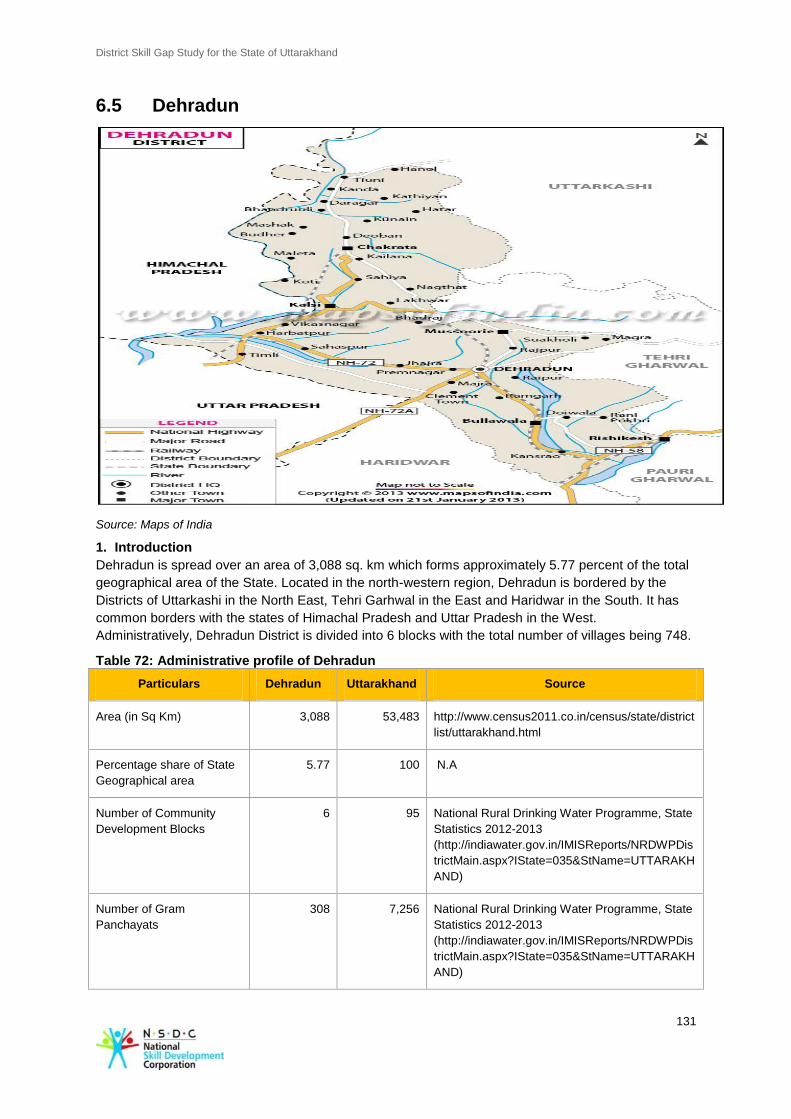
District Skill Gap Study for the State of Uttarakhand
131
6.5 Dehradun
Source: Maps of India
1. Introduction
Dehradun is spread over an area of 3,088 sq. km which forms approximately 5.77 percent of the total
geographical area of the State. Located in the north-western region, Dehradun is bordered by the
Districts of Uttarkashi in the North East, Tehri Garhwal in the East and Haridwar in the South. It has
common borders with the states of Himachal Pradesh and Uttar Pradesh in the West.
Administratively, Dehradun District is divided into 6 blocks with the total number of villages being 748.
Table 72: Administrative profile of Dehradun
Particulars Dehradun Uttarakhand Source
Area (in Sq Km) 3,088 53,483 http://www.census2011.co.in/census/state/district
list/uttarakhand.html
Percentage share of State
Geographical area
5.77 100 N.A
Number of Community
Development Blocks
6 95 National Rural Drinking Water Programme, State
Statistics 2012-2013
(http://indiawater.gov.in/IMISReports/NRDWPDis
trictMain.aspx?IState=035&StName=UTTARAKH
AND)
Number of Gram
Panchayats
308 7,256 National Rural Drinking Water Programme, State
Statistics 2012-2013
(http://indiawater.gov.in/IMISReports/NRDWPDis
trictMain.aspx?IState=035&StName=UTTARAKH
AND)
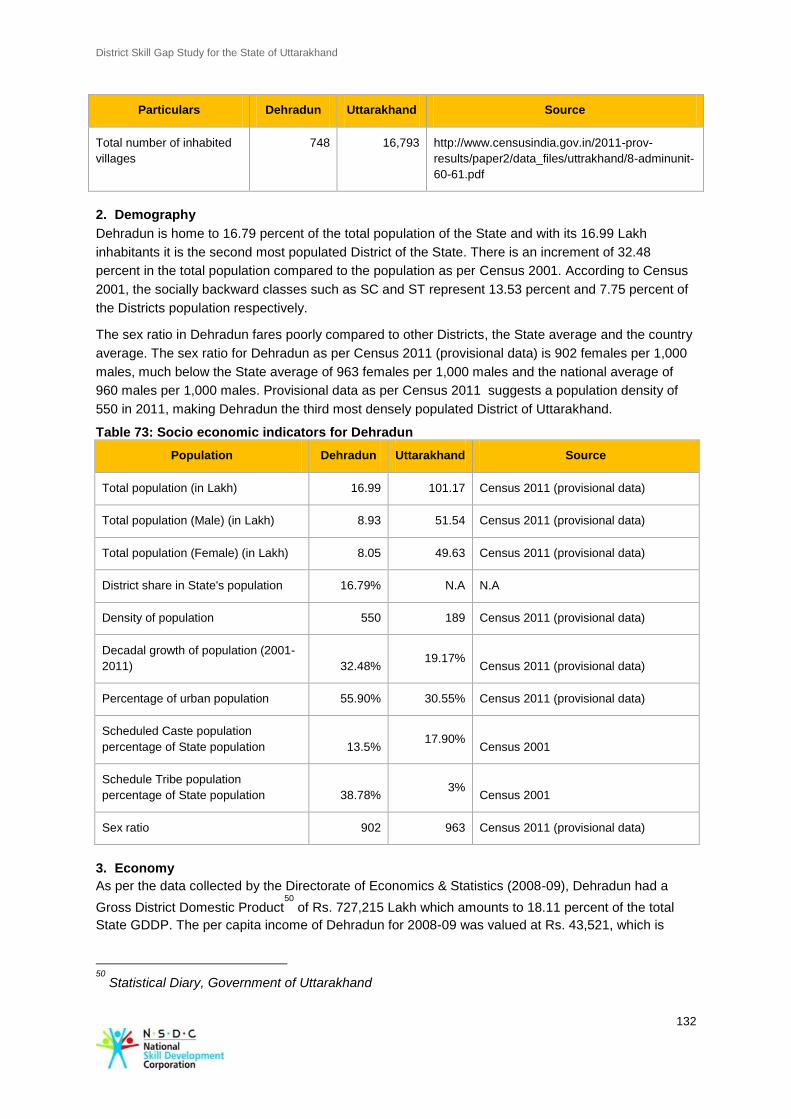
District Skill Gap Study for the State of Uttarakhand
132
Particulars Dehradun Uttarakhand Source
Total number of inhabited
villages
748 16,793 http://www.censusindia.gov.in/2011-prov-
results/paper2/data_files/uttrakhand/8-adminunit-
60-61.pdf
2. Demography
Dehradun is home to 16.79 percent of the total population of the State and with its 16.99 Lakh
inhabitants it is the second most populated District of the State. There is an increment of 32.48
percent in the total population compared to the population as per Census 2001. According to Census
2001, the socially backward classes such as SC and ST represent 13.53 percent and 7.75 percent of
the Districts population respectively.
The sex ratio in Dehradun fares poorly compared to other Districts, the State average and the country
average. The sex ratio for Dehradun as per Census 2011 (provisional data) is 902 females per 1,000
males, much below the State average of 963 females per 1,000 males and the national average of
960 males per 1,000 males. Provisional data as per Census 2011 suggests a population density of
550 in 2011, making Dehradun the third most densely populated District of Uttarakhand.
Table 73: Socio economic indicators for Dehradun
Population Dehradun Uttarakhand Source
Total population (in Lakh) 16.99 101.17 Census 2011 (provisional data)
Total population (Male) (in Lakh) 8.93 51.54 Census 2011 (provisional data)
Total population (Female) (in Lakh) 8.05 49.63 Census 2011 (provisional data)
District share in State's population 16.79% N.A N.A
Density of population 550 189 Census 2011 (provisional data)
Decadal growth of population (2001-
2011) 32.48% 19.17%
Census 2011 (provisional data)
Percentage of urban population 55.90% 30.55% Census 2011 (provisional data)
Scheduled Caste population
percentage of State population 13.5% 17.90%
Census 2001
Schedule Tribe population
percentage of State population 38.78% 3%
Census 2001
Sex ratio 902 963 Census 2011 (provisional data)
3. Economy
As per the data collected by the Directorate of Economics & Statistics (2008-09), Dehradun had a
Gross District Domestic Product50
of Rs. 727,215 Lakh which amounts to 18.11 percent of the total
State GDDP. The per capita income of Dehradun for 2008-09 was valued at Rs. 43,521, which is
50
Statistical Diary, Government of Uttarakhand
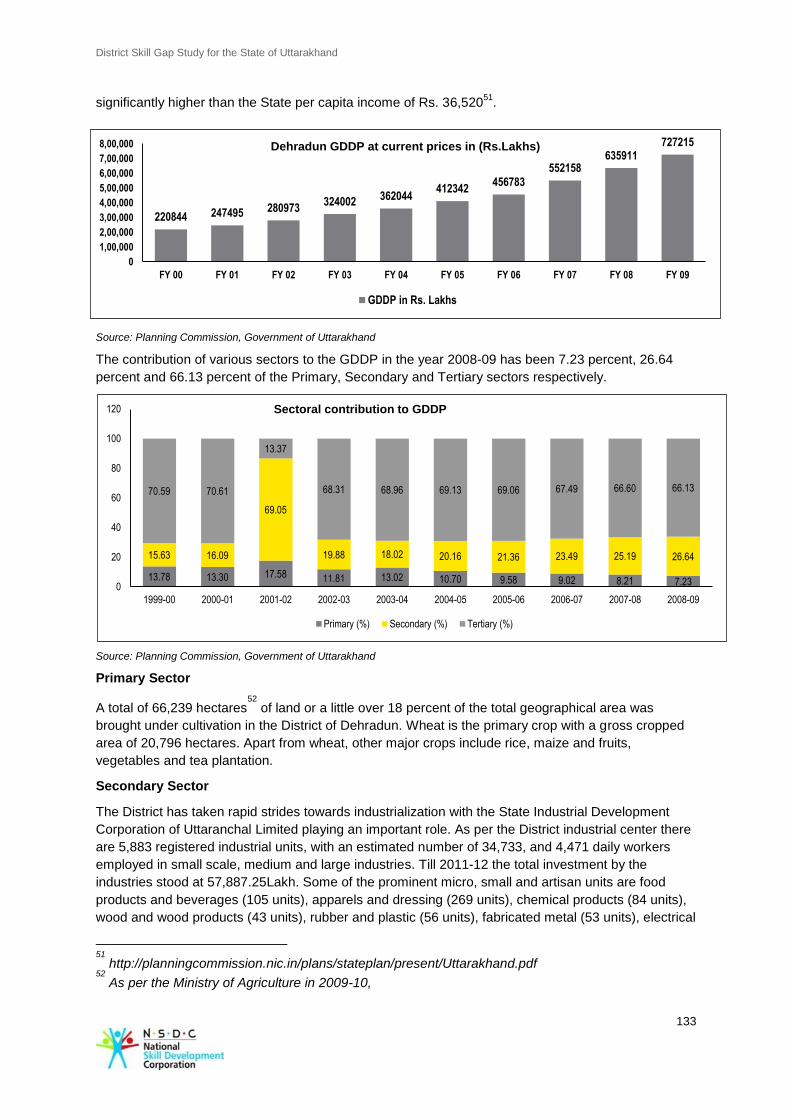
District Skill Gap Study for the State of Uttarakhand
133
significantly higher than the State per capita income of Rs. 36,52051
.
Source: Planning Commission, Government of Uttarakhand
The contribution of various sectors to the GDDP in the year 2008-09 has been 7.23 percent, 26.64
percent and 66.13 percent of the Primary, Secondary and Tertiary sectors respectively.
Source: Planning Commission, Government of Uttarakhand
Primary Sector
A total of 66,239 hectares52
of land or a little over 18 percent of the total geographical area was
brought under cultivation in the District of Dehradun. Wheat is the primary crop with a gross cropped
area of 20,796 hectares. Apart from wheat, other major crops include rice, maize and fruits,
vegetables and tea plantation.
Secondary Sector
The District has taken rapid strides towards industrialization with the State Industrial Development
Corporation of Uttaranchal Limited playing an important role. As per the District industrial center there
are 5,883 registered industrial units, with an estimated number of 34,733, and 4,471 daily workers
employed in small scale, medium and large industries. Till 2011-12 the total investment by the
industries stood at 57,887.25Lakh. Some of the prominent micro, small and artisan units are food
products and beverages (105 units), apparels and dressing (269 units), chemical products (84 units),
wood and wood products (43 units), rubber and plastic (56 units), fabricated metal (53 units), electrical
51
http://planningcommission.nic.in/plans/stateplan/present/Uttarakhand.pdf 52
As per the Ministry of Agriculture in 2009-10,
13.78 13.30 17.58 11.81 13.02 10.70 9.58 9.02 8.21 7.23
15.63 16.09
69.05
19.88 18.02 20.16 21.36 23.49 25.19 26.64
70.59 70.61
13.37
68.31 68.96 69.13 69.06 67.49 66.60 66.13
0
20
40
60
80
100
120
1999-00 2000-01 2001-02 2002-03 2003-04 2004-05 2005-06 2006-07 2007-08 2008-09
Sectoral contribution to GDDP
Primary (%) Secondary (%) Tertiary (%)
220844 247495 280973 324002
362044 412342
456783
552158 635911
727215
0
1,00,000
2,00,000
3,00,000
4,00,000
5,00,000
6,00,000
7,00,000
8,00,000
FY 00 FY 01 FY 02 FY 03 FY 04 FY 05 FY 06 FY 07 FY 08 FY 09
Dehradun GDDP at current prices in (Rs.Lakhs)
GDDP in Rs. Lakhs
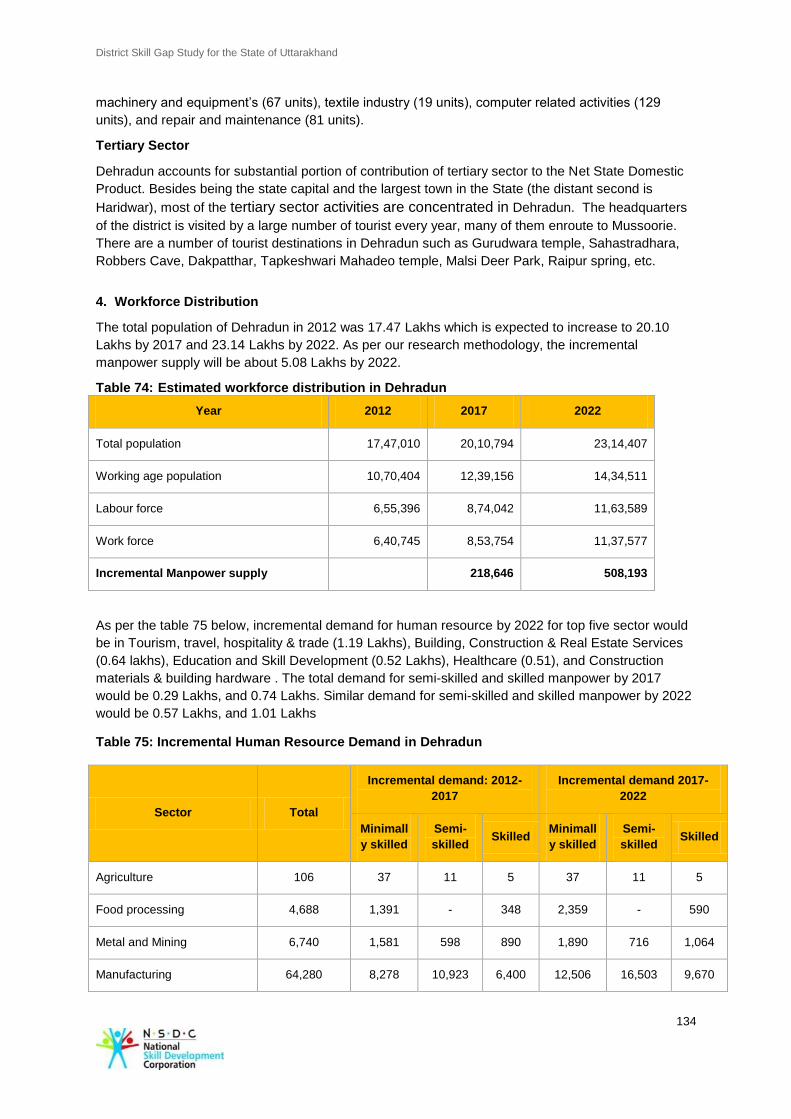
District Skill Gap Study for the State of Uttarakhand
134
machinery and equipment’s (67 units), textile industry (19 units), computer related activities (129
units), and repair and maintenance (81 units).
Tertiary Sector
Dehradun accounts for substantial portion of contribution of tertiary sector to the Net State Domestic
Product. Besides being the state capital and the largest town in the State (the distant second is
Haridwar), most of the tertiary sector activities are concentrated in Dehradun. The headquarters
of the district is visited by a large number of tourist every year, many of them enroute to Mussoorie.
There are a number of tourist destinations in Dehradun such as Gurudwara temple, Sahastradhara,
Robbers Cave, Dakpatthar, Tapkeshwari Mahadeo temple, Malsi Deer Park, Raipur spring, etc.
4. Workforce Distribution
The total population of Dehradun in 2012 was 17.47 Lakhs which is expected to increase to 20.10
Lakhs by 2017 and 23.14 Lakhs by 2022. As per our research methodology, the incremental
manpower supply will be about 5.08 Lakhs by 2022.
Table 74: Estimated workforce distribution in Dehradun
Year 2012 2017 2022
Total population 17,47,010 20,10,794 23,14,407
Working age population 10,70,404 12,39,156 14,34,511
Labour force 6,55,396 8,74,042 11,63,589
Work force 6,40,745 8,53,754 11,37,577
Incremental Manpower supply 218,646 508,193
As per the table 75 below, incremental demand for human resource by 2022 for top five sector would
be in Tourism, travel, hospitality & trade (1.19 Lakhs), Building, Construction & Real Estate Services
(0.64 lakhs), Education and Skill Development (0.52 Lakhs), Healthcare (0.51), and Construction
materials & building hardware . The total demand for semi-skilled and skilled manpower by 2017
would be 0.29 Lakhs, and 0.74 Lakhs. Similar demand for semi-skilled and skilled manpower by 2022
would be 0.57 Lakhs, and 1.01 Lakhs
Table 75: Incremental Human Resource Demand in Dehradun
Sector Total
Incremental demand: 2012-
2017
Incremental demand 2017-
2022
Minimall
y skilled
Semi-
skilled Skilled
Minimall
y skilled
Semi-
skilled Skilled
Agriculture 106 37 11 5 37 11 5
Food processing 4,688 1,391 - 348 2,359 - 590
Metal and Mining 6,740 1,581 598 890 1,890 716 1,064
Manufacturing 64,280 8,278 10,923 6,400 12,506 16,503 9,670
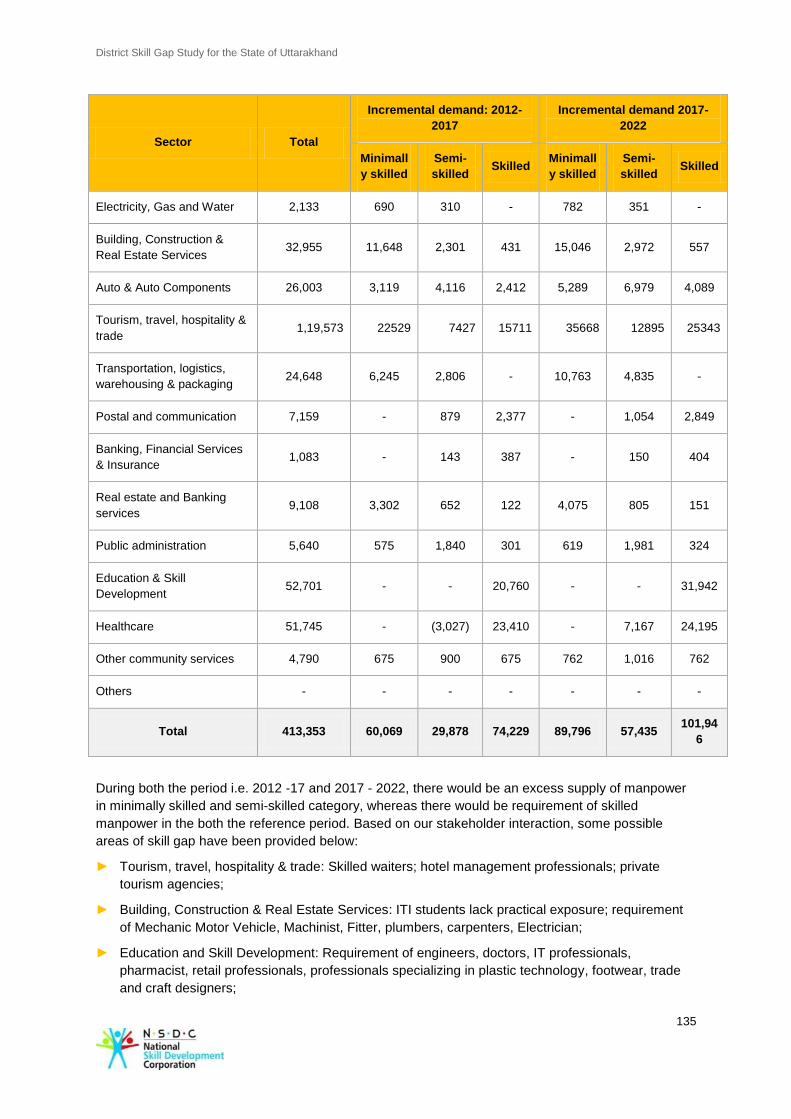
District Skill Gap Study for the State of Uttarakhand
135
Sector Total
Incremental demand: 2012-
2017
Incremental demand 2017-
2022
Minimall
y skilled
Semi-
skilled Skilled
Minimall
y skilled
Semi-
skilled Skilled
Electricity, Gas and Water 2,133 690 310 - 782 351 -
Building, Construction &
Real Estate Services 32,955 11,648 2,301 431 15,046 2,972 557
Auto & Auto Components 26,003 3,119 4,116 2,412 5,289 6,979 4,089
Tourism, travel, hospitality &
trade 1,19,573 22529 7427 15711 35668 12895 25343
Transportation, logistics,
warehousing & packaging 24,648 6,245 2,806 - 10,763 4,835 -
Postal and communication 7,159 - 879 2,377 - 1,054 2,849
Banking, Financial Services
& Insurance 1,083 - 143 387 - 150 404
Real estate and Banking
services 9,108 3,302 652 122 4,075 805 151
Public administration 5,640 575 1,840 301 619 1,981 324
Education & Skill
Development 52,701 - - 20,760 - - 31,942
Healthcare 51,745 - (3,027) 23,410 - 7,167 24,195
Other community services 4,790 675 900 675 762 1,016 762
Others - - - - - - -
Total 413,353 60,069 29,878 74,229 89,796 57,435 101,94
6
During both the period i.e. 2012 -17 and 2017 - 2022, there would be an excess supply of manpower
in minimally skilled and semi-skilled category, whereas there would be requirement of skilled
manpower in the both the reference period. Based on our stakeholder interaction, some possible
areas of skill gap have been provided below:
► Tourism, travel, hospitality & trade: Skilled waiters; hotel management professionals; private
tourism agencies;
► Building, Construction & Real Estate Services: ITI students lack practical exposure; requirement
of Mechanic Motor Vehicle, Machinist, Fitter, plumbers, carpenters, Electrician;
► Education and Skill Development: Requirement of engineers, doctors, IT professionals,
pharmacist, retail professionals, professionals specializing in plastic technology, footwear, trade
and craft designers;
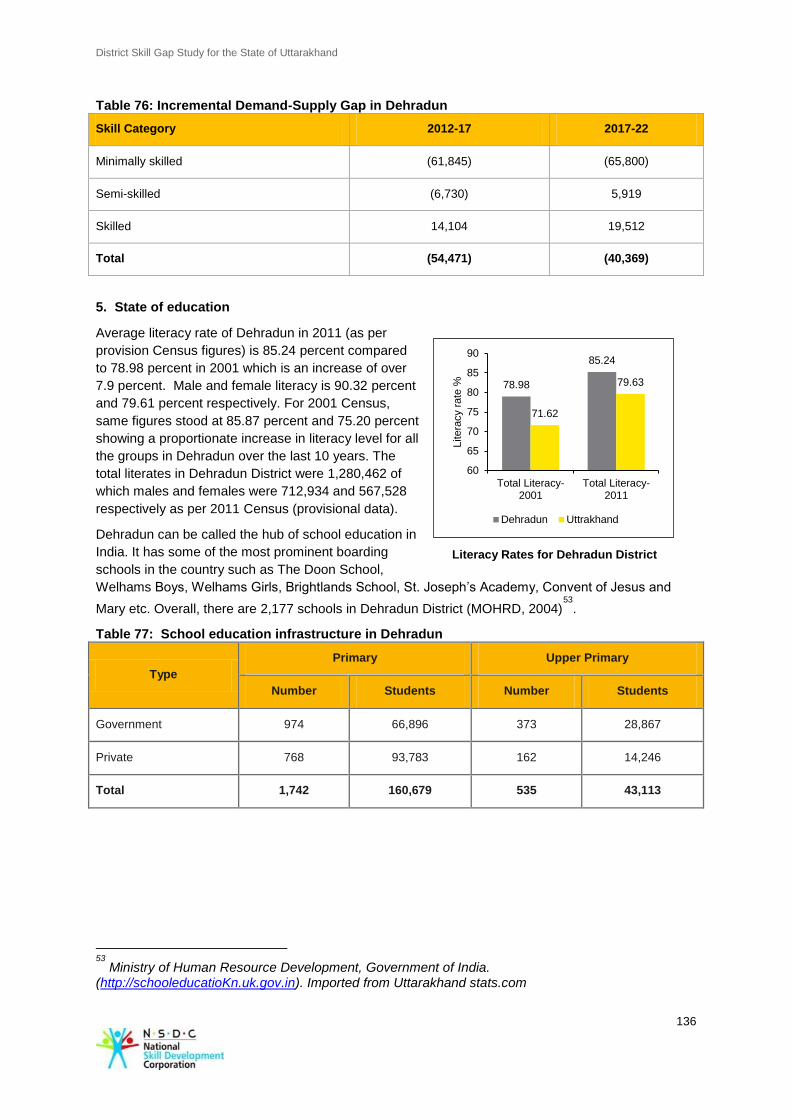
District Skill Gap Study for the State of Uttarakhand
136
78.98
85.24
71.62
79.63
60
65
70
75
80
85
90
Total Literacy-2001
Total Literacy-2011
Litera
cy r
ate
%
Dehradun Uttrakhand
Table 76: Incremental Demand-Supply Gap in Dehradun
Skill Category 2012-17 2017-22
Minimally skilled (61,845) (65,800)
Semi-skilled (6,730) 5,919
Skilled 14,104 19,512
Total (54,471) (40,369)
5. State of education
Average literacy rate of Dehradun in 2011 (as per
provision Census figures) is 85.24 percent compared
to 78.98 percent in 2001 which is an increase of over
7.9 percent. Male and female literacy is 90.32 percent
and 79.61 percent respectively. For 2001 Census,
same figures stood at 85.87 percent and 75.20 percent
showing a proportionate increase in literacy level for all
the groups in Dehradun over the last 10 years. The
total literates in Dehradun District were 1,280,462 of
which males and females were 712,934 and 567,528
respectively as per 2011 Census (provisional data).
Dehradun can be called the hub of school education in
India. It has some of the most prominent boarding
schools in the country such as The Doon School,
Welhams Boys, Welhams Girls, Brightlands School, St. Joseph’s Academy, Convent of Jesus and
Mary etc. Overall, there are 2,177 schools in Dehradun District (MOHRD, 2004)53
.
Table 77: School education infrastructure in Dehradun
Type
Primary Upper Primary
Number Students Number Students
Government 974 66,896 373 28,867
Private 768 93,783 162 14,246
Total 1,742 160,679 535 43,113
53
Ministry of Human Resource Development, Government of India. (http://schooleducatioKn.uk.gov.in). Imported from Uttarakhand stats.com
Literacy Rates for Dehradun District
District Skill Gap Study for the State of Uttarakhand
137
Table 78: Industrial Training infrastructure in Dehradun
Type of Institute Number of Institutes Enrolment
Industrial Training Institutes 8 1,043
Polytechnic 5 947
Total 13 1,990
Many important institutes are located in Dehradun. Some of the most prominent ones are Indira
Gandhi National Forest Academy (IGNFA), Lal Bahadur Shahstri National Academy of Administration
(LBSNAA), The Zoological Survey of India, Forest Research Institute, Indian Institute of Petroleum,
ICFAI University and Uttaranchal Institute of Technology etc. In addition, Dehradun is home to the
Indian Military Academy, which is the premier training institute for army officers in India. Dehradun has
2 medical colleges that have a combined intake capacity of 295 students for medical courses, 231
students for para medical courses and 210 students for nursing courses. For Vocational Training
Programs, there are 2 Government ITI centres, covering 20 courses, which give importance to
courses like Centre of Excellence with 125 seats, Fitter with 124 seats, Electrician with 80 seats and
the remaining 450 seats distributed among the other 17 courses.
6. Youth Aspirations
The assessment team also held discussions with youth groups to understand their aspirations and
preferred sectors of employment, willingness to migrate, training etc. Our key discussion points have
been summarised below:
In order to increase the employability of the youth and to attract them to agriculture it is important
to develop mandis and create market linkages between producers and buyers;
During our interaction with the youth, it was suggested that courses in the Government universities
and ITI’s need to be restructured keeping in line with the demand-based employment
opportunities/industry driven in the District;
The youth (ITI students met) highlighted their concerns on the existing infrastructure of the it is
which include: shortage of raw material which hinders them in doing their practical work, High
machine to student ratio resulting in very few students getting a chance to complete their job work.
There is also a requirement of more instructors who can provide them practical training. Above all,
the students feel that they face problem in interviews because of poor soft skills. The students feel
that they need to improve their personality as well as communication skills.
7. Development Potential and stakeholder perspective
Horticulture and Floriculture
With only 18 percent of the total geographical area under cultivation, there is a huge potential to
develop horticulture and floriculture related activities in the District. Fruits like apples, oranges and
pears are grown widely in the District leading to an immense opportunity for setting up food
processing units. Agriculture department officials shared that the transition of the farmers from
traditional farming to cash based crops, is very fast. It was suggested to adopt an integrated approach
to develop agriculture and food processing industry in the District. Another area that has development
potential is floriculture. The water conditions are conducive and make the District ideal for growing
flowers like gladiolus, Indian red roses, and lilies, which are high in demand in domestic as well as
international market. The farmers find it as a lucrative option against traditional farming and are willing
to adopt floriculture, if they are provided with necessary information and training. New ITIs under
Public Private Partnership mode have floated a course on floriculture which can serve the purpose of
District Skill Gap Study for the State of Uttarakhand
138
skill development and encourage farmers to undertake it as an alternative to traditional farming.
Industry and allied sector
Some of the top industrial sectors that have potential to generate employment in the District are
pharmaceutical, electronic assembling units, food processing, packaging, handicraft, ayurvedic and
cosmetics. According to the District Industry Center, there is shortage of skilled labour to perform the
operations of the industry. The current workforce does not have industrial exposure and lack basic
training. Most of the students coming from the existing ITIs lack practical exposure and have only
theoretical understanding of their related trades (fitter, mechanist, and motor mechanic). Dehradun
has a total of six ITIs out of which two are Government owned. Some of the courses offered by these
institutes are on Stenography (Hindi), Mechanic Moto Vehicle, Machinist, Fitter, Electrician, and
Draughtsman (Mechanical), Data Entry Operator, Carpenter, Plumber, and Turner. The most popular
and in demand courses are for Fitter, Electrician, and Mechanic Moto Vehicle. Trades such as fitters,
electricians, which were earlier thought to be male dominated have seen change in enrollment trends.
A lot of female students have also enrolled in these courses after the announcement of 30 percent
reservation by the State Government.
Apart from the traditional courses, the ITI have started Center for Excellence (‘COE’) that provides
specialized broad based training on 6 modules. In an effort to provide multi-skill training to meet the
skill requirement of particular industries, courses are being offered to meet the requirements of skilled
manpower to operate specialized and technology driven machines. However, the students were not
happy regarding the courses being offered by the COE. After completing the course they do not get
jobs as most of the industries are not aware of COE. Those who even manage to get jobs in the
private sector are poorly paid. On an average they are paid Rs. 4,000 to Rs. 4,500 per month.
Industries as well as private companies prefer to take students who have completed 2 years of course
work. Despite being multi- skilled they remain unemployed because there is less recognition by
industries.
Involvement of industry in skill development has not been in force and therefore the students are not
able to acquire industry specific training in the ITIS. In order to make the training, demand driven and
relevant to the needs of the industry, courses and skill development system needs to be driven from
the industries.
Services and allied sector
Since Dehradun is the capital of the State and is close to the National Capital, there is huge potential
for domestic as well as foreign tourists. By developing formal and informal links through road, rail and
air network the seasonality barriers can be overcome and year round tourist activities can be
maintained. Food processing units have the potential to grow and generate large scale employment in
the District. The District industry center has suggested offering short term courses on food processing
technology through ITIs so as to cope with the local demand of the industries.
Based on our interaction with various stakeholders, some key areas which provide skill development
opportunity have been provided in the table below:
Table 79: Sector and skill requirement
Sector Skill Requirements
Primary Skills development required in carrying floriculture and horticulture farming.
Training required in the areas of integrated farming and building market
linkages.
Secondary Lack of skilled labour to perform industrial operations in automobile, electrical,
and food processing industries. Existing ITIs to provide continuous supply of
raw material and more trained instructors to complete job work. Industry
exposure and training on CNC operated machines would strengthen the skills
District Skill Gap Study for the State of Uttarakhand
139
Sector Skill Requirements
of trainees from ITI.
Tertiary Plenty of opportunities exist in services sector- Insurance agents, retail
business, hospital management, and banking. Skilled development work can
be carried by offering short term course from ITIs.
8. Recommendations
Government ► Focus on encouraging high-growth service sectors such as banking and
retail services. Support ITIs and Government Colleges in developing
curriculum on retail management, insurance, finance and banking.
► Support training and skilling up activities in organic farming, developing
market linkages, and branding of organic produce.
NSDC ► Support trainings related to floriculture and horticulture
Industry ► Industries can collaborate with the exiting training providers to develop
course structure and curriculum.
► Provide opportunities for on the job training to the youth.
Vocation training providers ► Training providers can provide training for Insurance agents, retail
business, hospitality, and banking since there is high demand for such
professionals.
► Training is required on fodder management, shade installation, AI, and
upkeep of health and hygiene of animals.
► Training on new methods, techniques, and mechanization in farming, with
a special focus on commercial processing and value addition
► Skilling and up gradation of existing skills of machine operators on use of
CNC machines. Additionally provide more seats or more avenues for
training on popular courses like fitters, electricians and mechanics.
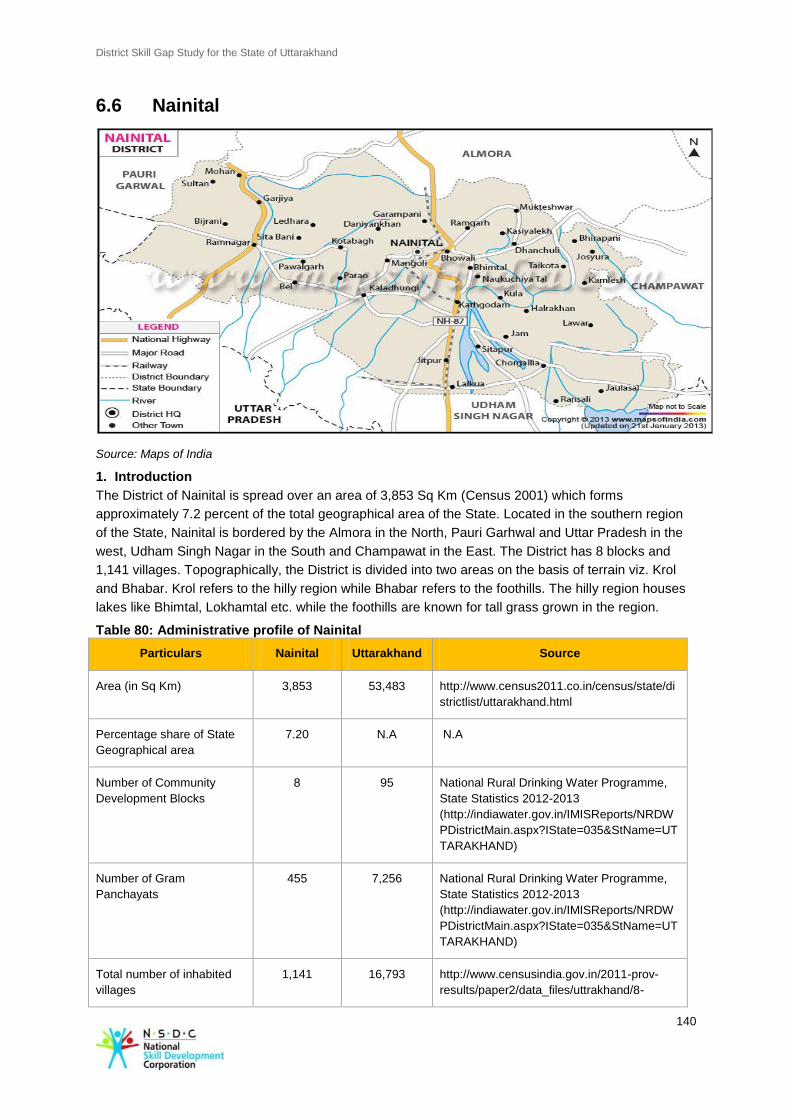
District Skill Gap Study for the State of Uttarakhand
140
6.6 Nainital
Source: Maps of India
1. Introduction
The District of Nainital is spread over an area of 3,853 Sq Km (Census 2001) which forms
approximately 7.2 percent of the total geographical area of the State. Located in the southern region
of the State, Nainital is bordered by the Almora in the North, Pauri Garhwal and Uttar Pradesh in the
west, Udham Singh Nagar in the South and Champawat in the East. The District has 8 blocks and
1,141 villages. Topographically, the District is divided into two areas on the basis of terrain viz. Krol
and Bhabar. Krol refers to the hilly region while Bhabar refers to the foothills. The hilly region houses
lakes like Bhimtal, Lokhamtal etc. while the foothills are known for tall grass grown in the region.
Table 80: Administrative profile of Nainital
Particulars Nainital Uttarakhand Source
Area (in Sq Km) 3,853 53,483 http://www.census2011.co.in/census/state/di
strictlist/uttarakhand.html
Percentage share of State
Geographical area
7.20 N.A N.A
Number of Community
Development Blocks
8 95 National Rural Drinking Water Programme,
State Statistics 2012-2013
(http://indiawater.gov.in/IMISReports/NRDW
PDistrictMain.aspx?IState=035&StName=UT
TARAKHAND)
Number of Gram
Panchayats
455 7,256 National Rural Drinking Water Programme,
State Statistics 2012-2013
(http://indiawater.gov.in/IMISReports/NRDW
PDistrictMain.aspx?IState=035&StName=UT
TARAKHAND)
Total number of inhabited
villages
1,141 16,793 http://www.censusindia.gov.in/2011-prov-
results/paper2/data_files/uttrakhand/8-
District Skill Gap Study for the State of Uttarakhand
141
Particulars Nainital Uttarakhand Source
adminunit-60-61.pdf
2. Demography
Nainital is home to 9.44 percent of the total population of the State. With a total population of 9.55
Lakh, it is the fourth most populated District of the State. Nainital had the fourth highest decadal
growth rate in population in the State, increasing by 25.2 percent. Approximately, 61.06 percent of the
population lives in rural areas and rest of the population lives in urban areas. According to Census
2001, the socially backward classes such as SC and ST represent 19.42 percent and 1.94 percent of
the population respectively.
As per Census 2011 (provisional data), Nainital has a population of 9.55 Lakh of which males and
females were 4.94 Lakh and 4.61 Lakh respectively. The District has a population density of 225
making Nainital the fourth most densely populated District of Uttarakhand. With regard to sex ratio,
the District fares poorly compared to other Districts and the State average. The sex ratio for Nainital
as per 2011 provisional Census figures was the fourth lowest in the State at 933 females per 1,000
males, much below the State average of 963 females per 1,000 males.
Table 81: Socio economic indicators for Nainital
Population Nainital Uttarakhand Source
Total population (in Lakh) 9.55 101.17 Census 2011(provisional data)
Total population (Male) (in Lakh) 4.94 51.54 Census 2011 (provisional data)
Total population (Female) (in Lakh) 4.61 49.63 Census 2011 (provisional data)
District share in State's population 9.44% N.A N.A
Density of population 225 189 Census 2011 (provisional data)
Decadal growth of population (2001-2011) 25.2% 19.17% Census 2011 (provisional data)
Percentage of urban population 38.94% 30.55% Census 2011 (provisional data)
Scheduled Caste population percentage of
State population 19.4% 17.90% Census 2001
Schedule Tribe population percentage of
State population 1.94% 3% Census 2001
Sex ratio 933 963 Census 2011 (provisional data)
3. Economy As per the data collected by the Directorate of Economics & Statistics (2008-09), Nainital had a Gross
District Domestic Product 54
of Rs. 407,192 Lakh which amounts to 10.14 percent of the total State GDDP. The per capita income of Nainital for 2008-09 was valued at Rs. 41,180, which is significantly
54
Statistical Diary, Government of Uttarakhand
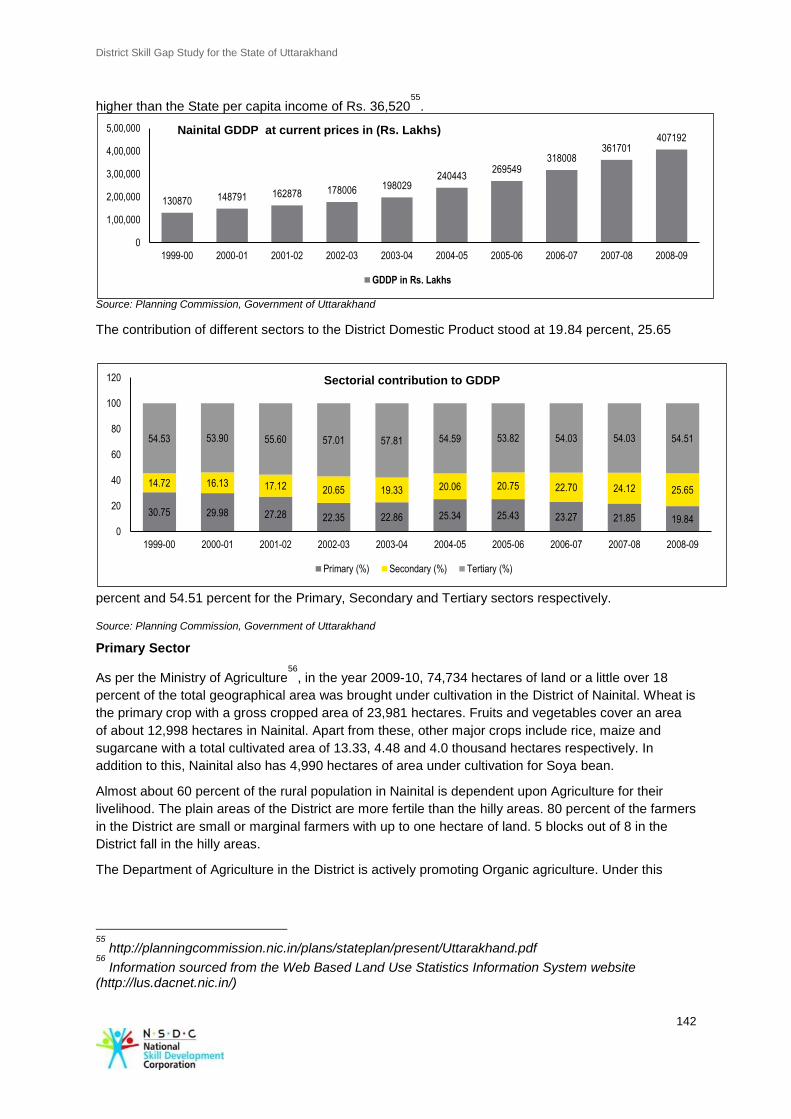
District Skill Gap Study for the State of Uttarakhand
142
higher than the State per capita income of Rs. 36,52055
.
Source: Planning Commission, Government of Uttarakhand
The contribution of different sectors to the District Domestic Product stood at 19.84 percent, 25.65
percent and 54.51 percent for the Primary, Secondary and Tertiary sectors respectively.
Source: Planning Commission, Government of Uttarakhand
Primary Sector
As per the Ministry of Agriculture56
, in the year 2009-10, 74,734 hectares of land or a little over 18
percent of the total geographical area was brought under cultivation in the District of Nainital. Wheat is
the primary crop with a gross cropped area of 23,981 hectares. Fruits and vegetables cover an area
of about 12,998 hectares in Nainital. Apart from these, other major crops include rice, maize and
sugarcane with a total cultivated area of 13.33, 4.48 and 4.0 thousand hectares respectively. In
addition to this, Nainital also has 4,990 hectares of area under cultivation for Soya bean.
Almost about 60 percent of the rural population in Nainital is dependent upon Agriculture for their
livelihood. The plain areas of the District are more fertile than the hilly areas. 80 percent of the farmers
in the District are small or marginal farmers with up to one hectare of land. 5 blocks out of 8 in the
District fall in the hilly areas.
The Department of Agriculture in the District is actively promoting Organic agriculture. Under this
55
http://planningcommission.nic.in/plans/stateplan/present/Uttarakhand.pdf 56
Information sourced from the Web Based Land Use Statistics Information System website (http://lus.dacnet.nic.in/)
130870 148791 162878 178006 198029 240443
269549 318008
361701 407192
0
1,00,000
2,00,000
3,00,000
4,00,000
5,00,000
1999-00 2000-01 2001-02 2002-03 2003-04 2004-05 2005-06 2006-07 2007-08 2008-09
Nainital GDDP at current prices in (Rs. Lakhs)
GDDP in Rs. Lakhs
30.75 29.98 27.28 22.35 22.86 25.34 25.43 23.27 21.85 19.84
14.72 16.13 17.12 20.65 19.33 20.06 20.75 22.70 24.12 25.65
54.53 53.90 55.60 57.01 57.81 54.59 53.82 54.03 54.03 54.51
0
20
40
60
80
100
120
1999-00 2000-01 2001-02 2002-03 2003-04 2004-05 2005-06 2006-07 2007-08 2008-09
Sectorial contribution to GDDP
Primary (%) Secondary (%) Tertiary (%)
District Skill Gap Study for the State of Uttarakhand
143
initiative ‘Model Villages’ have been identified where this programme is underway57
.
Secondary Sector
Nainital is spread over both hilly and plain terrain. The blocks of Haldwani, Ram Nagar and Kotabag
fall among the plain areas. Those in the hilly terrain are Bhimtal, Dhari, Ramgarh, Betalghat and
Okhalkanda. These areas are rich in natural resources and have primarily medium and small
industrial units. These also include cottage industries. The following types of industrial units are noted
to be present in Nainital58
:
Mineral products related Stone crossing, soap stone etc.
Forest products related Furniture, plywood, medicines etc.
Electronics and services related Computers, hardware, software, construction material etc.
Handicrafts Candle making, wood carving, artificial jewellery etc.
Besides there are some big industrial units like that of Century Paper Mills, HMT Watches, Bio-life
Food Pvt. Ltd etc.
Tertiary Sector
Increasingly the services sector has seen a boost in the District of Nainital mainly as a consequence
of the impetus provided to the agriculture and industrial sectors. These include tourism, basic
facilities, allied activities and services. Under the services sector, hotels, tourist guides,
accommodation, roadside dhabas, cyber café, milk parlors, road transportation services, motor
garages, tyre retreading, small shops, education, tent houses, motels etc. are included.
Tourism is the biggest contributor in the services sector, in the District. Nainital is one of the most
popular tourist spots in the State of Uttarakhand and is known for its lakes- Naini Lake, Bhimtal,
Saattal, Khupratal and Naukuchiatal. Other popular tourist destinations within the District include
Mukteshwar, Dhari, Ramgarh etc. Nainital’s natural lakes, forest cover and high peaks make it a very
scenic destination for tourists.
The Government of Uttarakhand in its initiative to promote tourism in the State runs the Veer Chandra
Singh Garhwali Tourism self-employment scheme through which unemployed youth are provided
loans for setting up small tourism oriented businesses.
Despite communication and road transportation facilities being relatively better in this District as
compared to other hilly Districts of Uttarakhand, some blocks like Ram Garh, Dhari and Okhalkanda
suffer serious setbacks due to a lack of petrol pumps and private health clinics. Also, these blocks
face a lack of basic tourism related service providers like quality restaurants, fast food centres, motor
workshops, souvenir shops etc.
4. Workforce Distribution
The total population of Nainital in 2012 was 9.76 Lakhs which is expected to increase to 10.92 Lakhs
by 2017 and 12.22 Lakhs by 2022. As per our research methodology, the incremental manpower
57
Potential Linked Credit Plan for XII Five Year Plan (2012- 2013 to 2016-2017) with specific reference to 2013-14; Nainital; National Bank for Agriculture and Rural Development, Uttarakhand Regional Office, Dehradun 58
Potential Linked Credit Plan for XII Five Year Plan (2012- 2013 to 2016-2017) with specific reference to 2013-14; Nainital; National Bank for Agriculture and Rural Development, Uttarakhand Regional Office, Dehradun
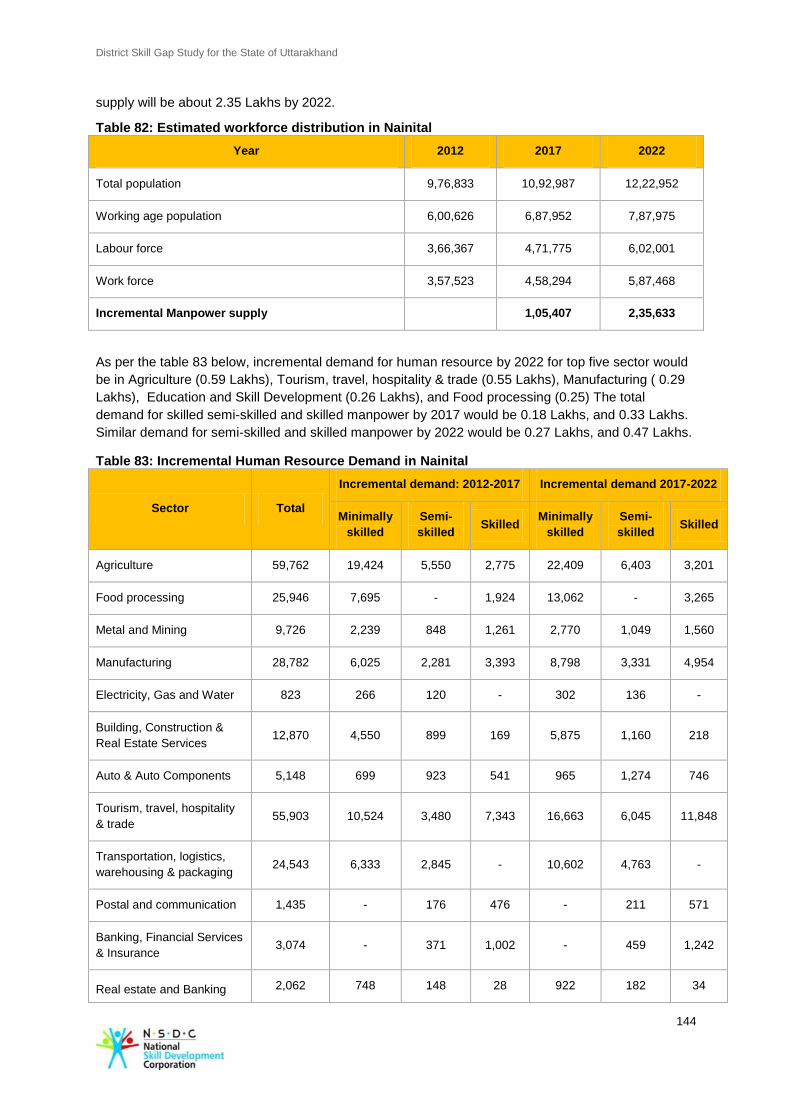
District Skill Gap Study for the State of Uttarakhand
144
supply will be about 2.35 Lakhs by 2022.
Table 82: Estimated workforce distribution in Nainital
Year 2012 2017 2022
Total population 9,76,833 10,92,987 12,22,952
Working age population 6,00,626 6,87,952 7,87,975
Labour force 3,66,367 4,71,775 6,02,001
Work force 3,57,523 4,58,294 5,87,468
Incremental Manpower supply
1,05,407 2,35,633
As per the table 83 below, incremental demand for human resource by 2022 for top five sector would
be in Agriculture (0.59 Lakhs), Tourism, travel, hospitality & trade (0.55 Lakhs), Manufacturing ( 0.29
Lakhs), Education and Skill Development (0.26 Lakhs), and Food processing (0.25) The total
demand for skilled semi-skilled and skilled manpower by 2017 would be 0.18 Lakhs, and 0.33 Lakhs.
Similar demand for semi-skilled and skilled manpower by 2022 would be 0.27 Lakhs, and 0.47 Lakhs.
Table 83: Incremental Human Resource Demand in Nainital
Sector Total
Incremental demand: 2012-2017 Incremental demand 2017-2022
Minimally
skilled
Semi-
skilled Skilled
Minimally
skilled
Semi-
skilled Skilled
Agriculture 59,762 19,424 5,550 2,775 22,409 6,403 3,201
Food processing 25,946 7,695 - 1,924 13,062 - 3,265
Metal and Mining 9,726 2,239 848 1,261 2,770 1,049 1,560
Manufacturing 28,782 6,025 2,281 3,393 8,798 3,331 4,954
Electricity, Gas and Water 823 266 120 - 302 136 -
Building, Construction &
Real Estate Services 12,870 4,550 899 169 5,875 1,160 218
Auto & Auto Components 5,148 699 923 541 965 1,274 746
Tourism, travel, hospitality
& trade 55,903 10,524 3,480 7,343 16,663 6,045 11,848
Transportation, logistics,
warehousing & packaging 24,543 6,333 2,845 - 10,602 4,763 -
Postal and communication 1,435 - 176 476 - 211 571
Banking, Financial Services
& Insurance 3,074 - 371 1,002 - 459 1,242
Real estate and Banking 2,062 748 148 28 922 182 34
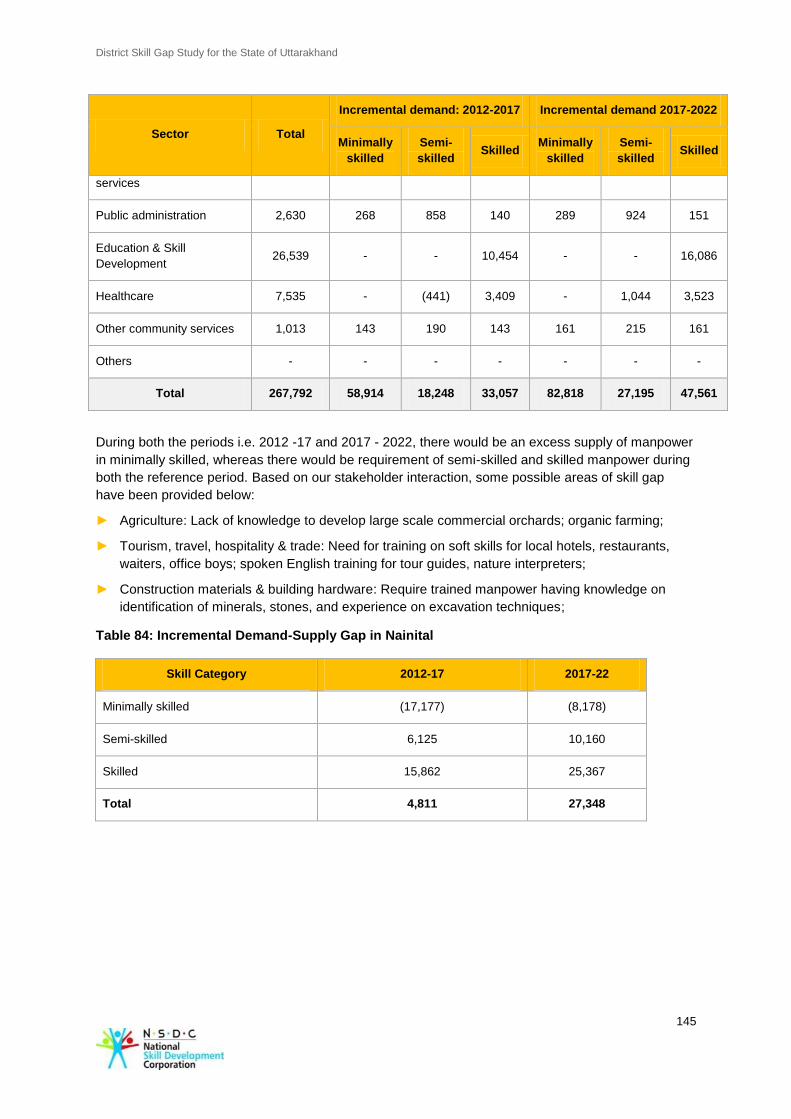
District Skill Gap Study for the State of Uttarakhand
145
Sector Total
Incremental demand: 2012-2017 Incremental demand 2017-2022
Minimally
skilled
Semi-
skilled Skilled
Minimally
skilled
Semi-
skilled Skilled
services
Public administration 2,630 268 858 140 289 924 151
Education & Skill
Development 26,539 - - 10,454 - - 16,086
Healthcare 7,535 - (441) 3,409 - 1,044 3,523
Other community services 1,013 143 190 143 161 215 161
Others - - - - - - -
Total 267,792 58,914 18,248 33,057 82,818 27,195 47,561
During both the periods i.e. 2012 -17 and 2017 - 2022, there would be an excess supply of manpower
in minimally skilled, whereas there would be requirement of semi-skilled and skilled manpower during
both the reference period. Based on our stakeholder interaction, some possible areas of skill gap
have been provided below:
► Agriculture: Lack of knowledge to develop large scale commercial orchards; organic farming;
► Tourism, travel, hospitality & trade: Need for training on soft skills for local hotels, restaurants,
waiters, office boys; spoken English training for tour guides, nature interpreters;
► Construction materials & building hardware: Require trained manpower having knowledge on
identification of minerals, stones, and experience on excavation techniques;
Table 84: Incremental Demand-Supply Gap in Nainital
Skill Category 2012-17 2017-22
Minimally skilled (17,177) (8,178)
Semi-skilled 6,125 10,160
Skilled 15,862 25,367
Total 4,811 27,348
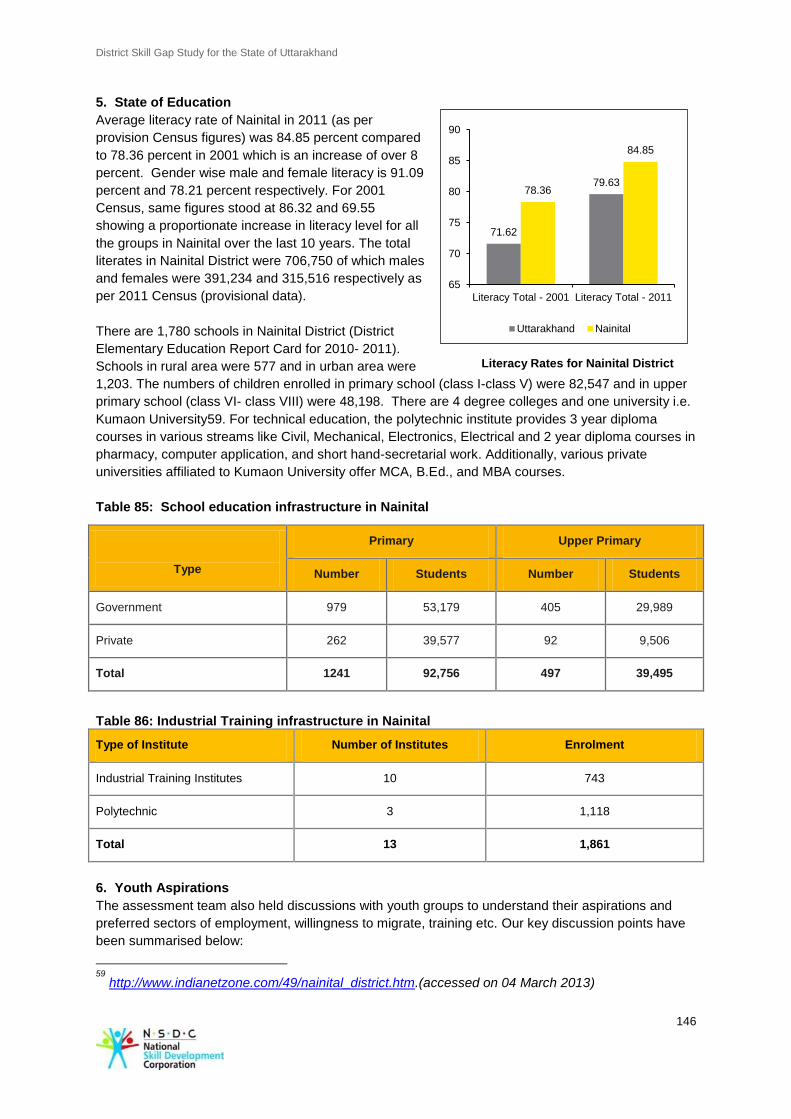
District Skill Gap Study for the State of Uttarakhand
146
5. State of Education Average literacy rate of Nainital in 2011 (as per
provision Census figures) was 84.85 percent compared
to 78.36 percent in 2001 which is an increase of over 8
percent. Gender wise male and female literacy is 91.09
percent and 78.21 percent respectively. For 2001
Census, same figures stood at 86.32 and 69.55
showing a proportionate increase in literacy level for all
the groups in Nainital over the last 10 years. The total
literates in Nainital District were 706,750 of which males
and females were 391,234 and 315,516 respectively as
per 2011 Census (provisional data).
There are 1,780 schools in Nainital District (District
Elementary Education Report Card for 2010- 2011).
Schools in rural area were 577 and in urban area were
1,203. The numbers of children enrolled in primary school (class I-class V) were 82,547 and in upper
primary school (class VI- class VIII) were 48,198. There are 4 degree colleges and one university i.e.
Kumaon University59. For technical education, the polytechnic institute provides 3 year diploma
courses in various streams like Civil, Mechanical, Electronics, Electrical and 2 year diploma courses in
pharmacy, computer application, and short hand-secretarial work. Additionally, various private
universities affiliated to Kumaon University offer MCA, B.Ed., and MBA courses.
Table 85: School education infrastructure in Nainital
Type
Primary Upper Primary
Number Students Number Students
Government 979 53,179 405 29,989
Private 262 39,577 92 9,506
Total 1241 92,756 497 39,495
Table 86: Industrial Training infrastructure in Nainital
Type of Institute Number of Institutes Enrolment
Industrial Training Institutes 10 743
Polytechnic 3 1,118
Total 13 1,861
6. Youth Aspirations
The assessment team also held discussions with youth groups to understand their aspirations and
preferred sectors of employment, willingness to migrate, training etc. Our key discussion points have
been summarised below:
59
http://www.indianetzone.com/49/nainital_district.htm.(accessed on 04 March 2013)
71.62
79.63 78.36
84.85
65
70
75
80
85
90
Literacy Total - 2001 Literacy Total - 2011
Uttarakhand Nainital
Literacy Rates for Nainital District
District Skill Gap Study for the State of Uttarakhand
147
In order to increase the employability of the youth and to attract them to agriculture it is important
to develop mandis and create market linkages between producers and buyers.
During our interaction with the youth, it was suggested that courses in the Government universities
and ITI’s need to be restructured keeping in line with the demand-based employment
opportunities/industry driven in the District.
7. Development Potential and stakeholder perspective
The District of Nainital is a major revenue centre in the Kumaon region of the State of Uttarakhand. In
discussions with a range of stakeholders- from Government officials to industry representatives and
students; the following sectors appeared as those with a growth potential in the District.
Horticulture and organic produce
The District has favorable condition to develop apple orchards which are grown in plenty in Ramgarh
Mukteshwar belt. Beside this Peach, Pears, Apricots, Citrus fruits, Kafal, Strawberry, Hill Banana are
grown in hilly track. There is huge potential to develop large scale commercial orchards for different
fruits and sell in domestic as well as International market. Skill based training if provided on organic
farming can help the farmers in getting better price for their crops and help in reviving the interest of
youth and farming communities.
Mining and Minerals
Major minerals of the District are Copper, Rock-Phosphate, Iron, Lime Stone and stone. There is
enormous scope to develop skill based training for Gems and Jewellery Industry. Efforts can be made
to develop cluster of micro and small medium enterprises of stone crushers industry in and around
Haldwani.
Tourism
Nainital is a popular tourist destination in the State with an inflow of both national and international
tourists. It is one of the noted hill stations of the State with considerable historical relevance from the
time of British rule in India. Scenically, it is noted for its green mountains and lush beauty.
However, in spite being a core contributing sector to the economy, stakeholders were of the opinion
that the full potential of this sector was not being tapped in the State. Firstly, a common concern was
accessibility. It was shared that road infrastructure is not very good. This is critical because being a
hilly terrain; road transportation is most common medium of commute to and from the District. Further,
lack of quality manpower was a major concern in the hospitality sector. Even though there is a high
presence of hotels, guest houses and restaurants in the District, there is a high scope of improving the
standards of service. Respondents from the tourism and hospitality industry have complained of high
staff turnovers and lack of trained staff. Since tourism has been thriving in the area, age-old practices
have come down with respect to hospitality. Modernizing and professionalizing these is seen as a
challenge and the need of the hour by industry representatives.
With respect to training of hospitality professionals, there is The Kumaon Catering University and The
Institute of Hotel Management (IHM), Catering Technology & Applied Nutrition, Dehradun in the
region. Better quality hotels absorb students from these institutes or they go outside the State to work.
Because overall hospitality services are not of a very high standard, employees are mostly trained on-
the-job. Also, remuneration is not satisfactory in the sector within the District; there is a high attrition
rate among employees. There is an urgent requirement to develop hospitality skills in the region
especially those of cooks, waiters, hotel management, communication skills and English speaking.
Professional Services
Nainital is one of the better literate Districts of the State. Being a tourism hub, the exposure of people
is better and consequently the aspirations of youth are high. There is an obvious inclination of youth to
take up Government and other professional services like Law, Engineering, Nursing etc.
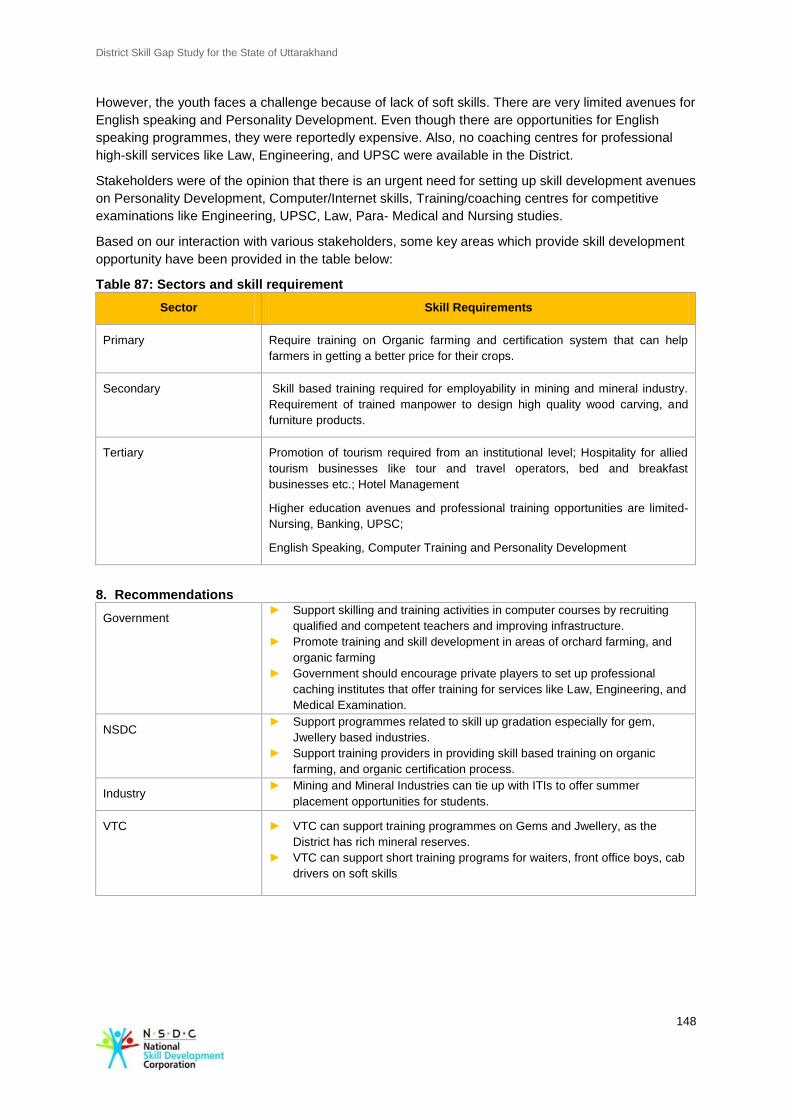
District Skill Gap Study for the State of Uttarakhand
148
However, the youth faces a challenge because of lack of soft skills. There are very limited avenues for
English speaking and Personality Development. Even though there are opportunities for English
speaking programmes, they were reportedly expensive. Also, no coaching centres for professional
high-skill services like Law, Engineering, and UPSC were available in the District.
Stakeholders were of the opinion that there is an urgent need for setting up skill development avenues
on Personality Development, Computer/Internet skills, Training/coaching centres for competitive
examinations like Engineering, UPSC, Law, Para- Medical and Nursing studies.
Based on our interaction with various stakeholders, some key areas which provide skill development
opportunity have been provided in the table below:
Table 87: Sectors and skill requirement
Sector Skill Requirements
Primary Require training on Organic farming and certification system that can help
farmers in getting a better price for their crops.
Secondary Skill based training required for employability in mining and mineral industry.
Requirement of trained manpower to design high quality wood carving, and
furniture products.
Tertiary Promotion of tourism required from an institutional level; Hospitality for allied
tourism businesses like tour and travel operators, bed and breakfast
businesses etc.; Hotel Management
Higher education avenues and professional training opportunities are limited-
Nursing, Banking, UPSC;
English Speaking, Computer Training and Personality Development
8. Recommendations
Government ► Support skilling and training activities in computer courses by recruiting
qualified and competent teachers and improving infrastructure.
► Promote training and skill development in areas of orchard farming, and
organic farming
► Government should encourage private players to set up professional
caching institutes that offer training for services like Law, Engineering, and
Medical Examination.
NSDC ► Support programmes related to skill up gradation especially for gem,
Jwellery based industries.
► Support training providers in providing skill based training on organic
farming, and organic certification process.
Industry ► Mining and Mineral Industries can tie up with ITIs to offer summer
placement opportunities for students.
VTC ► VTC can support training programmes on Gems and Jwellery, as the
District has rich mineral reserves.
► VTC can support short training programs for waiters, front office boys, cab
drivers on soft skills
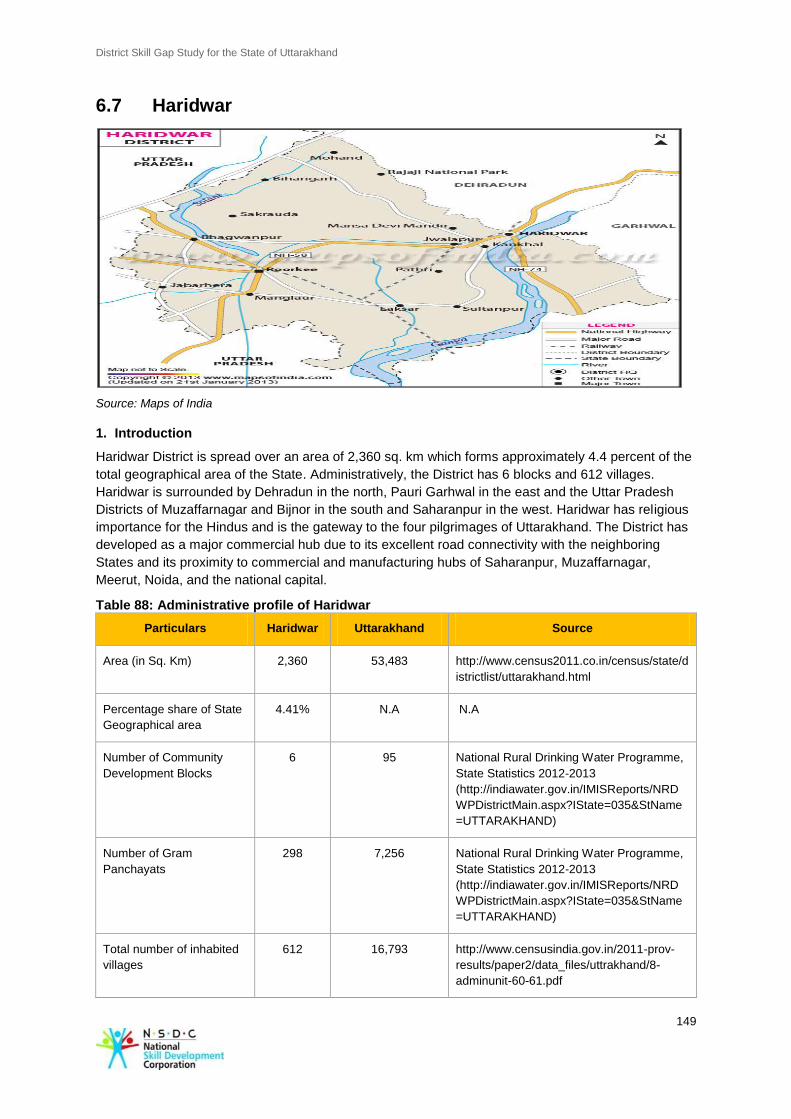
District Skill Gap Study for the State of Uttarakhand
149
6.7 Haridwar
Source: Maps of India
1. Introduction
Haridwar District is spread over an area of 2,360 sq. km which forms approximately 4.4 percent of the
total geographical area of the State. Administratively, the District has 6 blocks and 612 villages.
Haridwar is surrounded by Dehradun in the north, Pauri Garhwal in the east and the Uttar Pradesh
Districts of Muzaffarnagar and Bijnor in the south and Saharanpur in the west. Haridwar has religious
importance for the Hindus and is the gateway to the four pilgrimages of Uttarakhand. The District has
developed as a major commercial hub due to its excellent road connectivity with the neighboring
States and its proximity to commercial and manufacturing hubs of Saharanpur, Muzaffarnagar,
Meerut, Noida, and the national capital.
Table 88: Administrative profile of Haridwar
Particulars Haridwar Uttarakhand Source
Area (in Sq. Km) 2,360 53,483 http://www.census2011.co.in/census/state/d
istrictlist/uttarakhand.html
Percentage share of State
Geographical area
4.41% N.A N.A
Number of Community
Development Blocks
6 95 National Rural Drinking Water Programme,
State Statistics 2012-2013
(http://indiawater.gov.in/IMISReports/NRD
WPDistrictMain.aspx?IState=035&StName
=UTTARAKHAND)
Number of Gram
Panchayats
298 7,256 National Rural Drinking Water Programme,
State Statistics 2012-2013
(http://indiawater.gov.in/IMISReports/NRD
WPDistrictMain.aspx?IState=035&StName
=UTTARAKHAND)
Total number of inhabited
villages
612 16,793 http://www.censusindia.gov.in/2011-prov-
results/paper2/data_files/uttrakhand/8-
adminunit-60-61.pdf
District Skill Gap Study for the State of Uttarakhand
150
2. Demography
Haridwar is home to 19.04 percent of the total population of the State and with its 19.2 Lakh
inhabitants it is the most populated District of the State. It has had a decadal growth rate in population
of 33.16 percent. According to Census 2001, the socially disadvantaged groups such as SC and ST
represented 21.7 percent and 1.22 percent of the population respectively.
The Sex Ratio in the District fares poorly compared to other Districts and the State average. The sex
ratio for Haridwar as per Census 2011 (provisional data) is 879 females per 1,000 males, much below
the State average of 963 females per 1,000 males. Census 2011 (provisional data) suggest a
population density of 817 in 2011 making Haridwar the most densely populated District of
Uttarakhand.
Table 89: Socio economic indicators for Haridwar
Population Haridwar Uttarakhand Source
Total population (in Lakh) 19.2 101.17 Census 2011 (provisional data)
Total population (Male) (in Lakh) 10.25 51.54 Census 2011 (provisional data)
Total population (Female) (in Lakh) 9.01 49.63 Census 2011 (provisional data)
District share in State's population 19.05% N.A N.A
Density of population 817 189 Census 2011 (provisional data)
Decadal growth of population (2001-
2011) 33.16% 19.17% Census 2011 (provisional data)
Percentage of urban population 37.77% 30.55% Census 2011 (provisional data)
Scheduled Caste population percentage
of State population 21.7% 17.90% Census 2001
Schedule Tribe population percentage of
State population 1.22% 3% Census 2001
Sex ratio 879 963 Census 2011 (provisional data)
3. Economy
As per the data collected by the Directorate of Economics & Statistics (2008-09), Haridwar had a
Gross District Domestic Product 60
of Rs. 941,952 Lakh which amounts to 23.46 percent of the total
State GDDP. The per capita income of Haridwar for 2008-09 was valued at Rs. 50,227, which is
significantly higher than the State per capita income of Rs. 36,52061
.
60
Statistical Diary, Government of Uttarakhand 61
http://planningcommission.nic.in/plans/stateplan/present/Uttarakhand.pdf
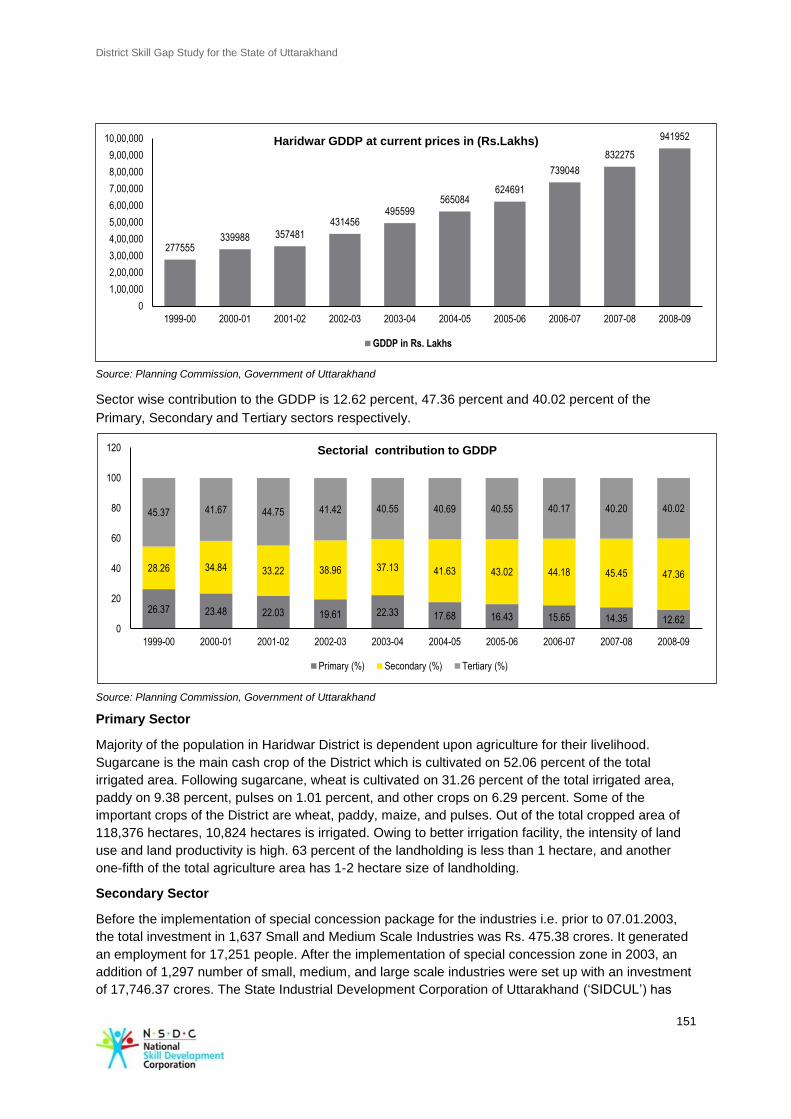
District Skill Gap Study for the State of Uttarakhand
151
Source: Planning Commission, Government of Uttarakhand
Sector wise contribution to the GDDP is 12.62 percent, 47.36 percent and 40.02 percent of the
Primary, Secondary and Tertiary sectors respectively.
Source: Planning Commission, Government of Uttarakhand
Primary Sector
Majority of the population in Haridwar District is dependent upon agriculture for their livelihood.
Sugarcane is the main cash crop of the District which is cultivated on 52.06 percent of the total
irrigated area. Following sugarcane, wheat is cultivated on 31.26 percent of the total irrigated area,
paddy on 9.38 percent, pulses on 1.01 percent, and other crops on 6.29 percent. Some of the
important crops of the District are wheat, paddy, maize, and pulses. Out of the total cropped area of
118,376 hectares, 10,824 hectares is irrigated. Owing to better irrigation facility, the intensity of land
use and land productivity is high. 63 percent of the landholding is less than 1 hectare, and another
one-fifth of the total agriculture area has 1-2 hectare size of landholding.
Secondary Sector
Before the implementation of special concession package for the industries i.e. prior to 07.01.2003,
the total investment in 1,637 Small and Medium Scale Industries was Rs. 475.38 crores. It generated
an employment for 17,251 people. After the implementation of special concession zone in 2003, an
addition of 1,297 number of small, medium, and large scale industries were set up with an investment
of 17,746.37 crores. The State Industrial Development Corporation of Uttarakhand (‘SIDCUL’) has
26.37 23.48 22.03 19.61 22.33 17.68 16.43 15.65 14.35 12.62
28.26 34.84 33.22 38.96 37.13 41.63 43.02 44.18 45.45 47.36
45.37 41.67 44.75 41.42 40.55 40.69 40.55 40.17 40.20 40.02
0
20
40
60
80
100
120
1999-00 2000-01 2001-02 2002-03 2003-04 2004-05 2005-06 2006-07 2007-08 2008-09
Sectorial contribution to GDDP
Primary (%) Secondary (%) Tertiary (%)
277555 339988 357481
431456 495599
565084 624691
739048
832275
941952
0
1,00,000
2,00,000
3,00,000
4,00,000
5,00,000
6,00,000
7,00,000
8,00,000
9,00,000
10,00,000
1999-00 2000-01 2001-02 2002-03 2003-04 2004-05 2005-06 2006-07 2007-08 2008-09
Haridwar GDDP at current prices in (Rs.Lakhs)
GDDP in Rs. Lakhs
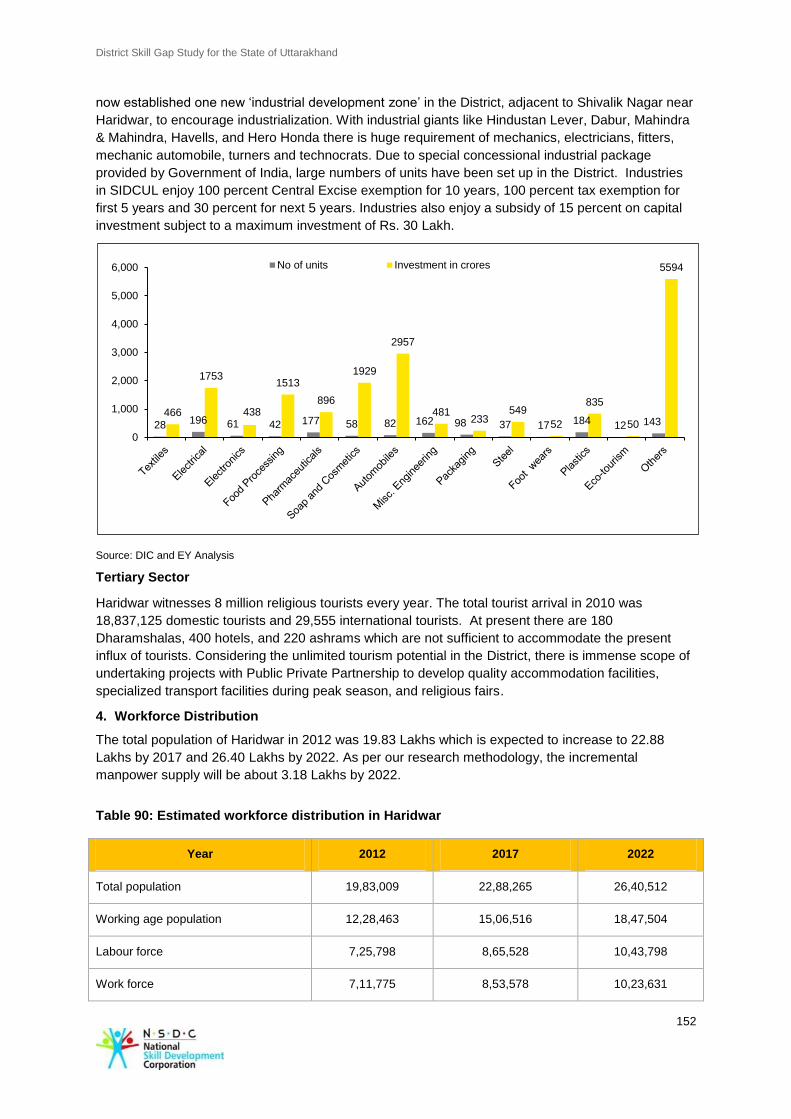
District Skill Gap Study for the State of Uttarakhand
152
now established one new ‘industrial development zone’ in the District, adjacent to Shivalik Nagar near
Haridwar, to encourage industrialization. With industrial giants like Hindustan Lever, Dabur, Mahindra
& Mahindra, Havells, and Hero Honda there is huge requirement of mechanics, electricians, fitters,
mechanic automobile, turners and technocrats. Due to special concessional industrial package
provided by Government of India, large numbers of units have been set up in the District. Industries
in SIDCUL enjoy 100 percent Central Excise exemption for 10 years, 100 percent tax exemption for
first 5 years and 30 percent for next 5 years. Industries also enjoy a subsidy of 15 percent on capital
investment subject to a maximum investment of Rs. 30 Lakh.
Source: DIC and EY Analysis
Tertiary Sector
Haridwar witnesses 8 million religious tourists every year. The total tourist arrival in 2010 was
18,837,125 domestic tourists and 29,555 international tourists. At present there are 180
Dharamshalas, 400 hotels, and 220 ashrams which are not sufficient to accommodate the present
influx of tourists. Considering the unlimited tourism potential in the District, there is immense scope of
undertaking projects with Public Private Partnership to develop quality accommodation facilities,
specialized transport facilities during peak season, and religious fairs.
4. Workforce Distribution
The total population of Haridwar in 2012 was 19.83 Lakhs which is expected to increase to 22.88
Lakhs by 2017 and 26.40 Lakhs by 2022. As per our research methodology, the incremental
manpower supply will be about 3.18 Lakhs by 2022.
Table 90: Estimated workforce distribution in Haridwar
Year 2012 2017 2022
Total population 19,83,009 22,88,265 26,40,512
Working age population 12,28,463 15,06,516 18,47,504
Labour force 7,25,798 8,65,528 10,43,798
Work force 7,11,775 8,53,578 10,23,631
28 196 61 42 177 58 82 162 98 37 17 184 12 143 466
1753
438
1513
896
1929
2957
481 233
549
52
835
50
5594
0
1,000
2,000
3,000
4,000
5,000
6,000 No of units Investment in crores
District Skill Gap Study for the State of Uttarakhand
153
Incremental Manpower supply
1,39,730 3,18,000
As per the table 57 below, incremental demand for human resource by 2022 for top five sector would
be Manufacturing (1.47 Lakhs), Tourism, travel, hospitality & trade (0.98 Lakhs), Agriculture (0.81
Lakhs), Building, Construction & Real Estate Services (0.25 Lakhs), and Transportation, logistics,
Warehousing & packaging (0.23 Lakhs). The total demand for semi-skilled and skilled manpower by
2017 would be 0.45 Lakhs, and 0.61 Lakhs. Similar demand for semi-skilled and skilled manpower by
2022 would be 0.72 Lakhs, and 0.89 Lakhs.
Table 91: Incremental Human Resource Demand in Haridwar
Sector Total
Incremental demand: 2012-
2017
Incremental demand 2017-
2022
Minimall
y skilled
Semi-
skilled Skilled
Minima
lly
skilled
Semi-
skilled Skilled
Agriculture 81,679 26,599 7,600 3,800 30,577 8,736 4,368
Food processing 15,882 5,337 - 1,334 7,368 - 1,842
Metal and Mining 465 108 41 61 131 50 74
Manufacturing 147,609 18,207 24,025 14,077 29,520 38,954 22,825
Electricity, Gas and Water 836 270 121 - 307 138 -
Building, Construction &
Real Estate Services 25,523 9,020 1,782 334 11,654 2,302 432
Auto & Auto Components 9,634 1,155 1,524 893 1,960 2,587 1,516
Tourism, travel, hospitality &
trade 98,031 19,444 5,295 13,100 30,476 8,927 20,791
Transportation, logistics,
warehousing & packaging 23,177 6,141 2,759 - 9,851 4,426 -
Postal and communication 3,046 - 374 1,012 - 448 1,212
Banking, Financial Services
& Insurance 4,595 - 554 1,499 - 686 1,856
Real estate and Banking
services 15,154 5,495 1,085 204 6,780 1,339 251
Public administration 2,026 206 661 108 222 712 117
Education & Skill
Development 41,247 - - 16,247 - - 25,000
Healthcare 17,698 - (1,035) 8,006 - 2,451 8,276
District Skill Gap Study for the State of Uttarakhand
154
Other community services 3,543 499 665 499 564 752 564
Others - - - - - - -
Total 490,146 92,481 45,452 61,174 129,410 72,508 89,122
During the period 2012-2017 there would be excess supply of minimally skilled manpower whereas
there would be great demand for semi-skilled and skilled manpower during 2017 and 2022. Based on
our stakeholder interaction, some possible areas of skill gap have been provided below:
► Construction materials & building hardware: Requirement of trained manpower especially
electricians, fitters; training and exposure on CNC operated machines;
► Tourism, travel, hospitality & trade: Trained cab drivers; waiters, tourist guides; soft skills;
► Agriculture: Lack of knowledge on value addition components of sugarcane crop; training on
packaging of agro produce; artificial insemination technology.
Table 92: Incremental Demand-Supply Gap in Haridwar
Skill Category 2012-17 2017-22
Minimally skilled (18,721) (12,516)
Semi-skilled 33,279 56,951
Skilled 44,819 68,334
Total 59,377 112,769
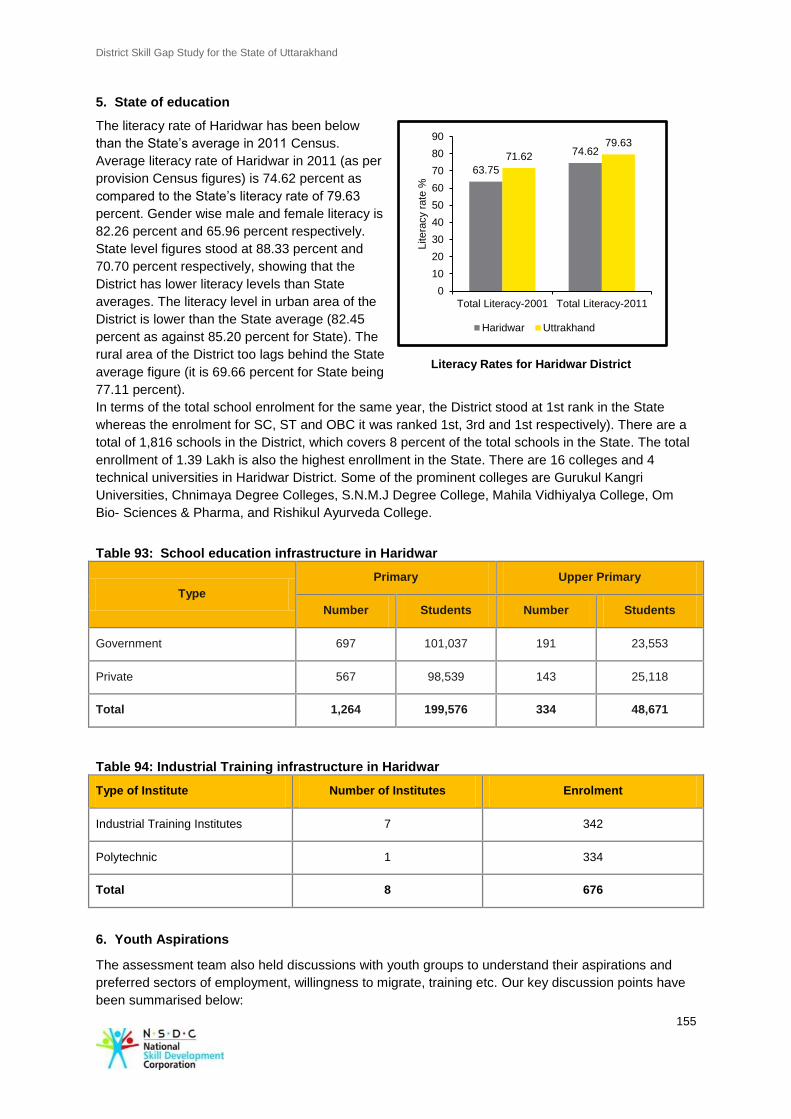
District Skill Gap Study for the State of Uttarakhand
155
5. State of education
The literacy rate of Haridwar has been below
than the State’s average in 2011 Census.
Average literacy rate of Haridwar in 2011 (as per
provision Census figures) is 74.62 percent as
compared to the State’s literacy rate of 79.63
percent. Gender wise male and female literacy is
82.26 percent and 65.96 percent respectively.
State level figures stood at 88.33 percent and
70.70 percent respectively, showing that the
District has lower literacy levels than State
averages. The literacy level in urban area of the
District is lower than the State average (82.45
percent as against 85.20 percent for State). The
rural area of the District too lags behind the State
average figure (it is 69.66 percent for State being
77.11 percent).
In terms of the total school enrolment for the same year, the District stood at 1st rank in the State
whereas the enrolment for SC, ST and OBC it was ranked 1st, 3rd and 1st respectively). There are a
total of 1,816 schools in the District, which covers 8 percent of the total schools in the State. The total
enrollment of 1.39 Lakh is also the highest enrollment in the State. There are 16 colleges and 4
technical universities in Haridwar District. Some of the prominent colleges are Gurukul Kangri
Universities, Chnimaya Degree Colleges, S.N.M.J Degree College, Mahila Vidhiyalya College, Om
Bio- Sciences & Pharma, and Rishikul Ayurveda College.
Table 93: School education infrastructure in Haridwar
Type
Primary Upper Primary
Number Students Number Students
Government 697 101,037 191 23,553
Private 567 98,539 143 25,118
Total 1,264 199,576 334 48,671
Table 94: Industrial Training infrastructure in Haridwar
Type of Institute Number of Institutes Enrolment
Industrial Training Institutes 7 342
Polytechnic 1 334
Total 8 676
6. Youth Aspirations
The assessment team also held discussions with youth groups to understand their aspirations and
preferred sectors of employment, willingness to migrate, training etc. Our key discussion points have
been summarised below:
63.75
74.62 71.62
79.63
0
10
20
30
40
50
60
70
80
90
Total Literacy-2001 Total Literacy-2011
Litera
cy r
ate
%
Haridwar Uttrakhand
Literacy Rates for Haridwar District
District Skill Gap Study for the State of Uttarakhand
156
► During our interaction with youth, they expressed their eagerness to join heavy engineering,
and automobile industries in the SIDCUL area. They want to acquire skills to operate new
machines that are operational in the industries. At present the current state of training
infrastructure does not have adequate infrastructure to provide training on new machines.
► As Haridwar being a pilgrimage center, some of the youth expressed their willingness to
acquire skills to run dairy operations on a commercial scale. Lack of training and support
infrastructure gaps needs to be fulfilled for running viable and scalable models of dairy
operation in the District.
► Youth were keen to open restaurants, accommodation, small hotels. They expressed their
desire to receive training, along with initial loan assistance to set up their own business.
7. Development Potential and stakeholder perspective
Agriculture
Sugarcane is the main cash crop and has the least mortality in comparison to other crops. At present
there are 3 private Sugar Mills in Haridwar i.e. Luxmi Sugar Mill in Iqbalpur, Uttam Sugar Mill in
Liberhedi, and Luxor Sugar Mill. The total production of sugarcane in 2009-2010 was 623.77 quintals
covering an area of 7,666 hectares. Sugarcane production thus is one area that can generate large
scale employment. Due to poor market linkages the production is limited and based on demand of
buyers. Most of the cane growers do not know the proper methods of sugarcane cultivation. Skill
development in scheduling and harvesting technique needs to be provided to the farmers to ensure
continuous supply, during the crushing season. Another area that needs focus is provision of training
for irrigation management principles and not the grandfathering approach towards irrigation. Value
addition like production of sugarcane juice, jaggery sweets, and granular jaggery down the value
chain will require skilled manpower to conduct the processing operations. Moving up the value chain
will require training on brand building, and packaging that can be organized in consultation with Indian
Institute of Packaging Technology, and Indian Institute of Foreign Trade.
Animal Husbandry and commercial dairy
Haridwar being one of the most important holy places for Hindus receives a vast flow of domestic and
international tourists throughout the year. The food habits are primarily vegetarian and consumption
of vegetables along with milk and milk products are high in demand. The local demand of milk is quite
high and it is being catered by adjoining Districts such as Saharanpur, Naziabad, and Bijnor. Based
on the existing demand, there is enormous scope for commercial dairy in the District. The total
population of dairy animals is 191,403 out of which 60,447 are cows and 130,956 are buffaloes.
There are 16 animal hospitals along with 33 Artificial Insemination facilities. Out of the 33 facilities 26
are Government owned and the rest is privately held. The District has 253 milk societies out of which
126 are functioning. However, the District has huge potential for commercial dairy. A cluster based
approach is required to scale up dairy activities in the District. Some of the factors that are
considered critical for the growth of commercial dairy are as follows:
► Interaction with the Chief Agriculture Officer suggested that instant credit should be provided to
farmers from some of the lead banks like Punjab National Bank, State Bank of India, and Oriental
Bank of commerce to purchase at least 4-5 animals.
► Based on a project mode, effort should be made on backward and forward linkages to develop
dairy as a potential area for large scale employment.
► Under the backward linkage, focus should be provided on fodder management, installation of
proper shades, availability of water, and health of the animal.
► At present there is shortage of skilled manpower that can perform complex dairy related
operations. Only 5 scientists are present in the Krishi Vigyan Kendra (KVK), which is difficult to
cater 510 villages. There is requirement of more scientist and skilled manpower to cater to the
District Skill Gap Study for the State of Uttarakhand
157
demand of dairy related services in the District.
Industry and allied sectors
Considering the present context and rising demand for skilled manpower to meet the requirements of
industries in SIDCUL, there is scope of skill development and training in operating CNC operated
machines. The Chairman of SIDCUL manufacturers association agreed that the trainees from ITI
should be provided with industrial exposure and the current courses of ITI should be amended as per
the industry requirements to cater to the needs of industries. Haridwar has 5 ITIs out of which 3 ITIs
are running under PPP mode. Some of the courses offered by the ITIs under PPP mode – motor
mechanic, auto, electronics, electrical are affiliated through State Council for Vocational Training
(SCVT). The students are facing problem in getting jobs as these are not recognized nationally. Even
the industries prefer candidates having diploma affiliated from National Council for Vocational Training
(NCVT). However, the 3 ITIs running under PPP mode are equipped with latest technology and
provide hands on experience on new machines. It also houses modern spare parts and tools that
assists student in completing their job work. Contrastingly, the other 2 ITIs will require infrastructural
support including training support to the teachers. The machineries employed in these ITIs are old
and outdated and are no more in use by the industries. Due to lack of training in handling new
machinery and technology, the students face problem in getting jobs. More industrial exposure and
opportunities to work as trainees in manufacturing industries, assembling units, and steel and
metallurgy industries would help in developing the skill of existing manpower. Some of the factors that
are considered to be critical for growth of industries are as follows:
► Requirement of trained manpower especially electricians, and fitters. The present workforce
would require more training and exposure on CNC operated machines and new technology being
used in the industries in SIDCUL.
► The present physical infrastructure needs to be strengthened by providing direct rail connectivity
to the SIDCUL industrial area. During the discussion with the Chairman, SIDCUL Manufacturers
Association, Uttarakhand, it was suggested to extend rail connectivity to the industrial area for
fastening the pace of supply of industrial goods across the country.
► Industries in SIDCUL are operational on latest technology and would require continuous
intermittent power supply. At present the power supply in the industrial area is not continuous.
► Develop infrastructure like road and rail connectivity to receive raw materials and semi processed
products.
Services and allied sector
Haridwar witnesses 8 million religious tourists every year. The total tourist arrival in 2010 was
18,837,125 domestic tourists, and 29,555 international tourists. At present there are 180
Dharamshalas, 400 hotels, and 220 ashrams which are not sufficient to accommodate the present
influx of tourists. Considering the unlimited tourism potential in the District, there is immense scope of
undertaking projects with Public Private Partnership to develop quality accommodation facilities,
specialized transport facilities during peak season, and religious fairs. Potential areas of skill
development include service providers like cab drivers, waiters, hoteliers and tourist guides. While the
demand for these is being met given that religious tourism is thriving in the District, it is seen as
imperative to provide better quality services in the hospitality and tourism domain. Skill development
on imparting training on soft skills and communication will provide employment to large number of
youth in the hotel and tourism industry.
Based on our interaction with various stakeholders, some key areas which provide skill development
opportunity have been provided in the table below:
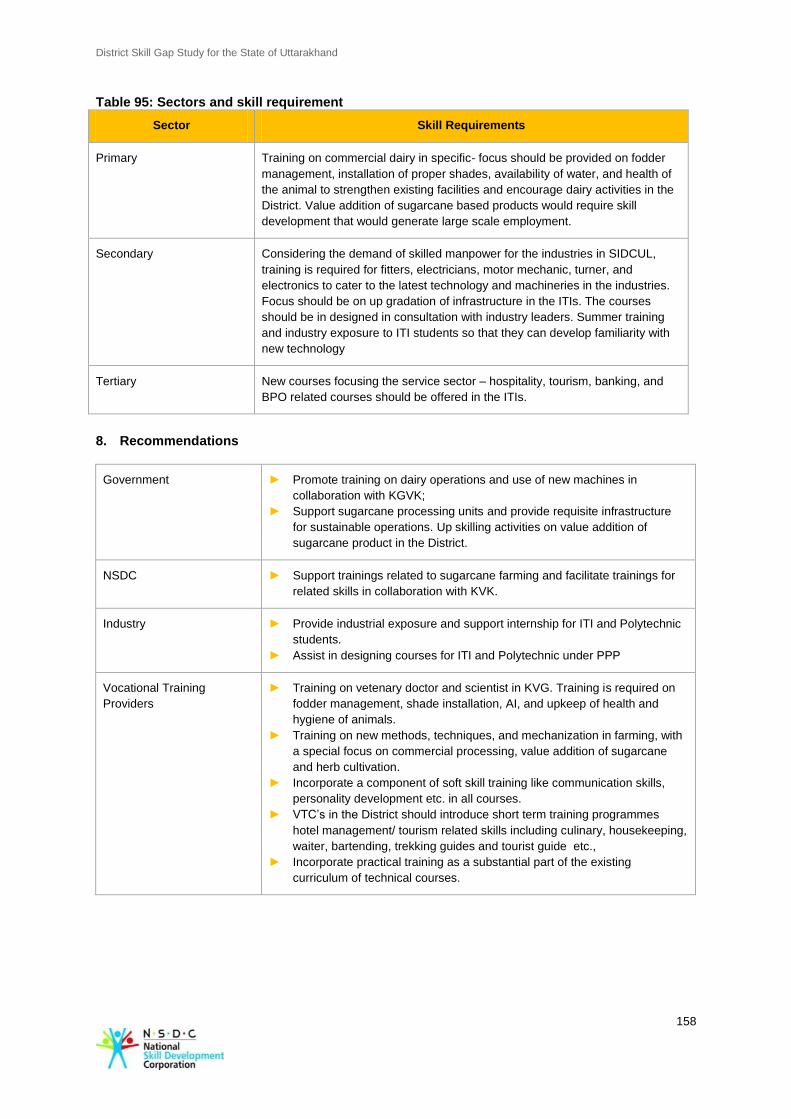
District Skill Gap Study for the State of Uttarakhand
158
Table 95: Sectors and skill requirement
Sector Skill Requirements
Primary Training on commercial dairy in specific- focus should be provided on fodder
management, installation of proper shades, availability of water, and health of
the animal to strengthen existing facilities and encourage dairy activities in the
District. Value addition of sugarcane based products would require skill
development that would generate large scale employment.
Secondary Considering the demand of skilled manpower for the industries in SIDCUL,
training is required for fitters, electricians, motor mechanic, turner, and
electronics to cater to the latest technology and machineries in the industries.
Focus should be on up gradation of infrastructure in the ITIs. The courses
should be in designed in consultation with industry leaders. Summer training
and industry exposure to ITI students so that they can develop familiarity with
new technology
Tertiary New courses focusing the service sector – hospitality, tourism, banking, and
BPO related courses should be offered in the ITIs.
8. Recommendations
Government ► Promote training on dairy operations and use of new machines in
collaboration with KGVK;
► Support sugarcane processing units and provide requisite infrastructure
for sustainable operations. Up skilling activities on value addition of
sugarcane product in the District.
NSDC ► Support trainings related to sugarcane farming and facilitate trainings for
related skills in collaboration with KVK.
Industry ► Provide industrial exposure and support internship for ITI and Polytechnic
students.
► Assist in designing courses for ITI and Polytechnic under PPP
Vocational Training
Providers
► Training on vetenary doctor and scientist in KVG. Training is required on
fodder management, shade installation, AI, and upkeep of health and
hygiene of animals.
► Training on new methods, techniques, and mechanization in farming, with
a special focus on commercial processing, value addition of sugarcane
and herb cultivation.
► Incorporate a component of soft skill training like communication skills,
personality development etc. in all courses.
► VTC’s in the District should introduce short term training programmes
hotel management/ tourism related skills including culinary, housekeeping,
waiter, bartending, trekking guides and tourist guide etc.,
► Incorporate practical training as a substantial part of the existing
curriculum of technical courses.
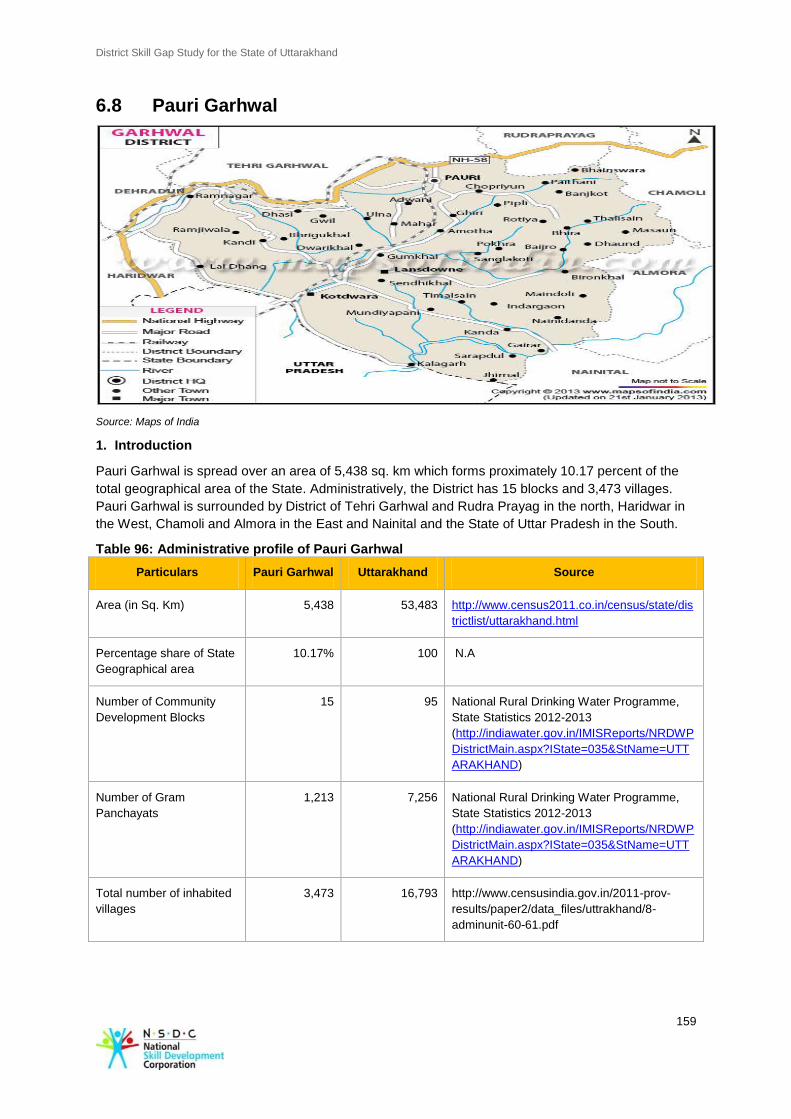
District Skill Gap Study for the State of Uttarakhand
159
6.8 Pauri Garhwal
Source: Maps of India
1. Introduction
Pauri Garhwal is spread over an area of 5,438 sq. km which forms proximately 10.17 percent of the
total geographical area of the State. Administratively, the District has 15 blocks and 3,473 villages.
Pauri Garhwal is surrounded by District of Tehri Garhwal and Rudra Prayag in the north, Haridwar in
the West, Chamoli and Almora in the East and Nainital and the State of Uttar Pradesh in the South.
Table 96: Administrative profile of Pauri Garhwal
Particulars Pauri Garhwal Uttarakhand Source
Area (in Sq. Km) 5,438 53,483 http://www.census2011.co.in/census/state/dis
trictlist/uttarakhand.html
Percentage share of State
Geographical area
10.17% 100 N.A
Number of Community
Development Blocks
15 95 National Rural Drinking Water Programme,
State Statistics 2012-2013
(http://indiawater.gov.in/IMISReports/NRDWP
DistrictMain.aspx?IState=035&StName=UTT
ARAKHAND)
Number of Gram
Panchayats
1,213 7,256 National Rural Drinking Water Programme,
State Statistics 2012-2013
(http://indiawater.gov.in/IMISReports/NRDWP
DistrictMain.aspx?IState=035&StName=UTT
ARAKHAND)
Total number of inhabited
villages
3,473 16,793 http://www.censusindia.gov.in/2011-prov-
results/paper2/data_files/uttrakhand/8-
adminunit-60-61.pdf
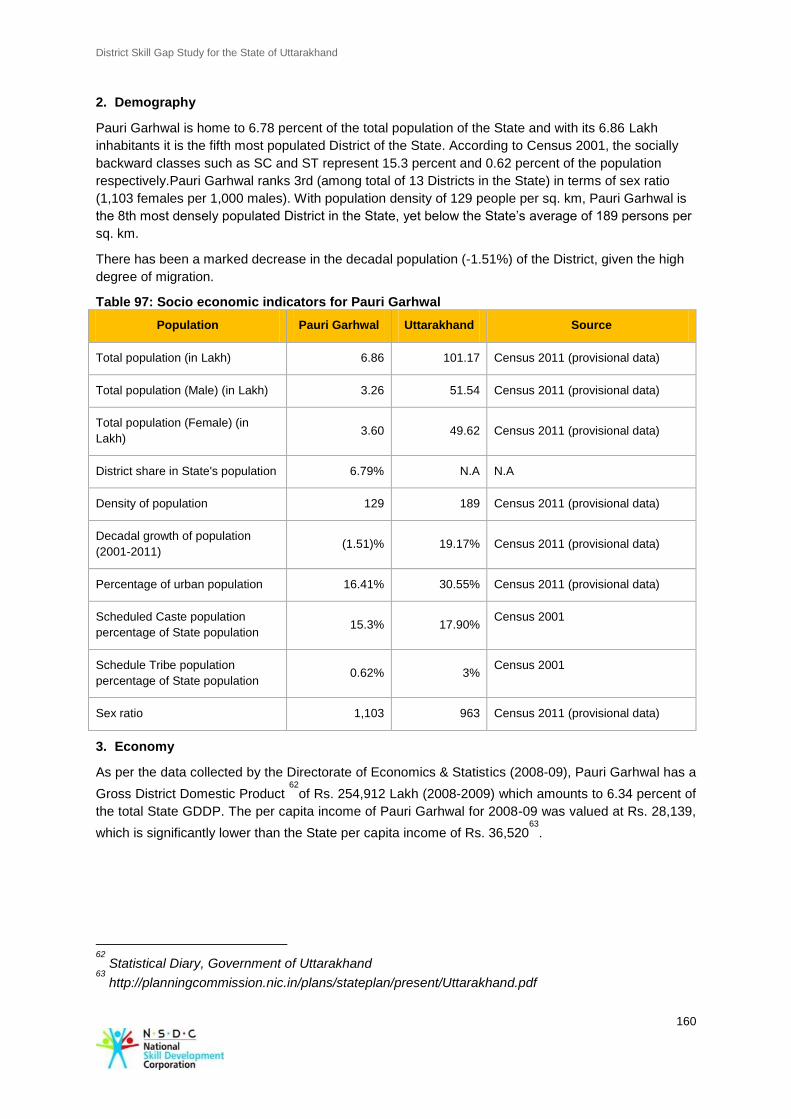
District Skill Gap Study for the State of Uttarakhand
160
2. Demography
Pauri Garhwal is home to 6.78 percent of the total population of the State and with its 6.86 Lakh
inhabitants it is the fifth most populated District of the State. According to Census 2001, the socially
backward classes such as SC and ST represent 15.3 percent and 0.62 percent of the population
respectively.Pauri Garhwal ranks 3rd (among total of 13 Districts in the State) in terms of sex ratio
(1,103 females per 1,000 males). With population density of 129 people per sq. km, Pauri Garhwal is
the 8th most densely populated District in the State, yet below the State’s average of 189 persons per
sq. km.
There has been a marked decrease in the decadal population (-1.51%) of the District, given the high
degree of migration.
Table 97: Socio economic indicators for Pauri Garhwal
Population Pauri Garhwal Uttarakhand Source
Total population (in Lakh) 6.86 101.17 Census 2011 (provisional data)
Total population (Male) (in Lakh) 3.26 51.54 Census 2011 (provisional data)
Total population (Female) (in
Lakh) 3.60 49.62 Census 2011 (provisional data)
District share in State's population 6.79% N.A N.A
Density of population 129 189 Census 2011 (provisional data)
Decadal growth of population
(2001-2011) (1.51)% 19.17% Census 2011 (provisional data)
Percentage of urban population 16.41% 30.55% Census 2011 (provisional data)
Scheduled Caste population
percentage of State population 15.3% 17.90%
Census 2001
Schedule Tribe population
percentage of State population 0.62% 3%
Census 2001
Sex ratio 1,103 963 Census 2011 (provisional data)
3. Economy
As per the data collected by the Directorate of Economics & Statistics (2008-09), Pauri Garhwal has a
Gross District Domestic Product 62
of Rs. 254,912 Lakh (2008-2009) which amounts to 6.34 percent of
the total State GDDP. The per capita income of Pauri Garhwal for 2008-09 was valued at Rs. 28,139,
which is significantly lower than the State per capita income of Rs. 36,52063
.
62
Statistical Diary, Government of Uttarakhand 63
http://planningcommission.nic.in/plans/stateplan/present/Uttarakhand.pdf
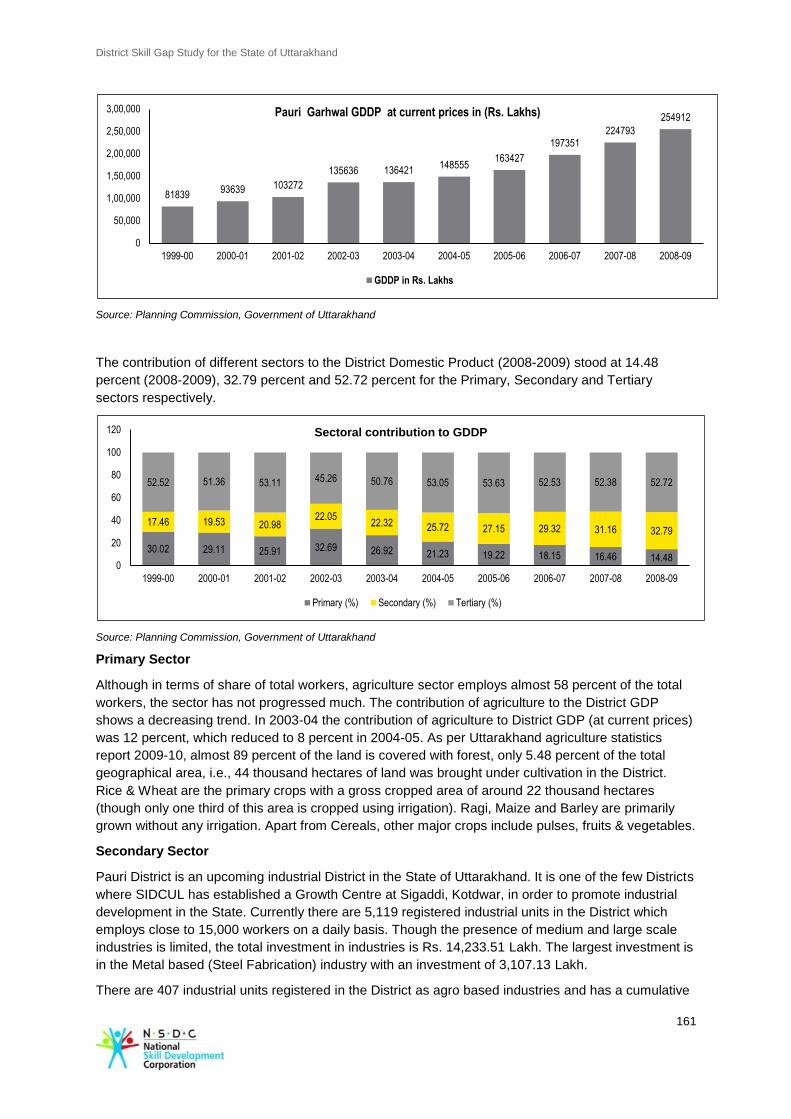
District Skill Gap Study for the State of Uttarakhand
161
Source: Planning Commission, Government of Uttarakhand
The contribution of different sectors to the District Domestic Product (2008-2009) stood at 14.48
percent (2008-2009), 32.79 percent and 52.72 percent for the Primary, Secondary and Tertiary
sectors respectively.
Source: Planning Commission, Government of Uttarakhand
Primary Sector
Although in terms of share of total workers, agriculture sector employs almost 58 percent of the total
workers, the sector has not progressed much. The contribution of agriculture to the District GDP
shows a decreasing trend. In 2003-04 the contribution of agriculture to District GDP (at current prices)
was 12 percent, which reduced to 8 percent in 2004-05. As per Uttarakhand agriculture statistics
report 2009-10, almost 89 percent of the land is covered with forest, only 5.48 percent of the total
geographical area, i.e., 44 thousand hectares of land was brought under cultivation in the District.
Rice & Wheat are the primary crops with a gross cropped area of around 22 thousand hectares
(though only one third of this area is cropped using irrigation). Ragi, Maize and Barley are primarily
grown without any irrigation. Apart from Cereals, other major crops include pulses, fruits & vegetables.
Secondary Sector
Pauri District is an upcoming industrial District in the State of Uttarakhand. It is one of the few Districts
where SIDCUL has established a Growth Centre at Sigaddi, Kotdwar, in order to promote industrial
development in the State. Currently there are 5,119 registered industrial units in the District which
employs close to 15,000 workers on a daily basis. Though the presence of medium and large scale
industries is limited, the total investment in industries is Rs. 14,233.51 Lakh. The largest investment is
in the Metal based (Steel Fabrication) industry with an investment of 3,107.13 Lakh.
There are 407 industrial units registered in the District as agro based industries and has a cumulative
81839 93639 103272
135636 136421 148555
163427
197351 224793
254912
0
50,000
1,00,000
1,50,000
2,00,000
2,50,000
3,00,000
1999-00 2000-01 2001-02 2002-03 2003-04 2004-05 2005-06 2006-07 2007-08 2008-09
Pauri Garhwal GDDP at current prices in (Rs. Lakhs)
GDDP in Rs. Lakhs
30.02 29.11 25.91 32.69 26.92 21.23 19.22 18.15 16.46 14.48
17.46 19.53 20.98 22.05
22.32 25.72 27.15 29.32 31.16 32.79
52.52 51.36 53.11 45.26 50.76 53.05 53.63 52.53 52.38 52.72
0
20
40
60
80
100
120
1999-00 2000-01 2001-02 2002-03 2003-04 2004-05 2005-06 2006-07 2007-08 2008-09
Sectoral contribution to GDDP
Primary (%) Secondary (%) Tertiary (%)
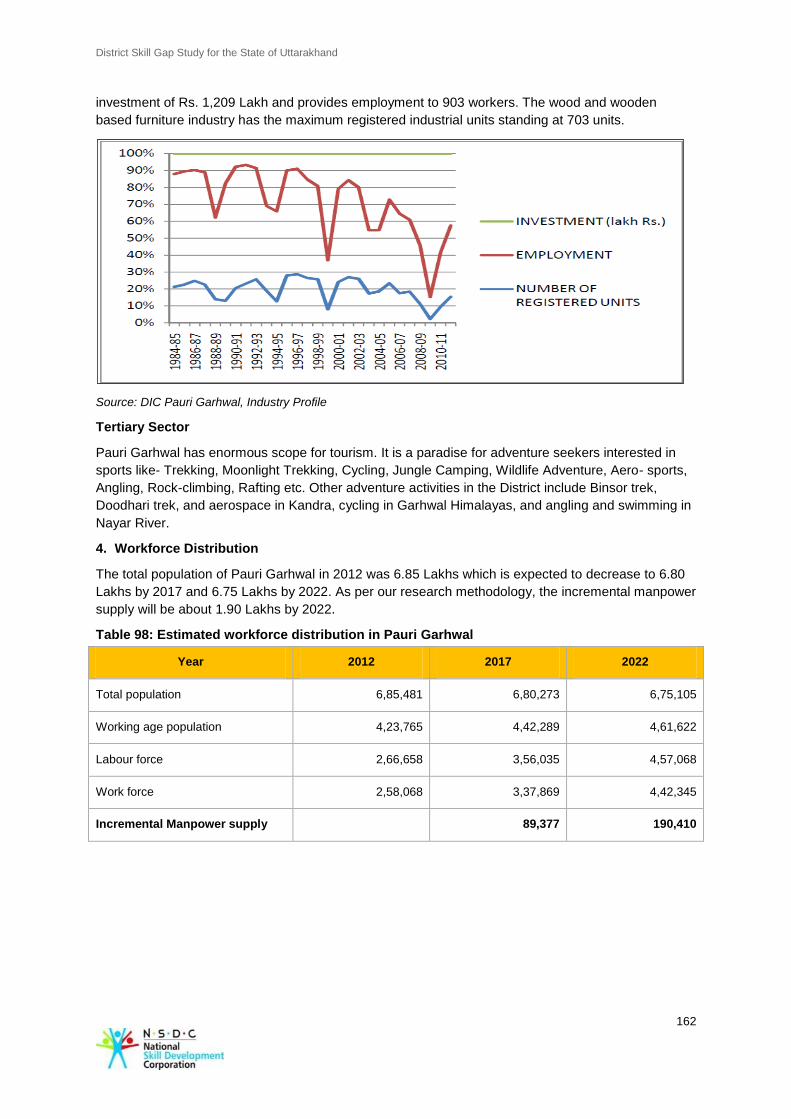
District Skill Gap Study for the State of Uttarakhand
162
investment of Rs. 1,209 Lakh and provides employment to 903 workers. The wood and wooden
based furniture industry has the maximum registered industrial units standing at 703 units.
Source: DIC Pauri Garhwal, Industry Profile
Tertiary Sector
Pauri Garhwal has enormous scope for tourism. It is a paradise for adventure seekers interested in
sports like- Trekking, Moonlight Trekking, Cycling, Jungle Camping, Wildlife Adventure, Aero- sports,
Angling, Rock-climbing, Rafting etc. Other adventure activities in the District include Binsor trek,
Doodhari trek, and aerospace in Kandra, cycling in Garhwal Himalayas, and angling and swimming in
Nayar River.
4. Workforce Distribution
The total population of Pauri Garhwal in 2012 was 6.85 Lakhs which is expected to decrease to 6.80
Lakhs by 2017 and 6.75 Lakhs by 2022. As per our research methodology, the incremental manpower
supply will be about 1.90 Lakhs by 2022.
Table 98: Estimated workforce distribution in Pauri Garhwal
Year 2012 2017 2022
Total population 6,85,481 6,80,273 6,75,105
Working age population 4,23,765 4,42,289 4,61,622
Labour force 2,66,658 3,56,035 4,57,068
Work force 2,58,068 3,37,869 4,42,345
Incremental Manpower supply 89,377 190,410
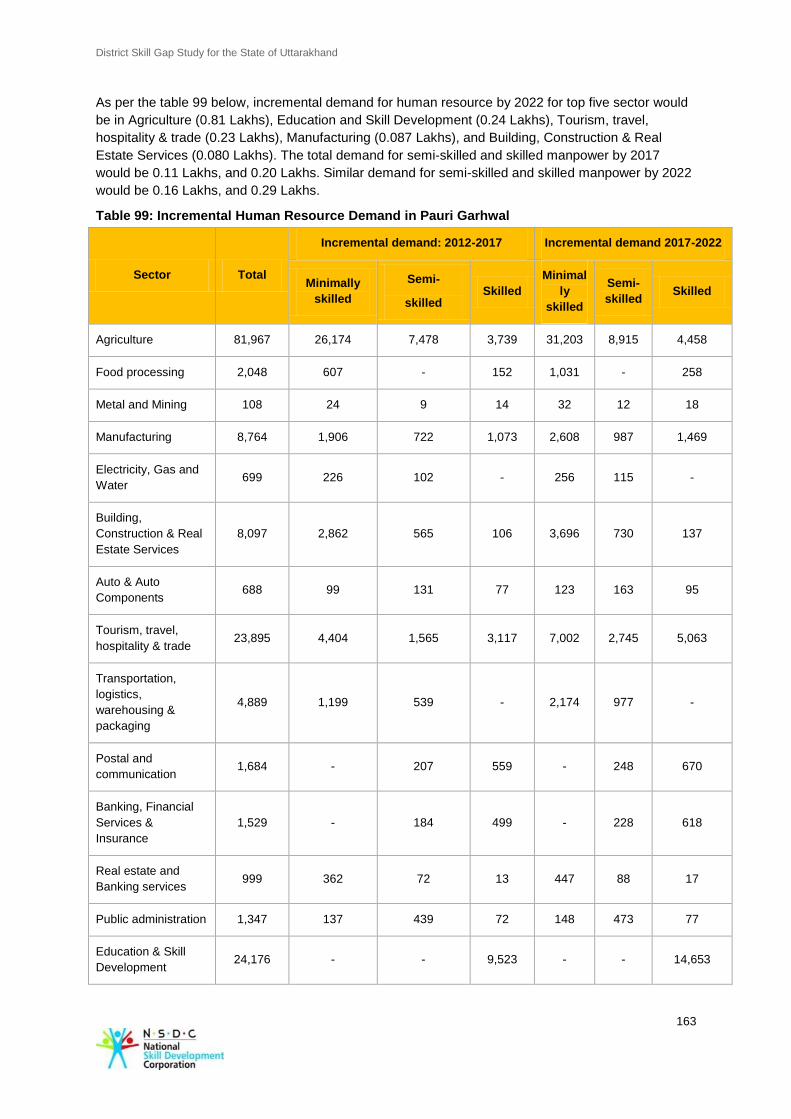
District Skill Gap Study for the State of Uttarakhand
163
As per the table 99 below, incremental demand for human resource by 2022 for top five sector would
be in Agriculture (0.81 Lakhs), Education and Skill Development (0.24 Lakhs), Tourism, travel,
hospitality & trade (0.23 Lakhs), Manufacturing (0.087 Lakhs), and Building, Construction & Real
Estate Services (0.080 Lakhs). The total demand for semi-skilled and skilled manpower by 2017
would be 0.11 Lakhs, and 0.20 Lakhs. Similar demand for semi-skilled and skilled manpower by 2022
would be 0.16 Lakhs, and 0.29 Lakhs.
Table 99: Incremental Human Resource Demand in Pauri Garhwal
Sector Total
Incremental demand: 2012-2017 Incremental demand 2017-2022
Minimally
skilled
Semi-
skilled Skilled
Minimal
ly
skilled
Semi-
skilled Skilled
Agriculture 81,967 26,174 7,478 3,739 31,203 8,915 4,458
Food processing 2,048 607 - 152 1,031 - 258
Metal and Mining 108 24 9 14 32 12 18
Manufacturing 8,764 1,906 722 1,073 2,608 987 1,469
Electricity, Gas and
Water 699 226 102 - 256 115 -
Building,
Construction & Real
Estate Services
8,097 2,862 565 106 3,696 730 137
Auto & Auto
Components 688 99 131 77 123 163 95
Tourism, travel,
hospitality & trade 23,895 4,404 1,565 3,117 7,002 2,745 5,063
Transportation,
logistics,
warehousing &
packaging
4,889 1,199 539 - 2,174 977 -
Postal and
communication 1,684 - 207 559 - 248 670
Banking, Financial
Services &
Insurance
1,529 - 184 499 - 228 618
Real estate and
Banking services 999 362 72 13 447 88 17
Public administration 1,347 137 439 72 148 473 77
Education & Skill
Development 24,176 - - 9,523 - - 14,653
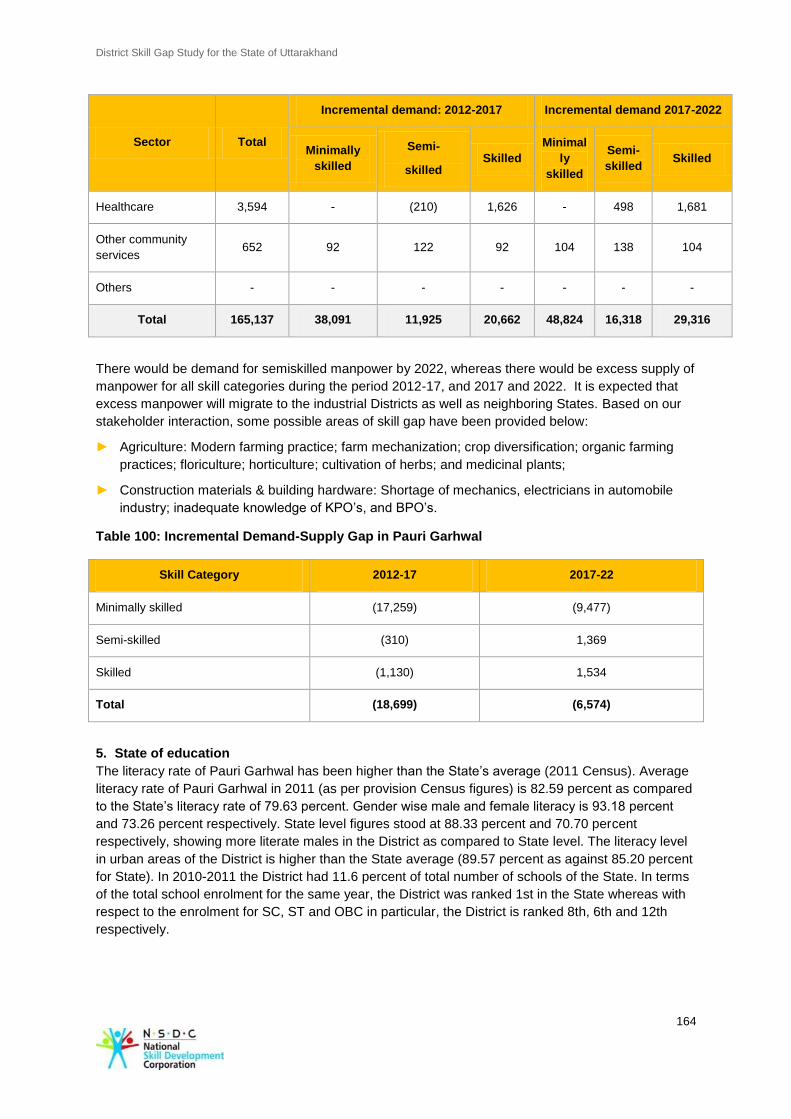
District Skill Gap Study for the State of Uttarakhand
164
Sector Total
Incremental demand: 2012-2017 Incremental demand 2017-2022
Minimally
skilled
Semi-
skilled Skilled
Minimal
ly
skilled
Semi-
skilled Skilled
Healthcare 3,594 - (210) 1,626 - 498 1,681
Other community
services 652 92 122 92 104 138 104
Others - - - - - - -
Total 165,137 38,091 11,925 20,662 48,824 16,318 29,316
There would be demand for semiskilled manpower by 2022, whereas there would be excess supply of
manpower for all skill categories during the period 2012-17, and 2017 and 2022. It is expected that
excess manpower will migrate to the industrial Districts as well as neighboring States. Based on our
stakeholder interaction, some possible areas of skill gap have been provided below:
► Agriculture: Modern farming practice; farm mechanization; crop diversification; organic farming
practices; floriculture; horticulture; cultivation of herbs; and medicinal plants;
► Construction materials & building hardware: Shortage of mechanics, electricians in automobile
industry; inadequate knowledge of KPO’s, and BPO’s.
Table 100: Incremental Demand-Supply Gap in Pauri Garhwal
Skill Category 2012-17 2017-22
Minimally skilled (17,259) (9,477)
Semi-skilled (310) 1,369
Skilled (1,130) 1,534
Total (18,699) (6,574)
5. State of education
The literacy rate of Pauri Garhwal has been higher than the State’s average (2011 Census). Average
literacy rate of Pauri Garhwal in 2011 (as per provision Census figures) is 82.59 percent as compared
to the State’s literacy rate of 79.63 percent. Gender wise male and female literacy is 93.18 percent
and 73.26 percent respectively. State level figures stood at 88.33 percent and 70.70 percent
respectively, showing more literate males in the District as compared to State level. The literacy level
in urban areas of the District is higher than the State average (89.57 percent as against 85.20 percent
for State). In 2010-2011 the District had 11.6 percent of total number of schools of the State. In terms
of the total school enrolment for the same year, the District was ranked 1st in the State whereas with
respect to the enrolment for SC, ST and OBC in particular, the District is ranked 8th, 6th and 12th
respectively.
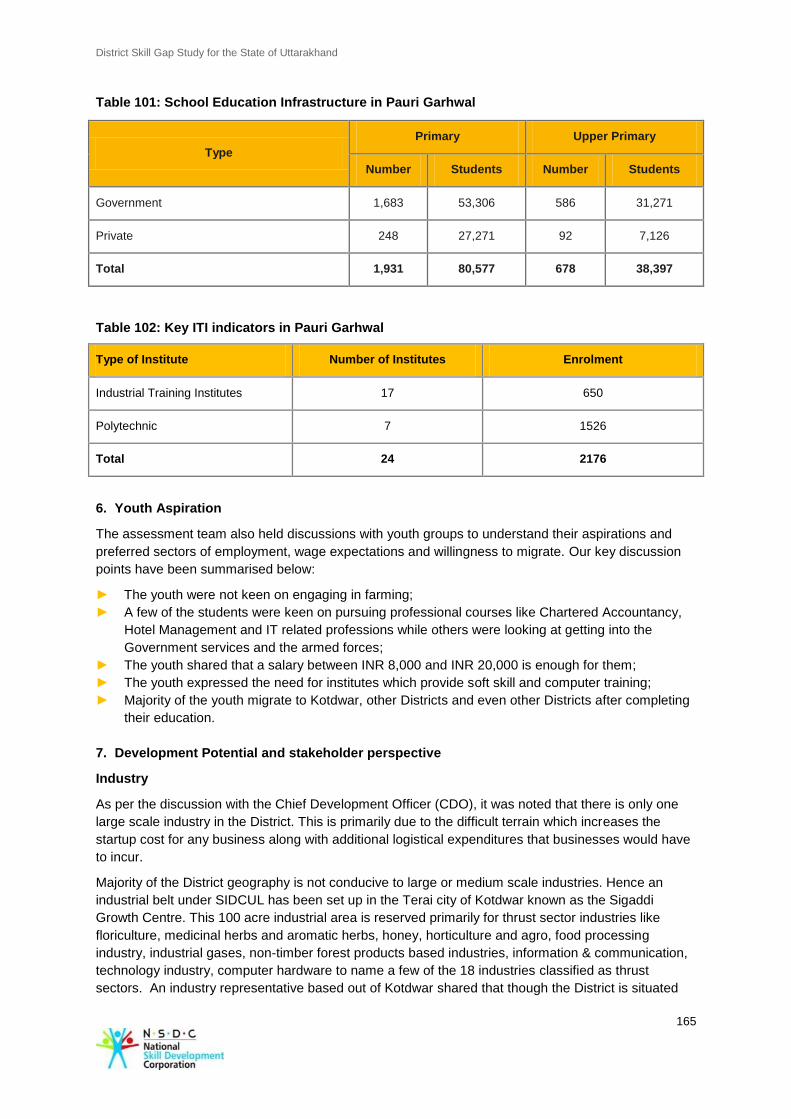
District Skill Gap Study for the State of Uttarakhand
165
Table 101: School Education Infrastructure in Pauri Garhwal
Type
Primary Upper Primary
Number Students Number Students
Government 1,683 53,306 586 31,271
Private 248 27,271 92 7,126
Total 1,931 80,577 678 38,397
Table 102: Key ITI indicators in Pauri Garhwal
Type of Institute Number of Institutes Enrolment
Industrial Training Institutes 17 650
Polytechnic 7 1526
Total 24 2176
6. Youth Aspiration
The assessment team also held discussions with youth groups to understand their aspirations and
preferred sectors of employment, wage expectations and willingness to migrate. Our key discussion
points have been summarised below:
► The youth were not keen on engaging in farming;
► A few of the students were keen on pursuing professional courses like Chartered Accountancy,
Hotel Management and IT related professions while others were looking at getting into the
Government services and the armed forces;
► The youth shared that a salary between INR 8,000 and INR 20,000 is enough for them;
► The youth expressed the need for institutes which provide soft skill and computer training;
► Majority of the youth migrate to Kotdwar, other Districts and even other Districts after completing
their education.
7. Development Potential and stakeholder perspective
Industry
As per the discussion with the Chief Development Officer (CDO), it was noted that there is only one
large scale industry in the District. This is primarily due to the difficult terrain which increases the
startup cost for any business along with additional logistical expenditures that businesses would have
to incur.
Majority of the District geography is not conducive to large or medium scale industries. Hence an
industrial belt under SIDCUL has been set up in the Terai city of Kotdwar known as the Sigaddi
Growth Centre. This 100 acre industrial area is reserved primarily for thrust sector industries like
floriculture, medicinal herbs and aromatic herbs, honey, horticulture and agro, food processing
industry, industrial gases, non-timber forest products based industries, information & communication,
technology industry, computer hardware to name a few of the 18 industries classified as thrust
sectors. An industry representative based out of Kotdwar shared that though the District is situated
District Skill Gap Study for the State of Uttarakhand
166
only 200 kms from Delhi and 120 kms from Dehradun, the Sigaddi Growth centre lacks basic
infrastructure like roads etc. due to which not many industries have set up their units, in spite of the
various benefits. SIDCUL offers 100 percent Central Excise exemption for 10 years, 100 percent
Income Tax exemption for first 5 years and 30 percent for next 5 Years, CST @1 percent for 5 years
and Capital Investment Subsidy @15 percent with a maximum of Rs. 30 Lakh.
The growth centre has major scope for fuelling the Districts economy; however it has not been as
appealing to the big industry players as some of the other industrial belts of Haridwar and Udham
Singh Nagar. The GM DIC shared that in Kotdwar the agro based industries, furniture industry,
readymade garments, automobile industry and the steel fabrication industry has immense scope for
generating domestic employment. However the limited number of training institutes and courses is not
able to fulfill the high demand for skilled labor in these industries. The GM DIC emphasized on the
high demand for mechanics and electricians in the automobile industry, owing to the recent growth of
industry in the District. He further added that the growth of wood and wood based furniture industry
has resulted in increasing the demand for skilled carpenters, painters and artisans. This industry
currently employs 4,986 people.
The CDO suggested that there is scope for setting up service industries like Business Process
Outsourcing (BPO’s), Knowledge Process Outsourcing (KPO), which will help generate employment
opportunities for the educated and unemployed youth.
During an interaction with the representative of one of the major IT companies that has set base in
Sigaddi Growth Centre, it was noted that the human resource requirements for skilled and unskilled
labour is fulfilled with great difficulty. This is due to the quality of higher education and the paucity
locally available trained workforce. The industry representative shared that the Government has
established a clause where a company that sets base in Sigaddi, is required to recruit at least
70percent of its workforce from the State. He further added that this condition becomes very difficult to
adhere to, given the high eligibility requirements of the skilled workforce in their organisation. The
company needs candidates who have a first division from 10th grade to Diploma or Polytechnic. Thus
human resource requirements have to be fulfilled by outsourcing jobs to other States where qualified
and committed workforce is available. Further the industry representatives shared with the team that
the courses being run by the ITI’s are outdated and should be discontinued. They were of the opinion
that, the ITI courses need to be updated and upgraded with more focus on practical experience, to
ensure that students learn employable skills rather than acquiring outdated theoretical knowledge.
Agriculture, Horticulture, Floriculture and Herbiculture
Agriculture is the primary source of income for the District, as 58 percent of the population is engaged
in farming. The scale of agriculture in the District has reduced due to high rate of migration of youth,
as can be seen by the drop in population of the District from 6,97,078 in 2001 to 6,86,527 in 2011.
The cultivable farmlands which constitute 5.4 percent of the geographical cover of the District, are
lying vacant and the landholdings have become smaller over a period of time. The use of traditional
farming practices has resulted in restricted output, leading to 78.85 percent of the farmers becoming
small and marginal farmers. NABARD is encouraging setting up of farmer clubs, and rural innovation
fund for promoting agriculture in the District/State. The agriculture department of Pauri aims to
increase the production and productivity of cereals and pulses by 2 to 3 quintals per hectare by 2015.
This will require a shift to modern farming practices which would include the use of high yield variety
of seeds, diversification of crops, better management of land and crops, inclusion of organic farming
practices etc. This gives rise to the need for training on such skills to help revive agriculture in the
District and meet the goal for 2015.
The ADM of the District suggested that floriculture, horticulture, cultivation of herbs and medicinal
plants should be promoted since the terrain and the climatic conditions provide large quantities of raw
material for commercial production. Given the natural conditions the District, like all other hilly Districts
has abundance for herbs and medicinal plants. The Sigaddi growth centre has 4 herbs processing
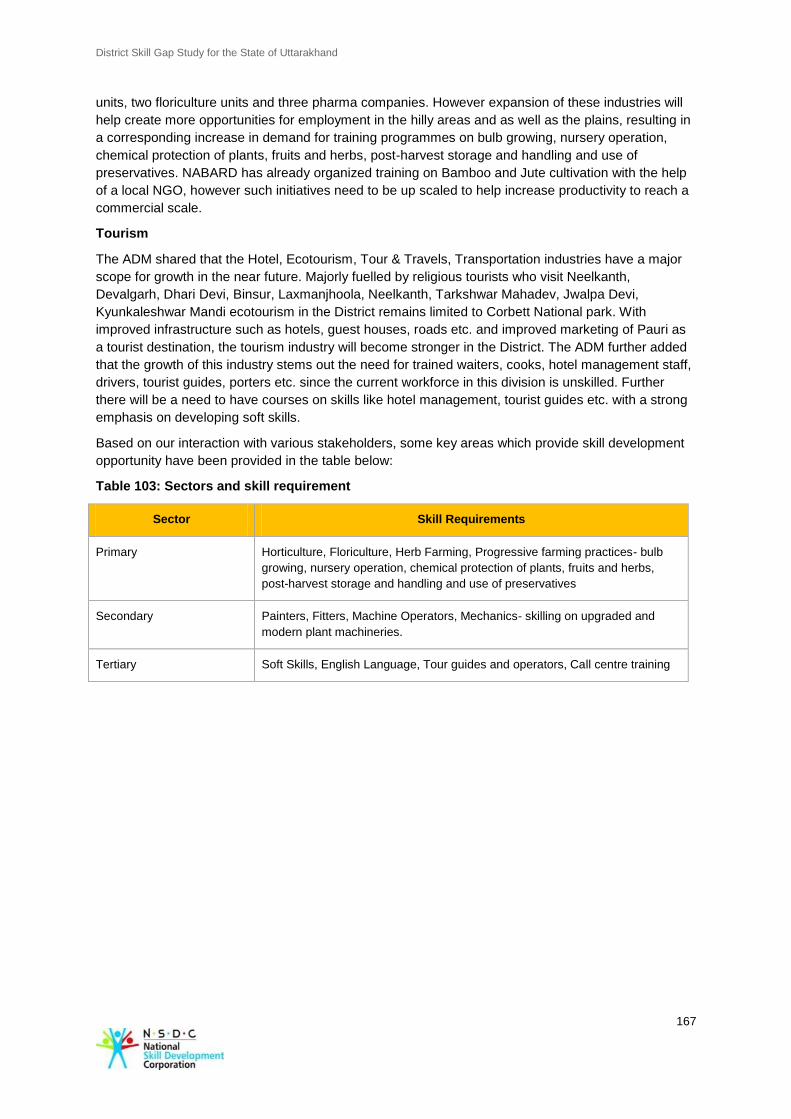
District Skill Gap Study for the State of Uttarakhand
167
units, two floriculture units and three pharma companies. However expansion of these industries will
help create more opportunities for employment in the hilly areas and as well as the plains, resulting in
a corresponding increase in demand for training programmes on bulb growing, nursery operation,
chemical protection of plants, fruits and herbs, post-harvest storage and handling and use of
preservatives. NABARD has already organized training on Bamboo and Jute cultivation with the help
of a local NGO, however such initiatives need to be up scaled to help increase productivity to reach a
commercial scale.
Tourism
The ADM shared that the Hotel, Ecotourism, Tour & Travels, Transportation industries have a major
scope for growth in the near future. Majorly fuelled by religious tourists who visit Neelkanth,
Devalgarh, Dhari Devi, Binsur, Laxmanjhoola, Neelkanth, Tarkshwar Mahadev, Jwalpa Devi,
Kyunkaleshwar Mandi ecotourism in the District remains limited to Corbett National park. With
improved infrastructure such as hotels, guest houses, roads etc. and improved marketing of Pauri as
a tourist destination, the tourism industry will become stronger in the District. The ADM further added
that the growth of this industry stems out the need for trained waiters, cooks, hotel management staff,
drivers, tourist guides, porters etc. since the current workforce in this division is unskilled. Further
there will be a need to have courses on skills like hotel management, tourist guides etc. with a strong
emphasis on developing soft skills.
Based on our interaction with various stakeholders, some key areas which provide skill development
opportunity have been provided in the table below:
Table 103: Sectors and skill requirement
Sector Skill Requirements
Primary Horticulture, Floriculture, Herb Farming, Progressive farming practices- bulb
growing, nursery operation, chemical protection of plants, fruits and herbs,
post-harvest storage and handling and use of preservatives
Secondary Painters, Fitters, Machine Operators, Mechanics- skilling on upgraded and
modern plant machineries.
Tertiary Soft Skills, English Language, Tour guides and operators, Call centre training
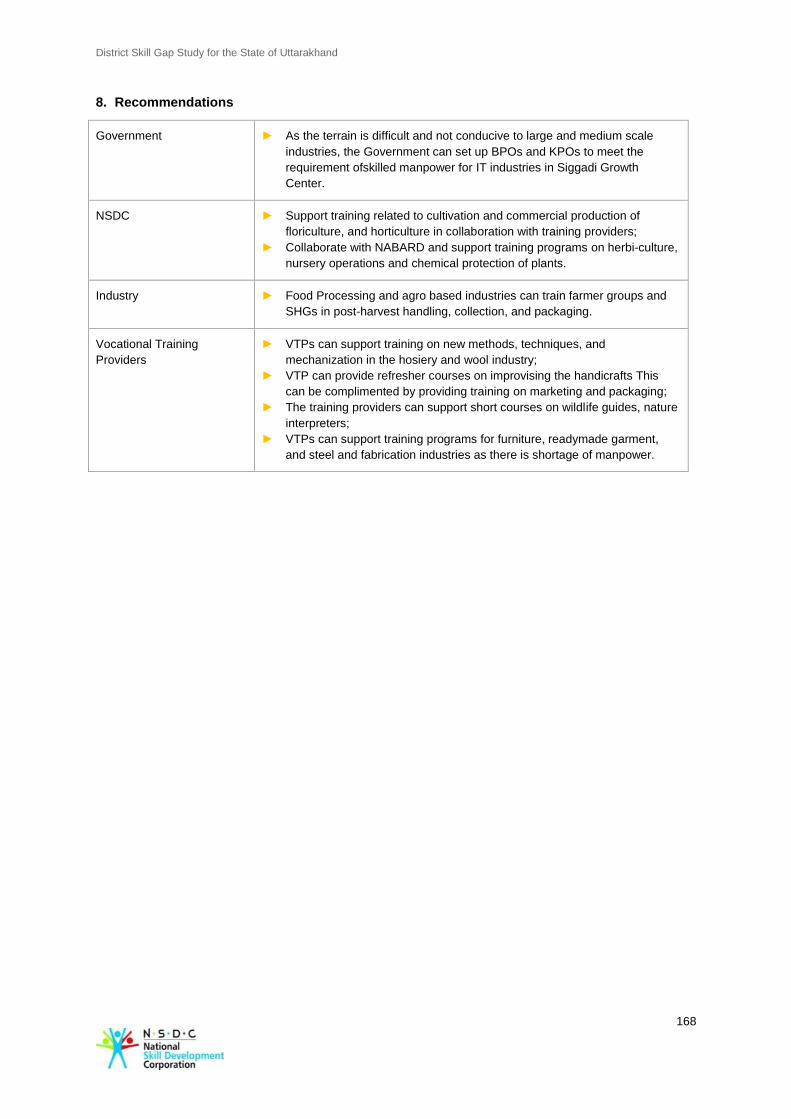
District Skill Gap Study for the State of Uttarakhand
168
8. Recommendations
Government ► As the terrain is difficult and not conducive to large and medium scale
industries, the Government can set up BPOs and KPOs to meet the
requirement ofskilled manpower for IT industries in Siggadi Growth
Center.
NSDC ► Support training related to cultivation and commercial production of
floriculture, and horticulture in collaboration with training providers;
► Collaborate with NABARD and support training programs on herbi-culture,
nursery operations and chemical protection of plants.
Industry ► Food Processing and agro based industries can train farmer groups and
SHGs in post-harvest handling, collection, and packaging.
Vocational Training
Providers
► VTPs can support training on new methods, techniques, and
mechanization in the hosiery and wool industry;
► VTP can provide refresher courses on improvising the handicrafts This
can be complimented by providing training on marketing and packaging;
► The training providers can support short courses on wildlife guides, nature
interpreters;
► VTPs can support training programs for furniture, readymade garment,
and steel and fabrication industries as there is shortage of manpower.
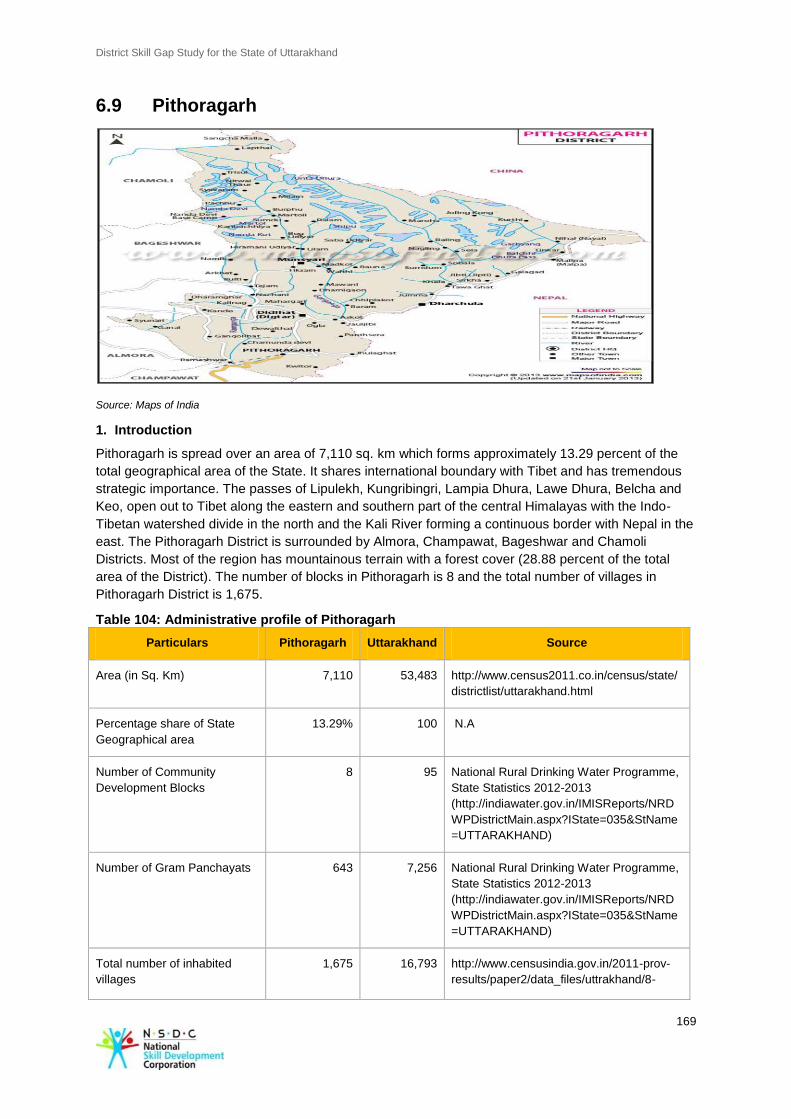
District Skill Gap Study for the State of Uttarakhand
169
6.9 Pithoragarh
Source: Maps of India
1. Introduction
Pithoragarh is spread over an area of 7,110 sq. km which forms approximately 13.29 percent of the
total geographical area of the State. It shares international boundary with Tibet and has tremendous
strategic importance. The passes of Lipulekh, Kungribingri, Lampia Dhura, Lawe Dhura, Belcha and
Keo, open out to Tibet along the eastern and southern part of the central Himalayas with the Indo-
Tibetan watershed divide in the north and the Kali River forming a continuous border with Nepal in the
east. The Pithoragarh District is surrounded by Almora, Champawat, Bageshwar and Chamoli
Districts. Most of the region has mountainous terrain with a forest cover (28.88 percent of the total
area of the District). The number of blocks in Pithoragarh is 8 and the total number of villages in
Pithoragarh District is 1,675.
Table 104: Administrative profile of Pithoragarh
Particulars Pithoragarh Uttarakhand Source
Area (in Sq. Km) 7,110 53,483 http://www.census2011.co.in/census/state/
districtlist/uttarakhand.html
Percentage share of State
Geographical area
13.29% 100 N.A
Number of Community
Development Blocks
8 95 National Rural Drinking Water Programme,
State Statistics 2012-2013
(http://indiawater.gov.in/IMISReports/NRD
WPDistrictMain.aspx?IState=035&StName
=UTTARAKHAND)
Number of Gram Panchayats 643 7,256 National Rural Drinking Water Programme,
State Statistics 2012-2013
(http://indiawater.gov.in/IMISReports/NRD
WPDistrictMain.aspx?IState=035&StName
=UTTARAKHAND)
Total number of inhabited
villages
1,675 16,793 http://www.censusindia.gov.in/2011-prov-
results/paper2/data_files/uttrakhand/8-
District Skill Gap Study for the State of Uttarakhand
170
Particulars Pithoragarh Uttarakhand Source
adminunit-60-61.pdf
2. Demography
Pithoragarh is home to 4.80 percent of the total population of the State. It is the eighth most populated
District of the State and has had a decadal growth rate in population of 5.13 percent in the total
population compared to the population as per Census 2001. Approximately, 85.69 percent of the
population lives in rural areas and rest of the population lives in urban areas.
According to Census 2011 (provisional data), the sex ratio in Pithoragarh was 1,021 females per
1,000 males. Pithoragarh has a population of 4.86 Lakh of which males and females were 2.40 Lakh
and 2.45 Lakh respectively. The population density of Pithoragarh was 69 in 2011 making it the third
most sparsely populated District of Uttarakhand after Uttarkashi and Chamoli.
Table 105: Socio economic indicators for Pithoragarh
Population Pithoragarh Uttarakhand Source
Total population (in Lakh) 4.86 101.16 Census 2011 (provisional date)
Total population (Male) (in Lakh) 2.40 51.54 Census 2011 (provisional date)
Total population (Female) (in Lakh) 2.45 49.63 Census 2011 (provisional date)
District share in State's population 4.80% N.A N.A
Density of population 69 189 Census 2011 (provisional date)
Decadal growth of population (2001-
2011) 5.13% 19.17% Census 2011 (provisional date)
Percentage of urban population 14.31% 30.55% Census 2011 (provisional date)
Scheduled Caste population
percentage of State population 23% 17.90% Census 2001
Schedule Tribe population
percentage of State population 7.53% 3% Census 2001
Sex ratio 1,021 963 Census 2011 (provisional data)
3. Economy
As per the data collected by the Directorate of Economics & Statistics (2008-09), Pithoragarh had a
Gross District Domestic Product 64
of Rs. 1,71,228 Lakh which amounts to 5.82 percent of the total
State GDDP. The per capita income of Pithoragarh for 2008-09 was valued at Rs. 28,896, which is
lower than the State per capita income of Rs. 36,52065
64
Statistical Diary, Government of Uttarakhand 65
http://planningcommission.nic.in/plans/stateplan/present/Uttarakhand.pdf
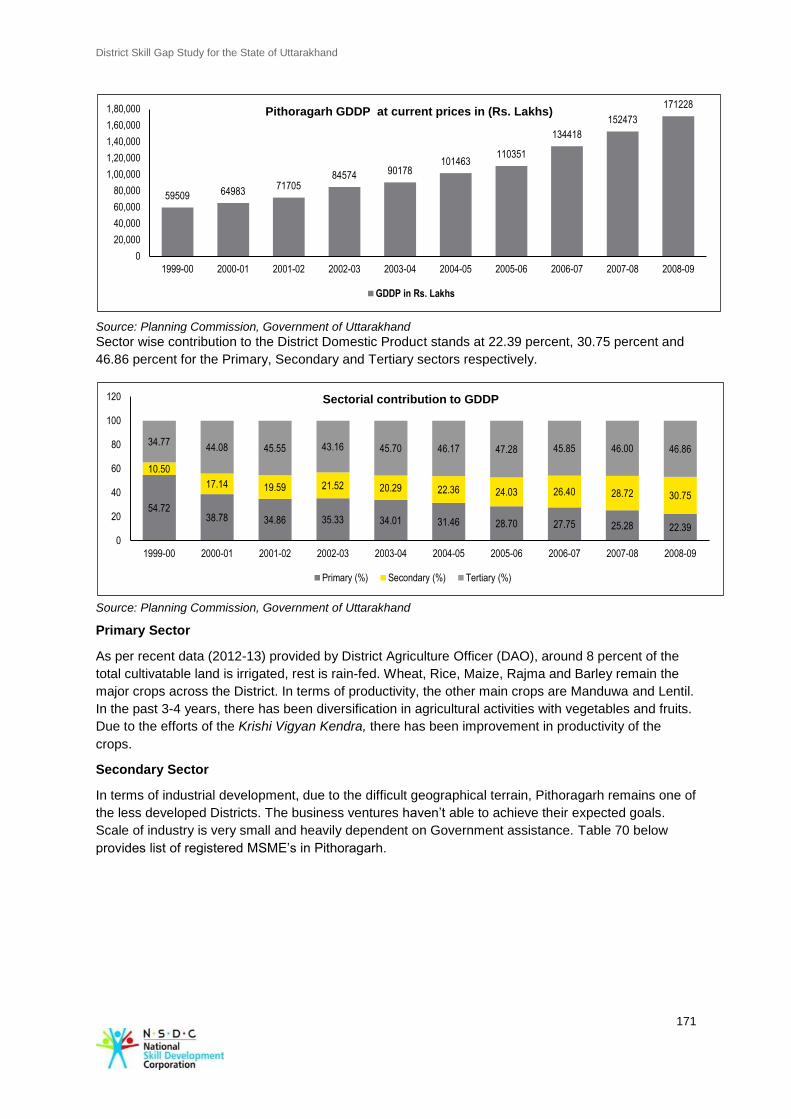
District Skill Gap Study for the State of Uttarakhand
171
Source: Planning Commission, Government of Uttarakhand
Sector wise contribution to the District Domestic Product stands at 22.39 percent, 30.75 percent and
46.86 percent for the Primary, Secondary and Tertiary sectors respectively.
Source: Planning Commission, Government of Uttarakhand
Primary Sector
As per recent data (2012-13) provided by District Agriculture Officer (DAO), around 8 percent of the
total cultivatable land is irrigated, rest is rain-fed. Wheat, Rice, Maize, Rajma and Barley remain the
major crops across the District. In terms of productivity, the other main crops are Manduwa and Lentil.
In the past 3-4 years, there has been diversification in agricultural activities with vegetables and fruits.
Due to the efforts of the Krishi Vigyan Kendra, there has been improvement in productivity of the
crops.
Secondary Sector
In terms of industrial development, due to the difficult geographical terrain, Pithoragarh remains one of
the less developed Districts. The business ventures haven’t able to achieve their expected goals.
Scale of industry is very small and heavily dependent on Government assistance. Table 70 below
provides list of registered MSME’s in Pithoragarh.
59509 64983 71705
84574 90178 101463
110351
134418
152473
171228
0
20,000
40,000
60,000
80,000
1,00,000
1,20,000
1,40,000
1,60,000
1,80,000
1999-00 2000-01 2001-02 2002-03 2003-04 2004-05 2005-06 2006-07 2007-08 2008-09
Pithoragarh GDDP at current prices in (Rs. Lakhs)
GDDP in Rs. Lakhs
54.72 38.78 34.86 35.33 34.01 31.46 28.70 27.75 25.28 22.39
10.50
17.14 19.59 21.52 20.29 22.36 24.03 26.40 28.72 30.75
34.77 44.08 45.55 43.16 45.70 46.17 47.28 45.85 46.00 46.86
0
20
40
60
80
100
120
1999-00 2000-01 2001-02 2002-03 2003-04 2004-05 2005-06 2006-07 2007-08 2008-09
Sectorial contribution to GDDP
Primary (%) Secondary (%) Tertiary (%)
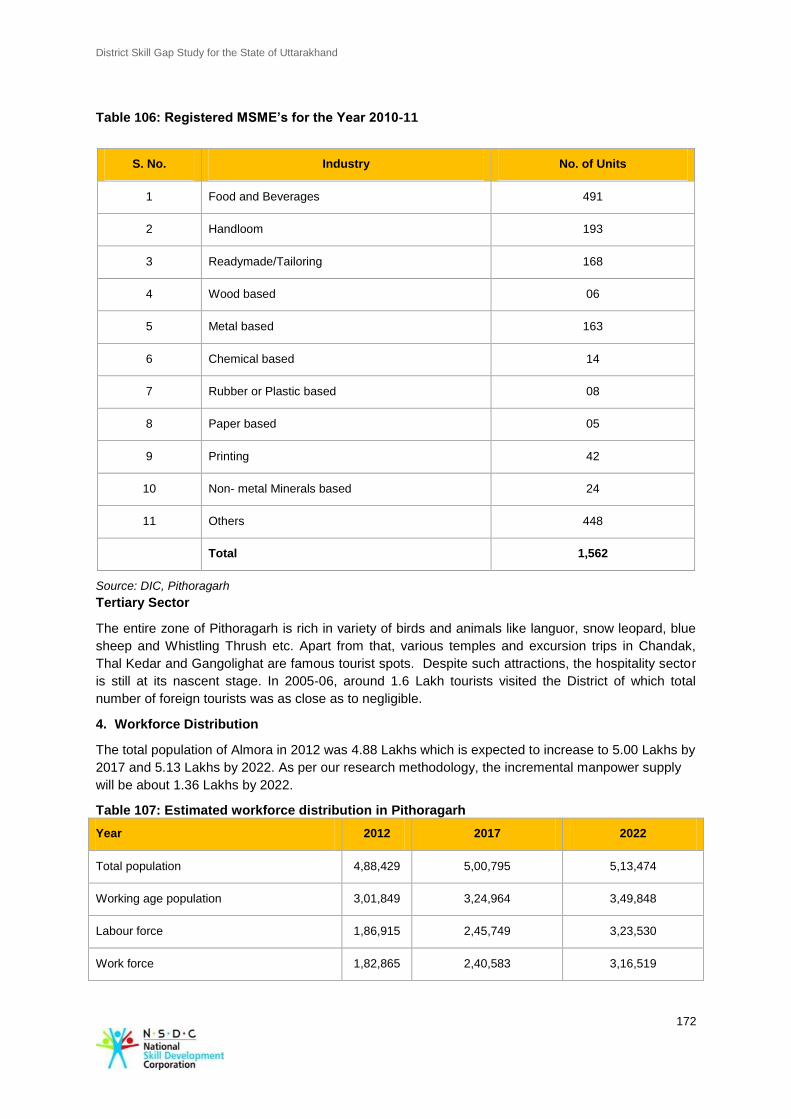
District Skill Gap Study for the State of Uttarakhand
172
Table 106: Registered MSME’s for the Year 2010-11
S. No. Industry No. of Units
1 Food and Beverages 491
2 Handloom 193
3 Readymade/Tailoring 168
4 Wood based 06
5 Metal based 163
6 Chemical based 14
7 Rubber or Plastic based 08
8 Paper based 05
9 Printing 42
10 Non- metal Minerals based 24
11 Others 448
Total 1,562
Source: DIC, Pithoragarh
Tertiary Sector
The entire zone of Pithoragarh is rich in variety of birds and animals like languor, snow leopard, blue
sheep and Whistling Thrush etc. Apart from that, various temples and excursion trips in Chandak,
Thal Kedar and Gangolighat are famous tourist spots. Despite such attractions, the hospitality sector
is still at its nascent stage. In 2005-06, around 1.6 Lakh tourists visited the District of which total
number of foreign tourists was as close as to negligible.
4. Workforce Distribution
The total population of Almora in 2012 was 4.88 Lakhs which is expected to increase to 5.00 Lakhs by
2017 and 5.13 Lakhs by 2022. As per our research methodology, the incremental manpower supply
will be about 1.36 Lakhs by 2022.
Table 107: Estimated workforce distribution in Pithoragarh
Year 2012 2017 2022
Total population 4,88,429 5,00,795 5,13,474
Working age population 3,01,849 3,24,964 3,49,848
Labour force 1,86,915 2,45,749 3,23,530
Work force 1,82,865 2,40,583 3,16,519
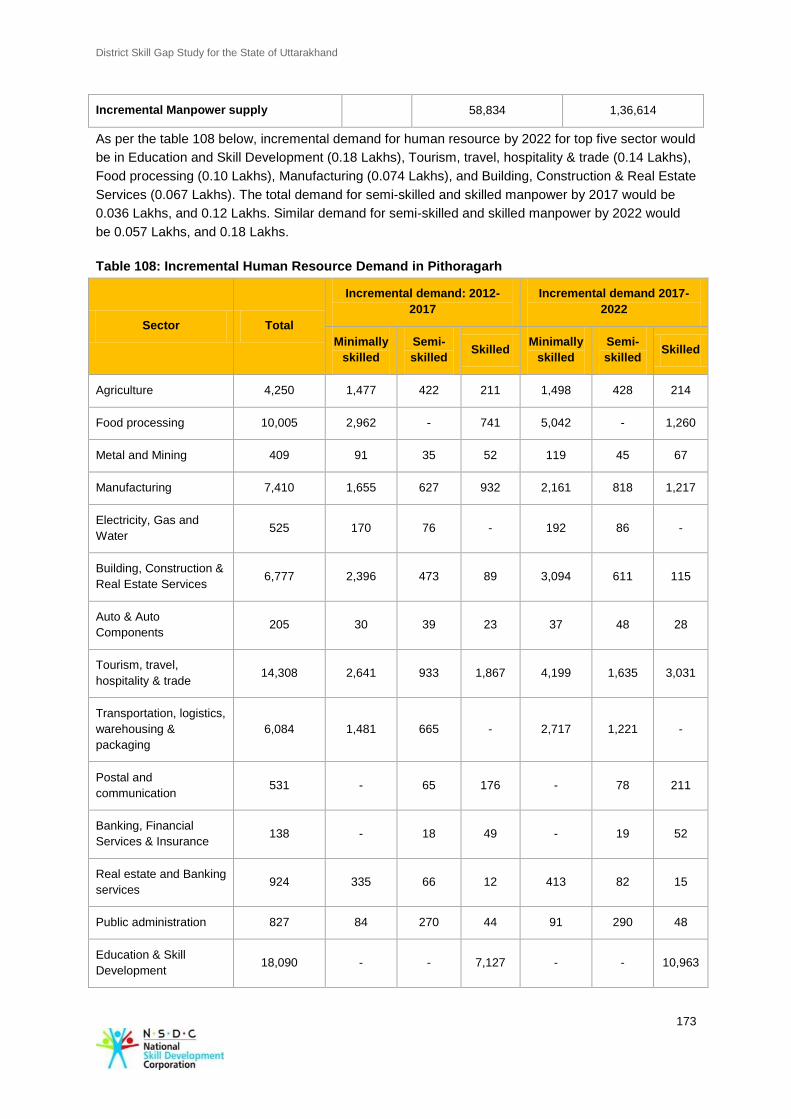
District Skill Gap Study for the State of Uttarakhand
173
Incremental Manpower supply
58,834 1,36,614
As per the table 108 below, incremental demand for human resource by 2022 for top five sector would
be in Education and Skill Development (0.18 Lakhs), Tourism, travel, hospitality & trade (0.14 Lakhs),
Food processing (0.10 Lakhs), Manufacturing (0.074 Lakhs), and Building, Construction & Real Estate
Services (0.067 Lakhs). The total demand for semi-skilled and skilled manpower by 2017 would be
0.036 Lakhs, and 0.12 Lakhs. Similar demand for semi-skilled and skilled manpower by 2022 would
be 0.057 Lakhs, and 0.18 Lakhs.
Table 108: Incremental Human Resource Demand in Pithoragarh
Sector Total
Incremental demand: 2012-
2017
Incremental demand 2017-
2022
Minimally
skilled
Semi-
skilled Skilled
Minimally
skilled
Semi-
skilled Skilled
Agriculture 4,250 1,477 422 211 1,498 428 214
Food processing 10,005 2,962 - 741 5,042 - 1,260
Metal and Mining 409 91 35 52 119 45 67
Manufacturing 7,410 1,655 627 932 2,161 818 1,217
Electricity, Gas and
Water 525 170 76 - 192 86 -
Building, Construction &
Real Estate Services 6,777 2,396 473 89 3,094 611 115
Auto & Auto
Components 205 30 39 23 37 48 28
Tourism, travel,
hospitality & trade 14,308 2,641 933 1,867 4,199 1,635 3,031
Transportation, logistics,
warehousing &
packaging
6,084 1,481 665 - 2,717 1,221 -
Postal and
communication 531 - 65 176 - 78 211
Banking, Financial
Services & Insurance 138 - 18 49 - 19 52
Real estate and Banking
services 924 335 66 12 413 82 15
Public administration 827 84 270 44 91 290 48
Education & Skill
Development 18,090 - - 7,127 - - 10,963
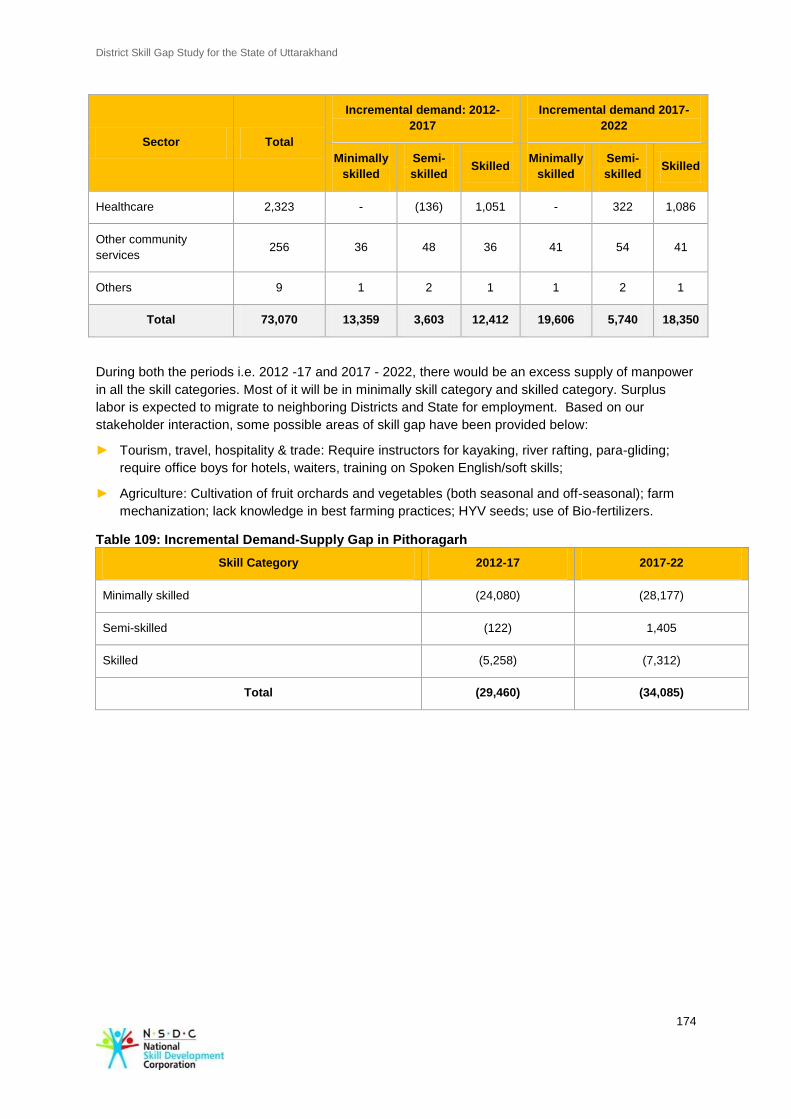
District Skill Gap Study for the State of Uttarakhand
174
Sector Total
Incremental demand: 2012-
2017
Incremental demand 2017-
2022
Minimally
skilled
Semi-
skilled Skilled
Minimally
skilled
Semi-
skilled Skilled
Healthcare 2,323 - (136) 1,051 - 322 1,086
Other community
services 256 36 48 36 41 54 41
Others 9 1 2 1 1 2 1
Total 73,070 13,359 3,603 12,412 19,606 5,740 18,350
During both the periods i.e. 2012 -17 and 2017 - 2022, there would be an excess supply of manpower
in all the skill categories. Most of it will be in minimally skill category and skilled category. Surplus
labor is expected to migrate to neighboring Districts and State for employment. Based on our
stakeholder interaction, some possible areas of skill gap have been provided below:
► Tourism, travel, hospitality & trade: Require instructors for kayaking, river rafting, para-gliding;
require office boys for hotels, waiters, training on Spoken English/soft skills;
► Agriculture: Cultivation of fruit orchards and vegetables (both seasonal and off-seasonal); farm
mechanization; lack knowledge in best farming practices; HYV seeds; use of Bio-fertilizers.
Table 109: Incremental Demand-Supply Gap in Pithoragarh
Skill Category 2012-17 2017-22
Minimally skilled (24,080) (28,177)
Semi-skilled (122) 1,405
Skilled (5,258) (7,312)
Total (29,460) (34,085)
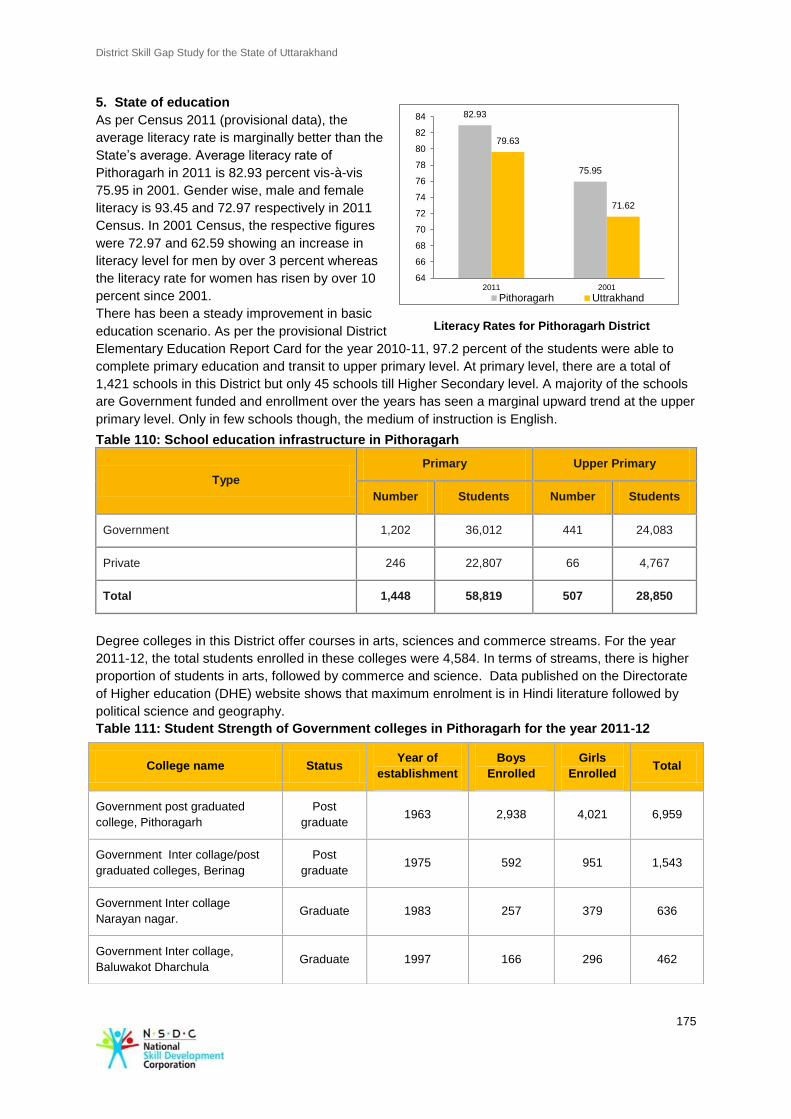
District Skill Gap Study for the State of Uttarakhand
175
82.93
75.95
79.63
71.62
64
66
68
70
72
74
76
78
80
82
84
2011 2001
Pithoragarh Uttrakhand
5. State of education
As per Census 2011 (provisional data), the
average literacy rate is marginally better than the
State’s average. Average literacy rate of
Pithoragarh in 2011 is 82.93 percent vis-à-vis
75.95 in 2001. Gender wise, male and female
literacy is 93.45 and 72.97 respectively in 2011
Census. In 2001 Census, the respective figures
were 72.97 and 62.59 showing an increase in
literacy level for men by over 3 percent whereas
the literacy rate for women has risen by over 10
percent since 2001.
There has been a steady improvement in basic
education scenario. As per the provisional District
Elementary Education Report Card for the year 2010-11, 97.2 percent of the students were able to
complete primary education and transit to upper primary level. At primary level, there are a total of
1,421 schools in this District but only 45 schools till Higher Secondary level. A majority of the schools
are Government funded and enrollment over the years has seen a marginal upward trend at the upper
primary level. Only in few schools though, the medium of instruction is English.
Table 110: School education infrastructure in Pithoragarh
Type
Primary Upper Primary
Number Students Number Students
Government 1,202 36,012 441 24,083
Private 246 22,807 66 4,767
Total 1,448 58,819 507 28,850
Degree colleges in this District offer courses in arts, sciences and commerce streams. For the year
2011-12, the total students enrolled in these colleges were 4,584. In terms of streams, there is higher
proportion of students in arts, followed by commerce and science. Data published on the Directorate
of Higher education (DHE) website shows that maximum enrolment is in Hindi literature followed by
political science and geography.
Table 111: Student Strength of Government colleges in Pithoragarh for the year 2011-12
College name Status Year of
establishment
Boys
Enrolled
Girls
Enrolled Total
Government post graduated
college, Pithoragarh
Post
graduate 1963 2,938 4,021 6,959
Government Inter collage/post
graduated colleges, Berinag
Post
graduate 1975 592 951 1,543
Government Inter collage
Narayan nagar. Graduate 1983 257 379 636
Government Inter collage,
Baluwakot Dharchula Graduate 1997 166 296 462
Literacy Rates for Pithoragarh District
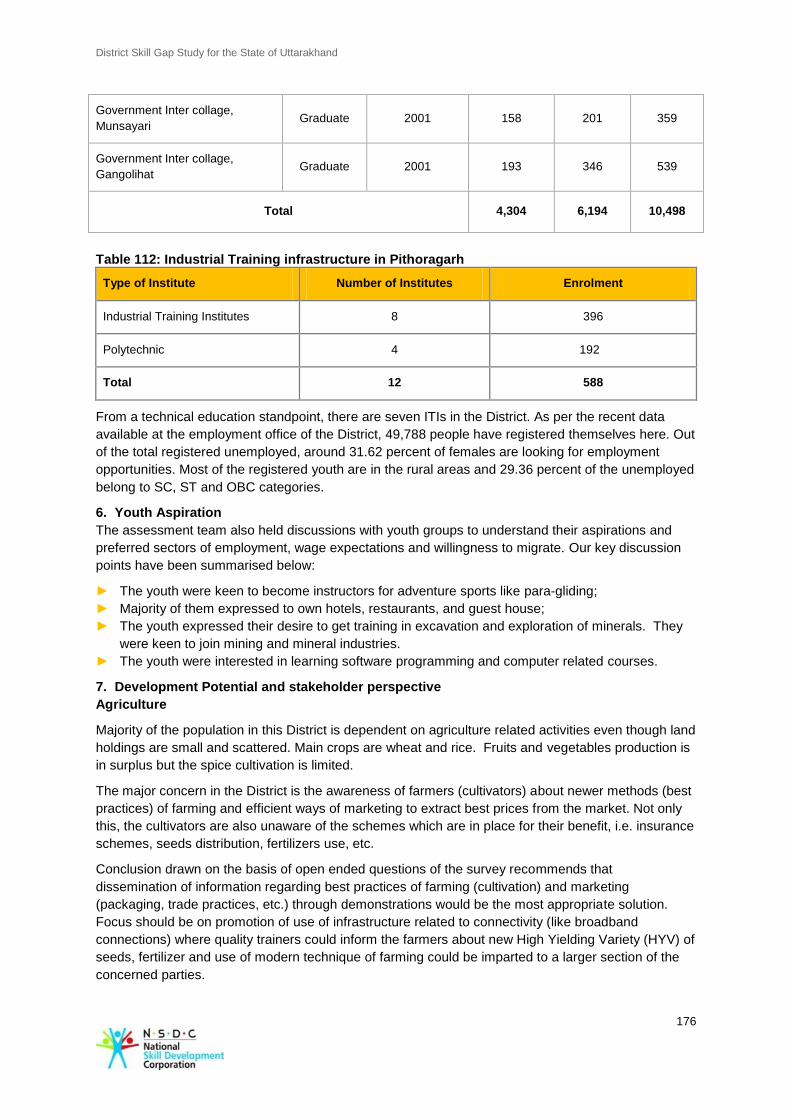
District Skill Gap Study for the State of Uttarakhand
176
Table 112: Industrial Training infrastructure in Pithoragarh
Type of Institute Number of Institutes Enrolment
Industrial Training Institutes 8 396
Polytechnic 4 192
Total 12 588
From a technical education standpoint, there are seven ITIs in the District. As per the recent data
available at the employment office of the District, 49,788 people have registered themselves here. Out
of the total registered unemployed, around 31.62 percent of females are looking for employment
opportunities. Most of the registered youth are in the rural areas and 29.36 percent of the unemployed
belong to SC, ST and OBC categories.
6. Youth Aspiration
The assessment team also held discussions with youth groups to understand their aspirations and
preferred sectors of employment, wage expectations and willingness to migrate. Our key discussion
points have been summarised below:
► The youth were keen to become instructors for adventure sports like para-gliding;
► Majority of them expressed to own hotels, restaurants, and guest house;
► The youth expressed their desire to get training in excavation and exploration of minerals. They
were keen to join mining and mineral industries.
► The youth were interested in learning software programming and computer related courses.
7. Development Potential and stakeholder perspective
Agriculture
Majority of the population in this District is dependent on agriculture related activities even though land
holdings are small and scattered. Main crops are wheat and rice. Fruits and vegetables production is
in surplus but the spice cultivation is limited.
The major concern in the District is the awareness of farmers (cultivators) about newer methods (best
practices) of farming and efficient ways of marketing to extract best prices from the market. Not only
this, the cultivators are also unaware of the schemes which are in place for their benefit, i.e. insurance
schemes, seeds distribution, fertilizers use, etc.
Conclusion drawn on the basis of open ended questions of the survey recommends that
dissemination of information regarding best practices of farming (cultivation) and marketing
(packaging, trade practices, etc.) through demonstrations would be the most appropriate solution.
Focus should be on promotion of use of infrastructure related to connectivity (like broadband
connections) where quality trainers could inform the farmers about new High Yielding Variety (HYV) of
seeds, fertilizer and use of modern technique of farming could be imparted to a larger section of the
concerned parties.
Government Inter collage,
Munsayari Graduate 2001 158 201 359
Government Inter collage,
Gangolihat Graduate 2001 193 346 539
Total 4,304 6,194 10,498
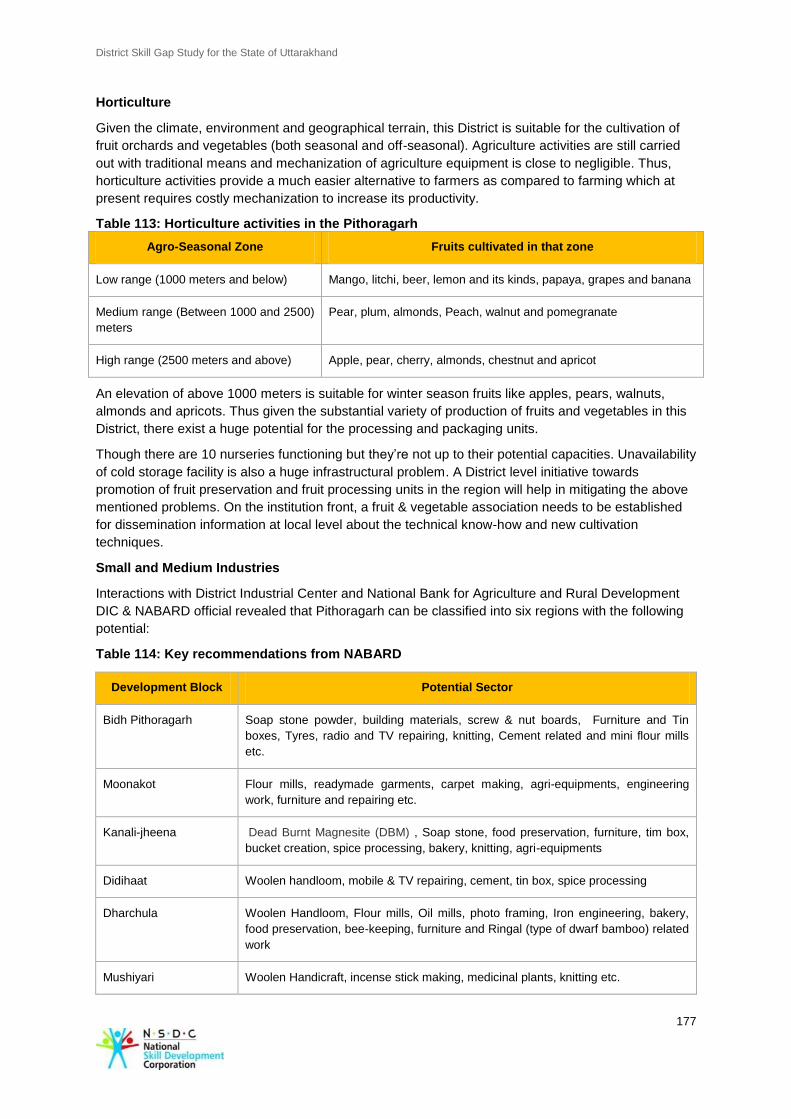
District Skill Gap Study for the State of Uttarakhand
177
Horticulture
Given the climate, environment and geographical terrain, this District is suitable for the cultivation of
fruit orchards and vegetables (both seasonal and off-seasonal). Agriculture activities are still carried
out with traditional means and mechanization of agriculture equipment is close to negligible. Thus,
horticulture activities provide a much easier alternative to farmers as compared to farming which at
present requires costly mechanization to increase its productivity.
Table 113: Horticulture activities in the Pithoragarh
Agro-Seasonal Zone Fruits cultivated in that zone
Low range (1000 meters and below) Mango, litchi, beer, lemon and its kinds, papaya, grapes and banana
Medium range (Between 1000 and 2500)
meters
Pear, plum, almonds, Peach, walnut and pomegranate
High range (2500 meters and above) Apple, pear, cherry, almonds, chestnut and apricot
An elevation of above 1000 meters is suitable for winter season fruits like apples, pears, walnuts,
almonds and apricots. Thus given the substantial variety of production of fruits and vegetables in this
District, there exist a huge potential for the processing and packaging units.
Though there are 10 nurseries functioning but they’re not up to their potential capacities. Unavailability
of cold storage facility is also a huge infrastructural problem. A District level initiative towards
promotion of fruit preservation and fruit processing units in the region will help in mitigating the above
mentioned problems. On the institution front, a fruit & vegetable association needs to be established
for dissemination information at local level about the technical know-how and new cultivation
techniques.
Small and Medium Industries
Interactions with District Industrial Center and National Bank for Agriculture and Rural Development
DIC & NABARD official revealed that Pithoragarh can be classified into six regions with the following
potential:
Table 114: Key recommendations from NABARD
Development Block Potential Sector
Bidh Pithoragarh Soap stone powder, building materials, screw & nut boards, Furniture and Tin
boxes, Tyres, radio and TV repairing, knitting, Cement related and mini flour mills
etc.
Moonakot Flour mills, readymade garments, carpet making, agri-equipments, engineering
work, furniture and repairing etc.
Kanali-jheena Dead Burnt Magnesite (DBM) , Soap stone, food preservation, furniture, tim box,
bucket creation, spice processing, bakery, knitting, agri-equipments
Didihaat Woolen handloom, mobile & TV repairing, cement, tin box, spice processing
Dharchula Woolen Handloom, Flour mills, Oil mills, photo framing, Iron engineering, bakery,
food preservation, bee-keeping, furniture and Ringal (type of dwarf bamboo) related
work
Mushiyari Woolen Handicraft, incense stick making, medicinal plants, knitting etc.
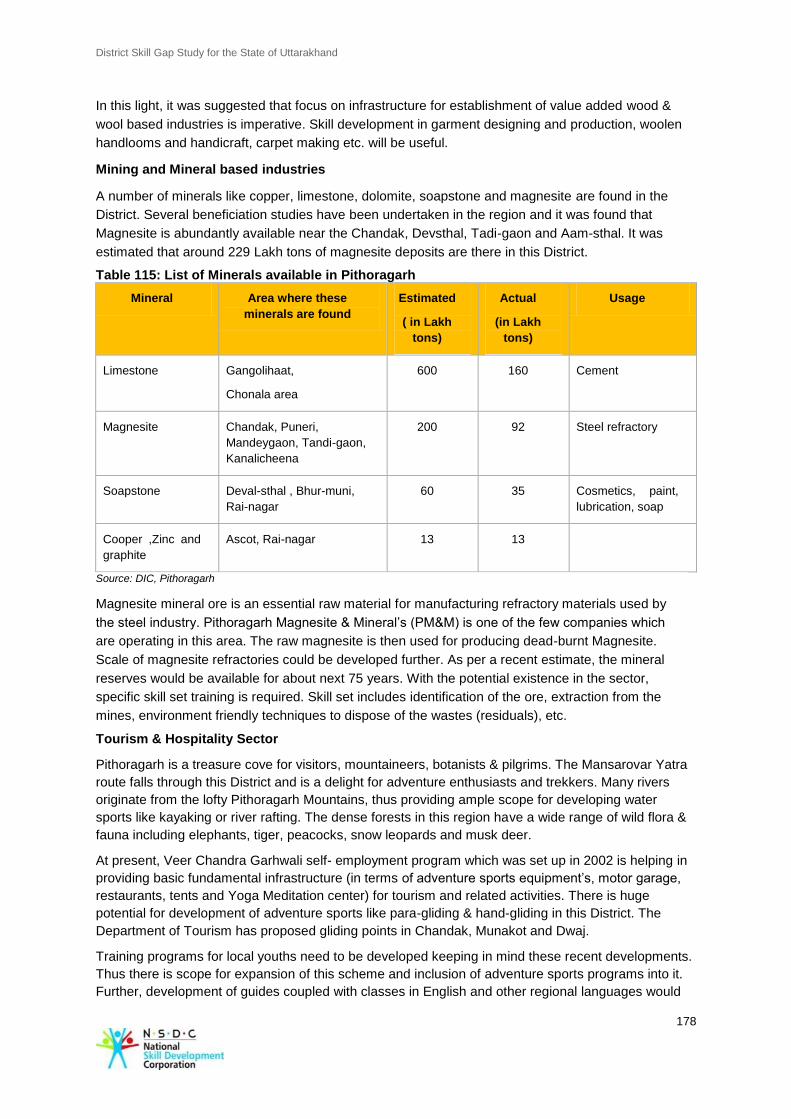
District Skill Gap Study for the State of Uttarakhand
178
In this light, it was suggested that focus on infrastructure for establishment of value added wood &
wool based industries is imperative. Skill development in garment designing and production, woolen
handlooms and handicraft, carpet making etc. will be useful.
Mining and Mineral based industries
A number of minerals like copper, limestone, dolomite, soapstone and magnesite are found in the
District. Several beneficiation studies have been undertaken in the region and it was found that
Magnesite is abundantly available near the Chandak, Devsthal, Tadi-gaon and Aam-sthal. It was
estimated that around 229 Lakh tons of magnesite deposits are there in this District.
Table 115: List of Minerals available in Pithoragarh
Mineral Area where these
minerals are found
Estimated
( in Lakh
tons)
Actual
(in Lakh
tons)
Usage
Limestone Gangolihaat,
Chonala area
600 160 Cement
Magnesite Chandak, Puneri,
Mandeygaon, Tandi-gaon,
Kanalicheena
200 92 Steel refractory
Soapstone Deval-sthal , Bhur-muni,
Rai-nagar
60 35 Cosmetics, paint,
lubrication, soap
Cooper ,Zinc and
graphite
Ascot, Rai-nagar 13 13
Source: DIC, Pithoragarh
Magnesite mineral ore is an essential raw material for manufacturing refractory materials used by
the steel industry. Pithoragarh Magnesite & Mineral’s (PM&M) is one of the few companies which
are operating in this area. The raw magnesite is then used for producing dead-burnt Magnesite.
Scale of magnesite refractories could be developed further. As per a recent estimate, the mineral
reserves would be available for about next 75 years. With the potential existence in the sector,
specific skill set training is required. Skill set includes identification of the ore, extraction from the
mines, environment friendly techniques to dispose of the wastes (residuals), etc.
Tourism & Hospitality Sector
Pithoragarh is a treasure cove for visitors, mountaineers, botanists & pilgrims. The Mansarovar Yatra
route falls through this District and is a delight for adventure enthusiasts and trekkers. Many rivers
originate from the lofty Pithoragarh Mountains, thus providing ample scope for developing water
sports like kayaking or river rafting. The dense forests in this region have a wide range of wild flora &
fauna including elephants, tiger, peacocks, snow leopards and musk deer.
At present, Veer Chandra Garhwali self- employment program which was set up in 2002 is helping in
providing basic fundamental infrastructure (in terms of adventure sports equipment’s, motor garage,
restaurants, tents and Yoga Meditation center) for tourism and related activities. There is huge
potential for development of adventure sports like para-gliding & hand-gliding in this District. The
Department of Tourism has proposed gliding points in Chandak, Munakot and Dwaj.
Training programs for local youths need to be developed keeping in mind these recent developments.
Thus there is scope for expansion of this scheme and inclusion of adventure sports programs into it.
Further, development of guides coupled with classes in English and other regional languages would
District Skill Gap Study for the State of Uttarakhand
179
help the youth in communicating in tourists’ vernacular. Training programs need to be diversified
further to include hospitality related training programs. Online training programs would be beneficial
but given the current infrastructure it is not feasible.
Other services
Interactions with NABARD and employment exchange officials revealed that since majority of the
youth is unskilled, the training programs generally focus on providing basic secretarial courses like
English speaking courses, computer, and Tally software and personality development classes. Other
than that, a book binding workshop was also conducted for a group of 25 people in the 2011-12.
Based on our interaction with various stakeholders, some key areas which provide skill development
opportunity have been provided in the table below:
Table 116: Sector and skill requirement
Sector Skill Requirements
Primary Production of ginger in the District is one of the highest among the neighboring
Districts within Uttarakhand; scope of scaling up the production exists. Even
horticulture is a promising sector thus there is a scope for encouraging
trainings on food processing, packaging and marketing.
Secondary Focus on infrastructure for establishment of value added wood & wool based
industries. Also, given the mineral repository in the District skills will be
required for, identification of the ore, extraction from the mines, environment
friendly techniques to dispose of the wastes (residuals), etc.
Tertiary Mansarovar yatra path falls in this District. There is a scope for the hotel
industry and adventure sports and training of guides with English language
proficiency.
8. Recommendations
Government ► Encourage farmers to develop orchards and promote fruit cultivation.
Extend support on skilling and training activities on farming fruit farming
practices, post-harvest fruit preservation technique, and packaging.
NSDC ► Support training provider in training and propagate best practices of
farming, cultivation, and marketing of agriculture produce.
Industry ► Based on factor endowment and mines reserves for the next 75 years, the
mining and minerals industry can take initiatives to help train youth on
identification of ores, extraction from the mines, and waste disposal.
Vocational Training
Providers
► VTC in the District can introduce short term training programmes on basic
levels of adventure sports, hotel management/ tourism related skills
including culinary, housekeeping, waiter, bartending, trekking guides etc.;
► It is essential to incorporate a component of soft skill training like
communication skills, personality development etc. in all courses;
► VTC can provide the local farmer families, training on the latest techniques
for growing fruits, flowers and vegetables and managing nurseries and
orchard's. Additionally short term courses on the use of mechanization in
agriculture are also required to help improve the efficiency of the farmers.
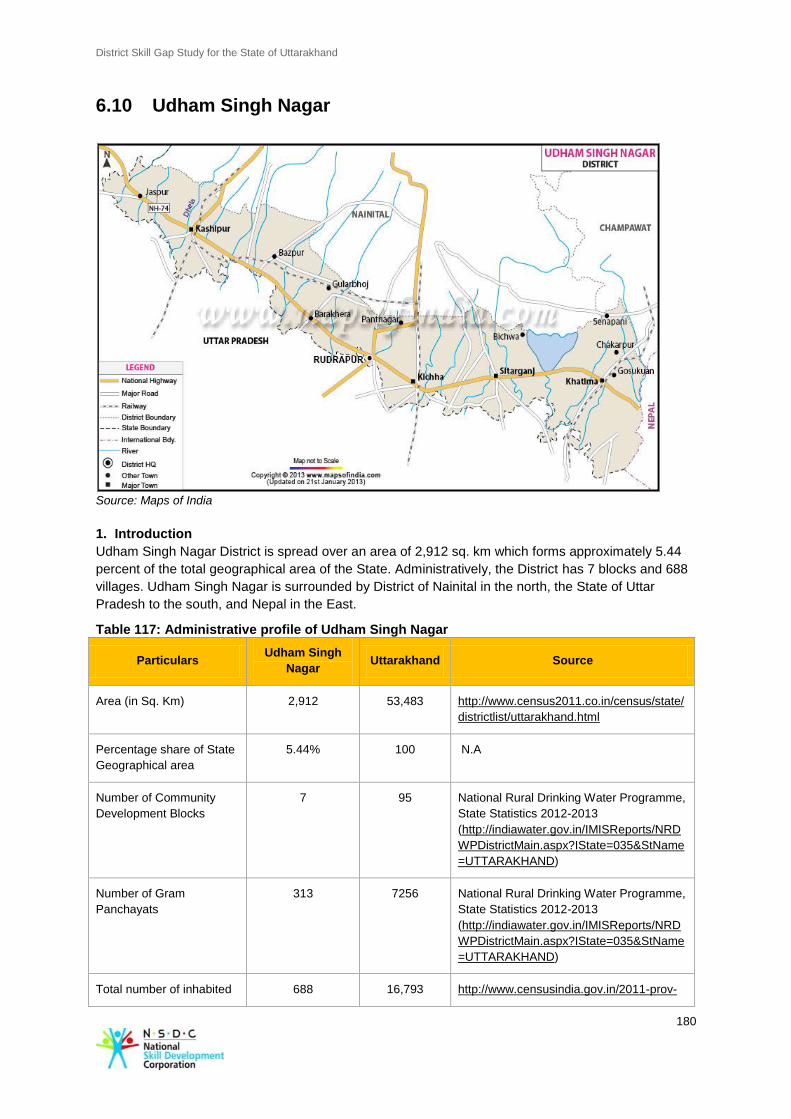
District Skill Gap Study for the State of Uttarakhand
180
6.10 Udham Singh Nagar
Source: Maps of India
1. Introduction
Udham Singh Nagar District is spread over an area of 2,912 sq. km which forms approximately 5.44
percent of the total geographical area of the State. Administratively, the District has 7 blocks and 688
villages. Udham Singh Nagar is surrounded by District of Nainital in the north, the State of Uttar
Pradesh to the south, and Nepal in the East.
Table 117: Administrative profile of Udham Singh Nagar
Particulars Udham Singh
Nagar Uttarakhand Source
Area (in Sq. Km) 2,912 53,483 http://www.census2011.co.in/census/state/
districtlist/uttarakhand.html
Percentage share of State
Geographical area
5.44% 100 N.A
Number of Community
Development Blocks
7 95 National Rural Drinking Water Programme,
State Statistics 2012-2013
(http://indiawater.gov.in/IMISReports/NRD
WPDistrictMain.aspx?IState=035&StName
=UTTARAKHAND)
Number of Gram
Panchayats
313 7256 National Rural Drinking Water Programme,
State Statistics 2012-2013
(http://indiawater.gov.in/IMISReports/NRD
WPDistrictMain.aspx?IState=035&StName
=UTTARAKHAND)
Total number of inhabited 688 16,793 http://www.censusindia.gov.in/2011-prov-
District Skill Gap Study for the State of Uttarakhand
181
villages results/paper2/data_files/uttrakhand/8-
adminunit-60-61.pdf
2. Demography
As per Census 2011 (provisional data), total population of Udham Singh Nagar is 16.48 Lakh,
constituting 16.29 percent of the State’s total population. The urban population is 35.58 percent of the
total population making Udham Singh Nagar largely an urban area. It ranks 8thth (among total of 13
Districts in the State) in terms of sex ratio (919 females per 1,000 males). With population density of
648 people per sq. km, Udham Singh Nagar is the 2nd
most densely populated District in the State, yet
below the State’s average of 189 persons per sq. km.
Table 118: Socio economic indicators for Udham Singh Nagar
Population Udham Singh Nagar Uttarakhand Source
Total population (in Lakh) 16.48 101.17 Census 2011(provisional data)
Total population (Male) (in Lakh) 8.58 51.54 Census 2011 (provisional data)
Total population (Female) (in
Lakh) 7.89 49.63 Census 2011 (provisional data)
District share in State's
population 16.29% N.A N.A
Density of population
(population/1000) 648 189 Census 2011 (provisional data)
Decadal growth of population
(2001-2011) 33.4% 19.17% Census 2011 (provisional data)
Percentage of urban population 35.58% 30.55% Census 2011 (provisional data)
Scheduled Caste population
percentage of State population 13.2% 17.90% Census 2001
Schedule Tribe population
percentage of State population 43.02% 3% Census 2001
Sex ratio 919 963 Census 2011 (provisional data)
3. Economy
As per the data collected by the Directorate of Economics & Statistics (2008-09), Udham Singh Nagar
had a Gross District Domestic Product 66
of Rs. 539,839 Lakh which amounts to 13.44 percent of the
total State GDDP. The per capita income of Udham Singh Nagar for 2008-09 was valued at Rs.
33,815, which is lower than the State per capita income of Rs. 36,52067
.
66
Statistical Diary, Government of Uttarakhand 67
http://planningcommission.nic.in/plans/stateplan/present/Uttarakhand.pdf
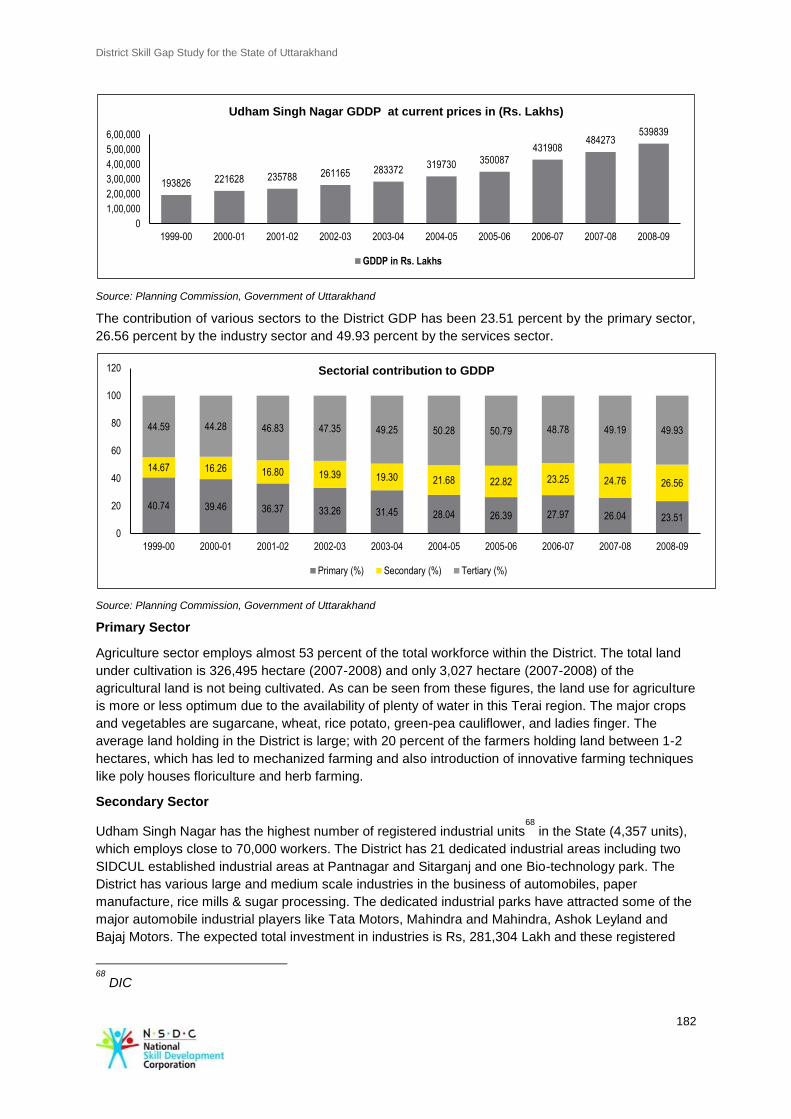
District Skill Gap Study for the State of Uttarakhand
182
Source: Planning Commission, Government of Uttarakhand
The contribution of various sectors to the District GDP has been 23.51 percent by the primary sector,
26.56 percent by the industry sector and 49.93 percent by the services sector.
Source: Planning Commission, Government of Uttarakhand
Primary Sector
Agriculture sector employs almost 53 percent of the total workforce within the District. The total land
under cultivation is 326,495 hectare (2007-2008) and only 3,027 hectare (2007-2008) of the
agricultural land is not being cultivated. As can be seen from these figures, the land use for agriculture
is more or less optimum due to the availability of plenty of water in this Terai region. The major crops
and vegetables are sugarcane, wheat, rice potato, green-pea cauliflower, and ladies finger. The
average land holding in the District is large; with 20 percent of the farmers holding land between 1-2
hectares, which has led to mechanized farming and also introduction of innovative farming techniques
like poly houses floriculture and herb farming.
Secondary Sector
Udham Singh Nagar has the highest number of registered industrial units68
in the State (4,357 units),
which employs close to 70,000 workers. The District has 21 dedicated industrial areas including two
SIDCUL established industrial areas at Pantnagar and Sitarganj and one Bio-technology park. The
District has various large and medium scale industries in the business of automobiles, paper
manufacture, rice mills & sugar processing. The dedicated industrial parks have attracted some of the
major automobile industrial players like Tata Motors, Mahindra and Mahindra, Ashok Leyland and
Bajaj Motors. The expected total investment in industries is Rs, 281,304 Lakh and these registered
68
DIC
193826 221628 235788 261165 283372 319730 350087
431908 484273
539839
0
1,00,000
2,00,000
3,00,000
4,00,000
5,00,000
6,00,000
1999-00 2000-01 2001-02 2002-03 2003-04 2004-05 2005-06 2006-07 2007-08 2008-09
Udham Singh Nagar GDDP at current prices in (Rs. Lakhs)
GDDP in Rs. Lakhs
40.74 39.46 36.37 33.26 31.45 28.04 26.39 27.97 26.04 23.51
14.67 16.26 16.80 19.39 19.30 21.68 22.82 23.25 24.76 26.56
44.59 44.28 46.83 47.35 49.25 50.28 50.79 48.78 49.19 49.93
0
20
40
60
80
100
120
1999-00 2000-01 2001-02 2002-03 2003-04 2004-05 2005-06 2006-07 2007-08 2008-09
Sectorial contribution to GDDP
Primary (%) Secondary (%) Tertiary (%)
District Skill Gap Study for the State of Uttarakhand
183
units earn a combined profit of 13,000 crores.
Tertiary Sector
Uddhan Singh Nagar is primarily an industrial District. Places of attraction include Nanakmatta Sahib
Gurdwara (a great pilgrimage center for the Sikh religion); Ataria Temple (a renowned shrine of the
Goddess Atariya); Drona Sagar Girtal and Drona Sagar, well known spots associated with the story of
Pandevas; Giri Sarovar Lake; and the renowned Pantnagar Fovind Ballabh Pant University of
Agriculture & technology
4. Workforce Distribution
The total population of Uddham Singh Nagar in 2012 was 16.96 Lakhs which is expected to increase
to 19.59 Lakhs by 2017 and 22.63 Lakhs by 2022. As per our research methodology, the incremental
manpower supply will be about 4.67 Lakhs by 2022.
Table 119: Estimated workforce distribution in Uddham Singh Nagar
Year 2012 2017 2022
Total population 16,96,567 19,59,551 22,63,300
Working age population 10,50,887 12,89,166 15,81,472
Labour force 6,32,030 8,27,070 11,00,017
Work force 6,20,575 8,18,701 10,80,080
Incremental Manpower supply
1,95,040 4,67,987
As per the table 120 below, incremental demand for human resource by 2022 for top five sector would
be in Manufacturing (1.27 Lakhs), Tourism, travel, hospitality & trade (0.29 Lakhs), Food Processing
(0.28 Lakhs), Transportation, logistics, warehousing & packaging (0.23 Lakhs) and Education & Skill
Development (0.22 Lakhs). The total demand for semi-skilled and skilled manpower by 2017 would
be 0.30 Lakhs, and 0.35 Lakhs. Similar demand for semi-skilled and skilled manpower by 2022 would
be 0.052 Lakhs, and 0.53 Lakhs.
Table 120: Incremental Human Resource Demand in Udham Singh Nagar
Sector Total
Incremental demand: 2012-
2017
Incremental demand 2017-
2022
Minimally
skilled
Semi-
skilled Skilled
Minimally
skilled
Semi-
skilled Skilled
Agriculture 370 129 37 18 130 37 19
Food processing 28,481 8,447 - 2,112 14,338 - 3,585
Metal and Mining 22 6 2 3 6 2 3
Manufacturing 127,432 14,900 19,662 11,521 26,303 34,709 20,337
Electricity, Gas and Water 1,248 376 169 - 485 218 -
Building, Construction & 16,099 5,691 1,124 211 7,349 1,452 272
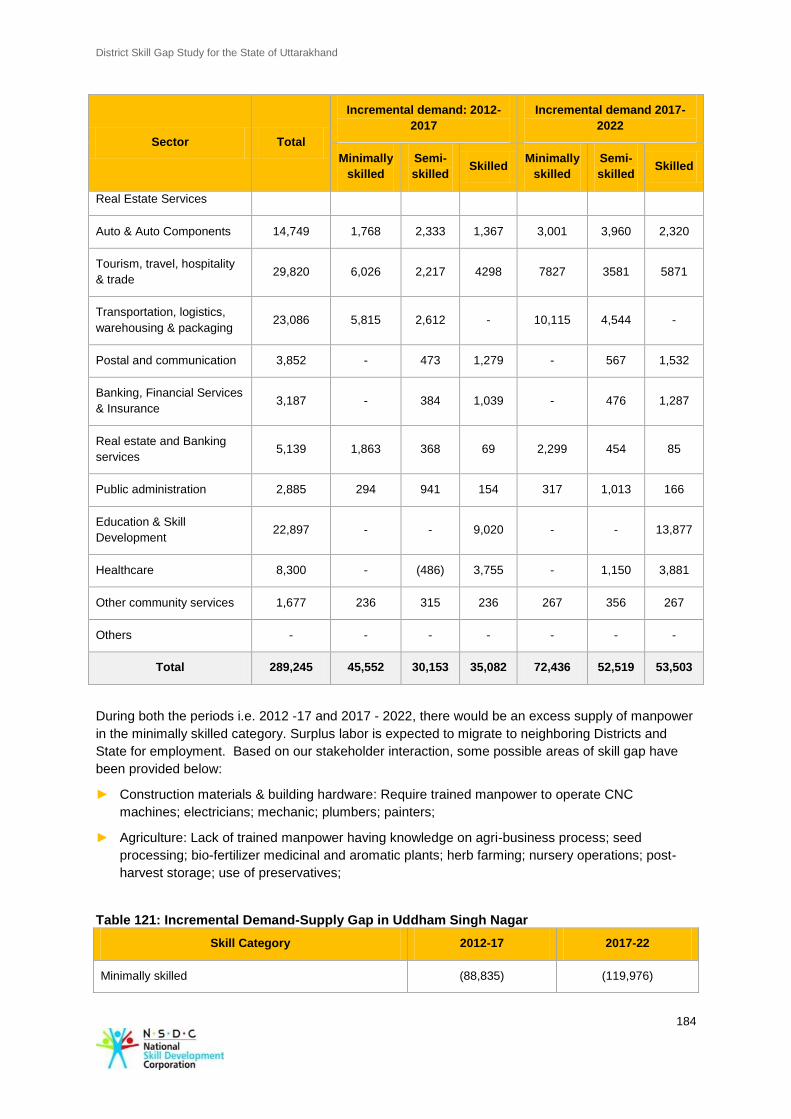
District Skill Gap Study for the State of Uttarakhand
184
Sector Total
Incremental demand: 2012-
2017
Incremental demand 2017-
2022
Minimally
skilled
Semi-
skilled Skilled
Minimally
skilled
Semi-
skilled Skilled
Real Estate Services
Auto & Auto Components 14,749 1,768 2,333 1,367 3,001 3,960 2,320
Tourism, travel, hospitality
& trade 29,820 6,026 2,217 4298 7827 3581 5871
Transportation, logistics,
warehousing & packaging 23,086 5,815 2,612 - 10,115 4,544 -
Postal and communication 3,852 - 473 1,279 - 567 1,532
Banking, Financial Services
& Insurance 3,187 - 384 1,039 - 476 1,287
Real estate and Banking
services 5,139 1,863 368 69 2,299 454 85
Public administration 2,885 294 941 154 317 1,013 166
Education & Skill
Development 22,897 - - 9,020 - - 13,877
Healthcare 8,300 - (486) 3,755 - 1,150 3,881
Other community services 1,677 236 315 236 267 356 267
Others - - - - - - -
Total 289,245 45,552 30,153 35,082 72,436 52,519 53,503
During both the periods i.e. 2012 -17 and 2017 - 2022, there would be an excess supply of manpower
in the minimally skilled category. Surplus labor is expected to migrate to neighboring Districts and
State for employment. Based on our stakeholder interaction, some possible areas of skill gap have
been provided below:
► Construction materials & building hardware: Require trained manpower to operate CNC
machines; electricians; mechanic; plumbers; painters;
► Agriculture: Lack of trained manpower having knowledge on agri-business process; seed
processing; bio-fertilizer medicinal and aromatic plants; herb farming; nursery operations; post-
harvest storage; use of preservatives;
Table 121: Incremental Demand-Supply Gap in Uddham Singh Nagar
Skill Category 2012-17 2017-22
Minimally skilled (88,835) (119,976)
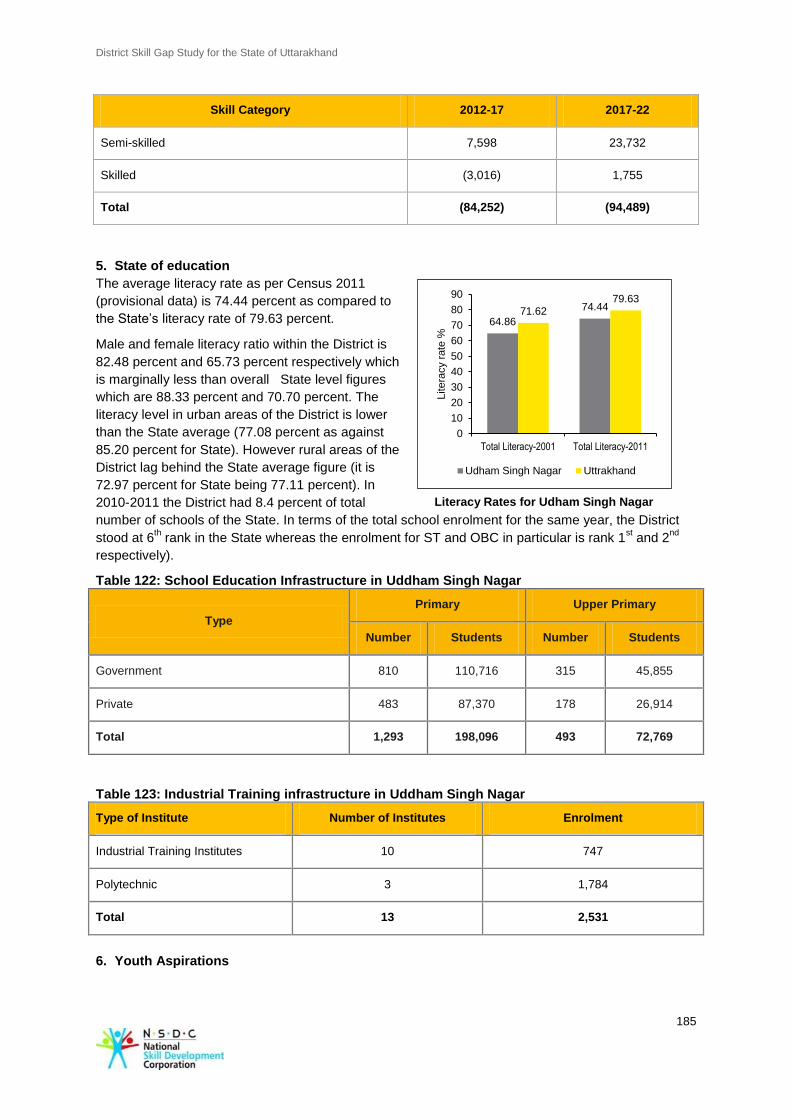
District Skill Gap Study for the State of Uttarakhand
185
Skill Category 2012-17 2017-22
Semi-skilled 7,598 23,732
Skilled (3,016) 1,755
Total (84,252) (94,489)
5. State of education
The average literacy rate as per Census 2011
(provisional data) is 74.44 percent as compared to
the State’s literacy rate of 79.63 percent.
Male and female literacy ratio within the District is
82.48 percent and 65.73 percent respectively which
is marginally less than overall State level figures
which are 88.33 percent and 70.70 percent. The
literacy level in urban areas of the District is lower
than the State average (77.08 percent as against
85.20 percent for State). However rural areas of the
District lag behind the State average figure (it is
72.97 percent for State being 77.11 percent). In
2010-2011 the District had 8.4 percent of total
number of schools of the State. In terms of the total school enrolment for the same year, the District
stood at 6th rank in the State whereas the enrolment for ST and OBC in particular is rank 1
st and 2
nd
respectively).
Table 122: School Education Infrastructure in Uddham Singh Nagar
Type
Primary Upper Primary
Number Students Number Students
Government 810 110,716 315 45,855
Private 483 87,370 178 26,914
Total 1,293 198,096 493 72,769
Table 123: Industrial Training infrastructure in Uddham Singh Nagar
Type of Institute Number of Institutes Enrolment
Industrial Training Institutes 10 747
Polytechnic 3 1,784
Total 13 2,531
6. Youth Aspirations
64.86
74.44 71.62 79.63
0
10
20
30
40
50
60
70
80
90
Total Literacy-2001 Total Literacy-2011Litera
cy r
ate
%
Udham Singh Nagar Uttrakhand
Literacy Rates for Udham Singh Nagar
District
District Skill Gap Study for the State of Uttarakhand
186
The assessment team also held discussions with youth groups to understand their aspirations and
preferred sectors of employment, wage expectations and willingness to migrate. Our key discussion
points have been summarised below:
► Majority of the youth expressed their desire to get employed in industries located in SIDCUL.
► The youth were interested to do course on automobile and auto component as it is easy to
find job in the Industrial area.
► The youth showed their willingness to do course in IT and IT enabled services.
► Some of them were also interested in acquiring diploma in biotechnology and food
processing.
7. Development Potential and stakeholder perspective
Industries
During our interaction with the former President of the Kumaun Garhwal Chambers of Commerce and
Industries (‘KGCCI’) we were informed that all the industries in the District were growing at an
approximate rate of 10 – 15 percent per annum and there is need to support this growth with more
trained manpower resources. Similar challenges regarding shortage of skilled manpower to support
industrial growth were also highlighted by the General Manager, DIC; Regional Manager, SIDCUL
and industry representatives met during our District visit. The industry representatives added that
there is high demand for painters, electricians, and operators for Computer Numerical Control (‘CNC’)
machines in these industries.
Industry representatives shared that there is a need to upgrade existing courses, course material,
curriculum and structure of courses, with more focus on practical experience than theoretical
knowledge. Industry representatives shared that most members of their chambers feel that the current
work force they recruit from ITI’s and other educational institutes are “trained” but not “skilled” to
perform on the job. They said that in spite of their formal training in the institutes, industry has to
spend considerable time and effort for all new recruits. The industry representatives also felt that there
is a need to ensure that teacher training in all these institutes is strengthened, which will in turn lead to
better quality of workforce.
During our interaction with the ITI faculty members we were informed that fitter courses have the
highest demand, since it is among the most employable trades in the industry. While electrician
courses have just been introduced, traditional courses like radio and television repair have been
discontinued. The ITI faculty members also suggested that CNC machines courses should be
introduced since most industries now function on these machines. During our focused group
discussion with ITI students they shared that majority of the students from the previous batch who
were placed in the industry, were not given the job which were promised to them and in most cases
they were given other smaller jobs since they very limited practical experience, as a result students
were of the opinion that ITI should focus more on providing practical training to have a better
appreciation of course.
The Regional Manager, SIDCUL shared that most industries complain about the absence of an
industrial tool rooms in the District. The Government has proposed setting up of industrial training
rooms, once operational these will provide large scale employment at all levels from with
management and technical background.
Agriculture and Allied Activities
As 67 percent of the population in the District is dependent on the agriculture sector, it is the primary
source of livelihood. There are currently 4 Agri Export Zones (AEZ) in the District for basmati rice,
litchi, flowers and medicinal plants. Upon discussion with the Chief Agriculture Officer it was noted
that that the agri allied sector has a strong presence in the District with close to 200 seed processing
plants, two bio-fertilizer plants, large number of rice, sugar and flour mills and one micro nutrient
District Skill Gap Study for the State of Uttarakhand
187
production plant, which provides ample employment opportunities within the District. Currently only
pea processing is undertaken in the District. The Chief Agriculture Officer was of the opinion that there
is scope for setting up fruit processing and vegetable processing units in the District. Given the major
scope for food and vegetable processing, there exists a need for training on food processor induction
skill set, machine operator skills and food production supervisor skills.
Herb farming and floriculture is becoming popular in the District with an estimated 21 hectares of land
currently being cultivated. Medicinal and aromatic plants like mint, lemon grass, stevia, giranium and
basil have been cultivated for close to a decade thus creating scope for training programmes on bulb
growing, nursery operation, chemical protection of plants, fruits and herbs, post-harvest storage and
handling and use of preservatives.
Tertiary Sector
Although the District is an Industrial belt, there is potential for skilled manpower in transportation,
logistics sector, IT related services, tool rooms, men power supplier, air conditioning, plumbers,
electricians, machine operators, restaurants, and hotel sector.
Based on our interaction with various stakeholders, some key areas which provide skill development
opportunity have been provided in the table below:
Table 124: Sector and skill requirement
Sector Skill Requirements
Primary Horticulture, Floriculture, Herb farming, food processor induction skill set,
machine operator skills and food production supervisor skills, farm equipment
mechanic skills, poly house management, bulb growing, nursery operation,
chemical protection of plants, fruits and herbs, post-harvest storage and
handling and use of preservatives
Secondary Painters, Fitters, CNC machine operators, Mechanics, Electricians
Tertiary -
8. Recommendations
Government ► Government can facilitate in setting up of an industrial tool room that can
provide technical and management support to industries.
► Provide for the up gradation of the courses, techniques and machinery in
the ITI's.
► Strengthen industry ties to encourage PPP’s in skill development for
different trades such as Automobile, and Electrical, and Mechanical.
NSDC ► Support more ITI’s and other training centers given that there is a huge
gap in supply of skilled manpower in the District.
► Promote the skilling of local population on common trades such as
electrician, plumber, fitter, motor mechanic etc. since the District is an
Industrial hub.
► Promotion of institutes that provide technical training on computers, both
hardware and software.
Industry ► Industries can collaborate with the exiting training providers to develop
course structure and curriculum.
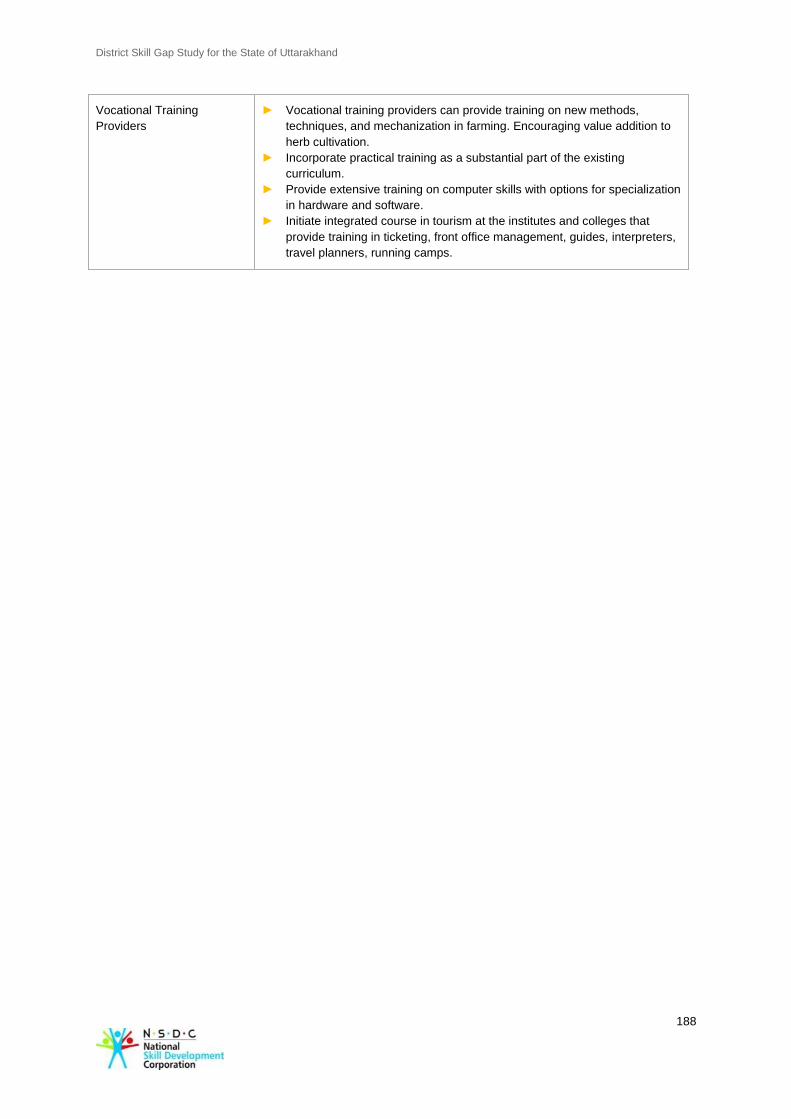
District Skill Gap Study for the State of Uttarakhand
188
Vocational Training
Providers
► Vocational training providers can provide training on new methods,
techniques, and mechanization in farming. Encouraging value addition to
herb cultivation.
► Incorporate practical training as a substantial part of the existing
curriculum.
► Provide extensive training on computer skills with options for specialization
in hardware and software.
► Initiate integrated course in tourism at the institutes and colleges that
provide training in ticketing, front office management, guides, interpreters,
travel planners, running camps.
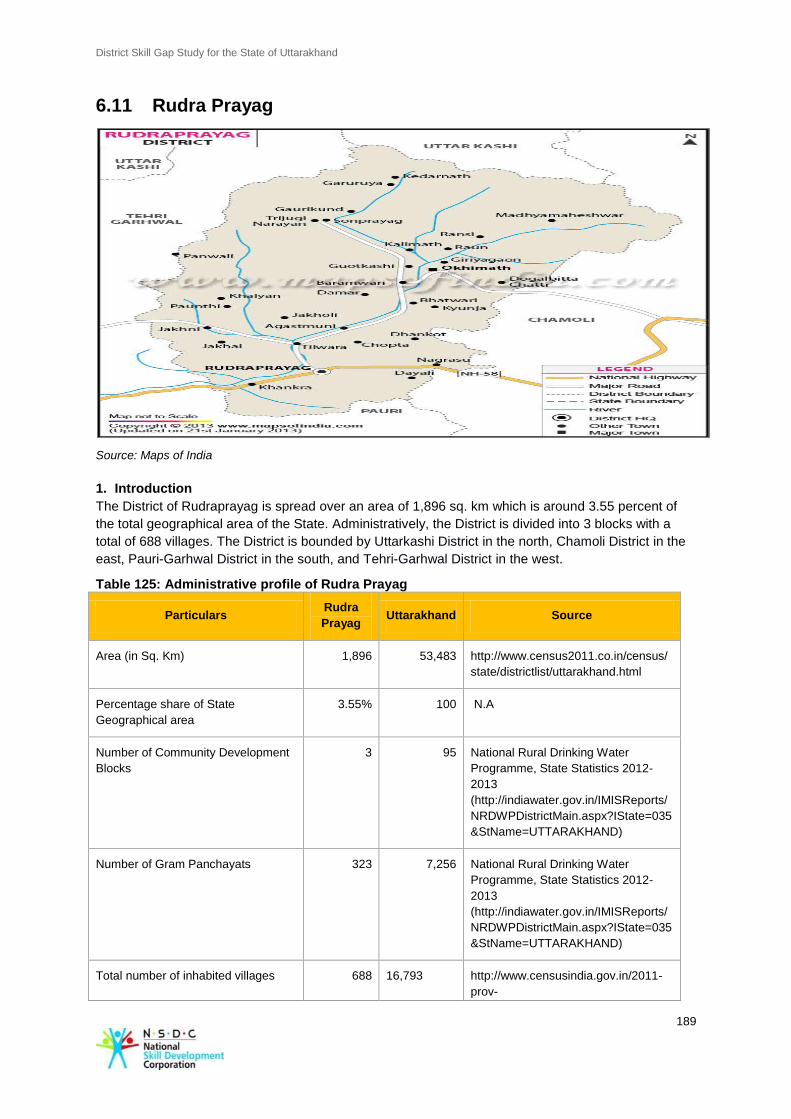
District Skill Gap Study for the State of Uttarakhand
189
6.11 Rudra Prayag
Source: Maps of India
1. Introduction
The District of Rudraprayag is spread over an area of 1,896 sq. km which is around 3.55 percent of
the total geographical area of the State. Administratively, the District is divided into 3 blocks with a
total of 688 villages. The District is bounded by Uttarkashi District in the north, Chamoli District in the
east, Pauri-Garhwal District in the south, and Tehri-Garhwal District in the west.
Table 125: Administrative profile of Rudra Prayag
Particulars Rudra
Prayag Uttarakhand Source
Area (in Sq. Km) 1,896 53,483 http://www.census2011.co.in/census/
state/districtlist/uttarakhand.html
Percentage share of State
Geographical area
3.55% 100 N.A
Number of Community Development
Blocks
3 95 National Rural Drinking Water
Programme, State Statistics 2012-
2013
(http://indiawater.gov.in/IMISReports/
NRDWPDistrictMain.aspx?IState=035
&StName=UTTARAKHAND)
Number of Gram Panchayats 323 7,256 National Rural Drinking Water
Programme, State Statistics 2012-
2013
(http://indiawater.gov.in/IMISReports/
NRDWPDistrictMain.aspx?IState=035
&StName=UTTARAKHAND)
Total number of inhabited villages 688 16,793 http://www.censusindia.gov.in/2011-
prov-
District Skill Gap Study for the State of Uttarakhand
190
Particulars Rudra
Prayag Uttarakhand Source
results/paper2/data_files/uttrakhand/8
-adminunit-60-61.pdf
2. Demography
As per Census 2011 (provisional data), Rudraprayag District has a population of 2.37 Lakh, which
constitutes roughly 2.34 percent of the total population of the State. It is the one of the least populated
Districts in Uttarakhand with only 4.19 percent of District’s population inhabits the urban area.
As per Census 2011 (provisional data), Rudraprayag shows a healthy sex ratio (1,120 females per
1,000 males), which is much higher than the State’s sex ratio of 963 females per 1,000 males. The
District has had a reasonable decadal growth rate of 4.14 percent in population in Census 2011
(provisional data) suggests a population density of 119 sq. km making the District the eighth most
densely populated District of Uttarakhand.
Table 126: Socio economic indicators for Rudraprayag
Population Rudraprayag Uttarakhand Source
Total population (in Lakh) 2.37 101.17 Census 2011 (provisional data)
Total population (Male) (in Lakh) 1.11 51.54 Census 2011 (provisional data)
Total population (Female) (in Lakh) 1.25 49.63 Census 2011 (provisional data)
District share in State's population 2.34% N.A N.A
Density of population 119 189 Census 2011 (provisional data)
Decadal growth of population (2001-
2011) 4.14% 19.17% Census 2011 (provisional data)
Percentage of urban population 4.19% 30.55% Census 2011 (provisional data)
Scheduled Caste population
percentage of State population 17.7% 17.90% Census 2001
Schedule Tribe population
percentage of State population 0.07% 3% Census 2001
Sex ratio 1120 963 Census 2011 (provisional data)
3. Economy
As per the data collected by the Directorate of Economics & Statistics (2008-09), Rudraprayag had a
Gross District Domestic Product 69
of Rs. 70,744 Lakh which amounts to 1.76 percent of the total State
GDDP. The per capita income of Rudraprayag for 2008-09 was valued at Rs. 24,474, which is
significantly lower than the State per capita income of Rs. 36,52070
.
69
Statistical Diary, Government of Uttarakhand 70
http://planningcommission.nic.in/plans/stateplan/present/Uttarakhand.pdf
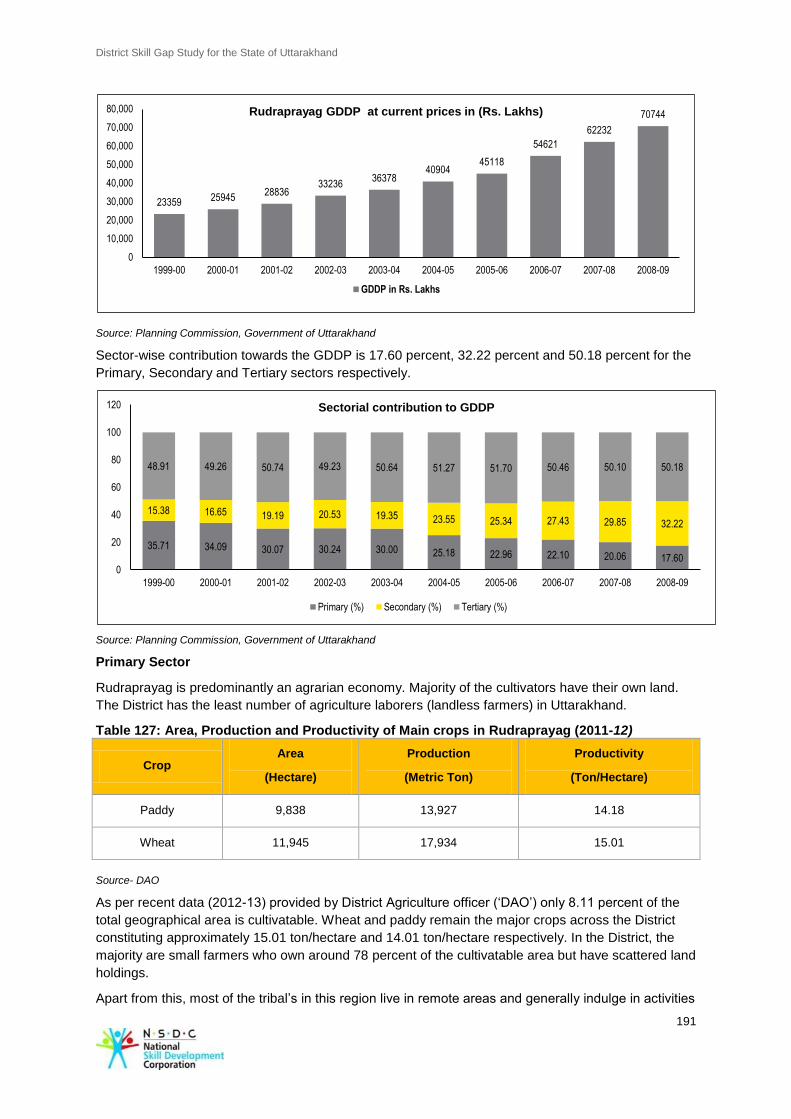
District Skill Gap Study for the State of Uttarakhand
191
Source: Planning Commission, Government of Uttarakhand
Sector-wise contribution towards the GDDP is 17.60 percent, 32.22 percent and 50.18 percent for the
Primary, Secondary and Tertiary sectors respectively.
Source: Planning Commission, Government of Uttarakhand
Primary Sector
Rudraprayag is predominantly an agrarian economy. Majority of the cultivators have their own land.
The District has the least number of agriculture laborers (landless farmers) in Uttarakhand.
Table 127: Area, Production and Productivity of Main crops in Rudraprayag (2011-12)
Crop Area
(Hectare)
Production
(Metric Ton)
Productivity
(Ton/Hectare)
Paddy 9,838 13,927 14.18
Wheat 11,945 17,934 15.01
Source- DAO
As per recent data (2012-13) provided by District Agriculture officer (‘DAO’) only 8.11 percent of the
total geographical area is cultivatable. Wheat and paddy remain the major crops across the District
constituting approximately 15.01 ton/hectare and 14.01 ton/hectare respectively. In the District, the
majority are small farmers who own around 78 percent of the cultivatable area but have scattered land
holdings.
Apart from this, most of the tribal’s in this region live in remote areas and generally indulge in activities
23359 25945 28836
33236 36378
40904 45118
54621
62232
70744
0
10,000
20,000
30,000
40,000
50,000
60,000
70,000
80,000
1999-00 2000-01 2001-02 2002-03 2003-04 2004-05 2005-06 2006-07 2007-08 2008-09
Rudraprayag GDDP at current prices in (Rs. Lakhs)
GDDP in Rs. Lakhs
35.71 34.09 30.07 30.24 30.00 25.18 22.96 22.10 20.06 17.60
15.38 16.65 19.19 20.53 19.35 23.55 25.34 27.43 29.85 32.22
48.91 49.26 50.74 49.23 50.64 51.27 51.70 50.46 50.10 50.18
0
20
40
60
80
100
120
1999-00 2000-01 2001-02 2002-03 2003-04 2004-05 2005-06 2006-07 2007-08 2008-09
Sectorial contribution to GDDP
Primary (%) Secondary (%) Tertiary (%)
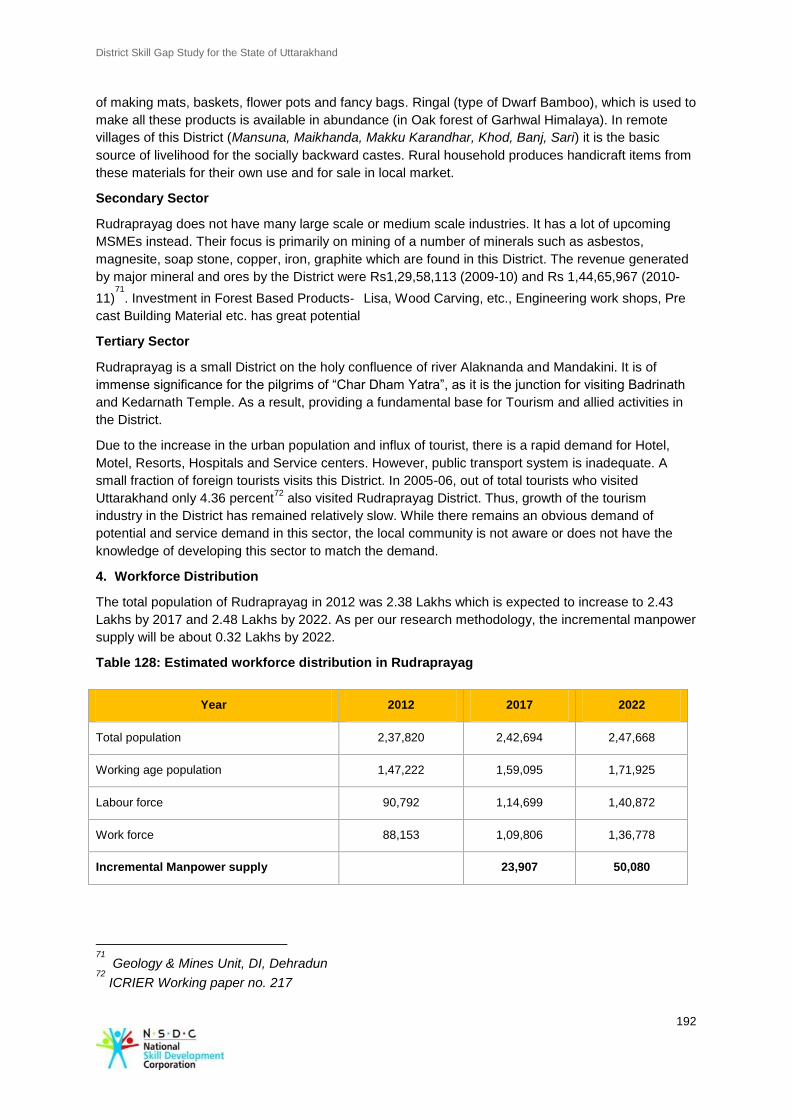
District Skill Gap Study for the State of Uttarakhand
192
of making mats, baskets, flower pots and fancy bags. Ringal (type of Dwarf Bamboo), which is used to
make all these products is available in abundance (in Oak forest of Garhwal Himalaya). In remote
villages of this District (Mansuna, Maikhanda, Makku Karandhar, Khod, Banj, Sari) it is the basic
source of livelihood for the socially backward castes. Rural household produces handicraft items from
these materials for their own use and for sale in local market.
Secondary Sector
Rudraprayag does not have many large scale or medium scale industries. It has a lot of upcoming
MSMEs instead. Their focus is primarily on mining of a number of minerals such as asbestos,
magnesite, soap stone, copper, iron, graphite which are found in this District. The revenue generated
by major mineral and ores by the District were Rs1,29,58,113 (2009-10) and Rs 1,44,65,967 (2010-
11)71
. Investment in Forest Based Products‐ Lisa, Wood Carving, etc., Engineering work shops, Pre
cast Building Material etc. has great potential
Tertiary Sector
Rudraprayag is a small District on the holy confluence of river Alaknanda and Mandakini. It is of
immense significance for the pilgrims of “Char Dham Yatra”, as it is the junction for visiting Badrinath
and Kedarnath Temple. As a result, providing a fundamental base for Tourism and allied activities in
the District.
Due to the increase in the urban population and influx of tourist, there is a rapid demand for Hotel,
Motel, Resorts, Hospitals and Service centers. However, public transport system is inadequate. A
small fraction of foreign tourists visits this District. In 2005-06, out of total tourists who visited
Uttarakhand only 4.36 percent72
also visited Rudraprayag District. Thus, growth of the tourism
industry in the District has remained relatively slow. While there remains an obvious demand of
potential and service demand in this sector, the local community is not aware or does not have the
knowledge of developing this sector to match the demand.
4. Workforce Distribution
The total population of Rudraprayag in 2012 was 2.38 Lakhs which is expected to increase to 2.43
Lakhs by 2017 and 2.48 Lakhs by 2022. As per our research methodology, the incremental manpower
supply will be about 0.32 Lakhs by 2022.
Table 128: Estimated workforce distribution in Rudraprayag
Year 2012 2017 2022
Total population 2,37,820 2,42,694 2,47,668
Working age population 1,47,222 1,59,095 1,71,925
Labour force 90,792 1,14,699 1,40,872
Work force 88,153 1,09,806 1,36,778
Incremental Manpower supply
23,907 50,080
71
Geology & Mines Unit, DI, Dehradun 72
ICRIER Working paper no. 217
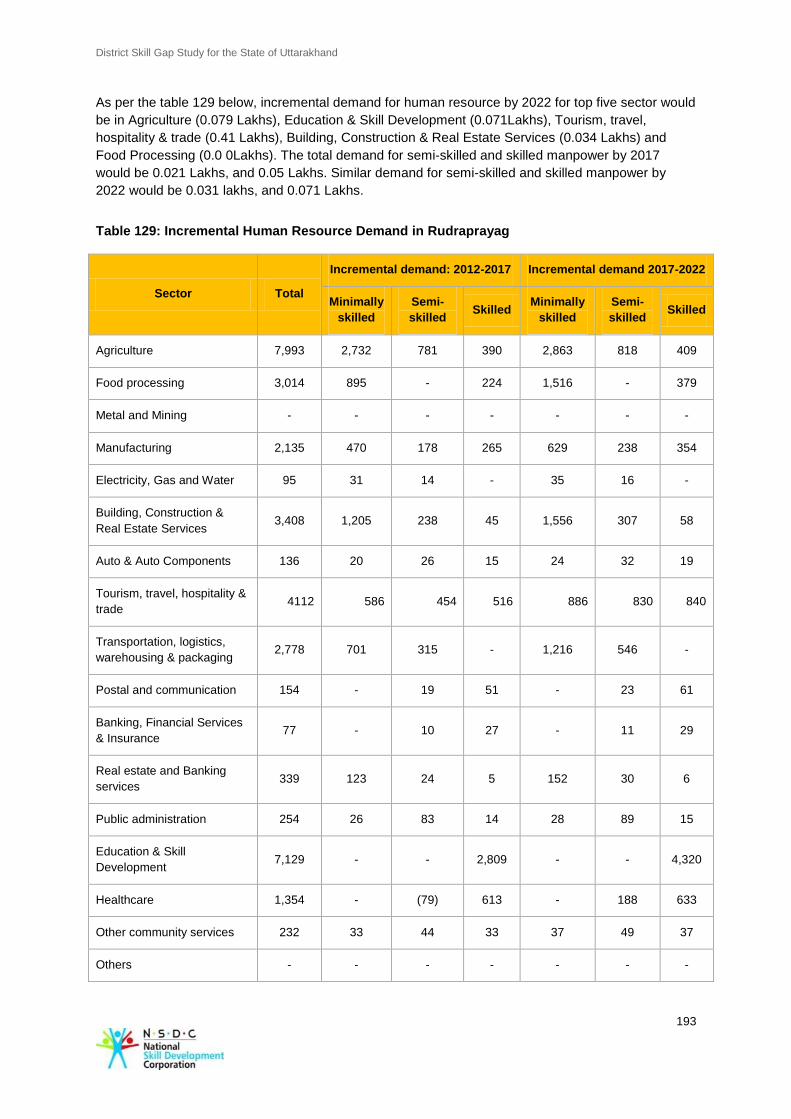
District Skill Gap Study for the State of Uttarakhand
193
As per the table 129 below, incremental demand for human resource by 2022 for top five sector would
be in Agriculture (0.079 Lakhs), Education & Skill Development (0.071Lakhs), Tourism, travel,
hospitality & trade (0.41 Lakhs), Building, Construction & Real Estate Services (0.034 Lakhs) and
Food Processing (0.0 0Lakhs). The total demand for semi-skilled and skilled manpower by 2017
would be 0.021 Lakhs, and 0.05 Lakhs. Similar demand for semi-skilled and skilled manpower by
2022 would be 0.031 lakhs, and 0.071 Lakhs.
Table 129: Incremental Human Resource Demand in Rudraprayag
Sector Total
Incremental demand: 2012-2017 Incremental demand 2017-2022
Minimally
skilled
Semi-
skilled Skilled
Minimally
skilled
Semi-
skilled Skilled
Agriculture 7,993 2,732 781 390 2,863 818 409
Food processing 3,014 895 - 224 1,516 - 379
Metal and Mining - - - - - - -
Manufacturing 2,135 470 178 265 629 238 354
Electricity, Gas and Water 95 31 14 - 35 16 -
Building, Construction &
Real Estate Services 3,408 1,205 238 45 1,556 307 58
Auto & Auto Components 136 20 26 15 24 32 19
Tourism, travel, hospitality &
trade 4112 586 454 516 886 830 840
Transportation, logistics,
warehousing & packaging 2,778 701 315 - 1,216 546 -
Postal and communication 154 - 19 51 - 23 61
Banking, Financial Services
& Insurance 77 - 10 27 - 11 29
Real estate and Banking
services 339 123 24 5 152 30 6
Public administration 254 26 83 14 28 89 15
Education & Skill
Development 7,129 - - 2,809 - - 4,320
Healthcare 1,354 - (79) 613 - 188 633
Other community services 232 33 44 33 37 49 37
Others - - - - - - -
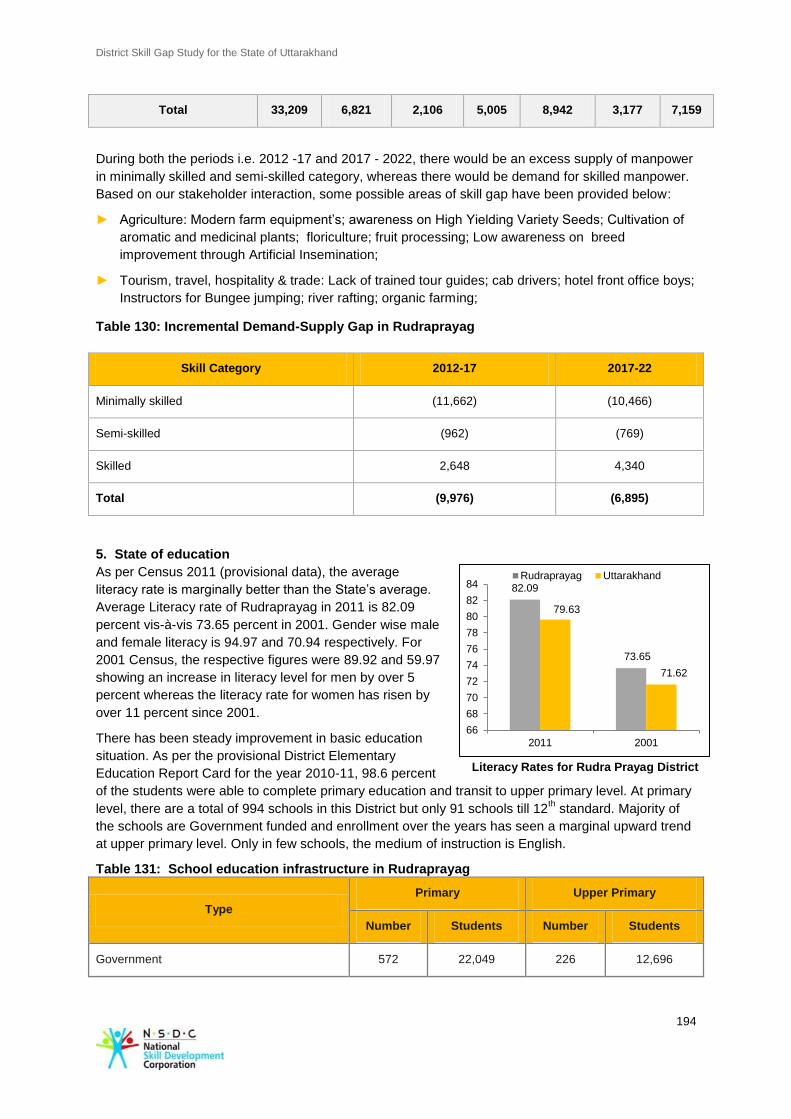
District Skill Gap Study for the State of Uttarakhand
194
82.09
73.65
79.63
71.62
66
68
70
72
74
76
78
80
82
84
2011 2001
Rudraprayag Uttarakhand
Total 33,209 6,821 2,106 5,005 8,942 3,177 7,159
During both the periods i.e. 2012 -17 and 2017 - 2022, there would be an excess supply of manpower
in minimally skilled and semi-skilled category, whereas there would be demand for skilled manpower.
Based on our stakeholder interaction, some possible areas of skill gap have been provided below:
► Agriculture: Modern farm equipment’s; awareness on High Yielding Variety Seeds; Cultivation of
aromatic and medicinal plants; floriculture; fruit processing; Low awareness on breed
improvement through Artificial Insemination;
► Tourism, travel, hospitality & trade: Lack of trained tour guides; cab drivers; hotel front office boys;
Instructors for Bungee jumping; river rafting; organic farming;
Table 130: Incremental Demand-Supply Gap in Rudraprayag
Skill Category 2012-17 2017-22
Minimally skilled (11,662) (10,466)
Semi-skilled (962) (769)
Skilled 2,648 4,340
Total (9,976) (6,895)
5. State of education
As per Census 2011 (provisional data), the average
literacy rate is marginally better than the State’s average.
Average Literacy rate of Rudraprayag in 2011 is 82.09
percent vis-à-vis 73.65 percent in 2001. Gender wise male
and female literacy is 94.97 and 70.94 respectively. For
2001 Census, the respective figures were 89.92 and 59.97
showing an increase in literacy level for men by over 5
percent whereas the literacy rate for women has risen by
over 11 percent since 2001.
There has been steady improvement in basic education
situation. As per the provisional District Elementary
Education Report Card for the year 2010-11, 98.6 percent
of the students were able to complete primary education and transit to upper primary level. At primary
level, there are a total of 994 schools in this District but only 91 schools till 12th standard. Majority of
the schools are Government funded and enrollment over the years has seen a marginal upward trend
at upper primary level. Only in few schools, the medium of instruction is English.
Table 131: School education infrastructure in Rudraprayag
Type
Primary Upper Primary
Number Students Number Students
Government 572 22,049 226 12,696
Literacy Rates for Rudra Prayag District
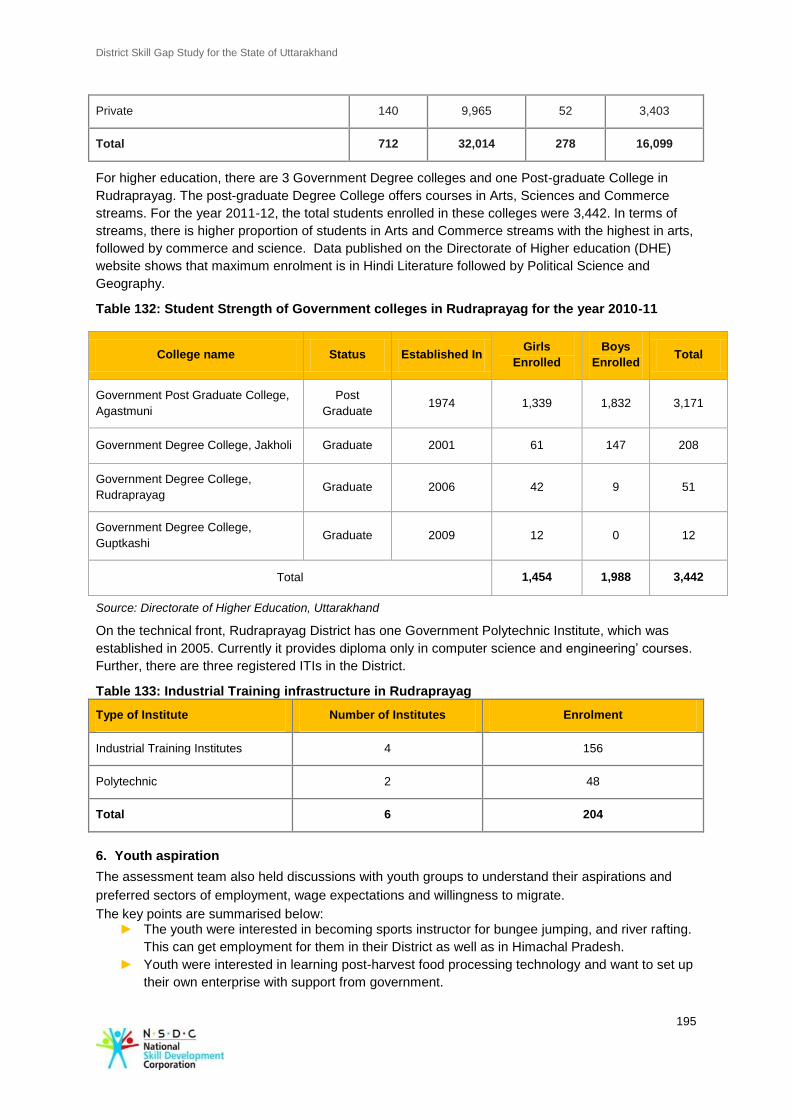
District Skill Gap Study for the State of Uttarakhand
195
Private 140 9,965 52 3,403
Total 712 32,014 278 16,099
For higher education, there are 3 Government Degree colleges and one Post-graduate College in
Rudraprayag. The post-graduate Degree College offers courses in Arts, Sciences and Commerce
streams. For the year 2011-12, the total students enrolled in these colleges were 3,442. In terms of
streams, there is higher proportion of students in Arts and Commerce streams with the highest in arts,
followed by commerce and science. Data published on the Directorate of Higher education (DHE)
website shows that maximum enrolment is in Hindi Literature followed by Political Science and
Geography.
Table 132: Student Strength of Government colleges in Rudraprayag for the year 2010-11
Source: Directorate of Higher Education, Uttarakhand
On the technical front, Rudraprayag District has one Government Polytechnic Institute, which was
established in 2005. Currently it provides diploma only in computer science and engineering’ courses.
Further, there are three registered ITIs in the District.
Table 133: Industrial Training infrastructure in Rudraprayag
Type of Institute Number of Institutes Enrolment
Industrial Training Institutes 4 156
Polytechnic 2 48
Total 6 204
6. Youth aspiration
The assessment team also held discussions with youth groups to understand their aspirations and
preferred sectors of employment, wage expectations and willingness to migrate.
The key points are summarised below: ► The youth were interested in becoming sports instructor for bungee jumping, and river rafting.
This can get employment for them in their District as well as in Himachal Pradesh.
► Youth were interested in learning post-harvest food processing technology and want to set up
their own enterprise with support from government.
College name Status Established In Girls
Enrolled
Boys
Enrolled Total
Government Post Graduate College,
Agastmuni
Post
Graduate 1974 1,339 1,832 3,171
Government Degree College, Jakholi Graduate 2001 61 147 208
Government Degree College,
Rudraprayag Graduate 2006 42 9 51
Government Degree College,
Guptkashi Graduate 2009 12 0 12
Total 1,454 1,988 3,442
District Skill Gap Study for the State of Uttarakhand
196
► Most of the youth were interested in setting up their own hotels, restaurants, dhabas, and
travel agency to tap the local tourism but lack resource and infrastructure for the same.
7. Development Potential and stakeholder perspective
Tourism & Hospitality Sector
The presence of various Hindu temples makes the District a destination for religious tourism and also
offers scenic beauty.
The sector provides employment in hospitality and allied activities but the remuneration in this sector
remains nominal. This is mainly because the demand is only seasonal, up surging during the ‘Char
Dham Yatra season’. Infrastructure, connectivity and transportation facilities are the key areas, which
need to be prioritized for tapping the tourism potential. Development of ropeway system in line with
reducing time from reaching destinations would be beneficial.
There is scope for new hotels with modern facilities and skilled staff to attract foreign as well as
domestic tourists in the region. However, the quality standards in the hotel industry it is a matter of
concern in the District. There is a need to improve the quality of the hotels- both in terms of
infrastructure and services to attract more tourists
Development of adventure sports service providers in the District will also boost the related ancillary
activities. Interaction with the youth of the District shows that the majority of them are only searching
for opportunities in the traditional sectors like army, Government jobs etc. Due to lack of awareness,
large number of arts and Commerce graduates are not able to find avenues of employment. ITI
education is considered costly without adequate employment opportunities. In this light, adventure
sports like river rafting and bungee jumping could be evolved on a much larger scale to tap the
interest of the youth aside of their traditional inclinations. Skill training for tour guides, hotel
management and professional drivers is imperative in this respect.
Agriculture & Organic Farming
Since, most of the cultivation done here is through traditional means, there is a huge potential of
increase in productivity by use of modern agricultural equipment. Currently, the Agricultural
Department provides loans to the farmer at subsidized rate for up-gradation of equipment73
. Increase
in awareness among women (who are majorly involved in agriculture) farmers group on modern
methods of production will go a long way in increasing the productivity and reducing the manpower
required.
Use of chemical fertilizers in this region is limited. Thus, most of the produce is sold under the banner
of Organic Produce but the yield is comparatively low. Uttarakhand Organic Commodity Board
(UOCB) was set up to promote organic farming in the State. Though there exist export markets for
organic produce like basmati rice and finger millet but lack of infrastructural facilities for processing
and value addition to this produce, impedes the envisaged returns. Further marketing of these
products is also an issue. Branding organic agricultural products would help in creating an
international brand. It is required to create awareness among the farmers and bring them under an
umbrella co-operative that can be further decentralized at the local level. There is a huge scope of
organized farming training among local youths. Awareness on the demand and higher market price for
organic produce should also be disseminated to the local agrarian population in attempts to attract
them in producing organic products at a larger and more commercial level.
While the concerned department provides various training and extension services through Krishi
73
Extensive use of big machines like tractors won’t be possible as landholdings aren’t consolidated.
District Skill Gap Study for the State of Uttarakhand
197
Vigyan Kendra, it was regarded as inadequate. Moreover, the educated male youth prefers to migrate
to cities in search of better employment opportunities which results in all the responsibilities related to
cultivation to fall on the shoulders of women. It is therefore considered requisite to develop skills of
Women SHG’s. The main problem in this regard has been that the property is not registered in the
name women who actually indulge in all the agriculture related chores. In absence of the male head of
the household, they find it difficult to garner loans from the bank for up-gradation and other purposes.
Joint accounts or education on joint registry of land and property could help women employed in
agriculture make decisions and improve farming practices while the men work in urban areas and
major cities.
Floriculture & Fruit Processing
Floriculture could be the growth-driving activity of the District. The main issue in Floriculture in the
District so far, has been the unorganized approach followed by the concerned department of not being
able to prepare a roadmap for sustainable production of various medicinal and aromatic plants. There
is a need of scaling up the flower market to gain a greater coverage.
Also, there is abundant production of fruits like Malta in the District. However, there exist few
Government owned and sponsored go-downs for storage of these fruits. These are only actively used
by Government agencies and local businessmen. However local farmers rarely avail of this benefit,
due to lack of awareness. Apart from that, there is no cold storage facility due to which the farmers
are not able to get remunerative prices for produce like potato and vegetables that rot or go waste
over a few days.
In this regard, it is requisite that the farmers should be provided with the planting seeds at marginal
rates and proper training should be provided to the herb collector for safe harvesting of endangered
and rare species74
. This sector shows promise to develop from subsistence to commercialization. In
this evolving process it will require professionals with technological, marketing and business skills.
Imparting training to the youths with technical and scientific know-how related to agriculture is the
need of the hour.
There is no fruit processing centers apart from few maltas juice processing units at private level in this
District. Most of the produce is dispatched to Dehradun and other plain areas in the State. Inadequate
post-harvest technology (processing, grading, processing and packaging) in the District results in lack
of motivation among farmers to be entrepreneurial and indulging in non-traditional activities. There is
a need for fruit processing training and post-harvest technology training. It was noted that most of the
interviewed youth didn’t want to be associated with agriculture related activities as they presume that
it won’t provide them financial security. Such trainings thus, would greatly benefit these youth by
involving them into lucrative business activities within their Districts.
Animal Husbandry
Small and marginal farmers are heavily dependent on the livestock. The population of livestock is
considerably significant but the productivity is low. There has been some improvement in the
availability of veterinary hospitals and artificial insemination facility centre but still a lot of work needs
to done on establishing a milk-processing unit and strengthening the distribution structure. There are
successful cases of Aanchal Cooperative (Dairy) and swine rearing in the District under PMEGP
scheme. There is also potential in poultry farming, swine and sheep rearing.
Based on our interaction with various stakeholders, some key areas which provide skill development
opportunity have been provided in the table below:
Table 134: Sectors and skill requirement
74
Status of Medicinal plants….. in Rudraprayag District, G.R.Gargya and L.D Gargya
District Skill Gap Study for the State of Uttarakhand
198
Sector Skill Requirements
Primary Medicinal and Aromatic plant, Sericulture and Horticulture and forest based
products like Ringal (Dwarfed Bamboo). In order to produce these goods on
extensive scale, youth needs to be skilled in developing forward and backward
linkages.
Secondary Focus on infrastructure for establishment of value added wood & wool based
industries. Credit provision need to be smoothened.
Tertiary Tourism though season, has a huge potential. Pilgrims come during the Yatra
season but do not stay for long periods due to low quality of Hotels and
Resorts, lack in variety of foods, staff problems etc. Organized approach needs
to be followed with re-structuring of the existing Vocational Institute to meet the
growing demand of this sector
8. Recommendations
Government ► Promote awareness generation program on medicinal and aromatic
plants. Support training programs on extraction and use of medicinal
plants.
► Encourage to set up fruit processing plant and support training and skill
development activities on commercial production and value addition done
the value chain.
NSDC ► NSDC can focus on promoting short term courses for farmers to
encourage the introduction of mechanization and to help understand the
use and maintenance of machinery in agriculture. These courses can be
run for youth groups to train them as mechanics and electricians that could
be employed in the farm mechanization industry.
Industry ► Rudraprayag is not an industrially developed area, the MSMEs in this area
can take initiatives to promote
scientific mining
wool processing
food processing
► These being a labour intensive area would help promote skills by
generating employment.
Vocational Training
Providers
► Provide avenues for mass training on communication skills, computers
which would enable the unemployed population to be eligible for better job
opportunities with better starting salaries.
► VTC in the District should introduce short term training programmes on
basic levels of adventure sports, hotel management/ tourism related skills
including culinary, housekeeping, bartending, trekking guides etc.,
► It is essential to incorporate a component of soft skill training like
communication skills, personality development etc. in all courses.
► VTC can provide the local farmer families, training on the latest techniques
for growing fruits, flowers and vegetables and managing nurseries and
orchard's. Additionally short term courses on the use of mechanization in
agriculture are also required to help improve the efficiency of the farmers.
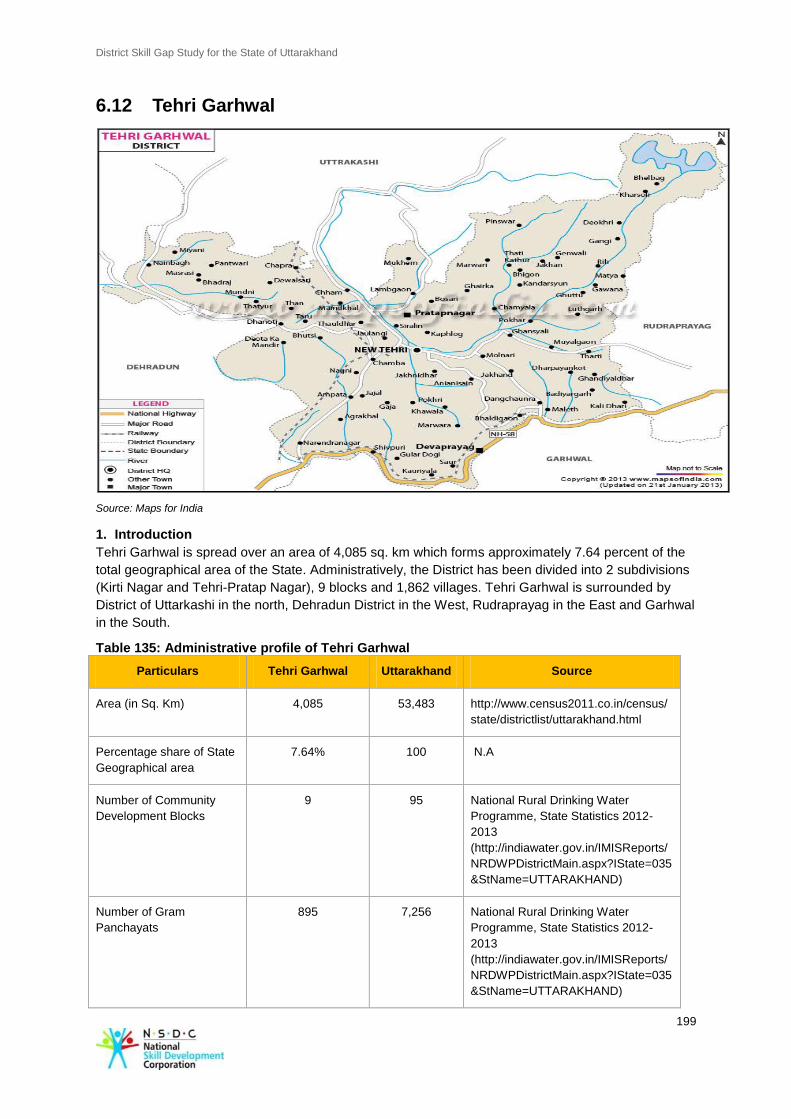
District Skill Gap Study for the State of Uttarakhand
199
6.12 Tehri Garhwal
Source: Maps for India
1. Introduction
Tehri Garhwal is spread over an area of 4,085 sq. km which forms approximately 7.64 percent of the
total geographical area of the State. Administratively, the District has been divided into 2 subdivisions
(Kirti Nagar and Tehri-Pratap Nagar), 9 blocks and 1,862 villages. Tehri Garhwal is surrounded by
District of Uttarkashi in the north, Dehradun District in the West, Rudraprayag in the East and Garhwal
in the South.
Table 135: Administrative profile of Tehri Garhwal
Particulars Tehri Garhwal Uttarakhand Source
Area (in Sq. Km) 4,085 53,483 http://www.census2011.co.in/census/
state/districtlist/uttarakhand.html
Percentage share of State
Geographical area
7.64% 100 N.A
Number of Community
Development Blocks
9 95 National Rural Drinking Water
Programme, State Statistics 2012-
2013
(http://indiawater.gov.in/IMISReports/
NRDWPDistrictMain.aspx?IState=035
&StName=UTTARAKHAND)
Number of Gram
Panchayats
895 7,256 National Rural Drinking Water
Programme, State Statistics 2012-
2013
(http://indiawater.gov.in/IMISReports/
NRDWPDistrictMain.aspx?IState=035
&StName=UTTARAKHAND)
District Skill Gap Study for the State of Uttarakhand
200
Particulars Tehri Garhwal Uttarakhand Source
Total number of inhabited
villages
1,862 16,793 http://www.censusindia.gov.in/2011-
prov-
results/paper2/data_files/uttrakhand/8
-adminunit-60-61.pdf
2. Demography
As per the Census 2011 (provisional data),the total population of Tehri Garhwal is 6.16 Lakh,
constituting 6.09 percent Uttarakhands total population. The urban population is 2.26 percent of the
total population making Tehri Garhwal primarily a rural area. It ranks 5thth among the 13 Districts in
terms of sex ratio (1,078 females per 1,000 males). With population density of 169 people per sq. km,
Tehri Garhwal is the 6th most densely populated District in the State, but below the State’s average of
189 persons per sq. km. This is due to the fact that forests occupy most of the area in the District.
Table 136: Socio economic indicators for Tehri Garhwal
Population Tehri Garhwal Uttarakhand Source
Total population (in Lakh) 6.16 101.17 Census 2011(provisional data)
Total population (Male) (in Lakh) 2.96 51.54 Census 2011 (provisional data)
Total population (Female) (in Lakh) 3.19 49.63 Census 2011 (provisional data)
District share in State's population 6.09% N.A N.A
Density of population 169 189 Census 2011 (provisional data)
Decadal growth of population
(2001-2011) 1.93% 19.17% Census 2011 (provisional data)
Percentage of urban population 11.37% 30.55% Census 2011 (provisional data)
Scheduled Caste population
percentage of State population 14.4% 17.90% Census 2001
Schedule Tribe population
percentage of State population 0.27% 3% Census 2001
Sex ratio 1,078 963 Census 2011 (provisional data)
3. Economy
As per the data collected by the Directorate of Economics & Statistics (2008-09), Tehri Garhwal had a
Gross District Domestic Product 75
of Rs. 261,787 Lakh which amounts to 6.52 percent of the total
State GDDP. The per capita income of Tehri Garhwal for 2008-09 was valued at Rs. 33,999, which is
lower than the State per capita income of Rs. 36,52076
.
75
Statistical Diary, Government of Uttarakhand 76
http://planningcommission.nic.in/plans/stateplan/present/Uttarakhand.pdf
District Skill Gap Study for the State of Uttarakhand
201
Source: Planning Commission, Government of Uttarakhand
The contribution of various sectors to the District GDP has been 19.43 percent by the primary sector,
39.05 percent by the industry sector and 41.52 percent by the services sector.
Source: Planning Commission, Government of Uttarakhand
Primary Sector
As per Uttarakhand Agriculture Statistics Report published in 2009-2010, almost 89 percent of the
land in the District is covered under forest and only 5.48 percent of the total geographical area of land
was brought under cultivation in the District. The landholding per individual in the District is 0.11
hectares whereas the size of average landholding is 0.87 hectares. Around 95 percent of the rural
population is dependent on agriculture for their livelihood. Rice and wheat are the primary crops with a
gross cropped area of around 22,000 hectares (though only one third of this area is cropped using
irrigation). Ragi, Maize and Barley are primarily grown without any irrigation. Apart from cereals, other
major crops include pulses, fruits & vegetables.
Secondary Sector
As per the District Industrial Center, there are 6,231 registered industrial units. The estimated average
number of daily workers employed in these registered small scale industrial units is 14,374. Currently
there are no medium or large scale industry and public sector undertaking in the entire District. Some
of the prominent micro and small enterprises are agro-based (703 units), readymade garments (1883
units), wooden based furniture (323 units), engineering units (217 units), and repairing service (352
units).
69592 80484
90795 107290
117176
151321
171287
198823
229336
261787
0
50,000
1,00,000
1,50,000
2,00,000
2,50,000
3,00,000
FY 00 FY 01 FY 02 FY 03 FY 04 FY 05 FY 06 FY 07 FY 08 FY 09
Tehri Garhwal GDDP at current prices in (Rs. Lakhs)
GDDP in Rs. Lakhs
27.71 27.60 26.20 24.51 24.82 29.10 28.51 23.65 21.93 19.43
22.99 24.44
46.15
29.69 27.81 28.95 30.23 34.17 36.55 39.05
49.30 47.96
27.64 45.81 47.37 41.96 41.25 42.18 41.53 41.52
0
20
40
60
80
100
120
1999-00 2000-01 2001-02 2002-03 2003-04 2004-05 2005-06 2006-07 2007-08 2008-09
Sectorial contribution to GDDP
Primary (%) Secondary (%) Tertiary (%)
District Skill Gap Study for the State of Uttarakhand
202
Tertiary Sector
Tehri Garhwal is one of the popular Districts for its natural beauty. There is very good scope of
tourism base service industry like hotel, restaurants, adventure sports, river rafting, and trekking.
Place of attraction includes:
Table 137: Key tourist attraction in Tehri Garhwal
Location Tourist Attraction
New Tehri Overlooks a massive artificial lake and a Dam
Narendra Nagar Offers a fine view of the Ganga and the beautiful Doon Valley
Chamba Offering a splendid view of the snow-capped Himalayas and the
serene Bhagirathi valley
Dhanaulti Located amidst thick, virgin forests of Deodar, Rhododendron and
Oak, has an atmosphere of perfect peace & tranquility
Kunjapuri Contains an old temple dedicated to the goddess Kunjapuri Devi which
is visited by a number of people every year.
Dev Prayag Raghunath Temple; Baital Kund, Brahm Kund; Surya Kund and
Vasisht Kund; the Indradyumna Tirth, Pushyamal Tirth, Varah Tirth ;
Pushpavatika ; Baitalshila and Varahishila ; the shrines of Bhairava,
Bhushandi, Durga and Vishveshvara ; and a temple dedicated to
Bharat.
Nagtibba Offers trekking opportunities and adventure sports
Khatling Glacier Sight of Khatling glacier is spectacular
4. Workforce Distribution
The total population of Tehri Garhwal in 2012 was 6.17 Lakhs which is expected to increase to 6.23
Lakhs by 2017 and 6.29 Lakhs by 2022. As per our research methodology, the incremental manpower
supply will be about 1.62 Lakhs by 2022.
Table 138: Estimated workforce distribution in Tehri Garhwal
Year 2012 2017 2022
Total population 6,17,587 6,23,514 6,29,497
Working age population 3,82,540 4,10,167 4,39,790
Labour force 2,35,949 3,05,018 3,98,438
Work force 2,31,365 3,00,655 3,90,697
Incremental Manpower supply
69,069 162,489
District Skill Gap Study for the State of Uttarakhand
203
As per the table 139 below, incremental demand for human resource by 2022 for top five sector would
be Agriculture (0.19 Lakhs), Education and Skill Development (0.18 Lakhs), Tourism, travel,
hospitality & trade (0.16 Lakhs), Building, Construction & Real Estate Services (0.14 Lakhs), and
Transportation, logistics, warehousing & packaging (0.094 Lakhs). The total demand for semi-skilled
and skilled manpower by 2017 would be 0.072 Lakhs, and 0.13 Lakhs. Similar demand for semi-
skilled and skilled manpower by 2022 would be 0.11 Lakhs, and 0.19 Lakhs
Table 139: Incremental Human Resource Demand in Tehri Garhwal
Sector Total
Incremental demand: 2012-2017 Incremental demand 2017-2022
Minimally
skilled
Semi-
skilled Skilled
Minimall
y skilled
Semi-
skilled Skilled
Agriculture 19,283 6,593 1,884 942 6,906 1,973 987
Food processing 1,014 301 - 75 510 - 128
Metal and Mining 95 23 9 13 25 10 14
Manufacturing 7,771 1,697 643 956 2,305 873 1,298
Electricity, Gas and
Water 1,432 432 194 - 556 250 -
Building, Construction
& Real Estate Services 14,162 5,006 989 185 6,466 1,277 239
Auto & Auto
Components 249 34 45 26 47 62 36
Tourism, travel,
hospitality & trade 16,979 2,151 2,038 2,049 3,445 3,796 3,500
Transportation,
logistics, warehousing
& packaging
9,425 2,298 1,032 - 4,205 1,889 -
Postal and
communication 854 - 105 284 - 126 340
Banking, Financial
Services & Insurance 159 - 21 57 - 22 59
Real estate and
Banking services 854 310 61 11 382 75 14
Public administration 924 94 301 49 101 324 53
Education & Skill
Development 18,365 - - 7,235 - - 11,130
Healthcare 2,849 - (167) 1,289 - 395 1,332
Other community
services 526 74 99 74 84 112 84
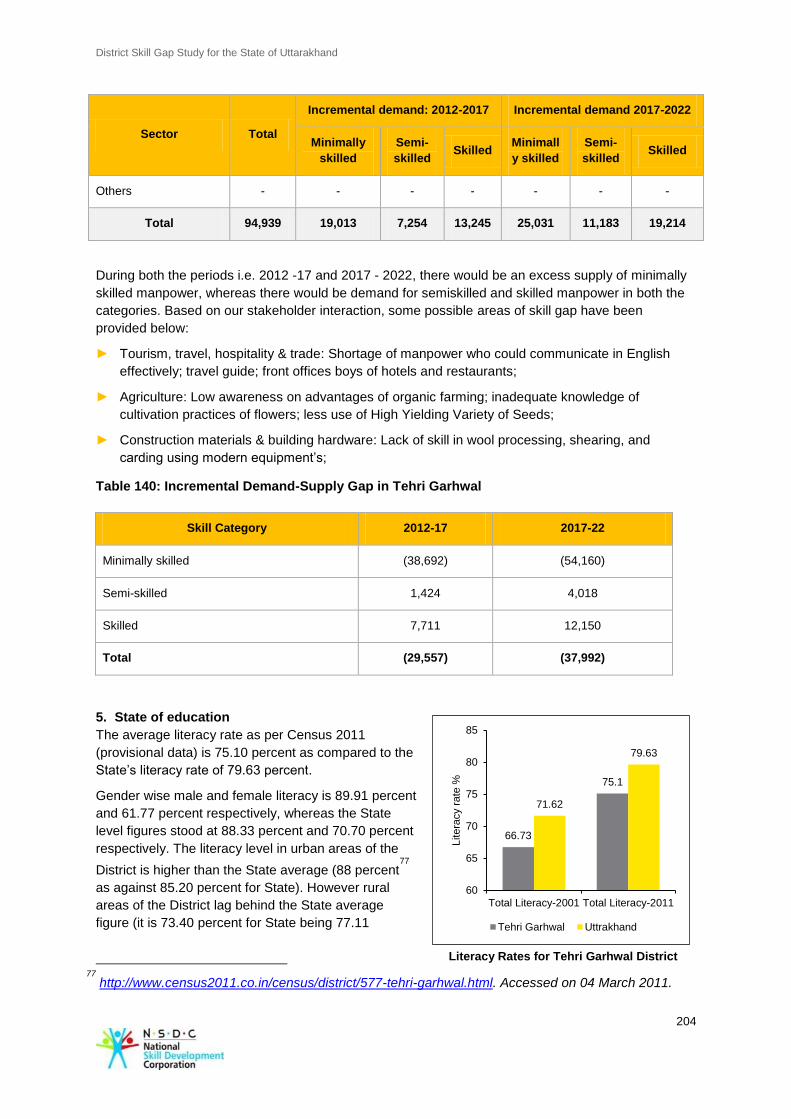
District Skill Gap Study for the State of Uttarakhand
204
Sector Total
Incremental demand: 2012-2017 Incremental demand 2017-2022
Minimally
skilled
Semi-
skilled Skilled
Minimall
y skilled
Semi-
skilled Skilled
Others - - - - - - -
Total 94,939 19,013 7,254 13,245 25,031 11,183 19,214
During both the periods i.e. 2012 -17 and 2017 - 2022, there would be an excess supply of minimally
skilled manpower, whereas there would be demand for semiskilled and skilled manpower in both the
categories. Based on our stakeholder interaction, some possible areas of skill gap have been
provided below:
► Tourism, travel, hospitality & trade: Shortage of manpower who could communicate in English
effectively; travel guide; front offices boys of hotels and restaurants;
► Agriculture: Low awareness on advantages of organic farming; inadequate knowledge of
cultivation practices of flowers; less use of High Yielding Variety of Seeds;
► Construction materials & building hardware: Lack of skill in wool processing, shearing, and
carding using modern equipment’s;
Table 140: Incremental Demand-Supply Gap in Tehri Garhwal
Skill Category 2012-17 2017-22
Minimally skilled (38,692) (54,160)
Semi-skilled 1,424 4,018
Skilled 7,711 12,150
Total (29,557) (37,992)
5. State of education
The average literacy rate as per Census 2011
(provisional data) is 75.10 percent as compared to the
State’s literacy rate of 79.63 percent.
Gender wise male and female literacy is 89.91 percent
and 61.77 percent respectively, whereas the State
level figures stood at 88.33 percent and 70.70 percent
respectively. The literacy level in urban areas of the
District is higher than the State average (88 percent77
as against 85.20 percent for State). However rural
areas of the District lag behind the State average
figure (it is 73.40 percent for State being 77.11
77
http://www.census2011.co.in/census/district/577-tehri-garhwal.html. Accessed on 04 March 2011.
66.73
75.1
71.62
79.63
60
65
70
75
80
85
Total Literacy-2001 Total Literacy-2011
Litera
cy r
ate
%
Tehri Garhwal Uttrakhand
Literacy Rates for Tehri Garhwal District
District Skill Gap Study for the State of Uttarakhand
205
percent) Census 2011 (provisional data).
Table 141: School education infrastructure in Tehri Garhwal District
Type
Primary Upper Primary
Number Students Number Students
Government 1,474 58,504 551 33,189
Private 282 24,560 75 6,609
Total 1,756 83,064 626 39,798
As per provisional District Elementary Education Report Card (2010-2011) the District had 10.5
percent of total number of schools of the State. Currently there are 9 Government degree colleges
offering course on Hindi, English, History, Economics, Geography, Political Science, Sociology, and
Environmental Studies and one Government run Industrial Training Institute (ITI) offering courses on
Fitter, Data Entry operator, Electrician, Mechanical Motor, Vehicle Driving, Electronic Mechanic,
Wiremen and Hindi Typing.
Table 142: Industrial Training infrastructure in Tehri Garhwal District
Type of Institute Number of Institutes Enrolment
Industrial Training Institutes 12 449
Polytechnic 1 248
Total 13 697
6. Youth Aspirations
The assessment team also held discussions with youth groups to understand their aspirations and
preferred sectors of employment, wage expectations and willingness to migrate. Our key discussion
points have been summarised below:
► There is lack of awareness on employable courses among the youth community as the female
students want to become teachers and male students aspire for Government jobs.
► Instead of taking direct agriculture related activities, male youth preferred to undertake agriculture
only with modern equipment’s and less labor intensive techniques. Their inclination is much
towards learning agro, and food processing technology.
► There is a need to align the existing courses offered by the ITI with industry needs and
requirements to ensure better employability.
7. Development Potential and stakeholder perspectives
Horticulture and Floriculture
During our interaction with the representatives of the Agriculture Department, the following points
were highlighted:
► With stumpy availability of crop land, diversification in agriculture is required to develop alternative
sources of livelihood. Alternative areas of diversification are horticulture farming, spices and
condiments and organic farming. Current yield levels can be effectively raised in a stable and
sustainable manner by adopting organic farming methods, use of high yielding variety of seeds,
District Skill Gap Study for the State of Uttarakhand
206
and modern farming equipment’s.
► Organic products have a parallel market, which if captured in strategic manner can generate
employment opportunities in the District. Skilled workforce will be required in promoting organic
farming methods and developing forward linkages for marketing of these products;
► Sorting, grading and processing of food products is another area requiring skilled workforce;
► Climatic conditions of the District provide adequate opportunities for commercial floriculture
farming. The District is en-route to religious tourism and provides potential for growth in floriculture
business. Market demand especially from pilgrimage centers of Haridwar and Rishikesh provides
opportunities for growth and employability in future.
Industry and allied sector
Given the absence of medium and large industrial set-ups in the District, there is great potential for
food and agro-processing industry, woolen processing units, hosiery units and handicrafts industries
in the District. Some of the MSMEs identified by the District Industrial Centre that have potential for
growth and employment are as follows:
► Food and agro-based processing industries – Agro based industries such as fruit pulp sauce,
ketchup, pickles, puree, grains & cereals processing unit, food packaging units with eco-friendly
packaging material;
► Handloom and handicraft industries – Wool processing unit, readymade garments centre;
► Automobile – automobile repair shop, service centers;
► Forest based- paper products, wood carvings, raisin based products (turpine).
Food processing industry has potential to generate large scale employment in the District. Our
discussion with industry representatives highlighted that based on the availability of raw material in
the District, there is potential scope for growth in fruit pulp enterprise, grains and cereal processing
unit, and food packaging industry. Lack of skilled manpower in processing facilities makes it difficult to
scale up production. On our interaction with General Manager, District Industrial Centre, it was
suggested to develop capacity of manpower in the District through Government Technical Institutions.
Existing ITI and training centers lack capability to impart training on specific skills related to food
processing. However, new ITI’s formed under the Public Private Partnership mode have introduced a
course on horticulture, that has potential to train people on horticulture and allied activities. Since
Tehri Garhwal has a potential for growth in food and agro-food processing industries, a skill based
course from ITI can go a long way in generating skilled manpower for languishing horticulture sector.
Dhalwala area in Rishikesh has huge potential to be developed as a common facility centre for wool
processing and cleaning. Wool industry has not been developed in an integrated manner. Industry
representatives feel that there is gap in skilled manpower for processing raw wool to final product.
Generally wool processing consists of 7-8 process i.e. skirting, shearing, carding, roving, spinning,
wind and/or skeining. Emphasis was laid on providing training on spinning, which is considered to be
technical and complex of all the process. There is severe gap of skilled manpower in this process and
it requires at least 6 months in getting proficient in spinning. Currently, skilled manpower is outsourced
from Ludhiana and Panipat to meet the industry requirement. Similarly for hosiery and handloom
units, there is requirement for skilled manpower in running knitting machines and adding design to the
final product. There is especially shortage of the master foreman to run these units.
Services and allied sector
During our interaction with the principal and students of the inter girls college both stressed on the
need for imparting training on spoken English. As per the principal, there is shortage of English
teachers that can impart soft skills related training which could enhance the employability of students
in the tourism industry (travel guide, front offices of hotels and restaurants where interaction with
foreign tourists is expected).
District Skill Gap Study for the State of Uttarakhand
207
Based on our interaction with various stakeholders, some key areas which provide skill development
opportunity have been provided in the table below:
Table 143: Sector and skill requirement
Sector Skill Requirements
Primary There is scope of diversification of agriculture to create different structures of
employment. Potential for growth and development exists in setting up food
and agro-food processing units. Temperate climate of the District provides
excellent opportunities for commercial floriculture. Training and skill
development course is required to develop the capacity of the farmers in
horticulture and floriculture methods. Training focus should also be on
developing market linkages with buyers.
Secondary Food processing and agro based industry has huge potential for growth.
Currently this sector is not well developed but there is good potential for
developing and building market linkages with nearby cities like Dehradun, and
Rishikesh. Wool processing units have potential and can be promoted in with
cluster approach across the District through training on modernized techniques
for wool processing. There is scope for skill development in farming practices
for fruit crops and processing of raw wool into a final product
Tertiary There is shortage of skilled manpower in tourism and hospitality sector.
Existing ITI and Vocational training centers are not sufficient to meet the
training demand of industries. Skill development would be required in soft skills
for tourism and hospitality sector. Effort should be made in strengthening the
existing educational institution and Government colleges.
8. Recommendations
Government ► Promote training and skilling activities of wool and woolen based products
in collaboration with National Institute of Design.
► Strengthen industry ties to encourage PPP’s in skill development.
► Promote eco-tourism in the District by developing new tourist spots and
marketing its existing tourist attractions. Further the Government can
introduce new policies to attract big hospitality firms to set up hotels in
these locations. Upgrade infrastructure like roads, transport, rest houses
etc.
NSDC ► NSDC can focus on promoting short term courses for farmers to
encourage the introduction of mechanization and to help understand the
use and maintenance of machinery in agriculture.
► Promote herb farming and facilitate trainings for related skills.
Industry ► Industries can collaborate with the exiting training providers to develop
course structure and curriculum.
► Major hospitality firms in the State and the country should be encouraged
to set up properties to help promote the District as a tourist destination.
This provides opportunities for introducing various skilling programs for
cooks, waiters, house-keeping and other hotel/ restaurant management
roles.
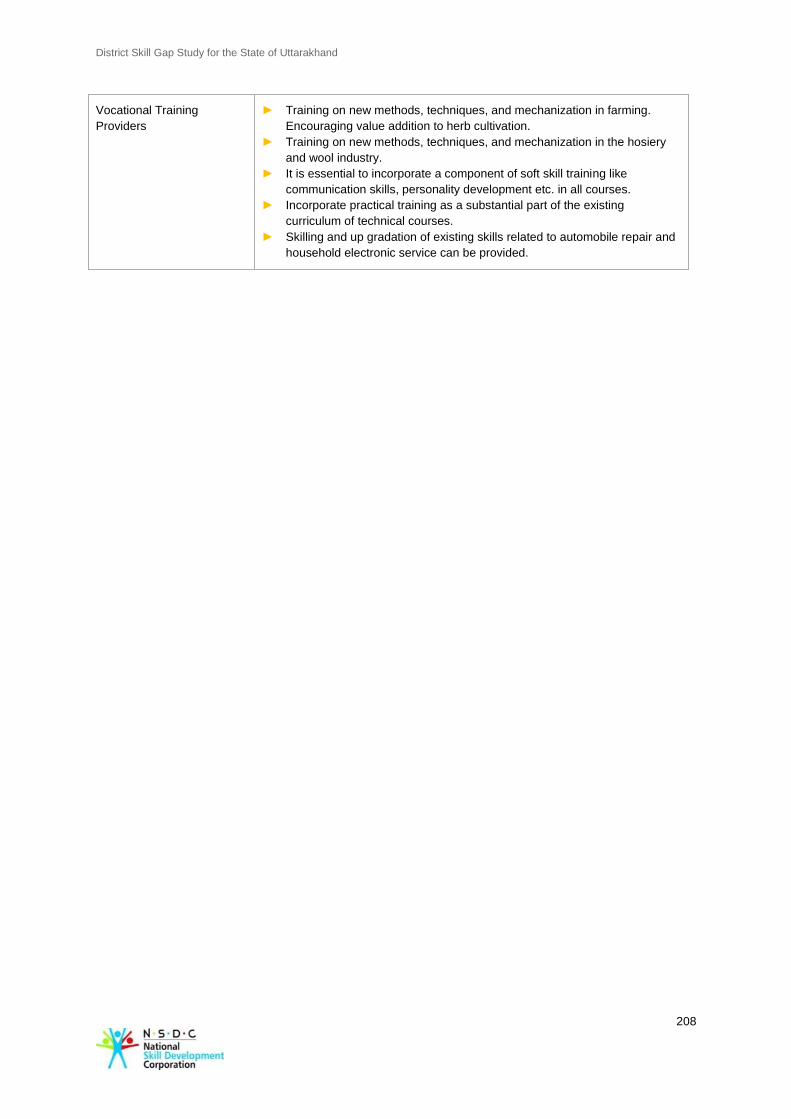
District Skill Gap Study for the State of Uttarakhand
208
Vocational Training
Providers
► Training on new methods, techniques, and mechanization in farming.
Encouraging value addition to herb cultivation.
► Training on new methods, techniques, and mechanization in the hosiery
and wool industry.
► It is essential to incorporate a component of soft skill training like
communication skills, personality development etc. in all courses.
► Incorporate practical training as a substantial part of the existing
curriculum of technical courses.
► Skilling and up gradation of existing skills related to automobile repair and
household electronic service can be provided.
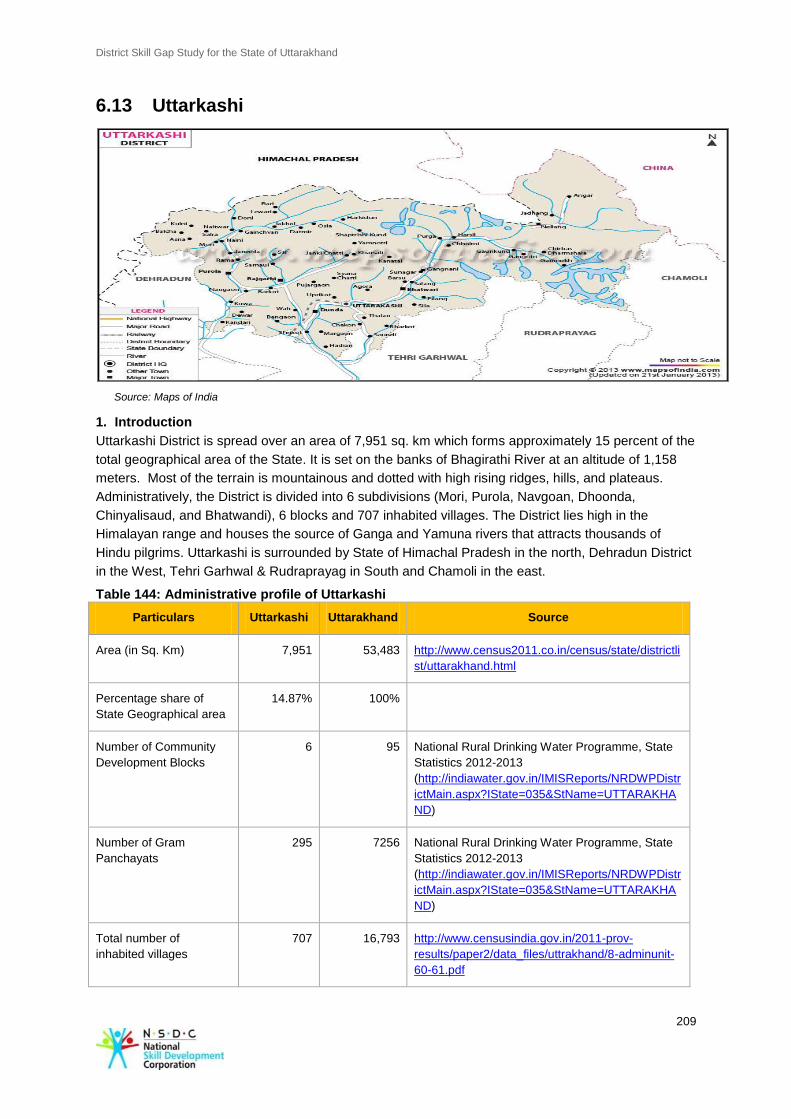
District Skill Gap Study for the State of Uttarakhand
209
6.13 Uttarkashi
Source: Maps of India
1. Introduction
Uttarkashi District is spread over an area of 7,951 sq. km which forms approximately 15 percent of the
total geographical area of the State. It is set on the banks of Bhagirathi River at an altitude of 1,158
meters. Most of the terrain is mountainous and dotted with high rising ridges, hills, and plateaus.
Administratively, the District is divided into 6 subdivisions (Mori, Purola, Navgoan, Dhoonda,
Chinyalisaud, and Bhatwandi), 6 blocks and 707 inhabited villages. The District lies high in the
Himalayan range and houses the source of Ganga and Yamuna rivers that attracts thousands of
Hindu pilgrims. Uttarkashi is surrounded by State of Himachal Pradesh in the north, Dehradun District
in the West, Tehri Garhwal & Rudraprayag in South and Chamoli in the east.
Table 144: Administrative profile of Uttarkashi
Particulars Uttarkashi Uttarakhand Source
Area (in Sq. Km) 7,951 53,483 http://www.census2011.co.in/census/state/districtli
st/uttarakhand.html
Percentage share of
State Geographical area
14.87% 100%
Number of Community
Development Blocks
6 95 National Rural Drinking Water Programme, State
Statistics 2012-2013
(http://indiawater.gov.in/IMISReports/NRDWPDistr
ictMain.aspx?IState=035&StName=UTTARAKHA
ND)
Number of Gram
Panchayats
295 7256 National Rural Drinking Water Programme, State
Statistics 2012-2013
(http://indiawater.gov.in/IMISReports/NRDWPDistr
ictMain.aspx?IState=035&StName=UTTARAKHA
ND)
Total number of
inhabited villages
707 16,793 http://www.censusindia.gov.in/2011-prov-
results/paper2/data_files/uttrakhand/8-adminunit-
60-61.pdf
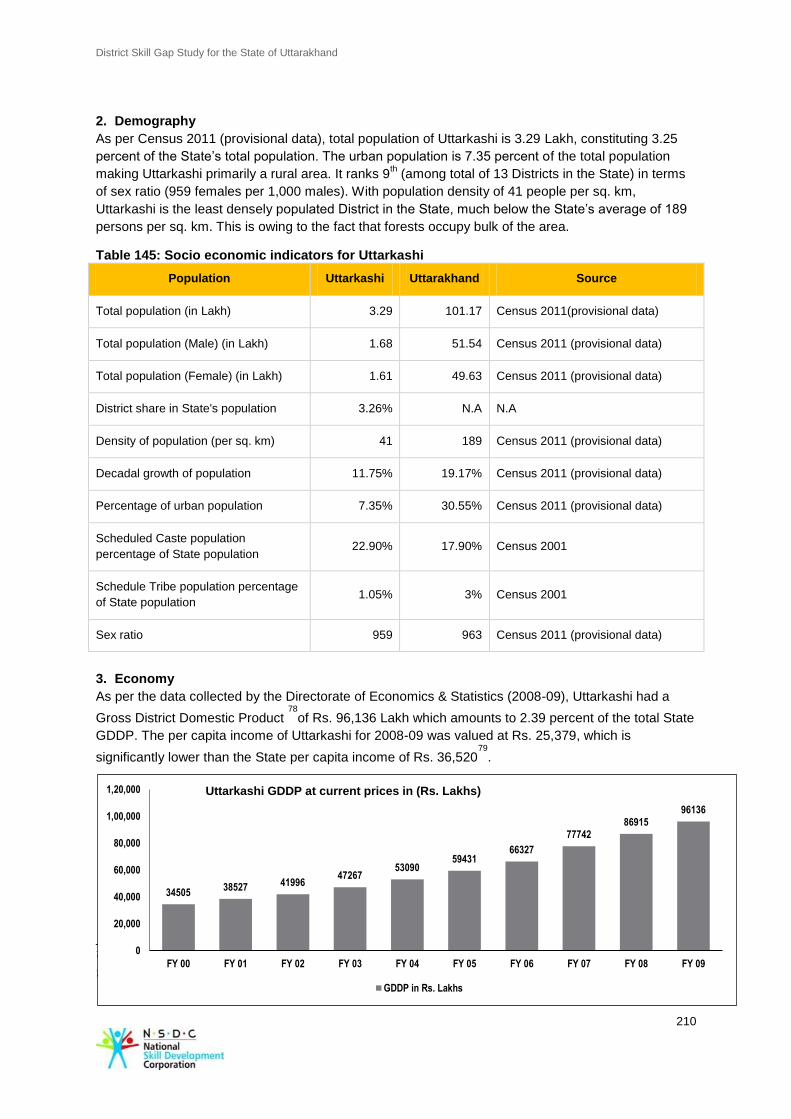
District Skill Gap Study for the State of Uttarakhand
210
2. Demography
As per Census 2011 (provisional data), total population of Uttarkashi is 3.29 Lakh, constituting 3.25
percent of the State’s total population. The urban population is 7.35 percent of the total population
making Uttarkashi primarily a rural area. It ranks 9th (among total of 13 Districts in the State) in terms
of sex ratio (959 females per 1,000 males). With population density of 41 people per sq. km,
Uttarkashi is the least densely populated District in the State, much below the State’s average of 189
persons per sq. km. This is owing to the fact that forests occupy bulk of the area.
Table 145: Socio economic indicators for Uttarkashi
Population Uttarkashi Uttarakhand Source
Total population (in Lakh) 3.29 101.17 Census 2011(provisional data)
Total population (Male) (in Lakh) 1.68 51.54 Census 2011 (provisional data)
Total population (Female) (in Lakh) 1.61 49.63 Census 2011 (provisional data)
District share in State's population 3.26% N.A N.A
Density of population (per sq. km) 41 189 Census 2011 (provisional data)
Decadal growth of population 11.75% 19.17% Census 2011 (provisional data)
Percentage of urban population 7.35% 30.55% Census 2011 (provisional data)
Scheduled Caste population
percentage of State population 22.90% 17.90% Census 2001
Schedule Tribe population percentage
of State population 1.05% 3% Census 2001
Sex ratio 959 963 Census 2011 (provisional data)
3. Economy
As per the data collected by the Directorate of Economics & Statistics (2008-09), Uttarkashi had a
Gross District Domestic Product 78
of Rs. 96,136 Lakh which amounts to 2.39 percent of the total State
GDDP. The per capita income of Uttarkashi for 2008-09 was valued at Rs. 25,379, which is
significantly lower than the State per capita income of Rs. 36,52079
.
78
Statistical Diary, Government of Uttarakhand 79
http://planningcommission.nic.in/plans/stateplan/present/Uttarakhand.pdf
34505 38527 41996
47267 53090
59431 66327
77742 86915
96136
0
20,000
40,000
60,000
80,000
1,00,000
1,20,000
FY 00 FY 01 FY 02 FY 03 FY 04 FY 05 FY 06 FY 07 FY 08 FY 09
Uttarkashi GDDP at current prices in (Rs. Lakhs)
GDDP in Rs. Lakhs
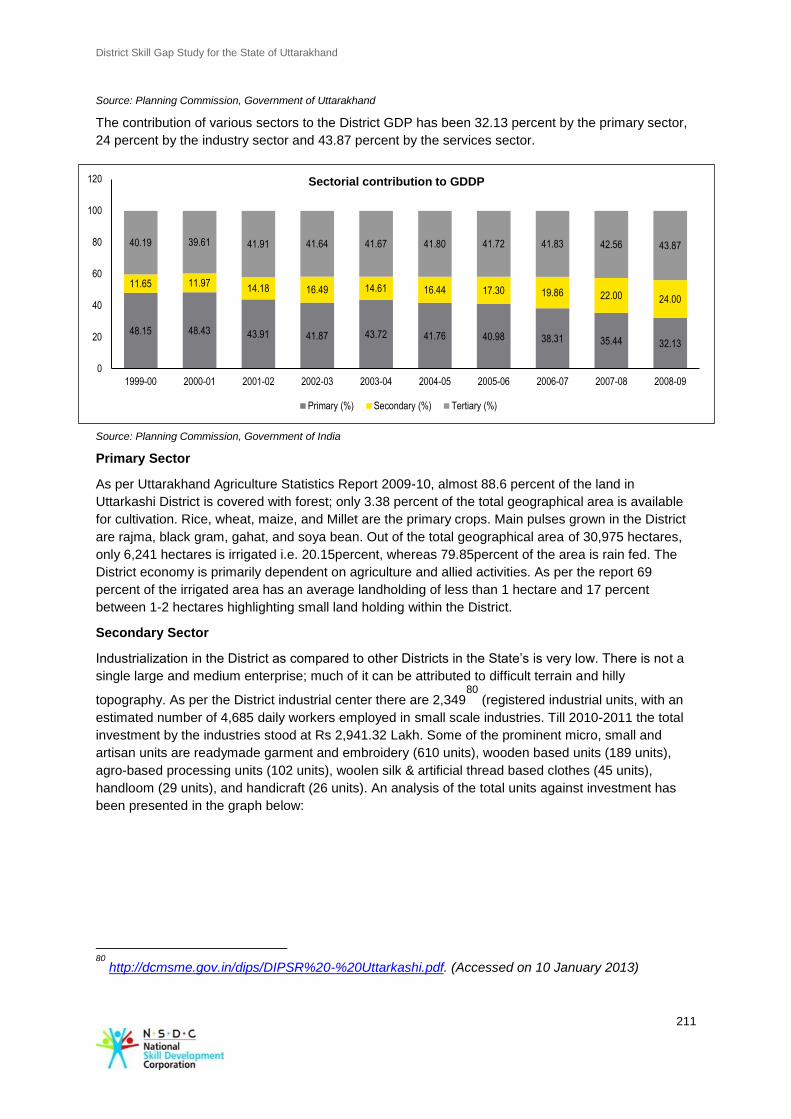
District Skill Gap Study for the State of Uttarakhand
211
Source: Planning Commission, Government of Uttarakhand
The contribution of various sectors to the District GDP has been 32.13 percent by the primary sector,
24 percent by the industry sector and 43.87 percent by the services sector.
Source: Planning Commission, Government of India
Primary Sector
As per Uttarakhand Agriculture Statistics Report 2009-10, almost 88.6 percent of the land in
Uttarkashi District is covered with forest; only 3.38 percent of the total geographical area is available
for cultivation. Rice, wheat, maize, and Millet are the primary crops. Main pulses grown in the District
are rajma, black gram, gahat, and soya bean. Out of the total geographical area of 30,975 hectares,
only 6,241 hectares is irrigated i.e. 20.15percent, whereas 79.85percent of the area is rain fed. The
District economy is primarily dependent on agriculture and allied activities. As per the report 69
percent of the irrigated area has an average landholding of less than 1 hectare and 17 percent
between 1-2 hectares highlighting small land holding within the District.
Secondary Sector
Industrialization in the District as compared to other Districts in the State’s is very low. There is not a
single large and medium enterprise; much of it can be attributed to difficult terrain and hilly
topography. As per the District industrial center there are 2,34980
(registered industrial units, with an
estimated number of 4,685 daily workers employed in small scale industries. Till 2010-2011 the total
investment by the industries stood at Rs 2,941.32 Lakh. Some of the prominent micro, small and
artisan units are readymade garment and embroidery (610 units), wooden based units (189 units),
agro-based processing units (102 units), woolen silk & artificial thread based clothes (45 units),
handloom (29 units), and handicraft (26 units). An analysis of the total units against investment has
been presented in the graph below:
80
http://dcmsme.gov.in/dips/DIPSR%20-%20Uttarkashi.pdf. (Accessed on 10 January 2013)
48.15 48.43 43.91 41.87 43.72 41.76 40.98 38.31 35.44 32.13
11.65 11.97 14.18 16.49 14.61 16.44 17.30 19.86 22.00 24.00
40.19 39.61 41.91 41.64 41.67 41.80 41.72 41.83 42.56 43.87
0
20
40
60
80
100
120
1999-00 2000-01 2001-02 2002-03 2003-04 2004-05 2005-06 2006-07 2007-08 2008-09
Sectorial contribution to GDDP
Primary (%) Secondary (%) Tertiary (%)
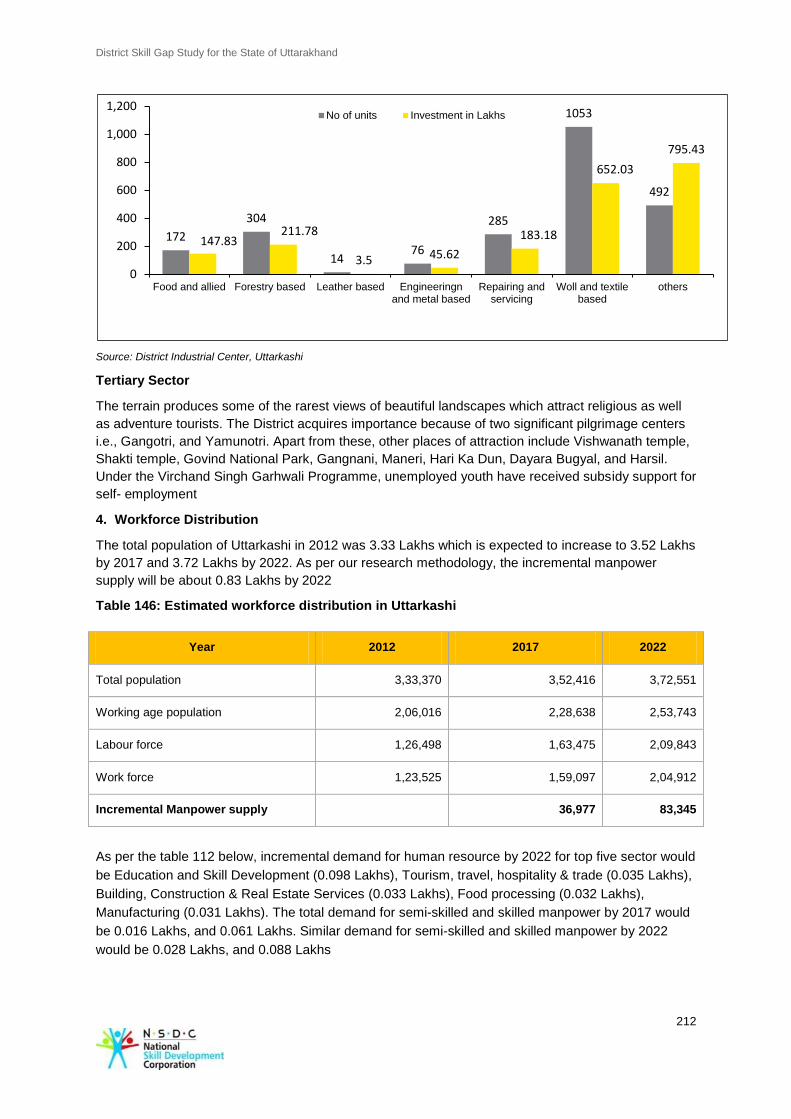
District Skill Gap Study for the State of Uttarakhand
212
Source: District Industrial Center, Uttarkashi
Tertiary Sector
The terrain produces some of the rarest views of beautiful landscapes which attract religious as well
as adventure tourists. The District acquires importance because of two significant pilgrimage centers
i.e., Gangotri, and Yamunotri. Apart from these, other places of attraction include Vishwanath temple,
Shakti temple, Govind National Park, Gangnani, Maneri, Hari Ka Dun, Dayara Bugyal, and Harsil.
Under the Virchand Singh Garhwali Programme, unemployed youth have received subsidy support for
self- employment
4. Workforce Distribution
The total population of Uttarkashi in 2012 was 3.33 Lakhs which is expected to increase to 3.52 Lakhs
by 2017 and 3.72 Lakhs by 2022. As per our research methodology, the incremental manpower
supply will be about 0.83 Lakhs by 2022
Table 146: Estimated workforce distribution in Uttarkashi
Year 2012 2017 2022
Total population 3,33,370 3,52,416 3,72,551
Working age population 2,06,016 2,28,638 2,53,743
Labour force 1,26,498 1,63,475 2,09,843
Work force 1,23,525 1,59,097 2,04,912
Incremental Manpower supply 36,977 83,345
As per the table 112 below, incremental demand for human resource by 2022 for top five sector would
be Education and Skill Development (0.098 Lakhs), Tourism, travel, hospitality & trade (0.035 Lakhs),
Building, Construction & Real Estate Services (0.033 Lakhs), Food processing (0.032 Lakhs),
Manufacturing (0.031 Lakhs). The total demand for semi-skilled and skilled manpower by 2017 would
be 0.016 Lakhs, and 0.061 Lakhs. Similar demand for semi-skilled and skilled manpower by 2022
would be 0.028 Lakhs, and 0.088 Lakhs
172
304
14 76
285
1053
492
147.83 211.78
3.5 45.62
183.18
652.03
795.43
0
200
400
600
800
1,000
1,200
Food and allied Forestry based Leather based Engineeringnand metal based
Repairing andservicing
Woll and textilebased
others
No of units Investment in Lakhs
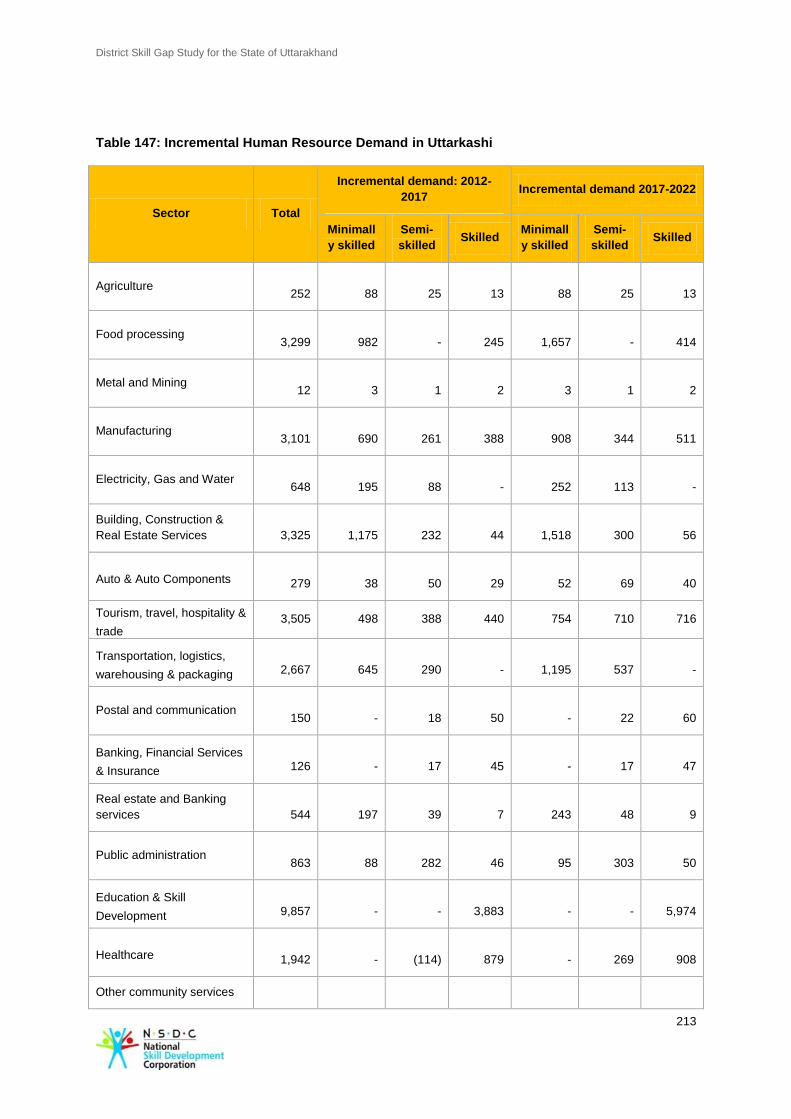
District Skill Gap Study for the State of Uttarakhand
213
Table 147: Incremental Human Resource Demand in Uttarkashi
Sector Total
Incremental demand: 2012-
2017 Incremental demand 2017-2022
Minimall
y skilled
Semi-
skilled Skilled
Minimall
y skilled
Semi-
skilled Skilled
Agriculture
252
88
25
13
88
25
13
Food processing
3,299
982
-
245
1,657
-
414
Metal and Mining
12
3
1
2
3
1
2
Manufacturing
3,101
690
261
388
908
344
511
Electricity, Gas and Water
648
195
88
-
252
113
-
Building, Construction &
Real Estate Services
3,325
1,175
232
44
1,518
300
56
Auto & Auto Components
279
38
50
29
52
69
40
Tourism, travel, hospitality &
trade 3,505 498 388 440 754 710 716
Transportation, logistics,
warehousing & packaging
2,667
645
290
-
1,195
537
-
Postal and communication
150
-
18
50
-
22
60
Banking, Financial Services
& Insurance
126
-
17
45
-
17
47
Real estate and Banking
services
544
197
39
7
243
48
9
Public administration
863
88
282
46
95
303
50
Education & Skill
Development
9,857
-
-
3,883
-
-
5,974
Healthcare
1,942
-
(114)
879
-
269
908
Other community services
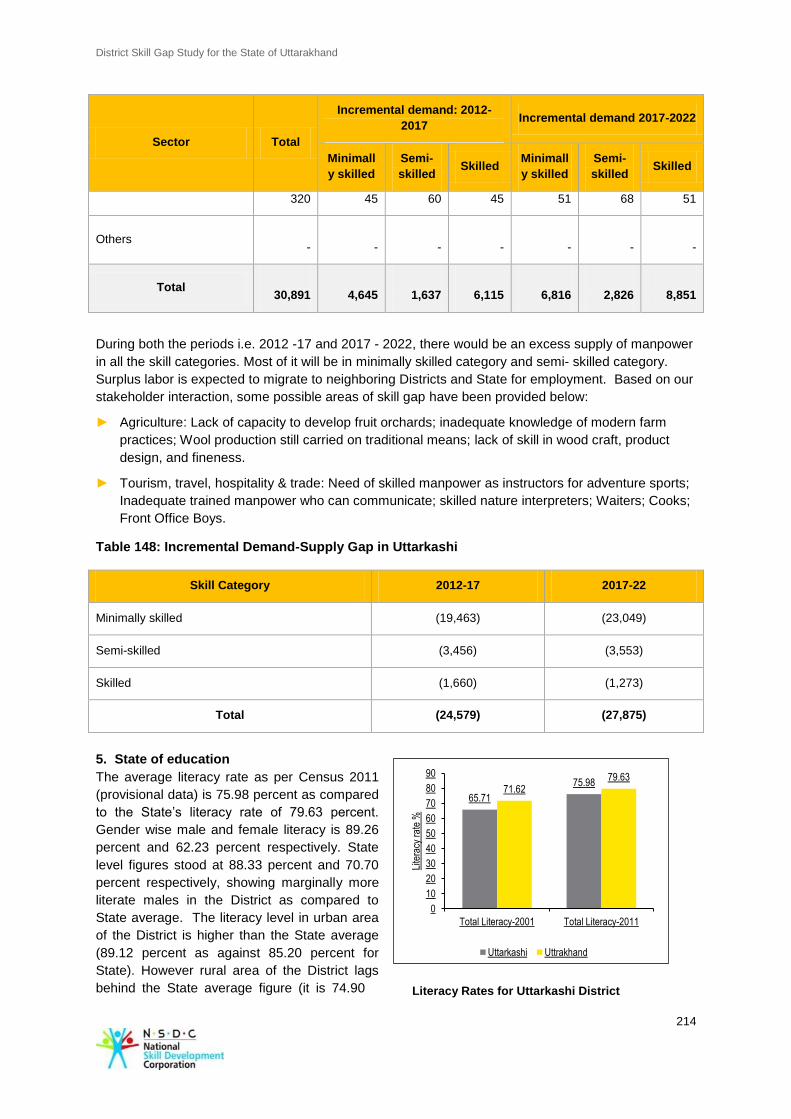
District Skill Gap Study for the State of Uttarakhand
214
Literacy Rates for Uttarkashi District
Sector Total
Incremental demand: 2012-
2017 Incremental demand 2017-2022
Minimall
y skilled
Semi-
skilled Skilled
Minimall
y skilled
Semi-
skilled Skilled
320 45 60 45 51 68 51
Others
-
-
-
-
-
-
-
Total
30,891
4,645
1,637
6,115
6,816
2,826
8,851
During both the periods i.e. 2012 -17 and 2017 - 2022, there would be an excess supply of manpower
in all the skill categories. Most of it will be in minimally skilled category and semi- skilled category.
Surplus labor is expected to migrate to neighboring Districts and State for employment. Based on our
stakeholder interaction, some possible areas of skill gap have been provided below:
► Agriculture: Lack of capacity to develop fruit orchards; inadequate knowledge of modern farm
practices; Wool production still carried on traditional means; lack of skill in wood craft, product
design, and fineness.
► Tourism, travel, hospitality & trade: Need of skilled manpower as instructors for adventure sports;
Inadequate trained manpower who can communicate; skilled nature interpreters; Waiters; Cooks;
Front Office Boys.
Table 148: Incremental Demand-Supply Gap in Uttarkashi
Skill Category 2012-17 2017-22
Minimally skilled (19,463) (23,049)
Semi-skilled (3,456) (3,553)
Skilled (1,660) (1,273)
Total (24,579) (27,875)
5. State of education
The average literacy rate as per Census 2011
(provisional data) is 75.98 percent as compared
to the State’s literacy rate of 79.63 percent.
Gender wise male and female literacy is 89.26
percent and 62.23 percent respectively. State
level figures stood at 88.33 percent and 70.70
percent respectively, showing marginally more
literate males in the District as compared to
State average. The literacy level in urban area
of the District is higher than the State average
(89.12 percent as against 85.20 percent for
State). However rural area of the District lags
behind the State average figure (it is 74.90
65.71
75.98 71.62
79.63
0
10
20
30
40
50
60
70
80
90
Total Literacy-2001 Total Literacy-2011
Lite
racy
rat
e %
Uttarkashi Uttrakhand
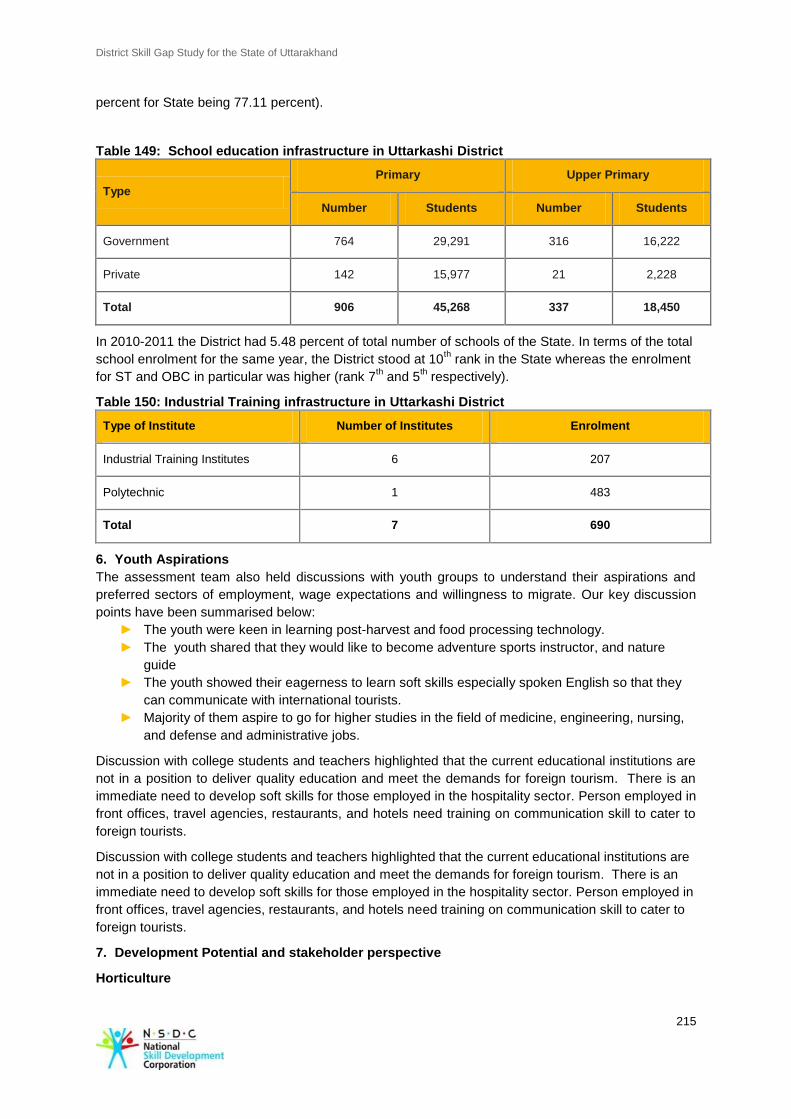
District Skill Gap Study for the State of Uttarakhand
215
percent for State being 77.11 percent).
Table 149: School education infrastructure in Uttarkashi District
Type
Primary Upper Primary
Number Students Number Students
Government 764 29,291 316 16,222
Private 142 15,977 21 2,228
Total 906 45,268 337 18,450
In 2010-2011 the District had 5.48 percent of total number of schools of the State. In terms of the total
school enrolment for the same year, the District stood at 10th rank in the State whereas the enrolment
for ST and OBC in particular was higher (rank 7th and 5
th respectively).
Table 150: Industrial Training infrastructure in Uttarkashi District
Type of Institute Number of Institutes Enrolment
Industrial Training Institutes 6 207
Polytechnic 1 483
Total 7 690
6. Youth Aspirations
The assessment team also held discussions with youth groups to understand their aspirations and
preferred sectors of employment, wage expectations and willingness to migrate. Our key discussion
points have been summarised below:
► The youth were keen in learning post-harvest and food processing technology.
► The youth shared that they would like to become adventure sports instructor, and nature
guide
► The youth showed their eagerness to learn soft skills especially spoken English so that they
can communicate with international tourists.
► Majority of them aspire to go for higher studies in the field of medicine, engineering, nursing,
and defense and administrative jobs.
Discussion with college students and teachers highlighted that the current educational institutions are
not in a position to deliver quality education and meet the demands for foreign tourism. There is an
immediate need to develop soft skills for those employed in the hospitality sector. Person employed in
front offices, travel agencies, restaurants, and hotels need training on communication skill to cater to
foreign tourists.
7. Development Potential and stakeholder perspective
Horticulture
District Skill Gap Study for the State of Uttarakhand
216
Horticulture seems to have potential in the light of limited growth and development in agriculture
related activities. Uttarkashi is located at an altitude of 1200 meters and is ideal for growing fruits like
apples, oranges, pears, litchi’s, plums and walnuts. Out of the 6 sub-divisions, Nawgaon sub-division
is famous for its apples all over the country. It produces three varieties of apple i.e. Royal Delicious,
Golden Delicious, and Red Delicious. The production of apple in the District has increased from
31,000 metric ton in 2009-2010 to 45,203 metric ton in 2010-2011. Even the cropped area for apple
has increased from 7,509 hectares in 2009-2010 to 7,714 hectares in 2010-2011. Farmers in the
District have showed great interest but lack necessary capacity and training to scale up apple
orchards. With adequate training and technical inputs on apple farming, this sector has potential to
generate large scale employment in the District
Uttarkashi has the highest the number of sheep in the State’s. Sheep rearing for meat and wool
products are the alternatives to traditional farming in the District. District industrial representative
suggested that there is huge potential for developing wool based enterprise in the Dhunda.
Traditionally sheep rearing is carried by the Bhotia community, a predominantly nomadic tribe in
Uttarakhand. Currently, the sheep are sheared locally without using any carding and cleaning
machine. The entire production is done manually with little mechanization. Upon discussion with local
industry representatives it was highlighted that there is shortage of skilled labor force and use of
appropriate technology. As a result the final products produced by the wool enterprise lack finesse
and design and also highlighted the need improvement for better marketability and sale in the open
market. In this regard the DIC had organized a skill based training programme in collaboration with
National Institute of Design.
District Industrial Center has suggested setting up the following industries based on factor
endowments such as abundance of forest, medicinal plants, large number of sheep’s, and interest of
the rural communities which includes development of medicinal based raw material collection and
processing center in Bhatwadi and Navgaon; readymade garments and wool based products
enterprise in Dhunda.
Forestry and allied sector
With the immense forest coverage in Uttarkashi, there is huge potential for the development of forest
resources based industry, while taking due care to maintain the ecological balance and compliance
with laws relating to forest conservation and environmental protection. Industries that can be
promoted are wood carvings, furniture, and ply board, products from agro-waste, craft work from
ringal (dwarf bamboo). In addition there is enormous scope to develop industries based on Non-
Timber Forest Produce (NTFP), forest rasin and fiber. General Manager, DIC shared his concern over
the current institutional arrangement for furniture based industry. Currently, it is banned to produce
furniture based products directly in the District. Instead it is transported to Rishikesh and auctioned,
and gets transported back to the District. This increases the cost of the product considerably and
affects the buying behavior of consumers. Action should be taken to reverse the trade process to
encourage furniture based artisan in the District. Possible skill development areas include in product
design and development of market linkages.
Services and allied sector
“Veer Chand Garhwali Programme” has been a successful self-employment model for generating
employment in the tourism sector. Tourism representative from the District suggested increasing the
budget amount to increase its outreach and promote employment in the District. There is also a need
to develop manpower and hold capacity development programmes.
Our interaction with the District Tourism Board representatives highlighted the need for following:
► Need for skilled manpower as instructors for various types of adventure sports. Currently, either
they have to outsource skilled manpower from Himachal Pradesh;
► The District does not provide adequate infrastructure support for adventure sports like rock
District Skill Gap Study for the State of Uttarakhand
217
climbing, river rafting, parasailing, and snow skiing
Also with the presence of Nehru Institute of Mountaineering in the District, there is huge potential for
growth in adventure tourism.
Based on our interaction with various stakeholders, some key areas which provide skill development
opportunity have been provided in the table below:
Table 151: Sectors and skill requirement
Sector Skill Requirements
Primary With limited scope in agriculture due to small land holdings, agro based and food
processing industry has potential for growth. Relevant skills are required in
horticulture development, and use of modern cultivation techniques to improve
productivity.
Secondary Wool based industry, food and agro- food processing industries has growth
potential. Large sections of the population are involved in sheep breeding and
production of wool. Wool industry needs to be developed in an integrated
manner. Skill development on wool processing and designing of wool based
products is required.
Tertiary Religious and adventure tourism forms the main activity of the District economy.
Improvement in adventure tourism infrastructure would give rise to demand for a
number of services like sports instructors, hotels, restaurants, and transportation
related services. Existing educational and ITI institutes needs to be strengthened
keeping in view the need for skilled manpower to cater for tourism and hospitality
related services.
8. Recommendations
Government ► Promote tourism in the district by developing new tourist spots and
marketing its existing tourist attractions.
► Upgraded ITI and Polytechnic infrastructure including course restructuring
so that the youth can find employment in SIDCUL and neighboring State.
NSDC ► NSDC can focus on promoting skilling of local artisans involved in hosiery,
designing woolen garments, shawls, wooden craft so that the products can
be sold in domestic as well as international market.
► Promote skilling on agro and food processing technology as the District has
huge number of food processing micro and small enterprises.
Industry ► Industries should explore possibilities of setting up food processing units as
the District produces good variety of apples, oranges, pears, litchi’s, plumps,
and walnut.
► Forest resource based industries should set up institutional arrangements
with the Forest Department to promote wood based craft.
Vocational Training
Providers
► VTC can provide the local farmer families, training on the latest techniques
for growing fruits, flowers and vegetables and managing nurseries and
orchard's.
► Provide training on computer skills especially Microsoft Office and basic
hardware infrastructure awareness.
► Provide training on soft skills to cater to Domestic as well as International
tourist.
► VTC can set up short term training courses to develop Para instructors for
adventure sports.
► VTC can provide short term courses on BPO and KPO so that youth can find
employment in the back office of IT companies.

District Skill Gap Study for the State of Uttarakhand
218
District Skill Gap Study for the State of Uttarakhand
219
1. Annexure I: List of Respondents
Almora
1. Mr. Chanar Ram, District Magistrate, Almora;
2. Mr. Shankar, Chief Development Officer, Almora;
3. Dr. K. K. Joshi, Chief Veterinary Officer, Almora;
4. Dr. Arya, Horticulture Department, Almora;
5. Dr. Abhay Saxena, Chief Agriculture Officer, Almora;
6. Ms. Latika Singh, Agriculture and Soil Conservation Officer, Almora;
7. Ms. Kavita Rani, General Manager, District Industries Centre
8. Mr. GS. Tilara, Industrial Training Institute, Almora.
Bageshwar
9. Mr. Roshan Lal, CDO, Bageshwar;
10. DR. Ila Panth, Officer, DSTO, Bageshwar;
11. Mr. Veer Singh, Assistant Engineer, DRDA, Bageshwar;
12. Mr. Rajendra Kumar Panth, District Employment Officer, Employment Office, Bageshwar;
13. Mr. Raveen Pant, LDM, State Bank of India, Bageshwar;
14. Mr. B.C Pathak, DIC, Bageshwar;
Chamoli
15. Mr. Mohinder Singh Tomar, CDO
16. Mr. Shikhar Saxena, General Manager, DIC
17. Mr. Kishore, LDM
18. Mr. Abhinav Nautiyal, District Agriculture Officer
19. Mr. Ramesh Tiwari, Manager, Mangalamaya Hotel
Champawat
20. Mr. Mohindar Singh Tomar, CDO Collector, Champawat;
21. Mr. Shikhar Saxena, General Manager DIC, Champawat;
22. Mr. Kishore, LDM, State Bank of India, Champawat;
23. Mr. Abhinav Nautiyal, DAO, Agriculture Office, Champawat;
Dehradun
24. Mr. R.S. Tolia, ex-Chief Secretary Uttarakhand
25. Mr. Om Prakash Gupta, Principal Secretary, Agriculture & Horticulture, Dehradun
26. Mr. S.S. Sandhu, Principal Secretary, Tourism & Energy, Dehradun;
27. Mr. Shailesh Bagauli, Additional Secretary Technical Education, Dehradun
28. Mr. Purshottam Kumar, District Magistrate, Dehradun;
29. M r. A. K. Tripathi, Principal ITI Niranjanpur, Dehradun;
30. Mr. Y. S. Pantgi, Director, Directorate of Economics and Statistics, Dehradun;
31. Mr. Arun Kumar Daundiyal, CEO, Animal Husbandry Board, Dehradun;
32. Mr. D.S. Bagri, GMDIC, Dehradun;
33. Mr. Brijesh Kumar, Statistician, Directorate of Economics and Statistics, Dehradun;
34. Mr. Pankaj Sharma, Supervisor- MIS, Directorate of School Education, Dehradun;
35. Mr. Pankaj Nathani, Joint Director, Directorate of Economics and Statistics, Dehradun;
36. Mr. Kolatri, Assistant Labor Commissioner, Labor Department, Dehradun;
37. Mr. Ramesh Patwal, Director, IL&FS Skills School, Dehradun;
38. Mr. Pawan, CCF-IFAD Project, Dehradun;
39. Mr. D.C. Gupta, Principal, Government Polytechnic, Dehradun;
40. Mr. Binita Shah, Organic Commodity Board, Dehradun;
District Skill Gap Study for the State of Uttarakhand
220
41. Mr. Rakesh Jain, Director, CMI Hospital, Dehradun;
42. Mr. Lepcha, PCCF Forest Conservation, Dehradun;
43. Mr. Anil Taneja, Director PHD Chambers, Dehradun;
44. Dr. Kamal, Livestock Board, Dehradun;
45. Mr. Bhaskar Pant, NABARD, Dehradun;
46. Mr. K.N. Sharma, Company Secretary, Garhwal Mandal Vikas Nigam Ltd., Dehradun;
47. Mr. Anil Joshi, HEFCO, Dehradun;
Haridwar
48. Mr. Sachin Kurle, District Magistrate, Haridwar;
49. Mr. J.P. Tiwari, Chief Agriculture Officer, Haridwar;
50. Mr. Harendar Garg, Managing Director/ Chairman Haridwar Industries Association, Cello
Houseware, Haridwar;
51. Mr. Hemant Tiwari, AGM, NABARD, Haridwar;
52. Mr. M. S. Sajjwan, Principal ITI, Jagjitpur, Haridwar;
53. Mr. K.C. Joshi, Project Director DRDA, Haridwar;
54. Ms. Kaushalya Bandhu, GMDIC, Haridwar;
55. Mr. R.K. Asthana, DSTO, Statistics Department, Haridwar;
56. Mr. Uttam Kumar, Employment Officer, Employment Exchange, Haridwar;
Nainital
57. Mr. Anand Bardhan, District Magistrate, Nainital
58. Mr. P.K. Srivastava, HMT Watches, Nainital;
59. Mr. Choudhary, NABARD, Nainital;
60. Mr. Wadhawan, General Manager, Manu Maharani Hotel, Nainital;
61. Mr. Akshay Chaudhary ,DRDA, Nainital;
Pauri Garhwal
62. Ms. Ravneet Cheema, Associate District Magistrate(ADM), Pauri Garhwal;
63. Mr. Mukesh Riyal, Employment Exchange Officer, District Employment Exchange, Pauri
Garhwal;
64. Mr. Negi, DDM, NABARD, Pauri Garhwal;
65. Mr. Bhandari, District Information Officer, Pauri Garhwal;
66. Mr. Dipendra, Chief Development Officer, Pauri Garhwal;
67. Ms. Chitra Singh, District Statistical Officer, Directorate of Economics and Statistics, Pauri
Garhwal;
68. Mr. Joshi, General Manager, District Industries Centre, Pauri Garhwal;
69. Mr. Bharat Dutt, Manager Operations, WIPRO, Pauri Garhwal;
Pithoragarh
70. Mr. B.L Rana, ADM Collector, Pithoragarh;
71. Mr. Naresh Kumar, Project Director, DSTO, Pithoragarh;
72. Md. Nazim, DRDA, Pithoragarh;
73. Mr. Lalit Mohan Shah, Officer DIC, Pithoragarh;
74. Mr. Vikas Bhatt, LDM, State Bank of India, Pithoragarh;
75. Mr. D. Kumar, DAO, Pithoragarh;
Rudraprayag
76. Mr. Navneet Pandey, ADM Collector, Rudraprayag;
77. Mr. Anupam Drivedi, District Economic & Statistical officer, DSTO,DIC, Rudraprayag;
78. Mr. Kapil Pandey, District Employment officer, Employment Office, Rudraprayag;
District Skill Gap Study for the State of Uttarakhand
221
79. Ms. Tamta, LDM, State Bank of India, Rudraprayag;
80. Mr. Negi, DRDA, Rudraprayag;
Tehri Garhwal
81. Mr. R. S. Rawat, District Development Officer, Tehri Garhwal;
82. Mr. R.S. Negi, PA to DDO, Tehri Garhwal;
83. Mr. Neeraj Gupta, District Welfare Officer, Tehri Garhwal;
84. Mr. A. K. Singh, School Principal, Tehri Garhwal;
85. Ms. Manju Kaushik, Principal Girls Inter College, Tehri Garhwal;
86. Mr. P.C. Uniyal, Principal ITI , Tehri Garhwal;
87. Mr. Jaspal Chouhan, Tourism Officer, Tehri Garhwal;
88. Mr. Mritunjay Singh, GMDIC, Tehri Garhwal;
89. Ms. Mamta Negi, Employment Officer, Employment Exchange, Tehri Garhwal;
90. Mr. Manish Ran, DSTO, Statistics Department, Tehri Garhwal;
Uttarkashi
91. Dr. Rajesh Kumar, District Magistrate, Uttarkashi;
92. Mr. Prakash Rawat, District Development Officer, Uttarkashi;
93. Mr. B. P. Uniyal, Upper District Agriculture Officer, Uttarkashi;
94. Mr. N. Bahuguna, Assistant Agriculture Officer, Uttarkashi;
95. Mr. B.S. Rawat, Accountant, DRDA, Uttarkashi;
96. Mr. S. C. Garg, Assistant General Manager, NABARD, Uttarkashi;
97. Mr. Dinesh Kumar, Chief Agriculture Officer, Uttarkashi;
98. Mr. B. K. Pokhriyal, Mukhay Sahayak, Tourism Department, Uttarkashi;
99. Mr. Amit Kumar, Fisheries Inspector, Uttarkashi;
100. Mr. R. N. Naitiyal, Fisheries Inspector, Uttarkashi;
101. Mr. G.M. Bahuguna, Assistant Manager DIC, Uttarkashi;
102. Mr. Bhanu Prakash Dangwal, Employment Exchange, Uttarkashi;
103. Mr. M.S. Sajwan, GMDIC, Uttarkashi;
Udham Singh Nagar
104. Mr. D.S. Garbyal, Chief Development Officer, Udham Singh Nagar;
105. Ms. Anubha Jain, Employment Exchange Officer, Employment Exchange, Udham Singh
Nagar;
106. Mr. P.R. Arya, General Manager, District Industries Centre, Udham Singh Nagar;
107. Mr. H.R. Nautiyal, General Manager, SIDCUL, Udham Singh Nagar;
108. Mr. Darbara Singh, President KGCCI, Udham Singh Nagar;
109. Mr. P.K. Singh, Chief Agriculture Officer, District Agriculture Department, Udham Singh
Nagar;
110. Mr. Anwar Ali, Head of Department (Fitter), Industrial Training Institute Dinseshpur, Udham
Singh Nagar;
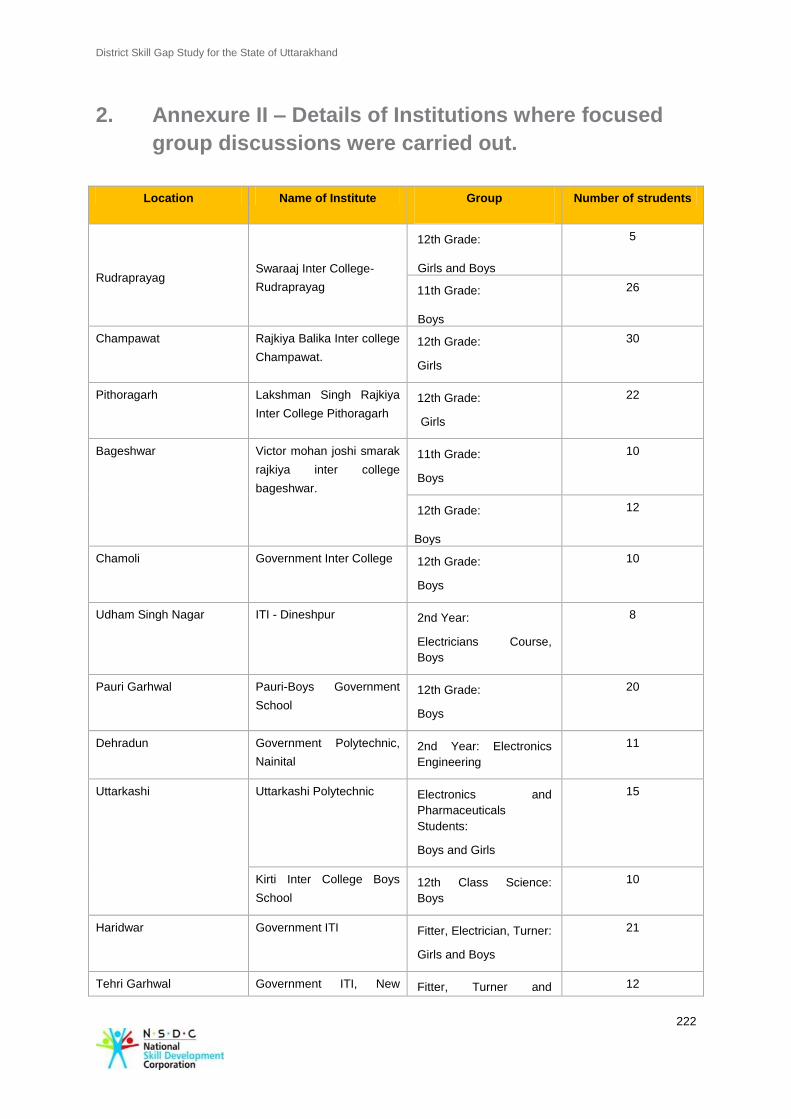
District Skill Gap Study for the State of Uttarakhand
222
2. Annexure II – Details of Institutions where focused
group discussions were carried out.
Location Name of Institute Group
Number of strudents
Rudraprayag Swaraaj Inter College-
Rudraprayag
12th Grade:
Girls and Boys
5
11th Grade:
Boys
26
Champawat Rajkiya Balika Inter college
Champawat.
12th Grade:
Girls
30
Pithoragarh Lakshman Singh Rajkiya
Inter College Pithoragarh
12th Grade:
Girls
22
Bageshwar Victor mohan joshi smarak
rajkiya inter college
bageshwar.
11th Grade:
Boys
10
12th Grade:
Boys
12
Chamoli Government Inter College 12th Grade:
Boys
10
Udham Singh Nagar ITI - Dineshpur 2nd Year:
Electricians Course,
Boys
8
Pauri Garhwal Pauri-Boys Government
School
12th Grade:
Boys
20
Dehradun Government Polytechnic,
Nainital
2nd Year: Electronics
Engineering
11
Uttarkashi Uttarkashi Polytechnic Electronics and
Pharmaceuticals
Students:
Boys and Girls
15
Kirti Inter College Boys
School
12th Class Science:
Boys
10
Haridwar Government ITI Fitter, Electrician, Turner:
Girls and Boys
21
Tehri Garhwal Government ITI, New Fitter, Turner and 12
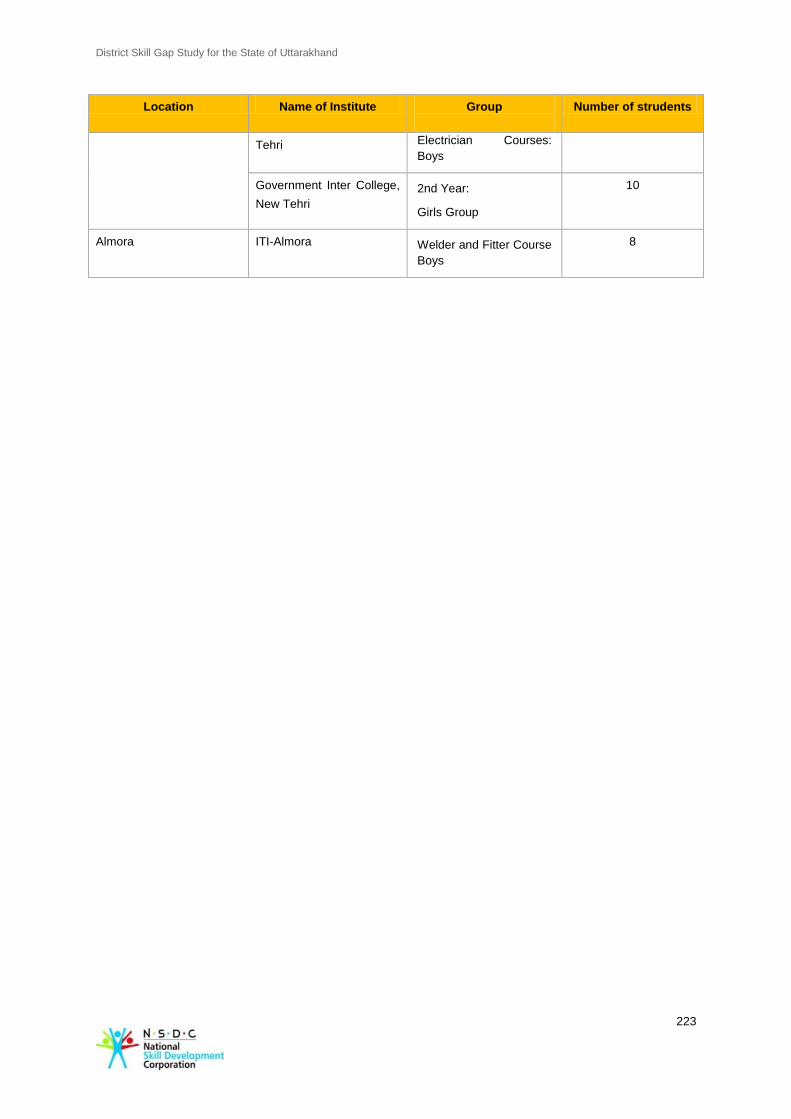
District Skill Gap Study for the State of Uttarakhand
223
Location Name of Institute Group
Number of strudents
Tehri Electrician Courses:
Boys
Government Inter College,
New Tehri
2nd Year:
Girls Group
10
Almora ITI-Almora Welder and Fitter Course
Boys
8
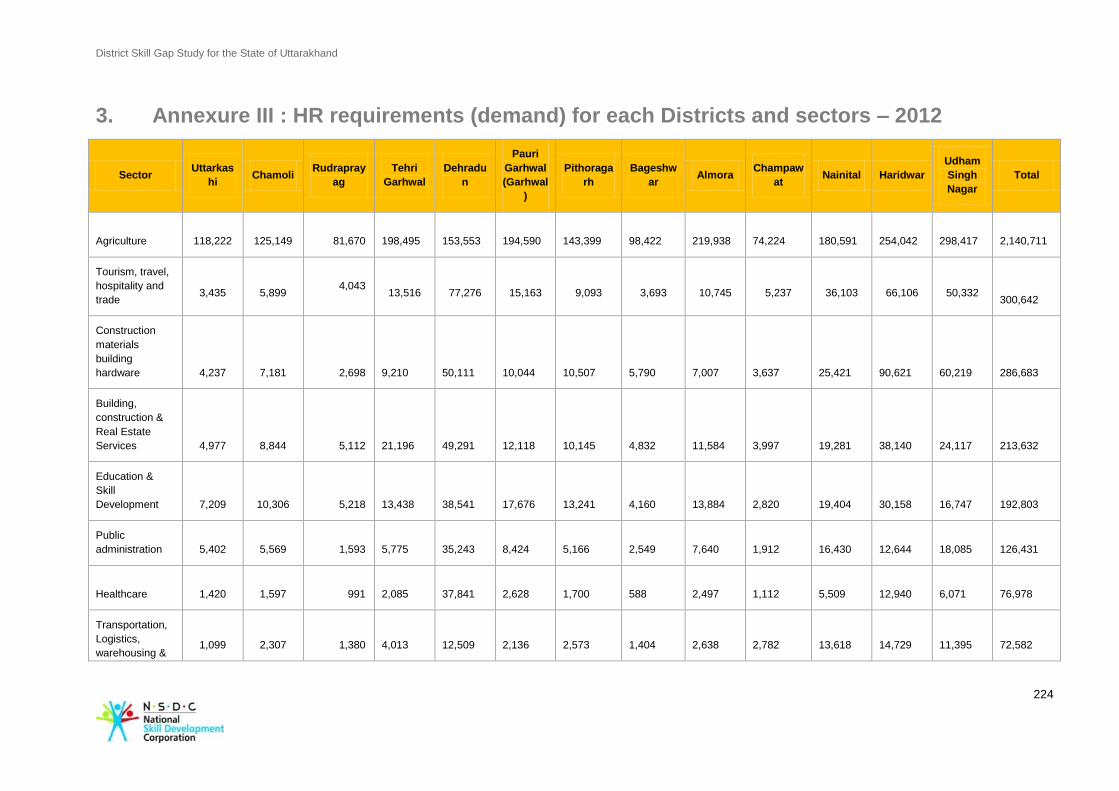
District Skill Gap Study for the State of Uttarakhand
224
3. Annexure III : HR requirements (demand) for each Districts and sectors – 2012
Sector Uttarkas
hi Chamoli
Rudrapray
ag
Tehri
Garhwal
Dehradu
n
Pauri
Garhwal
(Garhwal
)
Pithoraga
rh
Bageshw
ar Almora
Champaw
at Nainital Haridwar
Udham
Singh
Nagar
Total
Agriculture
118,222
125,149 81,670
198,495
153,553
194,590
143,399
98,422
219,938
74,224
180,591
254,042
298,417
2,140,711
Tourism, travel,
hospitality and
trade
3,435
5,899 4,043
13,516
77,276
15,163
9,093
3,693
10,745
5,237
36,103
66,106
50,332
300,642
Construction
materials
building
hardware
4,237
7,181 2,698
9,210
50,111
10,044
10,507
5,790
7,007
3,637
25,421
90,621
60,219
286,683
Building,
construction &
Real Estate
Services
4,977
8,844 5,112
21,196
49,291
12,118
10,145
4,832
11,584
3,997
19,281
38,140
24,117
213,632
Education &
Skill
Development
7,209
10,306 5,218
13,438
38,541
17,676
13,241
4,160
13,884
2,820
19,404
30,158
16,747
192,803
Public
administration
5,402
5,569 1,593
5,775
35,243
8,424
5,166
2,549
7,640
1,912
16,430
12,644
18,085
126,431
Healthcare
1,420
1,597 991
2,085
37,841
2,628
1,700
588
2,497
1,112
5,509
12,940
6,071
76,978
Transportation,
Logistics,
warehousing &
1,099
2,307 1,380
4,013
12,509
2,136
2,573
1,404
2,638
2,782
13,618
14,729
11,395
72,582
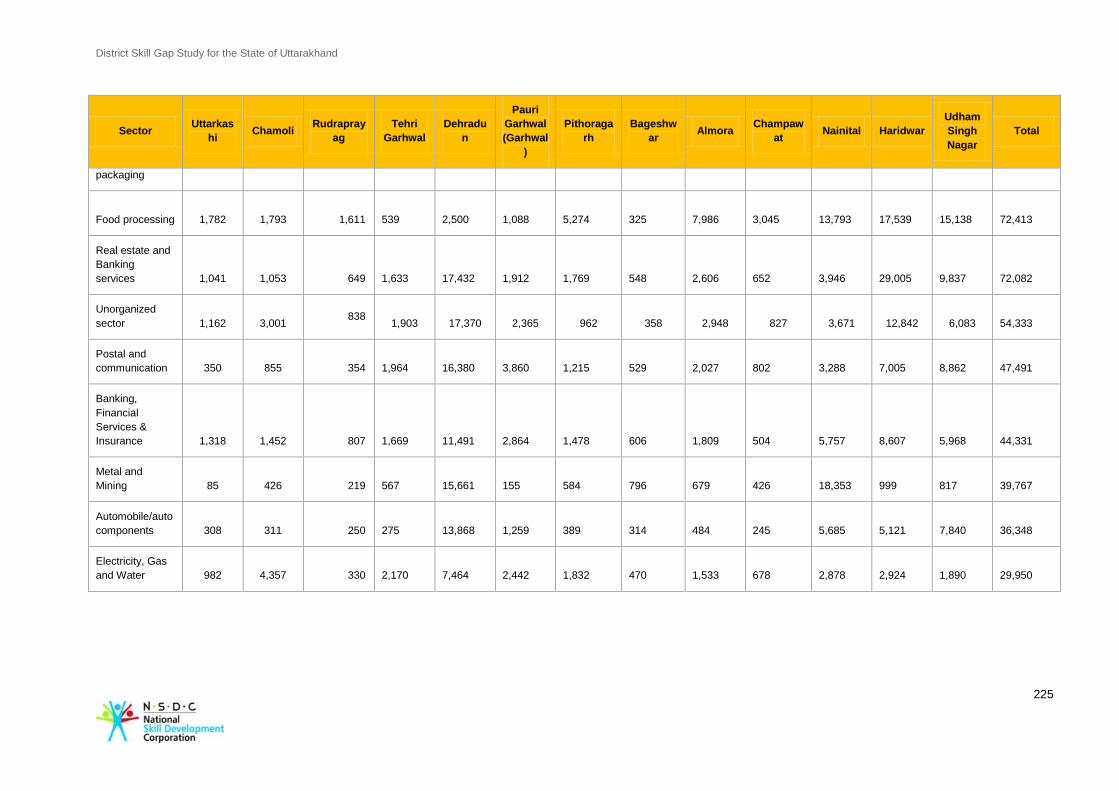
District Skill Gap Study for the State of Uttarakhand
225
Sector Uttarkas
hi Chamoli
Rudrapray
ag
Tehri
Garhwal
Dehradu
n
Pauri
Garhwal
(Garhwal
)
Pithoraga
rh
Bageshw
ar Almora
Champaw
at Nainital Haridwar
Udham
Singh
Nagar
Total
packaging
Food processing
1,782
1,793 1,611
539
2,500
1,088
5,274
325
7,986
3,045
13,793
17,539
15,138
72,413
Real estate and
Banking
services
1,041
1,053 649
1,633
17,432
1,912
1,769
548
2,606
652
3,946
29,005
9,837
72,082
Unorganized
sector
1,162
3,001 838
1,903
17,370
2,365
962
358
2,948
827
3,671
12,842
6,083
54,333
Postal and
communication
350
855 354
1,964
16,380
3,860
1,215
529
2,027
802
3,288
7,005
8,862
47,491
Banking,
Financial
Services &
Insurance
1,318
1,452 807
1,669
11,491
2,864
1,478
606
1,809
504
5,757
8,607
5,968
44,331
Metal and
Mining
85
426 219
567
15,661
155
584
796
679
426
18,353
999
817
39,767
Automobile/auto
components
308
311 250
275
13,868
1,259
389
314
484
245
5,685
5,121
7,840
36,348
Electricity, Gas
and Water
982
4,357 330
2,170
7,464
2,442
1,832
470
1,533
678
2,878
2,924
1,890
29,950
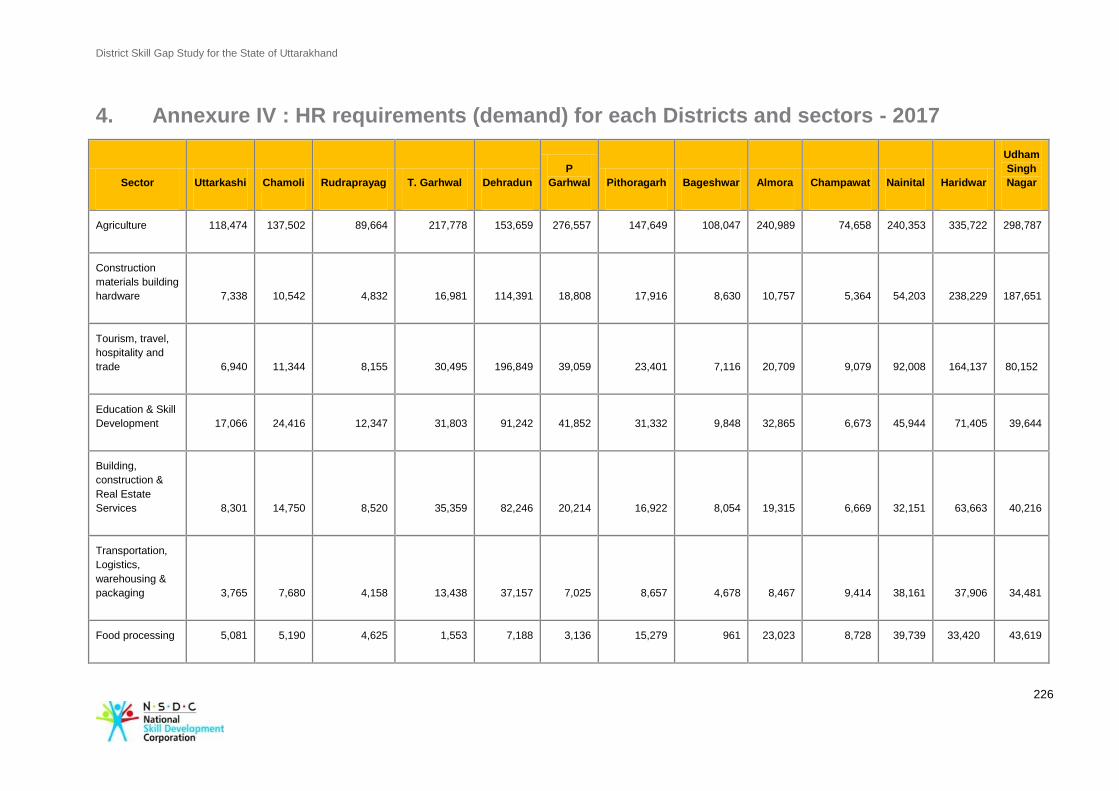
District Skill Gap Study for the State of Uttarakhand
226
4. Annexure IV : HR requirements (demand) for each Districts and sectors - 2017
Sector Uttarkashi Chamoli Rudraprayag T. Garhwal Dehradun
P
Garhwal Pithoragarh Bageshwar Almora Champawat Nainital Haridwar
Udham
Singh
Nagar
Agriculture 118,474 137,502 89,664 217,778 153,659 276,557 147,649 108,047 240,989 74,658 240,353 335,722 298,787
Construction
materials building
hardware 7,338 10,542 4,832 16,981 114,391 18,808 17,916 8,630 10,757 5,364 54,203 238,229 187,651
Tourism, travel,
hospitality and
trade 6,940 11,344 8,155 30,495 196,849 39,059 23,401 7,116 20,709 9,079 92,008 164,137 80,152
Education & Skill
Development 17,066 24,416 12,347 31,803 91,242 41,852 31,332 9,848 32,865 6,673 45,944 71,405 39,644
Building,
construction &
Real Estate
Services 8,301 14,750 8,520 35,359 82,246 20,214 16,922 8,054 19,315 6,669 32,151 63,663 40,216
Transportation,
Logistics,
warehousing &
packaging 3,765 7,680 4,158 13,438 37,157 7,025 8,657 4,678 8,467 9,414 38,161 37,906 34,481
Food processing 5,081 5,190 4,625 1,553 7,188 3,136 15,279 961 23,023 8,728 39,739 33,420 43,619
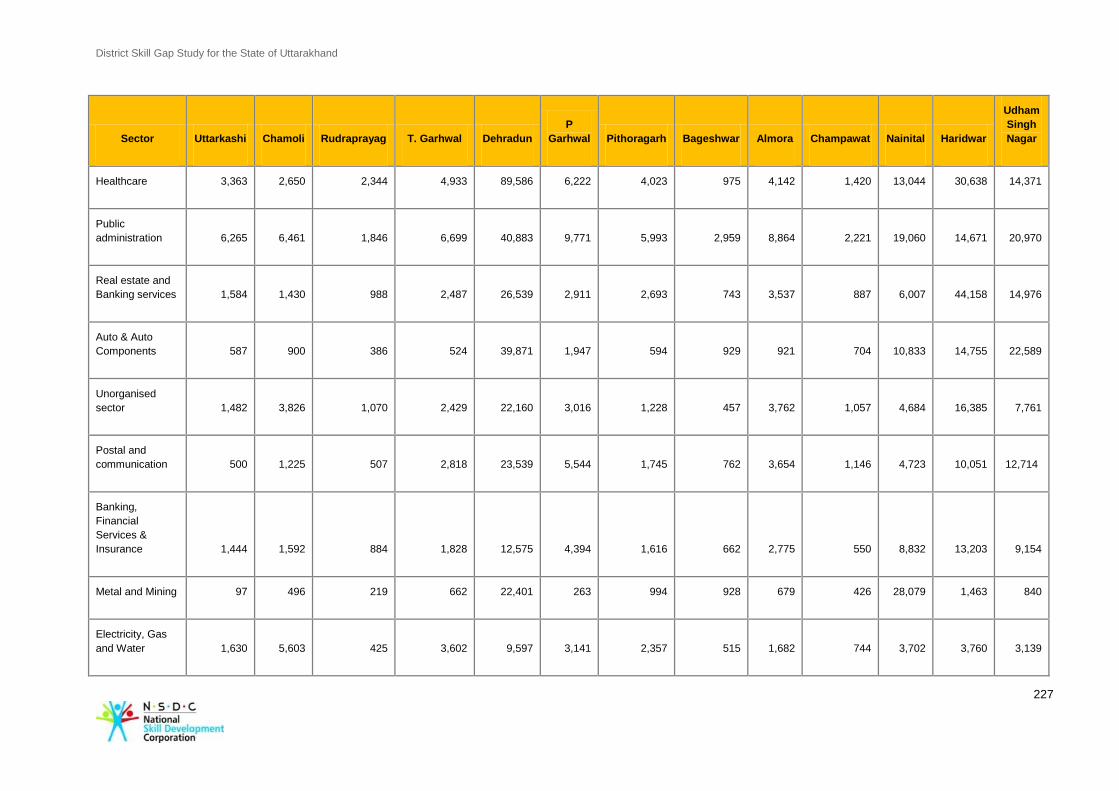
District Skill Gap Study for the State of Uttarakhand
227
Sector Uttarkashi Chamoli Rudraprayag T. Garhwal Dehradun
P
Garhwal Pithoragarh Bageshwar Almora Champawat Nainital Haridwar
Udham
Singh
Nagar
Healthcare 3,363 2,650 2,344 4,933 89,586 6,222 4,023 975 4,142 1,420 13,044 30,638 14,371
Public
administration 6,265 6,461 1,846 6,699 40,883 9,771 5,993 2,959 8,864 2,221 19,060 14,671 20,970
Real estate and
Banking services 1,584 1,430 988 2,487 26,539 2,911 2,693 743 3,537 887 6,007 44,158 14,976
Auto & Auto
Components 587 900 386 524 39,871 1,947 594 929 921 704 10,833 14,755 22,589
Unorganised
sector 1,482 3,826 1,070 2,429 22,160 3,016 1,228 457 3,762 1,057 4,684 16,385 7,761
Postal and
communication 500 1,225 507 2,818 23,539 5,544 1,745 762 3,654 1,146 4,723 10,051 12,714
Banking,
Financial
Services &
Insurance 1,444 1,592 884 1,828 12,575 4,394 1,616 662 2,775 550 8,832 13,203 9,154
Metal and Mining 97 496 219 662 22,401 263 994 928 679 426 28,079 1,463 840
Electricity, Gas
and Water 1,630 5,603 425 3,602 9,597 3,141 2,357 515 1,682 744 3,702 3,760 3,139
About Ernst & Young
Ernst & Young is a global leader in assurance,
tax, transaction and advisory services.
Worldwide, our 167,000 people are united by our
shared values and an unwavering commitment to
quality. We make a difference by helping our
people, our clients and our wider communities
achieve their potential.
Ernst & Young refers to the global organization
of member firms of Ernst & Young Global Limited,
each of which is a separate legal entity.
Ernst & Young Global Limited, a UK company
limited by guarantee, does not provide services
to clients. For more information about our
organization, please visit www.ey.com
Ernst & Young LLP is one of the Indian client serving member
firms of EYGM Limited. For more information about our
organization, please visit www.ey.com/india
Ernst & Young LLP is a Limited Liability Partnership, registered
under the Limited Liability Partnership Act, 2008 in India, having
its registered office at 22 Camac Street, 3rd Floor, Block C,
Kolkata – 700016
© 2013 Ernst & Young LLP Published in India.
All Rights Reserved.
This publication contains information in summary form and is
therefore intended for general guidance only. It is not intended to
be a substitute for detailed research or the exercise of
professional judgment. Neither EYGM Limited nor any other
member of the global Ernst & Young organization can accept any
responsibility for loss occasioned to any person acting or
refraining from action as a result of any material in this
publication. On any specific matter, reference should be made to
the appropriate advisor
Ernst & Young LLP
Assurance | Tax | Transactions | Advisory