Embed Size (px)
Citation preview

SED7, 3223–3244, 2015
Distribution of Pi inprofiles and particles
G. S. Zhang and J. C. Li
Title Page
Abstract Introduction
Conclusions References
Tables Figures
J I
J I
Back Close
Full Screen / Esc
Printer-friendly Version
Interactive Discussion
Discussion
Paper
|D
iscussionP
aper|
Discussion
Paper
|D
iscussionP
aper|
Solid Earth Discuss., 7, 3223–3244, 2015www.solid-earth-discuss.net/7/3223/2015/doi:10.5194/sed-7-3223-2015© Author(s) 2015. CC Attribution 3.0 License.
This discussion paper is/has been under review for the journal Solid Earth (SE).Please refer to the corresponding final paper in SE if available.
Distribution of inorganic phosphorus inprofiles and particle-size fractions acrossan established riparian buffer andadjacent cropped area at the Dian lakeG. S. Zhang and J. C. Li
Environmental Science and Ecological Rehabilitation Institute of Yunnan University,Kunming 650091,China
Received: 26 September 2015 – Accepted: 28 October 2015 – Published: 12 November 2015
Correspondence to: G. S. Zhang ([email protected])
Published by Copernicus Publications on behalf of the European Geosciences Union.
3223

SED7, 3223–3244, 2015
Distribution of Pi inprofiles and particles
G. S. Zhang and J. C. Li
Title Page
Abstract Introduction
Conclusions References
Tables Figures
J I
J I
Back Close
Full Screen / Esc
Printer-friendly Version
Interactive Discussion
Discussion
Paper
|D
iscussionP
aper|
Discussion
Paper
|D
iscussionP
aper|
Abstract
Riparian buffer can trap sediment and nutrients sourced from upper cropland and min-imizing eutrophication risk of water quality. This study aimed to investigate the distribu-tions of soil inorganic phosphorus (Pi) forms among profile and particle-size fractionsin an established riparian buffer and adjacent cropped area at the Dian lake, South-5
western China. The Ca-bound fraction (62 %) was the major proportion of the Pi inthe riparian soils. Buffer rehabilitation from cropped area had a limited impact on totalphosphorus (TP) concentrations after 3 years, but has contributed to a change in Piforms. At 0–20 cm soil layer, levels of the Olsen-P, nonoccluded, Ca-bound and totalPi were lower in the buffer than the cropped area; however, the Pi distribution between10
the cropped area and the buffer did not differ significantly as depth increased. The clayfraction corresponded to 57 % of TP and seemed to be both a sink for highly recalcitrantPi and a source for labile Pi. The lower concentration of Pi forms in the silt and sandparticle fraction in the surface soil was observed in the buffer area, which indicatingthat the Pi distribution in coarse particle fraction has sensitively responded to land-use15
changes.
1 Introduction
Eutrophication of surface water has been linked to runoff of excess nutrients fromagricultural soils in many parts of the world. The improper management or use ofphosphorus (P) fertilizer during cultivation enhances the P transport affecting the wa-20
ter quality, leading to alterations in water ecosystems (Sharpley et al., 2003; Troitiñoet al., 2008). Riparian buffer is an efficient and economical tool to reduce agriculturalnon-point source pollution (Correll, 2000). Because of the filtering function of soil, theeffectiveness of riparian buffers in reducing sediment and nutrient loading in surfaceand subsurface flows from cropland has been shown across many geographic regions25
(Dosskey et al., 2010; Keesstra et al., 2012).
3224

SED7, 3223–3244, 2015
Distribution of Pi inprofiles and particles
G. S. Zhang and J. C. Li
Title Page
Abstract Introduction
Conclusions References
Tables Figures
J I
J I
Back Close
Full Screen / Esc
Printer-friendly Version
Interactive Discussion
Discussion
Paper
|D
iscussionP
aper|
Discussion
Paper
|D
iscussionP
aper|
In the basin of the Dian lake, Southwestern China, agriculture development from con-ventional field crop to intensive horticultural crop has occurred for more than 20 years.Due to severe eutrophication of the Dian lake, a conservation program of Dian lake wasestablished in 2009. Since its inception, thousands of hectare of buffers have been es-tablished by converting strips of cropland around the lake riparian zones to permanent5
vegetation. It is critical to know how the change of land-use affects soil P and its variousforms which in turn affect its potential as a pollutant.
Much experimental evidence from research on both arable and buffer soils indi-cates that P are transported from soil to water with eroded soil (Abrams and Jarrell,1995). Minimizing the risk of P enrichment of surface water bodies with P transported10
from agricultural soils will require specific attention to forms of P in soils. Mooer andReddy (1994) reported that soil inorganic P may represent a greater risk for eutrophi-cation than the organic forms of P. P distribution in chemical fractions can vary amongland uses. Chalmers et al. (2001) observed only a slight increase in extractable P inbuffer area as compared with crop field after 3–5 years set-aside period. Schroeder and15
Kovar (2006) reported that levels of the iron (Fe)-P fractions were higher in the bufferarea than crop field over a 20 year period.
The chemical fractions of inorganic P include iron (Fe)-P, aluminum (Al)-P, calcium(Ca)-P, and occluded P according to Chang and Jackson (1957) fractionation proce-dure.20
Kuo (1996) developed a sequential extraction technique for separating soil inorganicP into various forms, which integrated several fractionation procedures. Application ofthe Kuo fractionation to particle-size fractions can achieve better understanding on Pitransformations because of soil texture is an essential factor dominating soil P dynam-ics (Christensen, 1992).25
In the present study we applied the Kuo fractionation to whole soil samples andparticle-size fractions of different land uses. The objective of this study was to iden-tify the transformations of the inorganic P forms in the plateau lake riparian anthrosolsafter land-use changes from cropped area to vegetation buffer. This will allow us to sus-
3225

SED7, 3223–3244, 2015
Distribution of Pi inprofiles and particles
G. S. Zhang and J. C. Li
Title Page
Abstract Introduction
Conclusions References
Tables Figures
J I
J I
Back Close
Full Screen / Esc
Printer-friendly Version
Interactive Discussion
Discussion
Paper
|D
iscussionP
aper|
Discussion
Paper
|D
iscussionP
aper|
tainably manage these systems within the landscape and minimize non-point sourcepollution.
2 Materials and methods
2.1 Site description
The study area is located on the southeastern basin of the Dian lake in the mid-Yunnan5
Plateau (24◦42′–46′N, 102◦41′–43′E), China, which is the last large agricultural produc-tion area in the basin of the Dian lake. This semi-humid region within the sub-tropicalclimatic zone is characterized by a dry winter and a moist summer. Mean annual airtemperature in the area is 14.7 ◦C and mean annual rainfall is 953 mm, of which 80 %falls between June and October. The soil at the site is a paddy soil (Soil Taxonomy:10
Anthrosols, according to IUSS Working Group WRB, 2014). The cropped area hasbeen in vegetable cropping (4–6 harvests per year) in plastic greenhouse for morethan 20 years. After each harvest in a year, the field is rotary plowed to a 0.15 m-depth.A large amount of chemical fertilizer and animal manure is applied in those productionarea, resulting in P application of approximately 136–195 kgha−1 in each year. The15
buffer area, which is approximately 100–200 m wide, was converted from the croppedarea in 2009 and planted indigenous tree plantation (Salix babylonica L.and Metase-quoia glyptostroboides).
2.2 Soil sampling
All the soils in this study were collected in the Niulian (NL), Haigeng (HG) and Xinglong20
(XL) sites which are located at the southern part of the basin of the Dian lake in 2012(Fig. 1). In the drought season, the shallow ground water levels were about 0.3, 0.7and 1.2 m deep in the buffer at NL, HG and XL, whereas the shallow ground waterlevels were about 0.1, 0.4 and 1.0 m deep at NL, HG and XL in the rainy season,respectively. Because of drainage, the shallow ground water levels were below 1.0 m25
3226

SED7, 3223–3244, 2015
Distribution of Pi inprofiles and particles
G. S. Zhang and J. C. Li
Title Page
Abstract Introduction
Conclusions References
Tables Figures
J I
J I
Back Close
Full Screen / Esc
Printer-friendly Version
Interactive Discussion
Discussion
Paper
|D
iscussionP
aper|
Discussion
Paper
|D
iscussionP
aper|
deep in the cropped area both at NL and HG. Soils were collected during April and Mayof 2012 to a depth of 100 cm at 20 cm-interval. At each site five cores were collectedfrom randomly selected locations across a 50 by 50 m area of both the buffer and thecropped area with a soil drill. There were 15 cores samples of soil profiles for bufferand cropped area respectively. All soil samples were air dried, passed through a 2 mm5
sieve, and stored at 20 ◦C.
2.3 Laboratory analyses
Soil subsamples were ground with a mortar and pestle prior to total soil nutrient analy-sis. Subsamples were analyzed for pH (soil : water = 1 : 2.5); Soil organic carbon andtotal nitrogen were determined by the oil-bath potassium dichromate (K2Cr2O7) titra-10
tion method and the macro-Kjeldahl method (Shi, 1998). Particle size distribution of soilwas determined by the hydrometer method (Gee and Bauder, 1986). Particle density ofsoil (Mgm3) was measured using the liquid pycnometer method, with desired water asthe displacing liquid (Blake andd Hartge, 1986). All the measurements were triplicated.
The particle-size fractionation followed a fractionation procedure of Christensen15
(1992) and Neufeldt et al. (2000). 50 g of soil in 100 mL deionised water was in-tensely shaked for 3 h to disaggregate the coarse-sand fraction. The coarse sand(> 250 µm) was obtained by passing the suspension through a 250 µm sieve, and driedat 40 ◦C. The remaining suspension was exposed to 1500 Jml−1 ultrasonic energy us-ing a probe-type disintegrator. The clay fraction (< 2 µm) was freeze-dried after sepa-20
rating it from the fine sand and the silt by repeated centrifugation until the supernatantwas clear. The fine sand (250–50 µm) was obtained by passing through a 50 µm sieve,and dried at 40 ◦C, whereas the remaining silt (2–50 µm) in the remaining suspensionwas freeze-dried. Due to the low recovery of sand fractions, it was necessary to com-bine coarse-sand and fine-sand fractions to give one sample for chemical analyses.25
Total soil P was determined using wet oxidation (Shi, 1998). Olsen P was determinedby adding 20 mL of 0.5 M NaHCO, pH 8.5 extractant to 1.00 g of soil, shaking for 30 min,and filtering through Whatman 42 filter paper (Kuo, 1996). Inorganic P fractions were
3227

SED7, 3223–3244, 2015
Distribution of Pi inprofiles and particles
G. S. Zhang and J. C. Li
Title Page
Abstract Introduction
Conclusions References
Tables Figures
J I
J I
Back Close
Full Screen / Esc
Printer-friendly Version
Interactive Discussion
Discussion
Paper
|D
iscussionP
aper|
Discussion
Paper
|D
iscussionP
aper|
conducted by Kuo fractionation schemes (Zhang and Kovar, 2000). A 0.5 g soil samplewas placed in a 50 mL centrifuge tube and sequentially extracted with 25 mL eachof 1.0 MNH4Cl, 0.5 MNH4F (loosely bound Pi), and 0.1 M NaOH (non-occluded Pi)in that order. Each extraction was performed for 0.1, 1, and 17 h using a horizontalshaker followed by centrifugation at 3300 rpm for 15 min, respectively. The occluded5
Pi was subsequently extracted by adding 20 mL of 0.3 M Na3C6H5O7, 2.5 mL of 1 MNaHCO3, and 0.5 g Na2S2O4 to the residue in each tube and heating for 15 min at85 ◦C, followed by centrifugation at 3300 rpm for 15 min. The calcium-bound Pi wassubsequently extracted by adding 25 mL of 0.25 M H2SO4 followed by centrifugation at3300 rpm for 15 min. All the measurements were triplicated.10
2.4 Statistical analysis
All data was submitted to analysis of variance (ANOVA) and treatment means weredetected using Fisher’s LSD and Duncan’s Multiple Range Tests. Statistical analyseswere performed with the PASW Statistics 17.0.2 for Windows (SPSS Inc., 2009).
3 Results and discussion15
3.1 Land-use effects on soil physicochemical properties
Summarized results from particle size analysis are presented in Fig. 2. The soils in theXinglong (XL) and Haigeng (HG) sites have less clay than those at the Niulian (NL)sites. Soil textures under the buffer and cropped fields were determined as a clay in allsoil depths at the NL sites, whereas a clay loam both at the XL and HG sites, according20
to soil texture classification of USDA system. The higher percentages of sand in thebuffer upper soils (0–40 cm) at the NL and HG sites indicated that the buffer has actedas a sink for coarse sediments but not for finer particles.
Soil organic carbon (SOC) and nitrogen (N) concentrations at the NL sites weresignificantly higher than the HG and XL sites (Fig. 3). This was probably related to the25
3228

SED7, 3223–3244, 2015
Distribution of Pi inprofiles and particles
G. S. Zhang and J. C. Li
Title Page
Abstract Introduction
Conclusions References
Tables Figures
J I
J I
Back Close
Full Screen / Esc
Printer-friendly Version
Interactive Discussion
Discussion
Paper
|D
iscussionP
aper|
Discussion
Paper
|D
iscussionP
aper|
shallower groundwater table and higher clay content of the soils (Parton et al., 1987).Organic carbon and nitrogen concentrations in the buffer soils (0–100 cm at the NL sitesand 0–20 cm at the HG and XL sites) were significantly higher than in the cropped soils(Fig. 3). The greater accumulation of plant debris by the revegetation and the slowerrate of organic matter decomposition by the lack of cultivation might have contributed5
to the build up of soil organic carbon (SOC) in the buffer soils (Reddy et al., 2008).There was a significant relationship between SOC and N at the research area. Severalstudies have indicated that the rate of SOC accumulation is controlled by the rate of Naccumulation in the early stages of vegetation regeneration of abandoned agriculturalsoils (Knops et al., 2000; Poulton et al., 2003). Differences of SOC and N between the10
cropped and the buffer soils were less significant as depth increased at the HG and XLsites but at the NL sites. The organic-rich subsurface soil in the buffer area at the NLsites may been due to the buried river channel sediment or peat.
The higher pH of surface soil (0–20 cm) in the cropped area reflected the regularfertilization increasing salt concentration in the soil solution (Godsey et al., 2007). In15
addition, the pH of the NL soils was 0.2 to 0.5 higher than the pH of the XL and HGsoils. Compared as the cropped soils, the lower pH of subsurface buffer soils in the NLsites may be partly explained as the higher soil organic matter which can be a potentialsource of soil acidity (Coleman and Thomas, 1967). Soil particle density (ρd ) of the NLsites was significantly lower than that of the XL and HG sites.20
3.2 Land-use effects on P fractions in whole soil samples
Fertilizer application has a significant effect on increasing the available P forms in thecropped soils (Fig. 4). Comparison of Olsen-P levels in the cropped and buffer soilsindicated that higher amount of available P (99.3 mgkg−1) was accumulated in topsoil(0–20 cm) in cropped areas. The higher extractable P in the cropped soil implicated25
that it would be more easily depleted by movement from the soil surface by erosionand leaching (Sharpley et al., 2003). Also, non-occluded, Ca-bound and total inorganicP (Pi) levels at 0–20 cm layer were higher in the cropped soil than in the buffer soil.
3229

SED7, 3223–3244, 2015
Distribution of Pi inprofiles and particles
G. S. Zhang and J. C. Li
Title Page
Abstract Introduction
Conclusions References
Tables Figures
J I
J I
Back Close
Full Screen / Esc
Printer-friendly Version
Interactive Discussion
Discussion
Paper
|D
iscussionP
aper|
Discussion
Paper
|D
iscussionP
aper|
This may be due to the regular fertilization in surface soil for crop growth. Sharply andSmith (1985) and Negassa et al. (2009) also reported amounts of soil Pi increasedwith fertilizer application, with non-occluded and Ca-bound Pi constituting the majorproportion of the change. Neufeldt et al. (2000) reported that fertilizer P has also beensorbed in a highly recalcitrant form and suggested that all P fractions are linked. No5
significant difference in loosely-bound and occluded Pi and total P distribution betweenthese cropped and buffer soils was observed in this study. However, Sharply and Smith(1985) reported that cultivated soils had lower occluded Pi as compared with their virginanalogues. Cooper and Gilliam (1987) reported that topsoil total P concentrations hassignificantly increased in riparian areas as compared with an adjacent cropland over10
a 20 year period.Furthermore, Olsen-P, Pi fractions and TP levels were higher in the 0–20 cm samples
compared to other sampling depths in both areas, suggesting that P was stratifiedin both areas. Within each sampling site (cropped or buffer soil), TP concentrationsdecreased as sampling depth increased. Loosely-bound, non-occluded, occluded and15
total Pi differed significantly in the 0–40 cm depth but not below the 40 cm depth in thesesoils. Additionally, the percentage of loosely-bound, non-occluded Pi also decreased assampling depth increased except occluded and Ca-bound Pi (Fig. 4).
Distribution of total Pi in the soils was, on the average, 5 % loosely-bound, 9 % non-occluded, 24 % occluded and 62 % Ca-bound. High levels of Ca-P in these soils sug-20
gested that at least some of the soil’s alluvial parent material probably originated fromthe limestone bedrock in the area above the catchment of the Dian lake (Schroederand Kovar, 2006). Except for the occluded Pi in 0–20 cm layer, the percentages of Pifractions did not differ significantly between the cropped and the buffer soils. Comparedwith the cropped area topsoils (0–20 cm), the higher percentages of occluded Pi was25
found in the buffer topsoils (Table 1). In general, this observation suggests the increas-ing possibility of occlusion of P with Fe/Al hydrous oxides or formation of insolubleAl/Fe phosphates in buffer soils relative to cropped soils.
3230

SED7, 3223–3244, 2015
Distribution of Pi inprofiles and particles
G. S. Zhang and J. C. Li
Title Page
Abstract Introduction
Conclusions References
Tables Figures
J I
J I
Back Close
Full Screen / Esc
Printer-friendly Version
Interactive Discussion
Discussion
Paper
|D
iscussionP
aper|
Discussion
Paper
|D
iscussionP
aper|
Although subsoil Ca-P (below 0–20 cm) alone did not differ among those areas, theothers Pi fractions were greater in the XL soils than in the HG and NL soils (Fig. 4).The NL soil had the lowest loosely-bound, non-occluded, occluded and total Pi (Fig. 4).However, total P concentration did not differ significantly among those areas. Soil TPconcentration was positively correlated with clay content (r = 0.508, n = 30, P< 0.01).5
However, there was not a significant relationship between Pi fractions and clay con-tent. Occluded Pi was negatively correlated with soil pH (r =-0.621, n = 30, P< 0.01).Furthermore, there were strong correlations among the P fractions.
3.3 Land-use effects on inorganic phosphorus fractions in particle-sizefractions10
Although the error of individual fractions was up to 12 %, the sum of all Pi fractions inthe particle-size fractions was similar to Pi in the whole soil (Table 2). In these soils,the proportion of P froms decreased continuously with increasing particle size of thefractions. The high proportion of P froms in the clay fraction reflected that the clayfraction not only seemed to be a sink for highly recalcitrant Pi but also a source for15
labile Pi forms (Neufeldt et al., 2000; Suñer and Galantini, 2015). The concentrationsof Pi forms in the sand fraction were both significantly lower than in the clay and siltfraction, whereas the concentrations of Pi forms did not differ significantly betweenthe clay and silt fraction. The higher concentration of TP in the clay fraction couldbe attributed to the enrichment of organic phosphorus in the finer particle size class.20
Christensen (2001) reported that in arable soils, clay-sized complexes (< 2µm) havethe largest concentrations of OM, silt-sized (2–20 µm) particles are less enriched, andsize separates> 20µm usually contain little OM.
Figure 5 shows the complex distribution of surface soil (0–20 cm) Pi fractions in theparticle-size fractions under different land-use types. Buffer rehabilitation had no effect25
on the concentration of Pi fractions within clay fraction, but the coarse particle fractionexhibited an decrease in the concentration of loosely-bound, nonoccluded, occluded(not in the silt fraction) and Ca-bound Pi. Chen et al. (2015) also reported that topsoil
3231

SED7, 3223–3244, 2015
Distribution of Pi inprofiles and particles
G. S. Zhang and J. C. Li
Title Page
Abstract Introduction
Conclusions References
Tables Figures
J I
J I
Back Close
Full Screen / Esc
Printer-friendly Version
Interactive Discussion
Discussion
Paper
|D
iscussionP
aper|
Discussion
Paper
|D
iscussionP
aper|
nutrients stored in coarse particle fractions were more sensitive than those stored inthe fine fraction to soil recovery. However, Suñer et al. (2014) reported that the coarsefraction of the cultivated field had low levels of Pi as a consequence of the particulateorganic matter decomposition and coarse mineral particle weathering. The reductionof Pi in coarse particle fractions in the buffer soil could have a positive influence on the5
function of the buffer to act as a sink for P. In the cropped soil, however, the accumu-lation of labile Pi in coarse particle fractions was considered to be more susceptibleto lose P via leaching. Zheng et al. (2003) reported that soil particles containing highamounts of extractable P suggested to have a higher P release potential. The highernonoccluded and occluded Pi in the sand and silt fractions of the cropped soil indi-10
cated that the dissoluted fertilizer P was easy transformed into more stable Pi forms(Neufeldt et al., 2000).The significant accumulation of Ca-bound Pi in the sand and siltfractions of the cropped soils as compared to the buffer soils could be explained by thepresence of undissolved P fertilizer granules in these fractions, because of rock phos-phate had been often used together with soluble P fertilizers in these areas. Tiessen15
et al. (1983) also observed a similar enrichment of recalcitrant P in the coarse silt frac-tion of a cropped soil. Below 20 cm, the concentrations of Pi fractions in the particle-sizefractions did not differ significantly between the cropped and buffer soils.
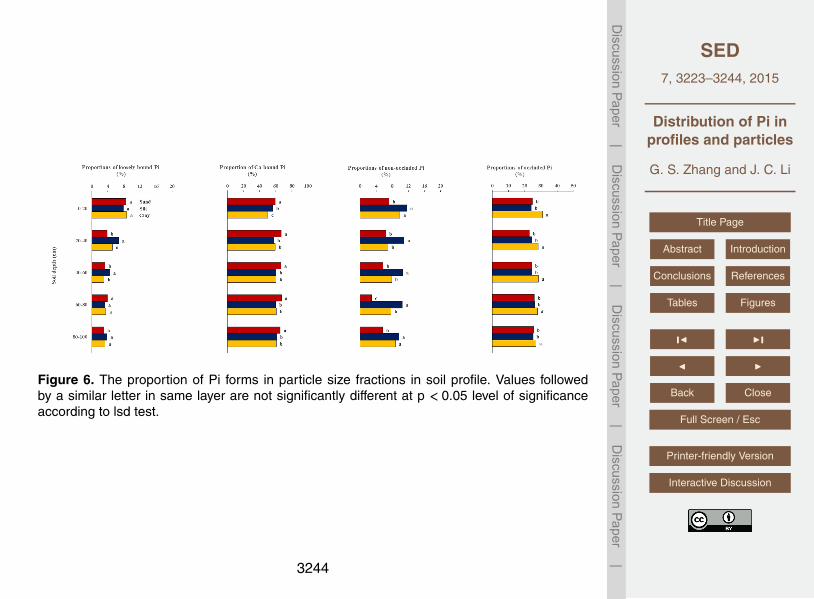
To enable a better understanding of P transformations in those riparian soils, regard-less of land uses, the average proportions of the P fractions in the particle size fractions20
are presented in Fig. 6. Compared with the sand and silt fractions, the proportions ofoccluded Pi was increased in the clay fraction, which should be related to the increas-ing adsorption to Fe/Al hydrous oxides with finer particle size classes. Agbenin andTiessen (1995) and Neufeldt et al. (2000) also reported a similar change of the propor-tions in entisols, inceptisols and oxisols from Brazil. The proportions of Ca-bound Pi in25
the clay and silt sand fraction were significantly lower than that in the sand fractions,which suggested that the increase in occluded Pi with finer particle size fractions maybe at the expense of Ca-bound Pi. The occluded Pi, which consisted of insoluble Al/Fe
3232

SED7, 3223–3244, 2015
Distribution of Pi inprofiles and particles
G. S. Zhang and J. C. Li
Title Page
Abstract Introduction
Conclusions References
Tables Figures
J I
J I
Back Close
Full Screen / Esc
Printer-friendly Version
Interactive Discussion
Discussion
Paper
|D
iscussionP
aper|
Discussion
Paper
|D
iscussionP
aper|
phosphates, are progressively sequestrated in finer particle size fractions and thereforemore difficult to extract.
The proportion of nonoccluded Pi was nearly twice as high in the silt and clay frac-tions as compared to the sand fractions, which could be attributed to their compara-tively higher amounts of discrete Fe/Al hydrous oxides. However, Neufeldt et al. (2000)5
reported that the proportions of NaOH-Pi showed no consistent trends between theparticle-size classes. In contrast, the proportions of loosely-bound Pi did not differ sig-nificantly between the particle-size classes, which suggested the potential of labile Pilose would not decrease with decreasing the particle-size fractions.
4 Conclusions10
Inorganic phosphorus forms and their distribution in particle-size fractions were differ-ent between the conservation buffer and the continuously cropped area. Amounts of Piincreased in the surface soil of crop field associated with fertilizer P application, withnonoccluded and Ca-bound Pi constituting the major proportion of the change. Lowerconcentration of Pi forms in the silt and sand particle fractions was found in the surface15
soil of the buffer, suggesting that P in these fractions had a lower release potential. Theenrichment of labile Pi in the coarse particle fraction of cropped soil implicated that itwould be more easily depleted by movement from the soil surface by leaching. Moreimportant, the application of particle-size separation of P forms determination can berepresented to a better understanding of soil P distribution between different land uses.20
Acknowledgements. The authors gratefully acknowledge financial support from NSFC(31060085) and National Key Sciences and Technology Program for Water Solutions(2012ZX07102-003).
3233

SED7, 3223–3244, 2015
Distribution of Pi inprofiles and particles
G. S. Zhang and J. C. Li
Title Page
Abstract Introduction
Conclusions References
Tables Figures
J I
J I
Back Close
Full Screen / Esc
Printer-friendly Version
Interactive Discussion
Discussion
Paper
|D
iscussionP
aper|
Discussion
Paper
|D
iscussionP
aper|
References
Abrams, M. and Jarrell, W. M.: Soil phosphorus as a potential nonpoint source for elevatedstream phosphorus levels, J. Environ. Qual., 24, 132–138, 1995.
Agbenin, J. O. and Tiessen, H.: Phosphorus forms in particle-size fractions of a toposequencefrom northeast Brazil, Soil Sci. Soc. Am. J., 59, 1687–1693, 1995.5
Blake, G. R. and Hartge, K. H.: Particle density, In: Methods of Soil Analysis, Part 1, 2nd edn.,edited by: Klute, A., ASA and SSSA, Madison, WI, 377–382 pp., 1986.
Chalmers, A. G., Bacon, E. T. G., and Clarke, J. H.: Changes in soil mineral nitrogen during andafter 3 year and 5 year set-aside and nitrate leaching losses after ploughing out the 5 yearcovers in the UK, Plant Soil, 228, 157–177, 2001.10
Chang, S. C. and Jackson, M. L.: Fractionation of soil phosphorus, Soil Sci., 84, 133–144,1957.
Chen, X., Duan, Z., and Tan, M.: Restoration Affect Soil Organic Carbon and Nutrients in Dif-ferent Particle-size Fractions, Land Degrad. Dev., doi:10.1002/ldr.2400, online first, 2015.
Christensen, B. T.: Physical fractionation of soil and organic matter in primary particle size and15
density separates, in: Advances in Soil Science, edited by: Stewart, B. A., vol 20, Springer,Berlin Heidelberg, New York, 1–90, 1992.
Christensen, B. T.: Physical fractionation of soil and structural and functional complexity inorganic matter turnover, Eur. J. Soil Sci., 52, 345–353, 2001.
Coleman, N. T. and Thomas, G. W.: The basic chemistry of soil acidity, in: Soil acidity and20
liming, 1st edn., edited by: Pearson, R. W. and Adams, F., Madison, WI, 1–41, 1967.Cooper, J. R. and Gilliam, J. W.: Phosphorus redistribution from cultivated fields into riparian
areas, Soil Sci. Soc. Am. J., 51, 1600–1604, 1987.Correll, D. L.: The current status of our knowledge of riparian buffer water quality functions,
in: AWRA Proceedings of International Conference on Riparian Ecology and Management25
in Multi-land Use Watersheds; American Water Resources Association: Middleburg, 28–31August 2000, Virginia; 5–10, 2000.
Dosskey, M. G., Vidon, P., Gurwick, N. P., Allan, C. J., Duval, T. P., and Lowrance, R.: The roleof riparian vegetation in protecting and improving chemical water quality in streams, J. Am.Water Resour. Assoc., 46, 261–277, 2010.30
Gee, G. W. and Bauder, J. W.: Particle fraction and particle size analysis, In: Methods of soilanalysis, Part 1, 2nd edn., edited by: Klute, A., ASA and SSSA, Madiso, WI, 383–409, 1986.
3234

SED7, 3223–3244, 2015
Distribution of Pi inprofiles and particles
G. S. Zhang and J. C. Li
Title Page
Abstract Introduction
Conclusions References
Tables Figures
J I
J I
Back Close
Full Screen / Esc
Printer-friendly Version
Interactive Discussion
Discussion
Paper
|D
iscussionP
aper|
Discussion
Paper
|D
iscussionP
aper|
Godsey, C. B., Pierzynski, G. M., Mengel, D. B., and Lamond, R. E.: Evaluation of common limerequirement methods, Soil Sci. Soc. Am. J., 71, 843–850, 2007.
IUSS Working Group WRB: World Reference Base for Soil Resources 2014: International soilclassification system for naming soils and creating legends for soil maps, World Soil Re-sources Reports No. 106. FAO, Rome, 2014.5
Keesstra, S. D., Geissen, V., van Schaik, L., Mosse, K., and Piiranen, S.: Soil as a filter forgroundwater quality, Curr. Opin. Environ. Sustain., 4, 507–516, 2012.
Knops, J. H. and Tilman, D.: Dynamics of soil nitrogen and carbon accumulation for 61 yearsafter agricultural abandonment, Ecology, 81, 88–98, 2000.
Kuo, S.: Phosphorus, in: Methods of Soil Analysis: Chemical Methods, Part 3, edited by:10
Sparks, D. L., SSSA, Madison, WI, 869–919, 1996.Moore, P. A. and Reddy, K. R.: Role of eH and pH on phosphorus geochemistry in sediments
of Lake Okeechobee, Florida, J. Environ. Qual., 23, 955–964,1994.Negassa, W. and Leinweber, P.: How does the Hedley sequential phosphorus fractionation
reflect impacts of land use and management on soil phosphorus: a review, J. Plant Nutr. Soil15
Sc., 172, 305–325, 2009.Neufeldt, H., da Silva, J. E., Ayarza, M. A., and Zech, W.: Land-use effects on phosphorus
fractions in Cerrado oxisols, Bio. Fert. Soils, 31, 30–37, 2000.Poulton, P. R., Pye, E., Hargreaves, P. R., and Jenkinson, D. S.: Accumulation of carbon and
nitrogen by old arable land reverting to woodland, Global Change Biol., 9, 942–955, 2003.20
Reddy, K. R. and DeLaune, R. D.: Biogeochemistry of Wetlands: Science and Applications,Taylor and Francis Group, Boca Raton, Florida , 157–181, 2008.
Schroeder, P. D. and Kovar, J. L.: Comparison of Organic and Inorganic Phosphorus Fractionsin an Established Buffer and Adjacent Production Field, Commun. Soil Sci. Plan., 37, 1219–1232, 2006.25
Sharpley, A. N. and Smith, S. J.: Fractionation of inorganic and organic phosphorus in virginand cultivated soils, Soil Sci. Soc. Am. J., 49, 127–130, 1985.
Sharpley, A. N., Weld, J. L., Beegle, D. B., Kleinman, P. J. A., Gburek, W. J., Moore, P. A., andMullins, G.: Development of phosphorus indices for nutrient management planning strategiesin the United States, J. Soil Water Conserv., 58, 137–152, 2003.30
Shi, R. H.: Soil and Agro-chemical Analysis (2), China Agricultural Press, Beijing, 1998.SPSS: PASW Statistics 17.0.2 for Windows. Chicago, IL, 2009.
3235

SED7, 3223–3244, 2015
Distribution of Pi inprofiles and particles
G. S. Zhang and J. C. Li
Title Page
Abstract Introduction
Conclusions References
Tables Figures
J I
J I
Back Close
Full Screen / Esc
Printer-friendly Version
Interactive Discussion
Discussion
Paper
|D
iscussionP
aper|
Discussion
Paper
|D
iscussionP
aper|
Suñer, L. and Galantini, J. A.: Texture influence on soil phosphorus content and distribution insemiarid pampean grasslands, Int. J. Plant Sci., 7, 109–120, doi:10.9734/IJPSS/2015/16939,2015.
Suñer, L., Galantini, J., and Minoldo, G.: Soil Phosphorus Dynamics of Wheat-Based Crop-ping Systems in the Semiarid Region of Argentina, Appl. Environ, Soil Sci., 2014, 532807,5
doi:10.1155/2014/532807, 2014.Tiessen, H., Stewart, J. W. B., and Moir, J. O.: Changes in organic and inorganic phosphorus
composition of two grassland soils and their particle size fractions during 60–90 years ofcultivation, J. Soil Sci., 34, 815–823, 1983.
Troitiño, F., Gil-Sotres, F., Leirós, M. C., Trasar-Cepeda, C., and Seoane, S.: Effect of land use10
on some soil properties related to the risk of loss of soil phosphorus, Land Degrad. Dev., 19,21–35, 2008.
Zhang, H. and Kovar, J. L.: Phosphorus fractionation. in: Pierzynski, G. M. (Eds.), Methodsof Phosphorus Analysis for Soils, Sediments, Residuals, and Waters. Southern CooperativeSeries Bulletin No., Kansas State University, Manhattan, Kansas, 396, 50–59, 2000.15
Zheng, Z., Parent, L. E., and Macleod, J. A.: Influence of soil texture on fertilizer and soil phos-phorus transformations in gleysolic soils, Can. J. Soil Sci., 83, 395–403, 2003.
3236

SED7, 3223–3244, 2015
Distribution of Pi inprofiles and particles
G. S. Zhang and J. C. Li
Title Page
Abstract Introduction
Conclusions References
Tables Figures
J I
J I
Back Close
Full Screen / Esc
Printer-friendly Version
Interactive Discussion
Discussion
Paper
|D
iscussionP
aper|
Discussion
Paper
|D
iscussionP
aper|
Table 1. Percentage of inorganic phosphorus forms on total Pi at 0–20 cm soil layer of differentsites. Data followed by the same lower case letter at same column indicate that the percentageof Pi forms were not significantly different at P< 0.05 according to lsd test.
Percentage of Pi forms on total Pi
loosely-bound non-occluded occluded Ca-boundNiulian siteBuffer area 5c 5c 26b 64bCropped area 4c 4c 23c 69aHaigeng siteBuffer area 7b 11b 31a 51dCropped area 6b 12b 26b 56cXinglong siteBuffer area 11a 18a 28ab 42fCropped area 11a 18a 25c 46e
3237

SED7, 3223–3244, 2015
Distribution of Pi inprofiles and particles
G. S. Zhang and J. C. Li
Title Page
Abstract Introduction
Conclusions References
Tables Figures
J I
J I
Back Close
Full Screen / Esc
Printer-friendly Version
Interactive Discussion
Discussion
Paper
|D
iscussionP
aper|
Discussion
Paper
|D
iscussionP
aper|
Table 2. Phosphorus forms in particle-size fractions of the riparian soil. For each phosphorusform, data followed by the same capital case letter indicate that the P concentrations betweenparticle size fractions were not significantly different at P< 0.05 according to lsd test. Data inparentheses followed by the same lower case letter indicate that the proportion of P formsbetween particle size fractions were not significantly different at P< 0.05 according to lsd test.
P forms Particle size classes∑
Whole soil< 2 µm 2–50 µm 50–2000 µm gkg−1 gkg−1
gkg−1 gkg−1 gkg−1
loosely-bound 0.05A(49a) 0.05A(38b) 0.04B(13c) 0.05 0.05non-occluded 0.09A(46a) 0.11A(44a) 0.06B(10b) 0.09 0.09occluded 0.25A(53a) 0.23B(33b) 0.19C(14c) 0.24 0.21Ca-bound 0.52A(51a) 0.51A(34b) 0.42B(15c) 0.50 0.48TPi 0.91A(51a) 0.91A(35b) 0.71B(14c) 0.87 0.82TP 1.75A(57a) 1.25B(28b) 1.21B(15c) 1.48 1.39
3238

SED7, 3223–3244, 2015
Distribution of Pi inprofiles and particles
G. S. Zhang and J. C. Li
Title Page
Abstract Introduction
Conclusions References
Tables Figures
J I
J I
Back Close
Full Screen / Esc
Printer-friendly Version
Interactive Discussion
Discussion
Paper
|D
iscussionP
aper|
Discussion
Paper
|D
iscussionP
aper|
Figure 1. Map of the research area with sampling sites
3239

SED7, 3223–3244, 2015
Distribution of Pi inprofiles and particles
G. S. Zhang and J. C. Li
Title Page
Abstract Introduction
Conclusions References
Tables Figures
J I
J I
Back Close
Full Screen / Esc
Printer-friendly Version
Interactive Discussion
Discussion
Paper
|D
iscussionP
aper|
Discussion
Paper
|D
iscussionP
aper|
Figure 2. The distribution of soil particle size fractions in profile at different land use sites. Bufferof Xinglong site (XL-B); Buffer of Haigeng site (HG-B); Buffer of Niulian site (NL-B); Croppedfield of Xinglong site (XL-F); Cropped field of Haigeng site (HG-F); Cropped field of Niulian site(NL-F).
3240

SED7, 3223–3244, 2015
Distribution of Pi inprofiles and particles
G. S. Zhang and J. C. Li
Title Page
Abstract Introduction
Conclusions References
Tables Figures
J I
J I
Back Close
Full Screen / Esc
Printer-friendly Version
Interactive Discussion
Discussion
Paper
|D
iscussionP
aper|
Discussion
Paper
|D
iscussionP
aper|
Figure 3. The distribution of soil physicochemical properties in profile at different land use sites.For abbreviations, see Fig. 2.
3241

SED7, 3223–3244, 2015
Distribution of Pi inprofiles and particles
G. S. Zhang and J. C. Li
Title Page
Abstract Introduction
Conclusions References
Tables Figures
J I
J I
Back Close
Full Screen / Esc
Printer-friendly Version
Interactive Discussion
Discussion
Paper
|D
iscussionP
aper|
Discussion
Paper
|D
iscussionP
aper|
Figure 4. The concentrations of P forms in soil profile at different land use sites. For abbrevia-tions, see Fig. 2.
3242

SED7, 3223–3244, 2015
Distribution of Pi inprofiles and particles
G. S. Zhang and J. C. Li
Title Page
Abstract Introduction
Conclusions References
Tables Figures
J I
J I
Back Close
Full Screen / Esc
Printer-friendly Version
Interactive Discussion
Discussion
Paper
|D
iscussionP
aper|
Discussion
Paper
|D
iscussionP
aper|
Figure 5. The P storage in particle size fractions for Pi fractions of different land use sites.Values on the column are the sum values of Pi fractions at same site. Values followed bya similar letter are not significantly different at p < 0.05 level of significance according to lsdtest. For abbreviations, see Fig. 2.
3243
SED7, 3223–3244, 2015
Distribution of Pi inprofiles and particles
G. S. Zhang and J. C. Li
Title Page
Abstract Introduction
Conclusions References
Tables Figures
J I
J I
Back Close
Full Screen / Esc
Printer-friendly Version
Interactive Discussion
Discussion
Paper
|D
iscussionP
aper|
Discussion
Paper
|D
iscussionP
aper|
Figure 6. The proportion of Pi forms in particle size fractions in soil profile. Values followedby a similar letter in same layer are not significantly different at p < 0.05 level of significanceaccording to lsd test.
3244