Embed Size (px)
Citation preview
Distribution Networks in Transition
Göran Persson, Leif-Magnus Jensen, Erna Senkina Engebrethsen, and Bente Flygansvær
Research Report 6/2008
BI Norwegian School of Management
Department of Strategy and Logistics
2
Göran Persson, Leif-Magnus Jensen, Erna Senkina Engebrethsen and Bente Flygansvær: Distribution Networks in Transition © Forfatterne 2008 Forskningsrapport 6/2008 ISSN: 0803-2610 Handelshøyskolen BI 0442 Oslo Telefon: 06600 www.bi.no Trykk: Nordberg hurtigtrykk Rapporten kan bestilles fra våre hjemmesider www.bi.no, under Forskning/Forskningspublikasjoner
3
CONTENT
FOREWARD ........................................................................................................................... 7
ABSTRACT............................................................................................................................. 9
PART I INTRODUCTION TO THE PROJECT ............................................................11
1. EMPIRICAL BACKGROUND FOR THE PROJECT .......................................................13
1.1 DISTRIBUTION NETWORKS ARE IN TRANSITION.....................................13 1.2 LOGISTICS SERVICE PROVIDERS ARE REPOSITIONING THEMSELVES ......18 1.3 CHANGING CUSTOMER NEEDS AND EXPECTATIONS ..............................20 1.4 THE ORGANIZATION OF DISTRIBUTION ARRANGEMENTS.......................21
2. THE DNET PROJECT – AN OVERVIEW.......................................................................23 2.1 OBJECTIVES AND OUTPUTS FROM THE PROJECT ....................................23 2.2 PROJECT ORGANISATION AND MANAGEMENT .......................................24 2.3 RESEARCH APPROACH AND PARTICIPATING COMPANIES.......................24 2.4 PHD-DISSERTATIONS............................................................................25 2.5 OTHER PUBLICATIONS ...........................................................................29 2.6 OUTLINE OF THE REPORT......................................................................30
3. RESEARCH ISSUES, THEORETICAL APPROACHES, AND METHODOLOGICAL CONSIDERATIONS ..............................................................................................................35
3.1 INTRODUCTION.....................................................................................35 3.2 S UPPLY CHAIN MANAGEMENT ............................................................36 3.3 BUSINESS LOGISTICS ............................................................................37 3.4 DISTRIBUTION RESEARCH.....................................................................39 3.5 THE INTERFACES ..................................................................................40 3.6 THE INDUSTRIAL NETWORK APPROACH ................................................42
3.7 INTEREST AREAS FOR THE STUDY……………………………………......... 44
3.8 THE STUDY OF DISTRIBUTION NETWORKS IN TRANSITION.....................48
4
PART II DISTRIBUTION NETWORKS - THREE CASE STUDIES...........................57
4. THE CAR DISTRIBUTION CASE ...................................................................................59
4.1 INTRODUCTION.....................................................................................59 4.2 THE SETTING – CAR DISTRIBUTION IN TRANSITION .............................59 4.3 THE BLOCK EXEMPTION.......................................................................61 4.4 DEVELOPMENT AND SCENARIOS ..........................................................61 4.5 CAR DISTRIBUTION IN NORWAY - THE CASE........................................64
5. THE WASTE MANAGEMENT CASE.............................................................................93 5.1 INTRODUCTION.....................................................................................93 5.2 THE REVERSE DISTRIBUTION SYSTEM FOR ELECTRICAL AND
ELECTRONIC PRODUCTS .......................................................................93 5.3 THE RENAS CASE.............................................................................. 109 5.4 DISCUSSION AND IMPLICATIONS........................................................ 133
6. THE FAST MOVING CONSUMER GOODS (FMCG) DISTRIBUTION CASE ........141 6.1 LOGISTICS IN RETAIL DISTRIBUTION IN EUROPE ................................. 141 6.2 FUTURE TRENDS AND CHALLENGES IN RETAIL LOGISTICS................... 144 6.3 ENVIRONMENTAL CONCERNS AND RETAIL LOGISTICS......................... 147 6.4 LOGISTICS OUTSOURCING IN EUROPEAN RETAIL INDUSTRY .............. 148 6.5 TRENDS AND CHALLENGES IN RETAIL LOGISTICS OUTSOURCING ......... 153 6.6 FMCG DISTRIBUTION IN NORWAY: A CASE STUDY............................. 155 6.7 CONCLUDING DISCUSSION .................................................................. 173
PART III DISTRIBUTION NETWORKS IN TRANSITION - SOME THEORETICAL ISSUES...................................................................................................175
7. VALUE CREATION IN CAR DISTRIBUTION. A VIEW FROM THREE THEORETICAL LENSES....................................................................................................179
7.1 INTRODUCTION................................................................................... 179 7.2 THEORETICAL PERSPECTIVES ON VALUE CREATION .......................... 180 7.3 THE CASE ........................................................................................... 187 7.4 DISCUSSION........................................................................................ 192 7.5 CONCLUSIONS .................................................................................... 195
5
8. COORDINATED ACTION IN REVERSE DISTRIBUTION SYSTEMS ......................199 8.1 INTRODUCTION................................................................................... 199 8.2 FRAMEWORK ...................................................................................... 200 8.3 DIMENSIONS OF REVERSE DISTRIBUTION SYSTEMS ............................. 204 8.4 THE RESEARCH MODEL ....................................................................... 205 8.5 THE RESEARCH METHOD AND EMPIRICAL STUDY................................ 206 8.6 DISCUSSION........................................................................................ 212 8.7 CONCLUSIONS .................................................................................... 215
9. REPLENISHMENT STRATEGY FOR IMPORTED WINE-PRODUCTS IN THE NORDIC COUNTRIES: A LOT-SIZING MODEL ............................................................219
9.1 INTRODUCTION................................................................................... 219 9.2 LITERATURE REVIEW.......................................................................... 220 9.3 CASE COMPANY ................................................................................. 224 9.4 PROBLEM FORMULATION.................................................................... 228 9.5 MODEL DEVELOPMENT....................................................................... 231 9.6 EXAMPLE PROBLEMS .......................................................................... 238 9.7 MANAGERIAL IMPLICATIONS AND EXTENDED USE.............................. 244
PART IV CONCLUSIONS AND IMPLICATIONS .....................................................247
10. DISTRIBUTION NETWORKS IN TRANSITION: THE ROLE OF INTERMEDIARIES .............................................................................................................249
10.1 INTRODUCTION – DEVELOPMENTS IN TRADE AND DISTRIBUTION...... 249 10.2 RESEARCH APPROACH AND PARTICIPATING COMPANIES................... 252 10.3 THE NEW CAR DISTRIBUTION CASE ................................................... 253 10.4 THE CASE OF REVERSE DISTRIBUTION SYSTEM FOR COLLECTING
ELECTRIC AND INDUSTRY FEATURES - DRIVERS ................................. 257 10.5 THE FMCG CASE ............................................................................. 261 10.7 SUMMARY AND CONCLUSIONS.......................................................... 268
11 DISTRIBUTION NETWORKS IN TRANSITION: IMPLICATIONS AND FUTURE RESEARCH..........................................................................................................................271
11.1 TRANSITIONS IN DISTRIBUTION SYSTEMS.......................................... 271 11.2 LOGISTICS AND DISTRIBUTION RESEARCH ........................................ 274

6
11.3 MAJOR CONCLUSIONS AND IMPLICATIONS FROM THE
DISSERTATIONS REGARDING DISTRIBUTION NETWORKS IN TRANSITION
.......................................................................................................... 275 11.4 FUTURE RESEARCH .......................................................................... 286
7
Foreword This research report – “Distribution networks in transition” is one of the outcomes of a four-year research project with the same title, where the purpose has been to carry out a set of studies concerning distribution and distribution arrangements. The project was initialized by the logistics group at the Norwegian School of Management in 2003, and it has been financed by the Norwegian Research Council, as well as by the five participating companies: Renas, the Møller Group, Autolink, VSD, and DHL Solutions. The focus of this study has been on logistics service providers, and more specifically on logistics service providers as actors in a distribution network. Also, we have had the intention, through the project, to better understand the transition processes in specific and targeted industries, thus to study distribution networks in transition. The major output of the project, in addition to this report, has been three PhD-dissertations covering different aspects of distribution and logistics, as well as a series of articles and papers based on the cases in the study. Some of these papers will be found in this report. Many people have been contributing to this project. We particularly want to thank the following persons for their participation in the research process. Gunnar Myrvold at RENAS for being a major contributor and an active participant in the project. We also want to thank Øystein Rønningen, former mangaging director at VSD, for giving us the opportunity to study the "forth party logistics provider" concept in more details. Special thanks to Terje Sten, Emma Almqvist and the inspiring team at supply chain management department for support and for sharing their knowledge. In DHL we would like to thank Claus Garbisch, Ketil Lundgaard, Alan Laven and Bent Dragset for opening the doors to one of the biggest "3PL"'s in the world. For the car distribution case we would like to thank Lars Olsen and Bjørn Width at Autolink, as well as Karsten Nielsen and Arild Solheim at Møller Logistics. A special thanks also to Bente Flygansvær for the role she has played in relation to this particular case. We sincerely hope that the participation in the project has been beneficial to all of you and not only to us. August 2008 Professor Göran Persson BI Norwegian School of Management Department of Strategy and Logistics

8

9
Abstract The overall objective of the DNet project has been to develop concepts, models, and methods for helping firms in reconsidering their role and position in a supply chain. In the project we have chosen to focus on three industries or settings: the electronics waste industry (EE-waste), the car industry, and the fast moving consumer goods (FMCG) industry, or rather segments of these industries. The focus of the study has been on logistics service providers, and more specifically on logistics service providers as actors in a distribution network. Two basic descriptive research approaches has been applied in the project as far as the empirical studies are concerned. One approach was studies of the industry structure in relation to the participating companies. By this approach, the intention was to describe the industry at a more general level, the transition processes in the industry, driving forces for changing positions, trends and patterns concerning the transition etc. The second approach was more focused studies of the distribution networks in which the participating companies take part. By this approach, we intended to explore issues concerning properties of distribution networks, contingencies for design of logistics and distribution networks, embeddedness as a contingency for specialization and integration etc. The pressures leading to transitions in the three cases are different, although there are some common points. In all three cases political pressures have resulted in a changed legal framework leading to a new set of conditions for the industry. The specific legal changes made are however different, ranging from the creation of a new business in the EE case to the still expected changes in the car distribution case. Likewise, the nature of each system in terms of industry structure as well as economic incentives is quite different so that changes are handled differently. It is these two factors taken together that create widely different opportunities for intermediaries in each of the three systems. There are however counter-forces that can reduce the effect of these changes. The delivery systems in the three cases have different features. A common development however in all the cases is the evolvement of more differentiated delivery systems. In the car distribution case a probable development is a differentiation related to segments. An example would be differentiated processes for volume cars and luxury cars, standard or customer-specified cars. In the EE-waste case the industry has become organized according to segments and the processes adapted to the specific needs in each segment. Finally in the FMCG case the importers have chosen
10
among different logistics solutions with varying degree of outsourced activities. Business opportunities for intermediaries are related to the organisation of the supply chain or network or to the integration and coordination of processes. The basic question, however, is if a neutral intermediary can position itself either to better exploit economies of scale for some or many of the activities in the supply chain or better control of the flow of goods. The latter is based on the fundamental principle that aggregate volumes are more easily controlled than disaggregated ones.

11
PART I INTRODUCTION TO THE PROJECT This research report – “Distribution networks in transition” is one of the outcomes of a four-year research project with the same title, where the purpose has been to carry out a set of studies concerning distribution and distribution arrangements. The report has been organised into four sections or parts. The following three chapters, part I, represent an introduction to the project. In the first chapter, we will discuss some of the major empirical trends and challenges within distribution, and thus the significance of the research area and the rationale for the whole project. In the second chapter, the basic features of the project will be described. Here an outline of the report will be presented which might be of guidance to the reader. In the last chapter in this section, there is a review of some of the research relevant for understanding the subject area. In the same chapter the interest areas for the study is specified and discussed.

12
13
CHAPTER 1
Empirical background for the project
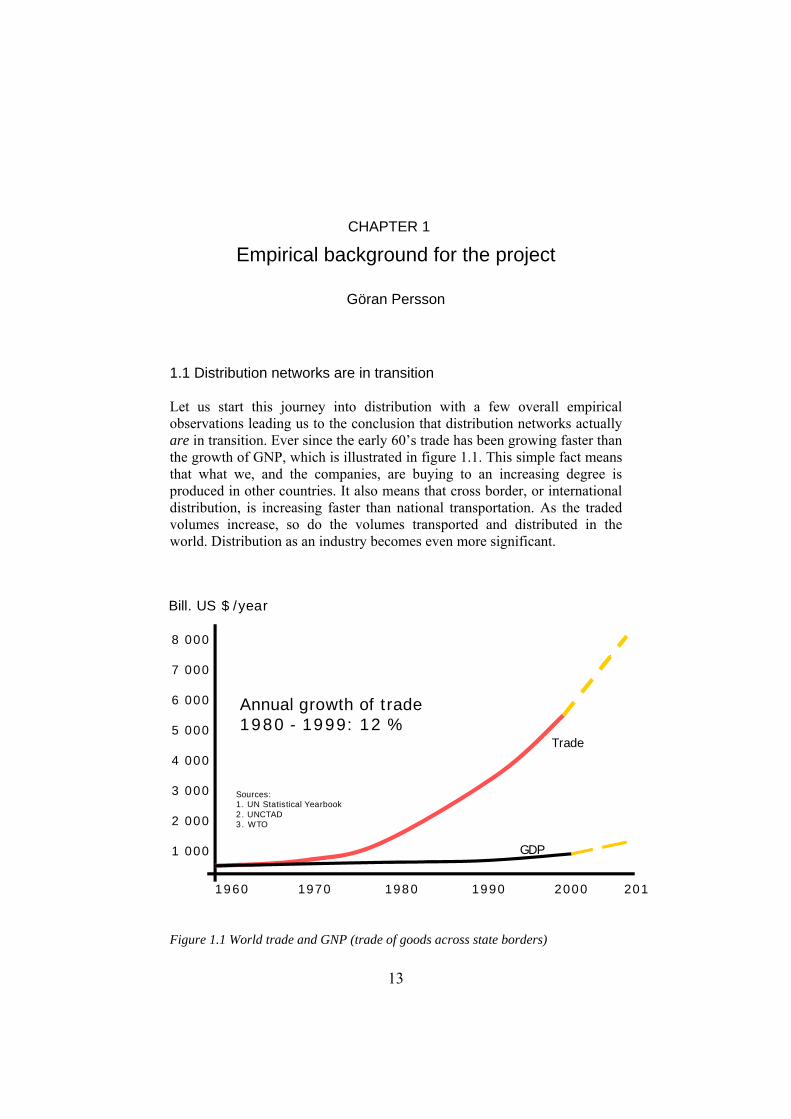
Göran Persson 1.1 Distribution networks are in transition Let us start this journey into distribution with a few overall empirical observations leading us to the conclusion that distribution networks actually are in transition. Ever since the early 60’s trade has been growing faster than the growth of GNP, which is illustrated in figure 1.1. This simple fact means that what we, and the companies, are buying to an increasing degree is produced in other countries. It also means that cross border, or international distribution, is increasing faster than national transportation. As the traded volumes increase, so do the volumes transported and distributed in the world. Distribution as an industry becomes even more significant.
Figure 1.1 World trade and GNP (trade of goods across state borders)
8 000
7 000
6 000
5 000
4 000
3 000
2 000
1 000
1960 1970 1980 1990 2000 201
Bill. US $ /year
Sources:1 . UN Statistical Yearbook2. UNCTAD3. WTO
Annual growth of trade 1980 - 1999: 12 %
World Trade and GDP(trade of goods across state borders)
Trade
GDP
8 000
7 000
6 000
5 000
4 000
3 000
2 000
1 000
1960 1970 1980 1990 2000 201
Bill. US $ /year
Sources:1. UN Statistical Yearbook2. UNCTAD3. WTO
Annual growth of trade 1980 - 1999: 12 %
Trade
GDP

14
Another fact that can be observed in pure numbers is that companies are increasingly sourcing in countries representing lower costs, see figure 1.2. They are moving parts of their production (or out-shoring) to the same countries. Thus, while production continuously is increasing in countries and regions such as China, India, the Baltic’s, Russia, and Central Europe, there is a decrease in production in western European countries. Again, looking at European companies, not only are they to a larger extent sourcing in other European markets, but also in the new and emerging markets.
Figure 1.2 Change in industrial production, % change on the year before. The growth in trade and changes in trade patterns have a significant impact not only on the flow of goods but also on the supply-, production- and distribution systems Sourcing and supply decisions are normally influenced when production is transferred to another country, and so are distribution decisions. Moving production from for instance Europe to India often involves a shift of suppliers as well as a new distribution arrangement.
1. China + 16,0 %2. Czech Rep. + 11,2 ”3. Hungary + 8,4 ”4. India + 6,7 ”5. Argentina + 6,0 ”6. Peru + 5,9 ”7. Indonesia + 5,5 ”
1. Belgium - 4,0 %2. Spain - 3,5 ”3. Italy - 3,0 ”4. Japan - 2,2 ”5. Denmark - 1,6 ”6. Britain - 1,6 ”7. Switzerland - 0,3 ”
Source: The Economist 16th. Sept. 2005Average manufacturing wage 2004USA $ 22.50 hourChina $ 0.69 “
15
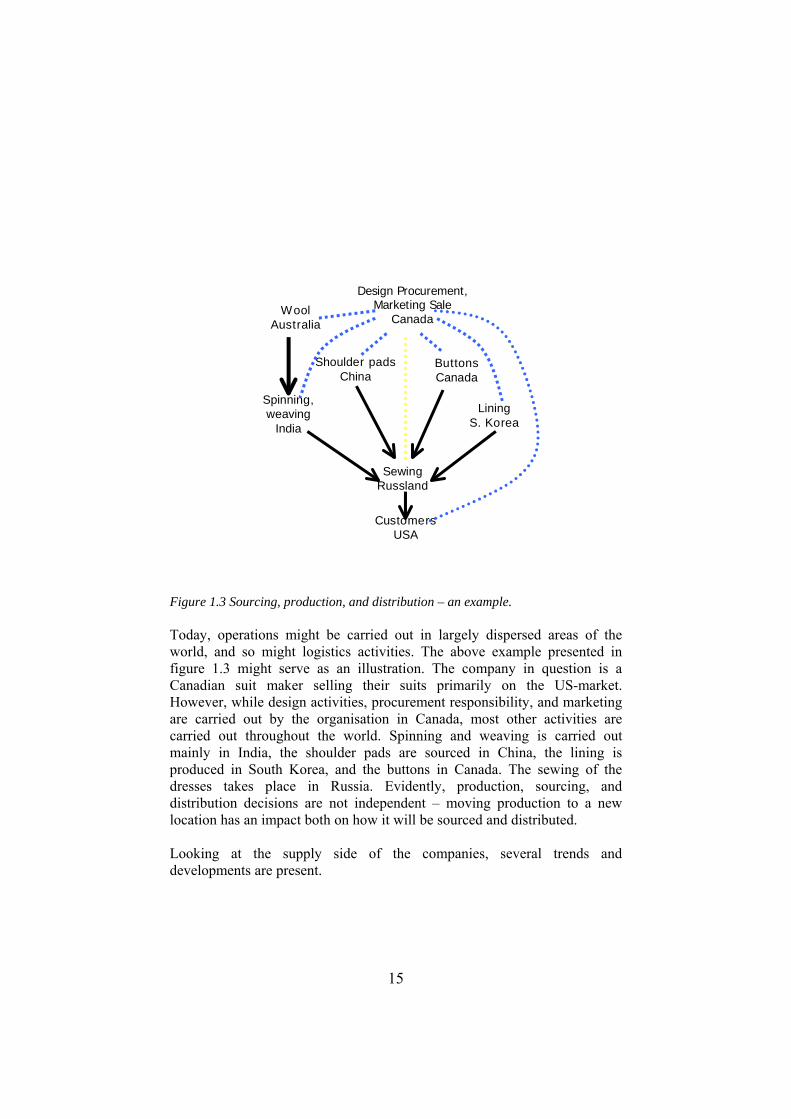
Figure 1.3 Sourcing, production, and distribution – an example. Today, operations might be carried out in largely dispersed areas of the world, and so might logistics activities. The above example presented in figure 1.3 might serve as an illustration. The company in question is a Canadian suit maker selling their suits primarily on the US-market. However, while design activities, procurement responsibility, and marketing are carried out by the organisation in Canada, most other activities are carried out throughout the world. Spinning and weaving is carried out mainly in India, the shoulder pads are sourced in China, the lining is produced in South Korea, and the buttons in Canada. The sewing of the dresses takes place in Russia. Evidently, production, sourcing, and distribution decisions are not independent – moving production to a new location has an impact both on how it will be sourced and distributed. Looking at the supply side of the companies, several trends and developments are present.
Design Procurement,Marketing Sale
Canada
SewingRussland
WoolAustralia
Spinning, weaving
India
Shoulder padsChina
ButtonsCanada
LiningS. Korea
CustomersUSA
16
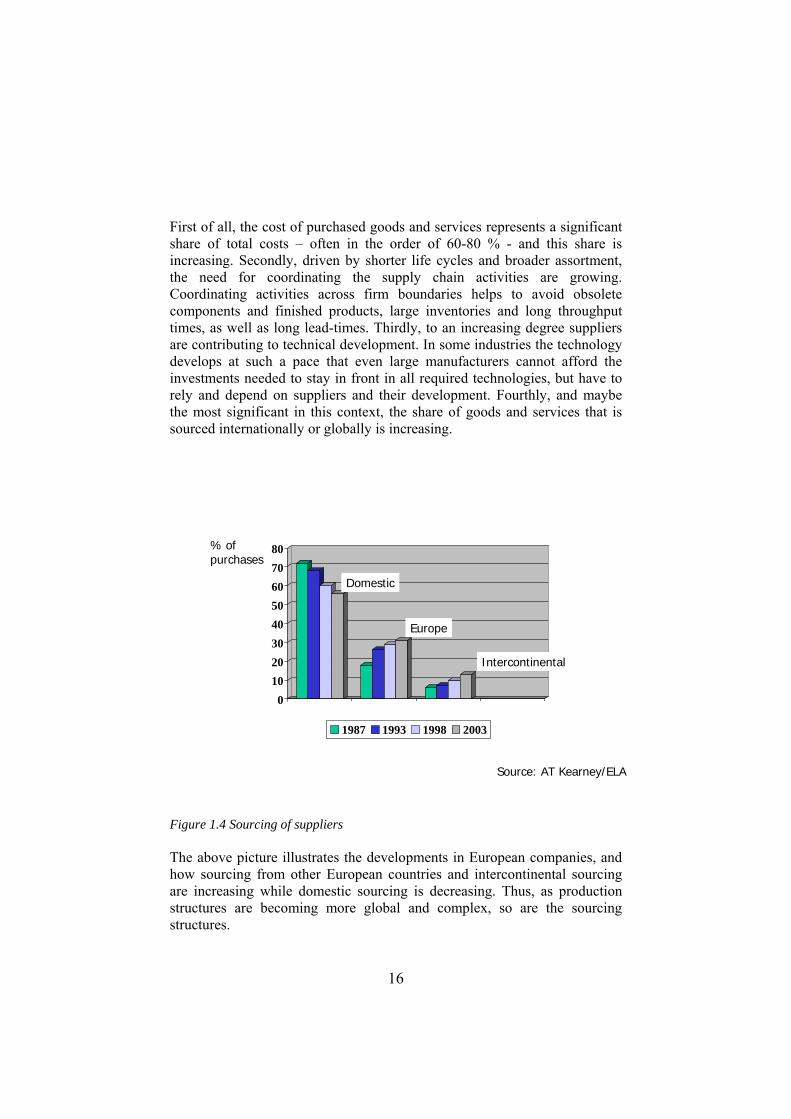
First of all, the cost of purchased goods and services represents a significant share of total costs – often in the order of 60-80 % - and this share is increasing. Secondly, driven by shorter life cycles and broader assortment, the need for coordinating the supply chain activities are growing. Coordinating activities across firm boundaries helps to avoid obsolete components and finished products, large inventories and long throughput times, as well as long lead-times. Thirdly, to an increasing degree suppliers are contributing to technical development. In some industries the technology develops at such a pace that even large manufacturers cannot afford the investments needed to stay in front in all required technologies, but have to rely and depend on suppliers and their development. Fourthly, and maybe the most significant in this context, the share of goods and services that is sourced internationally or globally is increasing.
Figure 1.4 Sourcing of suppliers The above picture illustrates the developments in European companies, and how sourcing from other European countries and intercontinental sourcing are increasing while domestic sourcing is decreasing. Thus, as production structures are becoming more global and complex, so are the sourcing structures.
01020304050607080
Domestic intercontinental
1987 1993 1998 2003
Domestic
Europe
Intercontinental
Sourcing of suppliers
Source: AT Kearney/ELA
% of purchases
01020304050607080
Domestic intercontinental
1987 1993 1998 2003
Domestic
Europe
Intercontinental
Source: AT Kearney/ELA
% of purchases
17
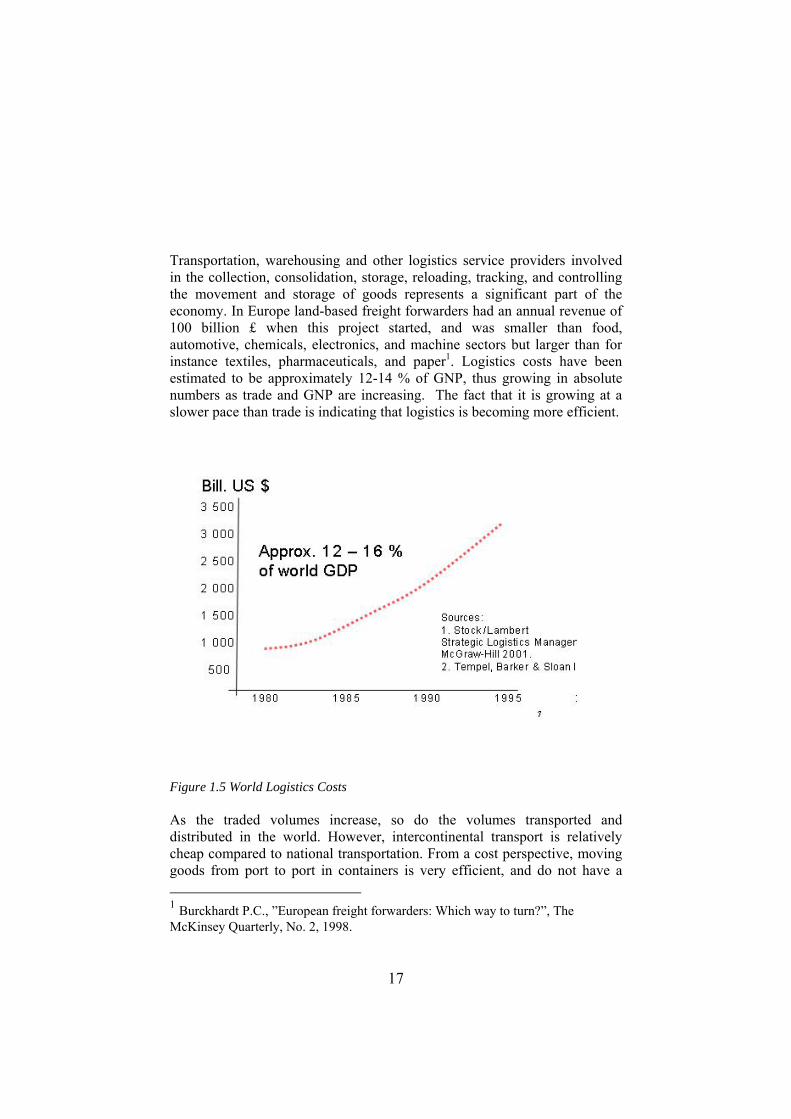
Transportation, warehousing and other logistics service providers involved in the collection, consolidation, storage, reloading, tracking, and controlling the movement and storage of goods represents a significant part of the economy. In Europe land-based freight forwarders had an annual revenue of 100 billion £ when this project started, and was smaller than food, automotive, chemicals, electronics, and machine sectors but larger than for instance textiles, pharmaceuticals, and paper1. Logistics costs have been estimated to be approximately 12-14 % of GNP, thus growing in absolute numbers as trade and GNP are increasing. The fact that it is growing at a slower pace than trade is indicating that logistics is becoming more efficient.
Figure 1.5 World Logistics Costs As the traded volumes increase, so do the volumes transported and distributed in the world. However, intercontinental transport is relatively cheap compared to national transportation. From a cost perspective, moving goods from port to port in containers is very efficient, and do not have a 1 Burckhardt P.C., ”European freight forwarders: Which way to turn?”, The McKinsey Quarterly, No. 2, 1998.
18
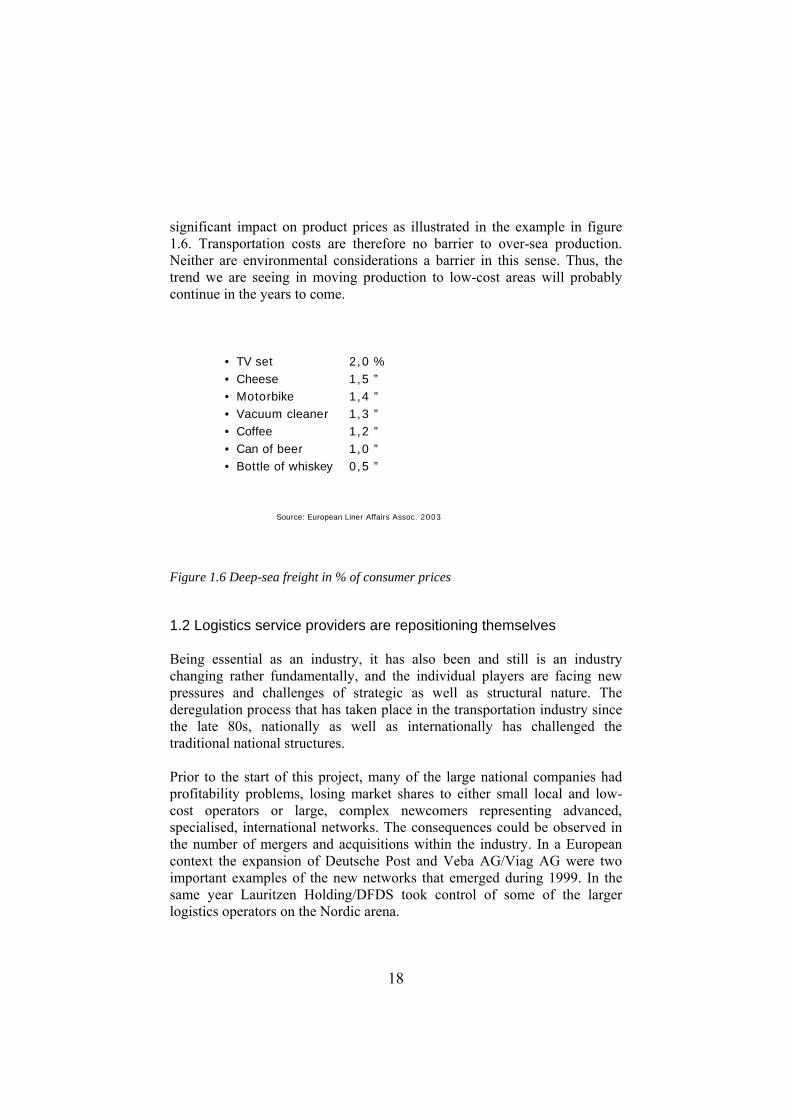
significant impact on product prices as illustrated in the example in figure 1.6. Transportation costs are therefore no barrier to over-sea production. Neither are environmental considerations a barrier in this sense. Thus, the trend we are seeing in moving production to low-cost areas will probably continue in the years to come.
Figure 1.6 Deep-sea freight in % of consumer prices 1.2 Logistics service providers are repositioning themselves Being essential as an industry, it has also been and still is an industry changing rather fundamentally, and the individual players are facing new pressures and challenges of strategic as well as structural nature. The deregulation process that has taken place in the transportation industry since the late 80s, nationally as well as internationally has challenged the traditional national structures. Prior to the start of this project, many of the large national companies had profitability problems, losing market shares to either small local and low-cost operators or large, complex newcomers representing advanced, specialised, international networks. The consequences could be observed in the number of mergers and acquisitions within the industry. In a European context the expansion of Deutsche Post and Veba AG/Viag AG were two important examples of the new networks that emerged during 1999. In the same year Lauritzen Holding/DFDS took control of some of the larger logistics operators on the Nordic arena.
• TV set 2,0 %• Cheese 1,5 ”• Motorbike 1,4 ”• Vacuum cleaner 1,3 ”• Coffee 1,2 ”• Can of beer 1,0 ”• Bottle of whiskey 0,5 ”
Source: European Liner Affairs Assoc. 2003
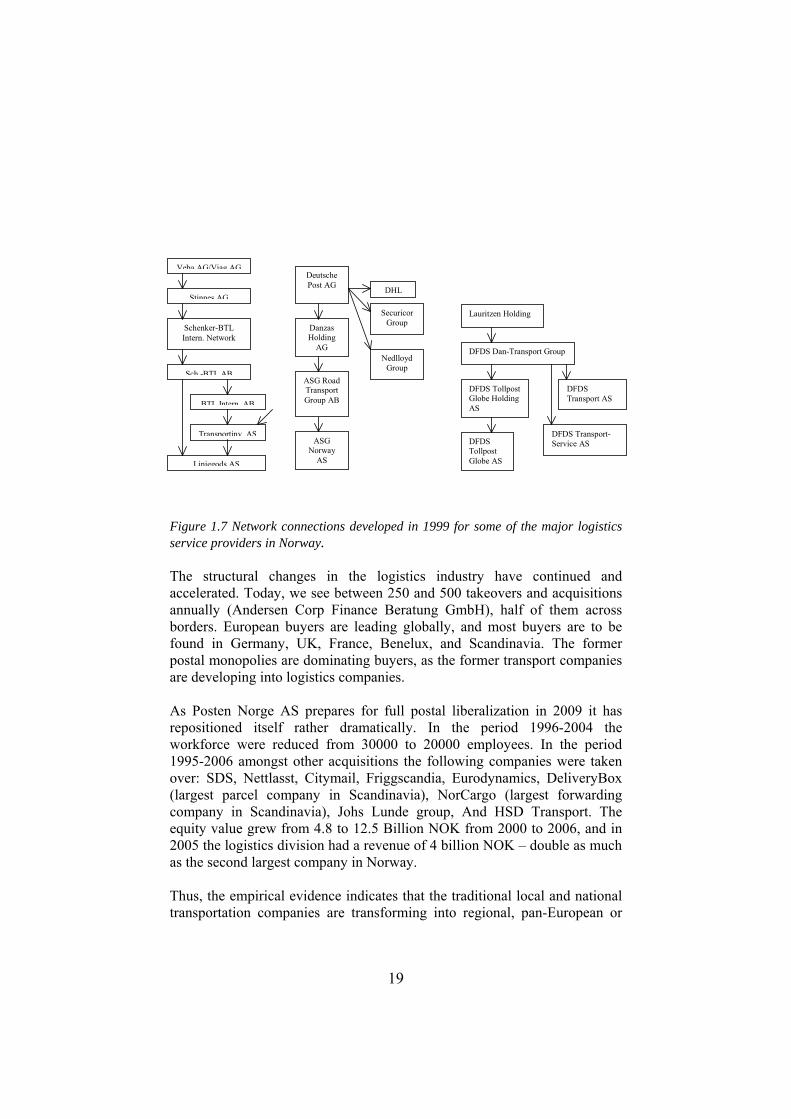
19
Figure 1.7 Network connections developed in 1999 for some of the major logistics service providers in Norway. The structural changes in the logistics industry have continued and accelerated. Today, we see between 250 and 500 takeovers and acquisitions annually (Andersen Corp Finance Beratung GmbH), half of them across borders. European buyers are leading globally, and most buyers are to be found in Germany, UK, France, Benelux, and Scandinavia. The former postal monopolies are dominating buyers, as the former transport companies are developing into logistics companies. As Posten Norge AS prepares for full postal liberalization in 2009 it has repositioned itself rather dramatically. In the period 1996-2004 the workforce were reduced from 30000 to 20000 employees. In the period 1995-2006 amongst other acquisitions the following companies were taken over: SDS, Nettlasst, Citymail, Friggscandia, Eurodynamics, DeliveryBox (largest parcel company in Scandinavia), NorCargo (largest forwarding company in Scandinavia), Johs Lunde group, And HSD Transport. The equity value grew from 4.8 to 12.5 Billion NOK from 2000 to 2006, and in 2005 the logistics division had a revenue of 4 billion NOK – double as much as the second largest company in Norway. Thus, the empirical evidence indicates that the traditional local and national transportation companies are transforming into regional, pan-European or
Veba AG/Viag AG
Stinnes AG
Schenker-BTL Intern. Network
Sch -BTL AB
BTL Intern AB
Transportinv AS
Linjegods AS
ASG Norway
AS
ASG Road Transport Group AB
Danzas Holding
AG
DeutschePost AG DHL
Securicor Group
Nedlloyd Group
DFDS Tollpost Globe AS
DFDS Tollpost Globe Holding AS
DFDS Dan-Transport Group
Lauritzen Holding
DFDS Transport AS
DFDS Transport-Service AS
20
global logistics service providers. New and different distribution networks are emerging as the logistics service providers are repositioning themselves.
1.3 Changing customer needs and expectations Parallel to the pressures that followed the deregulation process, customer needs and expectations have been changing. Customers or shippers are developing competitive advantage not only based on products and product features, but also based on superior delivery processes. They have come to accept the notion that superior processes towards the customer can create a sustainable competitive advantage. A consequence is that a growing number of shippers want fast, reliable, customised and cost-effective logistics processes towards their customers or customer segments. Since many of the customers are forced to concentrating on their core business, outsourcing many of their support activities, they are also re-evaluating their own logistics processes. There are many reasons for outsourcing an operation. Some of the more frequently given are factors such as: better focus on core business, access to world-class processes, products, services or technology, better capability of adjusting to changing environment needs, risk-sharing, releasing resources for other businesses, reducing the need for capital investments, better cash-flow, reducing operating costs, access to resources not available in own organisation, or difficulties related to managing on operation or parts of the business [Outsourcing Institute, 1996]. The important fact in this context is that this development has opened up for new opportunities in the 3. party logistics market. Many international buyers increasingly want to consolidate the number of suppliers they use. They expect the supplier to be able to provide more complete and integrated logistics services, adapted to the specific needs of the buyers. Suppliers are expected to have the capability to design, implement, and operate the entire or parts of the logistics processes of the customer. This can be observed in the growth of the 3. party logistics markets. While the market in general is large and growing2, the third-party logistics market is still small compared with the freight forwarding market as a whole, but is expecting to grow five to ten times faster over the next
2 According to several studies land-based transportation is expected to grow by 2-3 percent a year. The growth will particularly be in Eastern Europe and on an inter-regional level.

21
decade. Positioning yourself in these markets is therefore a major strategic challenge to many of the logistics operators. Changing customer needs are forcing the logistics service providers to address several new strategic issues. They have to develop strategies to improve performance and profitability in their existing business, and they have to develop strategies for further growth, making choices related to their products, markets and market segments, resources, and relationships and alliances etc.
1.4 The organization of distribution arrangements The organization of distribution has changed in a number of ways in business markets as well as in consumer markets during the last couple of decades. According to Narus and Andersen (1996) ‘forward looking companies are experimenting with their channels to make them more flexible and responsive’ (p.112). Business dynamics and emerging technologies have made it possible to respond to pressures to reduce costs and enhance service levels in novel ways. Buying firms increasingly require customized offerings from their suppliers of distribution services, implying that distribution solutions are tailored to industrial end user requirements (Gadde, 2003). More activity specialization can be observed among logistics or distribution service providers. This gives rise to specialized intermediaries rather than multi functional distributors, expanding the number of actors involved in the delivery of a product to a particular end customer. Simultaneously, the demands on coordinating the supply processes are increasing. Owing to the enhanced specialization among firms, the supply processes increasingly span the boundaries of several firms or organizations. By sharing capabilities and resources, channel members can offer better service at a lower cost then they could by acting alone. The ongoing changes lead to more differentiated distribution systems than traditionally was the case, and to stronger interdependencies among the actors and therefore also closer relationships. Parallel to this process, companies have outsourced not only traditional distribution activities, such as warehousing and transportation operations, but also managerial activities related to the flow of goods as well as certain production activities, such as kitting and sub-assembly operations, to logistics service providers. Simultaneously, the logistics service providers have developed their capabilities both in terms of broader service offerings and in terms of providing solutions adapted to specific customers or
22
customer segments. Though the majority of companies still do much of their logistics in-house, the 3PL market represents the fastest growing market for logistics service providers, which means that this trend of logistics outsourcing will continue. Today, we can also find cases where the companies are bringing logistics service providers even closer to the centre of operations. For instance, TNT Logistics, which is part of the Dutch post group, manages BMW´s supply chain to their North American factory in Spartanburg, from the moment a part is dispatched by a supplier until its installation in one of the vehicles on the production site. That means, among other things, that the fork-lift truck drivers shuttling components around the assembly line are employees not of the car manufacturer but of the logistics service provider (Financial Times, 2004). In fact examples like this illustrates how traditional roles of the supply chain participants are changing and firm boundaries are blurring. These developments in distribution arrangements have triggered an interest among managers as well as researchers for a whole range of empirical issues including firm positioning, exchange processes, adaptation and coordination, as well as the dynamics of distribution systems. Summing up some of these empirical observations, we can conclude that:
- The growth in trade and changes in trade patterns have a significant impact not only on the flow of goods but also on the supply-, production- and distribution systems
- Specialisation means increased outsourcing of logistics activities and functions – thus the growth of the 3rd party logistics markets
- Shippers require and expect process integration and more differentiated (and tailored) delivery processes
- Logistics service providers are repositioning themselves and we see new forms of collaboration and new types of logistics service providers
These empirical developments have been an important background to this project. The world of logistics as well as the world of distribution is changing and it seems crucial to try to understand at least some of the aspects of these changes. The focus of this study has been on logistics service providers, but on logistics service providers as actors in a distribution network. Also, of reasons that we will return to in the theoretical chapter, we have had the intention, through the project, to better understand the transition processes in specific and targeted industries, thus to study distribution networks in transition.
23
CHAPTER 2
The Dnet project – an overview
Göran Persson
2.1 Objectives and outputs from the project The overall objective of the DNet.project was originally formulated as follows: “ … to develop concepts, models and methods for helping firms in reconsidering their role and position in the value chain. This will be carried out by
a) Describing the transition process in targeted industries b) Analysing the transition from three different perspectives
a. The value creation process b. Contingencies for design c. Positioning and interaction among actors
c) Develop concepts, models and methods for explaining the transitions and the strategic actions of network participants”
Also, according to the research application, the expected output was defined as follows: “The physical output of the project will be
a) Two PhD-thesis within the targeted industries b) A book or a report with the working title “Distribution Networks in
Transition” c) Articles in scientific journals based on the cases involved in the
study d) Input to courses and educational programs at BI (specifically the
new major in Supply Chains and Networks)” Minor adjustments regarding both the overall objective and the output of the process, has been made during the process, mainly due to the fact that interests are maturing as the process goes along and that dissertations seem to have a will of their own. However, as can be observed in the outline of this report, we have studied the transitions in three different industries and analysed the transition from different perspectives. As far as the output is concerned, not two but actually three PhD-thesis has been produced within the context of the project.

24
2.2 Project organisation and management Responsible for the project has been The Department of Strategy and Logistics at The Norwegian School of Management BI. A detailed description of the project organisation can be found in enclosure 1.
2.3 Research approach and participating companies Two basic research approaches was applied in this project as far as the empirical studies are concerned. One approach was studies of the industry structure in relation to the participating companies. By this approach, the intention was to describe the industry, the transition processes in the industry, driving forces for changing positions, trends and patterns concerning the transition etc. The second approach was different studies of the distribution networks in which the participating companies take part. By this approach, we intended to explore issues concerning properties of distribution networks, contingencies for design of logistics and distribution networks, embeddedness as a contingency for specialization and integration etc.
When determining which industries might be interesting and interested in the study, an important criterion was that major changes could be observed in the industry, challenging and changing the roles and positions of the actors. After having considered several such industries we have chosen to focus on three: the electronics waste industry, the car industry, and the fast moving consumer goods (FMCG) industry, or rather segments of these industries. Setting no 1: A relationship between Møller Logistikk and Autolink AS Rationale: The car industry is experiencing significant changes, e.g. because of new rules from EU (Block Exemption Rules). Large actors are making changes in their distribution networks, which will drive forward new structures and a new basis for competitive advantage. Setting no 2: RENAS (Recycling of industrial electronic equipment) Rationale: New demands to collect waste has driven forth a development of new actors and changed the waste industry. Norway has unique solutions for collection of EE (electric and electronic) products. EU has recently implemented rules based on the same model as Norway. It is expected great developments within this area.
25
Setting no 3: A relationship between VSD and DHL Rationale: Actors in the Fast Moving Consumer Goods area. This is an area that has experienced major changes, and is faced with challenges to restructure in order to continue to secure competitive advantage. Phases in the project The project followed four distinct phases as described in enclosure 2. Basically, the phases were as follows: Phase 1 Project Mobilization 2003 Phase 2 Industry studies 2004 Phase 3 Case studies 2005/2006 Phase 4 Synthesis 2006/2007 In the first phase contracts were signed with the participating companies and plans were made for the empirical studies. Also PhD-students were recruited to the program. The second phase involved interviews with major actors in the participating companies business network, as well as studies of secondary data, In the third phase the participating companies and their context were analysed, and the PhD-students continued their specific data collection. In the forth phase focus has been on the dissertations as well as this report.
2.4 PhD-dissertations Below follows a short abstract from the three dissertations. 2.4.1 “The role of intermediaries in distribution: A Study of Car
Logistics”, by Leif-Magnus Jensen (Møller/Autolink) This dissertation can be related to an old question within the marketing channel literature – what is the value of the middleman? However, to make the question more specific, and considering that the empirical setting of the project is distribution, the question becomes: What is the role of the intermediary in distribution? In this dissertation, intermediaries as a group are exemplified by a logistics service provider. Such logistics service providers do not own the goods they transport or otherwise handle, but provide services required for successful distribution.

26
A further restriction is that I only deal with the distribution of finished goods. The domain is therefore from factory door to end customer. There are three main reasons for this limitation. Firstly the empirical setting is distribution – this is related to the DNet project. Secondly, the particular distribution setting chosen (automobiles) shows a fairly complex set of intermediaries making it interesting for study. Finally, the distribution literature (for example (Alderson 1954; Stern and Reve 1980) has a great deal to say about the functions served by intermediaries and the structure of distribution channels. This literature is then consistent both with the issue of theoretical interest (intermediaries) and the empirical setting (car distribution). The topic of the role of intermediaries is by no means new, but there are several reasons for exploring it further. The most important is that the changes in distribution structures related to increased specialization makes it likely that the set of roles available to firms in distribution has changed. In this sense some of the older theory regarding intermediaries may no longer be appropriate for describing today’s reality. This issueis approached through looking at a current distribution system, using an inductive approach to deal with the following research questions: What, if any, specific roles of an intermediary (in terms of functions and coordination mechanisms) can be identified in the distribution system? What are the features of such roles in terms of coordination and activity structures? The study will use the variation between how different manufacturers employ the focal logistics service provider to describe and analyze the roles for intermediaries and the implications of these. 2.4.2 “Transportation mode selection in supply chain planning models”,
by Erna S.Engebrethsen (VSD/DHL) The main focus of the thesis is to investigate under which conditions the selection of transportation mode should be integrated with other types of supply chain planning decisions, contrary to selecting it in isolation. This research is motivated by several empirical observations.
- Firstly, the number of logistics service providers drastically increased as a result of deregulation of transportation industry in
27
USA in 80s and in Europe in 90s. Instead of using the same common tariffs for their services, the transportation companies got an opportunity to price their services individually, which in turn resulted in variety of rates and discount schedules at the market. The freight rates are often non-linear, incorporating economies of scale and discounts, as well as constraints on the total volume or weight of the load. When outsourcing transportation, companies can choose among different types of providers with various modes (rail, road, sea, with various sizes of containers) and discount schedules, depending on shipment size, such as FTL (full truck load) or LTL (less than truckload) shipments. Shippers can now choose among a high number of actors offering transportation services with complex price structures and varying operational conditions. This increased solution space and decision-making complexity, motivate our study of transportation mode selection problems.
- Secondly, logistics network design, including location of facilities and allocation of products, is traditionally considered as a strategic long-term decision that is typically made prior to any tactical decision like for example lot sizing. However, due to increased outsourcing of warehousing and other logistics services, frequent redesign of the existing logistics network becomes more common, allowing the companies to expand or shrink their network as needed in a shorter term. Because the time span of network design decisions becomes shorter, a stronger interaction between these and tactical decisions, such as inventory management is needed.
- Thirdly, when conducting the case studies at VSD and DHL we have observed, that companies often make transportation mode decisions in a simplified way. For example, when choosing a transportation provider, the shipper often chooses the one with the lowest total transportation costs under the assumption that demand for all products is shipped using full containers of one size. Such practice is not always optimal, as it does not consider the trade-off between the inventory and transportation costs, as well as the possibility of using containers of other sizes in some periods. This is particularly relevant in the realistic case of time–varying demand.
In the thesis an extensive review of the operations-research literature is provided, in order to identify supply chain planning models that incorporate transportation mode selection. I identify different types of such integrates models and characterize the way transportation mode selection is integrated. The literature is classified into general mode selection, network design, inventory management and operational decision- making.
28
I conduct case studies in Nordic logistics service companies (VSD and DHL) and identify relevant decision-making problems, which are compared with existing models from the literature. Based on identified gaps, I develop extended models to (1) assess the potential benefits of integrating mode selection and (2) realize these benefits. When comparing the models existing in the literature and a decision problem faced by a case company, I observed that the problem of splitting a multi-item shipment among different transportation modes as well as the possibility of using lateral transshipment, are not sufficiently covered in the existing literature. I suggest a novel formulation for a multi-item dynamic lot-sizing model with lateral warehouse transshipments and test it, using the standard solver Xpress-MP. The suggested MIP-model considers competing transportation modes and various discount schedules in freight costs. Using the actual data from the case company, I analyze the model based on various example problems, showing the potential savings from incorporating mode selection into a lot-sizing model. I also discuss managerial implications and implementation issues and suggest paths for further research. 2.4.3 “Coordinated Action in Reverse Distribution Systems”, by Bente
Flygansvær (RENAS) Reverse distribution systems are the topic of this thesis. The term ‘reverse’ refers to the collection of products at end-of-life for the purpose of recovery and waste management. We specifically study the area of electrical and electronic product waste. Such distribution systems are becoming a more visible and commercially significant part of the modern business environment, and this makes them interesting to study. The importance of understanding the interaction effects between the coordination mechanisms of two crucial flows, physical flows and commercial interests, in distribution systems is the main thrust of this study. This is something that has largely gone unnoticed in the distribution literature because these flows are essentially explored in two different research traditions. Physical flows have been the focus of attention in the logistics and supply chain management literature, while commercial interests have been tackled by the governance literature. A major theoretical contribution of this thesis, therefore, has been to reunite these complementary aspects of the distribution system in order to make sense of how the two flows work together to create coordinated action, which in turn enables system goals to be achieved.
29
Therefore, our problem statement is: How do the coordination mechanisms for physical flows and commercial interests interact in order to achieve coordinated action in reverse distribution systems? A case study research strategy has been chosen because we are dealing with a relatively new phenomenon that is studied in its real life context. We use three cases, which relate to three different reverse distribution systems – all of which deal with electrical and electronic (EE) products at end-of-life. Each case covers a five-year period, which starts out from the time the initiative was introduced in Norway (1999). The data collection consists of interviews with the different types of actors that take part in the systems and different sources of secondary data. The system has been our unit of analysis, which we believe is a contribution in its own right and another reason for utilizing the case study strategy. Our results show that there are interaction effects between the coordination of physical flows and commercial interests. The choice of coordination mechanisms is interdependent between the two types of flows. We argue that each flow addresses different categories of costs and provides different categories of service and value to the end-consumer segments. In one case we are able to highlight that a lack of coordination across the flows increases costs and reduces service and value, and thus does not achieve coordinated action in the reverse distribution system. In contrast, another case shows that coordination across the flows contributes to lower costs and higher service and value, which suggest that the reverse distribution system achieves coordinated action. Each of three systems has chosen different combinations of coordination mechanisms, which have resulted in different levels of costs, service and value in the reverse distribution systems. To conclude our study, we summarize our findings as a set of propositions. We also discuss at length two particularly interesting matters that arise from the study, which are the role of a coordinator in the systems and the significance of the collection function. These present opportunities for further research.
2.5 Other publications In addition to the PhD-dissertations, the final output of the project was planned to be a report with the working title “Distribution Networks in Transition”, preceded by papers at international research conferences (NOFOMA, IMP), and articles in international refereed journals in logistics and marketing (International Journal of Logistics Management, International
30
Journal of Physical Distribution, Journal of Relationship Marketing). In enclosure 3 the reader will find a list of articles, papers, and cases that are related to the project.
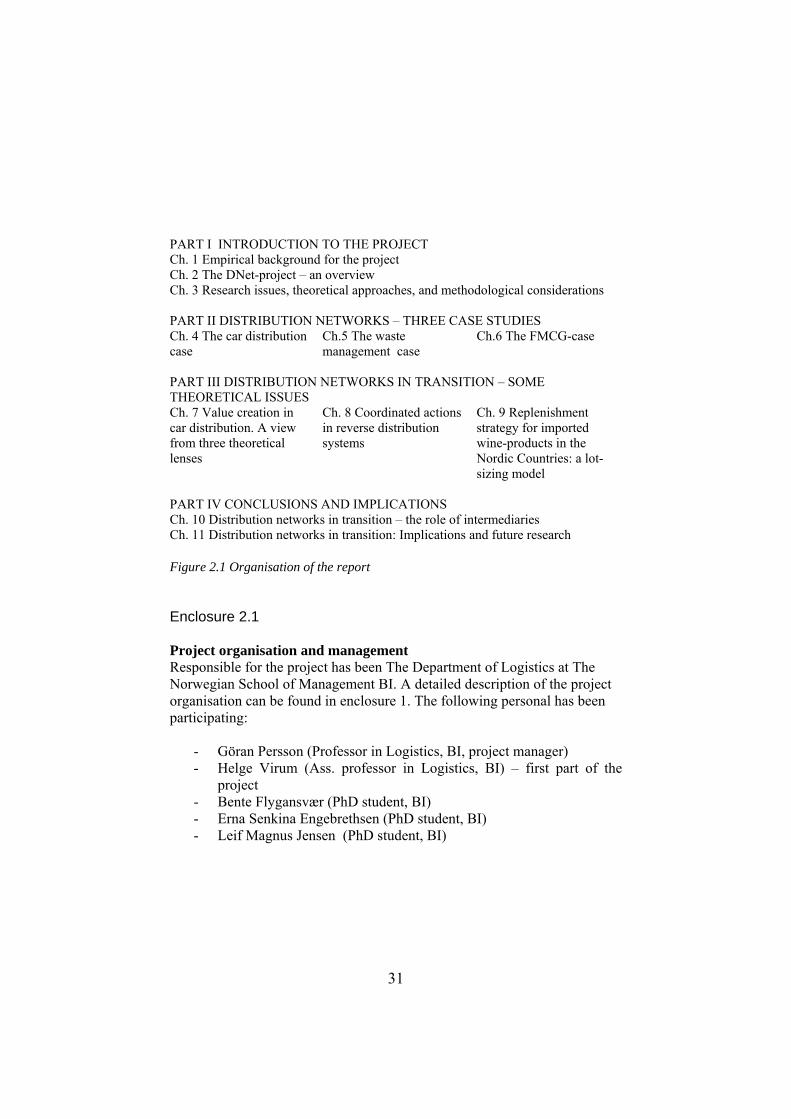
2.6 Outline of the report While the dissertations basically are individual achievements, the common ground for the DNet-project has been the case studies. There has also been a common interest for distribution arrangements, and in particular for logistics service providers and their role in these arrangements. Evidently the dissertations stands by themselves and are published separately. However, with this report we try to cover some of the common ground of the project and its purpose. This is the reason we have divided the report into four parts. In part I, we have tried to give a brief overview of the project as such (Chapter 2) as well as some of the empirical arguments for such a project (Chapter 1). There is also a review of some of the research relevant for understanding distribution arrangements. In part II, which is the major element of the report, the three different cases and the industries they represent will be described and discussed. Thus, the car distribution case is discussed and analysed in chapter 4, the waste management case in chapter 5, and the fast moving consumer goods case in chapter 6. The three chapters are basically following the same format, starting with an overall empirical analysis of the industry, followed by the case analysis, and ending up with discussions concerning the transitions in that particular context and the challenges for the case companies. In Part III we have attempted to give a flavour of the dissertations by following up each of the three empirical settings with a focused theoretical analysis. Thus it contains three chapters also related to three areas of interests (see below in chapter 3). In chapter 7 value creation in car distribution in discussed and analysed. The waste management setting is followed up by a chapter on coordinated action in reverse distribution system (chapter 8). Finally, in chapter 9 the FMCG setting is followed up by a paper on a lot-sizing model. Each of these topics is closely related to the dissertations. In the last part, we try to summarize some of the findings concerning the transition process in the three industries, (Chapter 10) and outline some implications for future research (Chapter 11). The outline and organisation of the report is illustrated in figure 2.1. As the report has been organised, the chapters can more or less be read independently, and the reader can choose his chapters based on his own preferences and perspective.
31
PART I INTRODUCTION TO THE PROJECT Ch. 1 Empirical background for the project Ch. 2 The DNet-project – an overview Ch. 3 Research issues, theoretical approaches, and methodological considerations PART II DISTRIBUTION NETWORKS – THREE CASE STUDIES Ch. 4 The car distribution case
Ch.5 The waste management case
Ch.6 The FMCG-case
PART III DISTRIBUTION NETWORKS IN TRANSITION – SOME THEORETICAL ISSUES Ch. 7 Value creation in car distribution. A view from three theoretical lenses
Ch. 8 Coordinated actions in reverse distribution systems
Ch. 9 Replenishment strategy for imported wine-products in the Nordic Countries: a lot-sizing model
PART IV CONCLUSIONS AND IMPLICATIONS Ch. 10 Distribution networks in transition – the role of intermediaries Ch. 11 Distribution networks in transition: Implications and future research Figure 2.1 Organisation of the report Enclosure 2.1 Project organisation and management Responsible for the project has been The Department of Logistics at The Norwegian School of Management BI. A detailed description of the project organisation can be found in enclosure 1. The following personal has been participating:
- Göran Persson (Professor in Logistics, BI, project manager) - Helge Virum (Ass. professor in Logistics, BI) – first part of the
project - Bente Flygansvær (PhD student, BI) - Erna Senkina Engebrethsen (PhD student, BI) - Leif Magnus Jensen (PhD student, BI)
32
Also related to the project and particularly supporting the PhD-students in their work:
- Lars-Erik Gadde (Professor in Industrial Marketing & distribution, Chalmers)
- Atle Nordli (Ass. professor in Logistics, BI) - Lars Huemer (Ass. professor in Strategy, BI) - Stein-Erik Grønland (Professor II in Operations and Logistics, BI) - Stephane Dauzere-Peres (Professor in Operations Management,
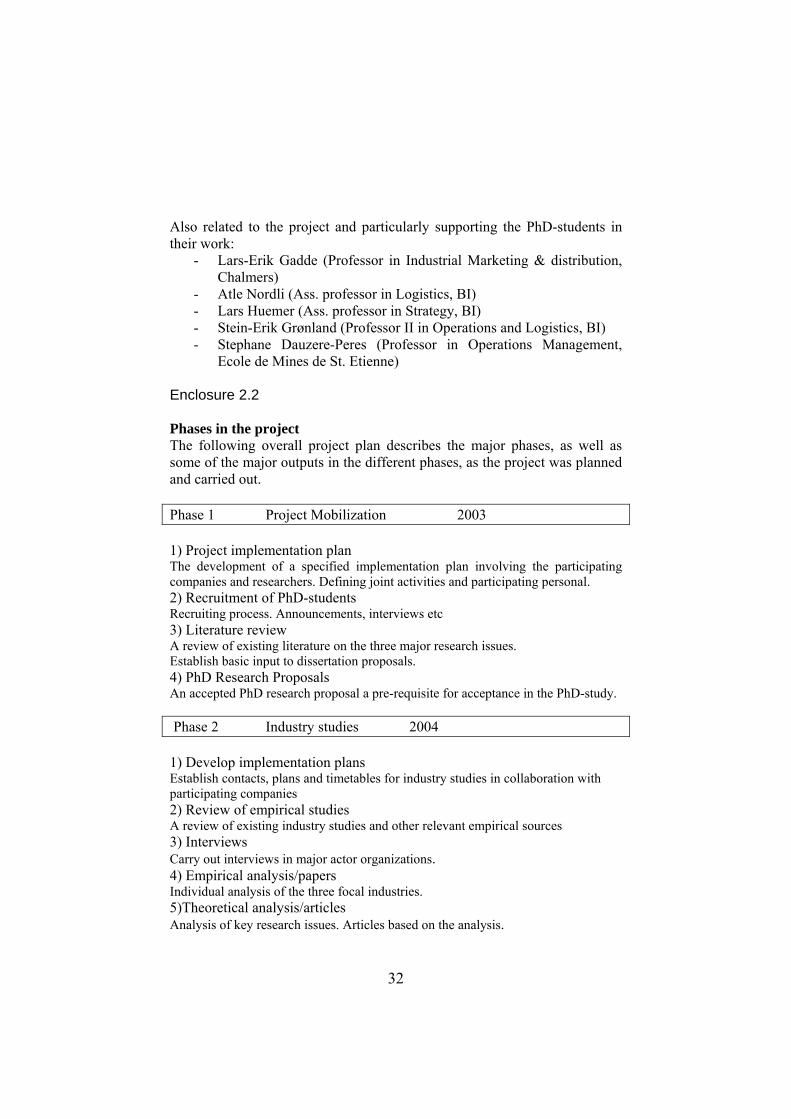
Ecole de Mines de St. Etienne) Enclosure 2.2 Phases in the project The following overall project plan describes the major phases, as well as some of the major outputs in the different phases, as the project was planned and carried out. Phase 1 Project Mobilization 2003 1) Project implementation plan The development of a specified implementation plan involving the participating companies and researchers. Defining joint activities and participating personal. 2) Recruitment of PhD-students Recruiting process. Announcements, interviews etc 3) Literature review A review of existing literature on the three major research issues. Establish basic input to dissertation proposals. 4) PhD Research Proposals An accepted PhD research proposal a pre-requisite for acceptance in the PhD-study.
Phase 2 Industry studies 2004 1) Develop implementation plans Establish contacts, plans and timetables for industry studies in collaboration with participating companies 2) Review of empirical studies A review of existing industry studies and other relevant empirical sources 3) Interviews Carry out interviews in major actor organizations. 4) Empirical analysis/papers Individual analysis of the three focal industries. 5)Theoretical analysis/articles Analysis of key research issues. Articles based on the analysis.
33
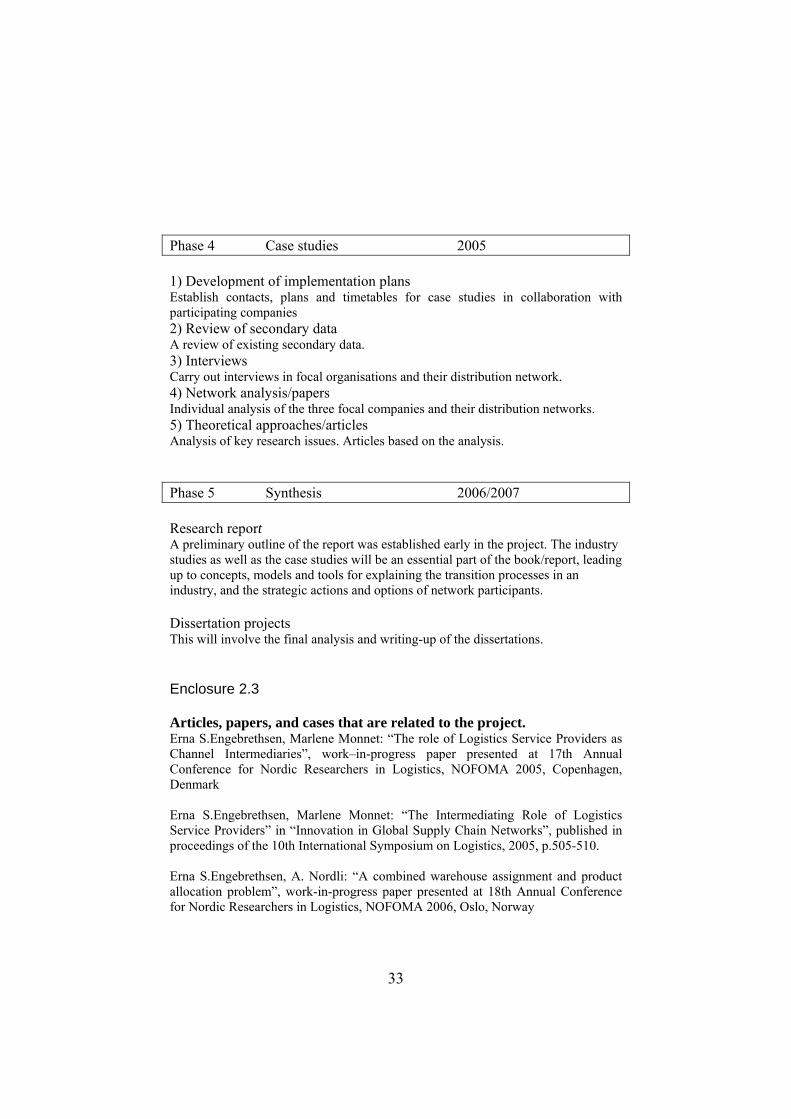
Phase 4 Case studies 2005 1) Development of implementation plans Establish contacts, plans and timetables for case studies in collaboration with participating companies 2) Review of secondary data A review of existing secondary data. 3) Interviews Carry out interviews in focal organisations and their distribution network. 4) Network analysis/papers Individual analysis of the three focal companies and their distribution networks. 5) Theoretical approaches/articles Analysis of key research issues. Articles based on the analysis.
Phase 5 Synthesis 2006/2007 Research report A preliminary outline of the report was established early in the project. The industry studies as well as the case studies will be an essential part of the book/report, leading up to concepts, models and tools for explaining the transition processes in an industry, and the strategic actions and options of network participants. Dissertation projects This will involve the final analysis and writing-up of the dissertations. Enclosure 2.3 Articles, papers, and cases that are related to the project. Erna S.Engebrethsen, Marlene Monnet: “The role of Logistics Service Providers as Channel Intermediaries”, work–in-progress paper presented at 17th Annual Conference for Nordic Researchers in Logistics, NOFOMA 2005, Copenhagen, Denmark Erna S.Engebrethsen, Marlene Monnet: “The Intermediating Role of Logistics Service Providers” in “Innovation in Global Supply Chain Networks”, published in proceedings of the 10th International Symposium on Logistics, 2005, p.505-510. Erna S.Engebrethsen, A. Nordli: “A combined warehouse assignment and product allocation problem”, work-in-progress paper presented at 18th Annual Conference for Nordic Researchers in Logistics, NOFOMA 2006, Oslo, Norway

34
G. Persson & H. Håkansson, “Supply Chain Management – the logic of supply chains and networks”, in International Journal of Logistics Management, 2004. G. Persson and M. Jahre, Supply Chain Management “and beyond”, Magma No 5, 2003. G. Persson & M. Jahre, “Origins, influences and assumptions in Business Logistics. Avenues for future research”. NOFOMA, København, 2005 G. Persson, M. Jahre & G. Gripsrud, “Supply Chain Management – back to the future”, NOFOMA, Linkøping, 2004. Published in Int. Journal of Physical Distribution, 2006. G. Persson and F. Awaleh, “Development and business relationships – A case study”. NOFOMA, Linkøping, 2004 G. Persson & H. Håkansson, “Supplier segmentation – when relationships matters”. Accepted for publication in IMP-Journal, 2006. Jensen, Leif-Magnus, ”Activity Structures and Performance in Distribution,” NOFOMA 2005, Paper presented as work in progress. Flygansvær, Bente & Jensen, Leif-Magnus, “Value creation in car distribution – A view from three theoretical lenses,” Paper presented at FIBE 2006. Flygansvær, Bente & Jensen, Leif-Magnus, “Value creation in car distribution – A look through three theoretical lenses,” NOFOMA 2006, Conference proceedings. Cases Cases published in Arlbjørn, et.al (Eds.), Nordic case reader in Logistics and Supply Chain Management, University Press of Southern Denmark, 2006. Leif-Magnus Jensen: Car Import Logistics: Responding to Change. Gøran Persson: World Wide Distribution a/S – Re-Evaluating the Supply Chain. Bente Flygansvær: Improving Processes in a Pre Delivery Inspection Centre for Cars. Erna S. Engebrethsen: Future Directions for Collaboration and Challenges for Logistics Service Providers. Bente Flygansvær: Restructuring a Recycling System for E-Waste: “What Buttons to Push”.

35
CHAPTER 3
Research issues, theoretical approaches, and methodological considerations
Göran Persson
3.1 Introduction The developments in distribution arrangements discussed in chapter 1 have triggered an interest among managers as well as researchers for a whole range of empirical issues including firm positioning, exchange processes, adaptation and coordination, as well as the dynamics of distribution systems. One of the most popular management concepts today, addressing some of these inter-organizational issues is Supply Chain Management (SCM). The concept supply chain management was coined in the early 1980s by consultants in logistics (Oliver and Webber 1982). In their original formulation, the authors underlined that the supply chain must be viewed as a single entity and that strategic decision-making at the top level is needed to manage the chain. This viewpoint is shared with logisticians as well as channel theorists in marketing. Originally marketing was defined as “…a series of activities which are involved in the flow of goods from production to consumption” (American Marketing Association 1935 in Gripsrud 2004). The importance of distribution is evident as is the similarity to business logistics as well as SCM. During the 1950s, however, the physical aspects of exchange became the domain of logistics, whereas marketing developed a stronger focus on the social aspects of exchange (Bartels 1998), establishing the “division of labour” between the disciplines. Whereas marketing now mainly focus on dyadic relationships in terms of power, conflict and transaction costs, i.e. the legal and psychological aspects of exchange, physical aspects of channels involving more than two parties are left to business logistics and SCM. The developments within the three areas distribution research, business logistics, and supply chain management, and what these developments involve as far as studies of distribution arrangements is concerned, have been discussed in depth in the article “Supply Chain Management – back to the future” (Gripsrud, Jahre & Persson, 2006). In the following sections
36
these developments are summarized, before we turn to the issues focused in this study,
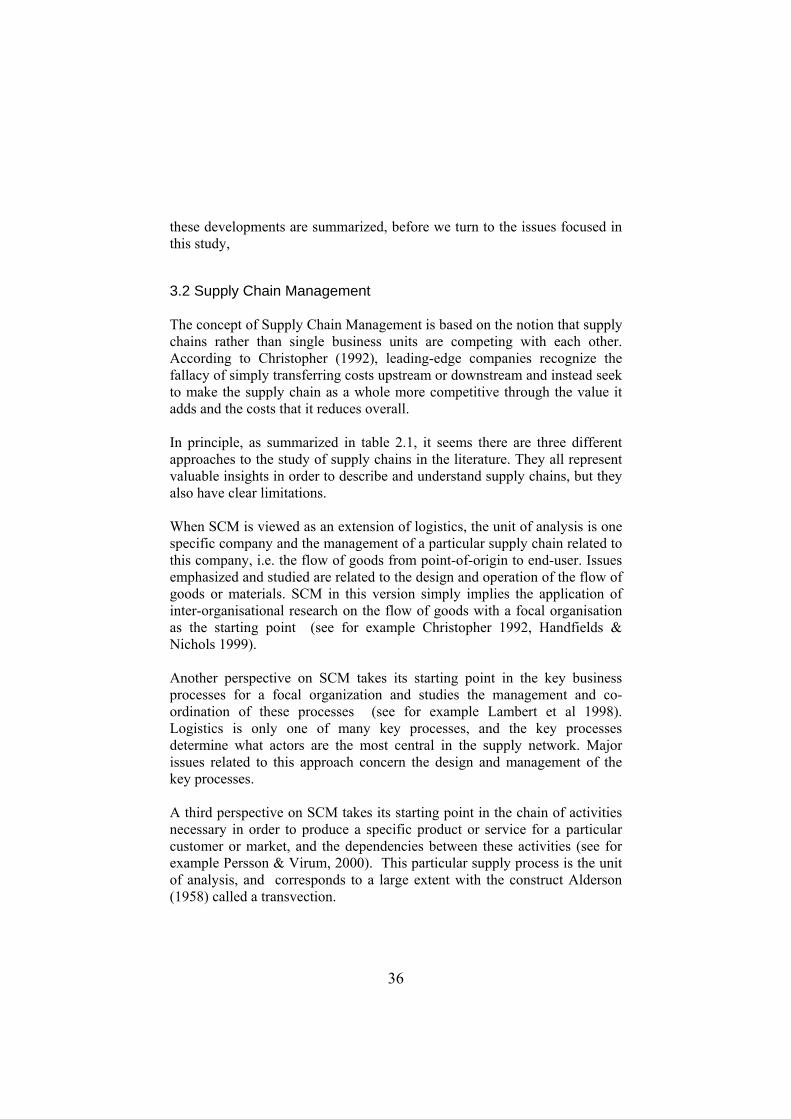
3.2 Supply Chain Management The concept of Supply Chain Management is based on the notion that supply chains rather than single business units are competing with each other. According to Christopher (1992), leading-edge companies recognize the fallacy of simply transferring costs upstream or downstream and instead seek to make the supply chain as a whole more competitive through the value it adds and the costs that it reduces overall. In principle, as summarized in table 2.1, it seems there are three different approaches to the study of supply chains in the literature. They all represent valuable insights in order to describe and understand supply chains, but they also have clear limitations. When SCM is viewed as an extension of logistics, the unit of analysis is one specific company and the management of a particular supply chain related to this company, i.e. the flow of goods from point-of-origin to end-user. Issues emphasized and studied are related to the design and operation of the flow of goods or materials. SCM in this version simply implies the application of inter-organisational research on the flow of goods with a focal organisation as the starting point (see for example Christopher 1992, Handfields & Nichols 1999). Another perspective on SCM takes its starting point in the key business processes for a focal organization and studies the management and co-ordination of these processes (see for example Lambert et al 1998). Logistics is only one of many key processes, and the key processes determine what actors are the most central in the supply network. Major issues related to this approach concern the design and management of the key processes. A third perspective on SCM takes its starting point in the chain of activities necessary in order to produce a specific product or service for a particular customer or market, and the dependencies between these activities (see for example Persson & Virum, 2000). This particular supply process is the unit of analysis, and corresponds to a large extent with the construct Alderson (1958) called a transvection.
37
Table 3.1 Approaches in Supply Chain Management studies (adapted from Persson and Virum 2000). Thus, fundamentally the first two approaches take a focal organisation as the starting point of the analysis. The focus is on this particular business unit and the relationships this business unit has to upstream and downstream actors. The third approach is different, in the sense that the unit of analysis in this case is a defined supply chain and the actors taking part in that chain. Basically, it can be claimed that this approach represents the only inter-organisational approach to supply chains. 3.3 Business Logistics Logistics in its modern civilian version has usually been defined in terms like ‘the art of managing the flow of materials from source to user’ (Magee et al 1985). In this respect logistics operations have always been crucial for the efficiency of firms and industries. However, in a long-term perspective significant changes have occurred when it comes to the perceptions of the most important issues in the art of managing the flow of materials. A literature review makes it possible to identify at least three ‘transformations’ during the last fifty years in the art of managing the flow
A supply process defined by a given product or service
Key business processes
Flow of goodsUnit of study
Network of participating business units/ system
Business unit/Dyadic relationship
Business unit/company
Perspective
SCM as the study of a specific supply process
SCM as an enhanced process management concept
SCM as an extension of thebusiness logistics concept
Approach

38
of materials (for historical overviews see for example Stock 1990, Mc Ginnis et al 1994, Kent and Flint 1997, Cooper et al 1997, or Ballou 1992).
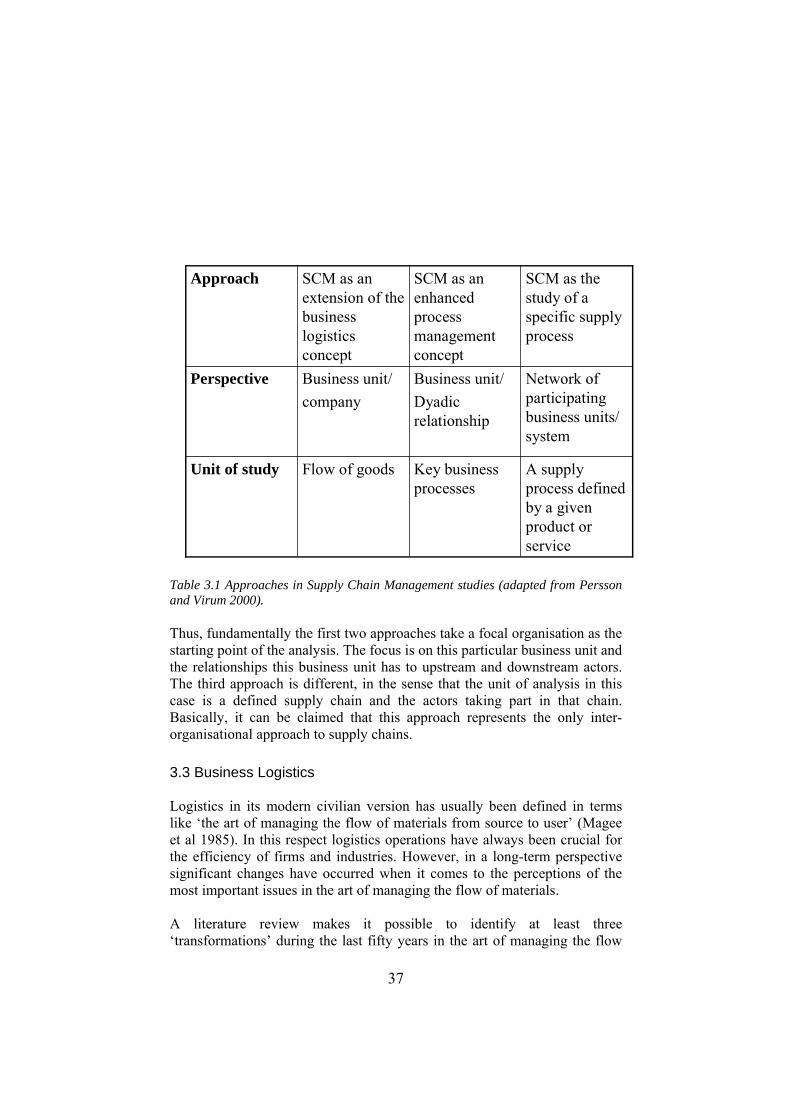
Table 3.2 Phases in the development of the business logistics concept (adapted from Kent and Flint 1997). The logistics era prior to 1950 has been characterised as the ‘dormant years’ when logistics was not considered a strategic function (Ballou 1978). On the contrary, a common view was that ‘firms had to carry out logistics just to be in business’ and ‘all too often the activities were treated as cost absorbing’ Around 1950 changes occurred that could be classified as a first ‘transformation’. The ‘total cost concept’ approach was introduced, which became an important principle in the development of business logistics. The underlying conceptual framework was claimed to be the ‘integrating systems view’, focusing on logistics as an entire system of activities working with and relying on one another. Thus, the first ‘transformation’ of logistics development was focused on reduction of total costs in logistics. The second ‘transformation’ had its roots in an enlarged perspective on logistics as a management discipline in a much broader sense than before. In this period, thinking about logistics changed ‘from a relatively compartmentalised orientation toward a relatively integrated one’. This, in turn, emphasised the interfaces to other disciplines and the need for ‘linking them together’
The Business Logistics Concept
Process orientationTBM, Lean production, ECR etcSCM- concept, the value chain concept
Third transformation
80/90-
Management disciplineInterfaces between disciplines (marketing, production, distribution)Balance logistics services and costsSystems perspective
Second transformation
70-
TCC, Reduction of total costsPhysical distribution separate function
First transformation
50-70
Cost absorbingOptimising
The dormant years
<50

39
The third ‘transformation’, finally, moved logistics in the direction of process orientation. Logistics were influenced by concepts such as Time Based Management, Lean Production and Efficient Consumer Response. This ‘transformation’ began as a defensive response to the need to become ‘leaner’. However, the process capabilities gained through these efforts could also be used in more active ways. Kent and Flint (1997) argue that from now on logistics was considered ‘a critical component in the strategy of the firm’ and the problem in focus was how to link together ‘the whole supply chain and create value for the consumer and be competitive in world markets’.
3.4 Distribution research A century ago, marketing emerged as an academic discipline from economics (Jones and Monieson, 1990). The centre of attention in the new discipline was empirical studies of how the distributive functions were carried out in different industries. Starting out with descriptive analyses of how the various distribution functions and activities were performed in society, the focus was on the vertical system as a whole up to the 50’s. The “managerial approach” to the marketing discipline developed through the 1950s and first appeared on the textbook scene with “Basic Marketing” authored by McCarthy (1960). The emerging new managerial approach to marketing meant that distribution became just one of the four “P’s” (product, price, promotion and place), while it had previously been at the core of the discipline. In the period 1950-1970, competing approaches to distribution research in marketing existed, as the emerging managerial approach gradually substituted the functionalist and system-wide approach. Since then, two distinct periods of managerial approaches may be discerned. The first was the behavioural type of research focusing on power and conflict management which dominated in the 1970s. During this period, the “dyad” was introduced as the theoretical unit of analysis, but much empirical work still was undertaken at the firm level. The second type of research, which remains dominant today, is preoccupied with how incentives for particular types of conduct may be most efficiently established. It builds on transaction cost economics and the focus is on governance structure.
40
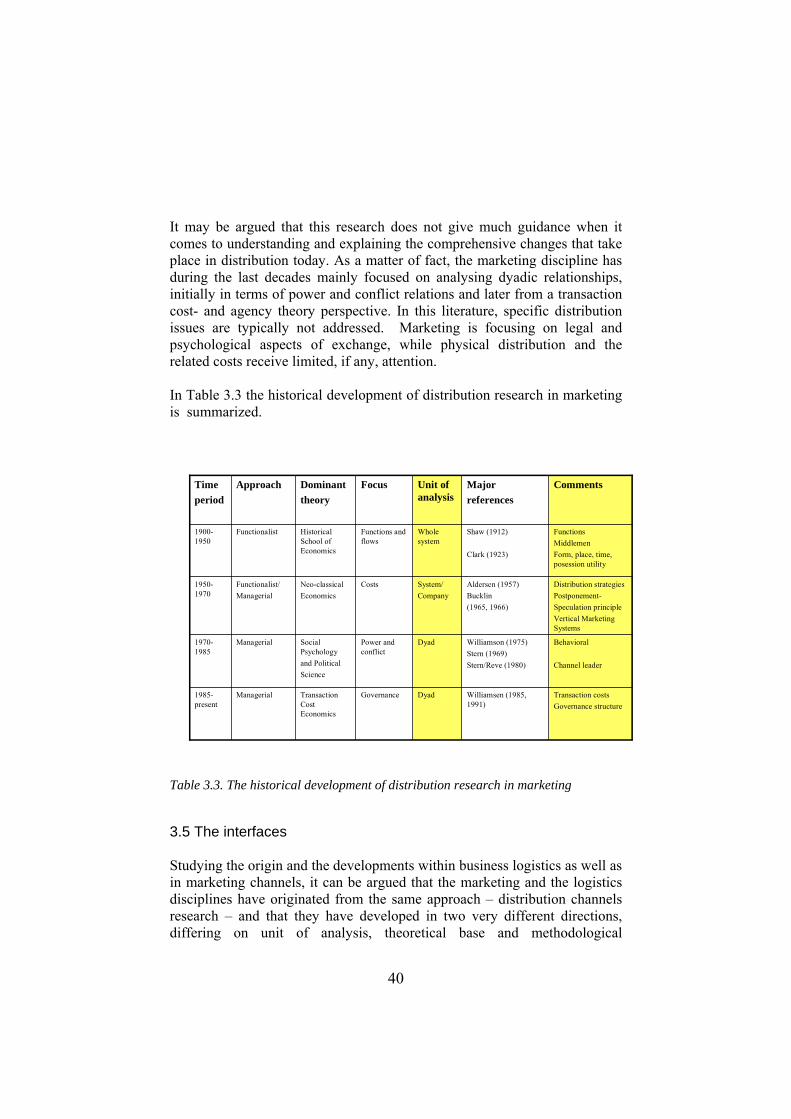
It may be argued that this research does not give much guidance when it comes to understanding and explaining the comprehensive changes that take place in distribution today. As a matter of fact, the marketing discipline has during the last decades mainly focused on analysing dyadic relationships, initially in terms of power and conflict relations and later from a transaction cost- and agency theory perspective. In this literature, specific distribution issues are typically not addressed. Marketing is focusing on legal and psychological aspects of exchange, while physical distribution and the related costs receive limited, if any, attention. In Table 3.3 the historical development of distribution research in marketing is summarized.
Transaction costsGovernance structure
Williamsen (1985, 1991)
DyadGovernanceTransaction Cost Economics
Managerial1985-present
Williamson (1975)Stern (1969)Stern/Reve (1980)
Aldersen (1957)Bucklin(1965, 1966)
Shaw (1912)
Clark (1923)
Majorreferences
Behavioral
Channel leader
DyadPower and conflict
Social Psychologyand PoliticalScience
Managerial1970-1985
Distribution strategiesPostponement-Speculation principleVertical Marketing Systems
System/Company
CostsNeo-classicalEconomics
Functionalist/Managerial
1950-1970
FunctionsMiddlemenForm, place, time, posession utility
Whole system
Functions and flows
HistoricalSchool ofEconomics
Functionalist1900-1950
CommentsUnit ofanalysis
FocusDominanttheory
ApproachTimeperiod
Table 3.3. The historical development of distribution research in marketing
3.5 The interfaces Studying the origin and the developments within business logistics as well as in marketing channels, it can be argued that the marketing and the logistics disciplines have originated from the same approach – distribution channels research – and that they have developed in two very different directions, differing on unit of analysis, theoretical base and methodological
41
approaches. It can also be argued, that they all have significant limitations regarding their contribution to understanding supply chains and networks. Based upon the review of the research, some fundamental observations can be made concerning the need for research in the interface between logistics, marketing, and supply chain management as well as the need for research on the organisation of distribution arrangements. First, to understand supply chains and networks it is important not only to understand the activities of the individual actors or business units, but also to develop an understanding of the system as a whole. Marketing has a strong tradition within this area, particularly interesting in this context is of course the functionalists like for instance Alderson (1956), and others. Some of the key concepts within this tradition have had a significant impact on logistics (for instance postponement), while others seem to be forgotten (like for instance sorting, transvections etc). Logistics on the other hand, has had a strong emphasis on a holistic view on the materials flows, and developed concepts and theories concerning the configuration and operation of these flows from point-of-origin to end-user (or disposal). While marketing to a large extent has abandoned this tradition, mainstream logistics has focused only on the physical flow of goods, paying little attention to other types of flows (for instance commercial flows). In the supply chain literature, Lambert (1998) has broadened the concept to cover also other processes, but limited the approach to a focal business unit. Thus, to enhance our understanding of supply chains and networks, there is a need to follow up these research traditions, taking a holistic perspective as a starting point (at the flow of goods, the transvection, or a the supply chain), and probably combining insights from marketing channels and business logistics research. In such a tradition the system as a whole rather than the individual actors is of focal interest. Second, to understand value creation in supply chains and networks, it is important to realize that there are other interdependencies in distribution settings than those serial activities defined by a supply chain or a supply process. The supply chain concept was partly developing from Porter’s value chain concept in the mid eighties. The value chain logic represents a value creation model particularly describing the value creation process in a manufacturing environment. Fjeldstad and Stabel (1998) have developed a framework based on Thompson’s (1967) typology of technologies, adding value shops and value networks as two alternative value configuration models to the value chain. The models represent three different interdependencies. An interesting issue in this context is that the value network configuration model better represent the value creation process of
42
logistics service providers than the value chain model. Different actors in a supply chain or a supply network play different roles and have different value creation logic. While being a key issue in the channel literature, this issue have been neglected in both the logistics and the supply chain management literature. Thus, to enhance our understanding of supply chains and networks, there is a need for research not only covering how individual companies or business units create value, but also how value is created in an interorganisational context or setting. Third, so far SCM, as well as logistics and marketing channel theories and models, can be characterized as deterministic, and to a limited extent covering the changing patterns in the materials flows. To understand the dynamics of supply chains and networks, one has to realize that there are interdependencies not only between activities, but also between resources (resource ties) and actors (actor bonds). These interdependencies and interfaces are as important, if not even more important than the interdependencies between activities for understanding what creates the dynamics of supply chains and networks. Thus, to enhance our understanding of supply chain and networks, there is a need for interorganisational research not only focusing on dyads, but also on the dynamics of chains and networks. There is obviously a need to enhance our understanding of how our supply and distribution systems work, how they create value, how to configure these systems, the roles or functions of the actors, drivers and economies in such systems, and their development. The purpose of this project has been to study some of these issues from an overall systems perspective. The ambition has not been to carry out one fully integrated study on the organisation of distribution arrangements, but rather to carry out several studies within this context, including the dissertation projects and some of the empirical issues of relevance to the participating companies. The common base for the empirical part has been an industrial network influenced approach.
3.6 The industrial network approach Two important features of to days emerging supply systems are that there is an increased dependency between different activities and that the companies have become more specialised. Different activities have become more dependent because buffers between
43
activities have been reduced in order to reduce cost and throughput time in the systems. The increased dependency gives rise to an increased need for coordination between activities in supply systems. Companies have become more specialised in order to exploit economies of scale in the various operations. In this development companies have outsourced many of their traditional logistics activities, creating a growth in the third party logistics market. But also among logistics service providers activities are outsourced, since it is very difficult to be able to offer the needed product and service variety within one organisation, while also being competitive on cost. The users’ demand for customized solutions has been a driving force for this development. The companies’ response to the increased demands for high variety, quick response, and low costs have been cooperation, where companies with different complementary strengths together can satisfy the customers in a better way than if they acted separately. The increased cooperation can also decrease the planning uncertainty between two companies in a supply system, in that more information is exchanged. Due to these trends, individual companies in many industries are facing major challenges related to their role in the value creation process, and strategic choices concerning core, relationships and cooperation models. In several industries we can observe major repositioning among the actors leading to a change in industry structure. This can be observed in the electronics industry, the construction industry, and the transportation industry, among others. To a large extent, theories in business and management have focused on business units or companies. Hence, the unit of study is the individual company. Within the field of logistics focus has been either on business logistics issues related to the individual shipper or to the individual logistics service provider. In recent years, there has been a growing understanding that an interorganisational approach is required to understand the challenges mentioned above (for an overview of this development, see for instance Bjørnland, Persson & Virum, 2001). Hence, a reasonable starting point for an analysis was to consider today’s logistics and distribution systems as networks, where effective division of labour and increased cooperation are important prerequisites for cost effectiveness and value creation. During the last decennials a new theoretical approach for the analysis of production structures and technical development in networks has emerged –
44
“The industrial network approach”. This has developed through cooperation between different research groups in Western Europe, particularly in Sweden and England. A cornerstone of the industrial network approach is that companies through close and long-term interaction ultimately will find new forms of adaptations to each other’s operations in order to increase the effectiveness both in day-to-day operational activities and in development and innovation (Håkansson 1982). In this project we have applied the network approach in an attempt to describe and explain transitions in distribution networks. In the central network model three different structures are identified: the activity structure, the resource structure, and the actor structure. In this study we will concentrate on the activity and the actor structures. Essential for the performance of industrial systems is the forms of labour division among the companies. This division of labour is represented by the link between the actor structure and the activity structure in the network. One purpose of the project has been to study how the design of the activity structure and its division of tasks on the different actors affect the cost effectiveness and the value creation of the supply systems.
3.7 Interest areas for the study
Within this framework three main research areas concerning the transition processes in distribution networks were identified and defined as starting points or interest areas for the study. (1) “Value Creation in Distribution Networks” Since the early 70`s Business Logistics and Logistics Management has been referred to as the art of managing the flow of materials and products from source to user. Among the most influential authors and scholars the dominating approach to the subject can be characterised as a systems approach to the flow of materials, from acquisition of raw materials to delivery of finished products to ultimate users (or in recent years to disposal), and the related flows of information that both control and record materials movements. (Magee, 1985) Still, as a subject Business Logistics has changed significantly over the years. First of all, it has been heavily influenced by developments in other areas, such as in marketing, manufacturing, strategy, and, obviously, the developments within the information and communication field (Persson et al, 2000). Secondly, within the field itself major insights related to the design, implementation, and operation of logistics systems and processes, have had a significant impact on logistics in practice. It has helped the

45
success in improving logistics operations in individual business units and companies as well as in larger configurations of companies forming different types of supply chains. As a discipline it has gained acceptance in an academic as well as in a practical context. While there is general agreement that logistics is an important function in business, and that logistics processes often represents a key process for a firm, the question arises as to whether logistics is a value-adding operation or merely represents a cost (Langley, 2001). The issue of how logistics resources and processes as well as distribution networks are creating or can create value is however one of the most critical issues in logistics and distribution.
Literature still tends to regard the contribution of logistics as either a sales increase due to better customer service and/or a cost and asset reduction difference through cost and asset cuts related to logistics resources. “Good” logistics seem to involve lower cost of purchased materials, reduced order management costs, lower transportation costs, lower inventory carrying costs, lower warehousing costs, lower costs of information processing and reduced supervision costs, reduced investments in inventory, reduced errors in shipment and invoicing, less warehouse space required etc. A major issue that this logic does not capture is how a logistics resource in it self, or in combination, can create value or a competitive advantage. Or how combinations of logistics resources in a distribution network can create value or represent a unique resource constellation.
Addressing distribution networks not only from an activity point of view but also from a resource and a resource constellation view has been one of the ambitions in this project. By describing the transition process in the three targeted industries, and analysing changes in the value creation processes, we hoped to understand some of the driving forces, trends and patterns in the industry.
Thus, by addressing issues concerning value creation in networks we aimed at enhancing our understanding of the role of logistics and distribution systems in the value creation process. The relevance of this issue has been emphasized in several recent studies and articles in the field (See for instance Byrne & Markham 1991, Christopher, 1998, Langley & Rutner, 2001, and Lambert, 2000).
46
(2) “Design of Distribution Networks” During the last decade many organisations have responded to competitive pressures by seeking to provide their products and services to customers faster, cheaper, and better than the competition. As the rate of product changes and product introduction increases, many managers have come to realise that flexibility and the organisation’s ability to respond to changing market demands are more critical capabilities than ever before. Also, as product prices towards end customers are decreasing in many areas, managers have to seek improvements in their supplier base. Thus, based on some of the empirical evidence it has been argued that the companies must work on a cooperative basis with the organisations in the supply chain in order to succeed, Handfields and Nichols (1999). Also, from a more analytical point-of-view, it has been argued that one of the most significant changes in paradigm of modern business management is that individual businesses no longer compete as solely autonomous entities, but rather as supply chains, Drucker (1998). Thus, it is argued, business management has entered the era of inter-network competition and the ultimate success of a single business will depend on management’s ability to integrate the company’s intricate network of business relationships.
In the study “Insight to Impact” (1999), carried out by A.T. Kearney for the European Logistics Association, and covering all major industries in five European geographical regions, it is argued that there is a steady movement of the supply chain from periphery to the centre of business concerns. There are several forces driving this process. As the EU is transformed into a single market, the resulting denationalization of operations structures is affecting most supply chains as companies seek to meet customer demands on a pan-European basis. The spread of practices across industry boundaries, sharply enhanced customer mobility and the rapid developments in information and communication technology all foster the emergence of demanding and empowered customers and thereby increase the degree of customer sophisti-cation. Also new developments in ICT have implications for virtually all business operations, perhaps especially those relating to supply chains and networks.
On one side customers no longer accept standard service, but are dictating their own terms and selecting suppliers with the capabilities to meet them. On the other side, suppliers are seeking to differentiate themselves by offering tailored solutions and value-added services. As these powerful competitive pressures raise the supply chain performance higher, traditional boundaries within and between firms tend to break down. The effect is tightly coupled processes and integrated systems, where the suppliers are
47
reaching deeper into the customers\ operations. This trend corresponds to the outsourcing movement, as operations traditionally carried out by the customer migrate to the supplier. Also, the traditional distinction between products and services are blurring (ELA, 1999).
As firms and functions are integrated around service and the customer, logistics can no longer be separated from the supply chain as a whole. The design and operation of a portfolio of tailored supply chains geared to particular market segments becomes a core competence, a business opportunity rather than a cost The development of concepts, models, and methods enhancing our understanding of logistics process design in this context is therefore a major theoretical challenge. By addressing issues concerning the design of logistics systems and distribution networks we attempted to enhance our knowledge and understanding concerning design variables regarding logistics and distribution systems, resource properties, resource constellations, and capabilities as elements in value creating systems. As argued above, these are important issues for shippers as well as for logistics service providers involved in the third party logistics market.
(3) “Specialization, Integration and Transitions in Distribution Networks” Thirdly, the project has addressed issues regarding specialization, integration, and transitions in distribution networks and thereby contribute to our understanding of roles and relationships in these networks. These are major issues in interorganisational research. They also represent major challenges for many organisations today.
A major assumption behind the SCM-concept is that there is an economical rational related to the integration of processes. In essence one assumes that there is an economy in adapting and coordinating the activities carried out in sequence. By exploiting the interdependencies between the activities one will achieve some economies of governance. Given that it concerns activities carried out in sequence there are obviously time dependencies to exploit, but there might also be technological or administrative dependencies. By adjusting and coordinating the activities across the supply chain one can gain competitive advantages in terms of superior processes. This is obviously often also the case. In that sense supply chain management has had in important contribution in focusing interorganisational links between activities and processes, and issues related to these links.
48
However there are several complications of theoretical as well as empirical nature giving reasons for enhancing the underlying logic in the SCM-model.
The first major complication concerns the supply model as such and the type of interdependencies it involves. The logic of supply chain coordination is built upon serial dependencies between the activities, Thompson (1968). The efficiency of carrying out one activity depends on how other activities in the chain are carried out. The efficiency of the supply chain will increase when the interdependency is exploited. In other words, a fully integrated supply chain will always be the most efficient supply chain if it is considered as an isolated phenomenon or object. There are however several other considerations to take into account. According to Thompson (1968) there are two other types of inter-dependencies, pooled dependencies and reciprocal dependencies. Any focal organisation is normally part of several supply chain, each of them representing different entities, which may or may not be in conflict as far as optimisation and integration is concerned. That means that the individual focal organisation is as relevant unit to consider as the individual supply chain. Also, the serial dependency is not the only dependency to consider. Enhancing the analysis to embrace other types of dependencies will strengthen the SCM approach. This argument has been followed up in the project. The second complication concerns the way in which resources are considered in the SCM-approach. Resources are considered only indirectly and they are considered as given. The challenge is to optimise the (known) use of given resources. In fact, the SCM-approach represents a pure process approach, emphasising the activities, their links and coordination, while little emphasis is put on the dependencies between resources and dependencies among the actors. Based on our earlier studies (Persson & Grønland, 2001), it is argued that there are interorganisational dependencies crucial for the individual organisation’s competitiveness concerning resources as well as actors, not only activities.
3.8 The study of distribution networks in transition The common empirical ground for this project has been the participating companies, representing logistics service providers or closely cooperating with such, and the distribution context in which they operate. This is why we have chosen to make the case studies in part II of this report rather rich in content.
49
In the first part of the project we carried out a series of interviews in the five directly involved companies. To our help an interview guide was developed, which also were strongly influenced by an earlier project (See Virum and Persson, 2000). The interview guide can be found in enclosure 3.1. Based on the interviews we identified the networks of each company, and continued carrying out interviews in the most relevant organizations in the network. This process was also strongly influences by the participating companies. The interviews were documented as “case” studies. The case studies as well as secondary material concerning the industry and the developments in the industry were used as inputs in seminars and workshops to discuss empirical questions and issues such as:
o How are the supply and distribution networks structured in the industry
o Identify the dominating distribution network structures in the industry and major differences between structures
o Identify major political, institutional and behavioural factors influencing the industry
o Why are the networks structured the way they are – what are the driving forces
o How and why does the network structure change over time o Develop some scenarios for the industry o What is the most probable developments in the distribution
network in the years to come o Identify some of the strategic challenges and opportunites
for the focal organisation, given the scenarios based on the industry study
The ambition with this report has been to at least make an attempt to discuss some of the common issues related to value creation, design, and dynamics of distribution networks. Some of these issues will therefore be covered in part II of this report as well as in chapter 10 where the role of logistics service providers as intermediaries is analysed. Each of the dissertations start from one of these three cases. However the empirical data in the dissertations goes much further in depth than what is covered here since those studies are much more precise and focused. Also the three dissertations are more focused on interesting theoretical issues, which we will try to illustrate in Part III of this report through three papers/chapters closely related to the topics in the dissertations. Though these chapters are rather independent, they still fall into the three areas of interest that has been described above. Also, the dissertations have in fact varying theoretical approaches. The study that falls into the area value creation in distribution networks, “The

50
Role of Intermediaries in Distribution: A Study of Car Logistics”, by Leif-Magnus Jensen, can be characterised as a network study. “Transportation mode selection in supply chain planning models”, by Erna S.Engebrethsen on the other hand is based on an operations research approach, while finally “Coordinated Action in Reverse Distribution Systems”, by Bente Flygansvær, is a study that is combining logistics and distribution research. References Ballou, R. (1978), Basic Business Logistics, Englewood Cliffs, Prentice Hall.
Ballou, R. (1992), Business Logistics Management, Englewood Cliffs, Prentice Hall.
Ballou, R.H., Gilbert, S.M. and Mukherjee, A. (2000), New Managerial Challenges from Supply Chain Opportunities, Industrial Marketing Management, Vol 29, pp.7-18.
Bartels, R. (1982), The History of Marketing Thought, Columbus, Ohio, Publishing Horizons Inc.
Bechtel, C. and Jayaram, J. (1997), “Supply Chain Management: A Strategic Perspective”, The International Journal Of Logistics Management, Vol 8, No 1, pp.15-34. Bjørnland D., Persson, G., & Virum, H. (2001). Logistikk – et lederansvar. Gyldendahl Akademisk, Oslo.
Bowersox, D.J. (1969), “Physical Distribution Development, Current Status, and Potential”, Journal of Marketing, Vol 33, January, pp.63-70.
Bucklin, L.P. (1965), “Postponement, Speculation and the Structure of Distribution Channels”, Journal of Marketing Research, Vol 1, February, pp.26-31.
Bucklin, L.P. (1966), A Theory of Distribution Channel Structure. Berkeley, California: IBER Special Publications.
Christopher, M. (1992), Logistics and Supply Chain Management - Strategies for reducing Cost and Improving Services, Financial times Professional Ltd., London.
Clark, F.E. (1923), Principles of Marketing. New York: The Macmillan Company.
Cooper, M., Lambert, D. and Pagh, J. (1997) “Supply Chain Management: More Than a New Name for Logistics”, The International Journal of Logistics Management, Vol 8, No 1,1-14.
Converse, P. D. (1958), “The Other Half of Marketing”, in Marketing in Transition, Seeyle, A. E. (Ed.), New York, Harper and Row, pp. 114-121.
Drucker, P. (1998), ”Management´s New Paradigms”, Forbes Magazine, Oct. Financial Times (2004), “Outsiders tighten supply chain”, 7th December.
51
Ford, D., Gadde, L-E, Håkansson, H., Lundgren, A., Snehota, I., Turnbull, P., Wilson, D., (1997) Managing Business Relationships. London: Wiley Gadde, L-E & Håkansson, H.: Analyzing change and stability in distribution channels - a network approach. In Axelsson, B. & Easton, G. (eds) Industrial Networks - a New View of Reality. Routledge, London, 1992. Gadde, L-E (2000) From Marketing Channels to Differentiated Networks – distribution dynamics in a historical perspective. In Dahiya, S.: The Current State of Business Disciplines. Spellbound Publications. Gadde, L-E and Snehota, I. (2000) Making the Most of Supplier Relationships. Industrial Marketing Management, 29, 305-316.
Gadde, L-E. (2003), “Activity coordination and resource combining in distribution networks – implications for relationship involvement and the relationship atmosphere”, Journal of Marketing Management, Vol 19, pp. 1-28.
Gadde, L-E, Håkansson, H., Jahre. M. and Persson, G. (2002) “‘More instead of less’ – strategies for use of logistics resources”, Journal of Chain and Network Science, Vol 2, No 2, pp. 81-93.
Gaski, J.F. (1984) The theory of power and conflict in channels of distribution, Journal of Marketing, Vol 48, Summer, pp. 9-29
Gripsrud, G. (2004) “The Marketing Discipline and distribution research: time to regain lost territory?” in Håkansson, H., Harrison, D. and Waluszewski, A (eds.) Rethinking Marketing: Developing a New Understanding of Markets, Wiley
Handfields, R.B. & Nichols, E.L. (1999), Introduction to Supply Chain Management, Prentice-Hall, New Jersey.
Håkansson, H. and Snehota, I. (1995), Developing Relationships In Business Networks, Thompson, London
Håkansson, H. and Waluszewski, A. (2002), Managing Technological Development IKEA, the environment and technology, Routledge, London, UK
Harland, C.M. (1996), “Supply Chain Management: Relationships, Chains and Networks”, British Journal of Management, Vol 7, Special Issue, pp.63-80. Heide J.B. (1994), “Interorganisational Governance in Marketing Channels”, Journal of Marketing, Vol 58, January, pp. 71-84.
Heskett, J., R. Ivie, and Glaskowsky, N. (1964), Business Logistics. Management of Physical Supply and Distribution, The Ronald Press Company, New York.
Hunt, S.D. and Goolsby, J. (1988), “The Rise and Fall of the Functional Approach to Marketing: A Paradigm Displacement Perspective”, in Nevett, T. and Fullerton, R.A. (eds.), Historical Perspectives in Marketing, 35-51. Lexington, Mass.: D.C. Heath and Company.
52
Jespersen, B. and Skjøtt-Larsen, T. (2000), Supply Chain Management. Et strategisk ledelseskonsept, Thomson Forlag.
Jones, D.G. B. and Monieson, D. D. (1990), “Early Development of the Philosophy of Marketing Thought”, Journal of Marketing, Vol 54 January, pp. 102-113.
Kent, J. L. J. and Flint, D.J. (1997), “Perspectives on the Evolution of Logistics Thought”, Journal of Business Logistics, Vol 18 No 2, pp. 15-29.
La Londe, B. (1997), ”Supply Chain Management: Myth of Reality?” Supply Chain Management Review, Vol 1, Spring, pp.6-7
Lambert, D.M., Cooper, M.C. and Pagh, J.D. (1998), “Supply Chain Management: Implementation Issues And Research Opportunities”, The International Journal of Logistics Management, Vol 9 No 2, pp. 1-19.
Magee, J. F., Copacino, C.F. and Rosenfield, D.B. (1985), Modern Logistics Management. Integrating Marketing, Manufacturing, and Physical Distribution, John Wiley & Sons, New York. McGinnis, M.A., Boltic, S.K. and Kochunny, C.M. (1994), “Trends in Logistics Thought: An Empirical Study”, Journal of Business Logistics, Vol 15, No 2, pp.273-303
McCarthy, E.J. (1960), Basic Marketing: A Managerial Approach. Homewood, Illinois, Irwin.
Mentzer, J.T., DeWitt, W., Keebler, J.S., Min, S., Nix, N.W., Smith, C.D. and Xacharia, Z. G. (2001) “Defining supply chain management”, Journal of Business Logistics, Vol 22, No 2, pp.1-25.
Narus, J.A.and Anderson, J.C. (1996), “Rethinking distribution”, Harvard Business Review, Vol 74, July-August, pp.112-120. Oliver, R.K. and Webber, M.D. (1982), “Supply-chain management: logistics catches up with strategy”, in Christopher, M. (ed.) (1992) Logistics: The strategic issues, Chapman & Hall, London. Persson G.& H. Håkansson, “Supply Chain Management – the logic of supply chains and networks”, in International Journal of Logistics Management, 2004.
Persson G. and M. Jahre, Supply Chain Management “and beyond”, Magma No 5, 2003. Persson, G. and Virum, H. (2000) Strategiutvikling hos logistikkaktører – En studie av logistikkallianser i forsyningskjeder, Research report Nr. 3, Handelshøyskolen BI Persson, G and Virum H. (2001) “Growth Strategies for Logistics Service Providers”, The International Journal of Logistics Management, No. 1
53
Persson G. and Virum H. (2001) “ Logistics Service Providers and Supply Chain Alliances”, IPSERA-conference 2001. Persson G., (1995)“Logistics Process Redesign: Some Useful Insights”, International Journal of Logistics Management, No. 1. Persson G. (1991). “Achieving Competitiveness Through Logistics”, International Journal of Logistics Management, Volume 2 Number 1.
Persson. G. and Grønland, S.E. (2002), Supply Chain Management – En flerdisiplinær studie av integrerte forsyningskjeder, Research Report No 9, Norwegian School of Management, Oslo.
Porter, M. (1985), Competitive Advantage – Creating and Sustaining Superior Performance, The Free Press, London.
Ross D.F. (1998) Competing Through Supply Chain Management, New York, NY: Chapman & Hall
Smykay, E.W., Bowersox, D.J. and Mossman, F.H. (1961), Physical Distribution Management, New York, MacMillan.
Shaw A.W. (1912), “Some problems in market distribution”, Quarterly Journal of Economics, Vol 26, pp.703-765
Stalk, G. and Hout, T.M. (1990), Competing against Time. The Free Press, New York.
Stern, L. (ed.) (1969), Distribution Channels: Behavioural Dimensions. Boston: Houghton Mifflin Co.
Stern, L. W., El-Ansary, A. I. and Coughlan, A. T. (1996), Marketing Channels, Upper Saddle River, New Jersey, Prentice Hall International. Fifth Edition.
Stock, J. (1990), “Logistics Thought and Practice: A Perspective”, International Journal of Physical Distribution and Logistics Management, Vol 20 No 1, pp.3-6.
Stock, J. R. and Lambert, D.M. (2001) Strategic Logistics Management, McGraw-Hill Companies, Inc., New York
Svensson, G. (2002) The theoretical foundation of supply chain management: A functionalist theory of marketing, International Journal of Physical Distribution and Logistics Management, Vol.32, No.10, pp.734-754.
Vaile, R.S., Grether, E.T. and Cox, R. (1952) Marketing in the American Economy, New York: The Ronald Press. Virum, H. (1993) "Third Party Logistics" in The Transportation and Logistics Review, Volume IV, Stanford
54
Virum, H. and Bagchi P. (1996) “Third Party Logistics: A Model for Planning and Operations”, with Prabir Bagchi. The International Journal of Logistics Management. Volume 7 Number 2 Virum, H., and Bagchi, P. (1998)“Logistical Alliances: Trends and Prospects in Integrated Europe”, Journal of Business logistics, Vol. 19, No. 1 Virum, H., Eidhammer, O., Pettersen, I. (1996) ”Transport- og logistikkmarkedet i Norge” Research Report. Transportøkonomisk institutt, Virum, H., Persson, G., and Bjørnland, D. (1994) "Logistikk - godstransport. Bæredyktig utvikling. En perspektivanalyse”. Project report for the Norwegian Research Council.
Womack, J. P., Jones, D.T., and Roos, D. (1990), The Machine that Changed the World, Macmillan, New York.
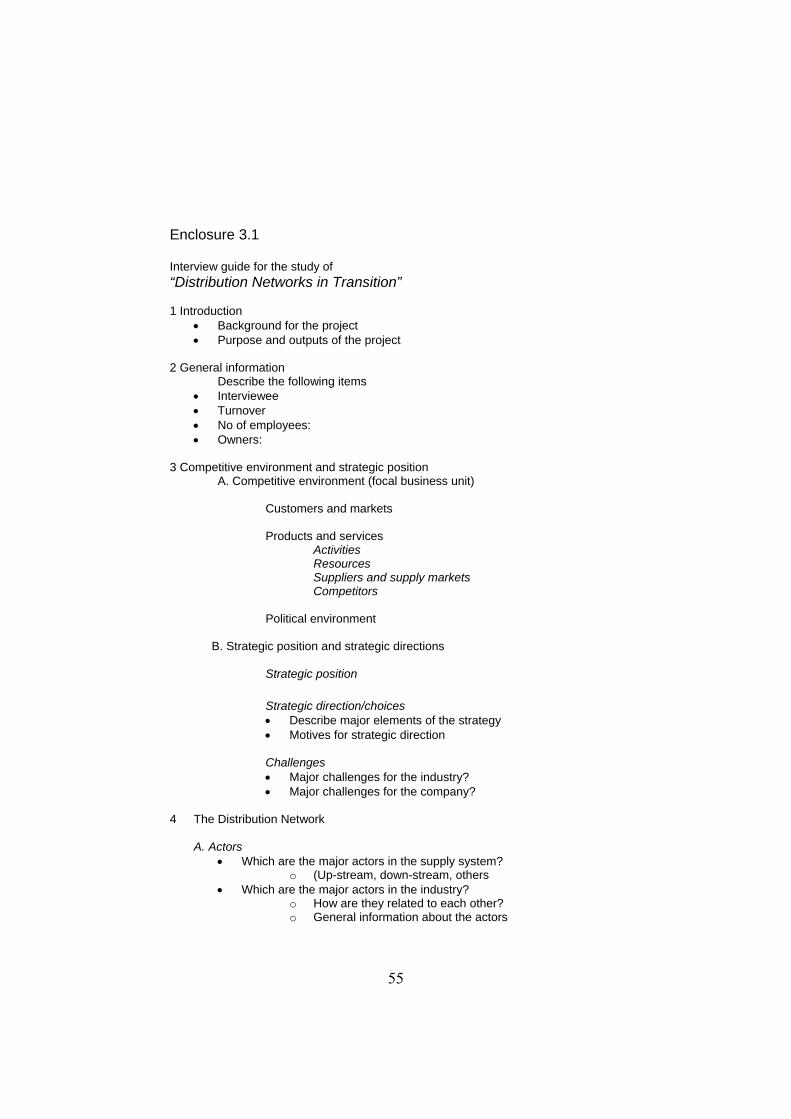
55
Enclosure 3.1 Interview guide for the study of “Distribution Networks in Transition” 1 Introduction
• Background for the project • Purpose and outputs of the project
2 General information Describe the following items
• Interviewee • Turnover • No of employees: • Owners:
3 Competitive environment and strategic position A. Competitive environment (focal business unit)
Customers and markets Products and services
Activities Resources Suppliers and supply markets Competitors
Political environment
B. Strategic position and strategic directions
Strategic position Strategic direction/choices
• Describe major elements of the strategy • Motives for strategic direction
Challenges • Major challenges for the industry? • Major challenges for the company?
4 The Distribution Network
A. Actors • Which are the major actors in the supply system?
o (Up-stream, down-stream, others • Which are the major actors in the industry?
o How are they related to each other? o General information about the actors
56
B. Activities • Describe the activity structure
C. Resources
• Which are the resources involved in this supply chain/supply network: (physical and organisational resources)
• Which are the most critical resources in the supply chain/supply network
D The flow of goods and information flow
• Describe the physical flow of goods between the actors • Describe the flow of information between actors and activities • Actions/projects within logistics
5. The dynamics in the network • What have been the major developments within the industry the last 5
years, if any? • What is happening at present and which factors influence the
development? • To what extent and in which way are changes in the industry
influencing the industry structure? • What counter forces to the development are present and to what extent
are they influencing the development? 6 Control aspects of the distribution network: Interdependencies, control, contracts
and cost drivers in the supply chain A. Contracts
• To what extent do you collaborate with internal partners • To what extent do you collaborate with external partners • Time-span of contracts • Type of contracts • Negotiations and adjustments • Atmosphere
B. ”Channel leader”:
• Dominating actors in the supply chain • How and to what extent do other actors influence the operation • Are some activities or resources more influenced by others
C. Interdependencies:
• How and to which extent are activities in the supply chain dependent on each other
• How and to which extent are resources in the supply chain dependent on each other
• How and to which extent are actors in the supply chain dependent on each other
D. Costs:
• Major cost elements in the supply chain

57
PART II DISTRIBUTION NETWORKS - THREE CASE STUDIES This section, part II, represent a major element of the report. In the following chapters the three different cases and the industries they represent will be described and discussed. Thus, the car distribution case is discussed and analysed in chapter 4, the waste management case in chapter 5, and the fast moving consumer goods case in chapter 6. The three chapters are basically following the same format, starting with an overall empirical analysis of the industry, followed by the case analysis, and ending up with discussions concerning the transitions in that particular context and the challenges for the case companies.

58
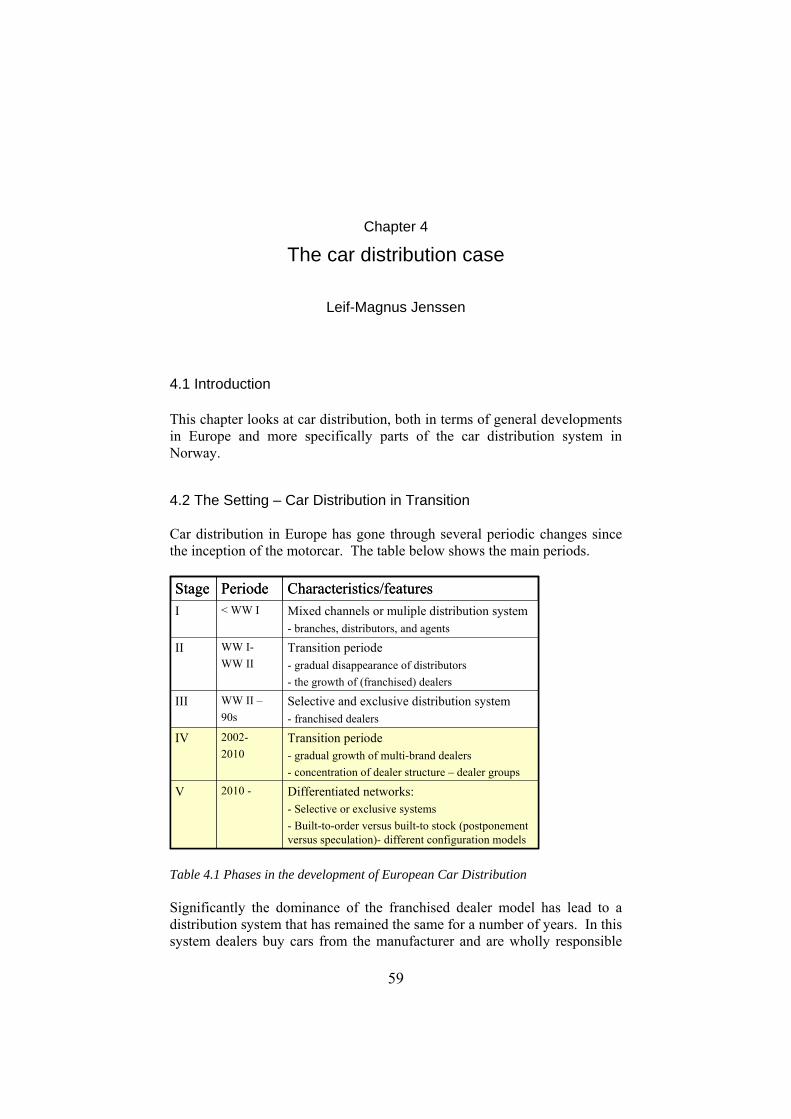
59
Chapter 4
The car distribution case
Leif-Magnus Jenssen
4.1 Introduction This chapter looks at car distribution, both in terms of general developments in Europe and more specifically parts of the car distribution system in Norway.
4.2 The Setting – Car Distribution in Transition Car distribution in Europe has gone through several periodic changes since the inception of the motorcar. The table below shows the main periods.
Transition periode- gradual growth of multi-brand dealers- concentration of dealer structure – dealer groups
2002-2010
IV
Differentiated networks:- Selective or exclusive systems- Built-to-order versus built-to stock (postponementversus speculation)- different configuration models
2010 -V
Selective and exclusive distribution system - franchised dealers
WW II –90s
III
Transition periode- gradual disappearance of distributors- the growth of (franchised) dealers
WW I-WW II
II
Mixed channels or muliple distribution system- branches, distributors, and agents
< WW II
Characteristics/featuresPeriodeStage
Table 4.1 Phases in the development of European Car Distribution Significantly the dominance of the franchised dealer model has lead to a distribution system that has remained the same for a number of years. In this system dealers buy cars from the manufacturer and are wholly responsible
60
for their own sales. The dealers are the main point of contact with the customer and almost all sales go through them. Unsold cars become tied up capital and the dealer will often sell cars at a discount or even at a loss rather than keep them for long periods of time. Manufacturers will however support dealers with general marketing expenditure and campaigns. The system does not give the dealers free reins. Dealers are bound by fairly strong contracts that define both the areas each dealer are allowed to operate in, as well as limitations on what type of customer they could sell to. In general the dealers can only sell to end customers and have to invest in equipment and showrooms to meet manufacturer standards. Each dealer further has to offer manufacturer-approved repair services. This has lead to a distribution system strongly lead by the manufacturer where dealers have had limited strategic options. Dealers were traditionally compensated by fairly high gross margins and could concentrate on competing with other brands. However, these margins are now decreasing, and car manufacturers are trying to find ways to tie the margins increasingly to the performance of the individual dealer. Gross margins in car distribution are half those seen in for example home appliances or furniture. The margins are being squeezed by a number of factors, not least the overcapacity in car manufacturing worldwide, leading manufacturers to push for cost reductions. In 2000 there were 55,000 franchised car dealers in Europe, representing 45,000 owners. Most dealer firms were small, but some chain-like structures were emerging, for example in the UK. It is expected that stronger dealer chains will emerge, in part based on experiences in the USA where dealer groups are very strong. In Germany and Italy there is conversely a degree of downward integration into dealer networks by manufacturers. In France and Italy there are also a number of sales and service agents. These agents are associated with franchised dealers, leading to a two-tier system. In the UK common stocking pools are an important feature, whereas in France delivery companies provide some of these storage services. In Italy a traditional dealer system operates where dealers order cars in advance and customers order from stock. In Germany on the other hand even volume cars are generally made to order and the customer is prepared to wait for this. These are however only variations to the franchised dealer model. In Norway, the one-tier dealer structure is the norm. There are substantial barriers for dealers to take on the franchise for more than one manufacturer, as this requires separate buildings and a separate legal organization for each additional franchise.
61
4.3. The Block Exemption The competition rules of the EU should in principle apply in all member states (and the EFTA countries) and at all times. However, the European Commission can rule that certain arrangements are acceptable even if they contravene the competition principles. In order to avoid having to deal with thousands of firms individually, the EC has defined “block exemption rules” meaning that firms falling within a certain category (typically an industry) are exempt from certain parts of the competition rules. Such an exemption exists for the car distribution sector. The primary argument for having such an exemption in this sector is that existing arrangements are relatively efficient, and that this must be balanced against the advantages the customer will derive from greater competition. Traditionally, car manufacturers have been allowed to organize their distribution systems as they see fit with relatively few restrictions. Among the more important mechanisms used has been selecting exactly which dealers are allowed to sell a manufacturer’s cars, and assigning exclusive territories to dealers. Now however, the block exemption rules require changes to this arrangement. Car manufacturers can choose only one of the two restrictions, and with definite limitations. That is, they can either assign exclusive territories to their dealers or they can select which dealers can sell their cars. However, if they assign exclusive territories, then independent resellers must be allowed to buy and sell cars, and other dealers are allowed to sell to customers in their territory as long as they do not actively carry out marketing to obtain these customers. In the case of selecting the dealers, the car manufacturer can specify to a substantial degree what is required of a dealer in terms of showroom, competence and to a certain extent marketing activities, but any dealer who fulfils these requirements must be allowed to sell the manufacturer’s cars3. This means that each car manufacturer must pick which distribution system it wants to use and is then bound by the restrictions relevant to that system.
4.4 Development and Scenarios A number of trends in car distribution may be identified, both in terms of recent changes and expected ones for the next few years. Clearly the intent
3 More information regarding the block exemption can be found at http://europa.eu.int/comm/competition/car_sector

62
of the Block Exemption to redistribute power in the distribution channel to the dealers is an important backdrop to these scenarios, but it is not given that the end result will be as intended by the European Commission. The car manufacturers and other parties in the distribution system are not passive players, and can influence the EC directly. Furthermore, there are other underlying trends such as the growth of Japanese manufacturers with their own distribution systems. The main issue for manufacturers is that they will not be allowed to impose as many restrictions on their own distribution systems, which can lead to a loss of control. One response to this has been to specify in great detail the standards and procedures to be used by the dealers when selling a particular type of car. The specifications cover such areas as the exact layout of the dealers’ showroom and the way the cars are displayed. Likewise, the requirements for repair-shops are quite exacting, and often include the purchase of advanced diagnostic equipment that can only be used for a particular brand of car. This is an adaptation to a selective agreement for dealers, but has so far lead to a lock-in of dealers that is very strong. It also raises questions regarding the efficiency of the distribution system. If manufacturers have very strict standards on for example PDI-operations then this reduces the opportunities for economies of scale for logistics service providers that offer such services because the standards are not the same across different car makes. In this way the manufacturers’ standards affect not only the dealers, but the entire logistics system as well. The Block Exemption does however require the unbundling of sales and after-sales service, meaning that independent repair shops must be authorized by the manufacturer if they adhere to the same standards that apply to the dealers’ repair shops. The lucrative after-market is equally or more likely to be a target for new actors than the dealers themselves. Clearly there are still barriers in place, especially with regard to specialized machinery and specific knowledge needed to repair specific brands of car, but all such information must be made available to the repair shops. This does not mean that it is unproblematic for the repair shops to keep updated with technical knowledge and the expensive test equipment for several cars, but it means that especially larger players (such as repair shop chains) have a much easier time trying to compete now. In terms of dealer structure the overall trend is toward a reduction in the number of dealer outlets and owners, leading to larger and stronger dealer groups and chains. The expectation is partly based on already observed changes, and partly on comparison with for example US auto distribution with far fewer dealer outlets compared to the size of the market (Germany
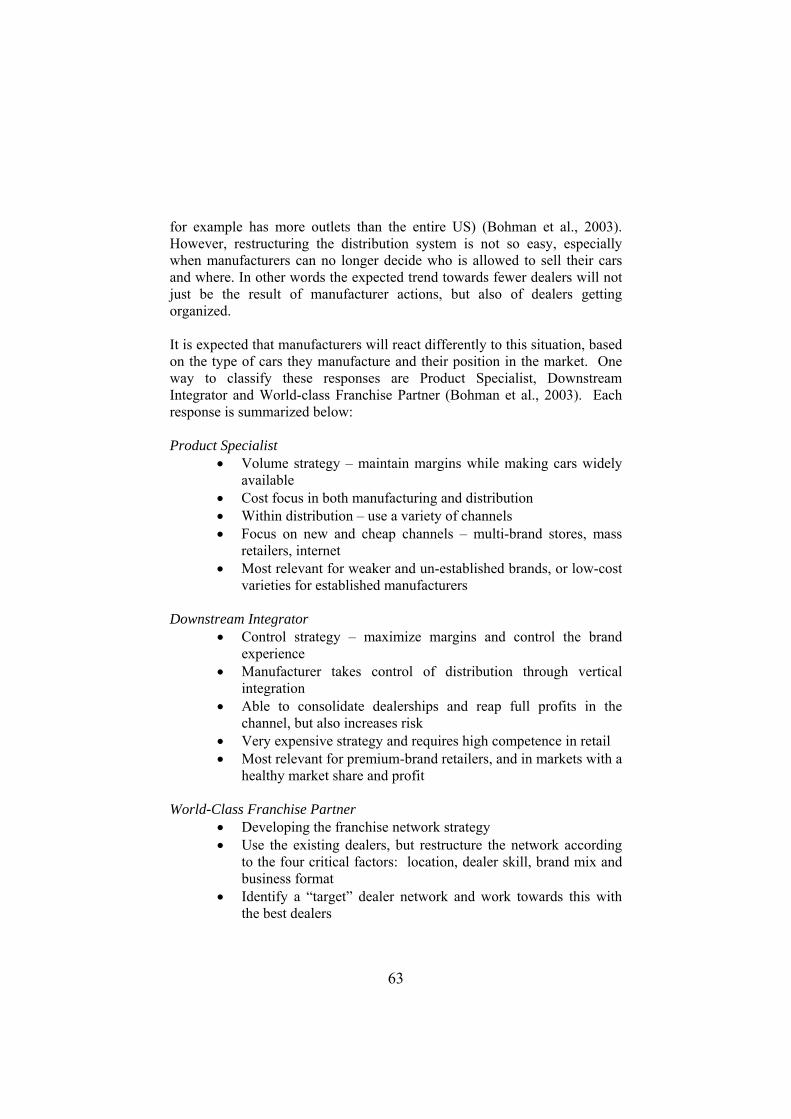
63
for example has more outlets than the entire US) (Bohman et al., 2003). However, restructuring the distribution system is not so easy, especially when manufacturers can no longer decide who is allowed to sell their cars and where. In other words the expected trend towards fewer dealers will not just be the result of manufacturer actions, but also of dealers getting organized. It is expected that manufacturers will react differently to this situation, based on the type of cars they manufacture and their position in the market. One way to classify these responses are Product Specialist, Downstream Integrator and World-class Franchise Partner (Bohman et al., 2003). Each response is summarized below: Product Specialist
• Volume strategy – maintain margins while making cars widely available
• Cost focus in both manufacturing and distribution • Within distribution – use a variety of channels • Focus on new and cheap channels – multi-brand stores, mass
retailers, internet • Most relevant for weaker and un-established brands, or low-cost
varieties for established manufacturers Downstream Integrator
• Control strategy – maximize margins and control the brand experience
• Manufacturer takes control of distribution through vertical integration
• Able to consolidate dealerships and reap full profits in the channel, but also increases risk
• Very expensive strategy and requires high competence in retail • Most relevant for premium-brand retailers, and in markets with a
healthy market share and profit World-Class Franchise Partner
• Developing the franchise network strategy • Use the existing dealers, but restructure the network according
to the four critical factors: location, dealer skill, brand mix and business format
• Identify a “target” dealer network and work towards this with the best dealers
64
• Provide a much higher level of centralized services such as sales training and marketing programs
• The most likely strategy for brands with a brand premium but without the capacity to take over the dealer network
4.5 Car Distribution in Norway - The Case Car distribution in Norway has a one-way flow in that new cars are produced elsewhere and imported into the country. The primary sources of new cars are factories in Europe and Japan, but because of the worldwide nature of the car industry cars may in principle originate anywhere. There is a secondary flow of used cars both to and from Norway, but this is not explored here since it to a large extent separate and does not involve the manufacturers and importers in the same way. The Norwegian setting is described through focusing on Autolink, a car transport and logistics service provider. The reason for using Autolink is that it is involved in the majority of transport operations for new cars in Norway, and provides services for a number of the major manufacturers. To describe more of the setting we also look at three importers representing the three manufacturers Volkswagen, Toyota and Ford. All three manufacturers use Autolink’s services but to different extents since they in effect pick from a menu of possible services for their cars. The purpose of using three different manufacturers is both to cover a significant portion of the distribution system for new cars in Norway, and to show some of the variation in distribution arrangements even in a relatively small market. Note that the connection Autolink-Volkswagen is here used to give a detailed overview of the activities and resources used in the distribution system, whereas the other two cases are used to illustrate different arrangements and are more general. Norway is a small market for most manufacturers, and since several manu-facturers are organized according to a regional or European-wide structure it is necessary to make some references to the general organization in each case in order to show how the Norwegian distribution system fits into the overall organization. 4.5.1 Autolink Autolink is a Norwegian (expanding into Sweden) firm providing transport, warehousing and a number of other services mostly related to the import of new cars. Autolink was established in Norway in 2003 as a result of the merger of Drammen Bilhavn AS (Drammen Car Port) and Motortransport AS. Autolink is owned by Autolink Group AS, established in 1999.
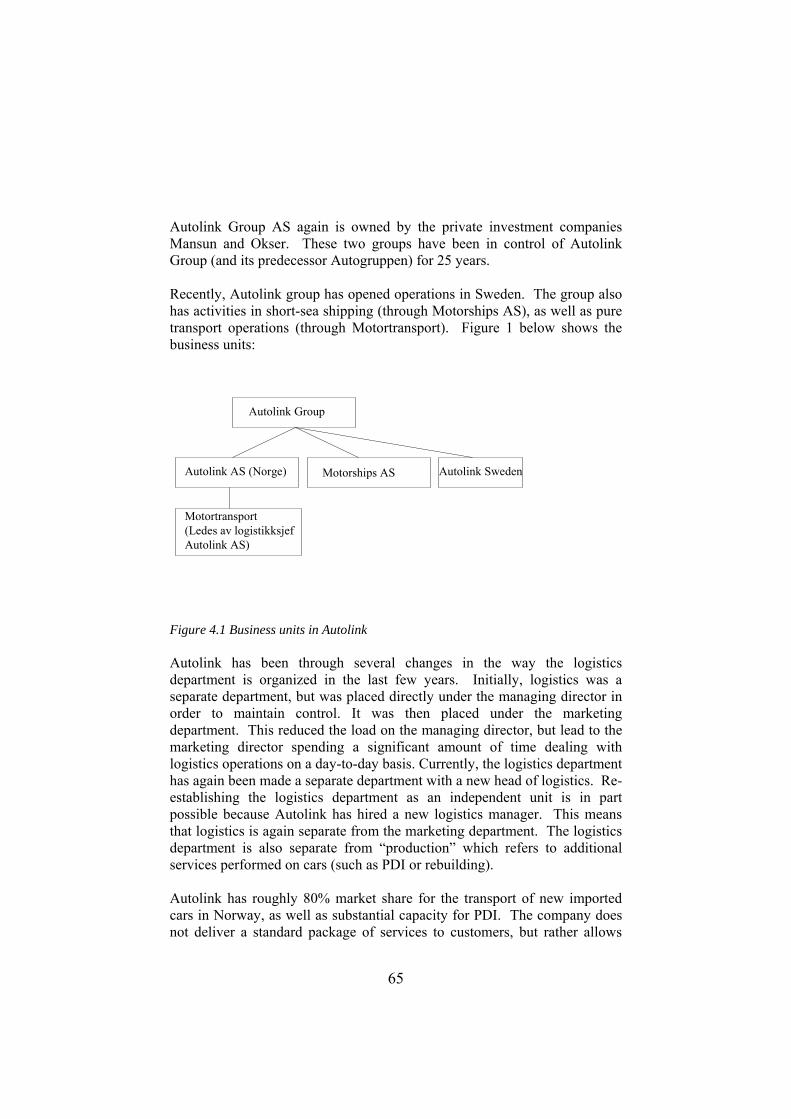
65
Autolink Group AS again is owned by the private investment companies Mansun and Okser. These two groups have been in control of Autolink Group (and its predecessor Autogruppen) for 25 years. Recently, Autolink group has opened operations in Sweden. The group also has activities in short-sea shipping (through Motorships AS), as well as pure transport operations (through Motortransport). Figure 1 below shows the business units:
Autolink Group
Autolink AS (Norge) Autolink SwedenMotorships AS
Motortransport(Ledes av logistikksjefAutolink AS)
Figure 4.1 Business units in Autolink Autolink has been through several changes in the way the logistics department is organized in the last few years. Initially, logistics was a separate department, but was placed directly under the managing director in order to maintain control. It was then placed under the marketing department. This reduced the load on the managing director, but lead to the marketing director spending a significant amount of time dealing with logistics operations on a day-to-day basis. Currently, the logistics department has again been made a separate department with a new head of logistics. Re-establishing the logistics department as an independent unit is in part possible because Autolink has hired a new logistics manager. This means that logistics is again separate from the marketing department. The logistics department is also separate from “production” which refers to additional services performed on cars (such as PDI or rebuilding). Autolink has roughly 80% market share for the transport of new imported cars in Norway, as well as substantial capacity for PDI. The company does not deliver a standard package of services to customers, but rather allows
66
them to pick and choose, with transport services as the basic service provided to most customers. Services and activities Standard new-car transport: The logistics activities related to a specific car start when Autolink receives an order from the manufacturer or importer. Normally manufacturers send orders for a group of cars at a time. The list or document is generally electronic, but the formats vary. The exact format and system used is determined by the manufacturer or importer. The manufacturers do not create special adaptations in their system for Norway, so Autolink must adapt itself to the standards used. Documents are as a rule imported into Autolink’s systems, either through written order documents or standardized files which can be converted to the appropriate format. For each car there is an order, divided into a transport section and additional services. The figure below shows an overview of the activities carried out on cars handled by Autolink. Note that these are potential activities since each importer decides what services to use. As will be seen later in the case, Møller carries out a number of these activities itself.
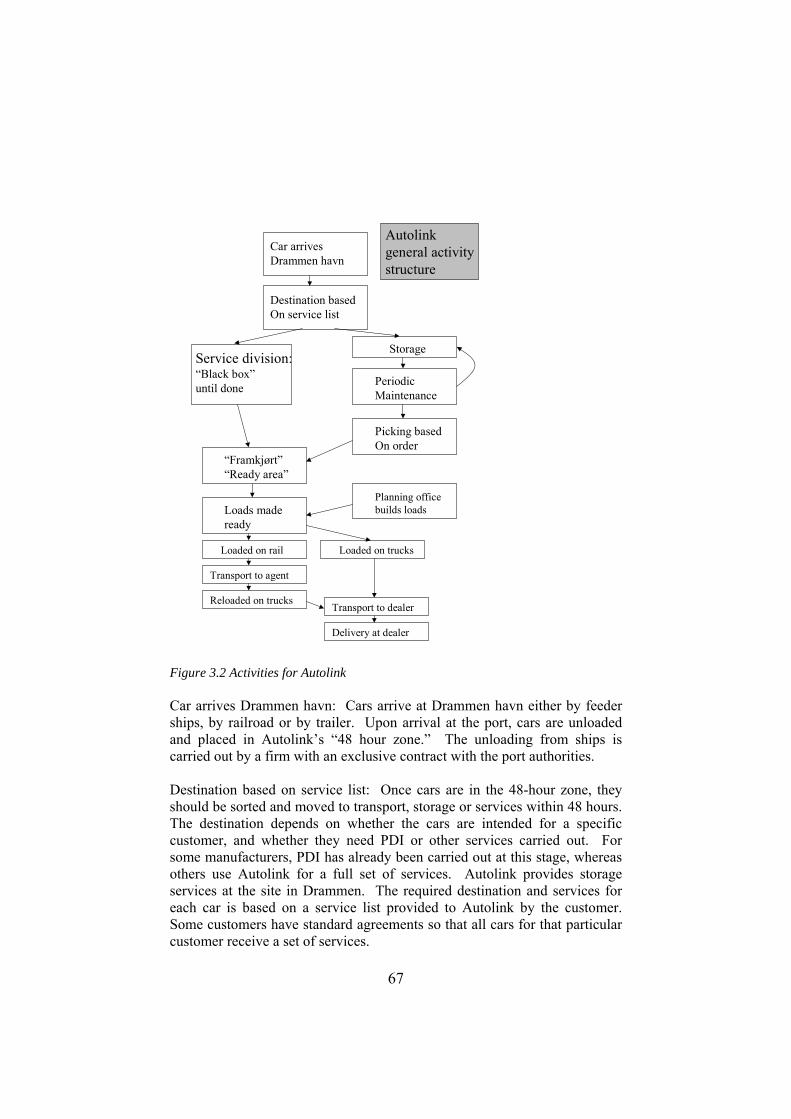
67
Car arrivesDrammen havn
Destination basedOn service list
Service division:“Black box” until done
Storage
Periodic Maintenance
Picking basedOn order
“Framkjørt”“Ready area”
Loads madeready
Planning office builds loads
Loaded on rail Loaded on trucks
Transport to agent
Transport to dealer
Delivery at dealer
Reloaded on trucks
Autolinkgeneral activitystructure
Figure 3.2 Activities for Autolink Car arrives Drammen havn: Cars arrive at Drammen havn either by feeder ships, by railroad or by trailer. Upon arrival at the port, cars are unloaded and placed in Autolink’s “48 hour zone.” The unloading from ships is carried out by a firm with an exclusive contract with the port authorities. Destination based on service list: Once cars are in the 48-hour zone, they should be sorted and moved to transport, storage or services within 48 hours. The destination depends on whether the cars are intended for a specific customer, and whether they need PDI or other services carried out. For some manufacturers, PDI has already been carried out at this stage, whereas others use Autolink for a full set of services. Autolink provides storage services at the site in Drammen. The required destination and services for each car is based on a service list provided to Autolink by the customer. Some customers have standard agreements so that all cars for that particular customer receive a set of services.
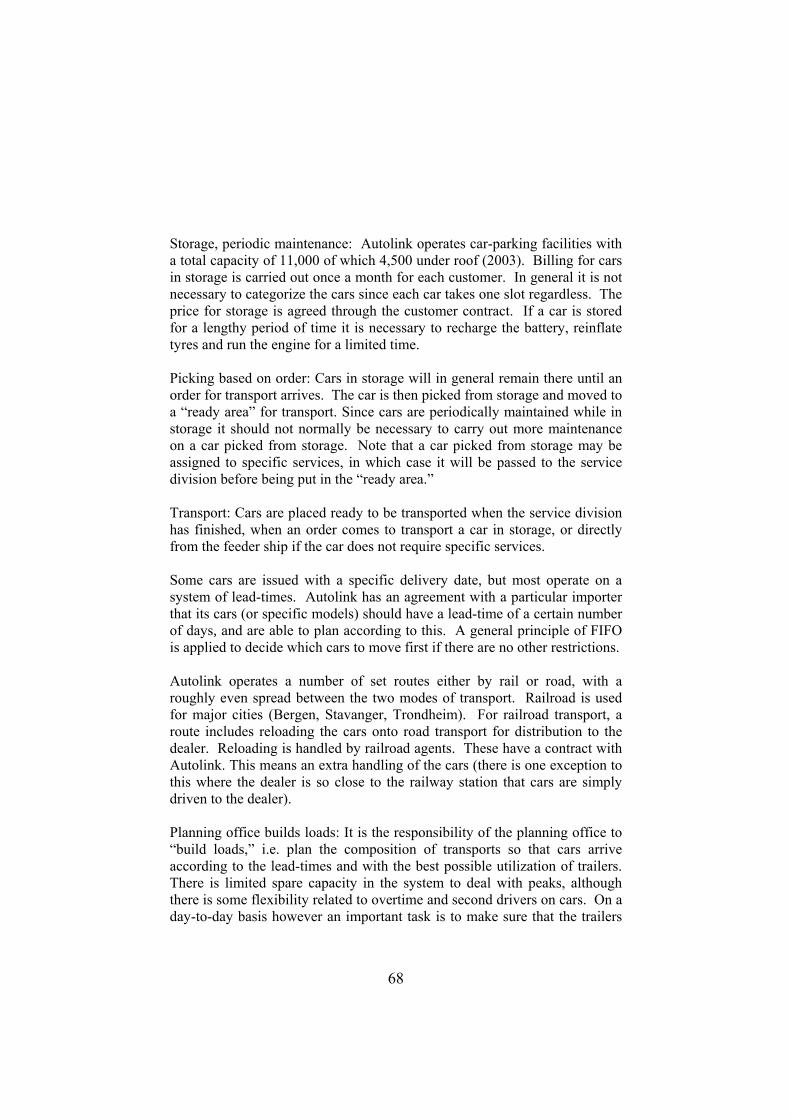
68
Storage, periodic maintenance: Autolink operates car-parking facilities with a total capacity of 11,000 of which 4,500 under roof (2003). Billing for cars in storage is carried out once a month for each customer. In general it is not necessary to categorize the cars since each car takes one slot regardless. The price for storage is agreed through the customer contract. If a car is stored for a lengthy period of time it is necessary to recharge the battery, reinflate tyres and run the engine for a limited time. Picking based on order: Cars in storage will in general remain there until an order for transport arrives. The car is then picked from storage and moved to a “ready area” for transport. Since cars are periodically maintained while in storage it should not normally be necessary to carry out more maintenance on a car picked from storage. Note that a car picked from storage may be assigned to specific services, in which case it will be passed to the service division before being put in the “ready area.” Transport: Cars are placed ready to be transported when the service division has finished, when an order comes to transport a car in storage, or directly from the feeder ship if the car does not require specific services. Some cars are issued with a specific delivery date, but most operate on a system of lead-times. Autolink has an agreement with a particular importer that its cars (or specific models) should have a lead-time of a certain number of days, and are able to plan according to this. A general principle of FIFO is applied to decide which cars to move first if there are no other restrictions. Autolink operates a number of set routes either by rail or road, with a roughly even spread between the two modes of transport. Railroad is used for major cities (Bergen, Stavanger, Trondheim). For railroad transport, a route includes reloading the cars onto road transport for distribution to the dealer. Reloading is handled by railroad agents. These have a contract with Autolink. This means an extra handling of the cars (there is one exception to this where the dealer is so close to the railway station that cars are simply driven to the dealer). Planning office builds loads: It is the responsibility of the planning office to “build loads,” i.e. plan the composition of transports so that cars arrive according to the lead-times and with the best possible utilization of trailers. There is limited spare capacity in the system to deal with peaks, although there is some flexibility related to overtime and second drivers on cars. On a day-to-day basis however an important task is to make sure that the trailers
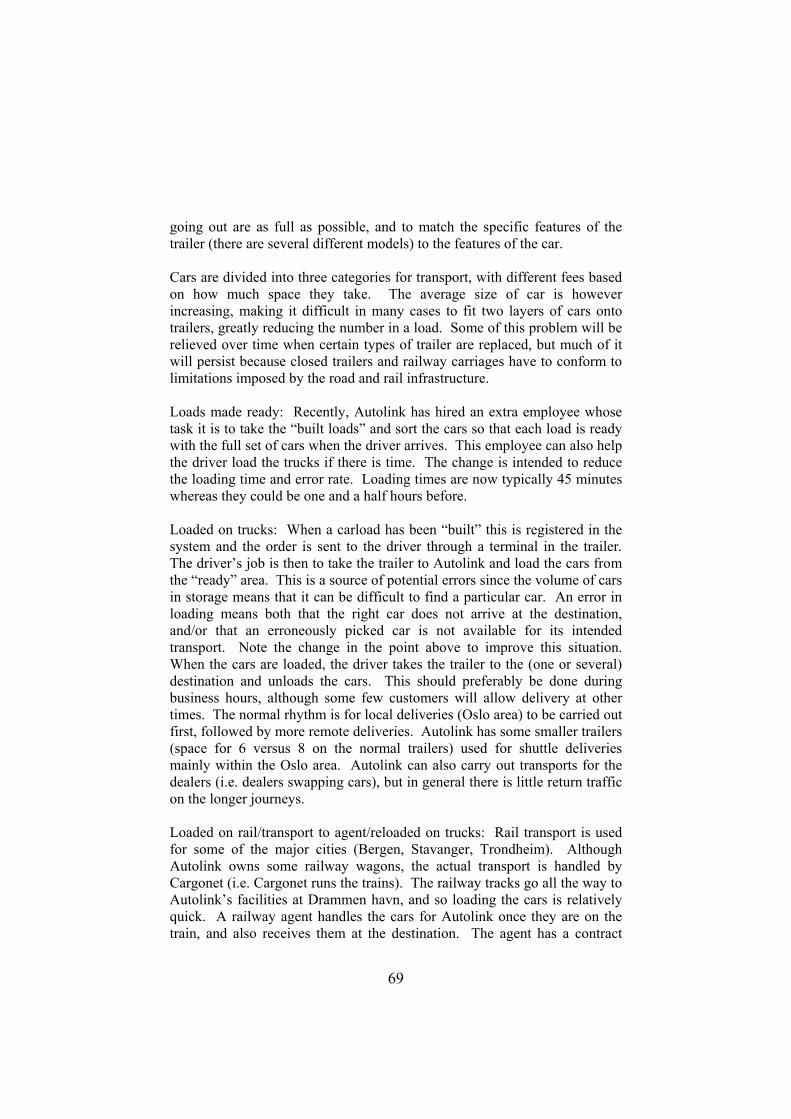
69
going out are as full as possible, and to match the specific features of the trailer (there are several different models) to the features of the car. Cars are divided into three categories for transport, with different fees based on how much space they take. The average size of car is however increasing, making it difficult in many cases to fit two layers of cars onto trailers, greatly reducing the number in a load. Some of this problem will be relieved over time when certain types of trailer are replaced, but much of it will persist because closed trailers and railway carriages have to conform to limitations imposed by the road and rail infrastructure. Loads made ready: Recently, Autolink has hired an extra employee whose task it is to take the “built loads” and sort the cars so that each load is ready with the full set of cars when the driver arrives. This employee can also help the driver load the trucks if there is time. The change is intended to reduce the loading time and error rate. Loading times are now typically 45 minutes whereas they could be one and a half hours before. Loaded on trucks: When a carload has been “built” this is registered in the system and the order is sent to the driver through a terminal in the trailer. The driver’s job is then to take the trailer to Autolink and load the cars from the “ready” area. This is a source of potential errors since the volume of cars in storage means that it can be difficult to find a particular car. An error in loading means both that the right car does not arrive at the destination, and/or that an erroneously picked car is not available for its intended transport. Note the change in the point above to improve this situation. When the cars are loaded, the driver takes the trailer to the (one or several) destination and unloads the cars. This should preferably be done during business hours, although some few customers will allow delivery at other times. The normal rhythm is for local deliveries (Oslo area) to be carried out first, followed by more remote deliveries. Autolink has some smaller trailers (space for 6 versus 8 on the normal trailers) used for shuttle deliveries mainly within the Oslo area. Autolink can also carry out transports for the dealers (i.e. dealers swapping cars), but in general there is little return traffic on the longer journeys. Loaded on rail/transport to agent/reloaded on trucks: Rail transport is used for some of the major cities (Bergen, Stavanger, Trondheim). Although Autolink owns some railway wagons, the actual transport is handled by Cargonet (i.e. Cargonet runs the trains). The railway tracks go all the way to Autolink’s facilities at Drammen havn, and so loading the cars is relatively quick. A railway agent handles the cars for Autolink once they are on the train, and also receives them at the destination. The agent has a contract

70
with Autolink, and provides transport from the railway station and to the dealers. This means there is an extra handling for cars sent by railroad. Services division: The services division is a separate unit from logistics (see fig 1.x). It has a separate IT system and communication with logistics is limited (the IT systems are not integrated). The activities within the services division are more production oriented than logistics. It is the task of the leader of the services division to take the orders for services on cars coming in and assign these so that the facilities are used efficiently. Pre-delivery inspection is a set of activities that involves making the car ready for the customer. Pre-delivery inspection consists of removal of transport protection on the car (such as plastic strips to protect corners, de-waxing as some cars are covered in protective wax when they leave the factory), washing and polishing, as well as internal cleaning. It also includes installations of optional extras such as hi-fi systems, or equipment such as tow bars and various interiors. These operations are relatively simple and so can be included in the PDI-operations, but they are not technically tied to the removal of transport protection. PDI must by its very nature be carried out close to the final customer, to avoid the car being unprotected for a significant period of time. There is however a trend towards carrying out PDI on a regional level. Therefore the last transport needs either to be closed (closed railway wagons or trucks), or a last cleaning at the dealers is needed. Long transports and long time in storage are more risky when the protection is removed. On the other hand certain types of damage to cars is much harder to spot while the transport protection is still in place. The market for PDI services is fragmented. Mainly, the dealers perform these services themselves, because there is a great deal of potential turnover in the sales and mounting of equipment. However, there is a growing market for buying these services. All new cars must however undergo PDI, so that the volume is directly related to new cars sold. Autolink wants to increase its market share for these services. Autolink has made a significant investment in specialized equipment for PDI. A centrepiece in this is the automated machine for de-waxing of cars. This machine has a capacity of 30,000 cars a year, and recycles 85% of the water and 70% of the chemicals used (including the removed wax). The recycling percentage is considered a selling point because smaller providers
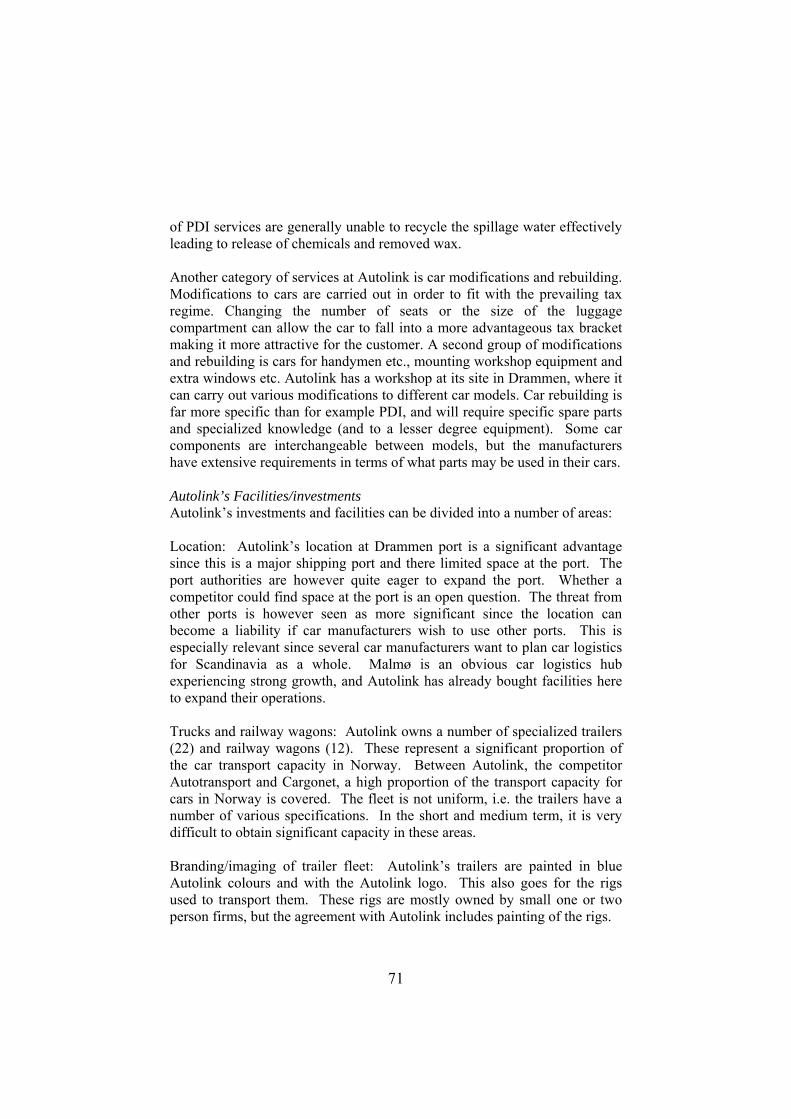
71
of PDI services are generally unable to recycle the spillage water effectively leading to release of chemicals and removed wax. Another category of services at Autolink is car modifications and rebuilding. Modifications to cars are carried out in order to fit with the prevailing tax regime. Changing the number of seats or the size of the luggage compartment can allow the car to fall into a more advantageous tax bracket making it more attractive for the customer. A second group of modifications and rebuilding is cars for handymen etc., mounting workshop equipment and extra windows etc. Autolink has a workshop at its site in Drammen, where it can carry out various modifications to different car models. Car rebuilding is far more specific than for example PDI, and will require specific spare parts and specialized knowledge (and to a lesser degree equipment). Some car components are interchangeable between models, but the manufacturers have extensive requirements in terms of what parts may be used in their cars. Autolink’s Facilities/investments Autolink’s investments and facilities can be divided into a number of areas: Location: Autolink’s location at Drammen port is a significant advantage since this is a major shipping port and there limited space at the port. The port authorities are however quite eager to expand the port. Whether a competitor could find space at the port is an open question. The threat from other ports is however seen as more significant since the location can become a liability if car manufacturers wish to use other ports. This is especially relevant since several car manufacturers want to plan car logistics for Scandinavia as a whole. Malmø is an obvious car logistics hub experiencing strong growth, and Autolink has already bought facilities here to expand their operations. Trucks and railway wagons: Autolink owns a number of specialized trailers (22) and railway wagons (12). These represent a significant proportion of the car transport capacity in Norway. Between Autolink, the competitor Autotransport and Cargonet, a high proportion of the transport capacity for cars in Norway is covered. The fleet is not uniform, i.e. the trailers have a number of various specifications. In the short and medium term, it is very difficult to obtain significant capacity in these areas. Branding/imaging of trailer fleet: Autolink’s trailers are painted in blue Autolink colours and with the Autolink logo. This also goes for the rigs used to transport them. These rigs are mostly owned by small one or two person firms, but the agreement with Autolink includes painting of the rigs.

72
Warehouse/storage facilities: Autolink has invested 35 million NOK in a large warehouse at their site in Drammen. The facilities have a total capacity of 11,000 cars, of which 4,500 can be under roof (2003). The warehouse is modular in nature (i.e. standardized). IT system: Autolink has one bespoke system developed for the production system (PDI etc.), and one system introduced from 2005 dealing with the transport system. Before 2005 the transport system was manual. The introduction has been fairly lengthy and difficult, and there are currently no concrete plans to connect the two systems. Training of drivers: Autolink spends some resources training new drivers, and has a set of standard operating procedures for its drivers. It also has a number of own drivers working for Motortransport. This allows for a benchmarking of costs in relation to the various agents working for Autolink, however Motortransport mostly deals with the transport of used cars. This is a different flow to the new car transport. Agent network: Autolink has agreements with a number of agents. These are of several types. Some are small transport firms of 1-2 employees who own one rig and carry out transport jobs for Autolink. There are also agents at all railway destinations in order to receive the cars and transport them out to the dealers. The quality of these agents is important. In several locations Autolink and Autotransport actually cooperate and use each other’s agents for better reliability. Contracts Autolink has two main types of contracts – contracts with importers and dealers, and contracts with their own agents and suppliers. Suppliers and agents Autolink’s contracts with suppliers are typically of 3-year duration. The agents’ trucks and trailers are painted according to specifications with the Autolink logo, and hand terminals are installed in the trucks for communication with drivers. Suppliers are small firms owning one or a small number of trucks, and with few drivers (less than a full year’s employee on average). The owner of the firm is responsible for getting drivers, and is frequently a driver himself. This means that the owner is often not interested in recruiting additional drivers to ensure full coverage because this reduces his own income, i.e. it is more profitable for the owner to have work than to split it with a hired driver even if this would generate more work and is better for

73
the distribution system. This is seen as a potential problem, since it can lead to trucks standing idle if the original driver is sick or away. Autolink tries to overcome some of these problems through operating a “driver pool” in order to match available drivers to trucks. Autolink also provides training for new drivers in order to teach them the procedures. The distribution of cars may not appear to be particularly specialized in terms of driver skills, but Autolink’s experience is that inexperienced drivers are more likely to damage cars when loading and unloading. This can be both because of improper handling of the equipment or accidents. Even if the damage to the car is relatively minor (scratches in the paintwork, minor bumps etc.) it can be relatively expensive to make repairs. Combined with the low accident rates to start with and the low margins on each car, this means that hiring an inexperienced driver may not be worthwhile even if it only leads to a minor increase in accidents. In one or two locations with limited numbers of cars, Autolink and the competitor Autotransport use each other’s agents. This is not mainly done due to capacity reasons, but because of the agents’ reliability. Contracts consist of a set of standard services to be carried out (potentially). This means that all cars from a particular importer, or cars going to a particular dealer are to have a set of standard services carried out. Additional services for particular cars may be added to this standard set. Orders are sent to Autolink electronically or by fax. The orders usually originate from the importer or specific dealers. Each service has a standard price for each customer, i.e. the contract includes specification of these prices. These prices are stored in the service management system allowing it to carry out correct invoicing. The pricing for the transport system is based on the type of car and a number of zones. A matrix table with source and destination zone then gives the price for a particular car. Pricing is thus per single car from and to a particular destination. 4.5.2 Møller Logistics (Volkswagen) The Møller Group is the primary importer of Volkswagen, Audi and Skoda in Norway. A total of 32 503 new vehicles were registered from these three brands in 2006 (www.moller.no). The Møller Group covers several business areas, but this case only pertains to the car operations. Where data is brand-specific this case will mostly focus on Volkswagen for ease of exposition and since Volkswagen is the largest part of Møllers portfolio.

74
The main source of data and focal part of the Møller Group has been Møller Logistics which is the logistics department of Møller Cars. This is not a legally separate unit, but it is the part of Møller dealing directly with logistics and Autolink. Clearly, it is not possible to describe the distribution system without referring to at least some activities in the rest of Møller Cars and the manufacturer. Background The Møller Group was founded in 1936 and then operated as an agent for Dodge and DeSoto (Chrysler). Møller were awarded the agency for Volkswagen in 1948, Audi in 1974 and Skoda in 1991. From 1989-2003 Seat was also part of the portfolio but sales were below expectations and Seat now imports their own cars to Norway. There are 148 VW dealers in Norway, of which 25 are owned and operated by the Møller Group. These are mostly situated in the larger cities. Møller is a privately owned importer, which is uncommon in the VW system. There are other private importers in Austria and the Netherlands, but apart from this VW owns all its country import operations. Here we will first go through some of the important actors in the distribution system in order to place the two focal actors. Secondly, we will describe the main activities each of the two focals carries out with regard to car distribution, and finally discuss how these two fit together.
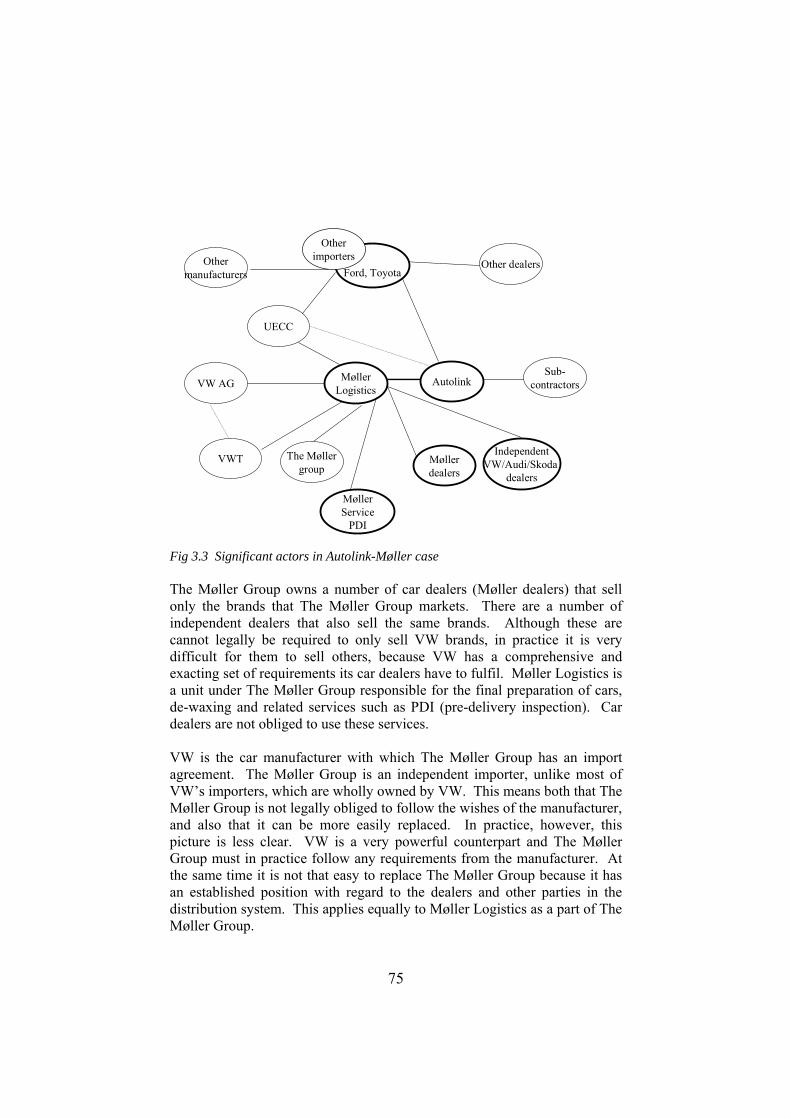
75
MøllerLogistics
Møllerdealers
IndependentVW/Audi/Skoda
dealers
Autolink
The Møllergroup
MøllerService
PDI
UECC
VW AG
VWT
Othermanufacturers
Other dealersFord, Toyota
Otherimporters
Sub-contractors
Fig 3.3 Significant actors in Autolink-Møller case The Møller Group owns a number of car dealers (Møller dealers) that sell only the brands that The Møller Group markets. There are a number of independent dealers that also sell the same brands. Although these are cannot legally be required to only sell VW brands, in practice it is very difficult for them to sell others, because VW has a comprehensive and exacting set of requirements its car dealers have to fulfil. Møller Logistics is a unit under The Møller Group responsible for the final preparation of cars, de-waxing and related services such as PDI (pre-delivery inspection). Car dealers are not obliged to use these services. VW is the car manufacturer with which The Møller Group has an import agreement. The Møller Group is an independent importer, unlike most of VW’s importers, which are wholly owned by VW. This means both that The Møller Group is not legally obliged to follow the wishes of the manufacturer, and also that it can be more easily replaced. In practice, however, this picture is less clear. VW is a very powerful counterpart and The Møller Group must in practice follow any requirements from the manufacturer. At the same time it is not that easy to replace The Møller Group because it has an established position with regard to the dealers and other parties in the distribution system. This applies equally to Møller Logistics as a part of The Møller Group.
76
VW Transport is the department of VW responsible for vehicle flows in Europe, and in effect coordinates incoming flows to Norway. Møller Logistics must follow any requirements from VW Transport. VW Transport deals directly with UECC (United European Car Carriers) for its transport requirements within Europe. The majority of this transport is carried out with smaller “feeder” ships carrying a few hundred cars at a time. These ships arrive either at a port in Norway, or increasingly in Sweden. Cars are then shipped to Norway by railway or road. UECC is also used by VW for some of the larger deep-sea transports used for intercontinental transport of large volumes of cars. The tendency is to reduce the number of ports used to maximize capacity utilization and obtain scale advantages in port operations. The Manufacturer and European setting Volkswagen has over 325,000 employees and 5.7 million cars sold worldwide (2006 annual report). Investment in production capacity in China is quite heavy (697,548 cars produced in 2003. In addition, factories in South-America are being updated to producing more recent car models. This leads to substantial shifts in the flow of cars between continents. However, European cars are still largely produced in Europe. Cars are transported to their destination partially by rail and partially by trucks. Cars are also shipped to Scandinavia using short-sea shipping. The ships used for this traffic are highly specialized. In total Møller Logistics receives cars from 18 different European factories for their own brands. Standard delivery time for a fully specified car is 6 weeks, but this can be reduced to 2 weeks if a car is already in production and the customer order only requires changes to optional extras. This is seen as a sales advantage, especially because the profit margin on optional extras is much higher than on the basic car model in most cases. The Volkswagen distribution system is based on a combination of cars made to customer orders, and cars manufactured to expected customer demand. Yearly, the importer, dealers and manufacturer will meet on a country basis to agree on a sales quota for the coming year. The plan is reviewed twice a year, but is based on market share and so there are no major adjustments unless there are big changes in new car sales. This leads to a sales plan detailed to the level of x numbers of car model y (e.g. Golf). In general, about 50% of cars produced can be specified fully due to customer orders appearing on a running basis, i.e. the customer is willing to wait long enough for the exact car features to be specified as an input to the factory. The residual between the pre-orders and the agreed quota has to be ordered by the importer. Since these are now specific cars to be manufactured, the importer has to speculate on what exact configurations can be sold to
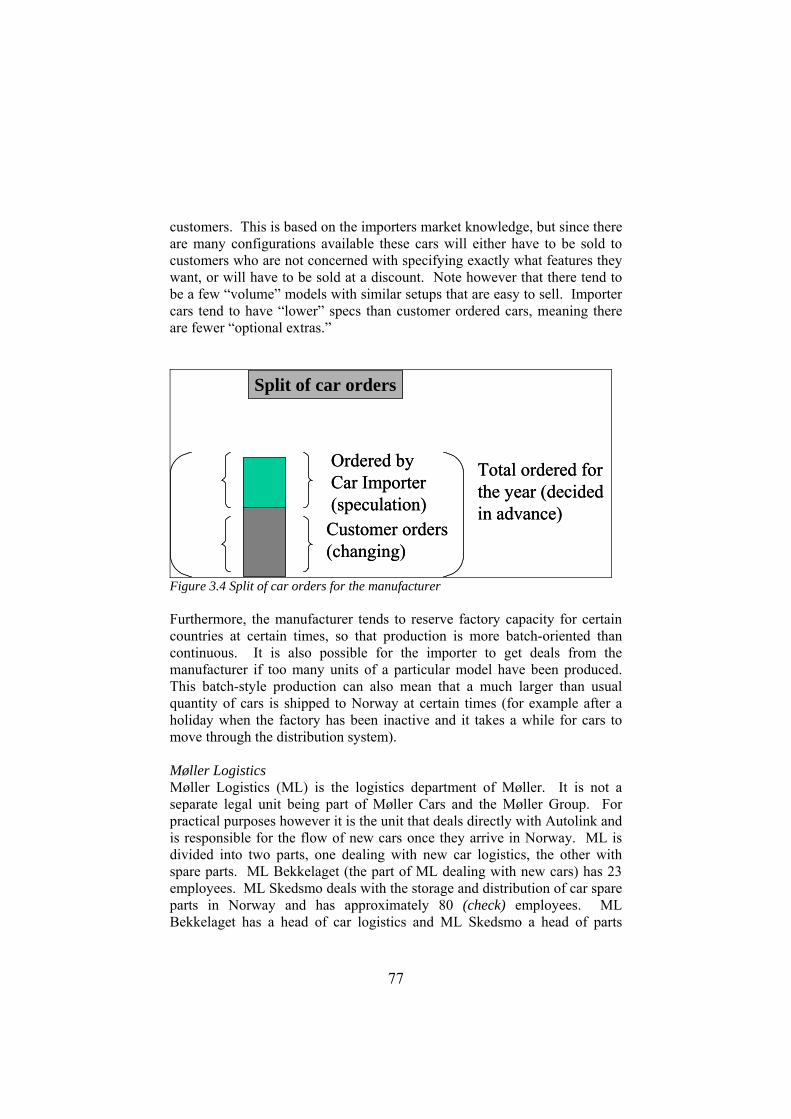
77
customers. This is based on the importers market knowledge, but since there are many configurations available these cars will either have to be sold to customers who are not concerned with specifying exactly what features they want, or will have to be sold at a discount. Note however that there tend to be a few “volume” models with similar setups that are easy to sell. Importer cars tend to have “lower” specs than customer ordered cars, meaning there are fewer “optional extras.”
Split of car orders
Customer orders(changing)
Total ordered for the year (decided in advance)
Ordered by Car Importer(speculation)
Split of car orders
Customer orders(changing)
Total ordered for the year (decided in advance)
Ordered by Car Importer(speculation)
Figure 3.4 Split of car orders for the manufacturer Furthermore, the manufacturer tends to reserve factory capacity for certain countries at certain times, so that production is more batch-oriented than continuous. It is also possible for the importer to get deals from the manufacturer if too many units of a particular model have been produced. This batch-style production can also mean that a much larger than usual quantity of cars is shipped to Norway at certain times (for example after a holiday when the factory has been inactive and it takes a while for cars to move through the distribution system). Møller Logistics Møller Logistics (ML) is the logistics department of Møller. It is not a separate legal unit being part of Møller Cars and the Møller Group. For practical purposes however it is the unit that deals directly with Autolink and is responsible for the flow of new cars once they arrive in Norway. ML is divided into two parts, one dealing with new car logistics, the other with spare parts. ML Bekkelaget (the part of ML dealing with new cars) has 23 employees. ML Skedsmo deals with the storage and distribution of car spare parts in Norway and has approximately 80 (check) employees. ML Bekkelaget has a head of car logistics and ML Skedsmo a head of parts

78
logistics who is also the director of Møller Logistics. This case only deals with new car logistics and so will not detail the activities at ML Skedsmo. The figure below shows the main activities related to the arrival and handling of cars at Bekkelaget.
Ship arrivesBekkelaget
Cars unloaded“First point of rest”
UECC
Indep. L
Cars inspectedfor damage
Independentinspectors
List of cars on s hip sent
Planning layoutof rows
VWT
Cars registeredthrough barcode
Hand terminals “docked”
Labels printed andput on cars
Boat day flow Møller, part 1
Control pointMøllerLogistikk

79
Order nr. + destin ationPut o n cars’ r ear wind ow
Driven in batchesTo interim area
Driven in batchesto Møller Synergi
Møller Synergi:-PDI
Rebuilding
Cars placed in “ready”area when d one
Cars moved to “rows”
Autolink informedof ready cars
Autolink sendstrailer for cars
Loaded on trains- 2 tracks
Boat day flow Møller, part 2
Train
PDI + Service
Ready for customer
Møller Synergi
MøllerLogistikk
Autolink
Figure 3.5 Detailed activities, “boat day” at Møller Detailed activities Notice of ship with list of inventory: This is sent to Møller Logistikk a couple of days before the ship arrives. The list is auto-generated. It arrives in a free text format in a mail and is then converted and loaded into Møllers IT system. VWT is responsible for the list.
80
Ship arrives: Normally the ship should arrive during the night and be ready for unloading at 0700. This is not always the case however. The last 6 months have been particularly problematic. This is in part caused by the use of a new ship – this is marginally slower and harder to load/unload than the previous ship used. Unloading: Unloading is carried out by a separate firm owned by a constellation of shipping firms. This firm has an exclusive contract for unloading ships in Oslo harbour so Møller cannot choose whether to use them or not. The unloading firm places the cars at “first point of rest” inside a security zone. Depending on the load, the ship may have enough cars to fill this area several times, and so the firm cannot finish unloading until Møller has registered and moved cars. Inspection: An independent firm inspects all cars after they have been unloaded to first point of rest. Each car is inspected from all angles and marked as ok or with noted damage. The inspection firm usually has 1 or 2 people on-site when a ship arrives. The general principle is that each new party in the transport chain checks the car for damage – the previous party must then pay for the damage unless it has already been pointed out. The inspection company has standard procedures for how the cars are to be inspected, but not all types of damage can be found through this type of inspection. Although the delineation of responsibility is theoretically quite clear, in practice there may be negotiation between the parties as to who is really responsible for particular damage to cars. Local planning: The list of cars arriving with the ship is combined with knowledge about other cars already at the docks and cars just coming out from Møller Synergi (detailed later). A number of “rows” are marked at Møller’s facility, and these are generally assigned cars for a specific destination. This is first planned on an Excel sheet, and the cars are then moved to rows accordingly. Updates are carried out as needed, with a new layout for rows made each time a boat arrives. All Møller Logistics personnel on the docks have access to this “target” layout. Cars registered: The first operation for Møller logistics at the docks is registering the cars. This is done through reading a barcode attached to the front screen of each car with a hand-held scanner. The scanner can read a number of codes, but must then be brought back to the Møller logistics office to “dock” so the data can be downloaded into Møllers IT system. When a car is registered, this information can be merged with existing information in Møllers IT system on services to be carried out to the car, end customer and so on. A more extensive label for local use is then printed.
81
When all cars have been read in this way, this also provides a check of cars unloaded versus the list sent by VWT previously. Car labelled: The new label is now attached to the car. The destination and order number (local information) is written, usually on the rear window of the car (in chalk). In some cases a delivery date is also written on the rear window. Depending on the services required and the destination of the car, there are three possible destinations at this stage: The car goes directly to transport by road: The car requires no further service from Møller and can be set up on a destination row. Once or several times a day if needed Møller logistics sends Autolink a list over the cars for transport, allowing Autolink to build loads. When the message is sent, Autolink will send a trailer when possible to pick up the cars, subject to the constraints in their own transport system. The car goes directly to transport by train: Trains run by Cargonet arrive periodically and with set destinations. Møller report requirements for transport on a running basis. There are two tracks at the Møller facilities. The train will arrive on one of these and leave a number of open railway wagons. These can be used to transport any type of car. The train then moves out and returns on the second track with the closed railway wagons. Both sets are then loaded, the open wagons are reattached and Cargonet is responsible for the train until it arrives at the destination. The spare capacity for railway transport is an important issue – a recurring problem has been that the demand for railway transport is not coordinated between the main users Møller, Autolink and Autotransport, so that all may decide that they want their cars for a particular city on the same day, leading to too much demand whilst trains going to other cities are not fully utilized. The car goes to Møller Synergi: Cars requiring PDI operations or technical modifications by Møller are assigned to Møller Synergi, another department of Møller. Møller Synergi is located in the same building as Møller Logistics. Cars for Møller Synergi are therefore simply parked in an assigned area in the building (which houses significant parking space). They then become the responsibility of Møller Synergi until they are finished with the services to be carried out and place the finished cars in another area in the building. Møller Logistics picks cars from this area on an ongoing basis, registers them as complete and places them on the rows ready for transport. A message is then sent to Autolink as per the description above.

82
Møller – Investments Møllers Facility at Bekkelaget at Oslo harbour is in principle rented from Oslo Port. The facility has total parking space for 3,500 cars. The building also houses the administration for Møller Logistics, as well as several workshops and space for Møller Synergi. A double railway track leads up to the building, allowing a train to be split for easier loading. Ramps at the end of each railway track enable cars to drive directly onto railway wagons. The actual berth for ships and first point of rest (i.e. the unloading area) is controlled by Oslo Port when ships are unloading. However, once the ship leaves this area can remain open. Due to safety regulations, the area must have a guard when it is in operation. 4.5.2 Toyota Toyota owns 100% of Toyota Norway and 40% of Bauda, the main dealer group for Toyota to Norway. Toyota Norway is a national sales company and also deals with spare parts. Approximately 22 300 Toyotas were registered in Norway in 2006 (Bauda Annual Report 2006). This gives Toyota a market-share in Norway of 14,1%. There is considerable growth in Europe, and Toyota has had trouble meeting demand in some areas. There are factories already operating or being built in the UK, France, Germany, Poland and Czech Republic. Over half of the Toyotas sold in Europe are currently produced in Europe. This number is expected to increase. Toyota’s general strategy for distribution is to maintain control over the entire logistics flow, but not to be directly involved on the dealer side. Distribution Network Toyota keeps control of a large degree of its own distribution network, but actual transport may be outsourced. Japanese production is transported to Europe with large deep-sea ships with a capacity of around 5,000 cars. Within Europe smaller Feeder ships are used in combination with rail or road transport. A goal has been to reduce the number of deep-sea ships used, partly because of cost. Furthermore, car production in Europe is increasing with more factories being built. This has lead to a reduced need for inter-continental transport. Several projects have been carried out in the last few years in order to improve logistics flow. The logistics flow is built upon contracts with customers, but the number of offers provided to customers is also used to guide pre-allocation. The sales process is now entirely electronic from the
83
dealer onwards. This allows monitoring of the total number of orders in the system at any time. Traditionally each European country has had its own storage facilities, with 2.8-3x of monthly sales in stock. Scandinavia has typically had somewhat lower inventories. Whereas Toyota Nordic does not own all its dealers, it has substantial influence, and enters into negotiation with the dealers in order to meet with challenges such as the block exemption. Formal control can be enforced through the contracts with Toyota itself, but this is not always necessary. Margins for dealers will become more variable, and more based on dealer performance. This is seen as partial protection against “low cost” dealers. It is Toyota’s aim for dealers to keep to Toyota because it is favourable for them. This is particularly the case currently because of the growth in market share and thus increased sales. HUB system Toyota’s Scandinavian hub is located at Malmö. The market for Scandinavia amounts to roughly 85,000 cars each year, with a total 100,000 passing through the hub because of return cars. Drammen is used as a local distribution centre for Norway. The distance to Malmö is 600 km. The car logistics hub in Malmø handled 345,000 cars in 2005 (these numbers indicate “handlings” rather than unique cars). In 2001 this number was 31,000 so the increase has been roughly one order of magnitude in five years. The background for this increase is the opening of the Øresund-bridge leading to reduced ferry and associated traffic and freeing up substantial capacity in both Copenhagen and Malmø ports. The two ports have joined forces through the company Copenhagen-Malmø Port (CMP). Substantial investments in infrastructure made the port attractive for car transport. Toyota’s decision to move its Scandinavian hub to Malmø gave the port a large base volume of cars and was a critical point in making the port attractive for other car manufacturers. Currently CMP houses four PDI-centres and 600,000m2 of space for handling and storage of cars. It has not yet been necessary to build storage facilities of more than one storey.
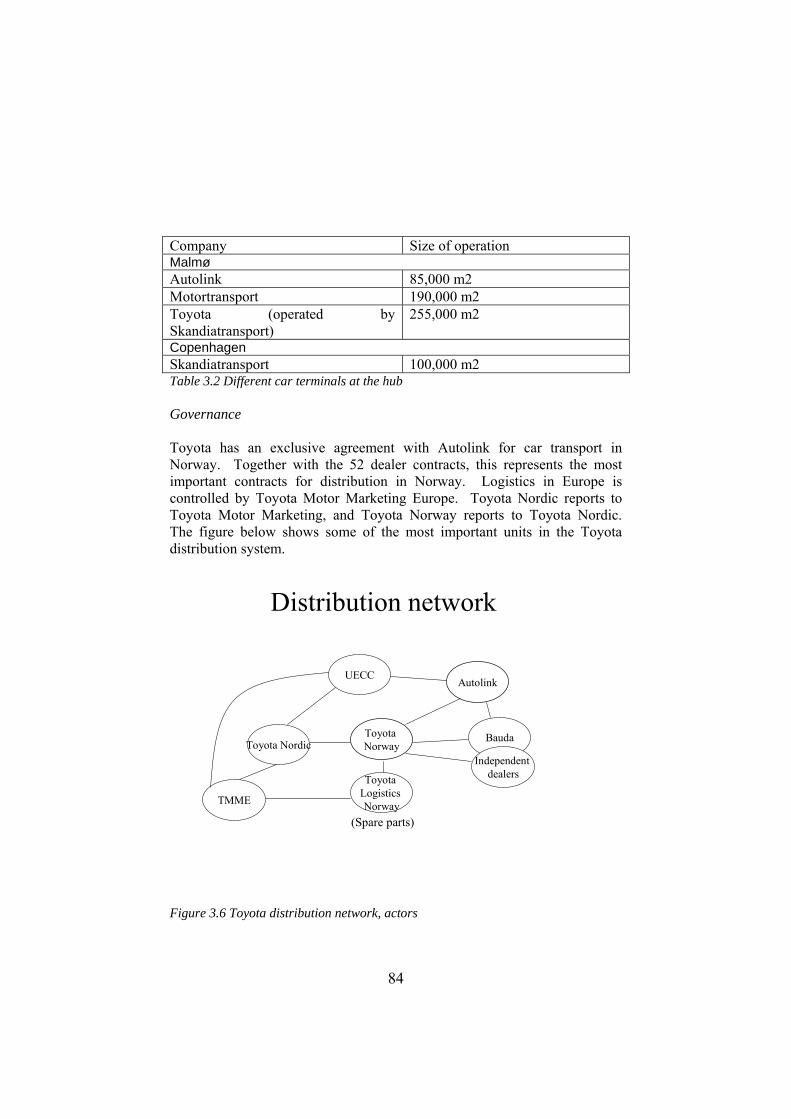
84
Company Size of operation Malmø Autolink 85,000 m2 Motortransport 190,000 m2 Toyota (operated by Skandiatransport)
255,000 m2
Copenhagen Skandiatransport 100,000 m2 Table 3.2 Different car terminals at the hub Governance Toyota has an exclusive agreement with Autolink for car transport in Norway. Together with the 52 dealer contracts, this represents the most important contracts for distribution in Norway. Logistics in Europe is controlled by Toyota Motor Marketing Europe. Toyota Nordic reports to Toyota Motor Marketing, and Toyota Norway reports to Toyota Nordic. The figure below shows some of the most important units in the Toyota distribution system.
Toyota Norway
Autolink
BaudaToyota Nordic
Toyota Logistics Norway
Independent dealers
TMME
UECC
Distribution network
(Spare parts)
Figure 3.6 Toyota distribution network, actors
85
Summary Toyota: Toyota Motor Marketing Europe is responsible for the flow of cars in Europe and maintains a high level of control, but many of the actual physical operations are outsourced to local providers. This is consistent with Toyota’s policy of not owning its dealers but maintaining a high level of control of the logistics flow. Toyota is experiencing growth in car sales and is building more factories in Europe in order to reduce the intercontinental flow. In terms of Autolink Toyota buys the services (mostly transport) not carried out at its regional hub in Malmø. 4.5.3 Ford Ford Norway registers sales of about 800 cars/month, or 10000 cars per year (50% of which are company cars). The turnover in 2003 was about 1,2 billions NOK and about 3 billions for the dealers. Currently Ford has about 30 employees in Norway, but the organization was much larger 15 years ago (about 190 people). The difference is due to a change in emphasis with more activities being outsourced. Ownership structure Ford Norway is owned by Ford Denmark, which is owned by Ford Motor Company (USA). Ford Norway is a sales organization of car manufacturer and it represents only Ford. The other brands manufactured such as for example Volvo and Mazda have their own import-companies. Ford Norway is responsible for sales and marketing of Ford vehicles and spare-parts in Norway. Corporate structure Ford Europe consists of 17 national sales companies. There are several vehicle plants in Europe. Ford England and Ford Germany have their own organizations because they need to coordinate both large sale-volumes and manufacturing activities in Europe. Ford Europe’s office is located in Köln, Germany, where Ford Traffic department is responsible for arrangement of logistics and transportation services for the national sales companies. The national sales companies are in addition organized in bigger “hubs” to coordinate and plan promotion and other marketing activities in larger geographical areas, taking into consideration the cultural similarities between the countries. There are hubs for Scandinavia (for all Scandinavian countries, with main office in Gothenburg), Iberia (for Portugal, Spain and Italy), Austria/Switzerland and others. All hubs have reporting and planning systems, which are approved by Ford Europe and controlled from Köln.
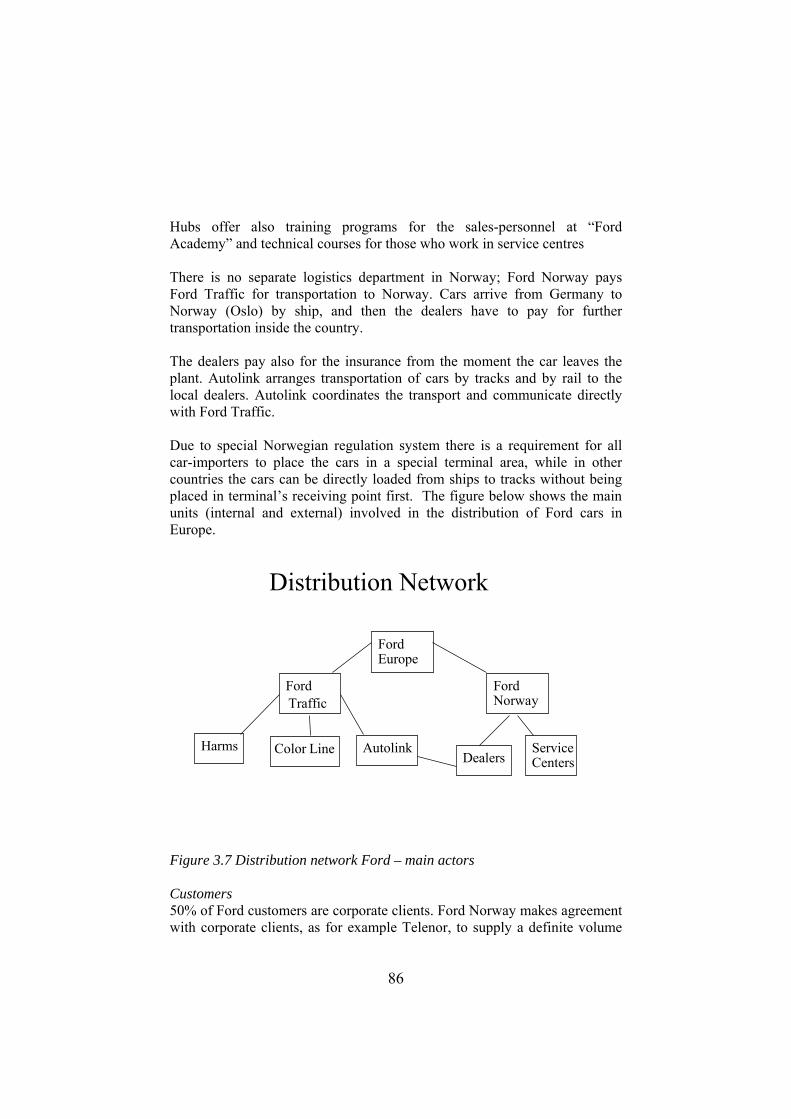
86
Hubs offer also training programs for the sales-personnel at “Ford Academy” and technical courses for those who work in service centres There is no separate logistics department in Norway; Ford Norway pays Ford Traffic for transportation to Norway. Cars arrive from Germany to Norway (Oslo) by ship, and then the dealers have to pay for further transportation inside the country. The dealers pay also for the insurance from the moment the car leaves the plant. Autolink arranges transportation of cars by tracks and by rail to the local dealers. Autolink coordinates the transport and communicate directly with Ford Traffic. Due to special Norwegian regulation system there is a requirement for all car-importers to place the cars in a special terminal area, while in other countries the cars can be directly loaded from ships to tracks without being placed in terminal’s receiving point first. The figure below shows the main units (internal and external) involved in the distribution of Ford cars in Europe.
Distribution Network
FordNorway
FordTraffic
AutolinkHarms
FordEurope
ServiceCentersDealers
Color Line
Figure 3.7 Distribution network Ford – main actors Customers 50% of Ford customers are corporate clients. Ford Norway makes agreement with corporate clients, as for example Telenor, to supply a definite volume
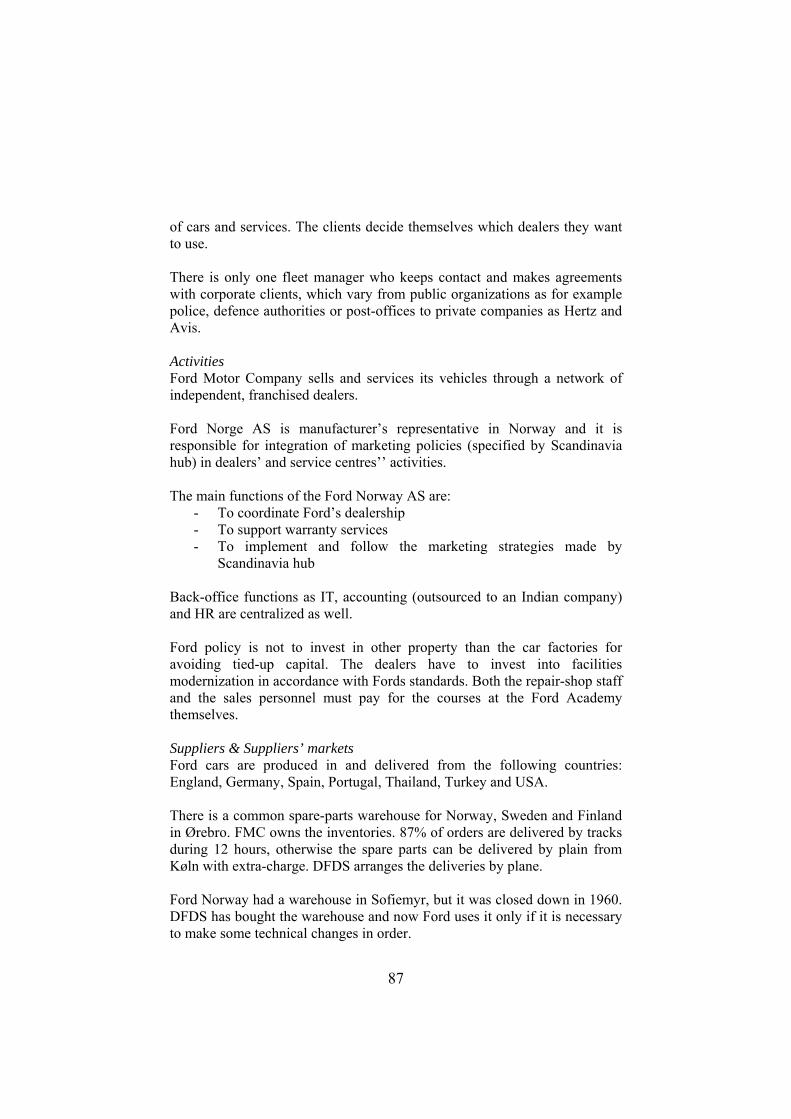
87
of cars and services. The clients decide themselves which dealers they want to use. There is only one fleet manager who keeps contact and makes agreements with corporate clients, which vary from public organizations as for example police, defence authorities or post-offices to private companies as Hertz and Avis. Activities Ford Motor Company sells and services its vehicles through a network of independent, franchised dealers. Ford Norge AS is manufacturer’s representative in Norway and it is responsible for integration of marketing policies (specified by Scandinavia hub) in dealers’ and service centres’’ activities. The main functions of the Ford Norway AS are:
- To coordinate Ford’s dealership - To support warranty services - To implement and follow the marketing strategies made by
Scandinavia hub
Back-office functions as IT, accounting (outsourced to an Indian company) and HR are centralized as well. Ford policy is not to invest in other property than the car factories for avoiding tied-up capital. The dealers have to invest into facilities modernization in accordance with Fords standards. Both the repair-shop staff and the sales personnel must pay for the courses at the Ford Academy themselves. Suppliers & Suppliers’ markets Ford cars are produced in and delivered from the following countries: England, Germany, Spain, Portugal, Thailand, Turkey and USA. There is a common spare-parts warehouse for Norway, Sweden and Finland in Ørebro. FMC owns the inventories. 87% of orders are delivered by tracks during 12 hours, otherwise the spare parts can be delivered by plain from Køln with extra-charge. DFDS arranges the deliveries by plane. Ford Norway had a warehouse in Sofiemyr, but it was closed down in 1960. DFDS has bought the warehouse and now Ford uses it only if it is necessary to make some technical changes in order.

88
Distribution network Dealers control the deliveries of vehicles to customer at promised date. Ford Norway can trace the order anytime due to the transparency of data system, and it also receives the copy of payment invoice. Car dealers place the orders via Internet system connected directly to the plant. The lead-time after placing an order is about 30 days. The transportation of the finished cars takes about 9 days. The main transporter of finished cars for Ford in Europe is E.H.Harms GmbH&Co KG Aut.Log. All cars in the data system can be divided into 3 groups:
- cars that have already arrived Norway - cars that are on the way to Norway - cars in production (specified and unspecified)
Unspecified cars in production are specific vehicle models, but without colour and motor specifications. That gives opportunity to make changes in specification during 10 days before production starts. Ford Norway has registered 400 specified cars in the system and 1500 unspecified cars, which are not yet in production per interview date. Once the order has been placed, Ford Norway registers that order in their system and follows up only information flow without taking part in delivery arrangements. Car dealers transfer the payment to the factory during 30 days after the car has arrived Norway. The data system, installed by Ford Norway, allows each dealer to see the orders placed in the system by other dealers. About 30% of ordered cars change the delivery-place, which means that dealers negotiate changes with each other by they own. . Information on changes in delivery-place must be communicated to Autolink in advance. As soon as the cars have arrived Norway by ship to Oslo and have been visually and technically inspected by port and custom services (PDI –pre-delivery inspection and custom clearance), the Autolink company arranges transportation of Ford cars inside the country. The figure below summarized the split of main activities and responsible parties for the distribution of Ford cars.
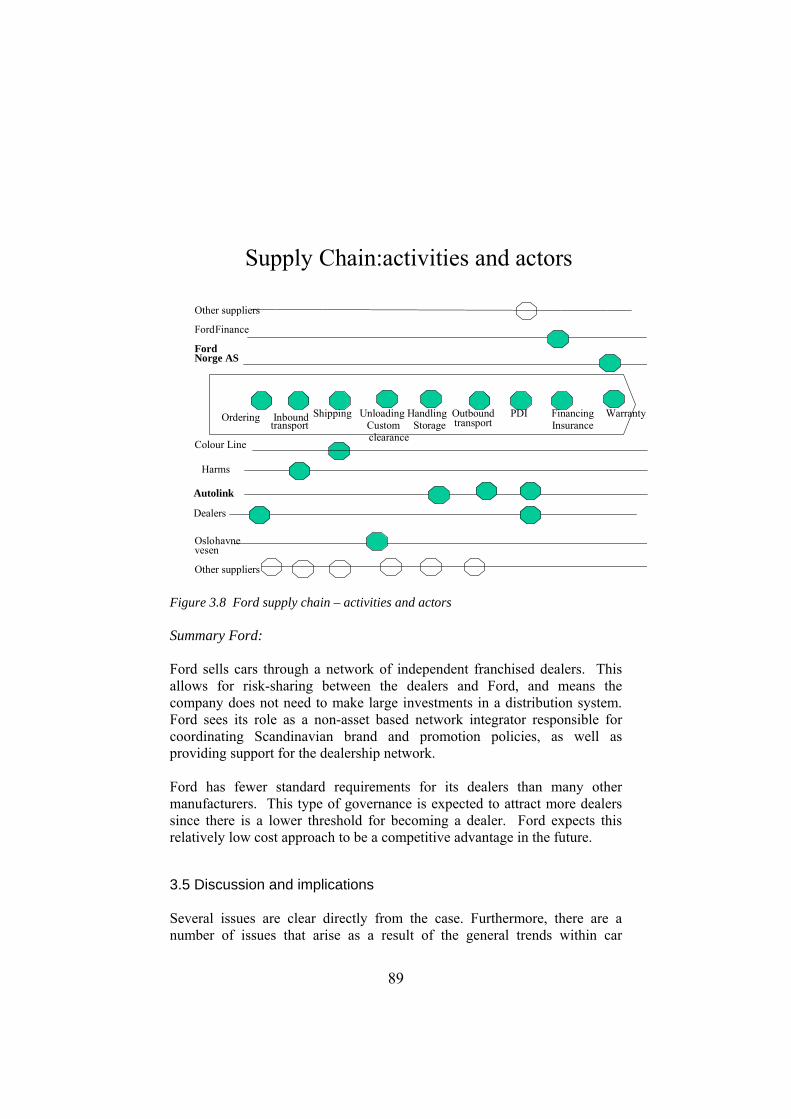
89
Supply Chain:activities and actors
Ordering Inbound Shipping Unloading Handling Outbound PDI Financing Warrantytransport Custom Storage transport Insurance
clearance
Other suppliers
Ford Finance
FordNorge AS
Colour Line
Harms
Autolink
Dealers
Oslo havnevesen
Other suppliers
Figure 3.8 Ford supply chain – activities and actors Summary Ford: Ford sells cars through a network of independent franchised dealers. This allows for risk-sharing between the dealers and Ford, and means the company does not need to make large investments in a distribution system. Ford sees its role as a non-asset based network integrator responsible for coordinating Scandinavian brand and promotion policies, as well as providing support for the dealership network. Ford has fewer standard requirements for its dealers than many other manufacturers. This type of governance is expected to attract more dealers since there is a lower threshold for becoming a dealer. Ford expects this relatively low cost approach to be a competitive advantage in the future.
3.5 Discussion and implications Several issues are clear directly from the case. Furthermore, there are a number of issues that arise as a result of the general trends within car
90
distribution. How these will affect a particular manufacturer, importer and service providers is not so obvious, however. A dominant force in car distribution is the manufacturers, both because of their relative size and traditional influence in structuring their distribution arrangements. This in itself has been some of the background for the discussion around the block exemption. The strategy of the manufacturer, in regards to whether they have a regional or country-focused distribution strategy is important for third party providers and for the structure of the distribution system. The manufacturers vary in how much control they seek to exercise over the distribution system, but all manufacturers buy a number of essential services from outside providers. In this sense it is more a case of the balance between maintaining control and passing control of the logistics flow to outside providers rather than a question of whether or not to buy services from others. Autolink is one example where the manufacturers use the company in different ways depending on their own systems, and aptly illustrate some of the various ways this may be done. From the case description we can conclude that Møller and Autolink perform a number of the same activities (although not on the same cars). Although Autolink performs transport services for Møller, there is duplication of services with regard to receiving cars, registering them and preparing them for the customer. Significantly, all these activities are carried out in-house at Møller, since Møller has its own port operation. Møller volumes are sufficient to achieve some economies of scale, and the existing operation fits well in the distribution system. The investment in the current system is significant and makes large changes costly. An obvious question is whether Autolink can offer some services more cheaply due to scale. Ford has outsourced the flow to a greater extent than the other manufacturers, as a clear low-cost strategy. This may be related to the Product Specialist approach shown above. Focus is both on car quality and marketing. This means that a service provider such as Autolink will typically be given more tasks in the Ford system. In the Toyota case there is somewhat tighter control but still a great deal of outsourcing. This outsourcing is done in accordance with a system designed by Toyota however, i.e. it was Toyota that decided to place the regional hub at Malmø and redirected the flow of cars there. Using local service providers to carry out the actual operations does not change the flow as long as their performance is sufficient. The regional model also means that there are few tasks remaining to be performed in Norway and so a Norwegian service provider such as Autolink mainly has tasks related to transport. Note
91
however that Autolink has expanded into Sweden, in part to be able to compete in terms of manufacturers such as Toyota which use Sweden as a main hub for Scandinavia. A general trend in distribution is that large international manufacturers are looking for regional partners or “one-stop-shops” that can provide the same services across a number of countries. This trend is certainly present in car distribution, for example with Toyota’s regional logistics hub in Malmø. VW for example has so far not shown any interest in this type of arrangement. If VW was to move to a regional hub this would of course have large consequences for the organization of its distribution system. For Autolink however the change might not be as large, since the distribution system within Norway would remain largely the same. Local transport from the distribution hub to a facility in Norway would also be necessary, so that the total expenditure on local transport might increase in such a case. VW might want to move to a regional transport provider in this case, but at present there are no truly Scandinavian car transport firms available to take on such a job. A final issue in this case is the block exemption which has received some considerable attention. Currently, the changes to the block exemption rules have not had a large and obvious impact in the Scandinavian region. This may be because of manufacturer strategies involving increased requirements for their dealers making it more difficult for others to enter the field, or it may simply be that any changes in such a relatively large distribution structure will take a long time . In terms of the block exemption it is interesting to note that Ford is the odd one out in this case, since it seems to encourage more dealers and by implication new outlets with its low-cost distribution strategy. References: Bohman, E., Stenbrink, P. & Rosenberg, J.H. (2003) Overhauling European Auto Distribution. Mckinsey Quarterly, 134-142.

92

93
CHAPTER 5
The Waste management case
Bente M. Flygansvær
5.1 Introduction
This chapter looks at reverse distribution systems and one specific transition process. The setting is taken from the reverse distribution systems for electrical and electronic products in Norway. The discussion is addressing the coordination issues that arose in the transition process, and specifically looking at the commercial interests and physical flows of the distribution system. Starting out, we give an introduction to the electrical and electronic setting of the case, and then we look at one specific reverse distribution system, namely the RENAS case. This case takes us through a transition period of five years, and addresses a number of challenges that we sum up in the final section of the chapter.
5.2 The reverse distribution system for electrical and electronic products In March 1996, the Ministry for the Environment (ME) in Norway published a report entitled "The collection and handling of waste from electrical and electronic (EE) products"4 (ME 1996). The report maps the volumes, contents and handling alternatives of waste from EE-products. The total amount of annual waste is estimated to be approximately 145,000 tonnes (Hjellnes Cowi 1996). Two years later, on March 16th 1998, the ME passed ‘Regulations regarding scrapped electrical and electronic products’ (EE-Regulations)5. In the EE-Regulations, the actors involved in importing, manufacturing (domestic), distributing and sales of EE-products were given responsibility for collection, recycling and proper treatment of EE-products
4 The report is printed in Norwegian and has the title “Innsamling og behandling av avfall fra elektriske og elektroniske produkter” (Miljøverndepartementet 1996/ T-1135). 5 In Norwegian: ‘EE-forskriften’
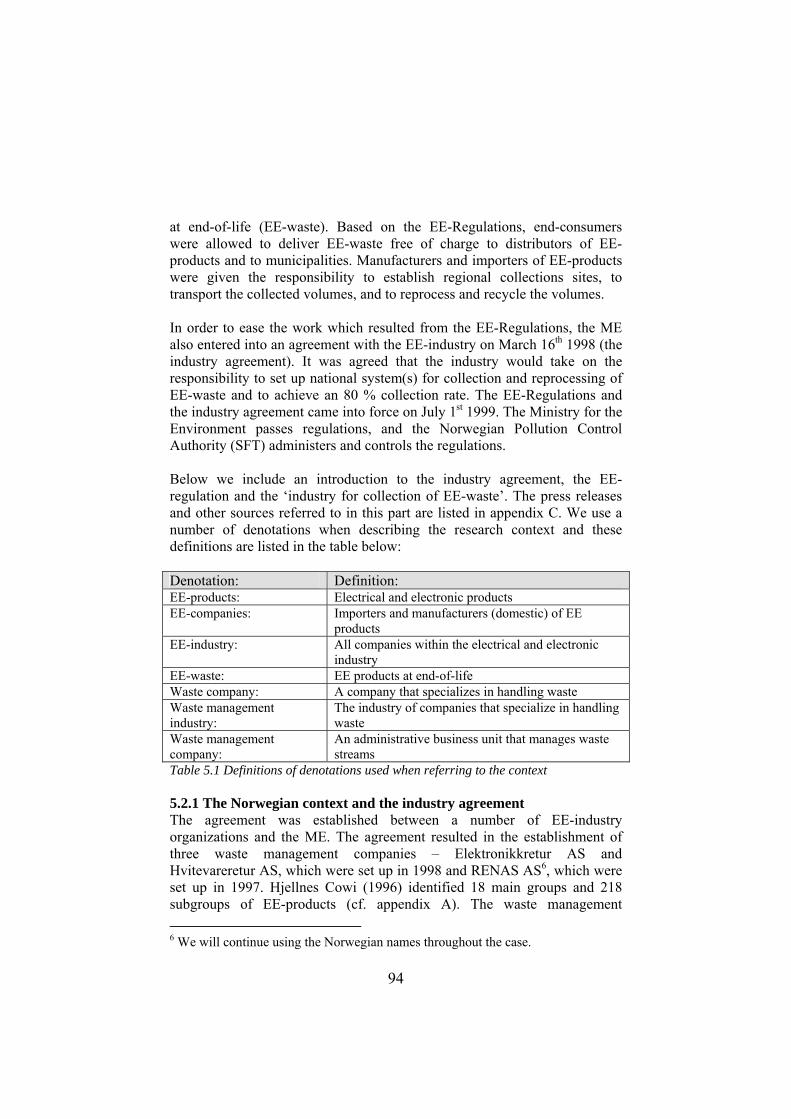
94
at end-of-life (EE-waste). Based on the EE-Regulations, end-consumers were allowed to deliver EE-waste free of charge to distributors of EE-products and to municipalities. Manufacturers and importers of EE-products were given the responsibility to establish regional collections sites, to transport the collected volumes, and to reprocess and recycle the volumes. In order to ease the work which resulted from the EE-Regulations, the ME also entered into an agreement with the EE-industry on March 16th 1998 (the industry agreement). It was agreed that the industry would take on the responsibility to set up national system(s) for collection and reprocessing of EE-waste and to achieve an 80 % collection rate. The EE-Regulations and the industry agreement came into force on July 1st 1999. The Ministry for the Environment passes regulations, and the Norwegian Pollution Control Authority (SFT) administers and controls the regulations. Below we include an introduction to the industry agreement, the EE-regulation and the ‘industry for collection of EE-waste’. The press releases and other sources referred to in this part are listed in appendix C. We use a number of denotations when describing the research context and these definitions are listed in the table below: Denotation: Definition: EE-products: Electrical and electronic products EE-companies: Importers and manufacturers (domestic) of EE
products EE-industry: All companies within the electrical and electronic
industry EE-waste: EE products at end-of-life Waste company: A company that specializes in handling waste Waste management industry:
The industry of companies that specialize in handling waste
Waste management company:
An administrative business unit that manages waste streams
Table 5.1 Definitions of denotations used when referring to the context 5.2.1 The Norwegian context and the industry agreement The agreement was established between a number of EE-industry organizations and the ME. The agreement resulted in the establishment of three waste management companies – Elektronikkretur AS and Hvitevareretur AS, which were set up in 1998 and RENAS AS6, which were set up in 1997. Hjellnes Cowi (1996) identified 18 main groups and 218 subgroups of EE-products (cf. appendix A). The waste management 6 We will continue using the Norwegian names throughout the case.
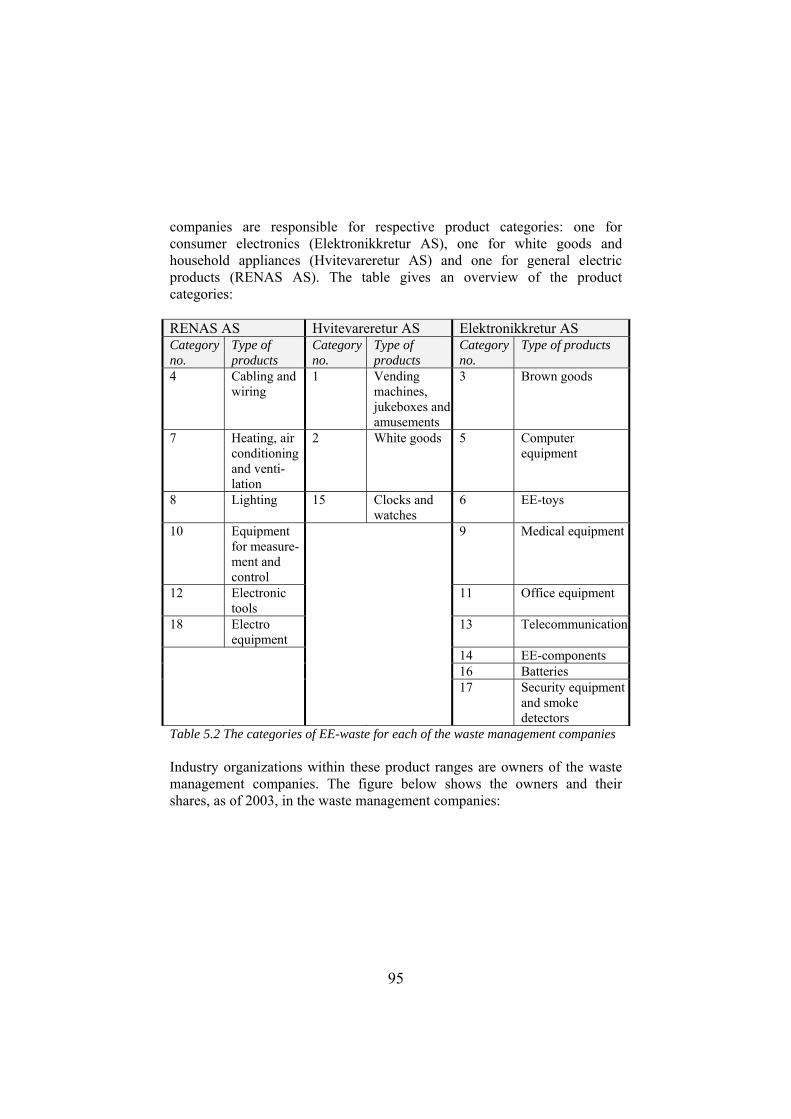
95
companies are responsible for respective product categories: one for consumer electronics (Elektronikkretur AS), one for white goods and household appliances (Hvitevareretur AS) and one for general electric products (RENAS AS). The table gives an overview of the product categories: RENAS AS Hvitevareretur AS Elektronikkretur AS Category no.
Type of products
Category no.
Type of products
Category no.
Type of products
4 Cabling and wiring
1 Vending machines, jukeboxes and amusements
3 Brown goods
7 Heating, air conditioning and venti-lation
2 White goods 5 Computer equipment
8 Lighting 15 Clocks and watches
6 EE-toys
10 Equipment for measure-ment and control
9 Medical equipment
12 Electronic tools
11 Office equipment
18 Electro equipment
13 Telecommunication
14 EE-components 16 Batteries 17 Security equipment
and smoke detectors
Table 5.2 The categories of EE-waste for each of the waste management companies Industry organizations within these product ranges are owners of the waste management companies. The figure below shows the owners and their shares, as of 2003, in the waste management companies:

96
Elektronikkretur AS
Hvitevareretur AS
RENAS AS
TBL Elektro
EFO (elektroforeningen)
50 %
50 %
NEL (Norske elektroleverandørers
landsforening)
100 %
EE-bransjen
ABELIA
IKT Norge
40 %
20 %
40 %
Figure 5.1 Ownership structure of the waste management companies7 For RENAS, EFO is a professional body for Norwegian electro manufacturers, agents and wholesalers, and TBL Elektro is an association of electro-manufacturers. For Hvitevareretur, NEL represents the trade of white goods and household appliances. NEL is also a member to ‘EE-bransjen’, which is one of Elektronikkreturs’ owners. In Elektronikkretur’s case, EE-Bransjen (Electro and Electronics Trade) is responsible for organizing all actors within the trade. The actors are specialized traders/dealers, chain stores, suppliers (importers/agents) and service workshops. ‘ABELIA’ is the association of Norwegian ICT - and knowledge-based enterprises. The organization is a trade and employers association, which is linked to Norway’s leading employers organization, the Confederation of Norwegian Business and Industry (NHO). ‘IKT-Norge’ represents companies within the ICT industry, which works to improve the general terms and conditions of the industry. The waste management companies are responsible for handling the demands of the EE-Regulations on behalf of the industry. A waste management company can be described as the operative consequence of the industry agreement. Responsibilities include setting up collection systems for their respective product categories, as well as managing the stakeholders of the systems. A collection system involves collection, transport and recycling of all EE-products at end-of-life. Such systems are given directives from the
7 Source: The waste management companies

97
EE-Regulations and these are to be looked at more closely in the next section. Each system has a number of stakeholders, who have their own particular interests. It is the waste management companies’ task to facilitate fulfilment of these interests. Stakeholders include the industry organizations (i.e. the owners), the end-consumers, the EE-companies and the authorities. The industry organizations’ aim is to fulfil the industry agreement. The industry organizations represent the interests of the EE-companies and, if the agreement is not fulfilled, sanctions are made towards the EE-companies. The waste management companies are given the responsibility on behalf of the industry organizations. As owners of the waste management companies, they are directly involved with and have direct influence on the waste management companies. The end-consumers are the suppliers of volumes of waste. The end-consumers need to receive information about the collection systems, and how and where to return their EE-waste. The waste management companies are dependent on the end-consumers in order to achieve high collection rates. A third stakeholder group is the importers and manufacturers (domestic) of EE-products (the EE-companies). The EE-companies need a collection system to handle the EE-products at end-of-life. They can either establish their own systems or become ‘members’ of the waste management companies. The waste management companies provide collection systems for members. The waste management companies are funded by members and therefore it is necessary for them to recruit members. Information and promotion is an activity the waste management companies perform towards the EE-companies. The authorities are also a stakeholder group of the waste management companies. The authorities’ focus is on a high collection rate. In this respect, the waste management companies have to demonstrate to the authorities that they are able to achieve this goal (i.e. 80%). A high collection rate is the means to secure the safe handling of the hazardous materials in EE-waste. In addition to collection rates, the waste management companies need to report and demonstrate that they are able to sort out the hazardous materials from the collected EE-waste, and that it is disposed of in environmentally friendly ways. Norway is the first country in the world to implement a national broad scale system for the collection of EE-waste (SFT 1998). The systems are structured on an industry level and are provided as a service to the industry as a whole. The relation between the government, represented by the ME, and the industry, represented by the industry organizations, is illustrated below:
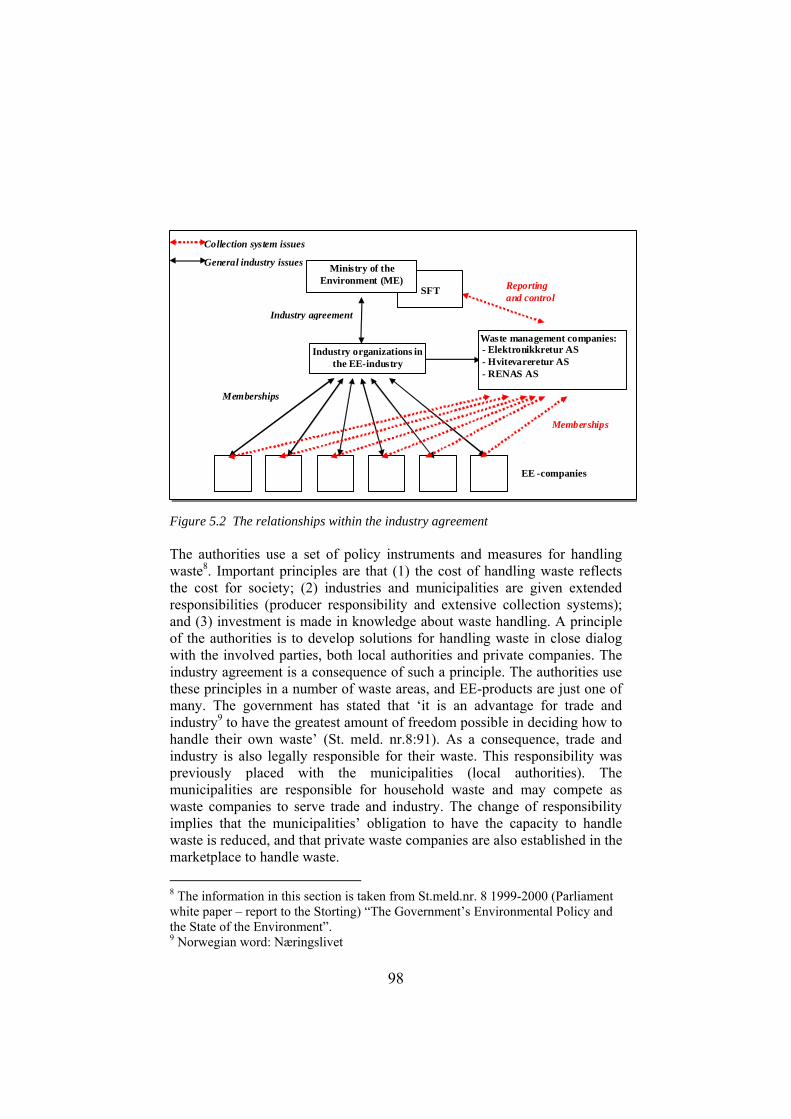
98
‘
Industry organizations in the EE-industry
EE -companies
Waste management companies: - Elektronikkretur AS - Hvitevareretur AS - RENAS AS
Industry agreement
Memberships
SFT
Ministry of the Environment (ME) Reporting
and control
Memberships
Collection system issues
General industry issues
Figure 5.2 The relationships within the industry agreement The authorities use a set of policy instruments and measures for handling waste8. Important principles are that (1) the cost of handling waste reflects the cost for society; (2) industries and municipalities are given extended responsibilities (producer responsibility and extensive collection systems); and (3) investment is made in knowledge about waste handling. A principle of the authorities is to develop solutions for handling waste in close dialog with the involved parties, both local authorities and private companies. The industry agreement is a consequence of such a principle. The authorities use these principles in a number of waste areas, and EE-products are just one of many. The government has stated that ‘it is an advantage for trade and industry9 to have the greatest amount of freedom possible in deciding how to handle their own waste’ (St. meld. nr.8:91). As a consequence, trade and industry is also legally responsible for their waste. This responsibility was previously placed with the municipalities (local authorities). The municipalities are responsible for household waste and may compete as waste companies to serve trade and industry. The change of responsibility implies that the municipalities’ obligation to have the capacity to handle waste is reduced, and that private waste companies are also established in the marketplace to handle waste. 8 The information in this section is taken from St.meld.nr. 8 1999-2000 (Parliament white paper – report to the Storting) “The Government’s Environmental Policy and the State of the Environment”. 9 Norwegian word: Næringslivet
99
Voluntary10 is, in other words, a key issue for the authorities in establishing collection systems for EE-waste (and other wastes). This is tied to the principle of producer responsibility11. The “producers” are given the responsibility to handle their products at end-of-life. In order to find effective and efficient solutions for this responsibility, it is a principle for the authorities that each company individually decides how to solve their challenges. The EE-companies therefore decide whether they want to become members of the waste management companies, and to which one. They could also establish their own systems as an alternative. In this case, they have to provide the authorities with evidence that they are actually collecting and handling 80% of their share of the EE-products at end-of-life. Within the EE-waste area, a few waste management companies have been established in addition to Elektronikkretur, Hvitevareretur and RENAS. We refer to these waste management companies as representatives of “independent systems”, as they are not a part of the industry agreement (cf. appendix B for an overview of such systems per 2003). One such company, Eurovironment, has specialized in taking back ICT12 equipment. It is a privately owned company but represents a number of ICT companies (i.e. follows the same model as the industry agreement). ICT equipment is the responsibility of the waste management company Elektonikkretur and therefore Eurovironment is a competitor. It was established because a branch of EE-companies decided to establish a collection system which consisted of different activities from those within the El-retur reverse distribution system. A second independent waste management company is RagnSells, which takes back all categories of EE-products but concentrates on consumer electronics. RagnSells is, in this manner, a competitor to all the other waste management companies. RagnSells' rationale for operating in this area is that it had a system prior to the industry wide initiative, with an already established customer portfolio (i.e. members). When the collection of EE-waste became prioritized, RagnSells saw this as a business opportunity. 10 Voluntary refers to the fact that each EE-company individually are given the legal right to decide how to solve the collection responsibilities for EE-products at end-of-life. 11 Companies are given the responsibility for their own waste according to the Norwegian Pollution Control Act and Product Control Act. See also St.meld.nr. 8 1999-2000. 12 ICT = Information and Communication Technology.
100
Thirdly, there is Batteriretur AS. This company specializes in the collection of car batteries, which have an electronic component. This particular system is directed at car importers/manufacturers in Norway, and not EE-companies. A few companies operate in-house collection systems and, as a result, have been registered with the authorities as waste management companies. These companies collect their own products and are considered marginal systems (in terms of volume). Five waste management companies within the collection of EE-waste, have established four different collection systems. Elektronikkretur AS and Hvite-vareretur AS jointly established a collection system, which is referred to as ‘the El-retur system’. RENAS AS developed a collection system for their products, which is referred to as ‘the Renas system’. Collection systems outside the industry agreement are referred to as ‘the independent systems’, and this includes ‘the Eurovironment system’ and ‘the RagnSells system’. “Outside the industry agreement” means that while they do not have a direct responsibility for product categories (cf. table 5.1), they do have established systems that collect the same products as the systems within the industry agreement. The authorities introduced a trial period of five years (1999-2004) in order for the industry to demonstrate its capability to take on the responsibility of the industry agreement. During this time, the waste management companies have set up collection systems and worked systematically with the stake-holders. Our specific case study will demonstrate this in the next section. Now, we take a closer look at the regulations that relate to scrapped EE-products. 5.2.2 The EE-Regulations The EE-Regulations’ primary function is to prevent hazardous materials from damaging the natural environment. Waste from EE-products is assumed to contain large quantities of hazardous materials. The table below gives an indication:
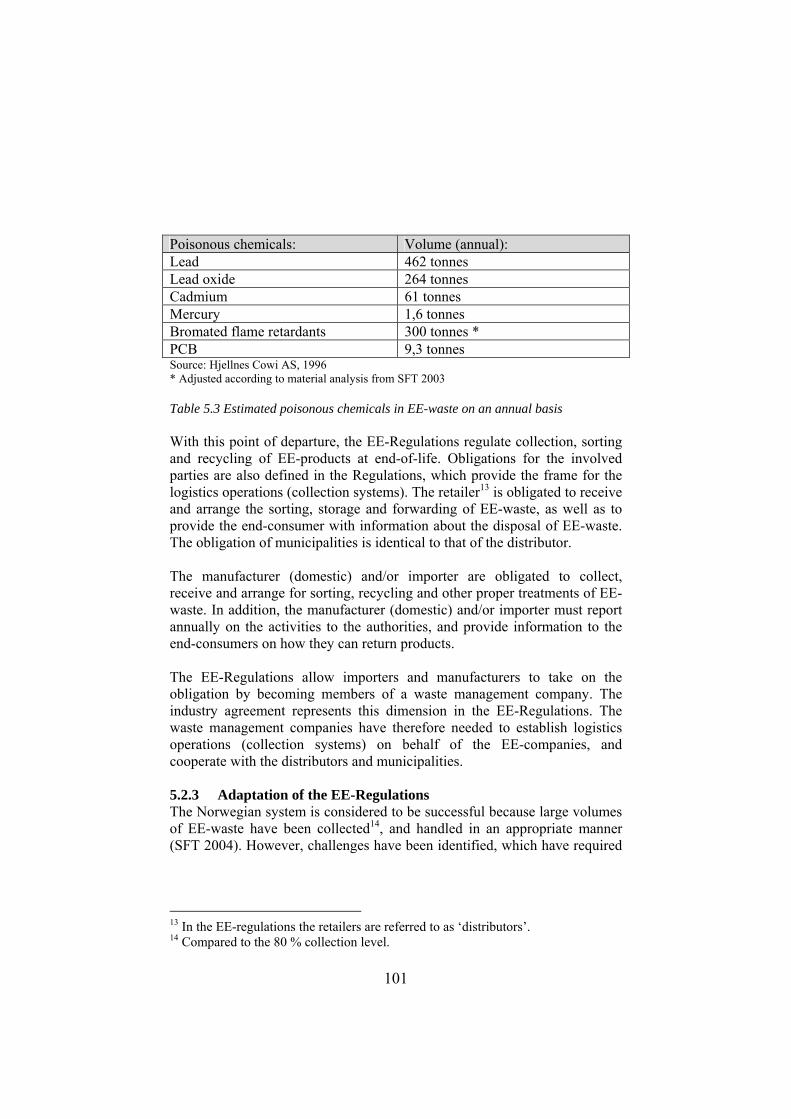
101
Poisonous chemicals: Volume (annual): Lead 462 tonnes Lead oxide 264 tonnes Cadmium 61 tonnes Mercury 1,6 tonnes Bromated flame retardants 300 tonnes * PCB 9,3 tonnes Source: Hjellnes Cowi AS, 1996 * Adjusted according to material analysis from SFT 2003 Table 5.3 Estimated poisonous chemicals in EE-waste on an annual basis With this point of departure, the EE-Regulations regulate collection, sorting and recycling of EE-products at end-of-life. Obligations for the involved parties are also defined in the Regulations, which provide the frame for the logistics operations (collection systems). The retailer13 is obligated to receive and arrange the sorting, storage and forwarding of EE-waste, as well as to provide the end-consumer with information about the disposal of EE-waste. The obligation of municipalities is identical to that of the distributor. The manufacturer (domestic) and/or importer are obligated to collect, receive and arrange for sorting, recycling and other proper treatments of EE-waste. In addition, the manufacturer (domestic) and/or importer must report annually on the activities to the authorities, and provide information to the end-consumers on how they can return products. The EE-Regulations allow importers and manufacturers to take on the obligation by becoming members of a waste management company. The industry agreement represents this dimension in the EE-Regulations. The waste management companies have therefore needed to establish logistics operations (collection systems) on behalf of the EE-companies, and cooperate with the distributors and municipalities. 5.2.3 Adaptation of the EE-Regulations The Norwegian system is considered to be successful because large volumes of EE-waste have been collected14, and handled in an appropriate manner (SFT 2004). However, challenges have been identified, which have required
13 In the EE-regulations the retailers are referred to as ‘distributors’. 14 Compared to the 80 % collection level.
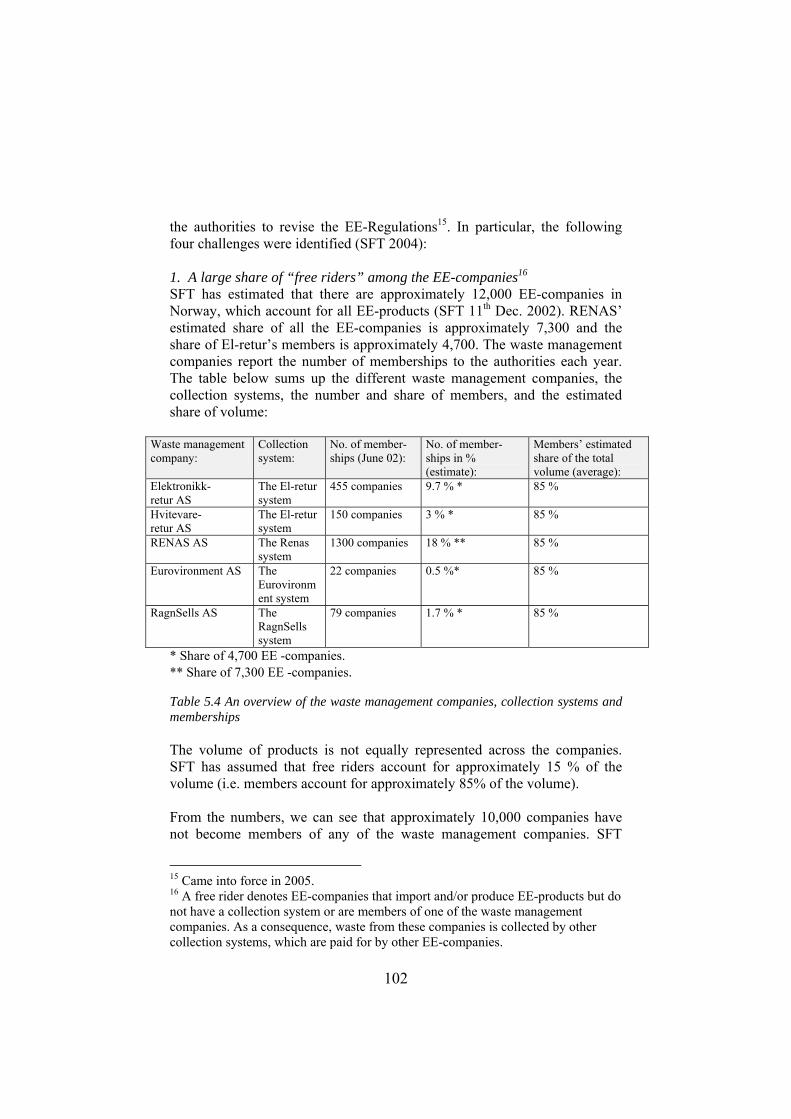
102
the authorities to revise the EE-Regulations15. In particular, the following four challenges were identified (SFT 2004): 1. A large share of “free riders” among the EE-companies16 SFT has estimated that there are approximately 12,000 EE-companies in Norway, which account for all EE-products (SFT 11th Dec. 2002). RENAS’ estimated share of all the EE-companies is approximately 7,300 and the share of El-retur’s members is approximately 4,700. The waste management companies report the number of memberships to the authorities each year. The table below sums up the different waste management companies, the collection systems, the number and share of members, and the estimated share of volume:
Waste management company:
Collection system:
No. of member- ships (June 02):
No. of member- ships in % (estimate):
Members’ estimated share of the total volume (average):
Elektronikk- retur AS
The El-retur system
455 companies 9.7 % * 85 %
Hvitevare- retur AS
The El-retur system
150 companies 3 % * 85 %
RENAS AS The Renas system
1300 companies 18 % ** 85 %
Eurovironment AS The Eurovironment system
22 companies 0.5 %* 85 %
RagnSells AS The RagnSells system
79 companies 1.7 % * 85 %
* Share of 4,700 EE -companies. ** Share of 7,300 EE -companies. Table 5.4 An overview of the waste management companies, collection systems and memberships The volume of products is not equally represented across the companies. SFT has assumed that free riders account for approximately 15 % of the volume (i.e. members account for approximately 85% of the volume). From the numbers, we can see that approximately 10,000 companies have not become members of any of the waste management companies. SFT
15 Came into force in 2005. 16 A free rider denotes EE-companies that import and/or produce EE-products but do not have a collection system or are members of one of the waste management companies. As a consequence, waste from these companies is collected by other collection systems, which are paid for by other EE-companies.
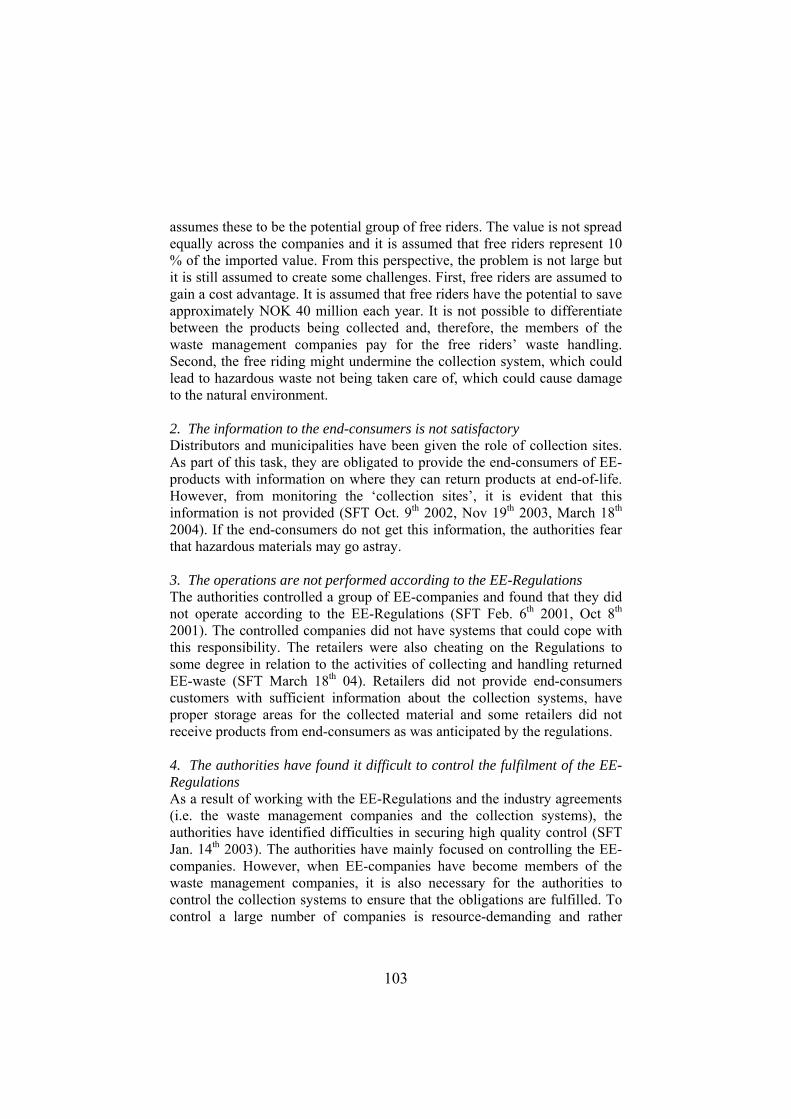
103
assumes these to be the potential group of free riders. The value is not spread equally across the companies and it is assumed that free riders represent 10 % of the imported value. From this perspective, the problem is not large but it is still assumed to create some challenges. First, free riders are assumed to gain a cost advantage. It is assumed that free riders have the potential to save approximately NOK 40 million each year. It is not possible to differentiate between the products being collected and, therefore, the members of the waste management companies pay for the free riders’ waste handling. Second, the free riding might undermine the collection system, which could lead to hazardous waste not being taken care of, which could cause damage to the natural environment. 2. The information to the end-consumers is not satisfactory Distributors and municipalities have been given the role of collection sites. As part of this task, they are obligated to provide the end-consumers of EE-products with information on where they can return products at end-of-life. However, from monitoring the ‘collection sites’, it is evident that this information is not provided (SFT Oct. 9th 2002, Nov 19th 2003, March 18th 2004). If the end-consumers do not get this information, the authorities fear that hazardous materials may go astray. 3. The operations are not performed according to the EE-Regulations The authorities controlled a group of EE-companies and found that they did not operate according to the EE-Regulations (SFT Feb. 6th 2001, Oct 8th 2001). The controlled companies did not have systems that could cope with this responsibility. The retailers were also cheating on the Regulations to some degree in relation to the activities of collecting and handling returned EE-waste (SFT March 18th 04). Retailers did not provide end-consumers customers with sufficient information about the collection systems, have proper storage areas for the collected material and some retailers did not receive products from end-consumers as was anticipated by the regulations. 4. The authorities have found it difficult to control the fulfilment of the EE-Regulations As a result of working with the EE-Regulations and the industry agreements (i.e. the waste management companies and the collection systems), the authorities have identified difficulties in securing high quality control (SFT Jan. 14th 2003). The authorities have mainly focused on controlling the EE-companies. However, when EE-companies have become members of the waste management companies, it is also necessary for the authorities to control the collection systems to ensure that the obligations are fulfilled. To control a large number of companies is resource-demanding and rather

104
controlling the collection systems than each EE-company increases the efficiency of control. Based on these challenges, which arose from the 1998 EE-Regulations, revisions were suggested. The issues were linked to the fact that the obligations from the EE-Regulations were rather difficult to understand. As a consequence, different practices and understandings exist and, therefore, these make the systems difficult to control and follow up. In addition, the WEEE-directive17 from the EU needed to be incorporated into Norwegian law. The new EE-Regulations were implemented August 13th 2005. The revisions are expected to enable the following consequences (SFT 2004): • Simplification of the regulation of importers and manufacturers. EE-
companies are obligated to join a certified collection system, either an industry system or an individual system. As long as the systems are certified, the authorities are better placed to control free riders (the EE-companies need to provide a certification document).
• The authorities need to implement specific demands (specific criteria) on the collection systems (i.e. the waste management companies) rather than towards the importers and manufacturers. The authorities expect that certification of the collection system will encourage compliance with the demands (specific criteria).
• The demands on distributors and municipalities are to continue as they are but they need to be made clearer and easier to understand. The mandate to control these actors is placed on the local authorities18.
• Incorporation of the WEEE directive. The directive covers fewer products than the Norwegian regulation and, therefore, Norway has been allowed to keep the broad scope of products in the EE-Regulations.
o The directive demands a realistic possibility for the producers and importers of EE-waste to choose between an individual or collective system. Continuance of the industry agreements secures collection systems for all kinds of EE-waste. The industry is expected to provide a realistic possibility to set up competing and individual systems. The demand of an 80% collection rate is continued.
o The directive demands a register of all importers and manufacturers, which includes imported volume, collected volume, recycled volume and exported volume. Registration
17 Waste from Electrical and Electronic Equipment – directive 2002/96. 18 In Norwegian: Fylkesmannen.
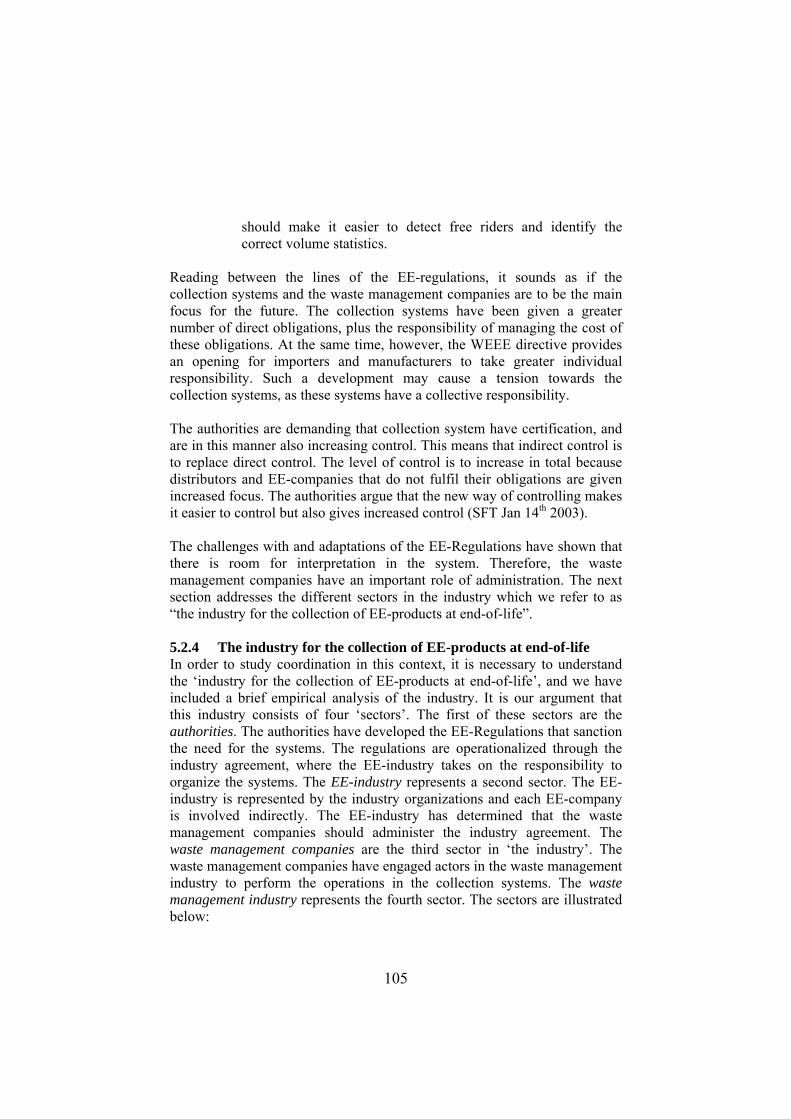
105
should make it easier to detect free riders and identify the correct volume statistics.
Reading between the lines of the EE-regulations, it sounds as if the collection systems and the waste management companies are to be the main focus for the future. The collection systems have been given a greater number of direct obligations, plus the responsibility of managing the cost of these obligations. At the same time, however, the WEEE directive provides an opening for importers and manufacturers to take greater individual responsibility. Such a development may cause a tension towards the collection systems, as these systems have a collective responsibility. The authorities are demanding that collection system have certification, and are in this manner also increasing control. This means that indirect control is to replace direct control. The level of control is to increase in total because distributors and EE-companies that do not fulfil their obligations are given increased focus. The authorities argue that the new way of controlling makes it easier to control but also gives increased control (SFT Jan 14th 2003). The challenges with and adaptations of the EE-Regulations have shown that there is room for interpretation in the system. Therefore, the waste management companies have an important role of administration. The next section addresses the different sectors in the industry which we refer to as “the industry for the collection of EE-products at end-of-life”. 5.2.4 The industry for the collection of EE-products at end-of-life In order to study coordination in this context, it is necessary to understand the ‘industry for the collection of EE-products at end-of-life’, and we have included a brief empirical analysis of the industry. It is our argument that this industry consists of four ‘sectors’. The first of these sectors are the authorities. The authorities have developed the EE-Regulations that sanction the need for the systems. The regulations are operationalized through the industry agreement, where the EE-industry takes on the responsibility to organize the systems. The EE-industry represents a second sector. The EE-industry is represented by the industry organizations and each EE-company is involved indirectly. The EE-industry has determined that the waste management companies should administer the industry agreement. The waste management companies are the third sector in ‘the industry’. The waste management companies have engaged actors in the waste management industry to perform the operations in the collection systems. The waste management industry represents the fourth sector. The sectors are illustrated below:
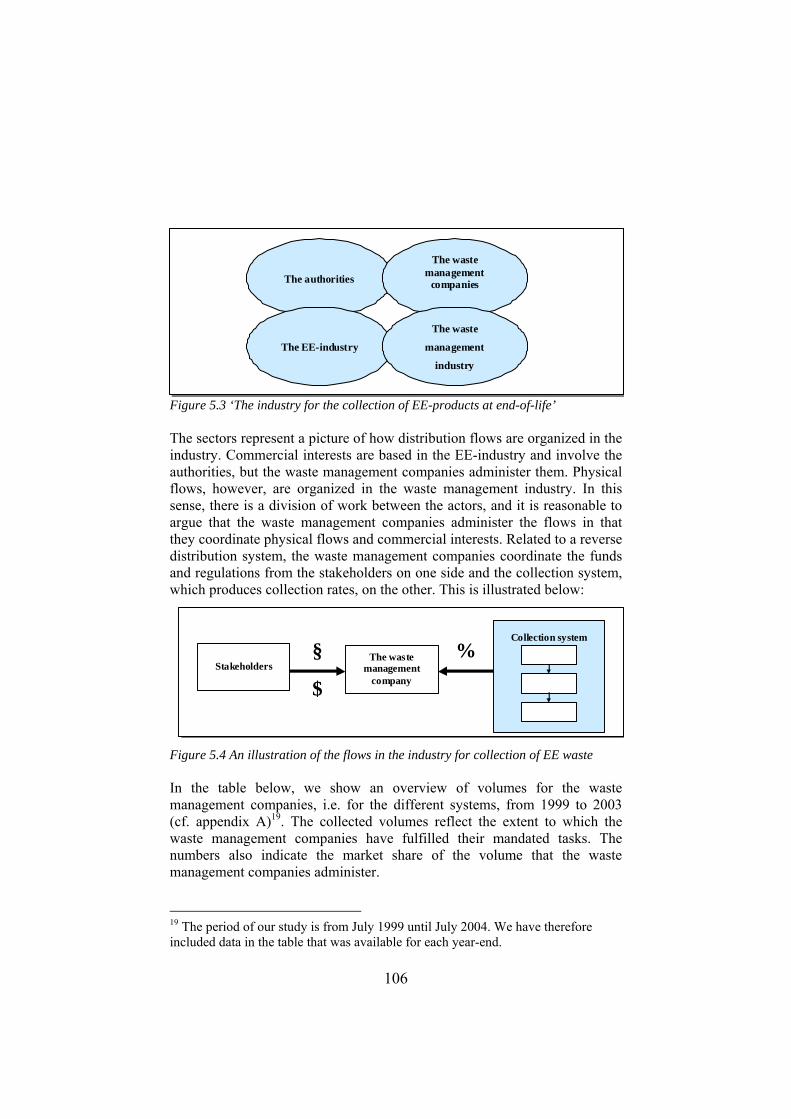
106
The authorities
The waste management
companies
The EE-industry
The waste
management
industry
Figure 5.3 ‘The industry for the collection of EE-products at end-of-life’ The sectors represent a picture of how distribution flows are organized in the industry. Commercial interests are based in the EE-industry and involve the authorities, but the waste management companies administer them. Physical flows, however, are organized in the waste management industry. In this sense, there is a division of work between the actors, and it is reasonable to argue that the waste management companies administer the flows in that they coordinate physical flows and commercial interests. Related to a reverse distribution system, the waste management companies coordinate the funds and regulations from the stakeholders on one side and the collection system, which produces collection rates, on the other. This is illustrated below:
Collection system
The waste management
company Stakeholders
§
$
%
Figure 5.4 An illustration of the flows in the industry for collection of EE waste In the table below, we show an overview of volumes for the waste management companies, i.e. for the different systems, from 1999 to 2003 (cf. appendix A)19. The collected volumes reflect the extent to which the waste management companies have fulfilled their mandated tasks. The numbers also indicate the market share of the volume that the waste management companies administer.
19 The period of our study is from July 1999 until July 2004. We have therefore included data in the table that was available for each year-end.
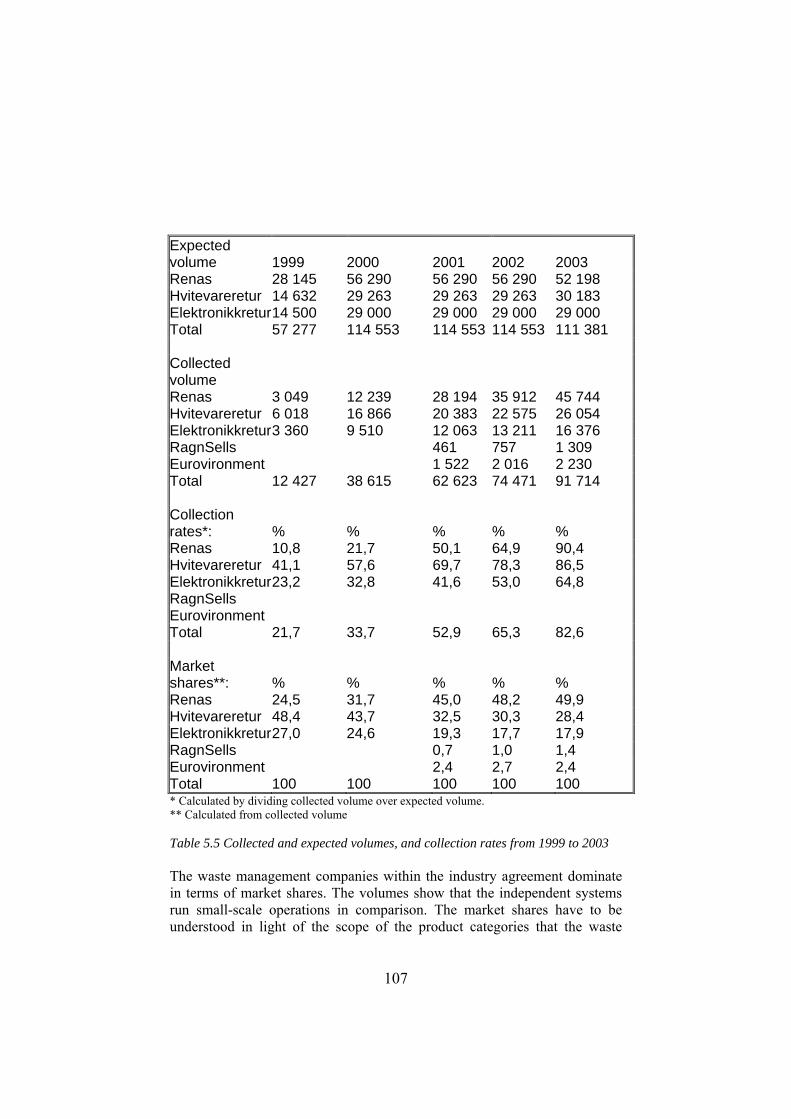
107
Expected volume 1999 2000 2001 2002 2003 Renas 28 145 56 290 56 290 56 290 52 198 Hvitevareretur 14 632 29 263 29 263 29 263 30 183 Elektronikkretur 14 500 29 000 29 000 29 000 29 000 Total 57 277 114 553 114 553 114 553 111 381 Collected volume Renas 3 049 12 239 28 194 35 912 45 744 Hvitevareretur 6 018 16 866 20 383 22 575 26 054 Elektronikkretur 3 360 9 510 12 063 13 211 16 376 RagnSells 461 757 1 309 Eurovironment 1 522 2 016 2 230 Total 12 427 38 615 62 623 74 471 91 714 Collection rates*: % % % % % Renas 10,8 21,7 50,1 64,9 90,4 Hvitevareretur 41,1 57,6 69,7 78,3 86,5 Elektronikkretur 23,2 32,8 41,6 53,0 64,8 RagnSells Eurovironment Total 21,7 33,7 52,9 65,3 82,6 Market shares**: % % % % % Renas 24,5 31,7 45,0 48,2 49,9 Hvitevareretur 48,4 43,7 32,5 30,3 28,4 Elektronikkretur 27,0 24,6 19,3 17,7 17,9 RagnSells 0,7 1,0 1,4 Eurovironment 2,4 2,7 2,4 Total 100 100 100 100 100 * Calculated by dividing collected volume over expected volume. ** Calculated from collected volume Table 5.5 Collected and expected volumes, and collection rates from 1999 to 2003 The waste management companies within the industry agreement dominate in terms of market shares. The volumes show that the independent systems run small-scale operations in comparison. The market shares have to be understood in light of the scope of the product categories that the waste
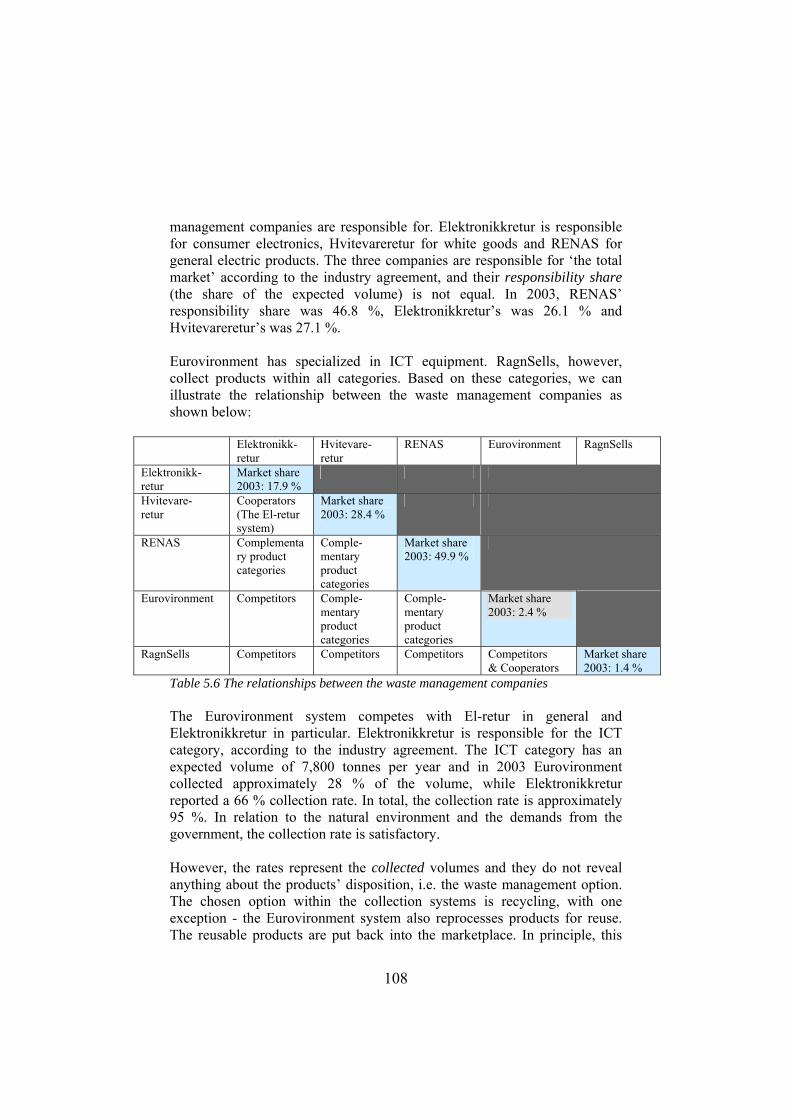
108
management companies are responsible for. Elektronikkretur is responsible for consumer electronics, Hvitevareretur for white goods and RENAS for general electric products. The three companies are responsible for ‘the total market’ according to the industry agreement, and their responsibility share (the share of the expected volume) is not equal. In 2003, RENAS’ responsibility share was 46.8 %, Elektronikkretur’s was 26.1 % and Hvitevareretur’s was 27.1 %. Eurovironment has specialized in ICT equipment. RagnSells, however, collect products within all categories. Based on these categories, we can illustrate the relationship between the waste management companies as shown below:
Elektronikk- retur
Hvitevare- retur
RENAS Eurovironment RagnSells
Elektronikk- retur
Market share 2003: 17.9 %
Hvitevare- retur
Cooperators (The El-retur system)
Market share 2003: 28.4 %
RENAS Complementary product categories
Comple-mentary product categories
Market share 2003: 49.9 %
Eurovironment Competitors Comple- mentary product categories
Comple-mentary product categories
Market share 2003: 2.4 %
RagnSells Competitors Competitors Competitors Competitors & Cooperators
Market share 2003: 1.4 %
Table 5.6 The relationships between the waste management companies The Eurovironment system competes with El-retur in general and Elektronikkretur in particular. Elektronikkretur is responsible for the ICT category, according to the industry agreement. The ICT category has an expected volume of 7,800 tonnes per year and in 2003 Eurovironment collected approximately 28 % of the volume, while Elektronikkretur reported a 66 % collection rate. In total, the collection rate is approximately 95 %. In relation to the natural environment and the demands from the government, the collection rate is satisfactory. However, the rates represent the collected volumes and they do not reveal anything about the products’ disposition, i.e. the waste management option. The chosen option within the collection systems is recycling, with one exception - the Eurovironment system also reprocesses products for reuse. The reusable products are put back into the marketplace. In principle, this
109
means that the products return to the end-of-life stage for a second time. Thus, the waste management option may be relevant for performance evaluation of the system. 5.2.5 A summary note on the industry Two documents direct operations in ‘the industry for the collection of EE-products at end-of-life’: the EE-Regulations and the industry agreement between the ME and the EE-industry. The authorities have left the responsibility of finding the best solution with which to handle EE-waste at end-of-life to the industry, but within a legal frame of reference. The industry agreement has resulted in the development of three waste management companies and two collection systems. In addition, a few independent waste management companies and collection systems have been established, although these are small scale compared to the industry agreement systems. The authorities believe that the solutions for the collection of EE-waste have been successful but have still identified a number of challenges within the area (SFT 2004). As a result of these challenges, the EE-Regulations have been subjected to revisions and changes have been suggested. In short, a new industry has been created and a set of reverse distribution systems has been established. The flows of distribution are split between different sectors within the industry but are administered by the waste management companies. As a result, the coordination responsibility of the systems is placed with the waste management companies. The reverse distribution systems require a high degree of coordination. A number of actors are involved in the same task of collecting EE-waste but they have varied spheres of interests. However, if the waste management companies are able to achieve coordinated action between the actors, a sufficiently high collection rate is expected (i.e. 80 %).
5.3 The RENAS case In this part we present the RENAS case in further detail. This includes a transition period from when the system started operations July 1st 1999, and for two three-year timeframe periods. These periods were from July 1st 1999 to July 1st 2002, and from July 1st 2002 to July 1st 2005. The case is presented in accordance with the two three year periods. The RENAS system consists of one waste management company and one collection system. EE-waste within the category of general electric is collected in the RENAS system and this represents the largest share of the
110
EE-products collected at end-of-life (cf. part 5.2). Products that are returned in the RENAS system are reprocessed for materials recycling (waste management option). The case starts with a presentation of the waste management company and then we present the collection system according to the two contract periods. The presentation is divided between the physical flow and the commercial interests in the system. The case is closed with an evaluation of the performance of the system. 5.3.1 The waste management company RENAS AS was established August 7th 1997. RENAS is a non-profit company owned by two industry organizations (cf. part 5.2). RENAS does not get directly involved in the operations of the collection system but cooperates with professional partners in order for the waste handling to be effective and environmental friendly. RENAS’ goal is to achieve the 80 % collection rate of waste from general electric products annually: “We take the obligation to collect 80% very seriously. We expect sanctions from the authorities if we do not meet their demands. The member companies are also very serious about the task, as this system is costing them a great deal of money.” RENAS The producers and importers of general electric EE-products are RENAS’ members. RENAS has calculated the potential number of members to be approximately 7,300 companies. Approximately 1300 of these companies have become members of RENAS (as of June 2002). It is assumed that the member companies of the system represent 75-80% of the total volume of general electric products. The largest companies in the (general electric) industry have joined the system. Approximately 5900 companies represent the remaining 20-25% of the volume. It is assumed that it is difficult to identify possible members both for RENAS and the company itself: “In some cases companies do not identify themselves with our industry, and do not know that they have general electrical in their products. It is in some cases more lack of knowledge than conscious free riding that explain why companies have not joined our systems.” RENAS RENAS has initiated a reference group to facilitate communication with the members. The group consists of a selection of member companies20. Establishment of the reference group gives a forum for discussing the RENAS system. The reference group meets once every three months. RENAS presents information from the collection system and uses the arena
20 Approximately 11 companies are represented in the reference group.
111
to get feedback from the members. In order to establish a dialog with the other members as well, RENAS arranges a member seminar once a year. At the seminar, members receive information about the system and motivation to continue as a member to RENAS. The invitation to the member seminar in March 2003 stated: “Membership in RENAS is a competitive advantage. It shows that your company takes the environment seriously. We invite you to a free member seminar about environmental responsibility and marketing. We have prepared tools that member companies may use in their marketing and sales. We want to present this together with competence and entertainment.” Members are important to RENAS, as the system is funded from the membership fees. The fee is divided between an initial (one-time) fee, which is payable on joining the system, and a fee that is tied to the products. The initial fee is set based on the turnover of the member – the larger the turnover, the greater the fee. The product fee is charged per unit of general electric product that members import to, or produce in, the Norwegian market. There are three fee levels: 0,1%, 1% and 5%. The levels are based on the fact that different products generate different costs in the collection system. Customs21 charges the fee on behalf of RENAS at the time of import, based on customs tariff numbers. The funds are then transferred to RENAS. Additionally, the members report the volume they import/produce to RENAS. The information from customs and the members are compared and if they do not correspond RENAS makes the necessary correction. Products may have been wrongly identified in customs22. The figure below illustrates the process:
21 The Norwegian Customs and Excise – Tollvesenet 22 This has turned out to become a major activity for RENAS, who in 2001 billed the members for NOK 20 mill. extra after having compared information from members with that of the customs.
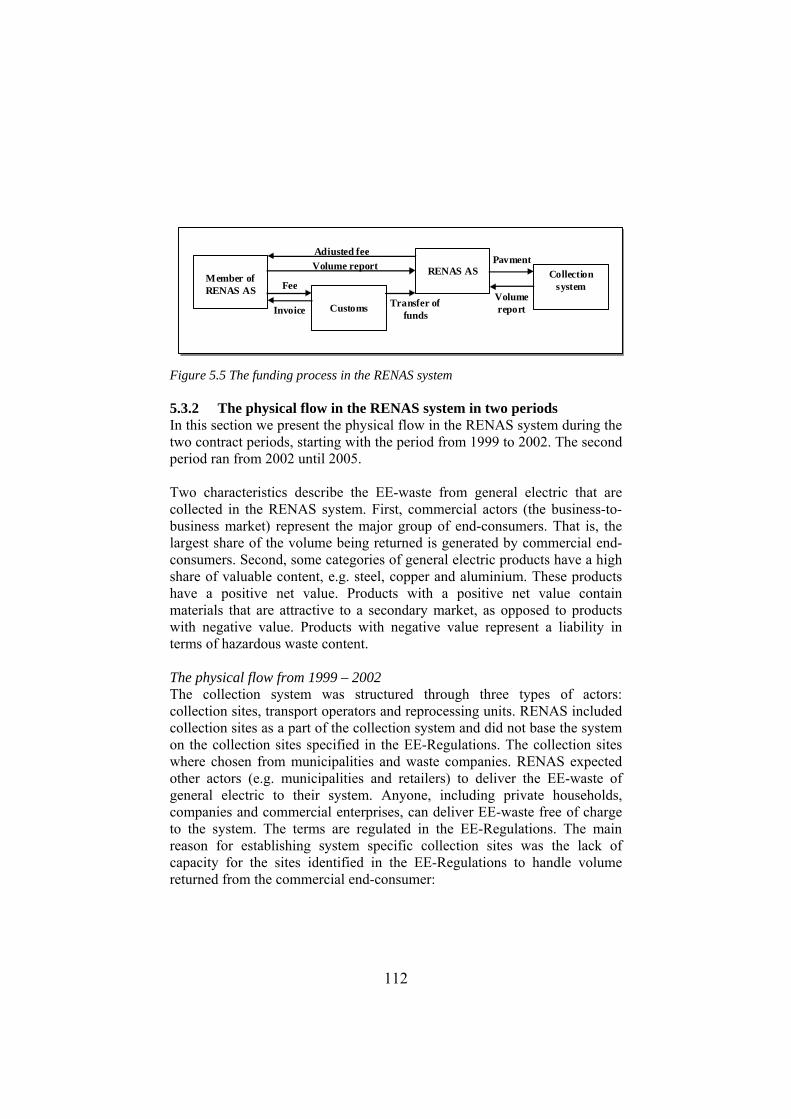
112
Member of RENAS AS
RENAS AS
Customs
Collection system Fee
Invoice
Volume reportAdjusted fee
Transfer of funds
Payment
Volume report
Figure 5.5 The funding process in the RENAS system 5.3.2 The physical flow in the RENAS system in two periods In this section we present the physical flow in the RENAS system during the two contract periods, starting with the period from 1999 to 2002. The second period ran from 2002 until 2005. Two characteristics describe the EE-waste from general electric that are collected in the RENAS system. First, commercial actors (the business-to-business market) represent the major group of end-consumers. That is, the largest share of the volume being returned is generated by commercial end-consumers. Second, some categories of general electric products have a high share of valuable content, e.g. steel, copper and aluminium. These products have a positive net value. Products with a positive net value contain materials that are attractive to a secondary market, as opposed to products with negative value. Products with negative value represent a liability in terms of hazardous waste content. The physical flow from 1999 – 2002 The collection system was structured through three types of actors: collection sites, transport operators and reprocessing units. RENAS included collection sites as a part of the collection system and did not base the system on the collection sites specified in the EE-Regulations. The collection sites where chosen from municipalities and waste companies. RENAS expected other actors (e.g. municipalities and retailers) to deliver the EE-waste of general electric to their system. Anyone, including private households, companies and commercial enterprises, can deliver EE-waste free of charge to the system. The terms are regulated in the EE-Regulations. The main reason for establishing system specific collection sites was the lack of capacity for the sites identified in the EE-Regulations to handle volume returned from the commercial end-consumer:
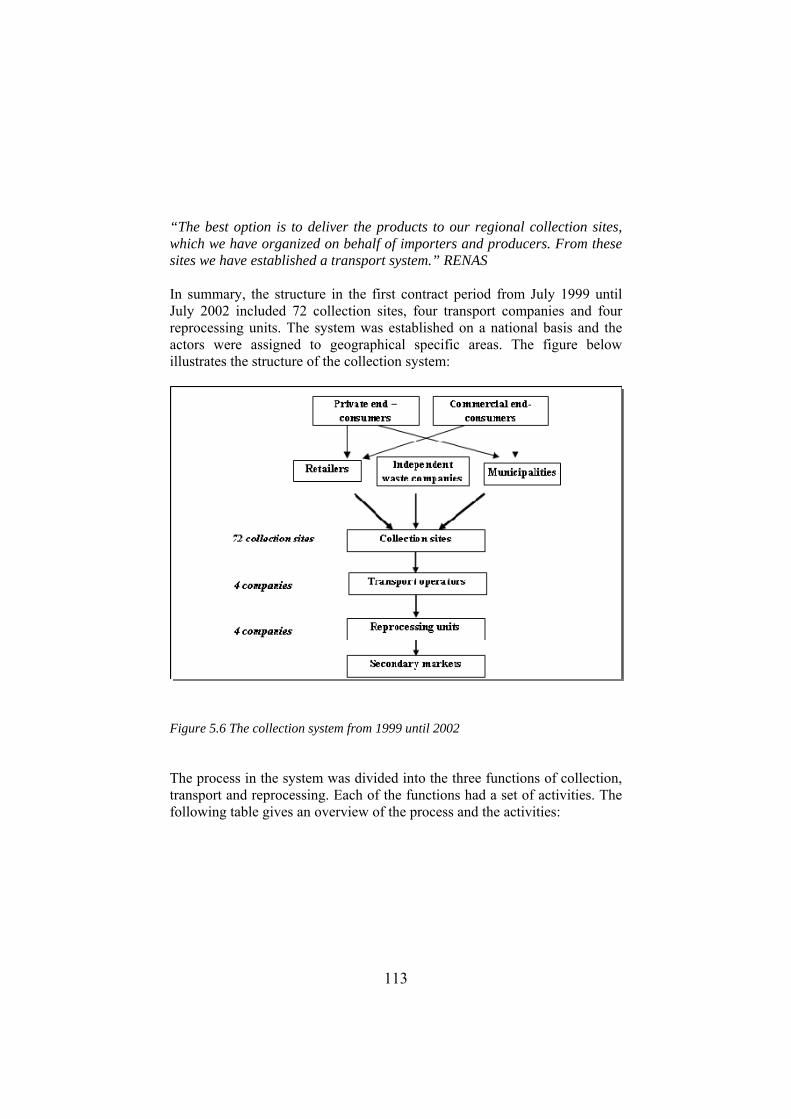
113
“The best option is to deliver the products to our regional collection sites, which we have organized on behalf of importers and producers. From these sites we have established a transport system.” RENAS In summary, the structure in the first contract period from July 1999 until July 2002 included 72 collection sites, four transport companies and four reprocessing units. The system was established on a national basis and the actors were assigned to geographical specific areas. The figure below illustrates the structure of the collection system:
Figure 5.6 The collection system from 1999 until 2002 The process in the system was divided into the three functions of collection, transport and reprocessing. Each of the functions had a set of activities. The following table gives an overview of the process and the activities:

114
Process: Comments regarding activities: Handling at collection sites
• Collection of general electric products at end-of-life (provide cages and containers).
• Secure sorting into seven categories. • Secure proper internal routines. • Initiate transport from the collection site to the reprocessing unit. • Report volumes to RENAS.
Transport operations
• Transport from collection site to the reprocessing unit within a defined geographical area.
• Identify proper schedules (frequencies). Reprocessing • Control that the delivered material are sorted into the seven
product categories. • Register and report the volumes to RENAS. • Dismantling of products, and the extraction of hazardous
material. Sort out groups of homogenized materials. • Register the dismantled materials in 40 categories. • Finding secondary markets for the materials. • Dispose of hazardous materials.
Table 5.7 The process in the RENAS system from 1999 -2002 In the first period, the collection sites were primarily delivery points 23, and were supposed to sort products into the defined categories and initiate transport when the collection capacity was filled. The rationale in the first model was that the products could be returned to the system free of charge and the actors were paid by RENAS for the cost of the activities they performed. The system did not operate according to expectations because of two main factors. First, the products’ characteristic concerning positive and negative value resulted in two waste streams. The end consumers found the system attractive for ‘negative valued products’ because it was free of charge. The positive valued products had a tendency to be sold directly to the secondary market because the end-consumer was able to recapture a rest value for the products. These products were sold outside the RENAS system because their value was not compensated for within the system: “In the first period it was possible to deliver the goods free of charge, which sounds attractive. However, if you have a product that is worth NOK 1000 per tonne the end-consumer felt he was loosing money. As a consequence,
23 End-consumers could negotiate for pick-ups, but this was an ad hoc operation. The end-consumer had to cover the cost of pick up.

115
the actors tried to recapture the value of the products and traded it outside our system.” RENAS A second dimension was how the actors were compensated for their services. The compensation for the services was a gross amount and RENAS calculated on income from the sales of the products. However, the income was to be deducted from the cost after the logistics operations had been performed in the collection system and provide the actors with a fixed margin. Combined with the defined geographical areas, the actors behaved passively in the system (i.e. they did not actively pursue volume). The defined geographical areas were supposed to provide the actors with a certain level of volume. There was, therefore, a lack of supply push in the system. RENAS’ coordination of the collection function did not grasp, in other words, all the characteristics of the physical flow. We have illustrated this in the figure below:
CollectionSites (72)
Coordination in the RENAS system
No coordination within the RENAS system
Physical flow (negative value)
Physical flow (positive value)
Figure 5.7 Coordination of the collection function in the RENAS system 1st period The transporters worked within defined geographical areas, and collected products from defined sites and partners. However, as the physical flows did not follow the expected paths, the transport functions had difficulties gaining access to volume: “We collected products for RENAS, but the system did not work well. RENAS’ products were interesting for the scrap dealers, and it was no use in delivering products to RENAS when you got paid for it elsewhere.” Norsk Gjenvinning Oslo The end-consumer organized the flow of the positive valued products themselves and the collection sites did not seek volume actively. In this sense, the transport operators were left in a situation with low volume and did not have the possibility to influence the situation. This next figure illustrates the coordination of the transport:
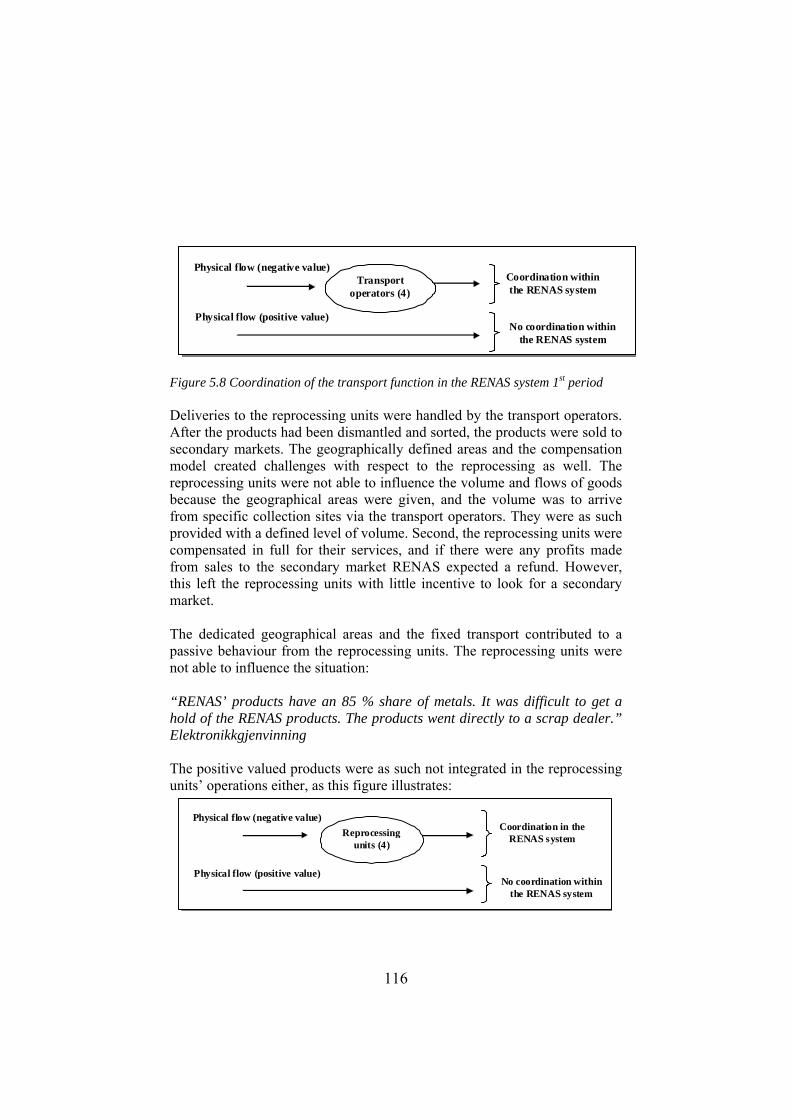
116
Transport operators (4)
Coordination within the RENAS system
Physical flow (negative value)
Physical flow (positive value) No coordination within
the RENAS system
Figure 5.8 Coordination of the transport function in the RENAS system 1st period Deliveries to the reprocessing units were handled by the transport operators. After the products had been dismantled and sorted, the products were sold to secondary markets. The geographically defined areas and the compensation model created challenges with respect to the reprocessing as well. The reprocessing units were not able to influence the volume and flows of goods because the geographical areas were given, and the volume was to arrive from specific collection sites via the transport operators. They were as such provided with a defined level of volume. Second, the reprocessing units were compensated in full for their services, and if there were any profits made from sales to the secondary market RENAS expected a refund. However, this left the reprocessing units with little incentive to look for a secondary market. The dedicated geographical areas and the fixed transport contributed to a passive behaviour from the reprocessing units. The reprocessing units were not able to influence the situation: “RENAS’ products have an 85 % share of metals. It was difficult to get a hold of the RENAS products. The products went directly to a scrap dealer.” Elektronikkgjenvinning The positive valued products were as such not integrated in the reprocessing units’ operations either, as this figure illustrates:
Reprocessing units (4)
Coordination in the RENAS system
Physical flow (negative value)
Physical flow (positive value) No coordination within
the RENAS system
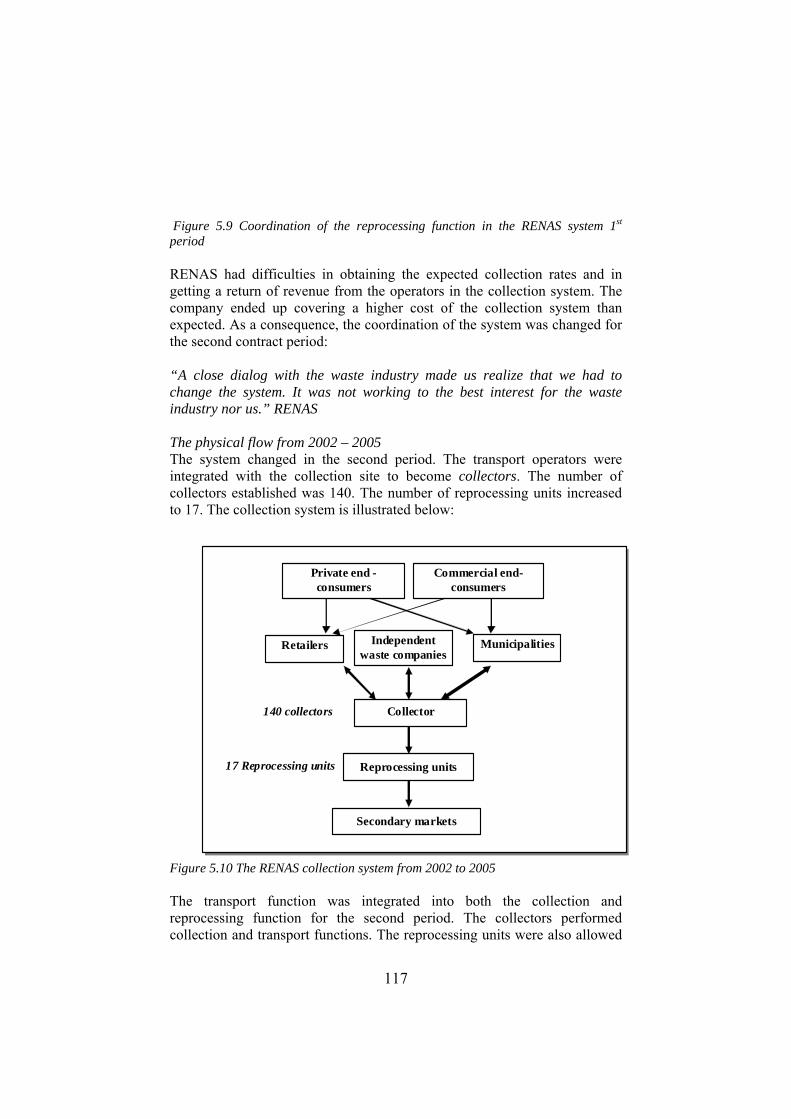
117
Figure 5.9 Coordination of the reprocessing function in the RENAS system 1st period RENAS had difficulties in obtaining the expected collection rates and in getting a return of revenue from the operators in the collection system. The company ended up covering a higher cost of the collection system than expected. As a consequence, the coordination of the system was changed for the second contract period: “A close dialog with the waste industry made us realize that we had to change the system. It was not working to the best interest for the waste industry nor us.” RENAS The physical flow from 2002 – 2005 The system changed in the second period. The transport operators were integrated with the collection site to become collectors. The number of collectors established was 140. The number of reprocessing units increased to 17. The collection system is illustrated below:
140 collectors Collector
17 Reprocessing units
Secondary markets
Reprocessing units
Retailers Municipalities Independent waste companies
Private end -consumers
Commercial end-consumers
Figure 5.10 The RENAS collection system from 2002 to 2005 The transport function was integrated into both the collection and reprocessing function for the second period. The collectors performed collection and transport functions. The reprocessing units were also allowed
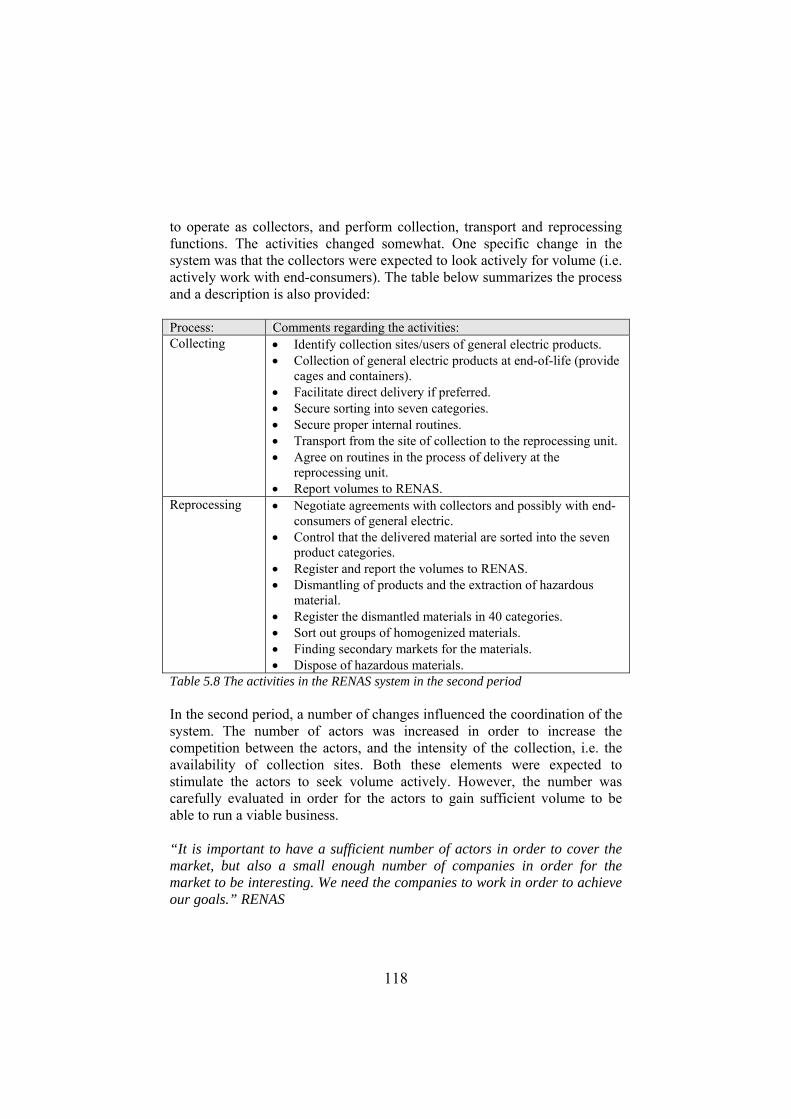
118
to operate as collectors, and perform collection, transport and reprocessing functions. The activities changed somewhat. One specific change in the system was that the collectors were expected to look actively for volume (i.e. actively work with end-consumers). The table below summarizes the process and a description is also provided: Process: Comments regarding the activities: Collecting • Identify collection sites/users of general electric products.
• Collection of general electric products at end-of-life (provide cages and containers).
• Facilitate direct delivery if preferred. • Secure sorting into seven categories. • Secure proper internal routines. • Transport from the site of collection to the reprocessing unit. • Agree on routines in the process of delivery at the
reprocessing unit. • Report volumes to RENAS.
Reprocessing • Negotiate agreements with collectors and possibly with end-consumers of general electric.
• Control that the delivered material are sorted into the seven product categories.
• Register and report the volumes to RENAS. • Dismantling of products and the extraction of hazardous
material. • Register the dismantled materials in 40 categories. • Sort out groups of homogenized materials. • Finding secondary markets for the materials. • Dispose of hazardous materials.
Table 5.8 The activities in the RENAS system in the second period In the second period, a number of changes influenced the coordination of the system. The number of actors was increased in order to increase the competition between the actors, and the intensity of the collection, i.e. the availability of collection sites. Both these elements were expected to stimulate the actors to seek volume actively. However, the number was carefully evaluated in order for the actors to gain sufficient volume to be able to run a viable business. “It is important to have a sufficient number of actors in order to cover the market, but also a small enough number of companies in order for the market to be interesting. We need the companies to work in order to achieve our goals.” RENAS

119
The new compensation model stimulated the actors into taking an active role in the system. The model changed from compensating a gross amount, where both cost and revenue were expected to be reported back before the final compensation was settled. In the second period, the actors were compensated for a net amount, with no adjustments in arrears. An increased effort to find innovative ways to collect and handle the products from the actors’ side would result in increased profits to themselves. In this situation, the actors were given the opportunity to search out for volume themselves, i.e. get in contact with the end-consumers of general electric products. The competition between the actors (as a consequence of not having geographically limited areas) stimulated the actors into finding volume in order to increase their profits: “The system is gradually getting established. We are able to take an active role. At the outset I took an overview of the industry and thought, “who would be relevant partners for us”? The actors have an interest in delivering volume to us, because RENAS pays a fair compensation.” Elektronikk-gjenvinning VEST “Our collection activity consists of eight collection sites. The RENAS products are sent from the seven other collection sites to the main collection site. There is a payoff in sorting the RENAS products. We have taught our employees to sort out the RENAS products.” ROAF Bøler The actors were allowed to, and expected to, trade and negotiate with each other. The changes resulted in a more flexible system. This was important with respect to the products with both types of character (positive and negative value). The products with positive value were being traded in the market. Without flexibility the actors were not able to integrate these waste streams into the system. The ability to negotiate with end-customers gave the collectors the ability to offer a pick-up service and a rest value for the collected material. As the collectors were also able to run the transport service, they were able to move the products directly from the site of the end-consumer to the site of the reprocessing units. That is, they identified the best possible transport solution for each collection task. In this manner, they avoided handling activities and were able to lower the cost, as this statement illustrates: “It is an advantage to be both a collector and a reprocessing unit, because you then do not have the cost of transport between the two processes. Our company is a collector and in this sense we have a disadvantage.” Hermod Teigen, Lierstranda
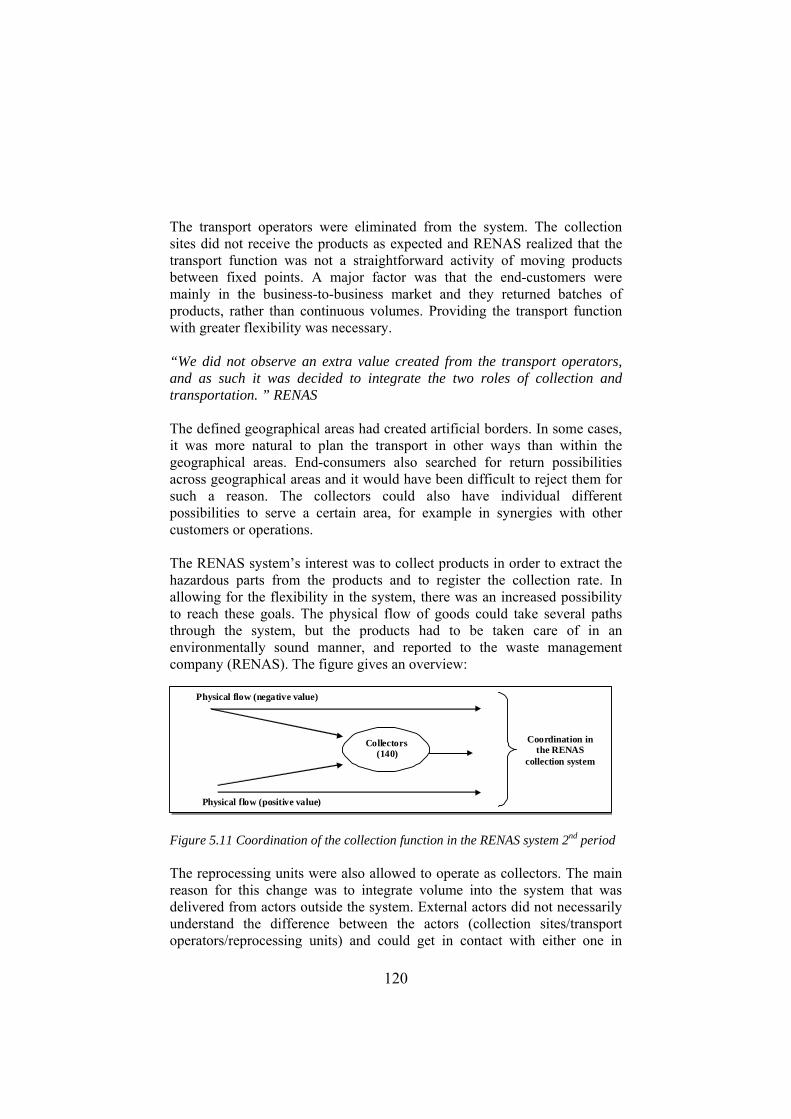
120
The transport operators were eliminated from the system. The collection sites did not receive the products as expected and RENAS realized that the transport function was not a straightforward activity of moving products between fixed points. A major factor was that the end-customers were mainly in the business-to-business market and they returned batches of products, rather than continuous volumes. Providing the transport function with greater flexibility was necessary. “We did not observe an extra value created from the transport operators, and as such it was decided to integrate the two roles of collection and transportation. ” RENAS The defined geographical areas had created artificial borders. In some cases, it was more natural to plan the transport in other ways than within the geographical areas. End-consumers also searched for return possibilities across geographical areas and it would have been difficult to reject them for such a reason. The collectors could also have individual different possibilities to serve a certain area, for example in synergies with other customers or operations. The RENAS system’s interest was to collect products in order to extract the hazardous parts from the products and to register the collection rate. In allowing for the flexibility in the system, there was an increased possibility to reach these goals. The physical flow of goods could take several paths through the system, but the products had to be taken care of in an environmentally sound manner, and reported to the waste management company (RENAS). The figure gives an overview:
Collectors (140)
Physical flow (negative value)
Physical flow (positive value)
Coordination in the RENAS
collection system
Figure 5.11 Coordination of the collection function in the RENAS system 2nd period The reprocessing units were also allowed to operate as collectors. The main reason for this change was to integrate volume into the system that was delivered from actors outside the system. External actors did not necessarily understand the difference between the actors (collection sites/transport operators/reprocessing units) and could get in contact with either one in
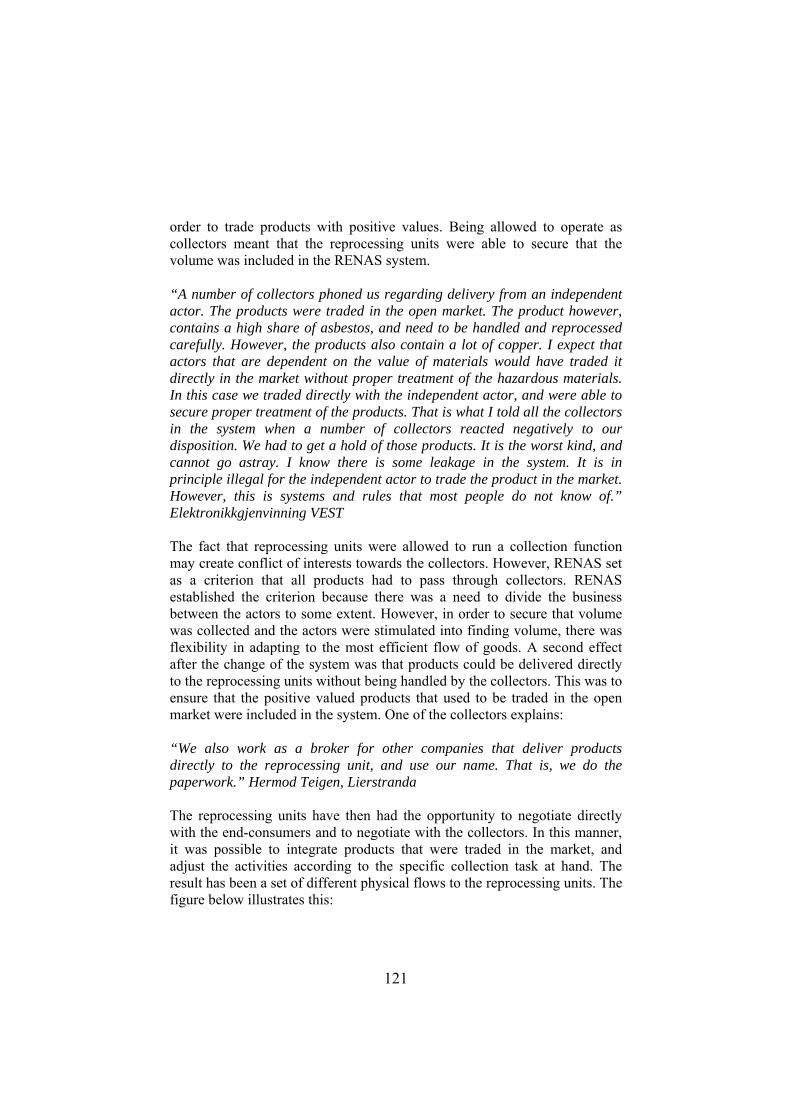
121
order to trade products with positive values. Being allowed to operate as collectors meant that the reprocessing units were able to secure that the volume was included in the RENAS system. “A number of collectors phoned us regarding delivery from an independent actor. The products were traded in the open market. The product however, contains a high share of asbestos, and need to be handled and reprocessed carefully. However, the products also contain a lot of copper. I expect that actors that are dependent on the value of materials would have traded it directly in the market without proper treatment of the hazardous materials. In this case we traded directly with the independent actor, and were able to secure proper treatment of the products. That is what I told all the collectors in the system when a number of collectors reacted negatively to our disposition. We had to get a hold of those products. It is the worst kind, and cannot go astray. I know there is some leakage in the system. It is in principle illegal for the independent actor to trade the product in the market. However, this is systems and rules that most people do not know of.” Elektronikkgjenvinning VEST The fact that reprocessing units were allowed to run a collection function may create conflict of interests towards the collectors. However, RENAS set as a criterion that all products had to pass through collectors. RENAS established the criterion because there was a need to divide the business between the actors to some extent. However, in order to secure that volume was collected and the actors were stimulated into finding volume, there was flexibility in adapting to the most efficient flow of goods. A second effect after the change of the system was that products could be delivered directly to the reprocessing units without being handled by the collectors. This was to ensure that the positive valued products that used to be traded in the open market were included in the system. One of the collectors explains: “We also work as a broker for other companies that deliver products directly to the reprocessing unit, and use our name. That is, we do the paperwork.” Hermod Teigen, Lierstranda The reprocessing units have then had the opportunity to negotiate directly with the end-consumers and to negotiate with the collectors. In this manner, it was possible to integrate products that were traded in the market, and adjust the activities according to the specific collection task at hand. The result has been a set of different physical flows to the reprocessing units. The figure below illustrates this:

122
Collectors (140)
Physical flow (negative value)
Physical flow (positive value)
Coordination in the RENAS
collection system
Figure 5.12 Coordination of the reprocessing function in the RENAS system 2nd period There is of course no guarantee that the products can be integrated into the system if the end-consumer decides to trade the products with other actors than those within the RENAS system. In these cases, the hazardous share of the products cannot be extracted from the products. And, in this case, it would reduce the collection cost for the products. However, the new flexibility of the system has increased the possibility to prevent these situations. The actors are pleased with the changes. The collectors and reprocessing units are able to run their operations according to their requirements. The changes have been able to include the physical flow of positive valued products in the collection function. It is a challenge in the system that the collectors and the reprocessing units both have the collection function as a part of their operations. The consequence is that both actors compete for the same volume but on different terms: “One problem for us is that customers may skip us and deliver products directly to the reprocessing unit. In this sense, the customer gets a higher price for the products, and the reprocessing unit gets a larger margin. The direct delivery may be conducted after we have been in contact with the parties. In this sense we feel left out.” Hermod Teigen, Lierstranda The collectors necessarily have an extra handling operation compared to the reprocessing units, except in the cases of facilitating direct delivery. 5.3.3 The commercial interests in the RENAS system in two periods In this section we present how the commercial interests in the RENAS system have been organized in the two contract periods from 1999 to 2002, and from 2002 to 2005.

123
The commercial interests from 1999 – 2002 The first contract period for RENAS was initiated in cooperation with Elektronikkretur and Hvitevareretur (one tender). The contracts were signed individually with the actors in the systems. RENAS issued contracts to each of the 72 collection sites, four transport operators and four reprocessing units. The actors had standardized contracts. That is, all collection sites had identical contracts, the transport operators had identical contracts and the reprocessing units had identical contracts. The contracts specified that the actors had to report directly to RENAS, who had to facilitate communication between the actors. The following figure illustrates the structure of the contract relationships in the RENAS system:
Transport operators
Secondary markets
Reprocessing units
Collection sites
RENAS AS
Figure 5.13 The coordination of commercial interests in the RENAS system 1999-2002 The main content of the contracts included24:
• The actors were given geographical dedicated areas to work with. • Specifications of who the actors were expected to interact with. • Operating activities and standards (packaging, availability, opening
hours, etc). Operating activities and standards are somewhat different for the different types of actors.
24 RENAS provided a copy of the contracts and tenders.
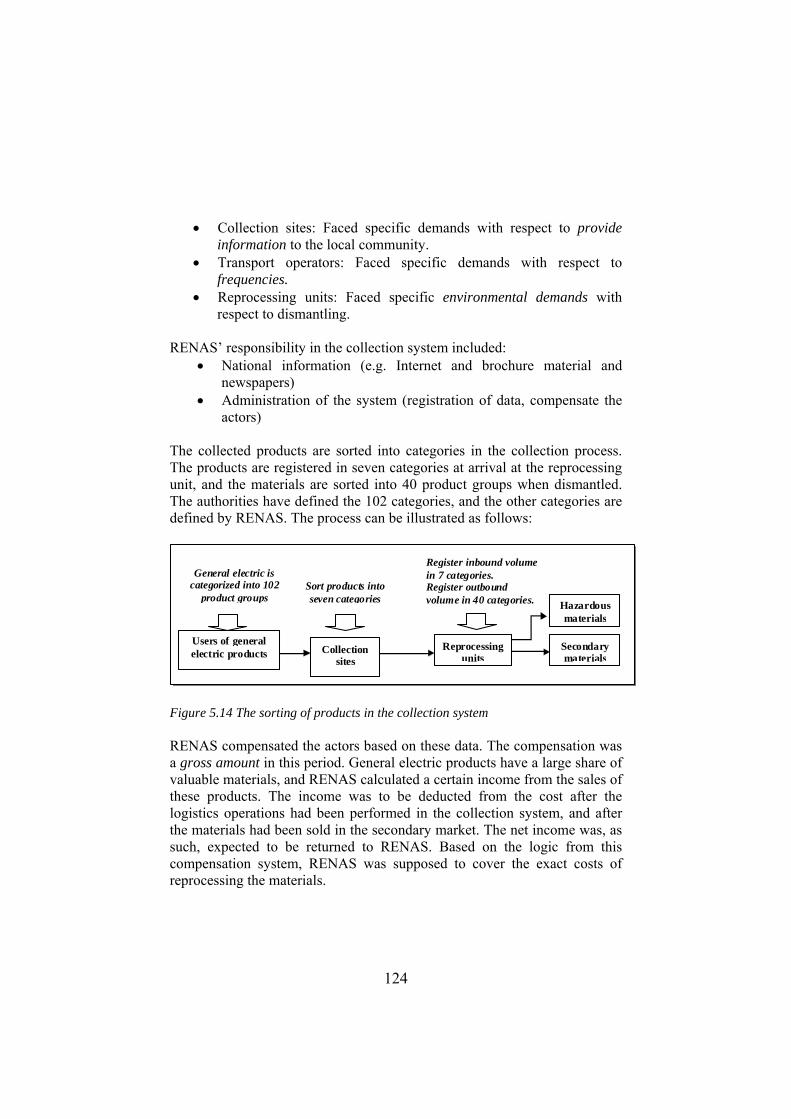
124
• Collection sites: Faced specific demands with respect to provide information to the local community.
• Transport operators: Faced specific demands with respect to frequencies.
• Reprocessing units: Faced specific environmental demands with respect to dismantling.
RENAS’ responsibility in the collection system included:
• National information (e.g. Internet and brochure material and newspapers)
• Administration of the system (registration of data, compensate the actors)
The collected products are sorted into categories in the collection process. The products are registered in seven categories at arrival at the reprocessing unit, and the materials are sorted into 40 product groups when dismantled. The authorities have defined the 102 categories, and the other categories are defined by RENAS. The process can be illustrated as follows:
Users of general electric products
Secondary materials
Collection sites
Sort products into seven categories
Register inbound volume in 7 categories. Register outbound volume in 40 categories. Hazardous
materials
Reprocessing units
General electric is categorized into 102
product groups
Figure 5.14 The sorting of products in the collection system RENAS compensated the actors based on these data. The compensation was a gross amount in this period. General electric products have a large share of valuable materials, and RENAS calculated a certain income from the sales of these products. The income was to be deducted from the cost after the logistics operations had been performed in the collection system, and after the materials had been sold in the secondary market. The net income was, as such, expected to be returned to RENAS. Based on the logic from this compensation system, RENAS was supposed to cover the exact costs of reprocessing the materials.
125
The commercial interests from 2002 – 2005 The governing of the collection system changed in the second period. RENAS changed types of actors and, consequently, the content of the contracts. RENAS and El-retur did not coordinate a common tender in this second period. RENAS entered into contracts with 140 collectors and 17 reprocessing units. The collectors were given identical contracts but the reprocessing units had individually negotiated contracts. The contracts included the activities the actors were expected to perform, and the actors had to be ISO certified. Beyond these aspects the actors were left with a higher degree of decision making for the second period. One main feature was that the actors were allowed, and expected to negotiate directly with each other. That is, identify for themselves with whom to cooperate both within the system (the actors that have contracts with RENAS) and with other relevant actors (actors that do not have contracts with RENAS). The actors were free to decide between themselves how to best organize their activities, as long as they kept the quality standards that RENAS had set. “I am very satisfied with how the system has changed. Now we are able to govern all that happens around us. In the first model we were very dependent on everything else. Now we are in the centre of things.” Elektronikkgjenvinning VEST In the second period, the actors have contracts with both RENAS and their operating partners. The contract relations in the system can be illustrated as shown below:

126
Collectors
Secondary markets
Reprocessing units
RENAS AS
Independent collectors
Sources of general electric products
Figure 5.15 The coordination of the commercial interests in the RENAS system 2nd period RENAS made two changes to support the new activity structure. The actors were not limited to geographical areas and a new compensation model was established. The compensation model changed from a gross to a net amount. RENAS paid the actors a fixed price for their services, without expecting returns. In this model the actors were able to keep the margins gained from increased efficiency. In the first model, RENAS set a fixed margin and any surplus from increased efficiency had to be returned. The actors were in the 2nd period directly tied to their own performance. The more their efficient operations, the more money they make: “We are very satisfied with the RENAS system. It works very well. We are compensated for the work we do.” Follo Truck Utleie “RENAS has a very nice model. In the RENAS model we receive a certain amount of money and are able to buy materials from the market.” Elektronikkgjenvinning Collected or delivered products still needed to be sorted in accordance with the seven defined categories. If end-consumers wanted to have products collected or to deliver unsorted materials, it was up to the specific collector
127
whether the end-consumers paid for the services. The collector had to provide the proper facilities (packaging) for collection of the general electric products, and ensure that the correct products were delivered to their sites: “In the RENAS system, the collectors have to deliver the products to one of the 17 reprocessing units. The products are supposed to be sorted into the 7 categories, which they are paid according to. It is then up to us to control the products and secure the quality. If the quality is not to standards, we have to do the sorting over again. In this sense all the parties watch over each other, and provide stability to the system. It works quite nice in this sense.” Elektronikkgjenvinning VEST The actors are no longer limited to geographical areas. This increased the competition between the actors. The actors were expected to spend time actively looking for volume, both within and outside the system. The collectors were expected to find end-consumers, rather than waiting for the end-consumers to find them. With an increased possibility to gain higher earnings, the incentive increased the search for waste: “We engaged a consultant that travelled around for one semester to all the EE-companies in our area and promoted the return possibility at our collection site. All the customers were given a folder of printed material.” ROAF Bøler “With respect to the commercial dimensions, i.e. being creative towards the waste owners, the collectors are free to do whatever they like. We want there to be competition between the collectors. It will stimulate them into finding volume actively, and give an edge to the operation. We strive for competition in our system.” RENAS They were also expected to identify which reprocessing unit(s) to work with and negotiate agreements with them: “It is possible for us to choose the cooperating reprocessing unit. We issued a tender and decided on the reprocessing unit.” ROAF Bøler The same applies to the reprocessing units. The increased competition between the reprocessing units increased the incentive to promote offers to collectors, and as such look actively for partners: “In the RENAS model we are expected to address the market. It is an interesting model with a higher degree of a free marketplace. In the RENAS

128
model we have to actively seek the volume, or someone else will.” Stena Miljø “We are a collector and a reprocessing unit in the RENAS model. We focus on reprocessing, but try to get a relationship to collectors. I work a great deal with getting these types of relationships. We think about hiring a sales representative to get in contact with collectors and generate volume for us.” Stena Miljø The earnings were in other words, dependent on their direct effort. This goes for the dismantling function as well – the better the solutions for the handling and dismantling of products, the higher earnings. RENAS also started the second period with the decision to hold annual seminars for the actors in the collection system. The collectors are invited to a yearly ‘collectors seminar’, and the reprocessing units are invited to a yearly ‘reprocessing seminar’. The seminars include training on how to identify general electric products (in order not to collect wrong categories of EE-products), and information about the performance of the system. The seminars facilitate communication in the system, and RENAS wants the actors to share experiences and give feedback about the system: “Deviance from the contract may be based on misunderstandings. An important task for RENAS is to organize seminars for the actors of the system. It is a new industry, and focus is to develop knowledge on how to handle the returned products.” RENAS 5.3.4 Performance in the RENAS system In this section we comment on the level of integrated activities and degree of aligned behaviour within the RENAS system, and the system performance variables. The system goal in the RENAS system is to collect 80 % of general electric products at end-of-life. The table on the next page gives an overview of the collected volume from 2001 to June 2004.
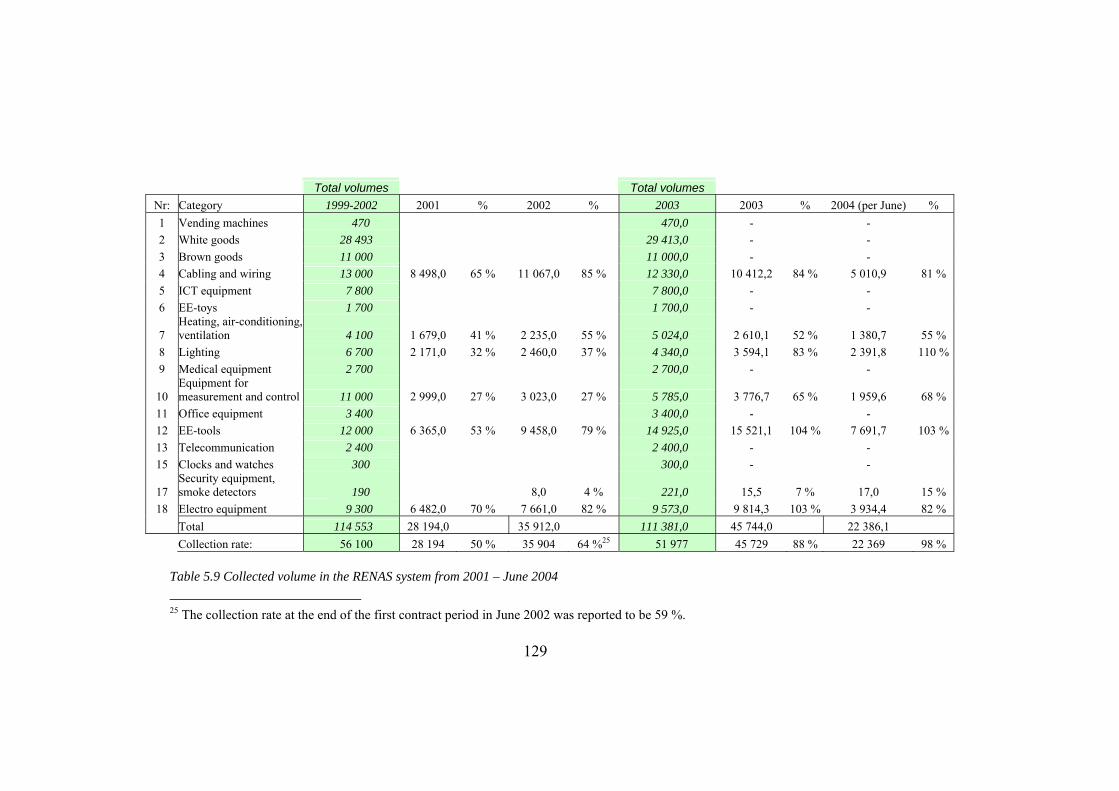
129
Total volumes Total volumes Nr: Category 1999-2002 2001 % 2002 % 2003 2003 % 2004 (per June) % 1 Vending machines 470 470,0 - - 2 White goods 28 493 29 413,0 - - 3 Brown goods 11 000 11 000,0 - - 4 Cabling and wiring 13 000 8 498,0 65 % 11 067,0 85 % 12 330,0 10 412,2 84 % 5 010,9 81 % 5 ICT equipment 7 800 7 800,0 - - 6 EE-toys 1 700 1 700,0 - -
7 Heating, air-conditioning, ventilation 4 100 1 679,0 41 % 2 235,0 55 % 5 024,0 2 610,1 52 % 1 380,7 55 %
8 Lighting 6 700 2 171,0 32 % 2 460,0 37 % 4 340,0 3 594,1 83 % 2 391,8 110 %9 Medical equipment 2 700 2 700,0 - -
10 Equipment for measurement and control 11 000 2 999,0 27 % 3 023,0 27 % 5 785,0 3 776,7 65 % 1 959,6 68 %
11 Office equipment 3 400 3 400,0 - - 12 EE-tools 12 000 6 365,0 53 % 9 458,0 79 % 14 925,0 15 521,1 104 % 7 691,7 103 %13 Telecommunication 2 400 2 400,0 - - 15 Clocks and watches 300 300,0 - -
17 Security equipment, smoke detectors 190 8,0 4 % 221,0 15,5 7 % 17,0 15 %
18 Electro equipment 9 300 6 482,0 70 % 7 661,0 82 % 9 573,0 9 814,3 103 % 3 934,4 82 % Total 114 553 28 194,0 35 912,0 111 381,0 45 744,0 22 386,1 Collection rate: 56 100 28 194 50 % 35 904 64 %25 51 977 45 729 88 % 22 369 98 %
Table 5.9 Collected volume in the RENAS system from 2001 – June 2004
25 The collection rate at the end of the first contract period in June 2002 was reported to be 59 %.
130
The RENAS system had an average collection rate of approximately 59 % at end of the first period. In this sense, the collection rate was much lower than the system goal, and the costs were reported to be too high. In the second period, however, the collection rates were satisfactory (more than 90%) and the costs were reduced. In fact, the collected volume increased by approximately 50% from the first to the second period, and the costs were reduced by approximately 50%. The RENAS system fulfilled the government’s demands in 2004 when the collection rate passed 80 %. Thus, the system goal was fulfilled in the second period. The collected volume was 45 958 tonnes, and the cost of operation was NOK 111 mill (2003). The average cost was then NOK 2 415 per tonne. It is argued that the change in coordination mechanisms in the second period has had a large impact on the improvement in performance between the two periods. As one reprocessing units states: “In the first model you were either inside of the system or outside. Many of the actors in the waste industry took offence at the others that gained these golden contracts, while they were not able to participate. In the new system we have been able to level out this difference in the sense that all can get a piece of the pie.” Elektronikkgjenvinning VEST Performance in the physical flow The challenge in the RENAS system in the first period was first and foremost that the physical flow was divided between the positive and negative valued products. The collection sites were organized to receive products at specific locations, accumulate the volume and call for transport operators to pick it up when the capacity was filled. The transport operators then had to deliver the products to the reprocessing units within defined geographical areas. The end-consumers did not deliver the products to collection sites. Rather, it was expected for the products to be picked up at the end-consumers’ premises. The products had in many cases a positive value and, therefore, the end-consumer was able to negotiate free pick up and a rest value for the products. The transport need was not between fixed points; rather the transport need was from the end-consumer sites and therefore changed from collection task to collection task. The activities were not well integrated

131
between the end-consumer and the collection sites, and it was difficult to fulfil the service levels in the collection system. As a consequence, the operations costs of the collection sites and transport operators were higher compared to expectations, as the volume prognosis was not fulfilled. The collection sites could offer the end-consumers pick up from their premises, but this cost had to be charged. RENAS did not cover such costs. The result was that the positive valued products were traded outside the RENAS system. The reprocessing unit, as a consequence, did not receive the expected volume for dismantling. In the second period, however, the collection sites and transport operators were integrated into one function – the collector. As a result, there was a closer coordination between the collection activities and transport activities. The waste management company states: “We did not observe an extra value created from the transport operators, and as such it was decided to integrate the two roles of collection and transportation. ” RENAS The collectors were also allowed to offer a rest value to the end-consumers. The operators in the collection system had in this manner a possibility to integrate both negative and positive valued products in the system. Thus, activities were integrated to a high level in the second period, and the operations costs were reduced. The ability to adapt the activities to the end-consumers also increased the customer service level in the system for the second period. Performance in the commercial interests The performance in the commercial interests created a higher level of transaction costs than was expected in the first period. The fact was that products with positive value at end-of-life were traded with other actors and in other systems, and not the RENAS system. The contracts were not properly adapted to align behaviour in the system, and reflected opportunity costs in the system. That is, costs of volumes not collected, income not earned, capacity not used and hazardous materials gone astray. The end-consumers were primarily seeking their self-interests when trading positive valued products, and the interests were not in accordance with the common interests of the RENAS system. A second challenge was the fact that RENAS operated a gross compensation model in the first period. The operators’ efforts were not rewarded as the earnings were supposed to be reported and transferred to RENAS. The non-profit profile led RENAS to set
132
a fixed margin, and expected upsides to be returned to them26. The actors did not actively seek volume because ‘there was nothing in it for them’. The earnings for the actors were fixed at the outset and the motivation of the actors was lacking in the system. The collection sites did not have an incentive to look for volume. The reprocessing units were not eager to seek profitable secondary markets for the recyclable materials. The model promoted diverging behaviour of the actors, which was a source of transaction costs. The lack of effort represented costs to the systems. RENAS had the possibility to compare efforts between actors during the first period. However, as the actors were assigned to different geographical areas, it was not straightforward to compare the operations between the actors. That is, each actor operated under different contingencies (in different areas). In the second period, however, RENAS was able to align the behaviour of the actors in the system. The contracts were restructured, which gave room for competition between the actors and included a net compensation model. RENAS was able to reduce transaction costs through the comparison of the actors. RENAS obtained a realistic comparison between the actors as the actors operated under similar contingencies (in the same areas). The performance criteria included collection rate and reported volume of hazardous material (i.e. separated from the products in the dismantling process). The hazardous material represents a challenge. Withdrawing hazardous materials was a cost driver and the rationale was the inverse of an ordinary production. The more effort they put into dismantling, the more it cost, but their performance towards RENAS increased. However, if this risk had been left to the actors, there would have been an incentive to cheat. They could not know how the other actors (i.e. their competitors) would act. The reprocessing units received unique contracts with RENAS in the second period. RENAS was able to compare the performance of the actors against each other, and gained in this manner a certain level of control. In addition, RENAS covered the costs for the disposal of the hazardous materials. Again, if this cost had been left to the actors individually, there would have been an incentive to cheat. However, as long as the cost was covered centrally there was a reduced incentive to cheat.
26 The waste management companies are cost centers for the members, and as such the companies aims to balance earnings and costs.

133
“There are a number of actors in the waste industry that do not comprehend what we do. However, they do not know the system. Most of the actors that I talk to think that it cannot be profitable. Most of the scrap dealers live of the value of the materials. We do not. We do not need to relate to the value. We do what is environmentally correct, because RENAS cover the cost. That is impossible to understand for those who see the value of the materials.” Elektronikkgjenvinning VEST In the second period, there was a conflict of interest between the collectors and reprocessing units with respect to the collection function. This generated some transaction costs to the system, in the sense that the collectors may have lost some opportunities to the reprocessing units. However, it was not to the disadvantage of the system as a whole and RENAS, whose goal was to get products collected and hazardous waste extracted. The statement illustrates: “We take the obligation to collect 80% very seriously. We expect sanctions from the government if we do not meet their demands. The member companies are also very serious about the task, as this system is costing them a great deal of money.” RENAS The actors have also been able to fulfil self-interests in the second period, without this being in conflict with the common interests. The actors were in the second period given control over their earnings, and were able to influence their profits in two ways. First, they were able to increase the collected volume and get a higher income, and second they were able to improve their operating efficiency and get higher profits. However, there was one source of added transaction costs, which resulted from the conflict between collectors and reprocessing units.
5.4 Discussion and Implications A strong characteristic from this case is that the networks in this industry started out as similar structures, across the different product categories, from scratch in trial mode. Systems were set up to organize a reverse distribution task that had not been there before. The systems were therefore based on similar networks from other types of wastes, both commercially and physically. Commercially, regulations were made and agreements were entered in order to divide and place responsibility, and funding structures were established. Physically, the networks were structured based on the three distribution levels of collection, transport and reprocessing. Thus, even though the networks were structured quite from scratch, a point of departure
134
was taken in similar networks. In Norway, industries of wastes have been addressed as a whole, different types subsequently (glass, plastics, paper etc.), thus the authorities have similar references to parallel networks. Based on this point of departure, the changes that the RENAS case experienced from the first to the second contract period, is not surprising, but still intriguing. And, it gives us quite an insight into the distribution networks. The Regulations put forward by the authorities are important frames of reference for the network. However, a major driver is the fact that the flows of the reverse distribution networks are separated between different sectors in the industry. Thus, the waste management company is taking an important focal role of the networks. Still, over time we see that there is a dynamic between the participating actors, reflecting behavioural factors influencing the industry. The lessons we have learned are important both commercially and physically. The RENAS distribution network experienced an active partner in the waste owner. Thus, the initiating structure was based on making a collection service available for the actors holding waste. It was addressed as a negative valued product, and this service itself was expected to be of value to the waste holder. Quite in line with parallel reverse distribution networks from other types of wastes. However, as it turned out the products had a positive net value at end-of-life and the waste holder was seeking actively for a secondary market and a salvage value. Thus, to the waste holder the collection service itself was not attractive, but rather the network was important as a trade arena. Correspondingly, the actors participating in the reverse distribution network were dependent on becoming trading partners to the waste holders. In the first period, these actors were only third party service providers, structured in a manner to provide a given service. That is, they were expected to run collection sites where the waste holders could deliver their products, and subsequent transport service delivering waste to the reprocessing sites on a regular basis. Such a distribution network did not fit the trade arena it was set to serve. Rather, the distribution network experienced a necessity to adapt to varying collection, transport and reprocessing needs. Thus, the distribution network changed from being a fixed infrastructure to becoming a flexible network adapting to customer needs with variations in both collection capacity and transport routes. In this distribution network, the waste management company actor stands out as specifically important. This actor is able to connect the commercial and physical flows of the reverse distribution network. The separation
135
between these interests is characteristics of the reverse, as the physical task is to handle “waste” and the environmental concern of the hazardous content, and there is not a obvious trading arena for these types of products. The traditional commercial forces in a distribution network are not automatically present. The waste management company will continue to have this important focal role in these reverse distribution networks for the future. However, the actor will most likely become a controlling function, rather than a participating actor in the day-to-day operations. The contracting actors have taken over this role in the networks. In this manner, the transition itself has been the establishment of the networks and making them running businesses. Still, the networks are facing different issues and challenges. One such issue is information, and free-riders. The networks are dependent on close control with free-riders in order for the members to trust them. The networks are costly to the members, and therefore they need to be sure that the competitors are not getting a free lunch. Continuous information to users of the networks and continuous work with recruiting new members to the networks is of growing importance after the initiation face of the networks. These reverse distribution systems in Norway have been pioneers of their kind. A question for the future is taking these systems to Europe, and maybe further. The systems are working very well in Norway, and the EU has taken lessons from these systems in their work with the WEEE directive. This is a political issue for the authorities, but also an interesting business opportunity for the participating companies. The latter companies have opportunities for scale and economic growth, based on their knowledge from the Norwegian systems.
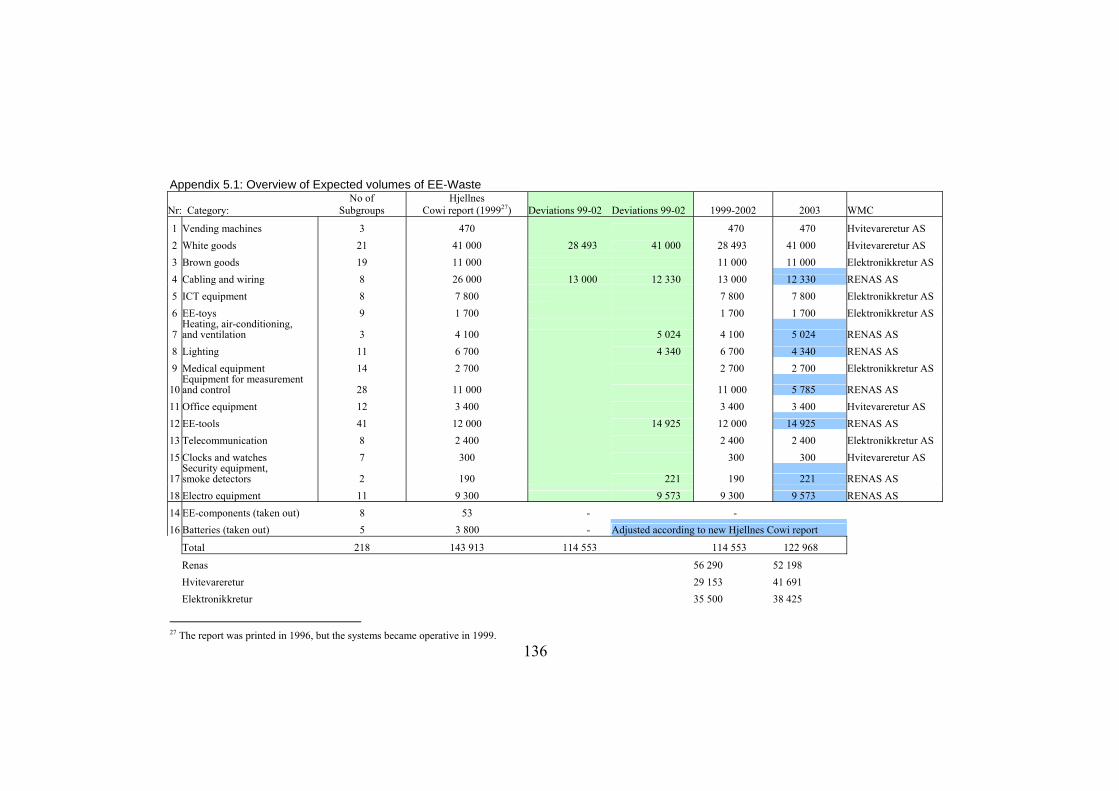
136
Appendix 5.1: Overview of Expected volumes of EE-Waste
Nr: Category: No of
Subgroups Hjellnes
Cowi report (199927) Deviations 99-02 Deviations 99-02 1999-2002 2003 WMC
1 Vending machines 3 470 470 470 Hvitevareretur AS 2 White goods 21 41 000 28 493 41 000 28 493 41 000 Hvitevareretur AS 3 Brown goods 19 11 000 11 000 11 000 Elektronikkretur AS 4 Cabling and wiring 8 26 000 13 000 12 330 13 000 12 330 RENAS AS 5 ICT equipment 8 7 800 7 800 7 800 Elektronikkretur AS 6 EE-toys 9 1 700 1 700 1 700 Elektronikkretur AS
7Heating, air-conditioning, and ventilation 3 4 100 5 024 4 100 5 024 RENAS AS
8 Lighting 11 6 700 4 340 6 700 4 340 RENAS AS 9 Medical equipment 14 2 700 2 700 2 700 Elektronikkretur AS
10Equipment for measurement and control 28 11 000 11 000 5 785 RENAS AS
11 Office equipment 12 3 400 3 400 3 400 Hvitevareretur AS 12 EE-tools 41 12 000 14 925 12 000 14 925 RENAS AS 13 Telecommunication 8 2 400 2 400 2 400 Elektronikkretur AS 15 Clocks and watches 7 300 300 300 Hvitevareretur AS
17Security equipment, smoke detectors 2 190 221 190 221 RENAS AS
18 Electro equipment 11 9 300 9 573 9 300 9 573 RENAS AS 14 EE-components (taken out) 8 53 - - 16 Batteries (taken out) 5 3 800 - Adjusted according to new Hjellnes Cowi report
Total 218 143 913 114 553 114 553 122 968
Renas 56 290 52 198 Hvitevareretur 29 153 41 691 Elektronikkretur 35 500 38 425
27 The report was printed in 1996, but the systems became operative in 1999.
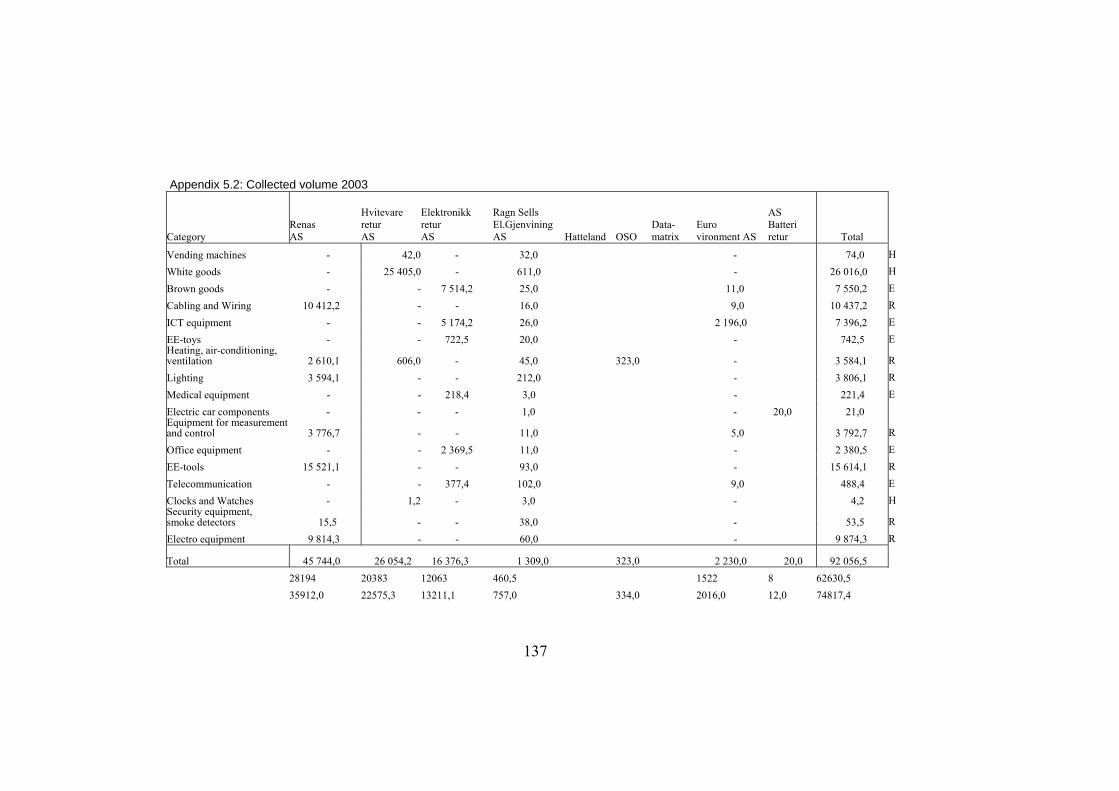
137
Appendix 5.2: Collected volume 2003
Category Renas AS
Hvitevare retur AS
Elektronikk retur AS
Ragn Sells El.Gjenvining AS Hatteland OSO
Data- matrix
Euro vironment AS
AS Batteri retur Total
Vending machines - 42,0 - 32,0 - 74,0 H White goods - 25 405,0 - 611,0 - 26 016,0 H
Brown goods - - 7 514,2 25,0 11,0 7 550,2 E Cabling and Wiring 10 412,2 - - 16,0 9,0 10 437,2 R
ICT equipment - - 5 174,2 26,0 2 196,0 7 396,2 E EE-toys - - 722,5 20,0 - 742,5 E Heating, air-conditioning, ventilation 2 610,1 606,0 - 45,0
323,0 - 3 584,1 R
Lighting 3 594,1 - - 212,0 - 3 806,1 R Medical equipment - - 218,4 3,0 - 221,4 E
Electric car components - - - 1,0 - 20,0 21,0 Equipment for measurement and control 3 776,7 - - 11,0 5,0 3 792,7 R
Office equipment - - 2 369,5 11,0 - 2 380,5 E EE-tools 15 521,1 - - 93,0 - 15 614,1 R
Telecommunication - - 377,4 102,0 9,0 488,4 E Clocks and Watches - 1,2 - 3,0 - 4,2 H Security equipment, smoke detectors 15,5 - - 38,0 - 53,5 R Electro equipment 9 814,3 - - 60,0 - 9 874,3 R
Total 45 744,0 26 054,2 16 376,3 1 309,0 323,0 2 230,0 20,0 92 056,5
28194 20383 12063 460,5 1522 8 62630,5 35912,0 22575,3 13211,1 757,0 334,0 2016,0 12,0 74817,4
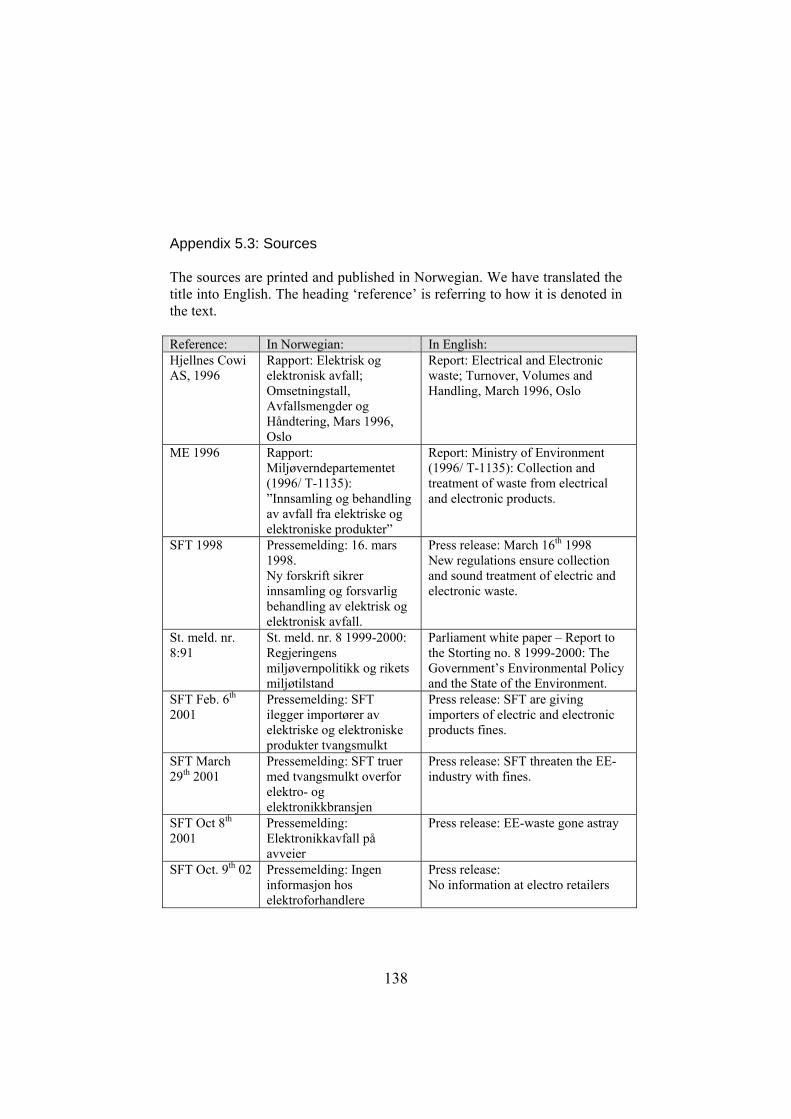
138
Appendix 5.3: Sources The sources are printed and published in Norwegian. We have translated the title into English. The heading ‘reference’ is referring to how it is denoted in the text. Reference: In Norwegian: In English: Hjellnes Cowi AS, 1996
Rapport: Elektrisk og elektronisk avfall; Omsetningstall, Avfallsmengder og Håndtering, Mars 1996, Oslo
Report: Electrical and Electronic waste; Turnover, Volumes and Handling, March 1996, Oslo
ME 1996 Rapport: Miljøverndepartementet (1996/ T-1135): ”Innsamling og behandling av avfall fra elektriske og elektroniske produkter”
Report: Ministry of Environment (1996/ T-1135): Collection and treatment of waste from electrical and electronic products.
SFT 1998 Pressemelding: 16. mars 1998. Ny forskrift sikrer innsamling og forsvarlig behandling av elektrisk og elektronisk avfall.
Press release: March 16th 1998 New regulations ensure collection and sound treatment of electric and electronic waste.
St. meld. nr. 8:91
St. meld. nr. 8 1999-2000: Regjeringens miljøvernpolitikk og rikets miljøtilstand
Parliament white paper – Report to the Storting no. 8 1999-2000: The Government’s Environmental Policy and the State of the Environment.
SFT Feb. 6th 2001
Pressemelding: SFT ilegger importører av elektriske og elektroniske produkter tvangsmulkt
Press release: SFT are giving importers of electric and electronic products fines.
SFT March 29th 2001
Pressemelding: SFT truer med tvangsmulkt overfor elektro- og elektronikkbransjen
Press release: SFT threaten the EE-industry with fines.
SFT Oct 8th 2001
Pressemelding: Elektronikkavfall på avveier
Press release: EE-waste gone astray
SFT Oct. 9th 02 Pressemelding: Ingen informasjon hos elektroforhandlere
Press release: No information at electro retailers
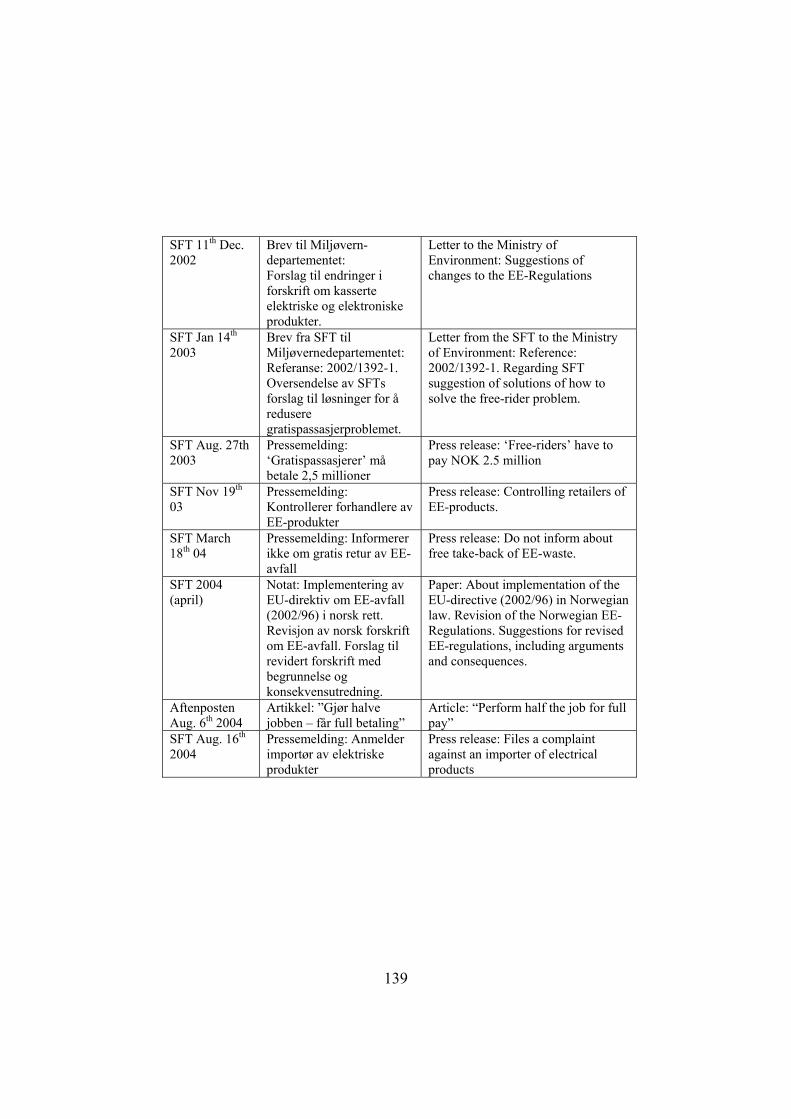
139
SFT 11th Dec. 2002
Brev til Miljøvern-departementet: Forslag til endringer i forskrift om kasserte elektriske og elektroniske produkter.
Letter to the Ministry of Environment: Suggestions of changes to the EE-Regulations
SFT Jan 14th 2003
Brev fra SFT til Miljøvernedepartementet: Referanse: 2002/1392-1. Oversendelse av SFTs forslag til løsninger for å redusere gratispassasjerproblemet.
Letter from the SFT to the Ministry of Environment: Reference: 2002/1392-1. Regarding SFT suggestion of solutions of how to solve the free-rider problem.
SFT Aug. 27th 2003
Pressemelding: ‘Gratispassasjerer’ må betale 2,5 millioner
Press release: ‘Free-riders’ have to pay NOK 2.5 million
SFT Nov 19th 03
Pressemelding: Kontrollerer forhandlere av EE-produkter
Press release: Controlling retailers of EE-products.
SFT March 18th 04
Pressemelding: Informerer ikke om gratis retur av EE-avfall
Press release: Do not inform about free take-back of EE-waste.
SFT 2004 (april)
Notat: Implementering av EU-direktiv om EE-avfall (2002/96) i norsk rett. Revisjon av norsk forskrift om EE-avfall. Forslag til revidert forskrift med begrunnelse og konsekvensutredning.
Paper: About implementation of the EU-directive (2002/96) in Norwegian law. Revision of the Norwegian EE-Regulations. Suggestions for revised EE-regulations, including arguments and consequences.
Aftenposten Aug. 6th 2004
Artikkel: ”Gjør halve jobben – får full betaling”
Article: “Perform half the job for full pay”
SFT Aug. 16th 2004
Pressemelding: Anmelder importør av elektriske produkter
Press release: Files a complaint against an importer of electrical products

140
141
CHAPTER 6
The Fast Moving Consumer Goods (FMCG28) Distribution Case
Erna Senkina Engebrethsen
6.1 Logistics in retail distribution in Europe Higher service level expectation of retail customer, increased distribution outsourcing by manufacturing, and the proliferation of advanced information technologies drive transformation in the structure and performance requirements for distribution channels, presenting new problems in supply chain management (Balakrishnan et al., 2001). The small independent stores in the 70-s have been replaced by retail chain stores and supermarkets, offering one-stop –shopping for a wide variety of products at low prices. The vast purchasing power of retail chains allows them to negotiate low prices and strict delivery terms from suppliers. At the same time offering a wide variety of products to consumers with slim profit margins requires the stores to keep low inventories (Balakrishnan et al., 2001). Inventories can be kept low by receiving frequent and reliable deliveries from suppliers under short lead times. Retail chains often place an order for different items from the supplier’s various product lines and demand consolidated shipments for these items, creating new challenges for suppliers for meeting these strict delivery requirements. European food retailers have taken over leadership in the marketing channel since World War II, and this phenomenon was almost total in some countries (UK, France) or only partially adapted in other countries (Spain, Italy) (Pache, 1998). For example, in Italy the market share of small independent retail shops is still rather high, comparing to the market share of retail chains, and 70% of FMCG are still distributed to the stores by the manufacturers (Battezatti and Magnani, 2000).
28 Fast Moving Consumer Goods – is a term used in reference to consumer goods that are frequently purchased and constantly restocked, such as packaged food, drinks, toiletries, tobacco and cleaning materials.
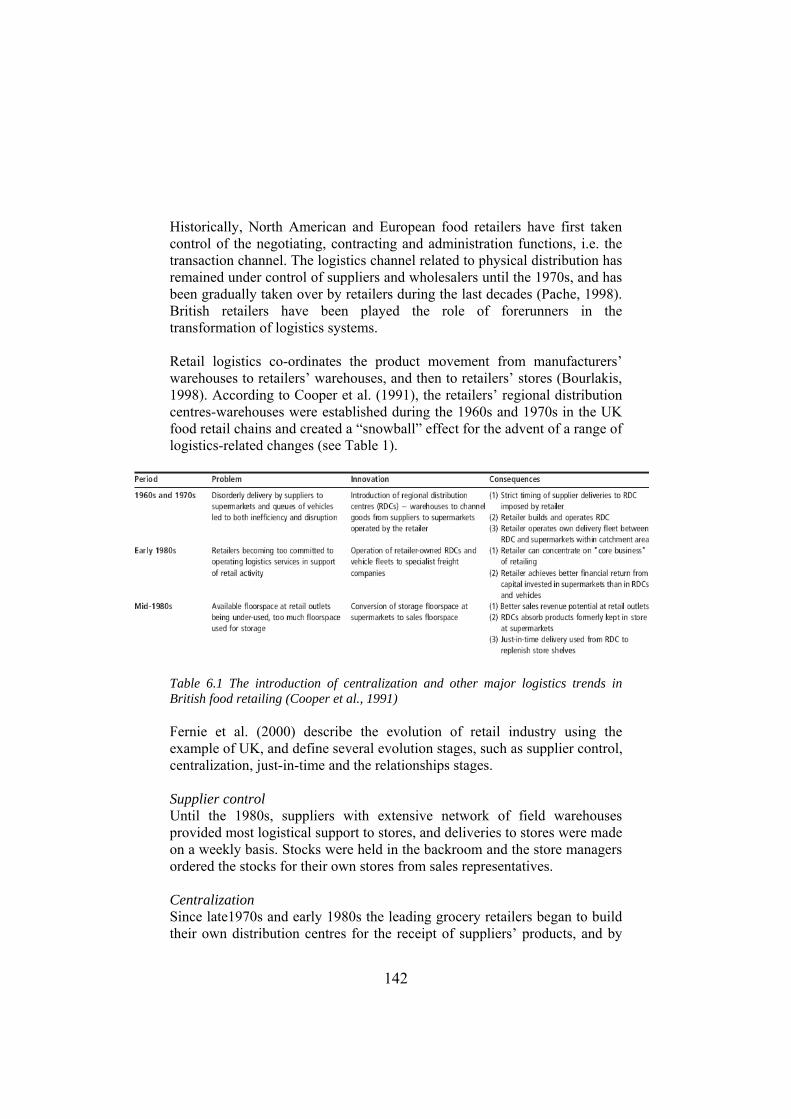
142
Historically, North American and European food retailers have first taken control of the negotiating, contracting and administration functions, i.e. the transaction channel. The logistics channel related to physical distribution has remained under control of suppliers and wholesalers until the 1970s, and has been gradually taken over by retailers during the last decades (Pache, 1998). British retailers have been played the role of forerunners in the transformation of logistics systems. Retail logistics co-ordinates the product movement from manufacturers’ warehouses to retailers’ warehouses, and then to retailers’ stores (Bourlakis, 1998). According to Cooper et al. (1991), the retailers’ regional distribution centres-warehouses were established during the 1960s and 1970s in the UK food retail chains and created a “snowball” effect for the advent of a range of logistics-related changes (see Table 1).
Table 6.1 The introduction of centralization and other major logistics trends in British food retailing (Cooper et al., 1991) Fernie et al. (2000) describe the evolution of retail industry using the example of UK, and define several evolution stages, such as supplier control, centralization, just-in-time and the relationships stages. Supplier control Until the 1980s, suppliers with extensive network of field warehouses provided most logistical support to stores, and deliveries to stores were made on a weekly basis. Stocks were held in the backroom and the store managers ordered the stocks for their own stores from sales representatives. Centralization Since late1970s and early 1980s the leading grocery retailers began to build their own distribution centres for the receipt of suppliers’ products, and by
143
the mid 1980s the shift to retail-controlled centralized regional distribution centres took the lead. The retailers began to apply ex-works trading terms (i.e. retailers took responsibility for transporting the goods from the suppliers’ outlet) and to demand better delivery terms and volume discounts for their large orders. The major efficiencies were achieved through centralizing stocks, decreasing lead-times. The inventories were reduced throughout the network, as back room stocks at stores were centralized to regional distribution centres, and the whole administrative ordering system was streamlines. Over 80 % of the stocks of British retailers is now centralized, and for the food retailers this figure is 98% in some companies. The suppliers abdicated their responsibility for managing the retail chain, and the shift in the balance of power from manufacturer to retailer over the last decades has been facilities by the extensive use of information technology. The process of centralization created a market for third-party services. Many companies previously acting on behalf of the suppliers have got the contracts for operating distribution centres and transportation on behalf of their new retail clients. JIT Centralization created a retail-controlled distribution network, where delivering products from the regional distribution centres to stores was more efficient than direct to store deliveries from suppliers. Increased delivery frequency reduced the stock-outs, while new technological developments in materials handling and information technology has further enhanced the efficiency. One of the major innovations was composite distribution, whereby all temperature-controlled products were distributed though one system of multi-temperature warehouses and vehicles with different compartments. Instead of having warehouses and vehicles, which could handle only one certain temperature, retailers could combine the storage and transportation of items requiring different temperature-regimes, and reduce the total number of warehouses and vehicles. Improvements in information technology in 1990s, such as electronic-data-interchange and availability of point-of –sale data, allowed applying just-in-time principles in the retail operations. In order to increase vehicle utilization rates and keep frequent replenishments, consolidation centres were introduced. Relationships In order to increase overall supply chain efficiency retailers and manufacturers needed better collaboration and an environment of greater openness to discuss supply chain problems, therefore the Efficient Consumer Response initiatives have been introduced. The established collaborative
144
groups worked on a range of issues from replenishment, category management to enabling technologies. According to Pache (1998) the practice of adopting more cooperative relationships with suppliers and logistics service providers varies in European countries, for example French retailers still hesitate to collaborate with their service providers on strategic and long-term level.
6.2 Future trends and challenges in retail logistics Information systems One of the biggest problems in retail logistics is the decreasing order sizes and increasing replenishment frequencies of the different goods flows. Frequent deliveries to the stores is necessitated by the perishable nature of merchandise, small backroom space at stores and often by large daily sales volumes. Some European retailers require a replenishment time of 18 hours between the Point-of-Sale transaction and refilling the in-store stocks, and it is expected that reduction of the replenishment time will continue to be an important target. It is impossible to achieve this target without using more advanced information exchange technologies and planning tools, which are compatible with the systems of supply chain members. There is a need for developing common industry standards for information exchange between retailers and their suppliers (Fernie, 2000). When using the Collaborative Planning and Forecasting, information exchange needs to be extended from real sales figures to the exchange of forecasts and trends, and their up-date between the partners. There is also need for development of better benefit and risk sharing mechanisms among all partner, for example for allocation of RFID costs among supply chain partners. Pricing policy Strategic pricing becomes more important, and logistical aspects become a part of companies pricing policy. For example, a company can apply a strategic pricing policy, where for “optimal” logistic orders customers receive a discount, while for suboptimal orders they pay a penalty. Scan based trading, where the suppliers are paid at the moment that the customer pays the supplier’s client, can result in changes in the way companies have to finance their inventories and production or distribution activities. Technological development Standardization of consumer and transportation packaging, pallets and roll-containers are important factors for making logistics operations more
145
effective. In Europe 50% of the packaged goods are distributed on standard pallets (Euro pallet 80 x 120 cm) and in standard-boxes (40 x 60 x 40 cm), and the use of these and other standards is expected to increase drastically in the near future. According to Fernie (2000) the benefits from technological development in the future will lead to more advanced use of traffic information systems, in-cab communication and scheduling software to maximize vehicle-running times, intelligent tagging and RFID. More effective processes in warehousing and transportation operations are expected due to automated sorting systems increasing the speed of picking small order quantities at DCs, new modular handling systems and vehicles design, greater use of multi-modal services and alternative fuel. Multi-modal transportation has particularly greater increase potential for items with longer shelf lives and slow movers. The new decision making challenge for retailer becomes determination of the best mix of transportation modes, including the outsourcing decision and the choice of transportation companies. Inventories re-location Inventory reduction can be achieved in the future due to new planning and information exchange systems, greater manufacturer flexibility and more effective sharing of information, where not only historical data, but also sales forecasts and promotional data will be exchanged between supply chain partners. Major inventory reductions are expected to take place at the stores and central distribution centres, while greater consolidation of loads at manufacturers’ distribution or consolidation centres will increase the upstream inventories Logistics solutions and infrastructure It is expected greater use of cross-docking, more levels of load consolidation, increased outsourcing of the “postponed” services, as well as greater use of shared user services. At the same time use of “white vehicles” for sharing transportation with competitors can be limited due to companies’ branding policy. The joint exploitation of logistics infrastructure by suppliers seems to be more accepted than joint exploitation of logistics infrastructure by retailers. There is a need for more differentiated distribution arrangement for different product groups within the same supply chain, such as for example deliveries via consolidation centre or direct deliveries, depending on distribution costs, products value and the sale rate. There is a sales-decline in catalogue
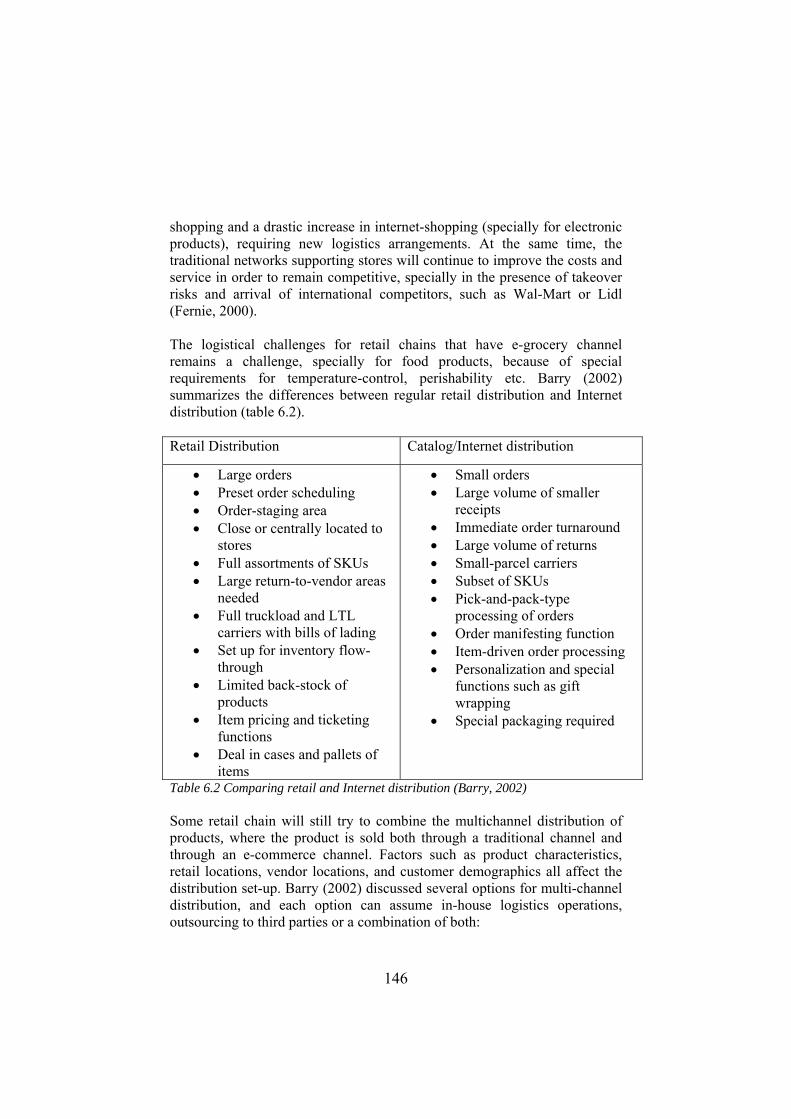
146
shopping and a drastic increase in internet-shopping (specially for electronic products), requiring new logistics arrangements. At the same time, the traditional networks supporting stores will continue to improve the costs and service in order to remain competitive, specially in the presence of takeover risks and arrival of international competitors, such as Wal-Mart or Lidl (Fernie, 2000). The logistical challenges for retail chains that have e-grocery channel remains a challenge, specially for food products, because of special requirements for temperature-control, perishability etc. Barry (2002) summarizes the differences between regular retail distribution and Internet distribution (table 6.2). Retail Distribution Catalog/Internet distribution
• Large orders • Preset order scheduling • Order-staging area • Close or centrally located to
stores • Full assortments of SKUs • Large return-to-vendor areas
needed • Full truckload and LTL
carriers with bills of lading • Set up for inventory flow-
through • Limited back-stock of
products • Item pricing and ticketing
functions • Deal in cases and pallets of
items
• Small orders • Large volume of smaller
receipts • Immediate order turnaround • Large volume of returns • Small-parcel carriers • Subset of SKUs • Pick-and-pack-type
processing of orders • Order manifesting function • Item-driven order processing • Personalization and special
functions such as gift wrapping
• Special packaging required
Table 6.2 Comparing retail and Internet distribution (Barry, 2002) Some retail chain will still try to combine the multichannel distribution of products, where the product is sold both through a traditional channel and through an e-commerce channel. Factors such as product characteristics, retail locations, vendor locations, and customer demographics all affect the distribution set-up. Barry (2002) discussed several options for multi-channel distribution, and each option can assume in-house logistics operations, outsourcing to third parties or a combination of both:

147
- One facility for all channels, where entire inventory is kept in one location. This arrangement usually requires a lower overall capital expenditure and may allow the to keep less inventory on hand. In addition, this option enables managers to more tightly control distribution. When opting for this approach, however, systems are needed that can allocate and reserve inventory by channel. - Different facilities for different channels, where retail and direct-to-customer operations are separated to ensure that they do not interfere with each other's order flow. Often this approach is applied because the channels sell different product lines or offer different service levels; or the growth of a channel has been so great that more room and split are needed. Reallocating inventory in this scenario can be costly and time-consuming if the warehouses are far apart. -Multiple multi-channel facilities. Generally order turnaround is quicker in this kind of operation, but costs are higher as well. Forecasting product geographically is a challenge; it can be difficult to ship effectively when smaller quantities are ordered at various DCs. The systems requirements for this scenario are usually the most complex of all.
6.3 Environmental concerns and retail logistics The major retail logistics trends of globalisation and centralisation have important implications for city planning and governmental policy on freight. The main cause of freight traffic growth in Western Europe by 60% in 2002 is not an increase in the physical mass of goods transported, but longer average distance that each freight consignment is moved, specially for high-value products (Braithwaite and McKinnon, 2003). Until recently the governments tried to provide addition infrastructural capacity to facilitate the traffic growth, however, there are economic, environmental and social limits to this problem. Use of transhipment facilities permits disaggregation and reconsolidation of loads to reduce congestion, and large European retail chains achieve a high degree of load consolidation by using them. The next promising development area can be the consolidation of retail supplies to smaller, independent outlets, and use of a “shared-user” service by shopping centres. Most European governments are developing “sustainable distribution strategies”, they set tighter emission standards for vehicle fleets and are keen to shift freight transportation mode from road to rail or water, as these modes
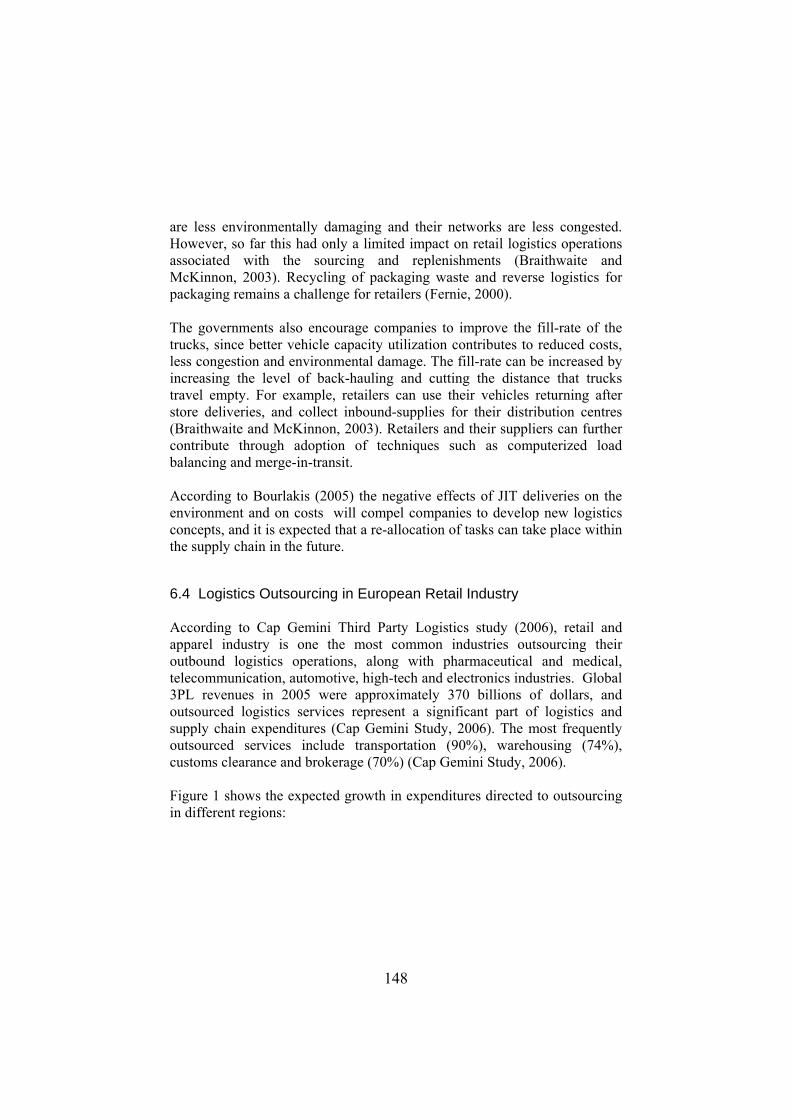
148
are less environmentally damaging and their networks are less congested. However, so far this had only a limited impact on retail logistics operations associated with the sourcing and replenishments (Braithwaite and McKinnon, 2003). Recycling of packaging waste and reverse logistics for packaging remains a challenge for retailers (Fernie, 2000). The governments also encourage companies to improve the fill-rate of the trucks, since better vehicle capacity utilization contributes to reduced costs, less congestion and environmental damage. The fill-rate can be increased by increasing the level of back-hauling and cutting the distance that trucks travel empty. For example, retailers can use their vehicles returning after store deliveries, and collect inbound-supplies for their distribution centres (Braithwaite and McKinnon, 2003). Retailers and their suppliers can further contribute through adoption of techniques such as computerized load balancing and merge-in-transit. According to Bourlakis (2005) the negative effects of JIT deliveries on the environment and on costs will compel companies to develop new logistics concepts, and it is expected that a re-allocation of tasks can take place within the supply chain in the future.
6.4 Logistics Outsourcing in European Retail Industry According to Cap Gemini Third Party Logistics study (2006), retail and apparel industry is one the most common industries outsourcing their outbound logistics operations, along with pharmaceutical and medical, telecommunication, automotive, high-tech and electronics industries. Global 3PL revenues in 2005 were approximately 370 billions of dollars, and outsourced logistics services represent a significant part of logistics and supply chain expenditures (Cap Gemini Study, 2006). The most frequently outsourced services include transportation (90%), warehousing (74%), customs clearance and brokerage (70%) (Cap Gemini Study, 2006). Figure 1 shows the expected growth in expenditures directed to outsourcing in different regions:
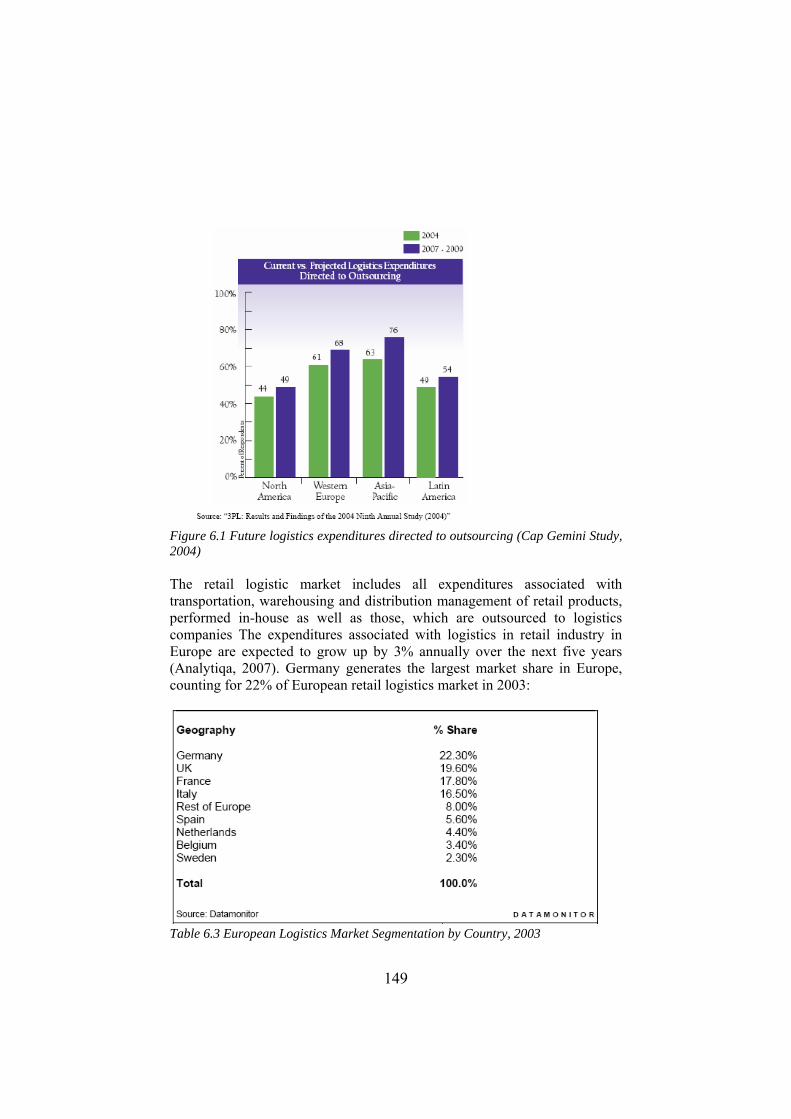
149
Figure 6.1 Future logistics expenditures directed to outsourcing (Cap Gemini Study, 2004) The retail logistic market includes all expenditures associated with transportation, warehousing and distribution management of retail products, performed in-house as well as those, which are outsourced to logistics companies The expenditures associated with logistics in retail industry in Europe are expected to grow up by 3% annually over the next five years (Analytiqa, 2007). Germany generates the largest market share in Europe, counting for 22% of European retail logistics market in 2003:
Table 6.3 European Logistics Market Segmentation by Country, 2003
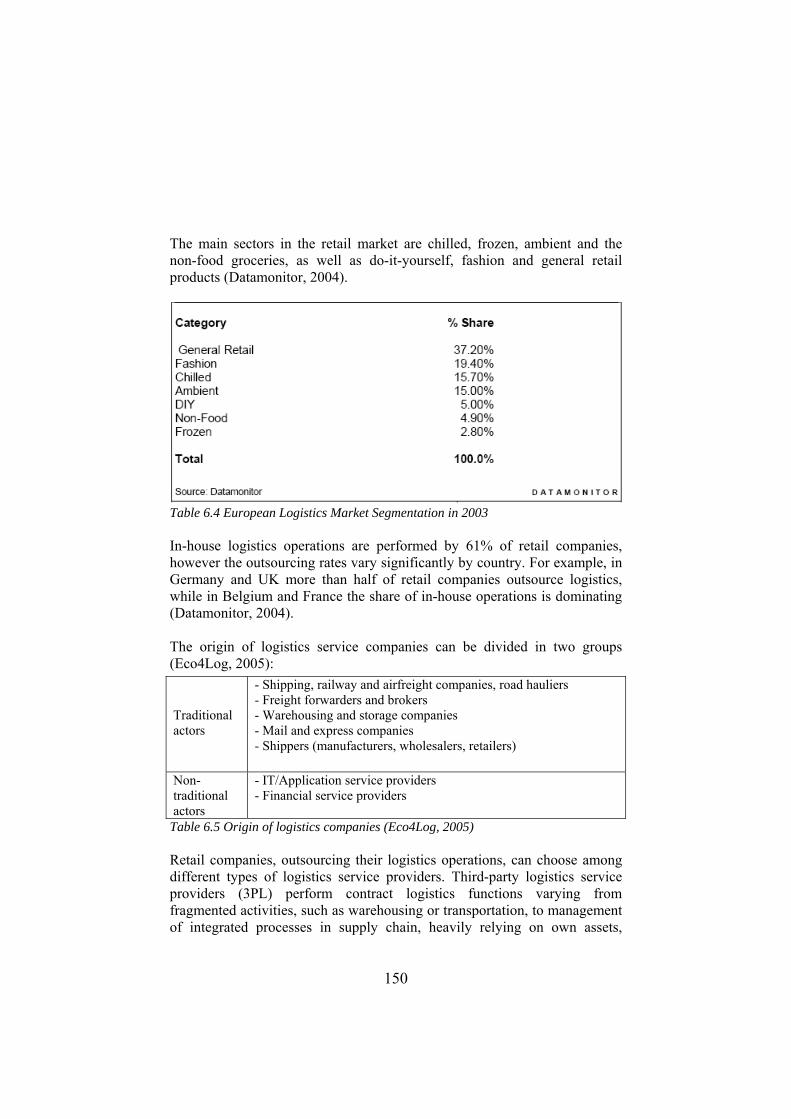
150
The main sectors in the retail market are chilled, frozen, ambient and the non-food groceries, as well as do-it-yourself, fashion and general retail products (Datamonitor, 2004).
Table 6.4 European Logistics Market Segmentation in 2003 In-house logistics operations are performed by 61% of retail companies, however the outsourcing rates vary significantly by country. For example, in Germany and UK more than half of retail companies outsource logistics, while in Belgium and France the share of in-house operations is dominating (Datamonitor, 2004). The origin of logistics service companies can be divided in two groups (Eco4Log, 2005):
Table 6.5 Origin of logistics companies (Eco4Log, 2005) Retail companies, outsourcing their logistics operations, can choose among different types of logistics service providers. Third-party logistics service providers (3PL) perform contract logistics functions varying from fragmented activities, such as warehousing or transportation, to management of integrated processes in supply chain, heavily relying on own assets,
Traditional actors
- Shipping, railway and airfreight companies, road hauliers - Freight forwarders and brokers - Warehousing and storage companies - Mail and express companies - Shippers (manufacturers, wholesalers, retailers)
Non-traditional actors
- IT/Application service providers - Financial service providers
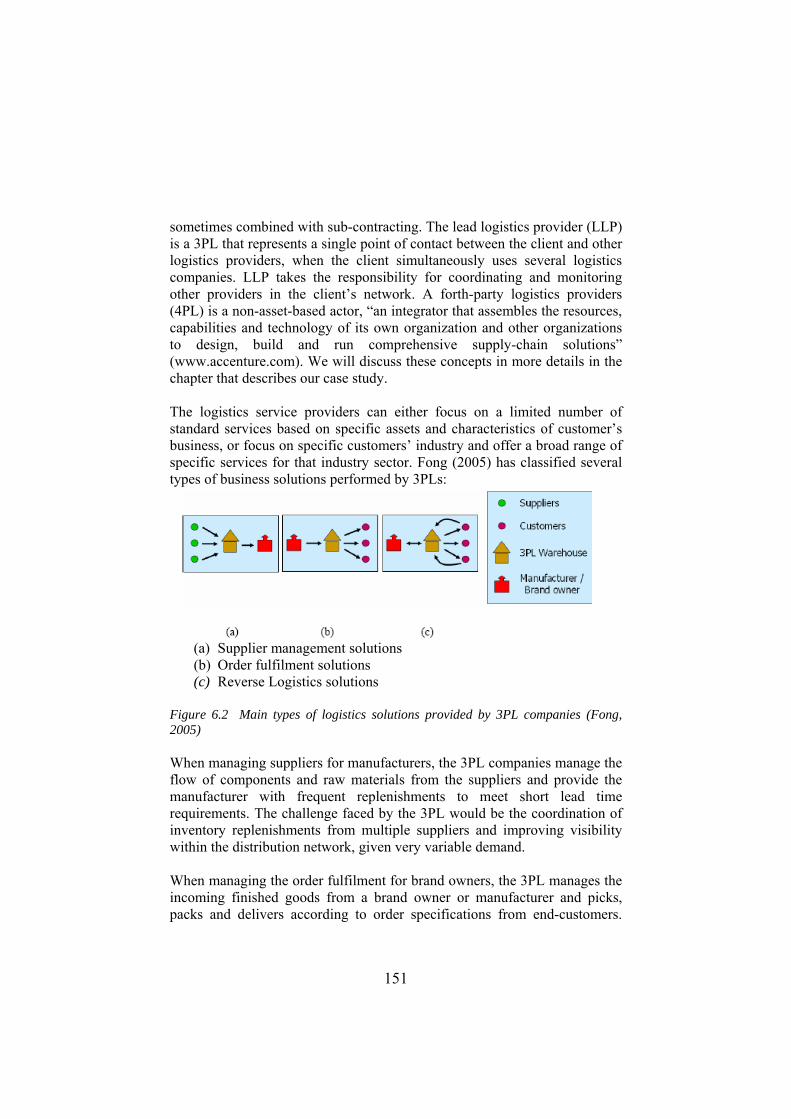
151
sometimes combined with sub-contracting. The lead logistics provider (LLP) is a 3PL that represents a single point of contact between the client and other logistics providers, when the client simultaneously uses several logistics companies. LLP takes the responsibility for coordinating and monitoring other providers in the client’s network. A forth-party logistics providers (4PL) is a non-asset-based actor, “an integrator that assembles the resources, capabilities and technology of its own organization and other organizations to design, build and run comprehensive supply-chain solutions” (www.accenture.com). We will discuss these concepts in more details in the chapter that describes our case study. The logistics service providers can either focus on a limited number of standard services based on specific assets and characteristics of customer’s business, or focus on specific customers’ industry and offer a broad range of specific services for that industry sector. Fong (2005) has classified several types of business solutions performed by 3PLs:
(a) Supplier management solutions (b) Order fulfilment solutions (c) Reverse Logistics solutions
Figure 6.2 Main types of logistics solutions provided by 3PL companies (Fong, 2005) When managing suppliers for manufacturers, the 3PL companies manage the flow of components and raw materials from the suppliers and provide the manufacturer with frequent replenishments to meet short lead time requirements. The challenge faced by the 3PL would be the coordination of inventory replenishments from multiple suppliers and improving visibility within the distribution network, given very variable demand. When managing the order fulfilment for brand owners, the 3PL manages the incoming finished goods from a brand owner or manufacturer and picks, packs and delivers according to order specifications from end-customers.

152
The challenge for the 3PL here would be to design a network to distribute the orders more effectively. When providing the reverse logistics solution the 3PL manages the returns of faulty parts to the repair and salvage operations for the brand owner. This solution can also be provided in combination with order fulfilment or supplier management solutions. The challenge faced by the 3PL is how to design a network to process returns and manage the customers. A study of several large 3 PL companies providing complete logistics solutions (Fong, 2005) shows that these companies organize their services according to industry sectors. Different industry sectors may have different requirements for storage, transportation and inventory management. The key characteristics, process requirements and types of logistics solutions are described in the table 3:

153
Table 6.6 Logistics solutions by industry sector (Fong, 2005) 6.5 Trends and challenges in retail logistics outsourcing Managing supply chains across several countries becomes more and more demanding task for manufacturers and retailers. The retail logistics markets
154
in each country vary by size, growth rates, supply chain complexity, outsourcing culture and sophistication. It is expected that outsourcing rates in European markets will continue to increase, specially as the geographical gravity centre for both manufacturing and central distribution centres moves eastwards (Analytiqa, 2007). In the more mature northern European markets the growth of outsourced logistics services will come from booming online shopping trends, as well as from demand for better reverse logistics and recycling capabilities, as a result of increased environmental focus in legislation (Analytiqa, 2007). It is expected that the UK will maintain the highest outsourcing rates in Europe, while German market will benefit from the migration of manufacturing activities eastwards, becoming an attractive facilitator of European distribution centres and transportation hubs (Analytiqa, 2007). At the same time, some countries, such as for example France, may experience declining outsourcing rates as a result of struggling economy and customers postponing the outsourcing decision. In Southern Europe the demand is expected to become higher for more integrated logistics solutions, for example combination of warehousing and transportation, rather than the more basic fragmented services that currently exist (Analytiqa, 2007). The service providers are expected to have a higher participation in co-manufacturing activities, playing a greater role in inventory management, asset control solutions, returnable packaging and other operations related to recycling (Analytiqa, 2007). The retail companies will outsource more of postponement operations to logistics service providers. It is expected that the 4PL market in Europe will increase from 4,7 billion EUR in 2002 up to 13 billion EUR in 2010 (Eco4Log, 2005). The most important factors affecting the cost and service in the next years will be road traffic congestion and transportation taxation levels for transportation service providers (Fernie, 2000). The consolidation trend in logistics service market will continue, putting pressure on small and large companies to offer more innovative customized solutions in a cost-effective manner. According to Cuthbertson et al.(2006) the major trend in logistics decision making can be summarized in the following table:
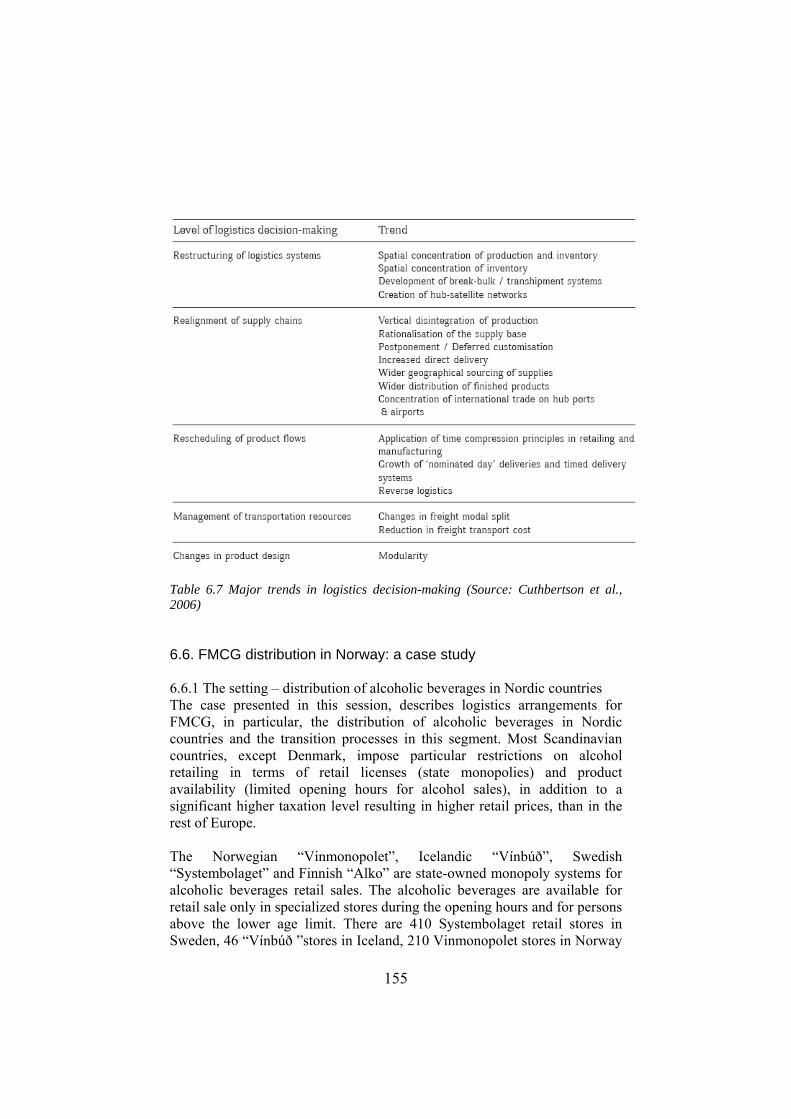
155
Table 6.7 Major trends in logistics decision-making (Source: Cuthbertson et al., 2006) 6.6. FMCG distribution in Norway: a case study 6.6.1 The setting – distribution of alcoholic beverages in Nordic countries The case presented in this session, describes logistics arrangements for FMCG, in particular, the distribution of alcoholic beverages in Nordic countries and the transition processes in this segment. Most Scandinavian countries, except Denmark, impose particular restrictions on alcohol retailing in terms of retail licenses (state monopolies) and product availability (limited opening hours for alcohol sales), in addition to a significant higher taxation level resulting in higher retail prices, than in the rest of Europe. The Norwegian “Vinmonopolet”, Icelandic “Vínbúð”, Swedish “Systembolaget” and Finnish “Alko” are state-owned monopoly systems for alcoholic beverages retail sales. The alcoholic beverages are available for retail sale only in specialized stores during the opening hours and for persons above the lower age limit. There are 410 Systembolaget retail stores in Sweden, 46 “Vínbúð ”stores in Iceland, 210 Vinmonopolet stores in Norway
156
and 327 Alko stores in Finland. Some types of beverages containing low degree of alcohol are allowed to be sold through the regular retail chain stores. The monopoly on the retailing of alcoholic beverages is based primarily on reasons related to social and health politics, and is intended to limit the availability of alcohol through control of the establishment of stores and their opening hours. Until 1996 the state had also the monopoly on production, import and export, as well as on trade with food service industry (HoReCa)29. The European Economic Area (EEA) agreement30, which came into effect on 1 January 1994, put renewed pressure on the monopoly system in Scandinavia. In 1995 the European Commission and European Free Trade Association (EFTA31) Surveillance Authority, has recognized this part of monopoly as conflicting with the EEA agreement; thus it has been repealed on 1 January 1996. However, the retail sale of alcoholic beverages still remains a state monopoly. Since 1996 many suppliers of alcoholic beverages, i.e. producers and importers holding the required license for import, have appeared on the Scandinavian market as a replacement for the former centralized system. 6.6.2 Distribution of alcoholic beverages in Norway The main part of alcoholic beverages are imported to Norway from different countries, while some of the products, such as for example beer and aquavit are produced locally. Vinmonopolet offers a unique range of roughly 7 000 different products. The most popular of these are available in all its shops, while those not in stock at one outlet can be ordered without additional charge. While the largest shops always carry at least 1 500 different products, the smallest primarily offer the most popular items - just over 400 brands. These account nationally for roughly 80 per cent of Vinmonopolet's
29 HoReCa refers to the food service industry, i.e. establishments which prepare and serve food and beverages. It is an acronym of the words hotel, restaurant and caterer.
30 EEA agreement unites the EU Member States and the three EEA EFTA States (Iceland, Liechtenstein, and Norway) into an Internal Market governed by the same basic rules. These rules aim to enable goods, services, capital, and persons to move freely within EEA in an open and competitive environment.
31 The European Free Trade Association (EFTA) was established on May 3, 1960 as an alternative for European states that were not allowed or did not wish to join the European Community (now the European Union). Today only Iceland, Norway, Switzerland and Liechtenstein remain members of EFTA.
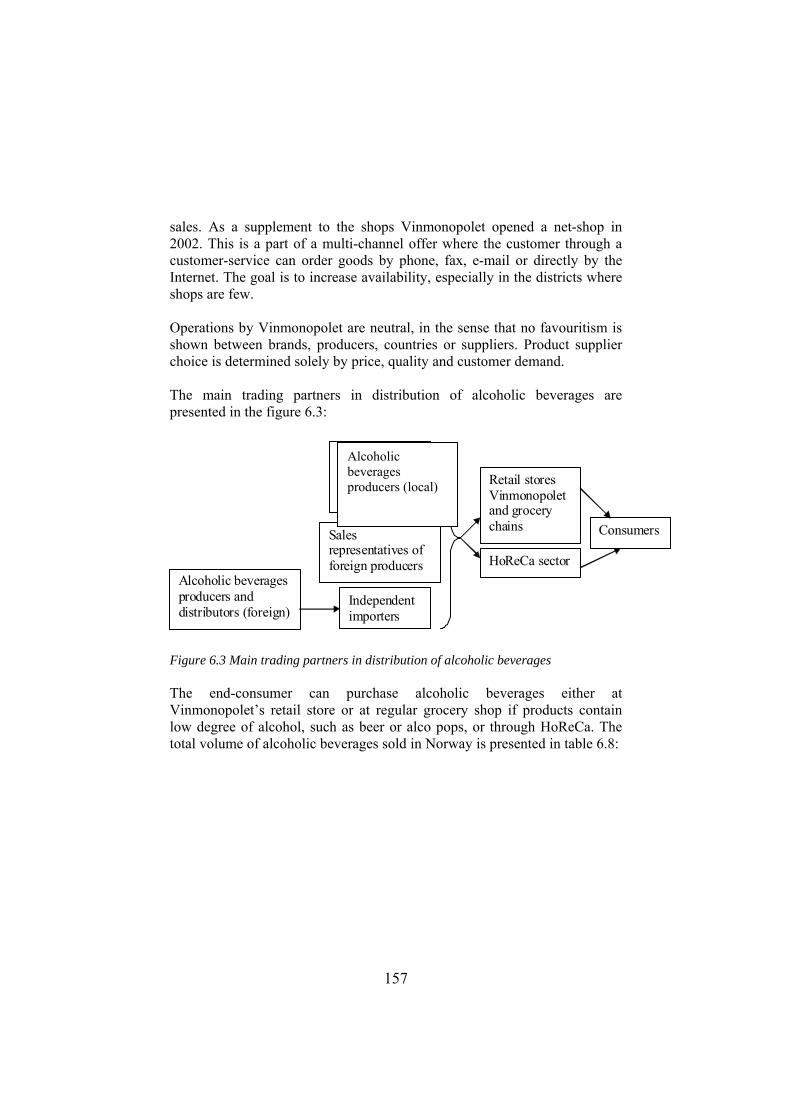
157
sales. As a supplement to the shops Vinmonopolet opened a net-shop in 2002. This is a part of a multi-channel offer where the customer through a customer-service can order goods by phone, fax, e-mail or directly by the Internet. The goal is to increase availability, especially in the districts where shops are few. Operations by Vinmonopolet are neutral, in the sense that no favouritism is shown between brands, producers, countries or suppliers. Product supplier choice is determined solely by price, quality and customer demand. The main trading partners in distribution of alcoholic beverages are presented in the figure 6.3:
Alcoholic beverages producers (local)
Sales representatives of foreign producers
Retail stores Vinmonopolet and grocery chains
HoReCa sector
Independent importers
Alcoholic beverages producers and distributors (foreign)
Consumers
Figure 6.3 Main trading partners in distribution of alcoholic beverages The end-consumer can purchase alcoholic beverages either at Vinmonopolet’s retail store or at regular grocery shop if products contain low degree of alcohol, such as beer or alco pops, or through HoReCa. The total volume of alcoholic beverages sold in Norway is presented in table 6.8:
Alcoholic beverages producers (local)
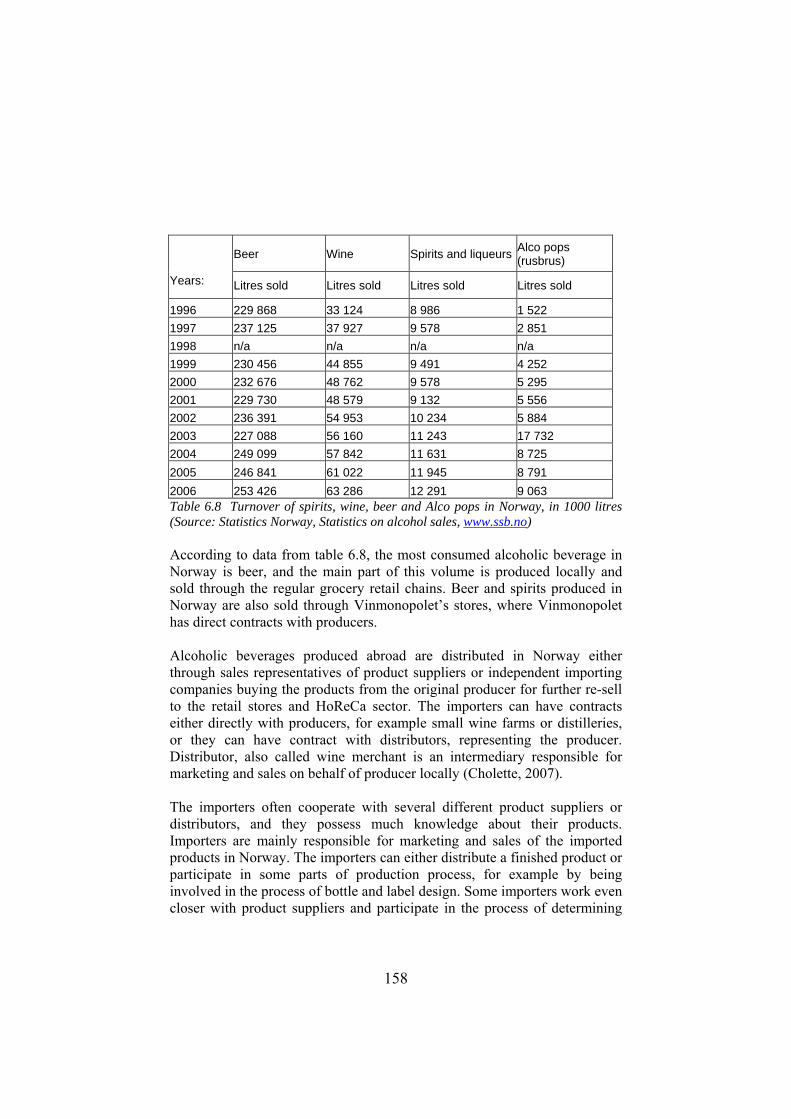
158
Beer Wine Spirits and liqueurs Alco pops (rusbrus)
Years: Litres sold Litres sold Litres sold Litres sold
1996 229 868 33 124 8 986 1 522 1997 237 125 37 927 9 578 2 851 1998 n/a n/a n/a n/a 1999 230 456 44 855 9 491 4 252 2000 232 676 48 762 9 578 5 295 2001 229 730 48 579 9 132 5 556 2002 236 391 54 953 10 234 5 884 2003 227 088 56 160 11 243 17 732 2004 249 099 57 842 11 631 8 725 2005 246 841 61 022 11 945 8 791 2006 253 426 63 286 12 291 9 063 Table 6.8 Turnover of spirits, wine, beer and Alco pops in Norway, in 1000 litres (Source: Statistics Norway, Statistics on alcohol sales, www.ssb.no) According to data from table 6.8, the most consumed alcoholic beverage in Norway is beer, and the main part of this volume is produced locally and sold through the regular grocery retail chains. Beer and spirits produced in Norway are also sold through Vinmonopolet’s stores, where Vinmonopolet has direct contracts with producers. Alcoholic beverages produced abroad are distributed in Norway either through sales representatives of product suppliers or independent importing companies buying the products from the original producer for further re-sell to the retail stores and HoReCa sector. The importers can have contracts either directly with producers, for example small wine farms or distilleries, or they can have contract with distributors, representing the producer. Distributor, also called wine merchant is an intermediary responsible for marketing and sales on behalf of producer locally (Cholette, 2007). The importers often cooperate with several different product suppliers or distributors, and they possess much knowledge about their products. Importers are mainly responsible for marketing and sales of the imported products in Norway. The importers can either distribute a finished product or participate in some parts of production process, for example by being involved in the process of bottle and label design. Some importers work even closer with product suppliers and participate in the process of determining
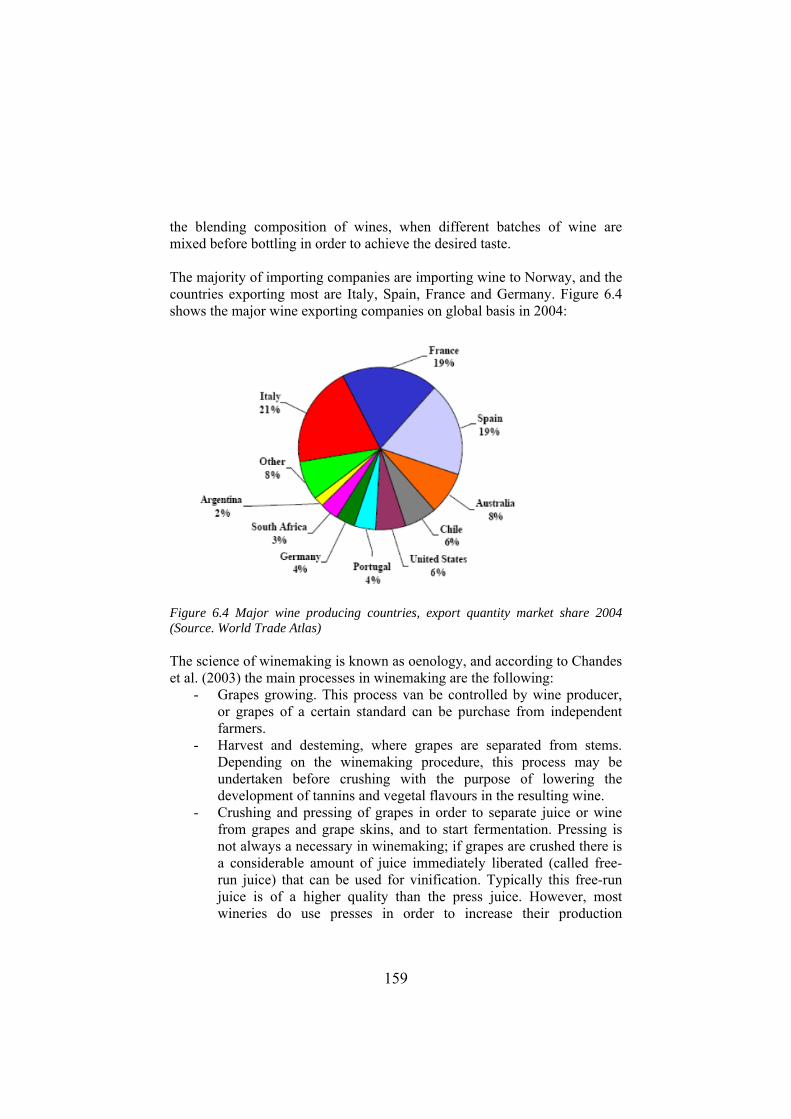
159
the blending composition of wines, when different batches of wine are mixed before bottling in order to achieve the desired taste. The majority of importing companies are importing wine to Norway, and the countries exporting most are Italy, Spain, France and Germany. Figure 6.4 shows the major wine exporting companies on global basis in 2004:
Figure 6.4 Major wine producing countries, export quantity market share 2004 (Source. World Trade Atlas) The science of winemaking is known as oenology, and according to Chandes et al. (2003) the main processes in winemaking are the following:
- Grapes growing. This process van be controlled by wine producer, or grapes of a certain standard can be purchase from independent farmers.
- Harvest and desteming, where grapes are separated from stems. Depending on the winemaking procedure, this process may be undertaken before crushing with the purpose of lowering the development of tannins and vegetal flavours in the resulting wine.
- Crushing and pressing of grapes in order to separate juice or wine from grapes and grape skins, and to start fermentation. Pressing is not always a necessary in winemaking; if grapes are crushed there is a considerable amount of juice immediately liberated (called free-run juice) that can be used for vinification. Typically this free-run juice is of a higher quality than the press juice. However, most wineries do use presses in order to increase their production
160
(gallons) per ton, as pressed juice can represent between 15%-30% of the total juice volume from the grape
- Bulk aging takes several months under special temperature conditions and in special vessels, where the fermentation of wine slowly continues.
- Blending. Different batches of wine can be mixed before bottling in order to achieve the desired taste. The winemaker can correct perceived inadequacies by mixing wines from different grapes and batches that were produced under different conditions. These adjustments can be as simple as adjusting acid or tannin levels, to as complex as blending different varieties or vintages to achieve a consistent taste. Fining agents are used during winemaking to remove tannins, reduce astringency and remove microscopic particles that could cloud the wines.
- Bottling and labelling. At this stage blended wine in bulk condition is bottled and labelled, according to the customer orders. Due to differentiated marketing strategies and customer requirements, the wine that is supposed to be consumed locally and abroad may have different design of bottles and labels. Wine produces may have different postponement strategies in production process. For example, some of producers start bottling process after the customer order is received, and such strategy can increase the lead-time, but it reduces the need for storage place for finished goods. Other producers, especially those who export much, postpone the labelling process, until they get the order from a specific country.
Packaging and transportation operations can be performed internally by wine producers or be outsourced. The trading terms define which trading partner is responsible for transportation and bears the costs. In some situations the importer arranges transportation from the winery, in other situations wine producer can deliver the products to the nearest harbour, from where the importer arranges the boat transportation to Norway. Products are usually delivered in large batches to Norwegian warehouse, from where they are distributed further to the stores and HoReCa customers. Vinmonoplet’s trading terms assume that product suppliers, i.e. producers and importers are responsible for deliveries to the retail stores. The suppliers can either arrange the activities associated with delivering the product to the stores themselves, or they can outsource all or just a part of these activities to the logistics service providers. Private companies have had the right to compete in offering physical distribution and administrative logistics services for alcoholic beverages importers and producers in Norway since 1996.
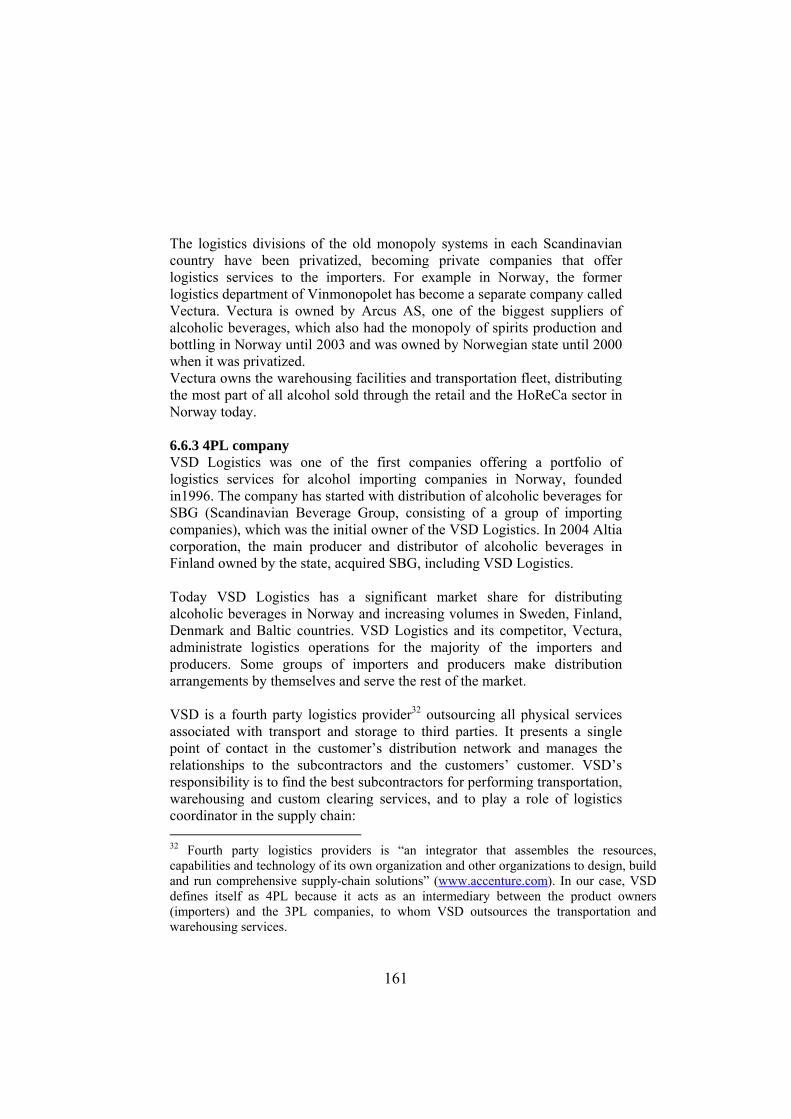
161
The logistics divisions of the old monopoly systems in each Scandinavian country have been privatized, becoming private companies that offer logistics services to the importers. For example in Norway, the former logistics department of Vinmonopolet has become a separate company called Vectura. Vectura is owned by Arcus AS, one of the biggest suppliers of alcoholic beverages, which also had the monopoly of spirits production and bottling in Norway until 2003 and was owned by Norwegian state until 2000 when it was privatized. Vectura owns the warehousing facilities and transportation fleet, distributing the most part of all alcohol sold through the retail and the HoReCa sector in Norway today. 6.6.3 4PL company VSD Logistics was one of the first companies offering a portfolio of logistics services for alcohol importing companies in Norway, founded in1996. The company has started with distribution of alcoholic beverages for SBG (Scandinavian Beverage Group, consisting of a group of importing companies), which was the initial owner of the VSD Logistics. In 2004 Altia corporation, the main producer and distributor of alcoholic beverages in Finland owned by the state, acquired SBG, including VSD Logistics. Today VSD Logistics has a significant market share for distributing alcoholic beverages in Norway and increasing volumes in Sweden, Finland, Denmark and Baltic countries. VSD Logistics and its competitor, Vectura, administrate logistics operations for the majority of the importers and producers. Some groups of importers and producers make distribution arrangements by themselves and serve the rest of the market. VSD is a fourth party logistics provider32 outsourcing all physical services associated with transport and storage to third parties. It presents a single point of contact in the customer’s distribution network and manages the relationships to the subcontractors and the customers’ customer. VSD’s responsibility is to find the best subcontractors for performing transportation, warehousing and custom clearing services, and to play a role of logistics coordinator in the supply chain: 32 Fourth party logistics providers is “an integrator that assembles the resources, capabilities and technology of its own organization and other organizations to design, build and run comprehensive supply-chain solutions” (www.accenture.com). In our case, VSD defines itself as 4PL because it acts as an intermediary between the product owners (importers) and the 3PL companies, to whom VSD outsources the transportation and warehousing services.
162
Transport providers - Inbound- Outb ound
VSD ’s functions:• Negotiations with
service suppliers• IS/IT -solutions and
integration to total supply chain
• Invoicing• Inventory Management
VSD Warehousing providers
IT and factoring service providers
Importers
Retail HoReCa
Figure 6.5 VSD as a logistics coordinator VSD’s customer base consists of 40 different Nordic importers of alcoholic beverages and brand owners (i.e., sales representatives of producers), counting 4500 types of products. Products are delivered from more than 900 supplier locations, and the largest product volumes are coming from France, Italy, Germany, Spain, South-Africa and USA. Importers negotiate purchasing prices and trading terms (Incoterms33) with suppliers. Trading terms define from which geographical location VSD Logistics has the responsibility for arranging transportation of the product from the wine supplier to one of the warehouses in Scandinavia. Currently, there is one warehouse facilitating services for multiple importers in each of the countries VSD operates in. Different transportation modes can be used for inbound transportation (road, rail or maritime transportation). Outbound logistics, i.e., from warehouses to retail stores, is also handled via
33 INCOTERMS or International Commerce Terms, is a set of uniform rules for the interpretation of commercial terms defining the costs, risks, and obligations of buyers and sellers in international transactions. Incoterms deal with the questions related to the delivery of the products from the seller to the buyer, including transportation, export and import clearance responsibilities, who pays for what, and who has risk for the condition of the products at different locations within the transport process.
163
VSD. Outbound shipments from warehouses to retail outlets are delivered by trucks within specific time windows with 24-48 hours order lead-time. VSD selects and subcontracts the 3PL providers for transportation and warehousing for importers, which share these services. VSD obtains better prices for the services from the subcontractors then the importers would do individually by accumulating high volumes coming from many importers. The extensive sub-contracting strategy makes VSD Logistics to one of the largest purchasers of transportation and factoring services in Norway. High volumes consolidated by VSD give possibility to obtain discounts for the services associated with transport, storage and distribution. VSD takes care of all operational decisions including inventory policy, the timing of a purchase, purchasing quantities, and modal choice both for inbound transportation (from suppliers to warehouses), and outbound transportation (from warehouses to retail stores). The company uses an Advanced Warehouse Replenishment Program E3 (from JDA Edwards) to manage inventories and control the stocks. The customers of importing companies, for example Vinmonopolet’s retail shops, place orders directly to VSD on-line or by contacting the customer service department, which sends a request to the warehouse and issues a customer order. An order usually contains products from different suppliers, but VSD issues only one aggregated invoice to the customer’s customer. Billing goes through a special EDI-system to the bank, where the payments are split and sent to the respective suppliers and other receivers automatically. Such a payment system was developed for VSD in order to make the invoicing process easier, less time-consuming and with lower transactions costs for the customers. VSD Logistics has responsibility for integration of the flows of goods, information and billing. The company has invested in many advanced IT-systems, such as inventory management system, accounting and billing system, shipment tracing system, customer interface system for real-life stock-updates etc. In addition, it provides different types of analytical reports on customer’s transactions on request. The customers of VSD share the costs for physical logistics services (in- and outbound transport, warehouse management, custom clearance) according to the quantities of products handled. The contracts with customers have duration of several years, and are usually renewed. In addition, the customers pay so-called “management fees”, constituting the source of revenues for VSD. The management fees are paid per item and not related to
164
the price of the product. The fee is based on the quantity of each product sold and is differentiated according to the annual volumes. The annual volumes are usually based on forecasts. The fees decrease stepwise with increasing of quantity intervals. For example, if the quantity of the product sold during the year is between 0 and 100, the fees are at the highest, but if the annual volume is over 50000 the fee is at the lowest. VSD Logistics offers similar services for producers of other FMCG- products, however the market share for such services is rather limited. 6.6.4 3PL company The warehousing operations for VSD are performed by DHL, a global third-party logistics company with different business areas. DHL performs also warehousing operations for several wine importers that manage inventories and transportation internally. The company offers warehousing and distribution solutions for FMCG, electronics, life style and apparel, pharmaceuticals, electronics, automotive and other industries. The warehousing services are offered by DHL Supply Chain business area, while DHL Express, DHL Freight and DHL Global Forwarding are the business areas performing transportation and forwarding services. The market expansion of DHL’s services has occurred due to mergers and acquisitions during the last decade. In Sweden and Finland DHL’s original business has had roots in transportation, and the warehousing activities appeared as a result of mergers. The main challenge during these merger and acquisition processes is to optimize the new network structure and adjust the capacities and locations of the existing and the acquired facilities. Instead of having several geographically dispersed warehousing locations, DHL tries to implement more centralized facilities structure, trying to consolidate customers at fewer and larger facilities. It is challenging task to develop an infrastructure strategy that takes into account the customized needs of a specific customer’s industry and at the same time remains robust and flexible in case of changes in customers portfolio of DHL. Even though the company is presented in all Nordic countries, the spectrum of activities and the customers vary from country to country:
• Denmark represents a Nordic hub or ”split point” for other Nordic countries because of its geographical position. Electronics (specially consumer electronics) and life style segments are dominating.
• Finland becomes an important “transit point” for distribution to Russia. Electronics and FMCG segments are dominating.
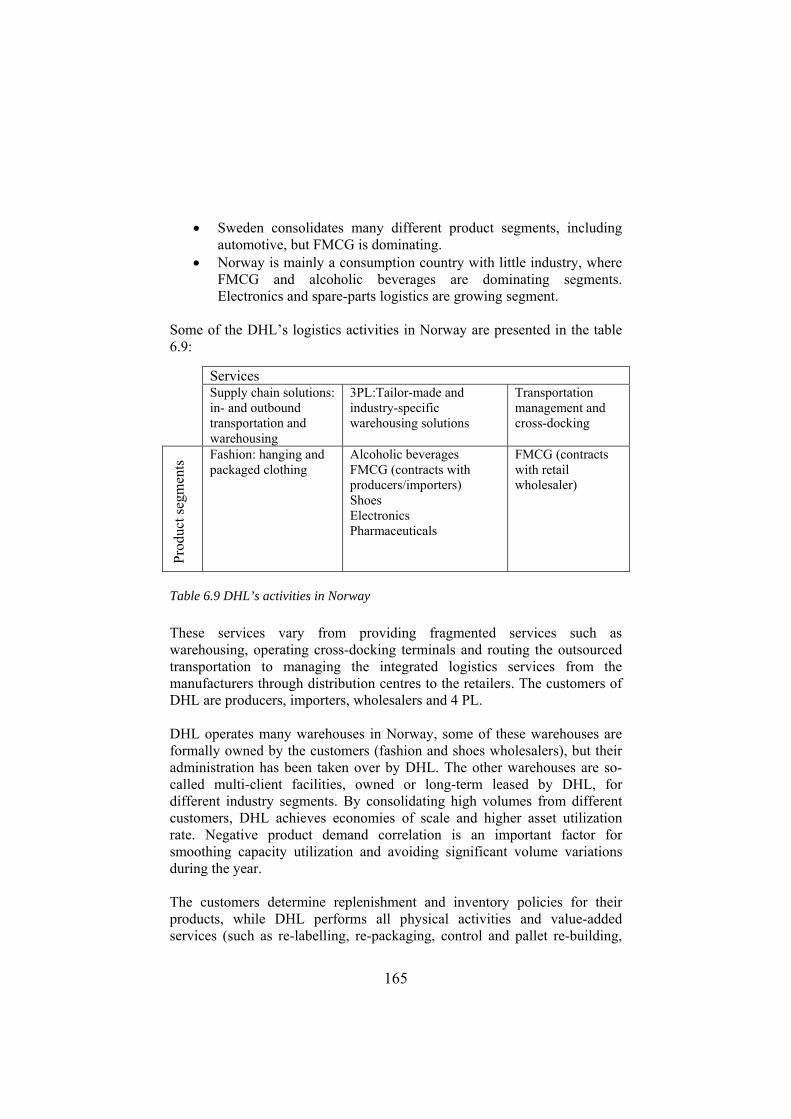
165
• Sweden consolidates many different product segments, including automotive, but FMCG is dominating.
• Norway is mainly a consumption country with little industry, where FMCG and alcoholic beverages are dominating segments. Electronics and spare-parts logistics are growing segment.
Some of the DHL’s logistics activities in Norway are presented in the table 6.9:
Table 6.9 DHL’s activities in Norway These services vary from providing fragmented services such as warehousing, operating cross-docking terminals and routing the outsourced transportation to managing the integrated logistics services from the manufacturers through distribution centres to the retailers. The customers of DHL are producers, importers, wholesalers and 4 PL. DHL operates many warehouses in Norway, some of these warehouses are formally owned by the customers (fashion and shoes wholesalers), but their administration has been taken over by DHL. The other warehouses are so-called multi-client facilities, owned or long-term leased by DHL, for different industry segments. By consolidating high volumes from different customers, DHL achieves economies of scale and higher asset utilization rate. Negative product demand correlation is an important factor for smoothing capacity utilization and avoiding significant volume variations during the year. The customers determine replenishment and inventory policies for their products, while DHL performs all physical activities and value-added services (such as re-labelling, re-packaging, control and pallet re-building,
Services Supply chain solutions:
in- and outbound transportation and warehousing
3PL:Tailor-made and industry-specific warehousing solutions
Transportation management and cross-docking
Prod
uct s
egm
ents
Fashion: hanging and packaged clothing
Alcoholic beverages FMCG (contracts with producers/importers) Shoes Electronics Pharmaceuticals
FMCG (contracts with retail wholesaler)
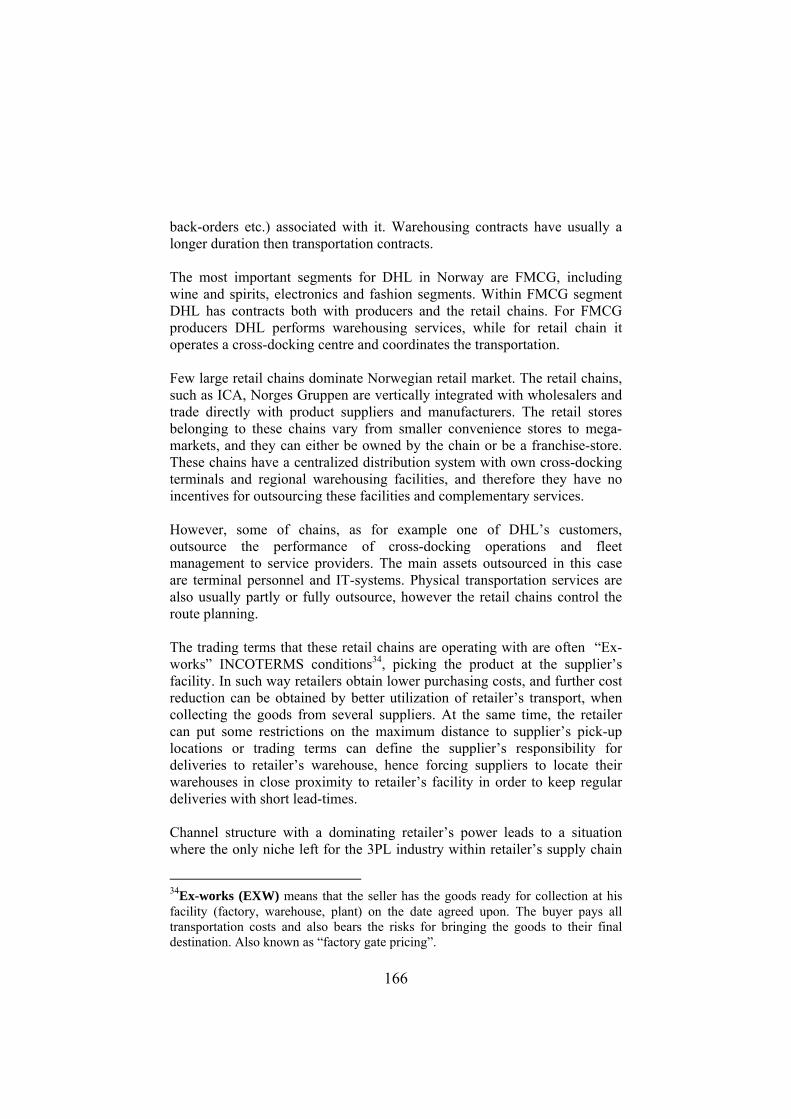
166
back-orders etc.) associated with it. Warehousing contracts have usually a longer duration then transportation contracts. The most important segments for DHL in Norway are FMCG, including wine and spirits, electronics and fashion segments. Within FMCG segment DHL has contracts both with producers and the retail chains. For FMCG producers DHL performs warehousing services, while for retail chain it operates a cross-docking centre and coordinates the transportation. Few large retail chains dominate Norwegian retail market. The retail chains, such as ICA, Norges Gruppen are vertically integrated with wholesalers and trade directly with product suppliers and manufacturers. The retail stores belonging to these chains vary from smaller convenience stores to mega-markets, and they can either be owned by the chain or be a franchise-store. These chains have a centralized distribution system with own cross-docking terminals and regional warehousing facilities, and therefore they have no incentives for outsourcing these facilities and complementary services. However, some of chains, as for example one of DHL’s customers, outsource the performance of cross-docking operations and fleet management to service providers. The main assets outsourced in this case are terminal personnel and IT-systems. Physical transportation services are also usually partly or fully outsource, however the retail chains control the route planning. The trading terms that these retail chains are operating with are often “Ex-works” INCOTERMS conditions34, picking the product at the supplier’s facility. In such way retailers obtain lower purchasing costs, and further cost reduction can be obtained by better utilization of retailer’s transport, when collecting the goods from several suppliers. At the same time, the retailer can put some restrictions on the maximum distance to supplier’s pick-up locations or trading terms can define the supplier’s responsibility for deliveries to retailer’s warehouse, hence forcing suppliers to locate their warehouses in close proximity to retailer’s facility in order to keep regular deliveries with short lead-times. Channel structure with a dominating retailer’s power leads to a situation where the only niche left for the 3PL industry within retailer’s supply chain
34Ex-works (EXW) means that the seller has the goods ready for collection at his facility (factory, warehouse, plant) on the date agreed upon. The buyer pays all transportation costs and also bears the risks for bringing the goods to their final destination. Also known as “factory gate pricing”.

167
is outsourcing of transportation, and operational services at warehousing and distribution facilities belonging to retailers. It makes it difficult for 3PL to take over more of the logistics operations in the downstream part of retailer’s supply chain. However, many product suppliers outsource their logistics operations to a higher degree, than retailers. Suppliers offering brands from different production lines located both locally and abroad often need to consolidate their stocks at one place in order to be able to ship different products together. This is especially important for the suppliers, which do not have high sales volumes or if the volumes are too low to be picked up by a retailer. Logistics operations for such supply chains might be better suited for outsourcing, especially if the products need to be handled in a specific way (for example, frozen food), which requires high investments in handling facilities if logistics operations are performed internally. Product suppliers that are new at the market might also benefit from logistics outsourcing, since the risk associated with uncertain demand will not affect the logistics costs as if the company would establish their own physical distribution services. The fact that the logistics costs become variable, depending on product’s throughput volume, when the services are outsourced, is one of the benefits associated with outsourcing. DHL performs such warehousing services for many product suppliers. For international suppliers delivering products to several Scandinavian countries, where the sales volumes in each country is rather low comparing to the rest of Europe, it can be even more beneficial to centralize distribution, having a warehouse only in one country. 6.6.5 Collaboration between 3PL and 4PL: challenges and opportunities In 2003 DHL and VSD signed an umbrella contract to collaborate in Northern Europe. “The reason for selecting DHL as our collaborative logistics partner is their geographical presence, use of advanced information systems technology and broad knowledge of the FMCG market in the Nordic region”, said the managing director of VSD. “This is a prestigious assignment with a very interesting potential for expansion to other local markets. Expanding our service level for VSD will strengthen our market position in this important market segment. The new partnership will allow both companies to focus on their key competences and extend their leading positions in Northern Europe”, said the managing director of DHL in the Nordic region. Cooperation between the DHL and VSD in several countries can contribute to exploring joint business opportunities in the Scandinavian market in the
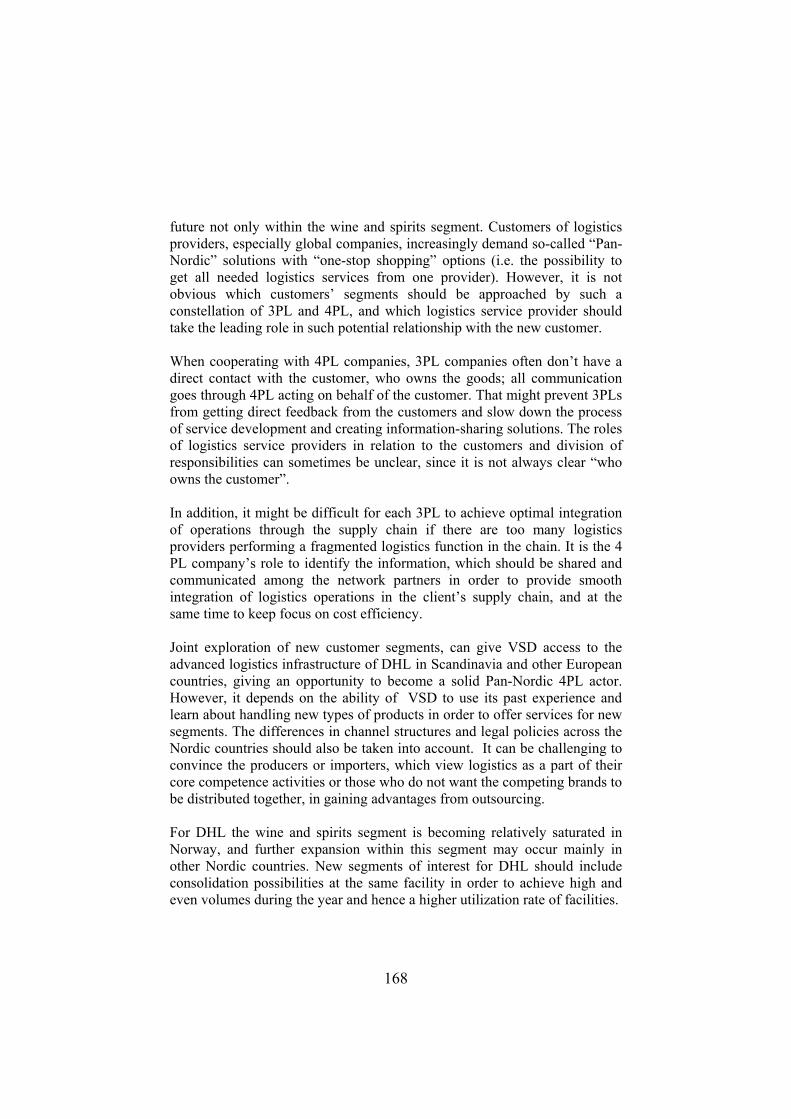
168
future not only within the wine and spirits segment. Customers of logistics providers, especially global companies, increasingly demand so-called “Pan-Nordic” solutions with “one-stop shopping” options (i.e. the possibility to get all needed logistics services from one provider). However, it is not obvious which customers’ segments should be approached by such a constellation of 3PL and 4PL, and which logistics service provider should take the leading role in such potential relationship with the new customer. When cooperating with 4PL companies, 3PL companies often don’t have a direct contact with the customer, who owns the goods; all communication goes through 4PL acting on behalf of the customer. That might prevent 3PLs from getting direct feedback from the customers and slow down the process of service development and creating information-sharing solutions. The roles of logistics service providers in relation to the customers and division of responsibilities can sometimes be unclear, since it is not always clear “who owns the customer”. In addition, it might be difficult for each 3PL to achieve optimal integration of operations through the supply chain if there are too many logistics providers performing a fragmented logistics function in the chain. It is the 4 PL company’s role to identify the information, which should be shared and communicated among the network partners in order to provide smooth integration of logistics operations in the client’s supply chain, and at the same time to keep focus on cost efficiency. Joint exploration of new customer segments, can give VSD access to the advanced logistics infrastructure of DHL in Scandinavia and other European countries, giving an opportunity to become a solid Pan-Nordic 4PL actor. However, it depends on the ability of VSD to use its past experience and learn about handling new types of products in order to offer services for new segments. The differences in channel structures and legal policies across the Nordic countries should also be taken into account. It can be challenging to convince the producers or importers, which view logistics as a part of their core competence activities or those who do not want the competing brands to be distributed together, in gaining advantages from outsourcing. For DHL the wine and spirits segment is becoming relatively saturated in Norway, and further expansion within this segment may occur mainly in other Nordic countries. New segments of interest for DHL should include consolidation possibilities at the same facility in order to achieve high and even volumes during the year and hence a higher utilization rate of facilities.

169
Examples of potential customers’ segments include customers buying from different sources (milk-runs), perishable products, high volumes of small quantity orders, highly valued inventory, spare-parts , health-care, reverse-logistics, etc. On-line shopping is an increasing trend, and this segment becomes a potential market for logistics service providers. According to Skøjtt-Larsen et al. (2006) the following types of logistics providers are likely to dominate in the future:
• Lead logistics providers • Pan-European logistics providers • Niche logistics providers • E-commerce logistics providers.
There is a potential for developing so-called “shopping-malls logistics” services, where products for different shops are handled and delivered by the same logistics company. Innovative use of RFID and other types of high-tech and temperature sensitive services, for example for chemical and pharmaceutical industry can also be a new niche for logistics service providers If DHL becomes a partner for global companies, represented in all several countries, this can require a re-design of the existing infrastructure (number, size and location of warehouses) in order to provide the optimal solution. Economies of scale is an important driver in the logistics business, requiring high volumes and standardization or at least similarities across the product groups handled by logistics actors. The inclusion of new customers depends often on the existing customer portfolio. In order to provide customer-specific solutions there is a need for good knowledge of customers’ needs and their business environment. DHL could also adapt the 4PL concept used by VSD for the existing customers, however there are both risks and advantages associated with adopting a 4 PL model by a 3PL actor:
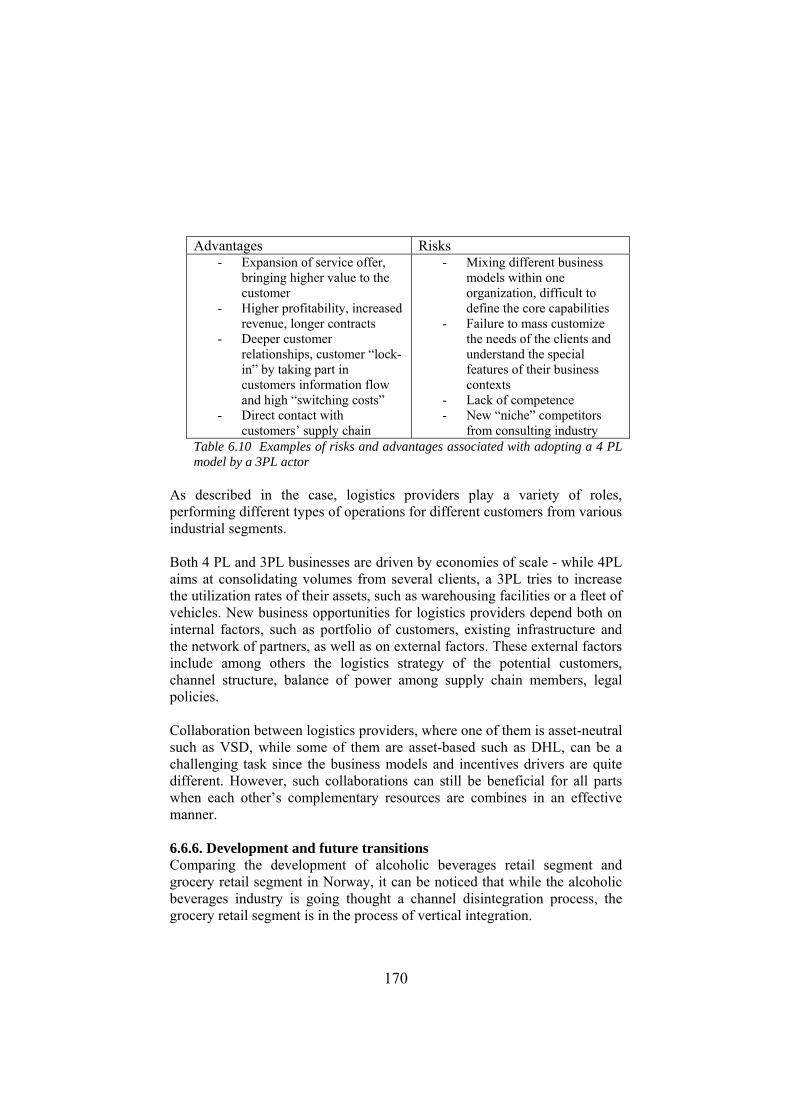
170
Advantages Risks
- Expansion of service offer, bringing higher value to the customer
- Higher profitability, increased revenue, longer contracts
- Deeper customer relationships, customer “lock-in” by taking part in customers information flow and high “switching costs”
- Direct contact with customers’ supply chain
- Mixing different business models within one organization, difficult to define the core capabilities
- Failure to mass customize the needs of the clients and understand the special features of their business contexts
- Lack of competence - New “niche” competitors
from consulting industry Table 6.10 Examples of risks and advantages associated with adopting a 4 PL model by a 3PL actor
As described in the case, logistics providers play a variety of roles, performing different types of operations for different customers from various industrial segments. Both 4 PL and 3PL businesses are driven by economies of scale - while 4PL aims at consolidating volumes from several clients, a 3PL tries to increase the utilization rates of their assets, such as warehousing facilities or a fleet of vehicles. New business opportunities for logistics providers depend both on internal factors, such as portfolio of customers, existing infrastructure and the network of partners, as well as on external factors. These external factors include among others the logistics strategy of the potential customers, channel structure, balance of power among supply chain members, legal policies. Collaboration between logistics providers, where one of them is asset-neutral such as VSD, while some of them are asset-based such as DHL, can be a challenging task since the business models and incentives drivers are quite different. However, such collaborations can still be beneficial for all parts when each other’s complementary resources are combines in an effective manner. 6.6.6. Development and future transitions Comparing the development of alcoholic beverages retail segment and grocery retail segment in Norway, it can be noticed that while the alcoholic beverages industry is going thought a channel disintegration process, the grocery retail segment is in the process of vertical integration.

171
Alcoholic beverages channel was highly integrated within monopoly system, i.e. the spirits production and bottling in Norway, wholesaling and retail was a part of the same organization owned by the state. Since 1996 the wholesaling part has been privatized and a variety of wholesalers have appeared at the market, then in 2003 the monopoly of spirits production and bottling was cancelled, leading to appearance of new local producers. The logistics function in monopoly system was performed internally until 1996, when also new logistics service providers serving this segment appeared at the market. Product suppliers can therefore choose between performing logistics operations internally and outsourcing them to logistics service providers. Some wholesalers prefer to keep inventory control and distribution planning, while outsourcing all physical logistics services to 3PLs. These wholesalers either outsource logistics services on individual basis or they cooperate with other wholesalers and outsource logistics services on a group basis in order to obtain volume discounts. Other wholesalers outsource all logistics activities, including planning, to 4PLs like as VSD or to lead logistics providers like Vectura, which was originally the internal logistics division of the old monopoly system. The result of the disintegration process in alcoholic beverages industry is the appearance of differentiated logistics arrangements. At the same time, grocery retail industry has gone through an intensive vertical integration process, where wholesalers and retailers became one organization at the end of 80s – beginning of 90s. There has also been an intensive horizontal integration process where independent retail stores have been taken over by retail chains, resulting in the dominance of few big retail chains on today’s retail market in Norway. Before the channel integration process, it was traditionally the suppliers’ responsibility to deliver the products to the stores. Retail chains have gradually started to take over logistics control due to increased price competition. They have started to open their own distribution centres, where suppliers delivered the products, and began to operate a fleet of vehicles to supply the stores from the distribution centres. After the wholesalers have been merged with retail, there has been a power balance shift from the producers to retailers. Today retailers try to control not only the outbound flows from the distribution centres to the stores, but also the inbound flows from the product suppliers to the distribution centres. In order to achieve cost efficiency,
172
grocery retailers have started to centralize and re-design the whole distribution structure, increasing the use of cross-docking. During the channel integration phase retailers have taken over logistics facilities belonging to the wholesalers. Due to the fact that grocery retail chains have their own network of logistics facilities, it becomes difficult for logistics service providers to take over some of functions. At the same time, retail chains outsource the operational services, such as transportation and administration of warehousing facilities. Grocery retailers still keep control of the physical distribution planning, however they use logistics service providers to perform the operational services, in this way the retailers achieve channel control without additional capital assets. Many of the logistics service providers serving retail industry have originated from the wholesaling organizations, for example due to ownership structure like in VSD case, or as a result of take over of wholesaler’s facilities by a 3PL company. There are different scenarios for the future development of logistics service providers within the alcoholic beverages segment. If the channel disintegration process results in privatization of retail segment, which is now owned by the state, there is a high probability that regular grocery chains might take over distribution of alcoholic beverages, selling them through the same channel as grocery products. In other European countries, for example in France, almost 70% of alcoholic beverages are sold through retail chains (Chandes et al., 2003). When selling alcoholic beverages through the retail chains, the distribution arrangements can still be differentiated for different types of these products. For example within wine sector, there are branded wines, store brands and high quality wines, so-called “Grand Crus”. The branded wines are wines that have been blended from several winemakers, and are sold by wine merchants, as their own brand products. Wine merchants are channel intermediaries that act as wholesalers or distributors on behalf of wine producers. When selling brand wines, these intermediaries act as producers, which outsource their production process to winemakers. Branded wines can be sold by competing retail chains, and the retailers work with wine merchants in the same ways as with other brand product suppliers. Depending on the sales volume of particular brands, either the wine merchants or the retailers can be responsible for making logistics arrangements.
173
The store brands represent wine products that are developed and produced for a specific retail chain. Retail chains communicate directly with wine producers, participating in product design and bypassing the wine merchants. In this case retailers heavily rely on their own logistics resources for distributing store brands, which can represent up to 30% of total sales volume of wine products sold by a retail chain. The Grand Cru wines are high quality products with a price level, which is higher than the average. There is a high risk associated with selling this product, and there are wine merchants that specialize on promoting this type of products both for retail chains and other customers, for example HoReCa. Based on this example of wine supply chains, it can be assumed that even if retail chains in Norway would take over the distribution of alcoholic beverages, there would be differentiated logistics arrangements depending on the type of product. Another scenario is a consolidation process among alcoholic beverages wholesalers and producers. As a result of mergers and acquisitions this may lead to creation of few large wholesalers groups in Norway. In this case, because of consolidation of high sales volumes within wholesaling company, the creation of internal logistics department might be possible. However there still be a niche for logistics providers, 3PL for internal logistics division as well as for 4PL serving small importers.
6.7 Concluding discussion Information technology is considered as a major safeguard and a central coordination medium in the management of the food retail chain (Bourlakis and Bourlakis, 2005). According to transaction costs theory, a retailer decides whether to outsource distribution functions, including transportation and warehousing, based on his perception the logistics asset specificity (Bourlakis, 1998). The fourth-party logistics provider acts as a network integrator for product suppliers, wholesalers, retailer and 3PLs. 4PLs use information technology for not only for coordination, but also for monitoring the third-party logistics firms’ performance. The next stage of 4 PLs service development process could be the inclusion of other logistics-related information technology applications that optimize the use of retail store sales space, stock models used to minimize stocks.
174
The acceptability of fourth-party logistics providers as the primary co-ordinating medium within the channel by other channel members is still one of the biggest challenges. Retailers need to be aware of the potential role of the fourth-party logistics providers and their capabilities for absorbing operational complexity. Combinations of companies are able to meet customer requirements in a more efficient and better way than individual companies can realize. The need to collaborate can be illustrated by a statement of the Food Management Institute: “To be a prime participant in the consumer replenishment process, requires a range of capabilities bigger than a single enterprise” (Bourlakis, 1998). References: Analytiqa report (2007): “Western European Logistics: Charting growth trends in logistics markets”, www.analytiqa.com. Balakrishnan A., Natarajan H., Pangburn M.(2000): ”Optimizing Delivery Fees for a Network of Distributors”, Manufacturing & Service Operations Management, Vol. 2(3), pp.297-317. Barry C. (2002), ”One warehouse or two?”, Catalogue Age, March, Vol. 19(3). Battezzati L. and Magnani,R.(2000): “Supply chains for FMCG and industrial products in Italy”, International Journal of Physical Distribution & Logistics Management, 2000, Vol. 30 Issue 5, pp.413-25. Bourlakis M.(1998): ”Transaction costs, internationalization and logistics: the case of European food retailing”; International Journal of Logistics: Research and Applications; 1998 Vol. 1 Issue 3, pp.251-264. Bourlakis, C., Bourlakis, M. (2005):“Information technology safeguards, logistics asset specificity and 4th party logistics network creation in the food retail chain” Journal of Business and Industrial Marketing, Vol. 20, No. 2/3, pp. 88-98. Braithwaite A. and McKinnon A.(2003): “Retail Trends Affecting Sustainable Distribution”, Logistics and Transport Focus, Vol. 5 (3), pp.56-60. CapGemini, Georgia Tech and Fedex (2004, 2006): ”3PL: Results and Findings of the Annual Study”, www.capgemini.com. Cooper, J., Browne, M., Peters, M. (1991),”European Logistics: Markets, Management and Strategy”, Blackwell, Oxford. Chandes J., Estampe D., Berthomier R.: ”Logistics performance of actors in the wine supply chain”; Supply Chain Forum: An International Journal, Vol.4 (1), 2003.
175
Cholette S. (2007): ”A Novel Problem for a Vintage Technique: Using Mixed-Integer Programming to Match Wineries and Distributors” Interfaces, May/Jun2007, Vol. 37 Issue 3, pp.231-239. Cuthbertson R., Isle G. (2006), ”What will the best retail supply chain look like in the future?”, European Retail Digest, Issue 50, pp.7-15. Datamonitor (2004), “ Retail Logistics in Europe”, Retail Logistics Industry Profile: Europe, May, pp.1-15. Eco4Log (2005), “Analysis of shipping systems and service portfolio of transport chain operations”. Fernie J., Pfab F., Marchant C. (2000):”Retail Grocery Logistics in the UK”, International Journal of Logistics Management, Vol. 11(2), pp.83-93. Fernie J. (1998): “Retail Change and Retail Logistics in the United Kingdom: Past Trends and Future Prospects” , Service Industries Journal, Vol. 17 (3), pp.383-396. Fong M.(2005): ”New models in Logistics Network Design and Implications for 3PL Companies”, PhD dissertation. Pache G. (1998), “Retail logistics in France: the coming of vertical disintegration”, The International Journal of Logistics Management, Vol. 9(1), pp.85-93. Sulogtra (2002): “European Commission Study of Effects on Transportation of Trends in Logistics and Supply Chain Management”. Skøjtt-Larsen T., Schary P., Mikkola J., Kotzab (2006): ”Managing the Global Supply Chain”, Copenhagen Business School Press, Liber.

176

177
PART III DISTRIBUTION NETWORKS IN TRANSITION – SOME THEORETICAL ISSUES
In Part III of this report, we have chosen to follow up each of the case studies by a specific theoretical analysis. Thus it contains three chapters, also related to three areas of interests (see chapter 3). In chapter 7 value creation in car distribution in discussed and analysed. The waste management setting
is followed up by a chapter on coordinated action in reverse distribution system (chapter 8). Finally, in chapter 9 the FMCG setting is followed up by
a paper on a lot-sizing model. Each of these topics is closely related to the dissertations.

178
179
CHAPTER 7 Value Creation in Car Distribution: A view from
three theoretical lenses35
Leif-Magnus Jensen and Bente Flygansvær
In this paper we discuss value creation in distribution networks. A company that takes part in a distribution network will contribute to value creation quite differently depending on how it is viewed. We look at three different perspectives – the resource-based view, transaction cost analysis and value networks. These theoretical perspectives differ with regard to both the unit of analysis and the most important variables they examine. In this article our main objective is to see how the theories can be employed to analyze value creation in one particular case, and what type of questions they can answer. We present the case of a car logistics firm that provides transport and associated services to the car distribution sector in Norway. The company deals with importers and car dealers, who select what services to use from its portfolio. Therefore the value that the car logistics firm contributes varies across relationships. What is then the best way to analyse its value creation? In using the case to guide our analysis, we see clearly that the three different theoretical perspectives provide quite different answers. We are left pondering whether these perspectives adequately capture value creation for logistics companies.
7.1 Introduction Value creation and sustainable competitive advantage (SCA) are recurrent themes in business literature. In several large streams of strategy research, notably Porter (1980, 1980) and the resource-based view (Barney 1986, 1991; Conner & Prahalad, 1991), achieving SCA for the firm is the goal of strategy. In general value creation is a precursor to SCA – i.e. a firm must create value in order to be in business. In order to be competitive, it must create value on a par with its competitors. To have a competitive advantage, it must provide more value than the competition. This is of course a fairly simple view of the relationship between value creation and SCA, but it is only presented here to position value creation as one of the pillars of SCA. 35 Paper presented NOFOMA, Oslo, 2006.

180
There are many ways of looking at value creation. In this paper, we explore value creation for Carlog, a logistics service provider to the car distribution sector. Since Carlog provides a different set of services for each of its customers, we look at the implications for value creation, and what different literatures have to say about this. The three literatures we use are the resource-based view, transaction cost analysis, and the value network as presented by Stabell & Fjeldstad (1998). There are overlaps between the different literatures, but thinking about value creation from different points of departure lead to a focus on different variables. We are not trying to compare three different literatures directly. Rather, we start with a particular case, and draw on theory to help us analyze its various aspects.
7.2 Theoretical Perspectives on Value Creation Strategy – Resource-based View The main purpose of certain parts of the strategy literature is to investigate or determine factors that result in SCA for a focal firm. This can be done in several ways, but typically involves comparing certain attributes of the firm with the environment it operates in. Whether the firm is successful is then dependent on the match between these attributes and variables in the environment. In this paper we use the resource-based view as one part of the strategy literature employing this kind of thinking. The resource-based view states that the competitive position of a firm in a particular industry is determined to a great extent by the resources it possesses. Resources are broadly defined:
“…firm resources include all assets, capabilities, organizational processes, firm attributes, information, knowledge, etc. controlled by a firm that enable the firm to conceive of and implement strategies that improve its efficiency and effectiveness.” (From Daft, 1983, in Barney, 1991, p.101).
This is not to say that other considerations such as marketing strategy are irrelevant, but that all things being equal the competitive position is determined by the resources possessed, and further that a good strategy is one making the best use of the firm’s resources. The possession of resources in themselves does not guarantee SCA, and the RBV goes further in specifying the qualities a resource must possess in order to form the basis for a SCA, namely:
(a) it must be valuable, in the sense that it exploits opportunities and/or neutralizes threats in the firm’s environment (b) it must be rare among a
181
firm’s current and potential competition, (c) it must be imperfectly imitable… (Barney, 1991, pp.105-106). In the updated framework, the last part is organization: “Is a firm organized to exploit the full competitive potential of its resources and capabilities?” (Barney, 1997, p.145) This is often expressed as VRIO: Value, rareness, limitability and organization. It is useful in this connection to discuss each element of VRIO framework. To say a resource has to be valuable risks tautology in this setting because value creation is then dependent on having valuable resources. Expressed differently, however, value creation in the resource-based view is about using the firm’s resources to exploit opportunities and neutralize threats. Resources that cannot be used for this do not contribute to value creation for the firm. Opportunities will often be related to providing a good or service to a customer or satisfying a need in the market. The next three elements of the VRIO definition are strongly related to the concept of SCA. Resources must be rare, in essence meaning that few competitors possess them. Rarity means that there is a premium paid for services or goods produced with the resources because demand is not satisfied at normal equilibrium prices. This also means that rarity affects value creation for the firm – a rare resource tends to create more value than one that is less rare to the extent that it leads to a price premium. The thinking is the same if the rare resource enables a firm to reduce its production cost – if many other firms can do the same then the margin will not be improved under competition. The demand that resources must be inimitable to create SCA is central to the resource based view, and one of the differences with for example Porter (1980,1990). This requirement essentially means that it is not possible for other firms to copy a particular resource at reasonable cost. There are three main reasons why this may be the case. Firstly, the resource may depend on unique historical conditions, which were not planned for, such as occupying a particular position in the market or access to information at an early stage. Secondly, the link between resources and outcomes may be causally ambiguous so that it is unclear what resources other firms will have to copy to emulate the focal firm. Thirdly, the resource may be socially complex, representing a unique firm culture or a social dynamics in the firm (Barney, 1991). In the last case, it may be very difficult to copy the culture both because it develops over time and has developed because of historical conditions (Nelson & Winter, 1982), and because attempting to change an organization’s culture may result in the subjects reacting to being
182
manipulated. The final requirement is that a firm must have the organizational capacity to make use of or mobilize the resources it possesses. This focus on VRIO resources has recently been challenged to a degree from within the RBV itself. Miller (2003) reports findings to the effect that firms will frequently start working from asymmetries in their resource bases compared to other firms. These asymmetries cannot initially be classified as valuable, but can be the basis for developed VRIO resources. In this conception, then, it is precisely the difficulty in copying a firm’s resources that is the most relevant issue. Miller further points out that on a theoretical level it may be exactly the difficulty in imitating a particular capability that makes it valuable, since it would otherwise be copied to such a degree that any unusual rents are competed away. The resource-based view has been expanded in several directions, and it may also be said that there are several “schools.” Conner & Prahalad (1996) for example have focused on knowledge as a central asset for the firm and have developed a theory of the firm on the basis of this. One of the difficulties in the RBV has been explaining how resources are developed and changed over time, i.e. how do some firms come to have VRIO resources. The Dynamic Capabilities literature seeks to explain this by focusing not only on the resources possessed by the firm (first-order resources), but also on the firm’s ability to act upon and change its current stock of resources (second-order resources) (Eisenhardt & Martin, 2000; Helfat & Peteraf, 2003; Winter, 2003). For car distribution, with substantial changes expected in the next few years, this is certainly a relevant perspective. The resource-based view of strategy, although focusing on SCA, has clear implications for the concept of value creation. The strength of a firm’s competitive position and its value creation potential is largely given by the set of resources it possesses and the attributes of these. The attributes such as the rarity of resources, although dependent on the qualities of other firms, are defined at the level of the firm. It is not necessary to investigate the details of the market if the context variables are known. The wants and needs of the customer are reflected in the context variables, so that it is not necessary to investigate the relationship between the focal firm and specific customers. The Dynamic Capabilities view adds some nuance to this picture, however, since it is not only what resources a firm possesses but its ability to change these that will determine SCA in the future. Miller (2003) finds that firms achieve SCA through working from asymmetries in their resource base compared to other firms, and that these asymmetries cannot necessarily be said to represents strengths initially. In other words a firm may profit more from turning its uniqueness into an advantage rather than building upon its existing VRIO resources.

183
Transaction Cost Analysis Treating the environment as a set of context variables is one approach to firm strategy. It does not mean that the environment is ignored, but rather implies a belief that it can be adequately classified using various context variables. A second approach is to look at the relations between firms and to see what qualities of the relation mean for how the firm should act. This reduces the problem to a dyadic structure where the features of the relation itself are the most important aspect. There are two main elements. One is that the source of value creation is specialization in terms of resources invested in facilities and training. These resources can be the result of specific investments by one of the parties or of co-development between both parties. The second aspect is that there are a number of governance issues that arise in this type of situation. “Thus not only does TCE name the transaction as the basic unit of analysis, but governance is the means to infuse order, thereby to mitigate conflict and realize mutual gains” (Williamson, 2005, p.25). Problems related to specific investments and how to create governance forms to deal with this is discussed extensively in the transaction cost economics literature (Williamson, 1975, 1981, 1991). TCA deals primarily with the boundaries of the firm, in particular with regard to safeguarding against opportunism36. The decision to be made is whether to carry out activities in-house (hierarchy), to buy them in the marketplace, or to employ a hybrid form such as strategic alliances or relational contracts. This has also been described as relying on price, trust or authority as governance mechanisms (Bradach & Eccles, 1989). An underlying assumption is that the production cost tends to be lower in the market because of strong incentives to achieve efficiency in order to be competitive. Important variables in this framework are the degree of specific investments that need to be made, the frequency of transactions, and the uncertainty of the environment. Williamson himself describes this as “…the comparative contractual approach to economic organization in which economizing on transaction costs is treated as the main case” (Williamson, 2005). The relevance of TCA to value creation has been discussed by Ghosh & John (1999). Using the Coase theorem as a building block they start with the basic assumption that firms will pursue opportunities for value creation whenever possible, given that they are able to reap sufficient of the value creation for themselves. Firms simply compare their expected gain from a particular value creation opportunity with the alternatives in order to decide
36 Defined as self-interested behaviour “with guile,” as opposed to “economic man” who is self-interested but always honest.
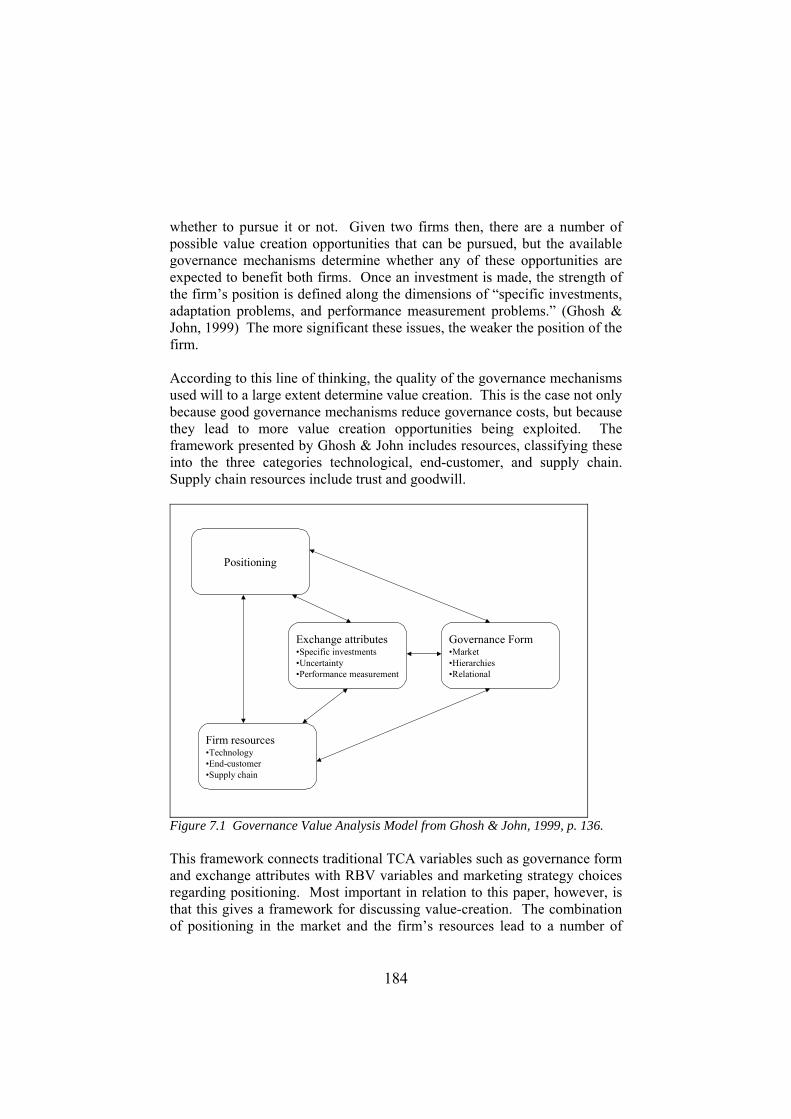
184
whether to pursue it or not. Given two firms then, there are a number of possible value creation opportunities that can be pursued, but the available governance mechanisms determine whether any of these opportunities are expected to benefit both firms. Once an investment is made, the strength of the firm’s position is defined along the dimensions of “specific investments, adaptation problems, and performance measurement problems.” (Ghosh & John, 1999) The more significant these issues, the weaker the position of the firm. According to this line of thinking, the quality of the governance mechanisms used will to a large extent determine value creation. This is the case not only because good governance mechanisms reduce governance costs, but because they lead to more value creation opportunities being exploited. The framework presented by Ghosh & John includes resources, classifying these into the three categories technological, end-customer, and supply chain. Supply chain resources include trust and goodwill.
Exchange attributes•Specific investments•Uncertainty•Performance measurement
Firm resources•Technology•End-customer•Supply chain
Positioning
Governance Form•Market•Hierarchies•Relational
Figure 7.1 Governance Value Analysis Model from Ghosh & John, 1999, p. 136. This framework connects traditional TCA variables such as governance form and exchange attributes with RBV variables and marketing strategy choices regarding positioning. Most important in relation to this paper, however, is that this gives a framework for discussing value-creation. The combination of positioning in the market and the firm’s resources lead to a number of
185
possible value creation opportunities when paired with the resources of other firms, but whether these are exploited depends on the exchange attributes and on how the relation can be governed. This connection between firm resources and governance has been explored further by a number of authors (Kor & Mahoney, 2006; Jacobides & Winter, 2005; Makadok, 2003). Jacobides & Winter explore how resources and governance mechanisms are intertwined and develop over time, i.e. tying the type of thinking shows in figure 1 above to the dynamic capabilities field. Makadok (2003) explores the interplay between having the right resources and using the right governance mechanisms, on the thinking that it is only when a firm has access to both simultaneously that it will accrue significant economic rents. This is a significant contribution to tying the resource-based view and TCA together, since it implies that only investigating one of them will not explain why some firms achieve superior economic rents. For the purpose of this particular article, however, the literatures will be kept separate.
Value Networks A final approach to strategy is based on the assumption that it is the structure of ties between firms overall that determines the competitive position of a firm. That is, value is created through the links operating between a set of firms. Thompson describes this as a mediating technology (Thompson, 1967). Whereas this type of technology is formulated in a general way in Thompson, it has been used by Stabell & Fjeldstad (1998) as the basis of their value network. Significantly “The mediating technology facilitates exchange relationships among customers distributed in space and time. The firm itself is not the network. It provides a networking service.” (Ibid, p.427) The three main task for a provider is network promotion & contract management, service provisioning and infrastructure operation.
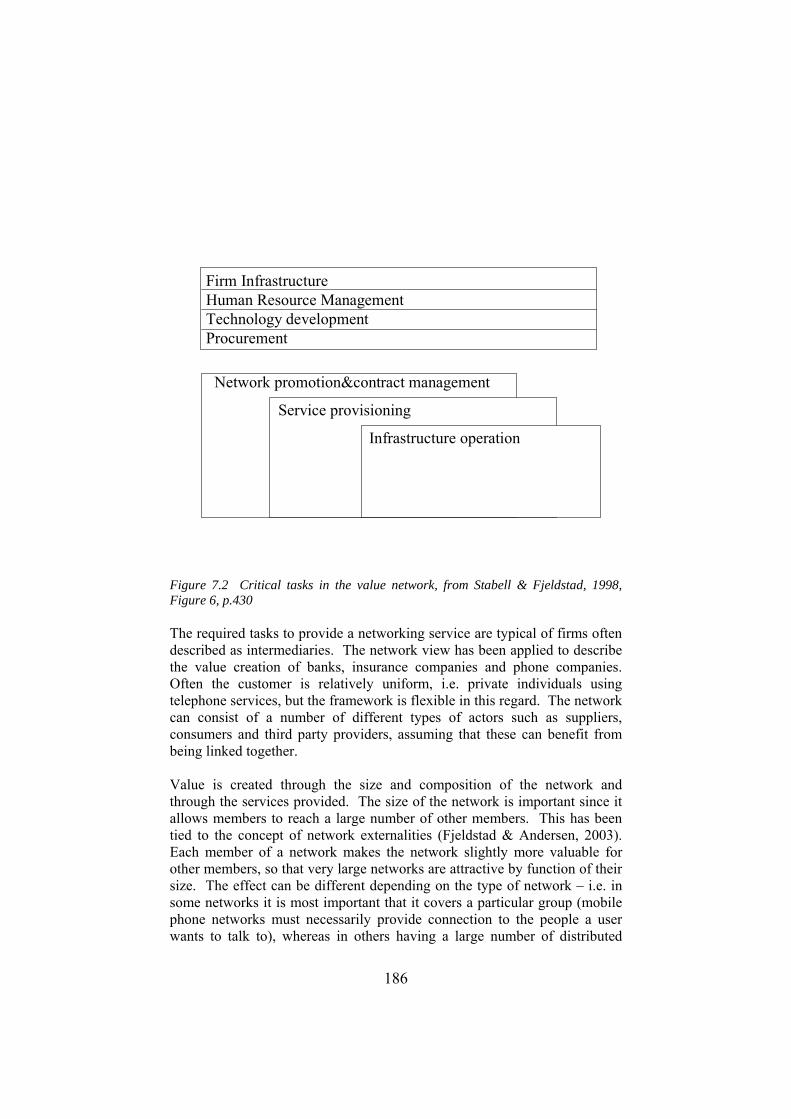
186
Firm InfrastructureHuman Resource ManagementTechnology developmentProcurement
Network promotion&contract management
Service provisioning
Infrastructure operation
Figure 7.2 Critical tasks in the value network, from Stabell & Fjeldstad, 1998, Figure 6, p.430 The required tasks to provide a networking service are typical of firms often described as intermediaries. The network view has been applied to describe the value creation of banks, insurance companies and phone companies. Often the customer is relatively uniform, i.e. private individuals using telephone services, but the framework is flexible in this regard. The network can consist of a number of different types of actors such as suppliers, consumers and third party providers, assuming that these can benefit from being linked together. Value is created through the size and composition of the network and through the services provided. The size of the network is important since it allows members to reach a large number of other members. This has been tied to the concept of network externalities (Fjeldstad & Andersen, 2003). Each member of a network makes the network slightly more valuable for other members, so that very large networks are attractive by function of their size. The effect can be different depending on the type of network – i.e. in some networks it is most important that it covers a particular group (mobile phone networks must necessarily provide connection to the people a user wants to talk to), whereas in others having a large number of distributed
187
members is more important (for example an insurance company). The quality of the members is also important. A good network consists primarily of members who can contribute to the network. An example is insurance companies, who try to exclude those who carry an excessive insurance risk from membership. The set of services offered contributes to the value created by the ways in which it ties network members together. The underlying logic is that providing a broad range of services and access to a large network creates more value than a narrow range of services provided to a small network, assuming that the services themselves are wanted. The focal firm creates value by enabling this network to operate and making the services available to network members. This conception is different from for example the industrial network conception (Håkansson & Snehota, 1995), where the firm is part of the network. The focus is both on the firm and the services it provides, and the characteristics of the network of customers. There are significant dynamics in the network, especially when trying to establish a new network, as has been demonstrated in the case of mobile phone operators in Europe (Fjeldstad, Becerra & Narayanan, 2004).
7.3 The Case The data used herein are exclusively from the ongoing project “Distribution Networks in Transition,” where value creation in distribution is one of the project themes. The project has a 3 ½ year duration and is funded jointly by the Norwegian Research Council and 5 participating firms. The participating firms agree both to provide part of the funding and to make themselves available as objects of study for the project. Three different industries are involved – recycling of electrical goods, fast moving consumer goods and car distribution. This case is based entirely on the car distribution sector. The sector itself is experiencing substantial changes due to pressures from the EU for more competition in the retail segment. This makes the domain itself interesting for study. The expected increased pressure on margins makes the question of how to analyze value creation particularly relevant. After initial meetings to explain the scope of the project and obtain agreement from the firms, we proceeded with interviewing key personnel in the participant firm. Interviews were made according to an interview guide developed on the basis of the categories of actors, resources and activities, but this was mainly used to structure the interviews when necessary and to operate as a checklist of which topics to cover, rather than as a set of
188
questions for the firms to answer. The firms were asked to identify their most important counterparts, and in this sense identified the network surrounding the firm. Interviews were then carried out with one or several individuals in each firm, in a free flowing format, with the main aim being to gather as much information as possible about the business, whilst touching on all the elements in the interview guide mentioned above. The interview notes were then typed by one person, and circulated so the other project members could add from their own notes or comment upon the interpretation. Finally, this document was translated into a “case background” document in English, where the information was reformatted according to a set structure covering general information and the elements from the interview guide. An original set of 7 interviews formed the background for this initial document, which was presented back to the firms for feedback and comments. The case background covered basic data on each firm, information on what services it offers to customers (broken into activities), the most important counterparts, as well as important infrastructure. This information was supplanted with data from webpages and annual reports where appropriate. The case data was updated after feedback from the firms. In the following sections we look at three parts of Carlog’s activities: The transport services provided, pre-delivery inspection and car modification (rebuilding). These three services do not cover the whole range of Carlog’s activities, but provide illustrations that can be used to show the use of the different theories.
Carlog AS Carlog AS is a logistics service provider that provides services to the car distribution sector. The company is based in the port of Norcity, Norway. The services include transport, rebuilding of cars, pre-delivery-inspection (PDI), handling and storage. Transport accounts for roughly half of the annual turnover, which is in excess of 200 million NOK. Carlog has parking facilities for 8,000 cars, of which 3,800 under roof. Other resources include trucks, railway wagons and workshop facilities. In addition, location is an important resource for Carlog. Being close to the port is an issue as most of the cars arrive by ship. In addition, there are railway tracks into the harbour, making the operations more convenient. The company Carlog has 135 employees. Many of the operations are similar across different brands of car, allowing for potential advantages of scale. Carlog’s main market is Norway. That is, the companies importing and distributing cars in Norway. The market for new cars is approximately 120.000 in Norway each year. Most of the cars
189
arrive in Norcity, except from three importers. JapanCar consolidated the hub from the Nordic market in Malmø in 2003, and moved the Norwegian volume from Norcity. Carlog has been given the task of transport from Malmø to the Norwegian market. The importer of EurCar imports their volume in Oslo, and Carlog provides transport services from Oslo. USCar imports volume to three sites in Norway, including Norcity, Oslo and Fredrikstad. Carlog is the logistics service provider for USCar in all locations. Carlog has Nordic growth ambitions, and have recently bought SWPDI (A Swedish-based Pre Delivery Inspection Operation) to strengthen its position in the Nordic market. In the following sections we look at three parts of Carlog’s activities, the Services, its business relationships and the network.
Carlog’s Services The primary business of Carlog is transport of new cars. Carlog has 80% of the market for car transport services in Norway. Cars either arrive at Norcity Port on feeder ships carrying 300-500 cars, or they are shipped to Sweden (Malmö) and then moved to Norcity Port by rail and road. Within Norway, the majority of transport takes place by road, but there is also rail transport from Oslo to other major cities (approximately 30%). Transport of used cars and cars for recycling are potential growth areas. The majority of car transport is directly related to car dealers, either bringing finished cars to the dealers or from dealers to other dealers. The number of car dealers in Norway is relatively large (hundreds). Carlog has two types of deals with respect to transport services. For exclusive deals, the deals are signed with the importer or manufacturer, and all dealers are obliged to use Carlog for all their car transport requirements. For non-exclusive deals, individual dealers can decide what transport firm to use for their transports, and Carlog has to negotiate a deal with each dealer. Carlog owns a number of specialized trailers and railway wagons suitable for transporting cars. However, driving the trailers is subcontracted out to a number of one and two person firms. These firms provide the manpower for the transports, and tend to own their own rigs. In principle a rig can be used for almost any road-based transport task. It is therefore an important task to secure availability of rigs, and to make sure they provide a reliable service. Pre-delivery inspection is a set of activities that involves making the car ready for the customer. Pre-delivery inspection consists of removal of transport protection on the car (such as plastic strips to protect corners, de-
190
waxing as some cars are covered in protective wax when they leave the factory), washing and polishing, as well as internal cleaning. It also includes installations of optional extras such as hi-fi systems, or equipment such as tow bars and various interiors. PDI must by its very nature be carried out close to the final customer, to avoid the car being unprotected for a significant period of time. There is however a trend towards carrying out PDI on a regional level. Therefore the last transport needs either to be closed (closed railway wagons or trucks), or a last cleaning at the dealers is needed. Long transports and long time in storage are more risky when the protection is removed. The market for PDI services is fragmented. Mainly, the dealers perform these services themselves, because there is a great deal of potential turnover in the sales and mounting of equipment. However, there is a growing market for buying these services. All new cars must however undergo PDI, meaning that the market is directly related to the number of new cars sold each year. Carlog is therefore increasing their market for these services, but it also includes holding inventory of equipment for cars. Carlog has made a significant investment in specialized equipment for this. A centrepiece in this is the automated machine for de-waxing of cars. This machine has a capacity of 30,000 cars a year, and recycles 85% of the water and 70% of the chemicals used. The recycling percentage is considered a selling point because smaller providers of PDI services are generally unable to recycle the spillage water effectively. A third category of services at Carlog is car modifications and rebuilding. Modifications to cars are carried out in order to fit with the prevailing tax regime. Changing the number of seats or the size of the luggage compartment can allow the car to fall into a more advantageous tax bracket making it more attractive for the customer. A second group of modifications and rebuilding is cars for handymen etc., mounting workshop equipment and extra windows etc. Carlog has a workshop at its site in Norcity, where it can carry out various modifications to different car models. Car rebuilding is far more specific than for example PDI, and will require specific spare parts and specialized knowledge (and to a lesser degree equipment). Some car components are interchangeable between models, but the manufacturers have extensive requirements in terms of what parts may be used in their cars.
Business Relationships Being market leader in Norway, Carlog has a number of partners. Except the cars from EurCar, USCar and JapanCar, the other importers take their cars through Norcity. In Norcity, Carlog is the sole operator for car services. The importers and dealers may therefore purchase various services from Carlog,

191
from their list of offers – i.e. transport, handling, storage, PDI, rebuilding and modifications. The purchase of services is different across the partners. JapanCar moved their hub from Norcity to Malmø in 2003. JapanCar operates a number of the services themselves, and is the responsible operator in the hub in Malmø. Carlog supplies a few PDI services and transport to . For EurCar, all the cars are imported to Oslo, and the importer (EurCar Logistics) is the operator of the port services. Carlog supplies the transport services on truck, while EurCar Logistics takes care of rail transport themselves. USCar runs a port operation in Oslo, Norcity and Fredrikstad. At all locations Carlog is engaged as operator for USCar, taking care of all necessary services.
The Network Carlog has important tasks on two levels. Firstly, it must manage the distribution network. It must ensure reliability in performance from the transport subcontractors. This goal is partly achieved through awarding work to those firms that prove reliable, and partly through defining standards the firms must adhere to. Furthermore, in those cases where Carlog has a non-exclusive deal with a manufacturer, it must work to recruit dealers to its distribution network, with the proviso that it is possible to provide a service effectively. That is, whereas for an exclusive deal Carlog has no choice, for a non-exclusive deal it may be mutually beneficial if certain dealers are not included, for example if they are geographically isolated and hard to reach for Carlog. In such cases regional transport firms may be better placed to provide a service. Secondly, on a more operational level, Carlog must ensure that the distribution system in Norway operates smoothly. The company must keep track of incoming cars so it is ready to receive them, and then sort them according to whether they are going directly to PDI/dealers, to storage or to rebuilding at Carlog’s facilities or by another party. This must be matched to transport capacity and grouped by destination so that the trailers are both active and full. This is a fairly complex task because the incoming cars are from a number of different manufacturers, who do not coordinate their output in relation to each other. A fairly high proportion of incoming cars are destined for some technical modifications and rebuilding, and most also require PDI.

192
Carlog
Transport Firms
Dealers
CarManufacturers
Figure 7.3 Carlog’s main counterparts in distribution 7.4 Discussion Since Carlog provides different services to different customers, it is desirable to capture its value creation in various situations. There are clear differences between an importer that only uses Carlog for transport services, and one that in effect outsources its logistics in Norway to Carlog. The three literatures described above each have their own answers to this question. Below, we use each to illustrate some of the differences, but with the proviso that the central issue is to obtain a satisfactory description of Carlog’s value creation rather than applying a specific theory to the case.
Resource-based view Using the RBV to guide the analysis, the main focus is on identifying what resources Carlog controls and the attributes of these compared to the marketplace and competitors. A comprehensive review is not possible here, but it is useful to look at some of the most important resources possessed by Carlog. Notably, the location of a number of its resources is important. The position at Norcity havn is highly relevant as long as the distribution systems of major manufacturers include Norcity havn as an entrance point to Norway. Whereas it is possible for other actors to obtain facilities at the port, these may not be as favourably placed, and may be more expensive if it requires an expansion of the port.
193
Carlog has developed substantial specialist knowledge in the field of transport coordination and also in car rebuilding. This knowledge relates to how to obtain efficiency in the transport system, i.e. administrative capacity. The significance of this knowledge is that it is tied to knowledge of local conditions for transport within Norway. The combination of administrative capacity and local knowledge is potentially a resource that enables value creation and is difficult to emulate for competitors. This is especially the case since Carlog has a dominant share of car distribution in Norway, i.e. it is difficult for competitors to obtain the same type of experience in Norway. Another point is that many resources are bought from others – i.e. transport services are bought from small firms. In the RBV concept, this does not contribute to Carlog’s competitive position, although it can of course be a good choice if Carlog does not have the resources to carry out the operations itself. Overall, Carlog’s position according to the RBV seems quite strong – it has substantial resources relevant to the market, and these resources are both value creating and difficult for others to emulate. This view does not so clearly describe the differences in Carlog’s value creation from situation to situation – it is the resources themselves that are used to create value and this is defined in general. Carlog’s position may be described as strong and unique for the moment.
Transaction Cost Analysis TCA naturally has a stronger focus on the relation-specific investments made by actors, and the contracts and governance mechanisms used to safeguard these. Clearly Carlog has made specific investments in relation to car transport, both in terms of location, facilities for storage, and specialized transport equipment. In a TCA framework, it is relevant to ask how specialized these resources are in terms of a particular customer, i.e. what are the alternative uses. Most of the resources used by Carlog do have alternative uses, but only for the transport and storage of other types of cars. There is an element of small numbers bargaining then since the investments are made specifically with regard to car manufacturers using Norcity port as a landing area for new cars to Norway. The rebuilding of cars presents a slightly more complicated situation. In relation to rebuilding of EurCar cars, both actors make investments in time and effort. Carlog may also make investments in specialized equipment for rebuilding, or in competence for its employees. The car manufacturer invests time in a particular solution and must guarantee the quality of this. For the car manufacturer the danger is that it may not be easy to monitor the exact quality of the work performed, and that any errors will reflect directly on the manufacturer’s reputation.
194
The focus on the relation between two firms and investments specific to this relation means that it can be useful to focus on particular pairings. For example, in the relation with EurCar , Carlog only provides transport services. There is some adaptation in this relation since EurCar receives cars at the port in Oslo whereas Carlog normally receives cars in Norcity. However, it would be an exaggeration to say that there are significant relation-specific investments. This reduces the chance of hold-up for both parties, but it also means that Carlog’s position vis-à-vis EurCar is not strong. Carlog’s contribution to value creation through specific investments is limited. Notably EurCar needs roughly the same set of services as other car importers, but chooses to use other providers to provide the majority of these. We see that TCA does capture some of the differences in Carlog’s relationships with various suppliers – the qualities of the transaction in particular specific investments can be used to describe this. However, Carlog’s value creation appears to be weak overall because even though many of its services are specialized, they are not specialized to particular counterparts. Carlog therefore appears more as a generic service provider.
Value network It is quite easy to relate the value network thinking to distribution, since the main task of distribution is to link actors together along the dimensions of time and space (i.e. moving goods from one time and place to another time and place). Typically this movement will be from one type of actor to another type, for example from the manufacturer to a dealer, but it can also be from dealer to dealer. In the case described above, Carlog can be seen to carry out all the critical tasks – it provides a transport and coordination service, it takes care of some (if not all) infrastructure operations and it deals with network promotion and contract management in particular with regard to the transport firms and dealers. The two most important functions for Carlog in this conception is to ensure that the transport system itself is operating effectively, and to match the supply and demand for transport services effectively on an ongoing basis. Using this type of conception to describe Carlog’s value creation will lead to a strong focus on network membership, what services to provide and ways to improve the match between transport needs and provision. This type of analysis points to Carlog as an integral part of the Norwegian car distribution system. There are other providers of transport services, but none who are as centrally placed. Other providers can only give access to a smaller network, or a more limited set of services. In this conception, Carlog seems to enable a great deal of value creation, since the alternative to a central coordinator is for all the actors to coordinate capacity between
195
themselves. Carlog is also strongly placed because replacing it would mean building up the same kind of capacity from a much lower level. Perhaps the strongest competition when using the value network as a framework is from other, larger regional networks that could potentially expand into Norway. This conception makes it possible to see why those importers who only need a few services are still fairly reliant on Carlog for inbound transport, since it is difficult to use another transport actor and maintain the same level of efficiency.
7.5 Conclusions The purpose of this paper has been to look at value creation in Carlog from several points of view. To this end, we have described value creation in three different literatures, and tried to apply this to the case presented in the paper. We see that the ability to capture Carlog’s value creation in different situations varies, and that its apparent degree of value creation is also different. Clearly since we are discussing the same firm, any differences reflect the theoretical lens used. Although we do not here try to quantify value creation, nor perform an exhaustive analysis, it is possible to discuss the differences qualitatively. Each theory has a unit of analysis, or more correctly a main focus for inquiry. The resource-based view can be said to have an internal focus on the qualities of the resources controlled by the firm. TCA focuses on the qualities of the transaction, which often leads to a preoccupation with the dyad. Finally, value networks focus on networks, but with the focal firm as a central provider rather than as a part of the network. In the resource-based view Carlog is seen to have developed some valuable resources that are hard to replace, but this is only the case for some of its portfolio. In a TCA setting, Carlog is seen to have made some specific investments, but these are generally not strongly tied to particular relations, so that the value creation that takes place is apparently limited. This is particularly so in the relation with EurCar because very little specific investment is made in this case. There may be other areas of Carlog’s activities with stronger value creation potential. Finally, in the value network Carlog’s position is strong and its value creation high. These points are illustrated in table 7.1.

196
RBV TCA Value Network Focal Unit The firm The dyad The network Sources of Value VRIO resources Exploited value
creation opportunities due to governance
Network size and composition + range of services
Carlog’s Sources Admin. Capacity Some facilities
Some on administrative systems
Large network (in Norway) and portfolio of services
Table 7.1 Summary of Carlog’s value creation reflected in the three theories Looking at the table briefly, it may seem that TCA explains a fairly limited amount of value creation in this case, whereas the lens of RBV explains more. The Value Network conception places Carlog more centrally and in a position to create more value. However, since we do not have a benchmark for Carlog’s value creation, we cannot say that a theory where Carlog appears to have high value creation is more appropriate. What we can however point to is that the network seems to better capture what is unique about Carlog – i.e. it occupies an important position in the value network which is difficult to replace. The network conception does not however give a good description of unique resources possessed by Carlog, nor does it clearly demonstrate Carlog’s differing position with regard to different customers. There is also the question of whether larger European logistics providers might be a significant threat since they can offer much larger networks. We conclude then that although the value network conception seems useful in analyzing Carlog as presented in this paper, it also has weaknesses and does not capture all the nuances in the other conceptions. There is of course much more to be said about each theory employed here, but this initial pass over the literature shows clearly that each literature has much to say about value creation but with a great variation in focus. The main advantage of the value network conception is that it reflects the unique qualities of Carlog’s position, and the activities through which Carlog creates value for its customers. The underlying challenge reflected in this paper is building theory that adequately describes the value creation of logistics service providers. Applying value network thinking is one promising avenue for this.
197
References Andersen, E. & Fjeldstad, Ø. ”Understanding Interfirm Relations in Mediation Industries with Special Reference to the Nordic Mobile Communication Industry,” Industrial Marketing Management, 2003, Vol.32., pp.397-408. Barney, Jay B., “Firm Resources and Sustained Competitive Advantage,” 1991, Vol.17, No.1., pp.99-120. Barney, Jay B., “Organizational Culture: Can IT be a Source of Sustained Competitive Advantage?” Academy of Management Review, 1986, Vol.11, No.3, pp.656-665. Barney, Jay B. Gaining and Sustaining Competitive Advantage, Addison-Wesley Publishing Company, Reading, 1997. Bradach, J.L. & Eccles, R.G., “Price, Authority and Trust: From Ideal Types to Plural Forms,” Annual Review of Sociology, 1989, pp.97-118. Conner, Kathleen R. & Prahalad C.K., “A Resource-based Theory of the Firm: Knowledge versus Opportunism,” Organization Science, Vol.7., No.5, September-October 1996. Eisenhardt, Kathleen M. & Martin, Jeffrey A., ”Dynamic Capabilities: What are they?” Strategic Management Journal, 2000, Vol.21, pp.1105-1121. Fjeldstad Ø.D, Becerra, M. & Narayanan, S. ”Strategic Action in Network Industries: An Empirical Analysis of the European Mobile Phone Industry,” Scandinavian Journal of Management, 2004, Vol.20, pp.173-196. Ghosh, M. & John, G., “Governance Value Analysis and Marketing Strategy,” Journal of Marketing, Vol. 63 (Special Issue 1999), pp.131-145. Helfat, C.E. & Peteraf. M.A. “The Dynamic Resource-based View: Capability Lifecycles,” Strategic Management Journal, 2003, Vol.24., pp.997-1010. Jacobides, M.G. & Winter, S.G. “The Co-evolution of Capabilities and Transaction Costs: Explaining the Institutional Structure of Production,” Strategic Management Journal, 2005, Vol. 26, pp-395-413. Håkansson, Håkan & Snehota, Ivan, Developing Relationships in Business Networks, Thomson Business Press, London, 1995. Kor, Y.Y. & Mahoney, J.T. “How Dynamics, Management, and Governance of Resource Deployments Influence Firm-Level Performance,” Strategic Management Journal, 2005, vol.26, pp.489-496.
198
Makadok, R. “Doing the Right Thing and Knowing the Right Thing to Do: Why the Whole is Greater than the Sum of the Parts,” 2003, Vol. 24, pp.1043-1055. Miller, D. “An Asymmetry-based View of Advantage: Towards an Attainable Sustainability,” Strategic Management Journal, 2003, Vol.24., pp.961-976. Nelson, R. & Winter, S. An Evolutionary Theory of Economic Change, Belknap Press, Cambridge, 1982. Porter, Michael E., Competitive Strategy : Techniques for Analyzing Industries and Competitors, Free Press, New York, 1980. Porter, Michael E., The Competitive Advantage of Nations, Macmillan, London, 1990. Shankar, Bhawani, “Up the Value Chain,” Telecommunications International, 1997, Vol.31, No.3, pp.43-44. Stabell, Charles B. & Fjeldstad, Øystein D., ”Configuring Value for Competitive Advantage: On Chains, Shops, and Networks,” Strategic Management Journal, 1998, Vol.19, pp.413-437. Thompson, J.D., Organizations in Action: Social Science Bases of Administrative Theory, McGraw Hill, New York, 1967. Williamson, O.E., Markets and Hierarchies: Analysis and Antitrust Implications: A Study in the Economics of Internal Organization, Free Press, New York, 1975. Williamson, O.E., “Transaction-Cost Economics: The Governance of Contractual Relations,” Journal of Law and Economics, 1979, Vol.22, pp.233-261. Williamson, O.E., “The Economics of Organization: The Transaction Cost Approach,” American Journal of Sociology, 1981, Vol. 87, No. 3, pp. 548-577. Williamson, O.E., “Comparative Economic Organization: The Analysis of Discrete Structural Alternatives,” Administrative Science Quarterly, 1991, Vol.36, No.2, pp.269-296. Williamson, O.E., “Transaction Cost Economics and Business Administration,” Scandinavian Journal of Management, 2005, Vol.21., pp.19-40. Winter, S.G. “Understanding Dynamic Capabilities,” Strategic Management Journal, 2003, Vol.24, pp.991-995.
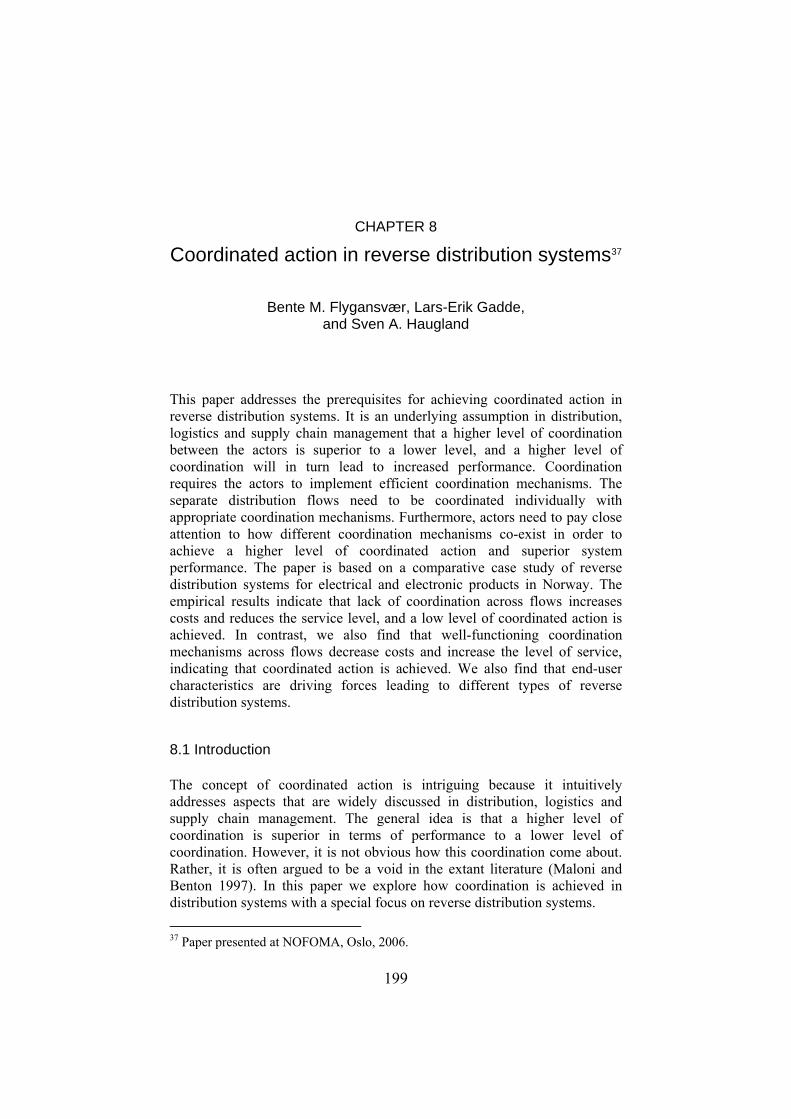
199
CHAPTER 8
Coordinated action in reverse distribution systems37
Bente M. Flygansvær, Lars-Erik Gadde, and Sven A. Haugland
This paper addresses the prerequisites for achieving coordinated action in reverse distribution systems. It is an underlying assumption in distribution, logistics and supply chain management that a higher level of coordination between the actors is superior to a lower level, and a higher level of coordination will in turn lead to increased performance. Coordination requires the actors to implement efficient coordination mechanisms. The separate distribution flows need to be coordinated individually with appropriate coordination mechanisms. Furthermore, actors need to pay close attention to how different coordination mechanisms co-exist in order to achieve a higher level of coordinated action and superior system performance. The paper is based on a comparative case study of reverse distribution systems for electrical and electronic products in Norway. The empirical results indicate that lack of coordination across flows increases costs and reduces the service level, and a low level of coordinated action is achieved. In contrast, we also find that well-functioning coordination mechanisms across flows decrease costs and increase the level of service, indicating that coordinated action is achieved. We also find that end-user characteristics are driving forces leading to different types of reverse distribution systems.
8.1 Introduction The concept of coordinated action is intriguing because it intuitively addresses aspects that are widely discussed in distribution, logistics and supply chain management. The general idea is that a higher level of coordination is superior in terms of performance to a lower level of coordination. However, it is not obvious how this coordination come about. Rather, it is often argued to be a void in the extant literature (Maloni and Benton 1997). In this paper we explore how coordination is achieved in distribution systems with a special focus on reverse distribution systems. 37 Paper presented at NOFOMA, Oslo, 2006.
200
Coordinated action is relevant for any type of distribution system and has become increasingly important in the present era of ‘multi-channel distribution’ (Payne and Frow 2004). It is of special importance in reverse distribution systems dealing with processes of collecting products at end-of-life for recovery and waste management. Distribution systems are primarily designed based on achieving efficient operations when moving products and services from producers to customers. In reverse systems products move in the opposite direction from customers to producers. The crucial role of distribution in recycling was expressed a long time ago when it was claimed that “the major cost of recycling waste products is their collection, sorting and transportation” (Zikmund and Stanton 1971:34). Despite the important role of distribution in recycling and waste management, our theoretical and managerial understanding of how efficient operations can be achieved is still limited. This study aims at enhancing the scientific knowledge in this area by focusing on how actors in reverse systems can achieve coordinated action. We argue that coordinated action requires the actors to implement a set of coordination mechanisms. These mechanisms should coordinate both the physical flows (the movements of products) and the commercial interests (contracts, control, ownership, etc.). Coordination of physical flows and commercial interests has been addressed in different streams of the research literature; logistics and supply chain management and the governance literature respectively. Our point of departure is that the overall performance of the system depends on a well-functioning interaction of coordination mechanisms for both physical flows and commercial interests, and only by linking these two areas can we make further progress in developing efficient reverse distribution systems. We start the paper by developing a theoretical framework for addressing these issues in reverse systems. Thereafter, we present a comparative case study based on collection of electrical and electronic (EE) products at end-of-life, involving two Norwegian reverse distribution systems. Finally, the findings are discussed and implications addressed. 8.2 Framework Coordinated action is a concept used to describe the actors’ ability to operate as an entity in a distribution system. Alderson (1954) argues, “only when someone in the marketing channel takes responsibility for coordinated action can it be expected that anything more than routine operations will be carried out effectively” (p.25). The concept implies that if actors are able to coordinate their activities they will also achieve an increased system
201
performance. Distribution is often conceptualized as a bundle of connected flows (Rosenbloom 1995). There is no common understanding of what should be the relevant number of flows. We focus here on two flows. The first is the physical flow representing the movement of goods. The second is ownership, referring to the legal right to what is exchanged. This also includes financing, negotiations and risks (Gripsrud 2004). This flow will in this paper be framed as commercial interests (Flygansvær 2006). The means to achieve coordinated action in distribution systems are through various forms of coordination mechanisms. The prerequisites and consequences of coordination through various contractual forms are analyzed in the governance literature (Heide 1994, Macneil 1980). However, this literature has primarily addressed the commercial interests in distribution systems. Equally well-developed coordination mechanisms are not apparent for the physical flows. One reason may be that the literature on commercial interests and on physical flows that used to be closely connected, over time developed in different directions (Gripsrud 2004, Juttner et. al. 2007). A second reason may be that the commercial interests of a distribution system are assumed to direct the physical flows (Rosenbloom 1995). However, separation of activity flows can have stand-alone specialization advantages and may facilitate alternative strategies for the distribution systems (Bowersox and Morash 1989). Håkansson and Persson (2004) identify some current trends in practice related to differentiation and specialization. Economies may be achieved when specialist companies take the responsibility for sets of activities in a distribution system. Moreover, differentiation of customer segments and demands for increased performance calls for enhanced coordination of activities across firm boundaries. The trends indicate that flows are becoming decoupled, especially where the physical flows are subject to specialization advantages. Consequently there is a need for a better understanding of the mechanisms for coordinated action in physical flows and commercial interests as well as for joint coordination of the two since all flows in a distribution system are indispensable (Stern and El-Ansary 1992).
8.2.1 Coordination mechanisms for physical flows
We argue that the activity structures within physical flows are characterized by similar conditions, as the technologies that Thompson (1967) suggests are the basis for organizations. Three types of interdependencies represent three ways in which activities are related to each other, and contribute to the understanding of how physical flows may be coordinated. These interdependencies have been used to analyze the physical flows (Håkansson and Persson 2004, Huemer 2004, Hammervold 2003), but the coordination mechanisms related to Thompson’s technologies have not, to our knowledge,
202
been specifically applied to physical flows. Understanding the type of interdependencies within activity structures, and ensuring the implementation of the corresponding coordination mechanisms, is a way of achieving efficient and effective physical flows in distribution systems. The technologies are referred to as long-linked, mediating and intensive, and reflect respectively serial, pooled and reciprocal interdependencies between activities (Thompson 1967). In activity structures with serial interdependencies, one activity is the input to another activity like mass production in assembly lines. In such systems coordination by plan allows the establishment of schedules in order to adjust activities to each other. Activities in structures that are characterized by pooled interdependencies have the task of linking activities that are dependent on each other. An example is a telephone company linking ‘those who would call and those who want to be called’ (Thompson 1967:16). An alternative example is a transportation unit, which provides pooling through its transportation capacity for people and goods. Pooled interdependencies are coordinated through standardization, where the establishment of rules and routines coordinate the activities. The activities are then sufficiently stable and repetitive in order for external activities to link to a system. The third category of interdependencies is the reciprocal, where the task is to solve a specific problem and the activities are adapted to the problem. It is exemplified by a hospital that has to adjust the activities to whatever the patients need. The coordination of the activities is customized to a particular situation with the coordination mechanism mutual adjustment. The various interdependencies within activity structures call for different coordination mechanisms for the physical flows. For physical flows, the coordination mechanisms aim to integrate the activities necessary to ensure movement of goods between locations in the distribution system. Integrating activities is not an end in itself, but the means to achieve minimization of operations costs for a defined level of customer service. The coordination mechanisms incur variety in cost levels, because there are different needs for communication and decision-making (Thompson 1967). The mechanisms for standardization demand less frequent decisions and less communication, compared to planning and mutual adjustment. The latter mechanisms are assumed to be the most resource demanding. In summary, these three types of interdependencies represent three ways of coordinating physical flows.
8.2.2 Coordination mechanisms for commercial interests
Variety is a characteristic also for the types of contracts developed to coordinate commercial interests in distribution systems (Heide 1994). The actors in distribution systems are dependent on each other but still strive to
203
keep their autonomy (Buvik and John 2000). In these types of relationships contracts represent the coordination mechanisms. The contracts are the means to which the participating actors align their self-interests with the common interests of the distribution system. Thus, the goal is to align the behaviour of the participating actors, and in this respect contribute to superior system performance. Contracts may have different forms: (i) hierarchical (Stinchcomb 1985), (ii) incentive (Bergen, Dutta and Walker 1992), and (iii) norm based (Macneil 1980). Hierarchical mechanisms represent the formal control in contracts, and are often conceptualized in terms of centralization and formalization (Dwyer and Oh 1988). Centralization refers to the locus of decision-making and reflects to what extent one member is able to implement decisions that affect the whole system. Formalization on the other hand refers to the extent to which rules and procedures are implemented to coordinate commercial interests. The hierarchical mechanisms allow for implementation of authority in vertical relationships. Even though participating actors have agreed to formalities of relationships, the effort they put towards the common interest of a distribution system may vary. It is therefore necessary to explicitly implement some form of incentive design in vertical relationships to stimulate participation (Murry and Heide 1998). Incentives are ways of rewarding compliance to the common interest of distribution systems. Not all relationships however, are easily defined in rules, procedures or by incentives. Thus, relational norms are used to regulate informal dimensions in vertical relationships (Heide 1994, Heide and John 1992, Macneil 1980). The use of relational norms is relevant when there is bilateral dependency to a relationship, and when the relationship is long-term (Lusch and Brown 1996). The finding is consistent with the inherent characteristics that norms materialize over time (Axelrod 1984, Macneil 1980). Studies on coordinating commercial interests in distribution systems demonstrate that improved governance is achieved when different types of mechanisms are combined (Olsen et. al. 2005, Poppo and Zenger 2002, Dahlstrøm and Nygaard 1999). The studies report that hierarchical mechanisms are important when there is little experience in a relationship, and that relational norms are important mechanisms in regulating behaviour over the longer term. Incentives, on the other hand, are reported to induce participating actors to put extra effort into the relationships. In combination, the governance mechanisms ensure both control and motivation of the actors that participate in distribution systems, inducing them to fulfil both common and self-interests. The studies reveal that different governance mechanisms may be accountable for different relationships in distribution systems, indicating that the total composition of coordination mechanisms is
204
important. The exact combinations of coordination mechanisms that are implemented in relationships vary, which indicates that the particular distribution systems and behaviour situations are important.
8.3 Dimensions of reverse distribution systems Studies of reverse distribution systems have focused on identifying distinct features“what is the ‘reverse’?” (Fuller and Allen 1995, Jahre 1995c, Pohlen and Farris 1992, Barnes 1982, Guiltinan and Nwokoye 1975, Zikmund and Stanton 1971). Reverse physical flows involve two main activities; collection and reprocessing (Jahre 1995a). Collection is the process of making returned products available for reprocessing, and reprocessing is the process by which materials are made into substitutes for primary materials. A collection system links the provider of products (i.e. end-users) with the re-users (i.e. when the products are taken into secondary use). The starting point of a collection system is the level of consumption, which represents the “producer or manufacturer” in the reverse distribution system. However, Zikmund and Stanton (1971) identified that the end-user does not consider itself as a “producer” of waste materials and is, as a consequence, not ‘marketing’ the products at end-of-life to any degree. As the end-user does not take an active part as the ‘seller’ in the reverse distribution system, the systems have been characterized by inherent supply uncertainty (Fleischmann 2000). The reverse distribution systems therefore have to compensate for the end-user’s lack of incentive to “find markets” for their products at end-of-life (Barnes 1982, Zikmund and Stanton 1971). In this respect, the reverse distribution systems need to be structured to actively seek the products at end-of-life and motivate the end-users to return the products. In an investigation of collection systems for household waste, Jahre (1995b) identified that service issues towards “waste producers” are complex. However, it is an important aspect because it has a direct impact on the performance of the collection system. Service aspects include dimensions like collection frequency, transportation work for the end-user, and the number of fractions to sort out (Jahre 1995b). Improved services in relation to “waste producers” lead to a higher collection rate in the system and this contributes to the reduction of supply uncertainty. A high service level also implies high costs for the system. It can be argued, therefore, that the systems most likely have to balance services and costs, in order to find a satisfactory service level for the systems.
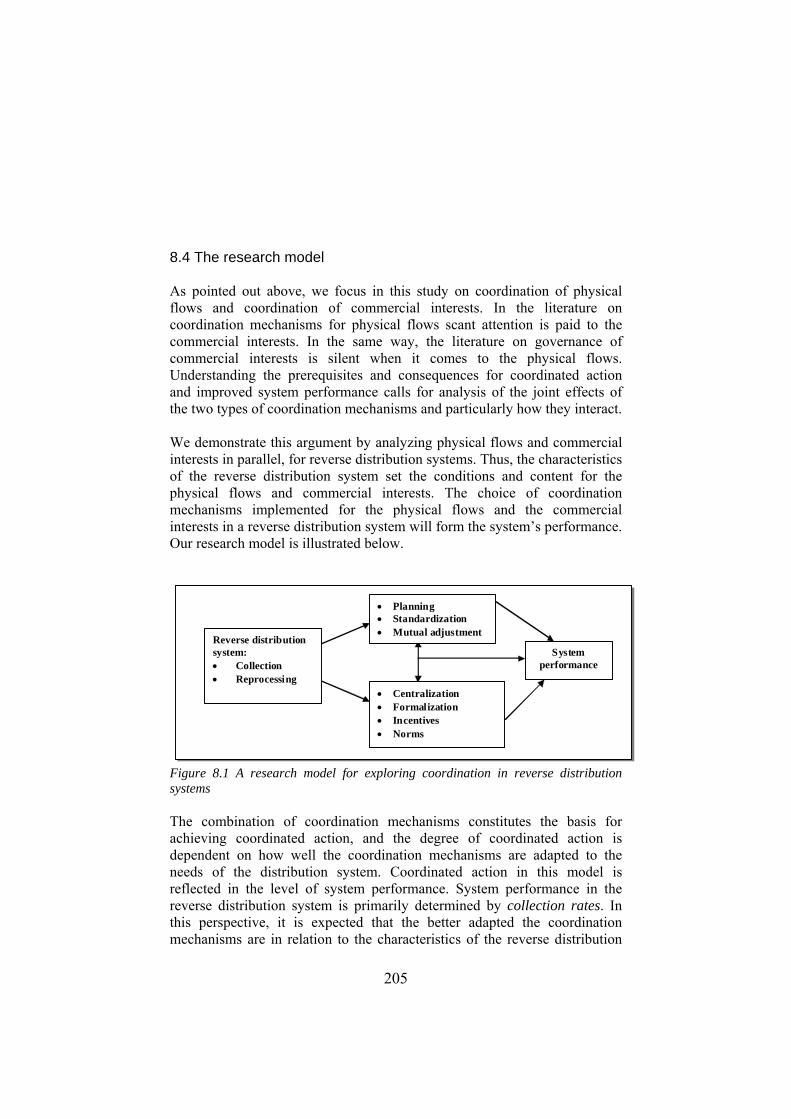
205
8.4 The research model As pointed out above, we focus in this study on coordination of physical flows and coordination of commercial interests. In the literature on coordination mechanisms for physical flows scant attention is paid to the commercial interests. In the same way, the literature on governance of commercial interests is silent when it comes to the physical flows. Understanding the prerequisites and consequences for coordinated action and improved system performance calls for analysis of the joint effects of the two types of coordination mechanisms and particularly how they interact. We demonstrate this argument by analyzing physical flows and commercial interests in parallel, for reverse distribution systems. Thus, the characteristics of the reverse distribution system set the conditions and content for the physical flows and commercial interests. The choice of coordination mechanisms implemented for the physical flows and the commercial interests in a reverse distribution system will form the system’s performance. Our research model is illustrated below.
System performance
• Centralization • Formalization • Incentives • Norms
• Planning • Standardization • Mutual adjustment
Reverse distribution system: • Collection • Reprocessing
Figure 8.1 A research model for exploring coordination in reverse distribution systems The combination of coordination mechanisms constitutes the basis for achieving coordinated action, and the degree of coordinated action is dependent on how well the coordination mechanisms are adapted to the needs of the distribution system. Coordinated action in this model is reflected in the level of system performance. System performance in the reverse distribution system is primarily determined by collection rates. In this perspective, it is expected that the better adapted the coordination mechanisms are in relation to the characteristics of the reverse distribution

206
system, the higher the level of collection rates and thus the system performance.
8.5 The research method and empirical study The chosen research strategy for this study is a case study, based on its contemporary character studied in its real life context (Yin 2003), and its focus on understanding the dynamics within a single setting (Eisenhardt 1989). We have studied two cases longitudinally within a five-year period. Our unit of analysis is a system, and data is based on both primary and secondary sources. The primary data include interviews and site visits with different types of actors, focusing on covering all the participants to the system. The secondary data are written documents ranging from regulations, contracts and presentations, to brochures.
The research context
The reverse distribution systems for collecting EE-products at end-of-life in Norway was initiated in 1998 when the Ministry of Environment passed the Norwegian EE-regulations, and entered an agreement with the EE-industry. In the so-called industry agreement the EE-industry took on the obligation to collect, reprocess and secure environmentally sound treatment of the EE-products at end-of-life. An agreed level of performance was to achieve an 80 % collection rate within a five-year time frame to 2004. The EE-industry established waste management companies (WMCs) to take the operative responsibility for the reverse distribution systems. The EE-products at end-of-life was divided into three main categories of (i) consumer electronics, (ii) white goods and household appliances and (iii) general electric. Accordingly, three WMCs were established to take responsibility for a product category each. The industry agreement was signed on an industry level. Therefore each individual EE-company also had to take an individual decision on how to solve their producer responsibility. One possible choice was to sign as members to the reverse distribution system that the WMCs established. Thus, the WMCs task was on the one side to recruit members to the systems, as this was the basis for funding of the systems, and secondly structure a collection system and sign contracts with operators in the waste industry to collect products at end-of-life. The contracts with these operators were signed for three-year periods. The point of departure is the WMCs. Each WMC is responsible for its specific reverse distribution system. Performance metrics are readily

207
available, as it is the WMCs responsibility to report collection rates to the authorities. The case study was limited to the five-year time frame that was agreed as a trial period, and compared across the three-year contract periods. Two sub-cases are included in the study, and referred to as the El-retur system and the RENAS system.
The El-retur system
The El-retur system was cooperation between two WMCs; Elektronikkretur AS and Hvitevareretur AS. The WMCs found that their products had highly coordinated product flows and thus synergies in establishing a common collection system. However, they kept distinct member groups, reported performances separately to the authorities, and were owned by different industry organizations. The characteristic for the members of the El-retur system was their heterogeneity. A wide range of companies within the EE-industry was accumulated as members to the WMCs. This heterogeneity was a source of conflict when deciding on the fees to fund the system. E.g. importers and producers of copiers had a hard time to relate to the funding of electronic cameras and vice versa. Such issues forced the WMCs to restructure the funding system during the first period of operations. The members started out with paying a fee on new products at time of import. However, it was difficult to agree how to share of costs of the collection system. Therefore, the funding system was changed to a fee based on actual collected volumes. That is, depending on the reported volumes of collected copiers, cameras etc, the members was charged with a fee reflecting the actual collection costs. This limited the crossover funding between products, easing the tension between various member groups.
Collection system The products in the El-retur system were mainly collected from private end-users, and thus the collection system was established at locations frequently visited by people. One type of collection site was established at the sales outlets for new EE-products. In this respect the end-users could return used EE-products at the same time as they went to buy new ones. Secondly, EE-collection sites were established at already existing municipality collection sites. The end-users then could take back EE-products at the same time when they returned other types of waste. The sales outlets and the municipality collection sites were bound by obligations in the EE-Regulations to operate as collection sites for EE-products at end-of-life. Altogether the El-retur reverse distribution system consisted of approximately 4000 collection sites.

208
The next step for WMCs was to enter into contracts with transport operators and reprocessing units. As the collection sites were bound to operate as collection sites in the EE-Regulations, the WMCs did not enter into contracts with these actors, but offered them a no-cost collection service. In the first contract period the WMCs signed with three transport operators, and four reprocessing units responsible for different geographical areas. The transport operators’ task was to service the 4000 collection sites and deliver the goods to the reprocessing units. The reprocessing units’ task was to dismantle the goods and sort the material into pre-defined categories (steel, plastics, etc). The contractors were compensated on the basis of transported and reprocessed volume. The WMCs in the El-retur system kept the same basic structure of the collection system from the first to the second period, but exchanged some of the actors. The main reason was an argument that the transport operators didn’t provide the collection sites with the necessary services in terms of frequency and capacity. However, the transport operators argued that it was difficult to follow the directions given in the contract, as they were dependent on filling capacity and adapting the frequency to the level of volume to be collected. The loading of cages at the collection site was a challenge as well, because the end-users were not stacking and sorting products efficiently. Moreover, transport operators claimed that it was difficult to adapt to the reprocessing units in terms of unloading service and opening hours. They argued that it was difficult to fulfil the terms of the contract, because they were not adapted to the real collection patterns. For the second contract period, the WMCs in the El-retur system exchanged larger transport operators with smaller ones, limiting the geographical collection areas. In this sense they expected collection conditions to become more predictable.
Coordination mechanisms and system performance Table 8.1 provides an overview of the coordination mechanisms applied in the two periods and the system performance.
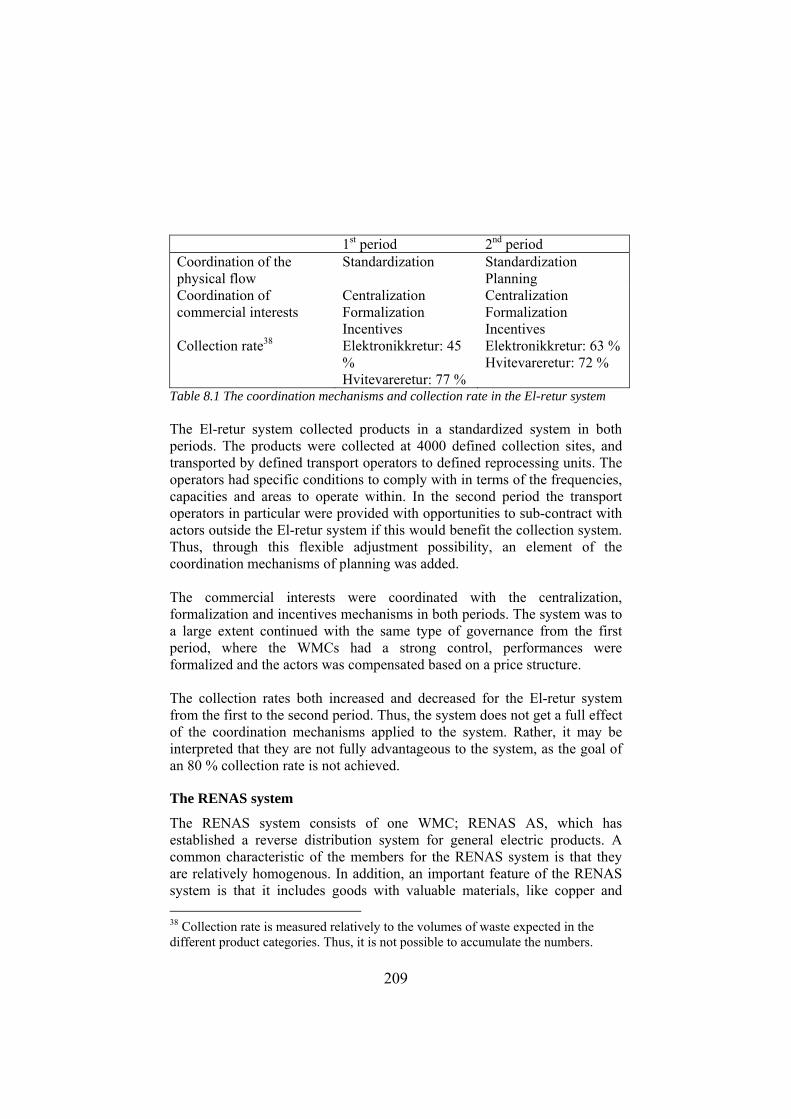
209
1st period 2nd period Coordination of the physical flow
Standardization Standardization Planning
Coordination of commercial interests
Centralization Formalization Incentives
Centralization Formalization Incentives
Collection rate38 Elektronikkretur: 45 % Hvitevareretur: 77 %
Elektronikkretur: 63 % Hvitevareretur: 72 %
Table 8.1 The coordination mechanisms and collection rate in the El-retur system The El-retur system collected products in a standardized system in both periods. The products were collected at 4000 defined collection sites, and transported by defined transport operators to defined reprocessing units. The operators had specific conditions to comply with in terms of the frequencies, capacities and areas to operate within. In the second period the transport operators in particular were provided with opportunities to sub-contract with actors outside the El-retur system if this would benefit the collection system. Thus, through this flexible adjustment possibility, an element of the coordination mechanisms of planning was added. The commercial interests were coordinated with the centralization, formalization and incentives mechanisms in both periods. The system was to a large extent continued with the same type of governance from the first period, where the WMCs had a strong control, performances were formalized and the actors was compensated based on a price structure. The collection rates both increased and decreased for the El-retur system from the first to the second period. Thus, the system does not get a full effect of the coordination mechanisms applied to the system. Rather, it may be interpreted that they are not fully advantageous to the system, as the goal of an 80 % collection rate is not achieved.
The RENAS system
The RENAS system consists of one WMC; RENAS AS, which has established a reverse distribution system for general electric products. A common characteristic of the members for the RENAS system is that they are relatively homogenous. In addition, an important feature of the RENAS system is that it includes goods with valuable materials, like copper and 38 Collection rate is measured relatively to the volumes of waste expected in the different product categories. Thus, it is not possible to accumulate the numbers.
210
steel. Thus, there is a commercial demand for the products at end-of-life. The fees collected in the RENAS system are reduced by income from sale of materials. In addition the WMC experienced it relatively straightforward to agree on fees, as the products were relatively homogenous.
Collection system The products in the RENAS system were mainly collected from business-to-business end-users, and thus they had to establish collection sites that could handle large loads of volumes of waste. The WMC decided to sign contracts with a set of regional collection sites. Thus, the end-users could deliver their goods at these sites at no cost. The reasoning was that the end-users often had to deliver the goods at some type of collection site, and previously had to pay for deliveries. Further, the WMC signed contracts with a set of transport operators and reprocessing units. The task of the transport operators was to transfer the goods from the collection sites to the reprocessing units. The task of the reprocessing unit was to dismantle the goods and sort into groups of materials. The actors had been assigned to defined geographical areas. The collection system was as such, based on regional collection sites, transport operators and reprocessing units. The experience with the system however, was that business-to-business end-users did not necessarily take back the goods to the regional collection sites. The main reason was that the goods were valuable, and the end-users were not looking for a free delivery point, rather they were looking for a compensation for the materials. Thus, the result was that the valuable share of the general electric waste were not returned to the RENAS system, but traded outside the system with metal brokers. The WMC therefore reorganized the collection system in the second contract period. They replaced the collection sites and transport operators by forming a new actor identified as a ‘collector’. This change was based on the conclusion that the collection function of the system had to be an active trader of materials rather than a passive collection point. Instead of having fixed collection points the collector could either receive goods at a collection site that was agreed with the end-users, or pick up the products at the site where they had been in use. Thus, the transport operations would vary from collection task to collection task and a fixed assignment was difficult to specify. The reprocessing units were also granted the role as collectors. In this way, they would be able to trade with end-users that wanted to do business with their disposal. Thus, the collection system consisted of the two types of actors, namely collectors and reprocessing units. In the first period, the actors had to operate according to defined tasks and terms agreed with the WMC. An important feature in the second period was that the actors
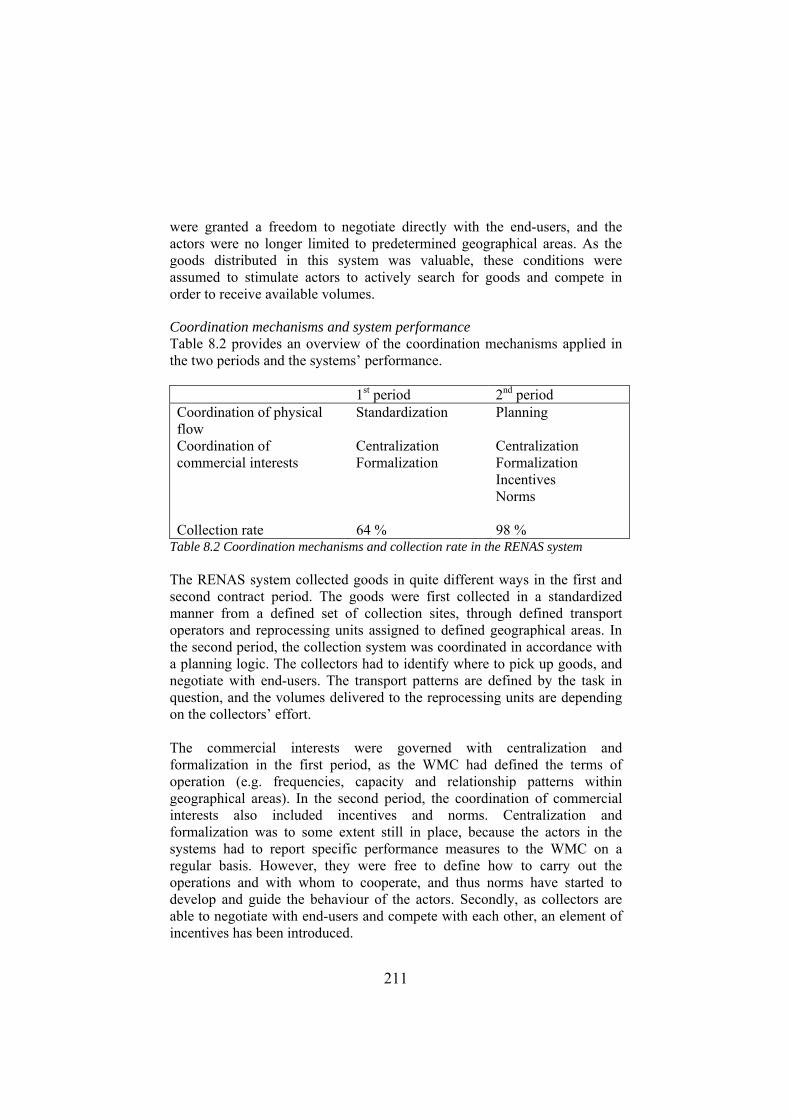
211
were granted a freedom to negotiate directly with the end-users, and the actors were no longer limited to predetermined geographical areas. As the goods distributed in this system was valuable, these conditions were assumed to stimulate actors to actively search for goods and compete in order to receive available volumes.
Coordination mechanisms and system performance Table 8.2 provides an overview of the coordination mechanisms applied in the two periods and the systems’ performance. 1st period 2nd period Coordination of physical flow
Standardization Planning
Coordination of commercial interests
Centralization Formalization
Centralization Formalization Incentives Norms
Collection rate 64 % 98 % Table 8.2 Coordination mechanisms and collection rate in the RENAS system The RENAS system collected goods in quite different ways in the first and second contract period. The goods were first collected in a standardized manner from a defined set of collection sites, through defined transport operators and reprocessing units assigned to defined geographical areas. In the second period, the collection system was coordinated in accordance with a planning logic. The collectors had to identify where to pick up goods, and negotiate with end-users. The transport patterns are defined by the task in question, and the volumes delivered to the reprocessing units are depending on the collectors’ effort. The commercial interests were governed with centralization and formalization in the first period, as the WMC had defined the terms of operation (e.g. frequencies, capacity and relationship patterns within geographical areas). In the second period, the coordination of commercial interests also included incentives and norms. Centralization and formalization was to some extent still in place, because the actors in the systems had to report specific performance measures to the WMC on a regular basis. However, they were free to define how to carry out the operations and with whom to cooperate, and thus norms have started to develop and guide the behaviour of the actors. Secondly, as collectors are able to negotiate with end-users and compete with each other, an element of incentives has been introduced.
212
The reorganizing of the RENAS systems results in an increased collection rate from the first to the second period from 64 % to 98 %. Interpreting this improvement, we can argue that the effects of the coordination mechanisms in the second period are advantageous.
8.6 Discussion The study shows that although the two reverse distribution systems were established in a similar manner, they developed in different directions over the two periods. Another finding is that only one of the reverse distribution systems achieved the 80 % collection rate in the studied period. In this discussion we will shed light on these effects. We start the analysis by focusing the physical flows in the collection system, and secondly we discuss the commercial interests. It has become visible that the collection of EE-products in the El-retur system and the RENAS system face different challenges. The El-retur system collects goods mainly from private end-users, while the RENAS system collects goods mainly from business-to-business end-users. One source of the differences between the systems is therefore the customer base from which the EE-products are collected. The pattern of collection varies amongst the two groups of end-users. Thus, the activity structures necessary to serve these groups are different and therefore the mechanisms to achieve integrated activities need to be differentiated. Activities in physical flows that have a linking purpose are supposed to be coordinated with the standardization mechanism (Stabell and Fjeldstad 1998, Thompson 1967). The collection systems in our study all have a purpose in providing availability for end-users to return EE-products at end-of-life. In other words, the end-users are linked to the collection system. The El-retur system standardized the system to the locations of retailers’ and municipalities’ collection sites. The sites linked the private end-users to the collection system by providing local availability, and made use of the fact that the private end-users would visit the sites for other purposes. The system was, in this way, able to create larger ‘collectable’ volumes as small, heterogeneous deliveries from private end-users were accumulated to a level that justified the transport costs and provided a certain service (frequency). The standardization was strengthened through the use of geographical areas, where transport operators were assigned to service specific collection sites and the reprocessing units were assigned volumes to be collected in each
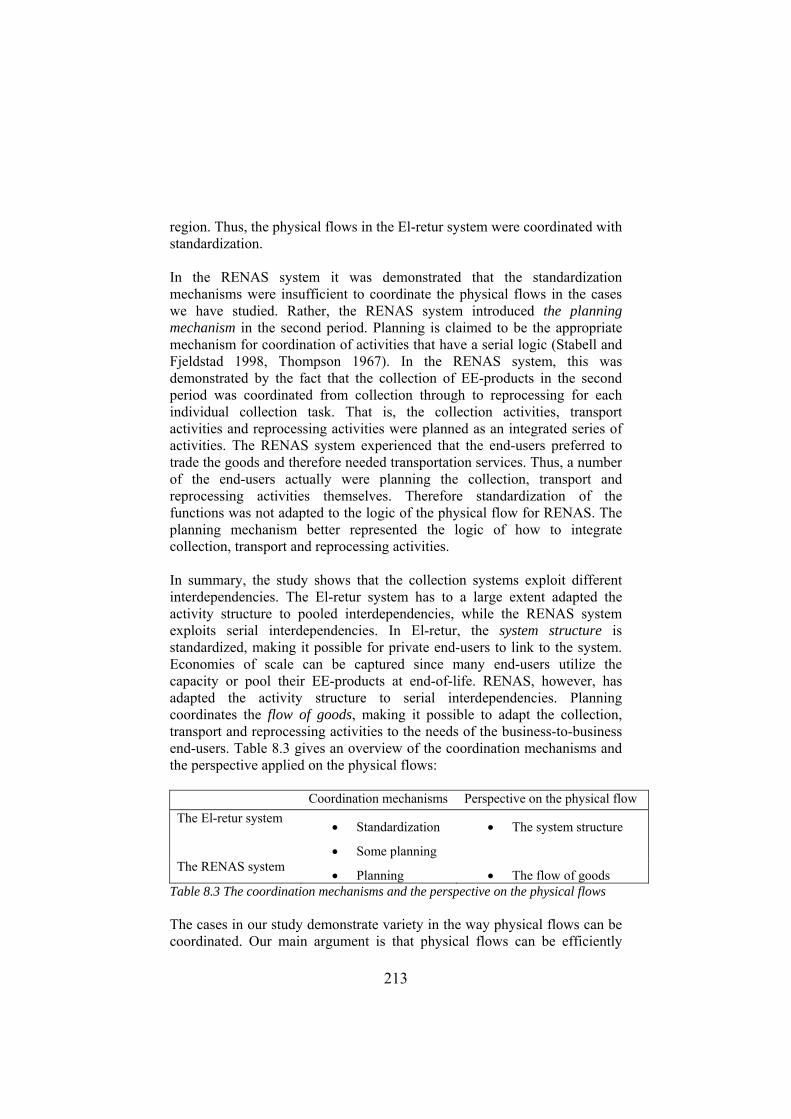
213
region. Thus, the physical flows in the El-retur system were coordinated with standardization. In the RENAS system it was demonstrated that the standardization mechanisms were insufficient to coordinate the physical flows in the cases we have studied. Rather, the RENAS system introduced the planning mechanism in the second period. Planning is claimed to be the appropriate mechanism for coordination of activities that have a serial logic (Stabell and Fjeldstad 1998, Thompson 1967). In the RENAS system, this was demonstrated by the fact that the collection of EE-products in the second period was coordinated from collection through to reprocessing for each individual collection task. That is, the collection activities, transport activities and reprocessing activities were planned as an integrated series of activities. The RENAS system experienced that the end-users preferred to trade the goods and therefore needed transportation services. Thus, a number of the end-users actually were planning the collection, transport and reprocessing activities themselves. Therefore standardization of the functions was not adapted to the logic of the physical flow for RENAS. The planning mechanism better represented the logic of how to integrate collection, transport and reprocessing activities. In summary, the study shows that the collection systems exploit different interdependencies. The El-retur system has to a large extent adapted the activity structure to pooled interdependencies, while the RENAS system exploits serial interdependencies. In El-retur, the system structure is standardized, making it possible for private end-users to link to the system. Economies of scale can be captured since many end-users utilize the capacity or pool their EE-products at end-of-life. RENAS, however, has adapted the activity structure to serial interdependencies. Planning coordinates the flow of goods, making it possible to adapt the collection, transport and reprocessing activities to the needs of the business-to-business end-users. Table 8.3 gives an overview of the coordination mechanisms and the perspective applied on the physical flows:
Coordination mechanisms Perspective on the physical flow The El-retur system
• Standardization
• Some planning
• The system structure
The RENAS system • Planning • The flow of goods
Table 8.3 The coordination mechanisms and the perspective on the physical flows The cases in our study demonstrate variety in the way physical flows can be coordinated. Our main argument is that physical flows can be efficiently
214
organized through two different perspectives. One perspective is that physical flows can be organized through the establishment of an infrastructure consisting of fixed distribution sites and transport routes. A second perspective is that the physical flow can be organized through adaptations in the flow of goods, with flexibility as a characteristic of distribution sites and transport routes. Concerning the commercial interests the study shows that the characteristics of the end-users’ situations explain why the two systems face their challenges. In the El-retur system end-users were too passive while these in the RENAS system were too active. The El-retur system faced mainly private end-users and the collection system had to compensate for their passive behaviour by increasing the hierarchical control. Decisions concerning collection frequencies and capacities were formalized in the agreement with the transport operators, and centralized with the WMCs. However, the collection sites were coordinated through the EE-regulations and not directly with the WMCs of the El-retur system. Therefore their collection efforts were seen as compliance with the Regulations, and were not further compensated. This resulted in a void in the incentives for the collection sites, and a reduced collection effort. The service from the transport operators was supposed to balance the lack of direct compensation for the collection effort. Thus, the WMCs were dependent on coordination mechanisms of control with the transport operators to ensure a collection effort. The RENAS system developed in a different direction than the El-retur system. One explanation is that the system experienced end-users that took an active negotiating role towards the system, as they were trying to recapture value from the goods. In this manner, the RENAS system was dependent on the operators as negotiation partners towards the end-users in order for the operators to be able to integrate the volume in the system. The reliance on an extension of incentives and norms empowered the operators to adapt to the active business-to-business end-users. The first period showed that the operators’ passive role - as they had limited negotiation power - resulted in the end-users trading goods outside the system. The El-retur system faced challenges with regard to obtaining a satisfactory collection volume. In comparison the RENAS system reported a sufficient improvement in the aligned behaviour after changing the mechanisms for coordination of the commercial interests. A possible explanation can be found in the literature, where it is argued that a combination of coordination mechanisms, which includes all the dimensions of hierarchical mechanisms,

215
incentives and norms, is expected to be more effective than utilization of only a selection of these mechanisms (John 1984). In fact, it is argued that the reliance on hierarchical mechanisms alone may be detrimental to achieve aligned behaviour. It may be argued that the RENAS system’s choice of coordination mechanisms in itself is more effective than those of the El-retur system. A second element is that the El-retur system did not use coordination mechanisms to integrate the collection sites, but relied on the coordination through the EE-regulations and left this to the authorities’ responsibility. In this manner, the El-retur system was dependent on performance from actors whose commercial interests were not directly coordinated within the system. In reality, they were ‘out of control’ with these actors.
8.7 Conclusions Our study has demonstrated that there is variety in the features of physical flows and commercial interests, as the collection systems in our cases are found to be coordinated with different mechanisms. The two systems were coordinated in the same way in the first period while they in the second period were coordinated differently. Thus, the diversity in the systems demands different types of coordination mechanisms in order to secure system performance. Variety in the customer bases and collection patterns are what drive forth diversity in reverse distribution systems. The end-users demonstrate heterogeneous and homogenous collection patterns, and differ also in terms of passive and active behaviour. The coordination of physical flows needs to be adapted to the collection patterns, while the coordination of commercial interests needs to adapt to the type of behaviour. A passive behaviour drives forth the need for increasing control, based on centralized and formalized coordination mechanisms. Active behaviour calls for decentralized coordination, which is achieved through reliance on more informal coordination mechanisms like norms. Based on this reasoning we suggest the typology showed in table 8.4. Customer base Customer
behaviour Coordination mechanisms for physical flows
Coordination mechanisms for commercial interests
Heterogeneous end-users
Passive Standardization Formal
Homogeneous end-users
Active Planning Formal and informal
Table 8.4 A typology of for achieving coordinated action in reverse distribution systems

216
We have investigated separate flows in a distribution system and found differentiated coordination needs. We have made and found support for the argument that physical flows follow the same variations that Thompson (1967) proposes for organizations, and that commercial interests are coordinated with different types of contracts. We have also found a certain pattern across the coordination mechanisms. Where the physical flows are coordinated with standardization it seems appropriate that the commercial interests are coordinated with formal mechanisms. On the other hand, where physical flows are coordinated with planning there is also a need for informal mechanisms. In reverse distribution systems we have seen that the customer bases and behaviour is a source of variation. References Alderson, W. (1954), "Factors governing the development of marketing channels, Marketing Channels for Manufactured Products, R. Clewett, Homewood, Ill., Richard D. Irwin, pp. 5-34. Axelrod, R. (1984), The Evolution of Cooperation, New York, Basic Books. Barnes, J. H. J. (1982) "Recycling: A problem in reverse logistics", Journal of Macromarketing, Fall, pp. 31-37. Bergen, M., S. Dutta, et. al. (1992) "Agency relationships in marketing: A review of the implications and applications of agency and related theories", Journal of Marketing, Vol 56 No 3, pp. 1-24. Bowersox, D. J. and E. A. Morash (1989) "The integration of marketing flows in channels of distribution", European Journal of Marketing, Vol 23 No 2, pp. 58-67. Buvik, A. and G. John (2000) "When does vertical coordination improve industrial purchasing relationships?" Journal of Marketing, Vol 64 October, pp. 52-64. Dahlstrom, R. and A. Nygaard (1999) "An empirical investigation of ex post transaction costs in franchised distribution channels", Journal of Marketing Research, Vol 36 May, pp. 160-170. Dwyer, F. R. and S. Oh (1988) "A transaction cost perspective on vertical contractual structure and interchannel competitive strategies", Journal of Marketing, Vol 52 April, pp. 21-34. Eisenhardt, K. M. (1989) "Building theories from case study research", Academy of Management Review, Vol 13, pp. 532-550. Fleischmann, M. (2000), Quantitative Models for Reverse Logistics. Rotterdam, Erasmus University.
217
Flygansvær, B. M. (2006), Coordinated Action in Reverse Distribution Systems. Doctoral Dissertation, Norwegian School of Economics and Business Administration, Bergen. Gripsrud, G. (2004). "The marketing dicipline and distribution research: Time to regain lost territory?" Rethinking Marketing, H. Håkansson, D. Harrison and A. Waluszewski, Chichester, West Sussex, John Wiley & Sons Ltd. Hammervold, T. (2003), Value Creation in Cooperative Vertical Relationships, Doctoral Dissertation, Norwegian School of Economics and Business Administration, Bergen. Heide, J. B. (1994) "Interorganizational governance in marketing channels", Journal of Marketing, Vol 58 January, pp. 71-85. Heide, J. B. and G. John (1992) "Do norms matter in marketing relationships?" Journal of Marketing, Vol 56 April, pp. 32-44. HjellnesCOWIAS (1996), Elektrisk og elektronisk avfall; Omsetningstall, avfallsmengder og håndtering, Oslo. Huemer, L. (2004), Building Effective Supply Networks: The Case of Logistics Service Providers, BI Norwegian School of Management, Oslo. Håkansson, H. and G. Persson (2004). "Supply chain management: The logic of supply chains and networks", The International Journal of Logistics Management, Vol 15 No 1, pp. 11-26. Jahre, M. (1995a) "Household waste collection as a reverse channel - A theoretical perspective", International Journal of Physical Distribution & Logistics, Vol 25 No 2, pp. 39-55. Jahre, M. (1995b), Logistics Systems for Recycling - Efficient Collection of Household Waste, Chalmers University of Technology, Gothenburg. John, G. (1984) "An empirical investigation of some antecedents of opportunism in a marketing channel", Journal of Marketing Research, Vol 21 August, pp. 278-89. John, G. and T. Reve (1982) "The reliability and validity of key informant data from dyadic relationships in marketing channels", Journal of Marketing Research, Vol 19 No 4, pp. 517-524. Juttner, U., Christopher, M. and S. Baker (2007) "Demand chain management – integrating marketing and supply chain management", Industrial Marketing Management, Vol 36 No 3, pp. 377-392. Lusch, R. F. and J. R. Brown (1996) "Interdependency, contracting, and relational behaviour in marketing channels", Journal of Marketing, Vol 60 October, pp. 19-38.

218
Macneil, I. R. (1980), The New Social Contract, New Haven, Yale University Press. Maloni, M. J. and W. C. Benton (1997) "Supply chain partnerships: Opportunities for operations research", European Journal of Operational Research, Vol 101, pp. 419-429. Murry, J. P. and J. B. Heide (1998) "Managing promotion program participation within manufacturer-retailer relationships", Journal of Marketing, Vol 62 January, pp. 58-68. Olsen, B. E., S. A. Haugland, et. al. (2005) "Governance of complex procurements in the oil and gas industry", Journal of Purchasing and Supply Management, Vol. 11, pp. 1-13. Payne, A. and P. Frow (2004) "The role of multi channel integration in customer relationship management", Industrial Marketing Management, Vol 33, pp. 527-538 Poppo, L. and T. Zenger (2002) "Do formal contracts and relational governance function as substitutes or complements?" Strategic Management Journal, Vol 23, pp. 707-725. Rosenbloom, B. (1995), "Channels of distribution", Companion Encyclopedia of Marketing, M. Baker, London, Routledge, pp. 137-154. Stabell, C. B. and Ø. D. Fjeldstad (1998) "Configuring value for competitive advantage: On chains, shops and networks", Strategic Management Journal, Vol 19, pp. 413-437. Stern, L. W. and A. I. El-Ansary (1992), Marketing Channels, Prentice-Hall International. Stern, L. W. and T. Reve (1980) "Distribution channels as political economies: A framework for comparative analysis", Journal of Marketing, Vol 44 Summer, pp. 52-64. Stinchcombe, A. L. (1985), Contracts as hierarchical documents, Organization Theory and Project Management: Administering Uncertainty in Norwegian Offshore Oil, A. L. Stinchcombe and C. A. Heimer, Oslo, Norwegian University Press, pp. 121-171. Thompson, J. D. (1967), Organizations in Action, New York, McGraw-Hill. Yin, R. K. (2003), Case Study Research, Thousand Oaks, Sage Publications. Zikmund, W. G. and W. J. Stanton (1971) "Recycling solid wastes: A channels-of-distribution Problem", Journal of Marketing, Vol 35 July, pp. 34-39.
219
CHAPTER 9
Replenishment strategy for imported wine-products in the Nordic Countries:
a lot-sizing model 39
Erna S. Engebrethsen
Companies that extensively outsource logistics services to third parties, often face a complex problem of choosing the best transportation modes, as well as determining the optimal replenishment plan. This paper presents a multi-item lot-sizing model with time-varying demand that is being developed based on a case study of a company coordinating the logistics for different Nordic wine importers. The company defines itself as a forth-party logistics provider, since all the physical logistics activities, such as transportation and warehousing, are outsourced to 3PLs. The problem is to find the best transportation modes and the optimal replenishment strategy, i.e. .whether lateral warehouse transhipments should be applied and for which products to take advantage of scale economies in freight rates. Using actual data from the case company, we analyze the complexity of our model based on some example problems, and discuss managerial implications. 9.1 Introduction As a result of increasing competition, transportation service providers use complex shipping rates and different types of discounts and transportation modes to differentiate themselves from competitors. In this situation, product shippers face problems that span from strategic ones, such as choosing the best transportation service provider, to more operational ones, such as coordinating the replenishment plans and transportation modes to benefit from the economies of scales represented by freight discounts.
39 Paper presented at the 22nd European Conference on Operational Research EURO XXII, Prague, 2007. …
220
In this paper, we propose a multi-item lot-sizing model and analyze it based on a real-life problem faced by a Nordic 4 PL company that coordinates shipments from producers to central warehouses. The company negotiates transportation prices with logistics service providers based on expected total annual volumes from a given country. The negotiated prices remain fixed for some period, usually for a year, except by minor corrections because of changes in taxation, insurance rates, fuel costs or similar. Each transportation service provider can offer different types of modes and rates, depending on the shipment size. The company needs to determine the optimal replenish-ment plan and to allocate the shipments to appropriate transportation modes. The paper is organized as follows. First, we briefly review relevant literature and describe the case company. Then we formulate the problem and present a mathematical model based on the case study. The model is an MIP lot-sizing model considering discounts in freight costs, competing transportation modes, and multiple products. Using the standard solver Xpress-MP, we analyze our model based on various example problems, and discuss some managerial implications.
9.2 Literature review Transportation costs can in some cases constitute up to 50% of total logistics costs (Swenseth & Godfrey, 2002). However, most inventory models in the literature do not directly consider transportation costs as a contributing factor in inventory policy. There is a substantial literature on inventory control and transportation management, respectively, but much less is available on the combined problem (Qu et al, 1999). Most of the network design problems assume transportation costs to be linear or to have a fixed charge cost structure, while in real situations the outsourcing of transportation changes the cost structure of transportation services. By outsourcing the transportation or warehousing services, companies turn their fixed costs associated with having a private fleet or own facilities into variable costs. These variable costs depend only on the actual product volume transported or handled, and they usually exhibit economies of scale and different types of discounts for higher volumes. Quantity discounts, volume-based price incentives, and other forms of economies of scale have a major impact on the replenishment strategy. Thus, when a company relays on external third-party providers for transportation
221
of goods from the suppliers through warehouses to retailers, the problem of finding an optimal replenishment plan is different from traditional network flow problems (Chan et al, 2002). Freight rates depend on several factors such as mean of transportation, shipping distance and weight, the type of shipment (FTL or LTL), and the commodity class of items shipped. The transportation cost structure offered by 3PL carriers is often piecewise linear, but not necessarily convex. Various types of discounts have been studied in continuous time EOQ-models (Li et al., 2004). However, little attention has been paid to dynamic lot-sizing models with discount schemes. Dynamic deterministic demand is assumed in papers by Diaby and Martel (1993) and Chan et al.(2002) for a single product case. Chan et al. (2002) studied a special case of piecewise linear ordering costs (modified all-units discounts) charged by an LTL carrier, and showed that the problem is NP-hard. Li et al. (2004) have developed an algorithm for the dynamic lot-sizing problem for a single-product with constant linear unit LTL and FTL costs, where order size is a multiple of the production batch size. The authors considered a case with one container size and without price-break intervals for LTL rates. Anily and Tzur (2005) studied the dynamic problem of shipping multiple items by identical capacitated vehicles, where a vehicle incurs a fixed cost for each trip made from the warehouse to the retailer. Jaruphongsa et al (2005) studied the case where products can be delivered from a single source, using two delivery modes (regular and emergency) with cargo capacity constraints. The suggested lot-sizing model considers only FTL shipments where the size of a container for one mode is an integer multiple of the size of a container for the other mode. In reality, this is not always the case; for example the size of a euro pallet-wide 40 feet container is not an integer multiple of a regular 40 or 20 feet container. Classical dynamic lot-sizing models assume that goods can be delivered using only one transportation mode. This is valid if the modes from different transporters cannot be combined, if one particular supplier is always superior (cheaper and faster) to others, or if only one mode is available due to some restrictions (Diaby and Martel, 1993). However, in many practical situations it can be more cost effective to consider the availability of various transporters and shipment modes in making replenishment decisions. The previous work that is closest to our approach is by Diaby and Martel (1993) and Rizk et al. (2006). The model presented by Diaby and Martel (1993) determines the optimal purchasing and shipping quantities over a finite planning horizon for a multi-echelon distribution system with time-varying demand for a single product. Transportation costs have been
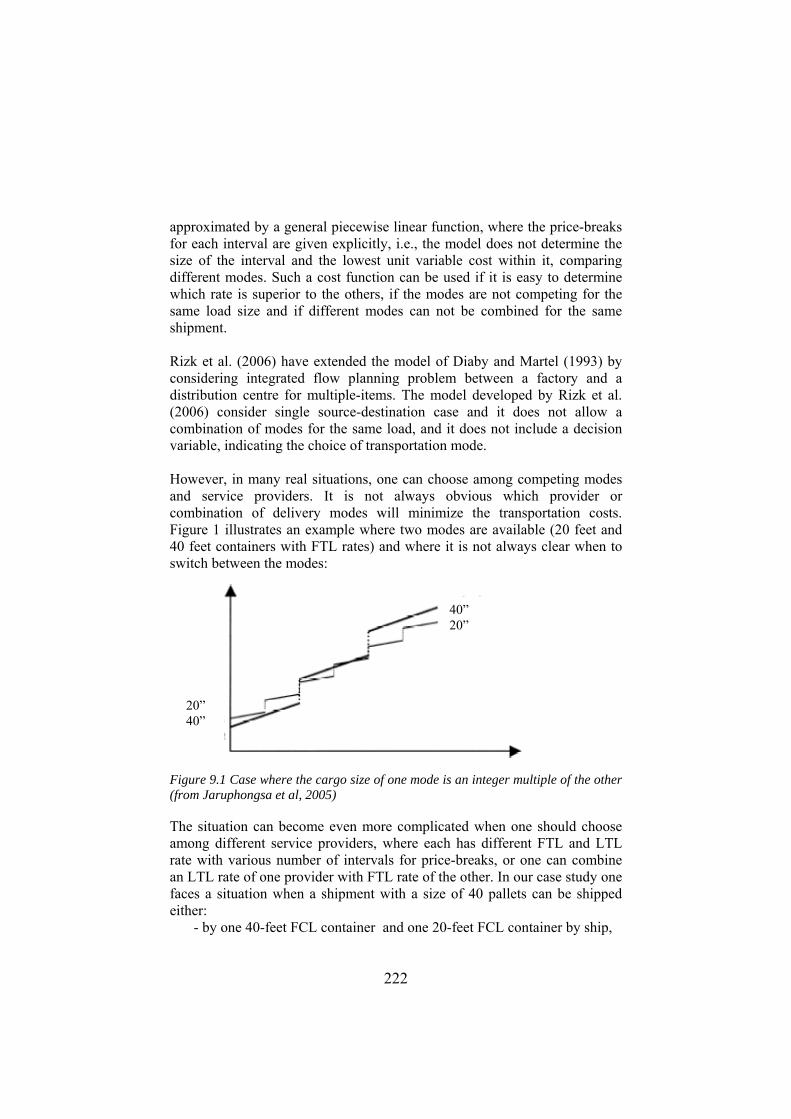
222
approximated by a general piecewise linear function, where the price-breaks for each interval are given explicitly, i.e., the model does not determine the size of the interval and the lowest unit variable cost within it, comparing different modes. Such a cost function can be used if it is easy to determine which rate is superior to the others, if the modes are not competing for the same load size and if different modes can not be combined for the same shipment. Rizk et al. (2006) have extended the model of Diaby and Martel (1993) by considering integrated flow planning problem between a factory and a distribution centre for multiple-items. The model developed by Rizk et al. (2006) consider single source-destination case and it does not allow a combination of modes for the same load, and it does not include a decision variable, indicating the choice of transportation mode. However, in many real situations, one can choose among competing modes and service providers. It is not always obvious which provider or combination of delivery modes will minimize the transportation costs. Figure 1 illustrates an example where two modes are available (20 feet and 40 feet containers with FTL rates) and where it is not always clear when to switch between the modes:
Figure 9.1 Case where the cargo size of one mode is an integer multiple of the other (from Jaruphongsa et al, 2005) The situation can become even more complicated when one should choose among different service providers, where each has different FTL and LTL rate with various number of intervals for price-breaks, or one can combine an LTL rate of one provider with FTL rate of the other. In our case study one faces a situation when a shipment with a size of 40 pallets can be shipped either:
- by one 40-feet FCL container and one 20-feet FCL container by ship,
20” 40”
40” 20”
223
- or by 3 20-feet FCL containers, - or by 1 FCL and 1 (LCL) 40 feet containers - or by combining 1 FTL and 1 LTL shipment by road.
Capacity reservation constraints, when the shipper should have a certain total volume during a year in order to be qualified for the discount scheme from the 3PL, make the transportation mode selection problem even less trivial. Thus, the following dimensions for future dynamic lot-sizing research have been mentioned in literature:
• Modelling several replenishment modes, multi-item systems with different cost structures and arbitrary cargo sizes (Jaruphongsa, 2005)
• Incorporation of multiple items, multiple types of trucks with various constraints (for example volume and weight considerations), and quantity discounts (Li et al., 2004)
• Exploring multiple sources and destinations, competing modes with different lead times and cost functions (Rizk et al., 2006).
In this paper we propose a multi-item lot-sizing model that considers modal choice simultaneously with lot sizing, allowing combination of different modes for the same shipment. One of the strategies in multi-location inventory systems involves movement of stocks between locations at the same echelon level of the inventory/ distribution system (Herer and Tzur, 2001). These stocks are termed lateral transhipments. Brahimi et al.(2006) in their review on single-item lot-sizing problems, point out that little research has been reported on inter-facility lateral transhipments. Much research has been done within emergency (not lateral) transhipments studies, when unexpected circumstances have caused a surplus at one location and a shortage at another. Demand was mainly considered to be static and stochastic (see Karmarkar, 1987; Robinson, 1990; Tagaras, 2002; Axsäter, 2003). However, transhipments can be used in other situations as for example consideration of reduction in fixed replenishment costs as in the model by Herer and Tzur (2001). One replenishes at one location and then tranships the items to another location in order to save on the fixed replenishment costs. Another reason for transhipments is to save on inventory holding costs, in cases in which inventory holding costs vary between different locations (Herer and Tzur, 2001). Transhipments can also be used as a mechanism to balance storage and handling capacities between different warehouses.
224
By outsourcing the warehousing services, one has also an opportunity to choose among different locations that have different holding costs as well as handlings costs (for example because of differences in labour costs and storage leasing costs). The two primary functions of a warehouse include (1) temporary storage and protection of goods and (2) providing value added services such as fulfilment of individual customer orders, packaging of goods, after sales services, repairs, testing, inspection and assembly (Heragu et al., 2005). The costs of these functions are different for each 3PL. In this way the transhipments can be considered not only as a way of satisfying an unexpected shortage with a surplus, but also as a strategy for reducing the total logistics costs. Sambasivan and Yahya (2005) addressed the dynamic problem of scheduling the lot-sizes in a multi-item, multi-plant, capacitated environment with inter-plant transfer, where costs associated with production, inventory carrying and inter-plant transfer of products were assumed to be linear. The authors developed and applied a Lagrangean-based heuristic approach for this problem. However, in many situations, the costs of transhipment may also exhibit economies of scale, for example when using third-party providers with complex cost structures in transportation and warehousing. As a contribution to the existing studies, we will consider such transhipment costs. The aim is to analyze the impact of implementing transhipment (or cross-docking) strategy on the total costs of distribution. Cross-docking is the practice of receiving goods and quickly processing them for re-shipment (with minimum dwell time in between and minimum handling and storage), according to Gümüs and Bookbinder (2004) The cross-docking costs are lower than the costs of a regular receiving and storage procedure, since the goods are not handled or stored at the cross-docking location, but just re-loaded. The “cross-docking” strategy for our case means that the products will be unloaded at one warehouse from the incoming carrier and then be re-loaded to another carrier going to another warehouse. Since the time between the goods have arrived the cross-docking location and until they are re-loaded to the vehicle going to another warehouse is short (maximum several days), this cross-docking time can be neglected. 9.3 Case Company The case company, ABC Logistics, offers a portfolio of logistics services for alcohol importing companies. Today, the company has a significant market
225
share for arranging distribution of alcoholic beverages in Norway and increasing volumes in Sweden, Finland, Denmark and the Baltic countries. Most Scandinavian countries impose particular restrictions on alcohol retailing in terms of retail licenses (state monopolies) and product availability (limited opening hours for alcohol sales). The Norwegian “Vinmonopolet”, Swedish “Systembolaget”, and Finnish “Alko” are state-owned monopoly systems for alcoholic beverages retail sales. It is the importer’s responsibility to deliver the products to the retail stores. The importers and producers of alcoholic beverages can either arrange the activities associated with delivering the product to the customers themselves, or they can outsource all or just a part of these activities to the service providers. ABC Logistics defines itself as a fourth party logistics provider40 outsourcing all physical services associated with transport and storage to third parties. ABC Logistics’s prime responsibility is to find the best subcontractors for performing these services, serving as a logistics coordinator in the supply chain (see Figure 9.2).
40 Fourth party logistics providers is “an integrator that assembles the resources, capabilities and technology of its own organization and other organizations to design, build and run comprehensive supply-chain solutions” (www.accenture.com). In our case, VSD defines itself as 4PL because it acts as an intermediary between the product owners (importers) and the 3PL companies, to whom VSD outsources the transportation and warehousing services.
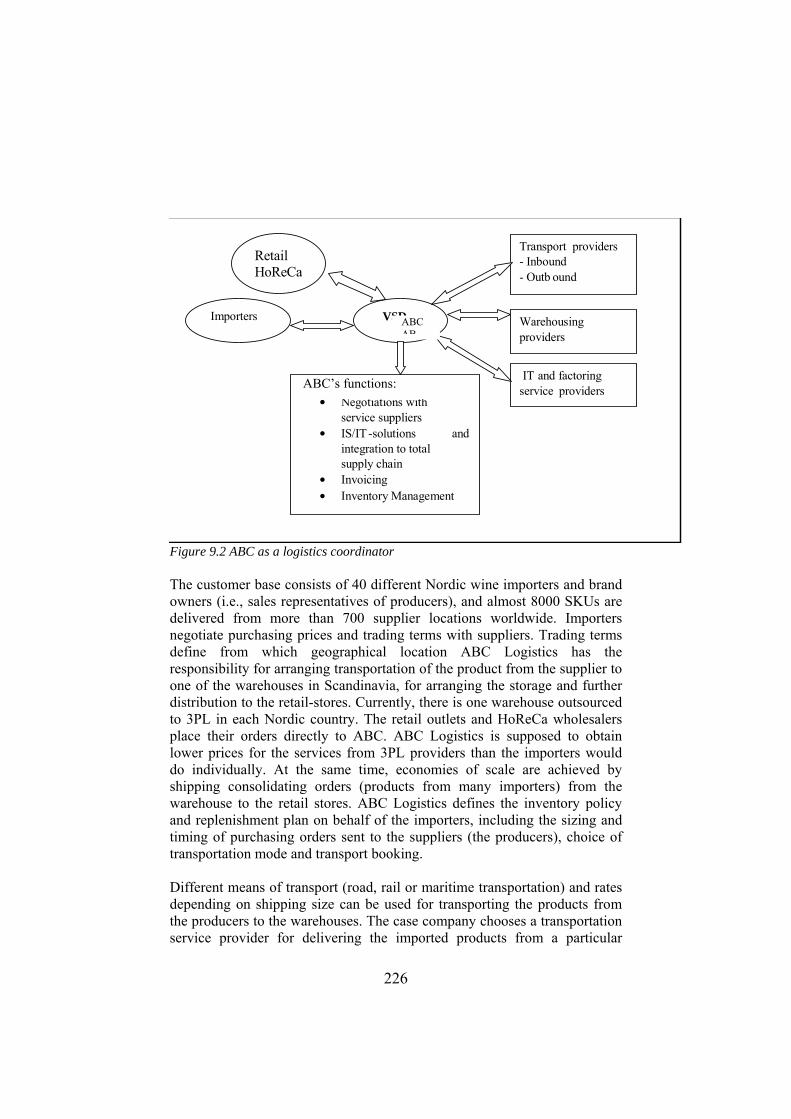
226
Transport providers - Inbound - Outb ound
VSD ’s functions:• Negotiations with
service suppliers• IS/IT -solutions and
integration to total supply chain
• Invoicing• Inventory Management
VSD Warehousing providers IT and factoring service providers
Importers
Retail HoReCa
Figure 9.2 ABC as a logistics coordinator The customer base consists of 40 different Nordic wine importers and brand owners (i.e., sales representatives of producers), and almost 8000 SKUs are delivered from more than 700 supplier locations worldwide. Importers negotiate purchasing prices and trading terms with suppliers. Trading terms define from which geographical location ABC Logistics has the responsibility for arranging transportation of the product from the supplier to one of the warehouses in Scandinavia, for arranging the storage and further distribution to the retail-stores. Currently, there is one warehouse outsourced to 3PL in each Nordic country. The retail outlets and HoReCa wholesalers place their orders directly to ABC. ABC Logistics is supposed to obtain lower prices for the services from 3PL providers than the importers would do individually. At the same time, economies of scale are achieved by shipping consolidating orders (products from many importers) from the warehouse to the retail stores. ABC Logistics defines the inventory policy and replenishment plan on behalf of the importers, including the sizing and timing of purchasing orders sent to the suppliers (the producers), choice of transportation mode and transport booking. Different means of transport (road, rail or maritime transportation) and rates depending on shipping size can be used for transporting the products from the producers to the warehouses. The case company chooses a transportation service provider for delivering the imported products from a particular
ABCAB
ABC’s functions:
227
country to each Nordic warehouse, based on service level, lead-times and the total price for annual forecasted volumes. Some 3PLs can offer several transportation means for the same destination, while the others specialize on specific modes. For the case of ship transportation, several container sizes are available, 20” and 40” feets, as well as a wider type of container, pallet-wide, that is used mainly in Europe. FCL (full-container load) and LCL (less-than-container load) are rates used in ship transport, corresponding to FTL (full truck load) and LTL (less-than-truck load) in road or rail transport. To support replenishment decisions, the company uses “E3 Advanced Warehouse Replenishment Program”41. The system uses linear unit transportation costs, independent of the shipment size, as input parameters. It does not support decisions about the choice of the best transportation mode. The company wants to find and analyze a replenishment plan that is based on “real” transportation cost functions that exhibit economies of scales in form of various discounts, and consider a situation where different transportation modes are available. The company expects to achieve the following benefits from finding such optimal replenishment plan:
1. Valuable savings in transportation, handling and holding costs due to dynamic allocation of shipments to different transportation modes and presence of economies of scale in freight cost. Transportation economies of scale are usually not taken into consideration explicitly in the vendor production plans and the buyer procurement plans, leading to higher inventory costs and inefficient transportation plans (Rizk et al, 2006).
2. Improved coordination of capacity planning and collaboration with transportation companies. The case company can benefit from coordinating the replenishment plans both with the warehousing companies (by adjusting to the limited storage and handling capacity during peak-seasons) and the transporters. It is beneficial for transporters to know which particular type of mode and container size the client will book, in order to be able to assign the fleet capacity in an appropriate way among all clients. The rapid demand increase for road freight transport in Europe (Blauwens et al., 2006) creates a need for transportation companies to be proactive and secure the resource availability (drivers and crews, equipment, containers, etc.). Transportation companies can sell excess transportation capacity on the spot-market and generate extra profits instead of keeping it for hedging the risk of unexpected increases in shipment size.
41 E3 Advanced Warehouse Replenishment Program is software offered by JDA Software Group, which supports ordering decision and optimizes inventory levels by finding the most economic order cycle (with EOQ-based algorithm).

228
9.4 Problem formulation We assume that the facility structure of the distribution network (suppliers, warehouses and demand points) is fixed. Each product supplier usually offers several products from the same location. The products are stored at the warehouse before being delivered to the end-customers. Each domestic warehouse should satisfy all demand in its own country, e.g. direct deliveries from other warehouses are not allowed, but we allow lateral transhipments between warehouses. Direct deliveries from the producers to the end-customers (retail stores) are not allowed due to requirements from the retail stores (such as quality control, re-packing and - if needed - re-labelling, as well as consolidation with other products ordered by the same store). The transportation rates from the warehouses to the stores are assumed to be linear since the transportation company uses constant unit prices. Thus, in our study we analyze only the inbound network, i.e., the flows from the product suppliers to Nordic warehouses. We also assume that transportation companies are chosen, and that they offer different means of transportation (ship, road, rail) and rates. The two transportation rates are: LTL (LCL) and FTL (FCL).
a) b) Figure 9.3 FTL (a) and LTL(b) costs structures (from Diaby and Martel, 1993). In freight cost structures, classical fixed-charge fees are applied to full truckloads (FTL). In this case, fixed amounts are paid per truck (or container), regardless of how much it is filled. LTL shipments are most cost effective for small shipments, while FTL modes are best suited for large shipments. Less than truckload (LTL) mode exhibits price breaks for increased weight, and the resulting cost function is piecewise linear. LTL shipments can be represented by a piecewise linear continuous function (see figure 3). In figure 3 z(S) is the total cost of shipment, S - the quantity
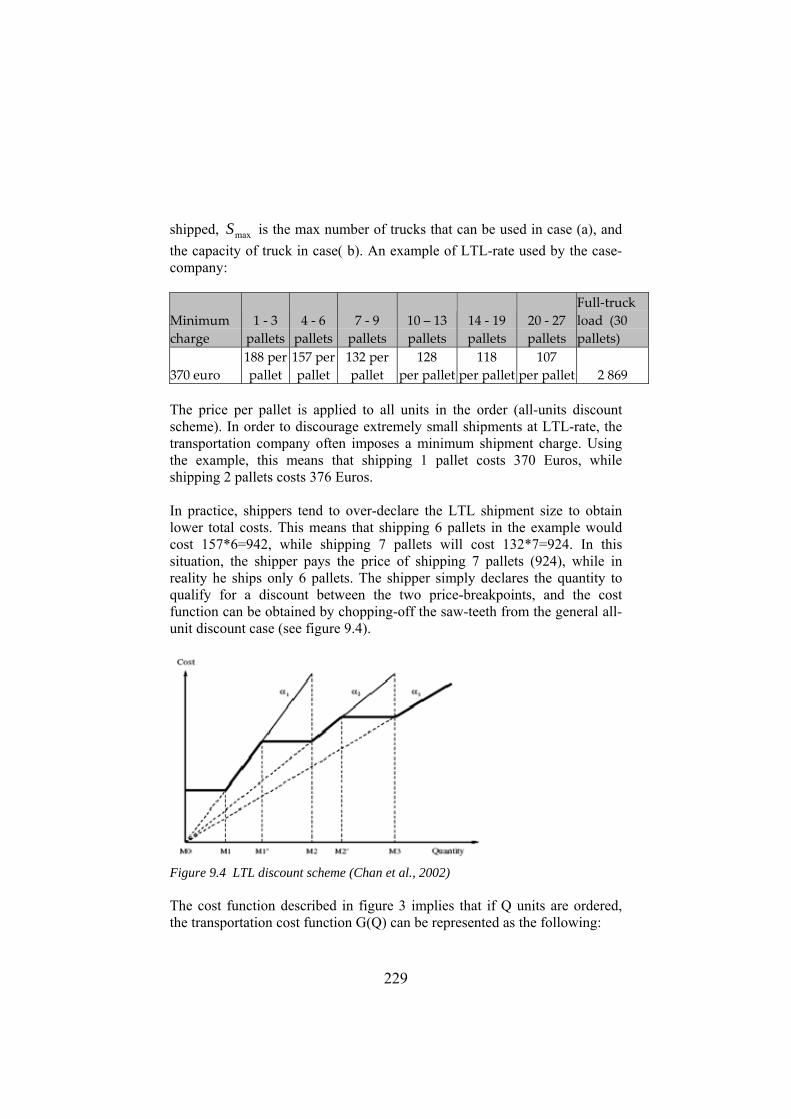
229
shipped, maxS is the max number of trucks that can be used in case (a), and the capacity of truck in case( b). An example of LTL-rate used by the case-company:
Minimum charge
1 ‐ 3 pallets
4 ‐ 6 pallets
7 ‐ 9 pallets
10 – 13 pallets
14 ‐ 19 pallets
20 ‐ 27 pallets
Full‐truck load (30 pallets)
370 euro 188 per pallet
157 per pallet
132 per pallet
128 per pallet
118 per pallet
107 per pallet 2 869
The price per pallet is applied to all units in the order (all-units discount scheme). In order to discourage extremely small shipments at LTL-rate, the transportation company often imposes a minimum shipment charge. Using the example, this means that shipping 1 pallet costs 370 Euros, while shipping 2 pallets costs 376 Euros. In practice, shippers tend to over-declare the LTL shipment size to obtain lower total costs. This means that shipping 6 pallets in the example would cost 157*6=942, while shipping 7 pallets will cost 132*7=924. In this situation, the shipper pays the price of shipping 7 pallets (924), while in reality he ships only 6 pallets. The shipper simply declares the quantity to qualify for a discount between the two price-breakpoints, and the cost function can be obtained by chopping-off the saw-teeth from the general all-unit discount case (see figure 9.4).
Figure 9.4 LTL discount scheme (Chan et al., 2002) The cost function described in figure 3 implies that if Q units are ordered, the transportation cost function G(Q) can be represented as the following:
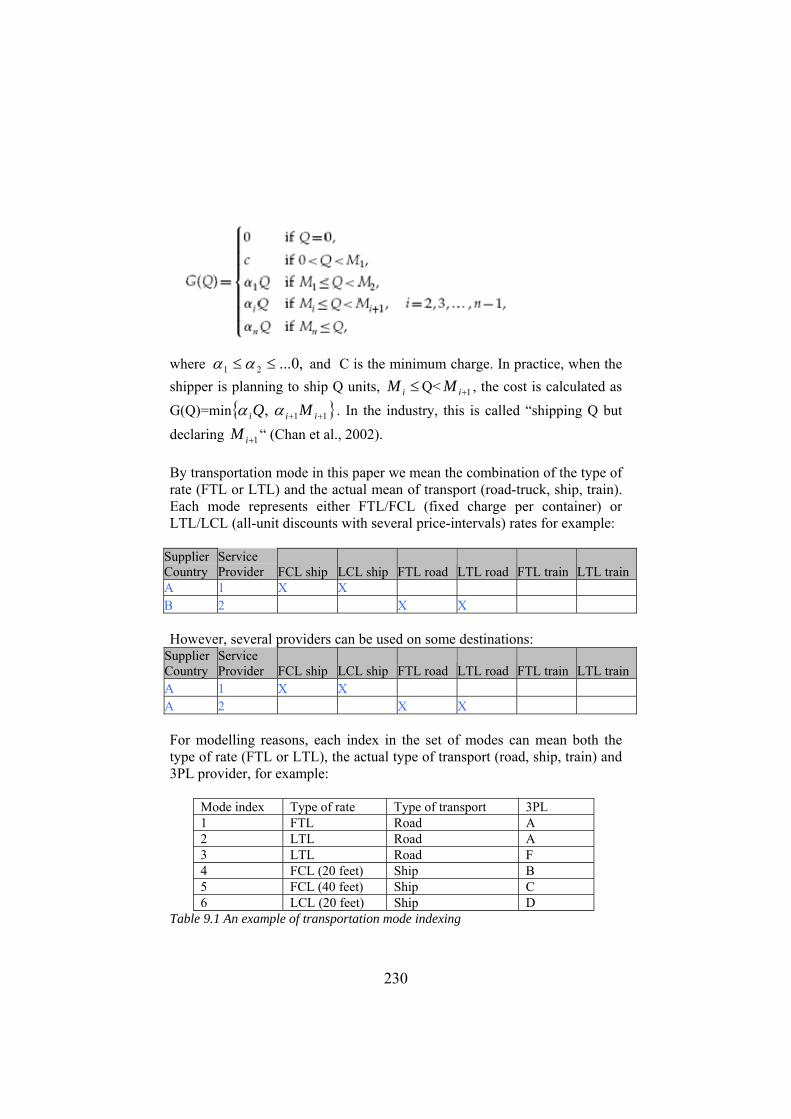
230
where ,0...21 ≤≤ αα and C is the minimum charge. In practice, when the shipper is planning to ship Q units, iM ≤ Q< 1+iM , the cost is calculated as G(Q)=min{ }11 , ++ iii MQ αα . In the industry, this is called “shipping Q but declaring 1+iM “ (Chan et al., 2002). By transportation mode in this paper we mean the combination of the type of rate (FTL or LTL) and the actual mean of transport (road-truck, ship, train). Each mode represents either FTL/FCL (fixed charge per container) or LTL/LCL (all-unit discounts with several price-intervals) rates for example:
Supplier Country
Service Provider FCL ship LCL ship FTL road LTL road FTL train LTL train
A 1 X X B 2 X X However, several providers can be used on some destinations:
Supplier Country
Service Provider FCL ship LCL ship FTL road LTL road FTL train LTL train
A 1 X X A 2 X X For modelling reasons, each index in the set of modes can mean both the type of rate (FTL or LTL), the actual type of transport (road, ship, train) and 3PL provider, for example:
Mode index Type of rate Type of transport 3PL 1 FTL Road A 2 LTL Road A 3 LTL Road F 4 FCL (20 feet) Ship B 5 FCL (40 feet) Ship C 6 LCL (20 feet) Ship D
Table 9.1 An example of transportation mode indexing
231
ABC Logistics wants to determine simultaneously the optimal replenishment plan and the appropriate transportation mode.
9.5 Model development We formulate a lot-sizing model considering freight cost discounts, competing modes, and multiple products with deterministic time-varying demand. In the first place the objective is to satisfy demand while minimizing the costs of ordering, transportation, handling and inventory holding costs. The demand for each product is aggregated at warehouse level (there is one warehouse in each country). The procurement price iswp for the same product i can differ among the countries, because there can be different importers in each Scandinavian country that have got different prices from the same supplier (for example, because of differences in demand). Unit handling and holding costs wα at 3PL warehouses are different at each warehouse, and we model them as linear constant costs. In our model we define swmtK as fixed ordering costs for placing an order, including the fixed charge for using the mode m from supplier s to warehouse w, such as taxes, customer declarations and intermodal transfer. These costs can be time-varying, because some of theses fees, for example BAF and CAF (Bunker Fuel and Currency Adjustment Factors) can change during the year. Transportation service providers measure the freight in different units, for example tons or pallets. In our model we introduce a parameter ima , which translates the demand expressed in product units (bottles, cases) into demand expressed in tons or pallets for product i and transportation mode m. Transportation costs for FTL rates are calculates as the number of full containers multiplied with the cost of each FTL container. For LTL rates the transportation are calculated as the quantity q (in pallets or tons) shipped within interval h multiplied with unit-price b for the corresponding interval, taking into account the minimum charge for small shipments and “over-declaring” option. Minimum and maximum quantity limits for each price interval for modes with LTL rates determine the length of the interval. The number of price-intervals as well as their length for each mode with LTL rate can be varying. The size of containers for each mode swmW is also varying.
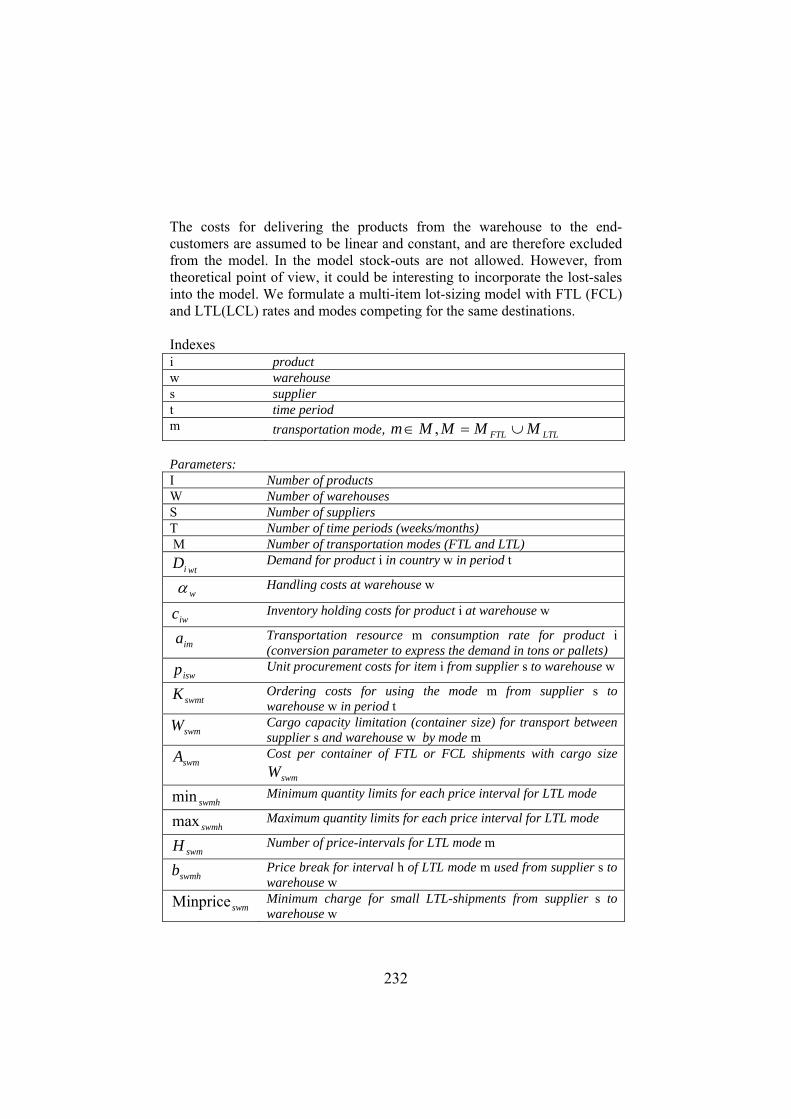
232
The costs for delivering the products from the warehouse to the end-customers are assumed to be linear and constant, and are therefore excluded from the model. In the model stock-outs are not allowed. However, from theoretical point of view, it could be interesting to incorporate the lost-sales into the model. We formulate a multi-item lot-sizing model with FTL (FCL) and LTL(LCL) rates and modes competing for the same destinations. Indexes
Parameters: I Number of products W Number of warehouses S Number of suppliers T Number of time periods (weeks/months) M Number of transportation modes (FTL and LTL)
wtiD Demand for product i in country w in period t
wα Handling costs at warehouse w
iwc Inventory holding costs for product i at warehouse w
ima Transportation resource m consumption rate for product i (conversion parameter to express the demand in tons or pallets)
iswp Unit procurement costs for item i from supplier s to warehouse w
swmtK Ordering costs for using the mode m from supplier s to warehouse w in period t
swmW Cargo capacity limitation (container size) for transport between supplier s and warehouse w by mode m
swmA Cost per container of FTL or FCL shipments with cargo size
swmW
swmhmin Minimum quantity limits for each price interval for LTL mode
swmhmax Maximum quantity limits for each price interval for LTL mode
swmH Number of price-intervals for LTL mode m
swmhb Price break for interval h of LTL mode m used from supplier s to warehouse w
swmMinprice Minimum charge for small LTL-shipments from supplier s to warehouse w
i product w warehouse s supplier t time period m transportation mode, LTLFTL MMMMm ∪=∈ ,

233
Decision variables: iswmtX Quantity of product i shipped from supplier s to warehouse w in
period t by mode m
iwtI Inventory level of product i at warehouse w at the end of period t
swmtδ Binary variable equal to 1 if transportation mode m is used from supplier s to warehouse w in period t
swmtQ Total quantity (in pallets or tons) shipped from supplier s to warehouse w by mode m in period t
swmtβ Integer number of FTL containers used for transporting swmtQ by mode m
swmhtq Quantity (in pallets or tons) shipped from supplier s to warehouse w by mode m at LTL-rate within price interval h in period t
swmhtY Binary variable equal to 1 if the interval h is used in LTL shipments
hswmtG Transportation costs for using interval h in LTL shipments
swmhB Quantity break for over-declaring the shipments within LTL price interval h
swmhtU Binary variable equal to 1 if LTL-shipment within LTL-price interval h is over-declared
Min
∑∑∑∑= = ∈ =
S
s
W
w Mm
T
tswmtswmtK
1 1 1δ + ∑∑ ∑∑
= = = =
S
s
W
w
M
m
T
tswmtswmt
FTL
A1 1 1 1
β +
∑∑∑ ∑∑= = = = =
H
h
S
s
W
w
M
mhswmt
T
t
LTL
G1 1 1 1 1
iswmtisw
I
i
S
s
W
w Mm
T
tXp∑∑∑ ∑∑
= = = ∈ =
+1 1 1 1
1 1 1 1
iswmtw
I
i
S
s
W
w Mm
T
t
Xα∑∑∑∑∑= = = ∈ =
+
1 1 1
iwtiw
I
i
W
w
T
tIc∑∑∑
= = =
+
Subject to:
iwtiwtiswmtMm
S
stwi IDXI +=+ ∑∑
∈ =−
11 ,, twi ,,∀
(1)
∑=
=I
iimiswmtswmt aXQ
1 tMmws ,,, ∈∀
(2)
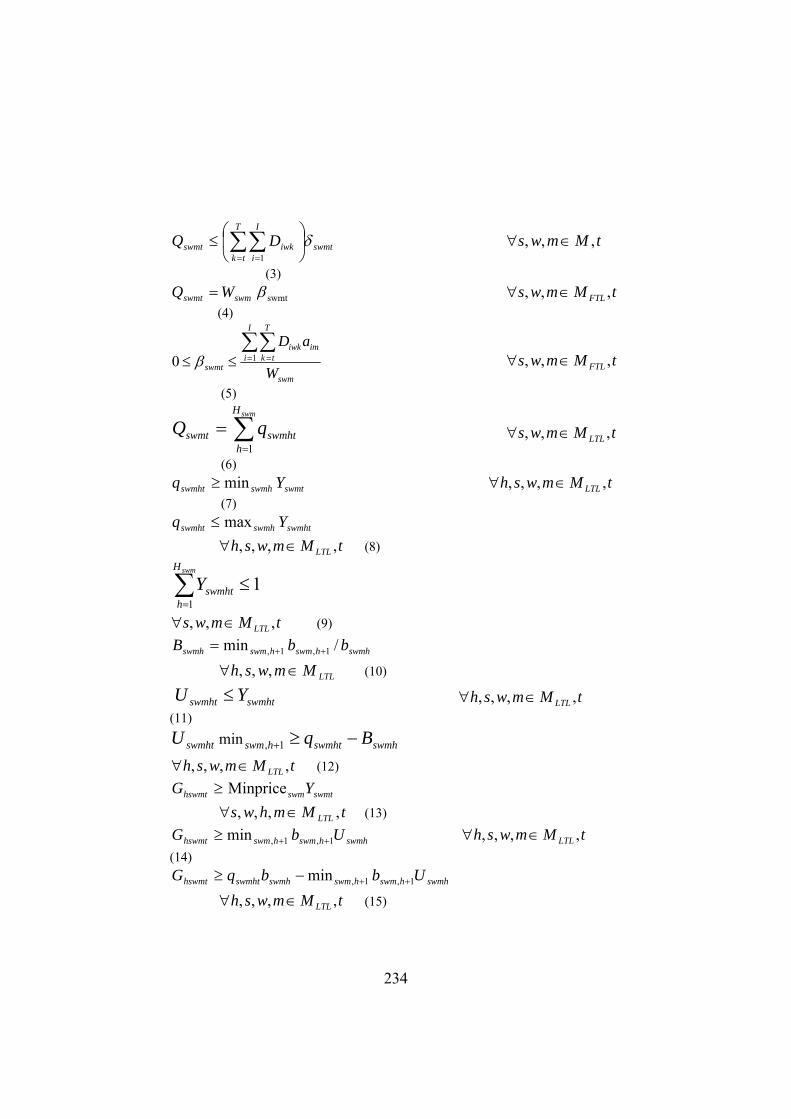
234
swmt
T
tk
I
iiwkswmt DQ δ⎟
⎠
⎞⎜⎝
⎛≤ ∑∑
= =1 tMmws ,,, ∈∀
(3)
swmt βswmswmt WQ = tMmws FTL ,,, ∈∀ (4)
swm
I
i
T
tkimiwk
swmt W
aD∑∑= =≤≤ 10 β tMmws FTL ,,, ∈∀
(5)
∑=
=swmH
hswmhtswmt qQ
1 tMmws LTL ,,, ∈∀
(6)
swmtswmhswmht Yq min≥ tMmwsh LTL ,,,, ∈∀ (7)
swmhtswmhswmht Yq max≤
tMmwsh LTL ,,,, ∈∀ (8)
11
≤∑=
swmH
hswmhtY
tMmws LTL ,,, ∈∀ (9)
swmhhswmhswmswmh bbB /min 1,1, ++=
LTLMmwsh ∈∀ ,,, (10)
swmhtswmht YU ≤ tMmwsh LTL ,,,, ∈∀ (11)
swmhswmhthswmswmht BqU −≥+1,min
tMmwsh LTL ,,,, ∈∀ (12)
≥hswmtG swmtswmYMinprice
tMmhws LTL ,,,, ∈∀ (13)
swmhhswmhswmhswmt UbG 1,1,min ++≥ tMmwsh LTL ,,,, ∈∀ (14)
swmhhswmhswmswmhswmhthswmt UbbqG 1,1,min ++−≥
tMmwsh LTL ,,,, ∈∀ (15)
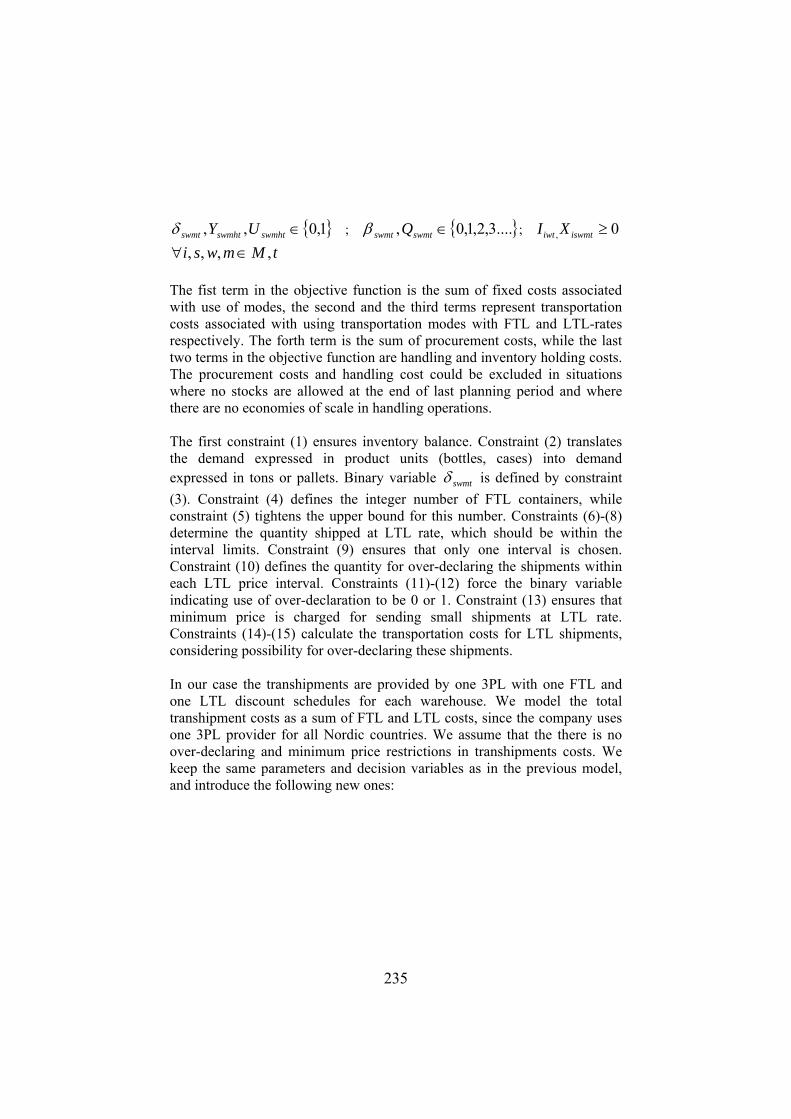
235
{ }1,0,, ∈swmhtswmhtswmt UYδ ; { }....3,2,1,0, ∈swmtswmt Qβ ; 0, ≥iswmtiwt XI
tMmwsi ,,,, ∈∀ The fist term in the objective function is the sum of fixed costs associated with use of modes, the second and the third terms represent transportation costs associated with using transportation modes with FTL and LTL-rates respectively. The forth term is the sum of procurement costs, while the last two terms in the objective function are handling and inventory holding costs. The procurement costs and handling cost could be excluded in situations where no stocks are allowed at the end of last planning period and where there are no economies of scale in handling operations. The first constraint (1) ensures inventory balance. Constraint (2) translates the demand expressed in product units (bottles, cases) into demand expressed in tons or pallets. Binary variable swmtδ is defined by constraint (3). Constraint (4) defines the integer number of FTL containers, while constraint (5) tightens the upper bound for this number. Constraints (6)-(8) determine the quantity shipped at LTL rate, which should be within the interval limits. Constraint (9) ensures that only one interval is chosen. Constraint (10) defines the quantity for over-declaring the shipments within each LTL price interval. Constraints (11)-(12) force the binary variable indicating use of over-declaration to be 0 or 1. Constraint (13) ensures that minimum price is charged for sending small shipments at LTL rate. Constraints (14)-(15) calculate the transportation costs for LTL shipments, considering possibility for over-declaring these shipments. In our case the transhipments are provided by one 3PL with one FTL and one LTL discount schedules for each warehouse. We model the total transhipment costs as a sum of FTL and LTL costs, since the company uses one 3PL provider for all Nordic countries. We assume that the there is no over-declaring and minimum price restrictions in transhipments costs. We keep the same parameters and decision variables as in the previous model, and introduce the following new ones:

236
Parameters: ig Transportation resource consumption rate during transhipments for
product i
wvH Number of price-intervals for transhipments at LTL rate between warehouses w and v
wvhTRmin Minimum quantity limits for each price interval h at LTL rate for transhipments between warehouses w and v
wvhTRmax Maximum quantity limits for each price interval h at LTL rate for transhipments between warehouses w and v
wvhtr Price break for interval h of LTL mode used for transhipments between warehouse w and v (v ≠ w)
wvAT Cost per container of FTL transhipments between warehouses w and v
wvWT Cargo capacity limitation (container size) for transhipments between warehouses w and v
wr Cross-docking costs at warehouse w
wC Storage capacity at warehouse w
Decision variables:
iwtZ Quantity of product i stored at warehouse w in period t
iwvtY Quantity of product i transhipped from warehouse w to warehouse v (v≠w) in period t
iwtI Inventory level of product i at warehouse w at the end of period t
wvhtε Binary variable equal to 1 if the interval h is used in LTL transhipments in period t
wvhtf Quantity (in pallets or tons) transhipped from warehouse w to warehouse v at LTL-rate within price interval h in period t
wvtλ Number of FTL containers transhipped between warehouse w and v in period t
Min
∑∑∑∑= = ∈ =
S
s
W
w Mm
T
tswmtswmtK
1 1 1δ + ∑∑ ∑∑
= = = =
S
s
W
w
M
m
T
tswmtswmt
FTL
A1 1 1 1
β +
∑∑∑ ∑∑= = = = =
H
h
S
s
W
w
M
mhswmt
T
t
LTL
G1 1 1 1 1

237
∑∑∑∑∑∑∑= == ≠= ≠ =
++wvH
hwvhtwvh
T
t
W
w
W
wvwvtwv
W
w
W
vw
T
tftrAT
1 111 1λ
w
W
w
W
wv
T
twvt rT∑∑∑
= ≠
+1
iswmtisw
I
i
S
s
W
w Mm
T
tXp∑∑∑ ∑∑
= = = ∈ =
+1 1 1 1
1 1 1
imtw
I
i
W
w
T
t
Zα∑∑∑= = =
+ 1 1 1
iwtiw
I
i
W
w
T
tIc∑∑∑
= = =
+
We add the following restrictions:
∑∑ ∑∑≠= ≠=
−+=W
wvivwt
M
m
W
wviwvt
S
siswmt YYX
1 1iwtZ twi ,,∀
(1)
iwtiwtiwttwi IDZI +=+−1 ,, twi ,,∀ (2)
∑=I
iiiwvtwvt gYT twvw , , ≠∀ (3)
∑=
+=wvH
hwvhtwvwvt fWTT
1wvtλ twvw , , ≠∀ (4)
wv
I
i
T
tkiiwk
wvt WT
gD∑∑= =≤≤ 10 λ twvw , , ≠∀ (5)
thvwwvhwvht TRf ,,,min ε> twvwh ,,, ≠∀ (6)
wvhtwvhwvht TRf εmax≤ twvwh ,,, ≠∀ (7)
11
≤∑=
H
hhwvtε twvw , , ≠∀ (8)
w
I
i
C≤∑=1
iwtI tw , ∀ (9)
0, ,, ≥iwtiwvmtiswmtiwt ZYXI tmwsi ,,,,∀ (10)
{ }1,0,, ∈wvhtswmhtswmt εγδ thmws ,,,,∀ (11)

238
The objective function differs from the previous model by inclusion of transhipments costs at FTL and LTL rates, and the cross-docking handling costs. The constraints are the same as the previous model, except that constraint (1) defines the quantity of product i stored at warehouse w in period t and constraint (2) includes it in the inventory balance. Constraint (3) translates the transhipped quantity expressed in product units (bottles, cases) into tons or pallets. Constraint (4) defines the total number of transhipped pallets as a sum of pallets shipped by FT and LTL modes, while constraint (5) tightens the upper bound for the integer number of transhipped FTL containers. Constraints (6)-(7) determine the quantity transhipped at LTL rate, which should be within the interval limits. Constraint (8) ensures that only one interval is chosen. Constraint (9) ensures that the quantity of products stored at warehouse is within storage capacity limit.
9.6 Example problems We programmed and ran the model using the Xpress-MP standard solver on an Intel Pentium 1600 MHz processor PC with 1024 MB of RAM. First we tested a set of problems where we choose only the transportation mode without transhipments. We chose five wine suppliers and created a test problem for each of them, based on actual input data. Parameters such as number of warehouses, number of products, number of periods, number of available modes, and number of price breaks in LTL shipments, varied among the five test problems. Four problems have 12 periods, while one problem has 48 periods. For each test problem we compared the multi-mode with the single-mode scenario.
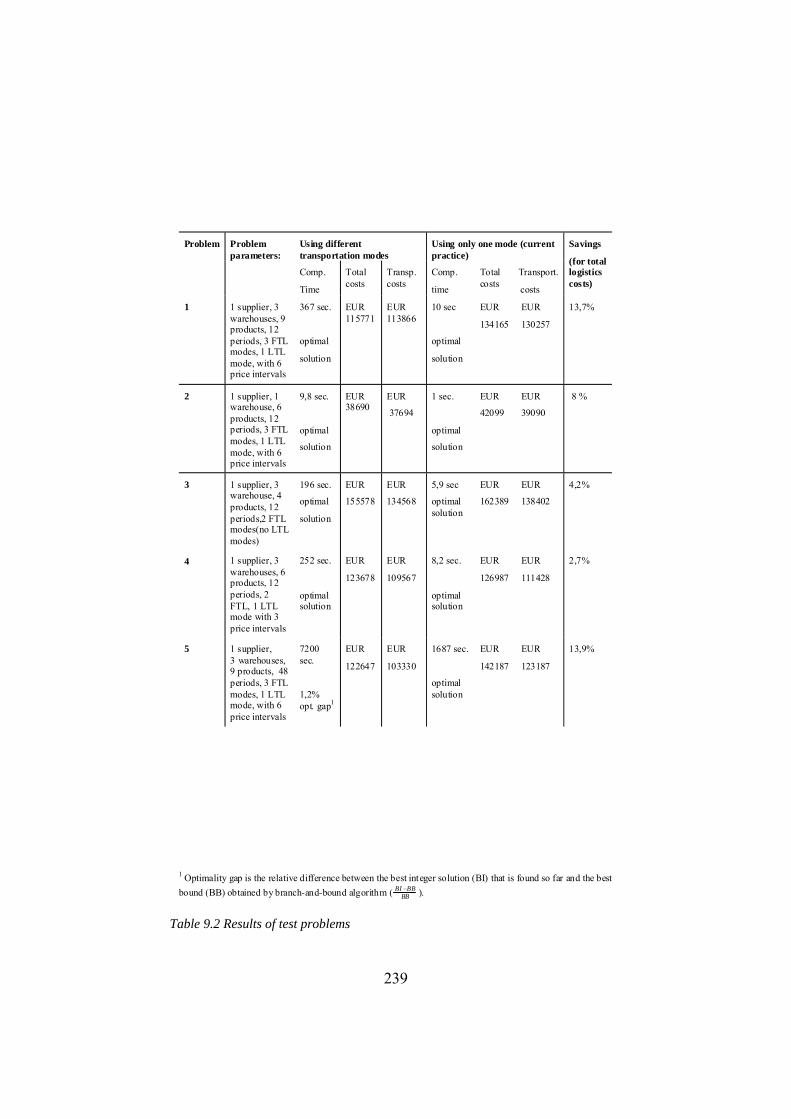
239
1 Optimality gap is the relative difference between the best integer solution (BI) that is found so far and the best bound (BB) obtained by branch-and-bound algorithm ( BB
BBBI − ).
Using different transportation modes
Using only one mode (current practice)
Problem Problem parameters:
Comp.
Time
Total costs
Transp. costs
Comp.
time
Total costs
Transport.
costs
Savings
(for total logistics costs)
1
1 supplier, 3 warehouses, 9 products, 12 periods, 3 FTL modes, 1 LTL mode, with 6 price intervals
367 sec.
optimal
solution
EUR 115771
EUR 113866
10 sec
optimal
solution
EUR
134165
EUR
130257
13,7%
2 1 supplier, 1 warehouse, 6 products, 12 periods, 3 FTL modes, 1 LTL mode, with 6 price intervals
9,8 sec.
optimal
solution
EUR 38690
EUR
37694
1 sec.
optimal
solution
EUR
42099
EUR
39090
8 %
3 1 supplier, 3 warehouse, 4 products, 12 periods,2 FTL modes(no LTL modes)
196 sec.
optimal
solution
EUR
155578
EUR
134568
5,9 sec
optimal solution
EUR
162389
EUR
138402
4,2%
4 1 supplier, 3 warehouses, 6 products, 12 periods, 2 FTL, 1 LTL mode with 3 price intervals
252 sec.
optimal solution
EUR
123678
EUR
109567
8,2 sec.
optimal solution
EUR
126987
EUR
111428
2,7%
5 1 supplier, 3 warehouses, 9 products, 48 periods, 3 FTL modes, 1 LTL mode, with 6 price intervals
7200 sec.
1,2% opt. gap1
EUR
122647
EUR
103330
1687 sec.
optimal solution
EUR
142187
EUR
123187
13,9%
Table 9.2 Results of test problems
240
Using multiple modes implied cost savings for all problems, varying between 3 % and 14%. We were able to find the optimal solution in all 12-period problems, but for the 48-period problem (Problem 5) there was still an optimality gap of 1,2 % after 2 hours, indicating that the number of periods has a big impact on the solution time. Number of available modes and price breaks also seem to influence the computational time, as could be expected. The examples indicate that one can expect cost savings from using multiple modes, especially for situations where one can choose among many different modes and where LTL-rates are characterized by many price-breaks. A better solution technique or problem-specific algorithm is needed for problems with longer planning horizon, in order to reduce the computational time. We also have tested the impact of using our model on a base case problem with changing parameters, described in table 3. In the base case 7 products are shipped from a supplier to one warehouse, the planning horizon is 12 months and there are 4 transportation modes available. One can choose among 3 FTL modes (FTL1: boat, 40”, max.35 pallets, 2939EUR; FTL2: boat 20”, max 17 pallets, 2487EUR; FTL3: truck, max 30 pallets, 2869EUR), and 1 LTL mode with 6 price intervals with over-declaring possibility.
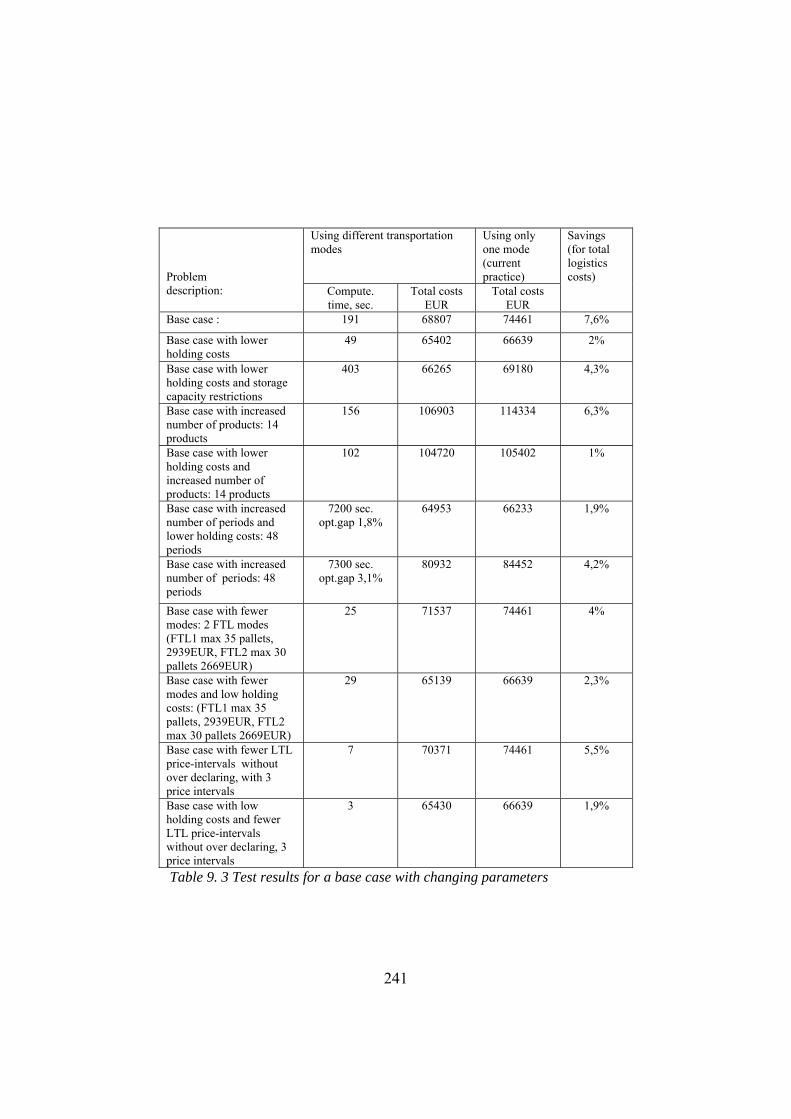
241
Table 9. 3 Test results for a base case with changing parameters
Using different transportation modes
Using only one mode (current practice)
Problem description: Compute.
time, sec. Total costs
EUR Total costs
EUR
Savings (for total logistics costs)
Base case : 191 68807 74461 7,6%
Base case with lower holding costs
49 65402 66639 2%
Base case with lower holding costs and storage capacity restrictions
403 66265 69180 4,3%
Base case with increased number of products: 14 products
156 106903 114334 6,3%
Base case with lower holding costs and increased number of products: 14 products
102 104720 105402 1%
Base case with increased number of periods and lower holding costs: 48 periods
7200 sec. opt.gap 1,8%
64953 66233 1,9%
Base case with increased number of periods: 48 periods
7300 sec. opt.gap 3,1%
80932 84452 4,2%
Base case with fewer modes: 2 FTL modes (FTL1 max 35 pallets, 2939EUR, FTL2 max 30 pallets 2669EUR)
25 71537 74461
4%
Base case with fewer modes and low holding costs: (FTL1 max 35 pallets, 2939EUR, FTL2 max 30 pallets 2669EUR)
29 65139
66639
2,3%
Base case with fewer LTL price-intervals without over declaring, with 3 price intervals
7 70371 74461 5,5%
Base case with low holding costs and fewer LTL price-intervals without over declaring, 3 price intervals
3 65430
66639
1,9%

242
The results indicate, for example, that the savings from using several modes increase when the holding costs are high. Use of small LTL shipments in combination with FTL shipments contribute to reduction of holding costs. This is especially important for shippers that use 3PL warehouses with “value-adding” activities, such as re-packaging, assembly, re-labelling, storage under special conditions (humidity, temperature) etc. Holding costs in such multi-clients facilities are often higher than in warehouses where products are only stored. We have also noticed that in a situation where holding costs are relatively low, storage capacity is high and one of the modes is dominant (for example FTL1, 40” has the cheapest unit price), the savings from using different modes comparing to using one mode with the lowest unit costs are not so high. That is because the model selects the dominant mode also for the multi-mode case. We assume that the decision maker uses dynamic lot-sizing for replenishment planning in both cases. It would be interesting to study a situation where also the price per FTL container exhibits economies of scale for each shipment. Use of multiple modes is also beneficial when the storage capacity is limited but the holding costs are still low. The complexity of the model in terms of computational time increases in the following situations:
• when the price structure for LTL-shipments allows over-declaration and includes many price intervals
• when the number of pallets shipped and inventories are integer variables.
• when storage costs run per pallet stored and not per unit. Then we have tested the impact of transhipments on a base case problem with changing parameters described in table 4. In the base case 9 products are shipped from a supplier to two warehouses, the planning horizon is 12 months and there are 4 transportation modes available. One can choose among 3 FTL modes (FTL1: boat, 40”, max.35 pallets, FTL2: boat 20”, max 17 pallets, FTL3: truck, max 30 pallets,), and 1 LTL mode with 6 price intervals with over-declaring possibility. Transportation modes for transhipments are FTL (max 33 pallets) and LTL mode with 6 price intervals and no over-declaring possibility. The results indicate that lateral warehouse transhipments and the use of different transportation modes or a combination of modes can decrease the total logistics costs by 6-11%. However we observe that the computational time increases and a better solution technique or problem-specific algorithm is needed for problems with transhipments, in order to reduce the computational time.
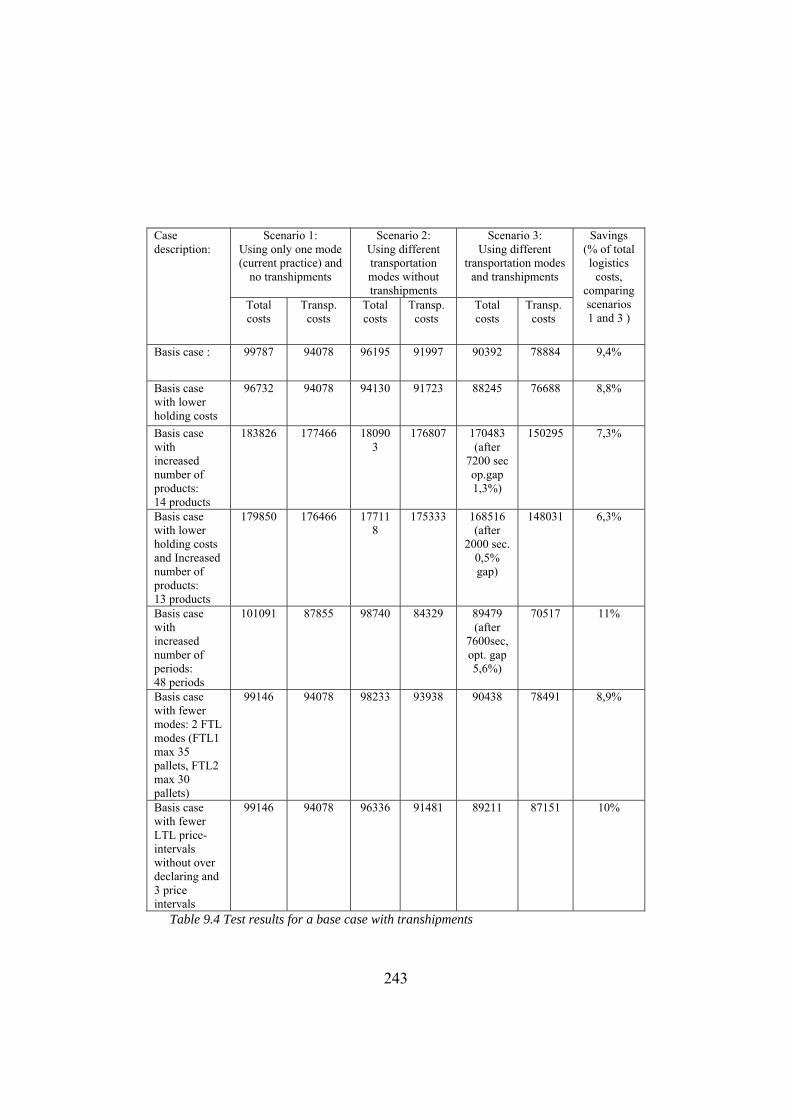
243
Table 9.4 Test results for a base case with transhipments
Scenario 1: Using only one mode (current practice) and
no transhipments
Scenario 2: Using different transportation modes without transhipments
Scenario 3: Using different
transportation modes and transhipments
Case description:
Total costs
Transp. costs
Total costs
Transp. costs
Total costs
Transp. costs
Savings (% of total logistics
costs, comparing scenarios 1 and 3 )
Basis case : 99787 94078 96195 91997 90392 78884 9,4%
Basis case with lower holding costs
96732 94078 94130 91723 88245
76688 8,8%
Basis case with increased number of products: 14 products
183826 177466 180903
176807 170483 (after
7200 sec op.gap 1,3%)
150295 7,3%
Basis case with lower holding costs and Increased number of products: 13 products
179850 176466 177118
175333 168516 (after
2000 sec. 0,5% gap)
148031 6,3%
Basis case with increased number of periods: 48 periods
101091 87855 98740 84329 89479 (after
7600sec, opt. gap 5,6%)
70517 11%
Basis case with fewer modes: 2 FTL modes (FTL1 max 35 pallets, FTL2 max 30 pallets)
99146 94078 98233 93938 90438 78491 8,9%
Basis case with fewer LTL price-intervals without over declaring and 3 price intervals
99146 94078 96336 91481 89211 87151 10%

244
9.7 Managerial implications and extended use It is important for managers to know how much the simplification of choosing only one mode might cost. On the other hand, the possibility of using dynamic allocation of shipments to different transportation modes depends on the ordering routines both for the buyer and the supplier. For example, changing the container size during the year can be inconvenient for some product suppliers, because transportation orders must be coordinated with the production batch-size. In the case company, the decision support system for replenishment planning does not support the choice among different transportation modes. Then the company faces a trade-off between investment costs for a system that does support such decisions and the lost savings from continuing without it. Anyway, the choice of optimal transportation mode is in many cases not a trivial task. The presented model can be extended in several ways. As shown by Blauwens (2006), both quantitative and qualitative criteria are taken into account in freight modal choice decisions: cost/price rate, lead-time performance (the speed and reliability of delivery), loss and damage (safety), flexibility, infrastructure availability and capacity, regulation, controllability/traceability, environmental considerations etc. Our model considers quantitative criteria based on costs only. It is however interesting to extend the model by quantifying and taking into account also other criteria. Studying the impact of transportation lead-times on safety stocks costs is another direction for future research. The model can also be used for choosing the best trading terms - Incoterms42, when buyers have several delivery options and corresponding purchasing prices, such as FOB condition (free delivery to the nearest harbour) at price A versus Ex-works (the buyer arranges and pays for delivery from supplier’s facility) at price B. One can extend the model by including various discount schedules offered by the product supplier or special types of contracts. For example, van Norden and Velde (2005) describe a special case of a capacity reservation 42 INCOTERMS or International Commerce Terms, is a set of uniform rules for the interpretation of commercial terms defining the costs, risks, and obligations of buyers and sellers in international transactions. Incoterms deal with the questions related to the delivery of the products from the seller to the buyer, including transportation, export and import clearance responsibilities, who pays for what, and who has risk for the condition of the products at different locations within the transport process.
245
contract, pointing out a difference between systematic and spot buying of transportation capacity. In systematic buying, the shipper can have a capacity reservation contract with one or more logistics service providers, which allows him to use any portion of reserved fixed capacity for a guaranteed fixed price lower than the spot market price. For this type of contract, the exceeded capacity should be bought at the spot market at higher price, given that the actual volume is higher than the reserved capacity. References Anily, S., Tzur M.(2005), ”Shipping Multiple Items by Capacitated Vehicles: An Optimal Dynamic Programming Approach”, Transportation Science, Vol. 39 Issue 2, pp.233-248. Axsater S.:”A New Decision Rule for Lateral Transhipments in Inventory Systems”; Management Science, Sep2003, Vol. 49 Issue 9, p1168-1179 Blauwens, G., Vandaele, N.(2006), ”Towards a Modal Shift in freight transportation?” Transport Reviews, Vol. 26 Issue 2, pp.239-251. Brahimi N., Dauzere-Peres S., Najid N., Nordli A.: “Single item lot sizing problems”; European Journal of Operational Research, Volume 168, Issue 1, 1 January 2006, pp. 1-16 Chan, L., Muriel, A., Shen, M., Simchi-Levi, D., Chung-Piaw, T.(2002), ”Effective Zero-Inventory-Ordering Policies for the Single-Warehouse Multiretailer Problem with Piecewise Linear Cost Structures”, Management Science, Vol. 48 Issue 11, pp.1446-1460. Diaby, M., Martel, A.(1993), “Dynamic lot sizing for multi-echelon distribution systems with purchasing and transportation”, Operations Research, Vol. 41 Issue 1, pp.48-53. Gümüs M., Bookbinder J.: ”CROSS-DOCKING AND ITS IMPLICATIONS IN LOCATION-DISTRIBUTION SYSTEMS”; Journal of Business Logistics, 2004, Vol. 25 Issue 2, p199-228 Herer Y., Roundy R.:”Heuristics for a one-warehouse multiretailer distribution problem with performance bounds”; Operations Research, Jan/Feb97, Vol. 45 Issue 1, p102 Herer Y.and Tzur M.: ”The Dynamic transhipment problem”, Naval Research Logistics, vol 48 (2001), p.386-408
246
Heragu, S. S.; Du, L.; Mantel, R. J.; Schuur, P. C.:”Mathematical model for warehouse design and product allocation”, International Journal of Production Research, 1/15/2005, Vol. 43 Issue 2, p327 Jaruphongsa, W., Çetinkaya, S., Chung-Yee, L.(2005), ”A dynamic lot-sizing model with multi-mode replenishments: polynomial algorithms for special cases with dual and multiple modes”, IIE Transactions, Vol. 37 Issue 5, pp.453-467. Karmarkar U.: ”The multilocation multiperiod inventory problem: bounds and approximations”; Management Science, Jan87, Vol. 33 Issue 1, p86-94 Li, C., Ning, H., Wen-Qiang, X. (2004), “Dynamic Lot Sizing with Batch Ordering and Truckload Discounts”, Operations Research, Vol. 52 Issue 4, pp.639-654. Qu, W., Bookbinder, J., Iyogun, P. (1999), “An integrated inventory-transportation system with modified periodic policy for multiple products”, European Journal of Operational Research, Vol. 115 Issue 2, pp.254-269. Rizk, N., Martel, A., D’Amours, S. (2006), “Multi-item dynamic production-distribution planning in process industries with divergent finishing stages”, Computers & Operations Research, Vol. 33 Issue 12, pp.3600-3623. Robinson L.: ”Optimal and approximate policies in multiperiod, multi-location inventory models with transshipments”; Operations Research, Mar/Apr90, Vol. 38 Issue 2, p278 Sambasivan M., Yahya S.:” A Lagrangean-based heuristic for multi-plant, multi-item, multi-period capacitated lot-sizing problems with inter-plant transfers”; Computers & Operations Research, Mar2005, Vol. 32 Issue 3, p537-555 Swenseth, S., Godfrey, M. (2002), “Incorporating transportation costs into inventory replenishment decisions”, International Journal of Production Economics, Vol. 77 Issue 2, pp.113-130. Tagaras G., Vlachos D.: ”Effectiveness of Stock Transhipment under Various Demand Distributions and Nonnegligible Transhipment Times”; Production & Operations Management, Summer2002, Vol. 11 Issue 2, p183-198 Van Norden, L., Van de Velde, S.(2005),”Multi-product lot-sizing with a transportation capacity reservation contract”, European Journal of Operational Research, Vol. 165 Issue 1, pp.127-138.
247
PART IV CONCLUSIONS AND IMPLICATIONS In this section, part IV, we have chosen to address two topics based on a cross-case analysis. First, the topic logistics service providers as intermediaries is addressed. Secondly, we have tried to summarize some major managerial and theoretical implications of the study.

248

249
CHAPTER 10
Distribution networks in transition: the role of intermediaries43
Erna Senkina Engebrethsen, Bente Flygansvær,
Leif-Magnus Jensen, and Gøran Persson Modern distribution research frequently focuses on dyads and supplier-buyer relationships. In contrast, this article is based on research focusing on entire distribution systems and intermediaries. The data used in this article is from a four-year research project at the Norwegian School of Management. The main purpose of the research has been to understand transitions or movements in three different industries: new car distribution, distribution of fast moving consumer goods, and recycling of electronic goods. In this article the transitions in the three industries are analysed using a framework with three main elements:
1. Drivers (such as competition, technology, microeconomic, operational, etc.).
2. System features (such as interfirm economies and interdependencies, coupling, supply chain responsiveness, etc.)
3. Outcomes in terms of implications for intermediaries in each system. Based on the analysis of these three systems we develop proposals specifically on intermediaries and their roles and business opportunities in modern distribution arrangements.
10.1 Introduction – developments in trade and distribution Gripsrud et al., 2006) suggest that distribution arrangements are becoming more and more complex. At the same time research into distribution channels has been split into two streams. One stream deals with business logistics dealing with physical distribution based on a process orientation. Another deals with marketing channels and increasingly focuses on the marketing manager and business unit level. The authors suggest that in
43 Paper first presented at the NOFOMA-conference in Reykjavik , June, 2007.
250
order to improve understanding of this area it is imperative to go beyond the business unit and draw on some of the thinking in early marketing theory as well as more recent supply chain management thinking. This forms the backdrop for this study, but here we have chosen to focus strongly on empirical studies. A few overall empirical observations indicate that distribution networks actually are in transition. Ever since the early 60’s trade has been growing faster than the growth of GNP. This simple fact means that what we, and the companies, are buying is to an increasing degree produced in other countries. It also means that cross border, or international distribution, is increasing faster than national transportation. As the traded volumes increase, so do the volumes transported and distributed in the world. Distribution as an industry is becoming even more significant. Another fact that can be observed in pure numbers is that companies are increasingly sourcing in countries representing lower costs. They are also moving parts of their production (or out-shoring) to the same countries. Thus, while production continuously is increasing in countries and regions such as China, India, the Baltics, Russia, and Central Europe, there is a decrease in production in western European countries. Looking at European companies, not only are they to a larger extent sourcing in other European markets, but also in the new and emerging markets. The growth in trade and changes in trade patterns have a significant impact not only on the flow of goods but also on the supply-, production- and distribution systems. Sourcing and supply decisions are normally influenced when production is transferred to another country, and so are distribution decisions. Moving production from for instance Europe to India often involves a shift of suppliers as well as a new distribution arrangement. Transportation, warehousing and other logistics service providers involved in the collection, consolidation, storage, reloading, tracking, and controlling the movement and storage of goods represents a significant part of the economy. Being essential as an industry, it has also been and still is an industry changing rather fundamentally, and the individual players are facing new pressures and challenges of a strategic as well as of a structural nature. The deregulation process that has taken place in the freight forwarding industry since the late 80s, nationally as well as internationally has challenged the traditional national structures. In recent years, the structural changes in the logistics industry have continued and accelerated. Today, we see between 250 and 500 takeovers and acquisitions annually (Andersen Corp Finance Beratung GmbH), half of them across borders. European

251
buyers are leading globally, and most buyers are to be found in Germany, UK, France, BeNeLux, and Scandinavia. The former postal monopolies are dominating buyers, as the former transport companies are developing into logistics companies. Thus, the empirical evidence indicates that the traditional local and national transportation companies are transforming into regional, pan-European or global logistics service providers. New and different distribution networks are emerging as the logistics service providers are repositioning themselves. Parallel to the pressures that followed the deregulation process, customer needs and expectations have been changing. Customers or shippers are developing competitive advantage not only based on products and product features, but also based on superior delivery processes. Buying firms increasingly require customized offerings from their suppliers of distribution services, implying that distribution solutions are tailored to industrial end user requirements (Gadde, 2003). More activity specialization can be observed among distribution service providers. This gives rise to specialized intermediaries rather than multi-functional distributors, expanding the number of actors involved in the delivery of a product to a particular end customer. Simultaneously, the demands on coordinating the supply processes are increasing. Owing to the enhanced specialization among firms, the supply processes increasingly span the boundaries of several firms or organizations. By sharing capabilities and resources, channel members can offer better service at a lower cost than they could by acting alone. It has often been argued that the ongoing changes lead to more differentiated distribution systems than traditionally was the case, and to stronger interdependencies among the actors and therefore also closer relationships. Manufacturing and producing companies have outsourced not only traditional distribution activities, such as warehousing and transportation operations, but also managerial activities related to the flow of goods as well as certain production activities, such as kitting and sub-assembly operations, to logistics service providers. Simultaneously, the logistics service providers have developed their capabilities both in terms of broader service offerings and in terms of providing solutions adapted to specific customers or customer segments. Though the majority of companies still do much of their logistics in-house, the 3PL market represents the fastest growing market for logistics service providers, which means that this trend of logistics outsourcing will continue.
252
These developments in distribution arrangements have triggered an interest among managers as well as researchers for a whole range of empirical issues including firm positioning, exchange processes, adaptation and coordination, as well as the dynamics of distribution systems. These empirical developments have also been an important background to this project. The world of logistics as well as the world of distribution is changing and it seems crucial to try to understand at least some of the aspects of these changes. The intention, and one purpose of the study, was to better understand the transition processes in specific and targeted industries, thus to study distribution networks in transition. The focus of this study has been not on logistics service providers, but on logistics service providers as actors in a distribution network.
10.2 Research approach and participating companies Two basic research approaches were applied in the project as far as the empirical studies are concerned. One approach was studies of the industry structure in relation to the participating companies. By this approach, the intention was to describe the industry, the transition processes in the industry, driving forces for changing positions, trends and patterns concerning the transition etc. The second approach was different studies of the distribution networks in which the participating companies take part. By this approach, we intended to explore issues concerning properties of distribution networks, contingencies for design of logistics and distribution networks, embeddedness as a contingency for specialization and integration etc. When determining which industries might be interesting and interested in the study, an important criterion was that major changes could be observed in the industry, challenging and changing the roles and positions of the actors. After having considered several such industries we choose to focus on three: the electronics waste industry, the car industry, and the fast moving consumer goods (FMCG) industry, or rather segments of these industries. In the following sections the transitions in the three industries will be described and discussed, and in the last section we will discuss inter-mediaries and their roles and business opportunities in modern distribution.
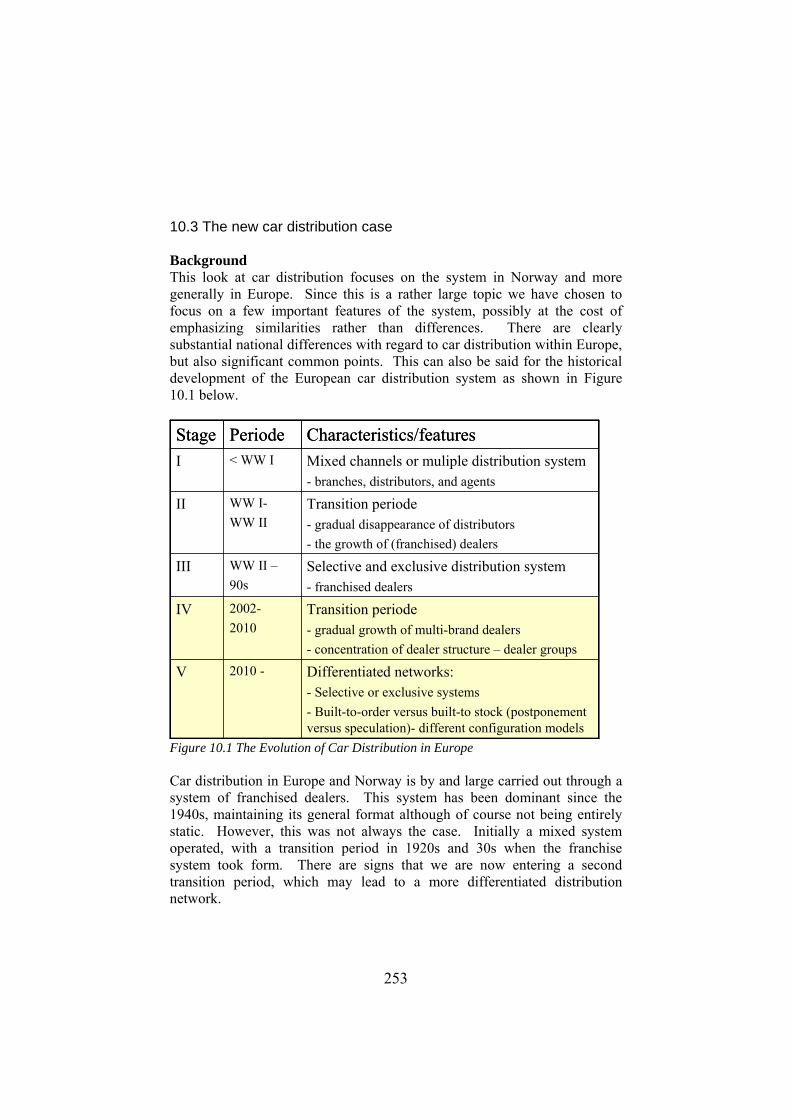
253
10.3 The new car distribution case Background This look at car distribution focuses on the system in Norway and more generally in Europe. Since this is a rather large topic we have chosen to focus on a few important features of the system, possibly at the cost of emphasizing similarities rather than differences. There are clearly substantial national differences with regard to car distribution within Europe, but also significant common points. This can also be said for the historical development of the European car distribution system as shown in Figure 10.1 below.
Transition periode- gradual growth of multi-brand dealers- concentration of dealer structure – dealer groups
2002-2010
IV
Differentiated networks:- Selective or exclusive systems- Built-to-order versus built-to stock (postponementversus speculation)- different configuration models
2010 -V
Selective and exclusive distribution system - franchised dealers
WW II –90s
III
Transition periode- gradual disappearance of distributors- the growth of (franchised) dealers
WW I-WW II
II
Mixed channels or muliple distribution system- branches, distributors, and agents
< WW II
Characteristics/featuresPeriodeStage
Figure 10.1 The Evolution of Car Distribution in Europe Car distribution in Europe and Norway is by and large carried out through a system of franchised dealers. This system has been dominant since the 1940s, maintaining its general format although of course not being entirely static. However, this was not always the case. Initially a mixed system operated, with a transition period in 1920s and 30s when the franchise system took form. There are signs that we are now entering a second transition period, which may lead to a more differentiated distribution network.
254
In the basic franchise system, contracts are granted to franchised dealers who get the exclusive right to sell a particular brand of car in a particular area. Dealers buy cars from the manufacturer and take the risk that they cannot be sold. They are also limited in that they cannot operate outside their own area, and have to follow manufacturer standards as well as provide after-sales service and workshop services. On the other hand the structure is set up so dealers only have to focus on competing with other brands, and the basic margins for the dealers on sold cars have traditionally been perceived as rather high.
System features
There are a number of significant features of the car distribution system that should be considered. Firstly, it represents a large sector of the economy, meaning both that the industry is watched by policymakers, and that it affects most consumers since a majority of the population either own or use a car. Some features are largely inherent in the nature of the product. The fact that each individual car is a major investment (normally second only to house purchases for regular consumers) means that many customers are willing to spend time on finding the best option. It also means the value of customer loyalty is high. Cars then are a relatively high volume, high value proposition in terms of distribution. Furthermore, the cost of even superficial damage is high. Typically scratches to the paintwork and minor bumps do not affect the performance of the car but strongly reduce the value in the eyes of the customer. Maintaining standards in handling and transport is very important then to keep the distribution related costs low. There are also a number of fixed points in the distribution system, namely car ports and the car transport routes of the shipping companies. These points are adapted to the needs of the car industry as a whole, but are not easy to change. This is the case both because investments in car port facilities are large and because the shipping companies depend on pooling volumes to achieve efficiency. Smaller manufacturers in particular must treat these points as given and even for larger ones the costs of change may be prohibitive. The high degree of manufacturer power and control over the distribution system is perhaps a dominant feature of the system. Manufacturers decide on most of the relevant standards in both distribution and retail, and although most manufacturers do not own the majority of their retail outlets, they have to a large extent structured the entire distribution system. In 2000 there were 55,000 franchised outlets in Europe, representing 45,000 owners. The dealers are generally small and fragmented, although some chain-like

255
structures are emerging in some European countries. Compared to the manufacturer these are still not significant in terms of size however.
Drivers
As mentioned, the size of the automotive sector in itself makes it the subject of scrutiny from the legal authorities. The EU has examined the sector and wants to encourage increased competition in the retail and distribution of automobiles. However, the franchise arrangement has been accepted on a temporary basis in what is known as the “block exemption” agreement. This type of agreement can be made for a sector of the economy where the general competition rules of the EU are not enforced for a particular sector because the current arrangements are effective or produce superior welfare. Increasingly, however, the EU has updated this arrangement with a view to reducing manufacturer control over the distribution system and strengthening competition. In summary, the changes introduced by the EU have targeted three particular issues. One is the selectivity criterion – i.e. the ability of manufacturers to choose exactly which dealers can sell their products. The block exemption now states that manufacturers can only specify what is required in terms of facilities, equipment and standards in order to become a dealer – they cannot deny specific dealers which fulfil these requirements the right to sell their cars. So far, however, this has mainly lead to manufacturers being far more exacting in terms of what is required of a dealer. This has led to a lock-in effect since the investments made are large for any particular dealer and in effect tie them even more strongly to their particular manufacturer. The second is the exclusivity criterion – the ability to assign specific territories. Now, manufacturers can assign territories to specific dealers. They cannot however prevent dealers from selling to third-party resellers that operate independently across the assigned territories. A further requirement is that manufacturers must now choose one of the two options – i.e. either selectivity or exclusivity. They are no longer allowed to impose both restrictions on their dealers. A final change is that service and repair is from 2005 legally separated from sales, so that independent repair shops can offer authorized repairs for particular brands of car. The manufacturers are required to furnish these shops with all necessary technical information and spare parts to carry out repairs at normal terms. The block exemption is taken very seriously by the car manufacturers and they have spent considerable effort lobbying in order to tone down the changes. However, at the dealer level large changes have not yet been noticed. It remains an open question whether regulations are a paper tiger or whether they will have the intended impact.

256
A very real driver however is the overcapacity in the car manufacturing industry and the consequent pressure for cost reductions in distribution. Margins for dealers in particular are dropping, and manufacturers want to differentiate the elements of the dealers’ margins and make them more performance-dependent. Numbers from 2000 show that the gross margins in car distribution are half those of for example home appliances or furniture. The increase in the market share of overseas manufacturers (mainly Japanese and South-Korean) has several strong implications for distribution. Much of the production from the car makers who are increasing their market share is situated overseas, leading to long supply lines and the need for new distribution capacity. At the same time it is difficult for European manufacturers heavily tied to particular distribution points to reorganize their distribution, whether this is to draw on the advantages of being closer to the market, or as a consequence of reduced sales.
Outcomes
In this type of setting there is clearly a role for intermediaries who can work across several manufacturers’ systems and achieve economies of scale. This is both the case in basic transportation and in common services such as PDI (pre-delivery inspection). To a large extent the requirements of the different manufacturers vary, but as the block exemption takes effect or the strength of the intermediaries increases, it may be the intermediaries who are able to define a common standard at least for limited areas. A number of manufacturers now want regional solutions, i.e. they want to be able to talk to the same transporters or logistics service provider for all of Scandinavia. This makes it harder for local providers but is also an opportunity for those able to achieve sufficient regional presence.
10.4 The case of reverse distribution system for collecting electric and electronic products at end-of-life The Norwegian government has addressed society’s waste issues by collaborating with the trade and industry to establish reverse distribution systems. In due course they have worked systematically with different industries, like paper, glass, plastics, metal etc. As reverse distribution systems are established for one industry, the government has shifted focus to a new industry. This case is taken from the period when the reverse distribution systems for collection of electric and electrical products at end-of-life were established in Norway.
257
Industry features - drivers
In March 1998 the Norwegian Ministry of Environment passed ‘Regulations regarding scrapped electrical and electronic products’ (EE-Regulations), and at the same time entered into an agreement with the EE-industry (the industry agreement). The industry formally took on the responsibility to set up national systems for collection and reprocessing of EE-products at end-of-life, and to achieve an 80% collection rate44. The EE-industry addresses in this manner their producer responsibility, which is a fundamental principle of the Norwegian government. The EE-Regulations and the industry agreement came into force July 1st 1999. The EE-industry established Waste Management Companies (WMCs) to take the operative responsibility for the reverse distribution systems. On one side this represented a task to recruit members to the system, and on the other side structure and organize a collection system. In light of the mandatory producer responsibility that faces each EE-company, it is however voluntary for each EE-company to decide how to solve their individual collection issues. The industry agreement has provided a collective solution, but each EE-company has to sign a membership with the WMCs. In this manner, they choose one way to solve their producer responsibility, and transfer their obligations to the WMCs. For the memberships they pay an annual fee. Alternatively, an EE-company has to establish individual reverse distribution systems. The WMCs use these funds to structure and organize a collection system, which is done by offering contracts to actors in the waste industry for collection, transport and reprocessing. The collection rates are reported back to the government. The Norwegian Pollution Control (NPC) was given the task of controlling the reverse distribution systems. In practice, this meant that the WMCs had to report their performances to NPC twice a year. If an EE-company chose to establish an individual reverse distribution system, they also had to report performances individually. A five-year time frame was set up for the EE-industry to prove they were able to take the responsibility for the reverse distribution systems for collection of EE-products at end-of-life. That is, the government expected the reverse distribution systems to achieve an 80 % collection level for EE-products at end-of-life by July 1st 2004.
44 An independent consultancy company calculated a reference volume reported in “The collection and handling of waste from electronic and electrical products” (Hjellnes COWI 1996).

258
The structuring of the reverse distribution systems is shown in the following figure.
Figure 10.2 The relationships within the industry agreement The figure summarizes the structuring of relationships on the industry level; how the government has made agreement with the industry, how the industry has operationalized the responsibility through the WMCs, and how the WMCs need to recruit members from the EE-companies and report performances to the government.
The reverse distribution systems - system features
In the industry agreement, the EE-industry was divided into three categories; one for consumer electronics, one for white goods and household appliances and one for general electric products. A WMC was established within each of these categories, with the responsibility to structure and organize their separate reverse distribution systems. Thus, the WMC was the central organizer of the system. They were securing funding from the EE-industry to finance the collection system, accompanied also with the legal responsibilities, and securing contracts from the waste industry to be able to produce collection rates. This is illustrated in the figure below:

259
Figure 10.3 The task of the waste management companies The three WMCs decided to organize two collection systems. The WMCs for consumer electronics and white goods and household appliances decided to integrate their operations in one system, as they found that collection sites and transport patterns to be highly overlapping and integrated. A second collection system was established for general electric products. In addition however, a third independent system was established. A selection of EE-companies importing ICT equipment found the systems established within the industry agreement not suitable for their products, and therefore decided to establish a specialized system for their products. Two WMCs were registered with the government, where one of the WMC organized a collection system for reuse, and the other organized a collection system for recycling. We refer to the three reverse distribution systems as the El-retur system, the RENAS system and the independent system. The table lists the product category, the WMCs, and the reverse distribution system:
Product category
Consumer electronics
White goods and household appliances
General electric products
ICT equipment
Responsible WMC
Elektronikkretur AS
Hvitevareretur AS
RENAS AS Eurovironment AS RagnSells AS
Collection system
The El-retur system The RENAS system
The independent system
Table 10.1 The categories of reverse distribution systems
Transition features - outcomes
The reverse distribution systems were studied over the first five-year period from 1999 until 2004, and system performance was measured against the 80 % collection rate. At the time of establishment of the systems (i.e. in 1999), the systems were very similar. However, at the end of the period, the systems were organized differently. Also, the systems scored differently with
260
respect to system performance. One of the systems had managed to achieve an 80 % collection rate, while the others did not fully reach this goal. The El-retur system and the RENAS system were established as a consequence of the industry agreement, and the similar industrial process led to a similar structure of the reverse distribution system. The collection systems were established with collection sites, transport operators and reprocessing units. The WMCs signed three-year contracts with the operators of the collection system. Moving into the second contract period, the systems developed in different directions. Both systems were characterized as highly centralized when being established, but toward the end of the period the RENAS system was characterized as decentralized, while the El-retur system had strengthened the centralization. Examples of systems differences were found in the consumer segments the systems addressed. The El-retur system mainly addressed private consumers, while the RENAS system addressed business-to-business relationships. Thus, the collection pattern of the users of the systems was different. A second difference was the characteristics of the EE-products collected. The El-retur system faced highly heterogeneous product categories, while the RENAS system faced more homogenous product categories. Also, in the RENAS system the products were often had valuable contents (like copper and steel), which the market was willing to pay for. The El-retur system was dependent on compensating the market to reprocess the products. The funding was thus a more challenging task in the El-retur system. The independent system was established as a consequence of the centralization features of the system. The ICT equipment demanded different activities, and also the system offered a reuse option for the products (specifically involving computers). In addition, the EE-companies disagreed on the funding principles within the El-retur system. In summarizing the transition features of the reverse distribution system we have found that the different categories of EE-products demanded highly adapted and specialized solutions, both in terms of funding and collection. This was not foreseen at the outset, as the systems were then structured and organized in a highly similar manner.
261
10.5 The FMCG case
Background
The case presented in this section describes logistics arrangements for FMCG, in particular, the distribution of alcoholic beverages in the Nordic countries. Most Scandinavian countries impose particular restrictions on alcohol retailing in terms of retail licenses (state monopolies) and product availability (limited opening hours for alcohol sales). The Norwegian “Vinmonopolet”, Swedish “Systembolaget” and Finnish “Alko” are state-owned monopoly systems for alcoholic beverages retail sales. The alcoholic beverages are available for retail sale only in specialized stores during the opening hours and for persons above the lower age limit. There are 410 Systembolaget retail stores in Sweden, 210 Vinmonopolet stores in Norway and 327 Alko stores in Finland. The monopoly on the retailing of alcoholic beverages is based primarily on reasons related to social and health politics, and is intended to limit the availability of alcohol through control of the establishment of stores and their opening hours. Until 1996 the state had also monopoly on production, import and export, as well as on trade with food service industry (HoReCa)45. The European Economic Area (EEA) agreement, which came into effect on 1 January 1994, put renewed pressure on the monopoly system. In 1995 the European Commission and European Free Trade Association (EFTA46) Surveillance Authority, has recognized this part of monopoly as conflicting with the EEA agreement; thus it has been repealed on 1 January 1996. The retail sale of alcoholic beverages still remains a state monopoly. Since 1996 many different importers and producers of alcoholic beverages holding the required license for import have appeared on the Scandinavian market as a replacement for the former centralized system. It is usually the importer’s responsibility to deliver the products to the retail stores. The importers can either arrange the activities associated with delivering the product to the customers themselves, or they can outsource all or just a part of these activities to the service providers. Private companies have had the right to compete in offering physical distribution and
45 HoReCa refers to the food service industry, i.e. establishments which prepare and serve food and beverages. It is an acronym of the words hotel, restaurant and caterer. 46 The European Free Trade Association (EFTA) was established on May 3, 1960 as an alternative for European states that were not allowed or did not wish to join the European Community (now the European Union). Today only Iceland, Norway, Switzerland and Liechtenstein remain members of EFTA.
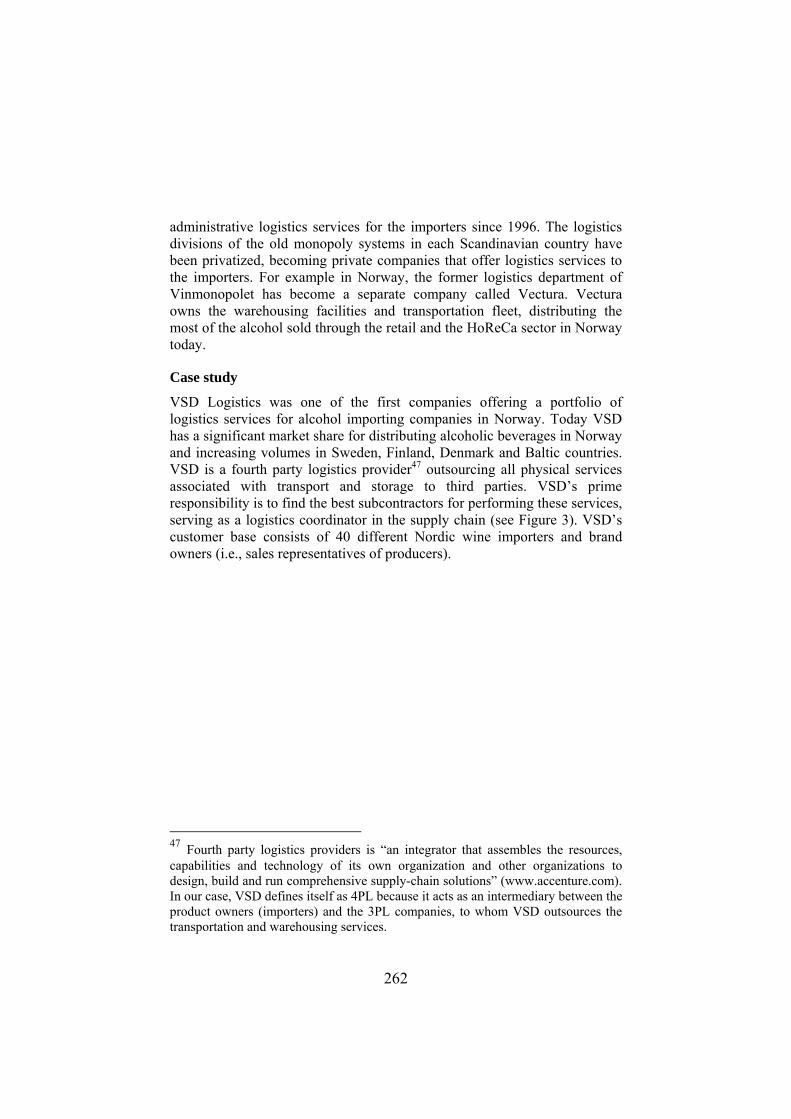
262
administrative logistics services for the importers since 1996. The logistics divisions of the old monopoly systems in each Scandinavian country have been privatized, becoming private companies that offer logistics services to the importers. For example in Norway, the former logistics department of Vinmonopolet has become a separate company called Vectura. Vectura owns the warehousing facilities and transportation fleet, distributing the most of the alcohol sold through the retail and the HoReCa sector in Norway today.
Case study
VSD Logistics was one of the first companies offering a portfolio of logistics services for alcohol importing companies in Norway. Today VSD has a significant market share for distributing alcoholic beverages in Norway and increasing volumes in Sweden, Finland, Denmark and Baltic countries. VSD is a fourth party logistics provider47 outsourcing all physical services associated with transport and storage to third parties. VSD’s prime responsibility is to find the best subcontractors for performing these services, serving as a logistics coordinator in the supply chain (see Figure 3). VSD’s customer base consists of 40 different Nordic wine importers and brand owners (i.e., sales representatives of producers).
47 Fourth party logistics providers is “an integrator that assembles the resources, capabilities and technology of its own organization and other organizations to design, build and run comprehensive supply-chain solutions” (www.accenture.com). In our case, VSD defines itself as 4PL because it acts as an intermediary between the product owners (importers) and the 3PL companies, to whom VSD outsources the transportation and warehousing services.

263
Transport providers - Inbound
- Outb ound
VSD ’s functions:• Negotiations with
service suppliers• IS/IT-solutions and
integration to total supply chain
• Invoicing• Inventory Management
VSD Warehousing providers
IT and factoringservice providers
Importers
Retail HoReCa
Figure10.4 VSD as a logistics coordinator Products are delivered from more than 700 supplier locations, and the largest product volumes are coming from France, Italy, Germany, Spain, South-Africa and USA. Importers negotiate purchasing prices and trading terms (Incoterms48) with suppliers. Trading terms define from which geographical location VSD Logistics has the responsibility for arranging transportation of the product from the supplier to one of the warehouses in Scandinavia. VSD selects and subcontracts the 3PL providers for transportation and warehousing for all importers. VSD is supposed to obtain better prices for the services from the subcontractors than the importers would do individually. VSD takes care of all operational decisions including the timing of a purchase, purchasing quantities, and modal choice both for inbound transportation (from suppliers to warehouses), and outbound transportation (from warehouses to retail stores). Currently, there is one warehouse in each of the countries VSD operates in. Different transportation modes can be used for inbound transportation (road, rail or maritime transportation). Outbound logistics, i.e., from warehouses to retail stores, is 48 INCOTERMS or International Commerce Terms, is a set of uniform rules for the interpretation of commercial terms defining the costs, risks, and obligations of buyers and sellers in international transactions. Incoterms deal with the questions related to the delivery of the products from the seller to the buyer, including transportation, export and import clearance responsibilities, who pays for what, and who has risk for the condition of the products at different locations within the transport process.

264
also handled via VSD. The retail outlets and HoReCa wholesalers place their orders directly to VSD, these orders usually include products from different importers. Outbound shipments from warehouses to retail outlets or wholesalers are delivered by truck within specific time windows with an order lead-time of 24-48 hours.
The transition in the industry
There are several factors driving the transition in the industry: Macroeconomic: In 1996 European Commission repealed the state monopoly on production, import and export of alcoholic beverages in Nordic countries. New importers have appeared, however most of them were product specialists with focus on marketing and little experience in logistics. Importers have faced a logistical challenge when delivering the products to all the retail monopoly shops within short time-windows in geographical dispersed areas and at the same time trying to maintain the service level and low logistics costs. These challenges have created a niche for actors like VSD. Technological: For 4 PLs information exchange is a critical factor for running the product flows effectively. Advanced inventory management system and logistics expertises create a competitive advantage for VSD. Microeconomic: Consolidation of high volumes from many importers gives bargaining power to VSD when negotiating with 3 PLs. At the same time economies of scale are achieved by shipping consolidated orders (products from many importers) from the warehouse to the retail stores. A high degree of customer power characterizes the distribution system for alcoholic beverages in Scandinavia, the retail monopoly systems have strict rules both for the selected product supplier and the delivery conditions. The branding policy of the importers doesn’t restrict to exclusive logistics arrangements, meaning that the same logistics company can deliver competing products, and the products are competing only about the shelf place at the retail store. The alcoholic beverage segment is highly competitive with very little consumer loyalty. Therefore, backlogging situations are rare, since the consumers purchase another similar product instead of the one that is not in stock. The demand for alcoholic beverage products is characterized by high seasonality, promotions, and differences in product life cycles. On the supply side of the supply chain the producers and importers experience a consolidation in the industries through mergers and
265
acquisitions, resulting in fewer but larger actors in the market. The importers try to reduce the number of their service providers, and logistics service providers with extended international presence are often preferred. Profit margins are squeezed and a rapid response to consumer demand is expected. Market growth and geographical expansion of VSD places an increased pressure on finding new and better ways of managing the product flows
10.6 The role of intermediaries in distribution arrangements
The delivery systems in the three cases described have different features concerning markets and demand characteristics, products and production, and the manner in which the supply chain is organised and controlled. Also, the pressures leading to transitions in the three cases described in this paper are somewhat different, albeit with some common points. This in combination creates a set of opportunities for intermediaries and logistics service providers. Business opportunities for intermediaries are related to the organisation of the supply chain or network, or to the integration and coordination of the process.However, the potential logistics role for intermediaries varies in the three cases. In the car distribution case, the product represent a significant spend for the consumer. There are also significant investments in all stages of the supply chain - for the manufacturer related to product development and production, in distribution the different actors must make major investments in ports, terminals, ships as well as special vehicles for car transportation etc. The pooling of resources becomes an important factor for efficiency in the distribution system. Economies of scale and process integration therefore become the two major parameters in the distribution system. There are important interdependencies among the actors as far as time and quality is concerned, creating a need for process integration. There are time-related as well as functional interdependencies that have to be handled among the actors. From a logistical point of view however, the manufacturers are, and have been, rather powerful. Therefore they have had a significant impact not only on the design of the distribution arrangement, but to a large extent they are also controlling the actual flow of goods in the channel. In fact, there is a need for them to do so, since demand uncertainty is high in production, while it is low in distribution, meaning that the total volumes of cars and types of cars are rather predictable, while forecast at the specific car level are very difficult to do with any precision. This leads to a system that can be characterized as a combined push and pull system. There are a number of obvious pressures in the car distribution case. The legal framework in terms of the block exemption forms an important
266
backdrop to explain the manufacturers’ actions, but has not yet lead to large-scale changes on the ground. More important has been the growth of the newer entrants such as the Japanese manufacturers, and recently their establishment of manufacturing capacity in Europe. Coupled with intense competitive pressures in car manufacturing generally, this has lead to a focus on distribution – to a large extent because it is believed that efficiencies can be had here. The car distribution setting is characterized by substantial cost and time pressure, but the flow is to a large extent managed by the manufacturer. This is motivated in part by the need to keep factories running. There is an advantage for the car producer to control the physical flow of goods in collaboration with dealers due to the fact that a significant part of the production is customer specified - each individual product might be more or less unique. This is not an issue in distribution. The investments in distribution in ports, ships terminals etc. require pooling of resources and the variation in volumes are rather small. There are also some economies of scale at the dealer level, although this is not that evident. When and if car manufacturers outsource a larger share of logistics, the most probable development would be that logistics would be centralised for families of car manufacturers, meaning that several makes in the same owner groups would integrate their operations. If new intermediaries evolve, it would probably be through these structures rather than through new or independent actors. The dominant position of the manufacturer in the distribution system means that intermediaries must follow the manufacturers lead, which means trying to match their wishes for regional specialists for a limited set of tasks. The evolvement of strong multi-brand dealer chains could change that picture, but would probably involve a situation where those dealer chains to a larger extent take control of the organisation and flow and therefore not opening up for new intermediating firms. In the EE-waste case, the system structure is depending on variables such as collection sites, the function in terms of reuse or recycling, and the content in terms of if it is valuable or not. The quality of the process is determined by collection rate and the degree to which dangerous materials or goods are extracted, while time is of less importance. Demand uncertainty is low, and the economies of scale are found in processing as well as in distribution, leading to a push system where the design issue rather than the coordination issue becomes significant for efficiency and effectiveness. The recycling case is founded in legislative changes for the handling of dangerous materials, and as such is created by the legal framework.
267
However, it is important to point out that there was already an existing system of scrap dealers and some processing facilities to deal with those parts of the waste that held a positive value. The challenge for the new intermediaries was therefore both to make use of existing processing capacity in the system, and to develop the competence needed to deal with their specific area of responsibility – the removal and handling of dangerous waste. The structure of the recycling case is quite different from the car distribution one. First of all the manufacturers do not generally have existing systems for recycling (with some exceptions), and do not necessarily want the added responsibility of running a recycling system. This makes it easier for an intermediary to take responsibility for and organize the entire recycling system. The main requirements are that legal obligations are fulfilled, and that the system operates cheaply. The business opportunities for intermediaries have basically been related to the organisation of the system and the process rather than the control of the physical flow of goods. It is the manner in which the resources are linked together with contracts that determines the efficiency and effectiveness of the system. The activities do not have to be coordinated from a time perspective, meaning that the overall control of the physical flow of goods is not a major issue. In that sense the actors to a large extent can act independently. This is also how the different intermediaries in this industry have evolved. In the FMCG-case, customer power is significant, and it involves a highly competitive situation, where products can easily be substituted and customer loyalty is low. Availability becomes a major issue. Demand uncertainty is rather low, and it concerns products that are functional rather than innovative. Process coordination and an efficient delivery process is the major concern. Wine and spirits are essentially a “convenience good.” Customers will mostly pick another wine if they cannot find a particular one. This may not be an important issue for the retailer, but it is very important for the importer, making time to market an essential factor. The FMCG case deals with the dissolution of a monopoly. Legislative changes removed the existing monopoly and opened the sector up to competition. This of course means that there was already capacity in the sector, so that a benchmark already existed. Any new intermediaries would have to outperform the benchmark of the existing firms to gain market share.
268
The large number of small importers makes it difficult if not impossible for them to achieve any advantages of scale on their own, and so there is an obvious opportunity for an intermediary to act as a go-between and accumulate orders both to increase efficiency in processing and strengthen bargaining power. In this case it is the small size and capacity of the importers that creates an opportunity for an intermediary, compared to the strong manufacturer control in the car distribution case and the compliance features of the EE case. In the FMCG-case, as in the car distribution case, there are business opportunities for logistics intermediaries related to both the organisation of the system and to process integration. Pooling of resources is essential for efficiency, and could best be achieved through a neutral intermediary. The intermediary is able to exploit these economies in the physical activities such as transportation and warehousing, but also in terms of competence and human resources within the field of logistics and information and communication technology - not only sharing resources but becoming more specialised.
10.7 Summary and conclusions The pressures leading to transitions in the three cases are different, although there are some common points. In all three cases political pressures have resulted in a changed legal framework leading to a new set of conditions for the industry. The specific legal changes made are however different, ranging from the creation of a new business in the EE case to the still expected changes in the car distribution case. Likewise, the nature of each system in terms of industry structure as well as economic incentives is quite different so that changes are handled differently. It is these two factors taken together that create widely different opportunities for intermediaries in each of the three systems. There are however counter-forces that can reduce the effect of these changes. In the car distribution case the car manufacturers lobby the EU and reduce the scale of the legal changes. In the EE case the counter-forces can largely be seen in free-riders that take advantage of the system making it less effective, and finally in the FMCG case the old Vinmonopolet is a counter-force in that it still operates as a competitor. The delivery systems in the three cases have different features. A common development however in all the cases is the evolvement of more differentiated delivery systems. In the car distribution case a probable
269
development is a differentiation related to segments. An example would be differentiated processes for volume cars and luxury cars, standard or customer-specified cars. In the EE-waste case the industry has become organized according to segments and the processes adapted to the specific needs in each segment. Finally in the FMCG case there has been a functional split between Vectura, VSD and other importers, where VSD has specialized in handling flows of goods from abroad to the retailer. Business opportunities for intermediaries are related to the organisation of the supply chain or network or to the integration and coordination of processes. The basic question, however, is if a neutral intermediary can position itself either to better exploit economies of scale for some or many of the activities in the supply chain or better control of the flow of goods. The latter is based on the fundamental principle that aggregate volumes are more easily controlled than disaggregated ones. References Alderson, W. (1965) Dynamic Marketing Behaviour: A Functionalist Theory of Marketing, Richard D. Irwin, Homewood, Illinois. Fisher, M. L. (1997),"What is the Right Supply Chain for Your Product?" Harvard Business Review, 105-116. Fredriksson, P. and Gadde, L.-E. (2005),"Flexibility and Rigidity in Customization and Build-to-order Production", Industrial Marketing Management, 34, 695-705. Gadde, L.-E. (2000) From Marketing Channels to Differentiated Networks - Distribution Dynamics in a Historical Perspective, In The Current State of Business Disciplines(Ed, Dahiya, S.) Spellbound Publications, pp. 1-27. Gadde, L.-E. (2004),"Activity Coordination and Resource Combining in Distribution Networks - Implications for Relationship Involvement and the Relationship Atmosphere", Journal of Marketing Management, 20, 157-184. Gripsrud, G. (2004) The Marketing Discipline and Distribution Research: Time to Regain Lost Territory, In Rethinking Marketing: Developing a New Understanding of Marketing (Eds, Håkansson, H., Waluszewski, A. and Harrison, D.) Wiley. Gripsrud, G., Jahre, M. and Persson, G. (2006),"Supply chain management - back to the future?" International Journal of Physical Distribution & Logistics Management, 36, 643-659.
270
Heide, J. B. (1994),"Interorganizational Governance in Marketing Channels", Journal of Management, 58, 71-85. Hertz, S. and Alfredsson, M. (2003),"Strategic development of third party logistics providers", Industrial Marketing Management, 32, 139-149. Håkansson, H. and Persson, G. (2004),"Supply Chain Management: the Logic of Supply Chains and Networks", Journal of Logistics Management, 15, 11-26. Mudambi, S. and Aggarwal, R. (2003),"Industrial distributors: Can they survive in the new economy?"Industrial Marketing Management, 32, 317-325. Persson, G. and Virum, H. (2001),"Growth Strategies for Logistics Service Providers: A Case Study", The International Journal of Logistics Management, 12, 53-64. Simchi-Levi, D., Kaminsky, P. and Simchi-Levi, E. (2004) Managing the supply chain: the definitive guide for the business professional, McGraw-Hill, New York.
271
CHAPTER 11
Distribution networks in transition: implications and future research
Erna Senkina Engebrethsen, Bente Flygansvær,
Leif-Magnus Jensen, and Gøran Persson 11.1 Transitions in distribution systems 11.1.1 The changing logistics markets There has been a dramatic change in the business environment for transport and logistics over the last 20-25 years (as has been described in chapter 1 of this report).. This is true in practice for the logistics actors as well as in theory for the researchers in logistics and distribution in the sense that the agenda is changing for logistics service providers as well as for researchers. There are several reasons for these developments. Here, we will focus on three major factors driving the developments. First of all, the political context in Europe as well as in Norway has changed dramatically in this period, particularly concerning rail, road, and sea. In principle, the consequence of the EU-agreement is that the market for international transport of goods is open for competition in the entire EU area and thet a service provider in any EU country (as well as Norway) can carry out missions between all the countries within the are, so called cabotage. We will not deal with the details of the agreement, but only conclude that the deregulation process has been a basic condition or pre-requisite for the internationalization process within the logistics industry in Europe. Secondly, also the growth in trade and the changing trading pattern as described in chapter 1 are a major determinant and driver for the developments within the business. Trade between countries has grown faster than the growth in GNP since the early 60s. Thus, we and the companies are to an increasing extent buying what have been produced abroad. The consequence is that international goods transport is growing faster than national transports. Also, firms are to an increasing extent buying from or moving production to low-cost countries or regions. Thus, while production is increasing in countries such as China, India, the Baltics, or central Europe,
272
a decrease can be observed in Western Europe. The growth of trade and the changing trading patterns obviously have an impact not only on the flow of goods, but also on the entire sourcing-, production- and distribution systems. A third important factor for understanding the developments within the logistics industry is that firms to an increasing degree chose to outsource larger parts of their logistics activities to service providers instead of performing these activities themselves. They concentrate their investments and use of resources on their core businesses and outsource activities not considered as core. In this process, often a major share of the traditional logistics activities and functions are transferred to so-called 3. party service providers. In adsdition, many larger international firms often find it convienient to use fewer suppliers and actively reduces their supplier bases. Thus, it is often a requirement that the chosen supplier should have a rather complete set of activities adapted to the specific needs and expectations of the individual customer. 11.1.2 The contextual consequences for logistics service providers These three factors, the deregulation of the logistics markets, the growth of trade and changing trading patterns, and the transfer of logistics activities and functions from the owner of the goods to logistics service providers, have had and will have a significant impact on the industry and the context in which the individual service provider operates. Here, we will focus on two major consequences. The most obvious consequence of the fact that the owners of the goods to an increasing degree are outsourcing logistics activities is the growth of the 3.party markets. There are several studies showing what this growth look like with regard to the total market, the growth in different segments of the market, the developments in different regions etc. Again, without dwelling on the details, we can conclude that while the general freight market is large, growing, and moving, the 3.party logistics market is still relatively small but growing faster than the general market, which makes it an interesting market for many logistics service providers. In this situation logistics service providers have been repositioning themselves in different ways. We have seen a wave of mergers and acquisitions in the industry. The European buyers have been most active in this regard. Also here, there are several studies for those who are interested, but let us just conclude that the traditional local and national transportation firms have been transformed to regional, pan-European or global logistics actors. They reposition themselves regarding the scope of services offered as well as the geographical coverage of these services. The networks are

273
becoming more complex and we can observe significant investments in both in infrastructure and in ICT. 11.1.3 Strategic challenges for logistics service providers As we see it, logics service providers are facing a set of political, economical, environmental as well as behavioral challenges. We will not however try to systemize these challenges, but rather focus on some of the challenges we can see in relation to this study. First of all, logistics service providers are facing a challenge regarding skills and competencies within logistics as well as strategy. It is a challenge concerning people as well as content. The knowledge regarding how to design and operate the flow of goods in an efficient manner have traditionally been located at the shippers and not the service providers. This is changing of course and over the last decade we have seen a transfer of skills and competencies within this field from the shippers to the service providers. Even so, and it is actually a major point here, the logistics challenges of the service provider are different from the ones facing producer and therefore not automatically covered. Also, within the strategy field, the value chain logic represents a dominating approach which can not be directly adapted to logistics service providers. Logistics service providers are unique actors with unique strategic choices and integration challenges. They follow a different logic then manufacturers. A general problem and challenge is also that buyers tend to consider logistics services as commodities in the sense that they to a large extent are focusing on price in contrast to the total cost and efficiency of a logistics solution. To understand and to accept , and this concern to shipper as well as the provider, that the key to the most efficient solutions often lies in collaboration and mutual adjustments, probably represent the major barrier for efficient solutions to evolve. Another major challenge for the individual logistics service provider regards how to position themselves adequately, given their resources and the context in which they are operating. Related to this, and given all the mergers and acquisitions in the industry, there are also challenges related to the consolidation and integration of physical as well as information and organizational systems. Thus, here lies a profound understanding of existing business model and how that can be further developed.
274
11.2 Logistics and distribution research Studying the origin and the developments within business logistics and Supply Chain Management as well as in marketing channels (as we did in chapter 2), we argued that the marketing and the logistics disciplines have originated from the same approach – distribution channels research – and that they have developed in two very different directions, differing on unit of analysis, theoretical base and methodological approaches. We also be argued, that they all have significant limitations regarding their contribution to understanding supply chains and networks. Based upon the review of the research, some fundamental observations were made concerning the need for research in the interface between logistics, marketing, and supply chain management as well as the need for research on the organisation of distribution arrangements. In short, we argued that
(1) to understand supply chains and networks, it is important not only to understand the activities of the individual actors or business units, but also to develop an understanding of the system as a whole. Further, that
(2) marketing has a strong tradition within this area, particularly interesting in this context is of course the functionalists like for instance Alderson (1956), and others. Some of the key concepts within this tradition have had a significant impact on logistics (for instance postponement), while others seem to be forgotten (like for instance sorting, transvections etc).
(3) Logistics on the other hand, has had a strong emphasis on a holistic view on the materials flows, and developed concepts and theories concerning the configuration and operation of these flows from point-of-origin to end-user (or disposal). While marketing to a large extent has abandoned this tradition, mainstream logistics has focused only on the physical flow of goods, paying little attention to other types of flows (for instance commercial flows).
(4) In the supply chain literature, Lambert (1998) has broadened the concept to cover also other processes, but limited the approach to a focal business unit.
Thus, we concluded by stating that to enhance our understanding of supply chains and networks, there is a need to follow up these research
275
traditions, taking a holistic perspective as a starting point (at the flow of goods, the transvection, or a the supply chain), and probably combining insights from marketing channels and business logistics research. In such a tradition the system as a whole rather than the individual actors is of focal interest. We also concluded by stating that there obviously is a need to enhance our understanding of how our supply and distribution systems work, how they create value, how to configure these systems, the roles or functions of the actors, drivers and economies in such systems, and their development. In this project we have been studying some of the issues, particularly regarding logistics service providers in the distribution network from an overall systems perspective. The ambition has not been to carry out one fully integrated study on the organisation of distribution arrangements, but rather to carry out several studies within this context.
11.3 Major conclusions and implications from the dissertations regarding distribution networks in transition In the following sections some of the experiences from the three dissertations are summarized from the perspective of the over-all project. Particularly, the following issues will be discussed
a) The systems level as the unit of analysis b) The evolving differentiated distribution systems c) The match between coordination of different types of flows d) The modelling context for LSPs e) The challenge of variety and the role of intermediaries in distribution
11.3.1 Coordinated actions in distribution systems The main ambition of the research in the dissertation regarding “Coordinated actions in reverse distribution systems” was to investigate the interaction between coordination of physical flows and commercial interests. The research was initiated by the idea that physical flows have a significant impact on the coordination of distribution systems. In the literature, commercial interests have received the main focus in studies on coordination of distribution systems. In fact, it is argued that to a certain extent commercial interests dictate the physical flow (Roosenblom 1995). Our argument, however, is that the physical flows influence distribution systems on an individual basis.
276
Having investigated the coordination mechanisms for physical flows, we have identified that the physical flows follow the same variations that Thompson (1967) suggested for technologies. Physical flows can be set up to exploit pooled interdependencies, serial interdependencies or reciprocal interdependencies. As a consequence, we have found that the coordination mechanisms of standardization, planning and mutual adjustment are readily applied to physical flows. Our study supports the utilization of these concepts to physical flows. The coordination mechanisms are found in our cases and we have argued that they are well adapted to the physical flows in question. Coordination of physical flows is a means to achieve integration of activities, as the level of integration is expected to lead to increased performance in physical flows (Lambert et. al. 1998). A contribution from the study, therefore, is how these coordination mechanisms can be adapted to physical flows. We argue that the logistics literature needs to be more specific as to how integration is achieved in activity structures. The coordination mechanisms of commercial interests in distribution systems are thoroughly studied (e.g. Heide 1994, Rindfleisch and Heide 1997). We have learned that the contract is the proper institution to regulate relationships in distribution systems, but we have also learned that the contract needs to be based on a combination of coordination mechanisms (Poppo and Zenger 2002, Heide 1994, Heide and John 1992, John 1984). In fact, we have identified that there needs to be a combination of hierarchical mechanisms, incentives and norms mechanisms. Such combinations provide a relationship with both formal and informal coordination mechanisms, which are argued to be necessary in contributing to both control and motivation. The literature has argued that there is a need to attend to such duality in order to achieve true effectiveness in the relationship (John 1984). In the study, we have identified that the distribution systems that have mainly utilized formal mechanisms, have achieved a lower system performance compared to the systems that have implemented both formal and informal mechanisms. As a result, the study supports John’s (1984) finding. However, we have also seen that the lack of sufficient performance is not only explained by the choice of coordination mechanisms. We have argued that it is also a question of how the coordination mechanisms are organized in the distribution systems. Our study shows that if important elements in the distribution system are left out of the coordination scheme, performance levels can be severely affected. Specifically, we have addressed the horizon of coordination as a concept to explain this. This is an important theoretical contribution from the study. We address the system as a level of analysis. This level has been addressed in literature on distribution (Stern and Reve 1979, Van de Ven 1976,

277
Alderson 1954). It argues that the system level is difficult to measure and therefore recommend that distribution systems should be investigated at the dyadic relationship level (Stern and Reve 1980). Recently, however, some studies have argued that it is necessary to address the system level of analysis, as there are effects to be recognized beyond the dyadic relationships (Gripsrud 2004, Wathne and Heide 2004, Heide 2003). Our study supports this argument, as system effects are demonstrated in the study. We have seen that it is necessary to organize a distribution system across several functions simultaneously. There is also evidence that systems need to be established for each transfer of goods (in the independent systems). Plus, there is evidence that the lack of a system perspective influences performance negatively. These effects, we argue, would have been difficult to identify if we had utilized levels of analysis other than the system level. The system level of analysis also brings us to the topic which has been our study’s main interest: the interaction effect between the coordination mechanisms of the physical flow and the commercial interests. We believe we have enlightened an area that is valuable in research on distribution systems. Our point of departure has been that the physical flow has an impact in its own right when it comes to distribution systems, rather than ‘just being guided’ by the commercial interests. We believe our cases have demonstrated this point. Our argument is that the different types of physical flows promote different types of commercial interests, and therefore the coordination mechanisms vary accordingly. In this manner, we have contributed to an understanding of how the physical flows and commercial interests interact in distribution systems. It is a contribution both to the literature on physical flows and on commercial interests. In logistics and supply chain management, one needs to become more aware of how the physical flows are both promoted and limited by related areas such as commercial interests. Also, the governance literature, which handles the coordination of commercial interests, needs to be made aware of how a related topic influences the choice of governance tools. Recent studies have addressed this point (e.g. Ghosh and John 1999) and we believe we have demonstrated further potential in the area of physical flows. We have found that end-consumers are a significant part of the reverse distribution system, but we have also found that they take both a passive and an active role to the system, which varies across the private and business-to-business end-consumers. There are clearly different end-consumer segments facing the reverse distribution systems. Our study contributes by differenti-ating the end-consumer unlike the extant theory. This development is in accordance with the findings of Mentzer et. al. (2001), who argue that
278
logistics systems need to be adapted to specific customer segments to ensure true service quality. We have found that the reverse distribution systems in our study are adapted to and shaped by separate end-consumer segments. We have also contributed to the understanding of new roles of the actors involved in reverse distribution systems. Of specific interest is the role of the waste management companies. The reverse distribution systems in our study consist of actors from several sectors, and the waste management companies are central administrators of the systems. The actors are responsible for administering the funding from the stakeholders into producing collection rates from the collection systems. These performances are then reported back to the stakeholders. The waste management companies have utilized different coordination mechanisms across the cases we have studied. A number of similarities can be found when we link the role of the waste management companies to that of channel leadership (Edgar 1977, Stern 1967). However, our contribution lies in identifying that the waste management companies take the role of a mediator (Stabell and Fjeldstad 1998), rather than of a ‘channel leader’. One of the main reasons for this is the need to link a number of sectors to each other. This is a significant contribution to the knowledge of how to achieve coordinated action in (reverse) distribution systems. The evolving distribution realities consist of a large number of autonomous but interdependent companies in need of coordination (Gadde 2004). Distribution systems have a need for actors that are able to take the overall view of the system in order to achieve satisfactory system performance and coordinated action. One important managerial implication from the study is the system perspective. The actors that participate in a reverse distribution system have to realize that their efforts are part of a larger system, and that their actions may influence and be influenced by activities that are not directly obvious. As a consequence, it is important for managers to reflect on the system they are a part of. This is one of the main arguments in the supply management literature (see e.g. Lambert et. al. 1998) and it has also been an issue in the distribution literature (see e.g. Reve and Stern 1969). The issue has also been addressed in the reverse distribution literature, but most of the focus has been on closed loop supply chains (see e.g. Krikke et. al. 2004), which is intra-organizational to a large extent. Coordination in reverse distribution systems has to a limited extent been studied in inter-organizational settings. The study has demonstrated that there are a number of coordination issues also on the inter-organizational level. Managers need to take the reverse issues into account also in inter-organizational settings.
279
In addition to the system effect, it is important to understand the connection between different categories of flows. If a partner is breaking the rules of the contract, it may be worthwhile for managers to check whether the rules are a just representation of the exchange. Our work shows that this may not always be the case. It is important to realize that actors that take part in a reverse distribution system, or any system for that matter first seek to secure their self-interests. In systems design, it is therefore necessary to align self and common interests in order to ensure that goals can be fulfilled. Managers that are establishing and setting up systems need therefore to be fully aware of actors’ interests in participating. System performance is also dependent on the ability to integrate activities in the physical flows well. If coordination mechanisms are implemented to ensure alignment of behavior and integration of activities, managers can expect to minimize both operations and transaction costs. Thus, in relation to the over-all project, there are basically five major contributions from this dissertation and the corresponding case studies.
(1) The study has demonstrated that it is necessary to address the system level of analysis, as there are effects to be recognized beyond the dyadic relationships. These systems effects would have been difficult to identify if another level of analysis had been utilized. It has also been demonstrated that it is necessary to organize a distribution system across several functions simultaneously. In addition, there is evidence that the lack of a system perspective influences performance negatively. The managerial implication of this is that the actors that participate in a distribution system have to realize that their efforts are part of a larger system, and that their actions may influence and be influenced by activities that are not directly obvious.
(2) The study illustrates the argument that end-consumers are a significant part of the distribution system, as there are clearly different end-consumer segments facing the distribution systems. It shows that logistics systems need to be adapted to specific customer segments to ensure true service quality.
(3) The study demonstrates that the different types of physical flows promote different types of commercial interests, and therefore the coordination mechanisms vary accordingly. It contributes to our understanding of how the physical flows and commercial interests interact in distribution systems. And it points to the fact, that in logistics and supply chain management, one needs to become more aware of how the physical flows are both promoted and limited by related to other flows such as commercial interests.
280
(4) The study has demonstrated that there are a number of coordination issues also on the inter-organizational level. This is a phenomenon that becomes even more important as distribution arrangements are becoming more and more specialized.
(5) Finally, the study has also contributed to the understanding of new roles of the actors involved in distribution systems. The evolving distribution realities consist of a large number of autonomous but interdependent companies in need of coordination. Distribution systems have a need for actors that are able to take the overall view of the system in order to achieve satisfactory system performance and coordinated action.
11.3.2 Outsourced logistics services and supply chain planning models The major conclusions from the study “Transportation mode selection in supply chain planning models”, regards outsourced logistics services and supply chain planning models in general, and can be summarized as follows. The solution space and decision-making complexity have increased both for shippers and the logistics providers. Shippers can now choose among a high number of logistics actors offering services with complex price structures and varying operational conditions. Logistics companies often offer a set of services to their customers, such as for example warehousing and transportation, and the customers can benefit from economies of scale and better coordination, when outsourcing a larger set of services. Therefore, decision about the choice of logistics partner should include consideration of benefits and risks for a set of services, rather than evaluating individual services. Due to increased outsourcing of warehousing and other logistics services, frequent redesign of the existing logistics network becomes more common, allowing the companies to expand or shrink their network as needed in a shorter term. Because the time span of network design decisions becomes shorter, a stronger interaction between these and tactical and operational decisions is needed. In the existing supply chain planning models the parameters are often assumed to be static, however for example transportation and handling costs can change over time. It is important to consider this dynamic aspect especially when evaluating the robustness and flexibility of the supply chain decisions with respect to the changes in the parameters. When outsourcing the transportation or warehousing services, companies turn their fixed costs, associated with having a private fleet or own facilities,
281
into variable costs. These variable costs depend on the actual product volume transported or handled, and they usually exhibit economies of scale for higher volumes in form of discounts. Most of the existing planning models assume a simplified cost structure for logistics services. More research that incorporates real-life costs including various discount schedules different and contract types is needed. It might be more cost-efficient to assume availability of transportation mode choice in the supply chain planning models and possibility to combine various modes for the same shipment. The transportation and commercial decisions about trading terms, Incoterms49 are often interrelated and need to be considered simultaneously. For example, according to some trading terms the supplier is responsible for product transportation, and in this case the transportation cost constitutes a part of purchasing price. The purchasing price can be lower if buyer arranges and pays for transportation. Hence, the total costs of each option need to be evaluated thoroughly when selecting the trading terms. When selecting logistics service providers the majority of planning models consider quantitative criteria based on the service costs only. It is however interesting to quantify and include other criteria, such as reliability and safety of delivery, flexibility, infrastructure availability and capacity, -traceability, environmental considerations etc. The complexity of planning decisions for logistics service providers has also increased. Logistics service providers can often combine the provision of tailor-made and standard services for different customers, and it can be challenging planning task to coordinate different service segments and prioritize the customers. In order to be able to offer services in larger geographical areas, the logistics providers often need to cooperate with each other. Planning model that support these coordination efforts, considering the interests of several parties can be a promising area for future research. Contract design and fee-setting issues also deserve a greater attention form the research society. 49 INCOTERMS or International Commerce Terms, is a set of uniform rules for the interpretation of commercial terms defining the costs, risks, and obligations of buyers and sellers in international transactions. Incoterms deal with the questions related to the delivery of the products from the seller to the buyer, including transportation, export and import clearance responsibilities, who pays for what, and who has risk for the condition of the products at different locations within the transport process.
282
Mergers and acquisitions that take place in logistics industry often result in re-design of the logistics company’s network or re-organization of flows, in order to achieve better synergy effects. Planning models that support this kind of strategic decisions are needed to be developed in order to increase the efficiency of logistics service providers. Better capacity planning allows to operate more efficiently, and predict the utilization rate of resources, such as fleet, equipment and manpower, in advance, giving possibility to sell the excess capacity on spot-markets or to book the additional resources for the periods with extraordinary high demand if needed. Technological innovations may lead to new logistics solutions, for example Ronen (2002) suggests that limited storage place may be avoided by using vessels as floating tanks. Nagl (2005) mentions that new decision making problem will appear when the cargo vehicles will be allowed to be larger and consist of several modules or containers with different sizes. The optimal combination of modules for a vehicle is an example of such problem. Technological factors should be incorporated in formulations of planning models in order to improve decision-making, modelling the real life dilemmas. The environmental concerns become increasingly important, however little attention is paid to environmental routing, handling and packaging issues. The shippers increasingly demand environmental friendly transportation alternatives. For example the size and composition of vehicle or vessel fleet impacts the pollution. More research is needed to incorporate the environmental aspects in planning decisions. In a supply chain, efficiency can be achieved by improving coordination between supply chain partners. Consideration of problem only from one supply chain member’s point of view reduces the improvement potential for the whole supply chain. There is a need for inclusion of not only shipper’s, but also customers’ and logistics providers’ interests and limitations into the supply chain planning models. Thus, in relation to the over-all project, there are basically four major contributions from this dissertation and the corresponding case studies. (1) The study and the cases demonstrate that there is a shift of focus regarding supply chain planning models as logistics services are outsourced to logistics service providers. Some of the effects of this development are identified and discussed.

283
(2) The study also demonstrate the consequences of outsourced logistics services in particular areas, such as the selection of logistics partner, the dynamic aspects of supply chain decisions, the combining of tailor-made and standard services etc. (3) Since logistics providers often need to cooperate with each other both to cover particular geographical ares and to be able to provide a specific solution, the study also point out the necessity to develop planning models that can support these coordination efforts, considering the interests of several parties. (4) Finally, the study also illustrates some of the aspects regarding logistics planning models and technological innovations as well as environmental concerns. 11.3.3 The role of intermediaries in distribution Our approach to analyzing the role of intermediaries in distribution here has two sources. One is the considerable observed variety in distribution arrangements. This variety has many dimensions, one of them clearly being time as a number of new ways of organizing distribution have been observed in the empirical world. There are also other dimensions tied to customer groups, manufacturer strategy and multi-channel systems. Considering this in depth, we find that intermediaries are often important in terms of enabling these systems, and so describing the different roles of intermediaries is in many cases at the heart of these phenomena. The second source is value creation as a topic, although this is not as heavily emphasized here. However, in the following discussion it should be borne in mind that the role of intermediaries as conceptualized here and closely tied to fundamental business logics are essentially about value creation. Here we proceeded by investigating the role conceptions in the older functionalist literature, and concluded that these focus to a large extent on fundamental economic logics or mechanisms. The study showed that the basic role formulations were still sound but required some modification and extension. In particular the empirical study showed intermediaries which were non-title takers. We employed the 3PL literature to derive possible role descriptions for these and added these to the basic functionalist descriptions. Crucially, the new roles were tied to being resource providers, a role which is not relevant in the older distribution reality where intermediaries essentially bought goods and sold these on to the next level in the chain. The role of the resource provider was shown to be more complicated than

284
presented in the 3PL literature, since the ability to provide a “fit” with the existing resources of similar but different customers is a major challenge. Since the non-title takers seem to be less limited in terms of their role than those previously described it is also the case that they combine roles, sometimes a number of potential ones in order to cement their position. In this way they may be seen to be a “generalist” although they possess a set of fundamental skills that essentially create their position and makes it possible for them to take on other more basic tasks as a matter of convenience. These tasks however can become quite important in terms of business. On the other hand, it was seen that taking on many tasks and roles in this way could lead to quite extensive expectations on the part of customers. This is especially the case when the intermediary remains a service provider and still does not own or control the flow of the goods it handles. The lack of information and final decision power on the part of the intermediary remains a constant challenge which is partially handled through developing competence in terms of adapting to shocks and opportunities in the system. We also found that many of the core activities of the intermediary were dependent on acting as a bridge between several different distribution systems. That is each manufacturers’ system comes with its own rules and regulations, and it is the ability to bring these together that creates opportunities for the intermediary. This could be likened to simply pooling flows of goods from different sources, but it becomes more difficult when the different pools have different standards used in each system in order to coordinate them. We considered coordination as an important enabler for the use of intermediaries, but also found that the intermediary itself served a crucial function in managing to create compromises between the standards in the different systems. Most of the time these compromises were tied to familiarity with the standards and finding operating procedures consistent with all. However, it also involved policing the standards, finding ways of working around inconsistent standards in order to still achieve economies of scale and scope, and finally in limited cases having importers adapt their own standards. It seems clear that a third party or intermediary in this case is much better placed to propose and find such compromises than the manufacturers would be themselves if they came together in order to cooperate on this issue. In terms of coordination we see that the use of intermediaries creates a number of inter-organizational coordination problems, and that these can be difficult to handle especially where the required information for early and good decision-making can be considered business-sensitive. We also see clearly the existence of different types of interdependencies (Thompson,

285
1967) as dominant in different parts of an intermediary’s business. The most important issues were tied to the use of large fixed resources in the distribution system and overlapping standards tied to logistics operations. Secondly, the scheduling of the different manufacturers and their different production systems means a constant series of minor shocks to the system with changes in car models produced and relatively short time horizons for planning the receiving and handling of cars. The study however showed that intermediaries are typically well adapted to this type of operation although there are clear opportunities for better planning tied to information exchange. However, the value of such information exchange was clearly related to the state of IT and related systems. That is there is no general linear relationships between information exchange and operational efficiency. We saw that the use of particular distribution strategies, such as build-to-order or make-to-stock could both take place in the same distribution system, and that intermediaries enabled this to take place through their ability to create high volume and frequency in operations. This enables them to deal with volume changes that are significant for each individual customer but less so for the system as a whole. However, we also saw that this ability to absorb incidental changes disappeared for shocks that affected the system as a whole, and this is a major challenge for an intermediary, especially where it has performed its job well in the past and customers expect it to ensure capacity, i.e. the availability of resources. Overall we can say that a better framework for describing the roles of intermediaries founded in basic economic realities gives us an improved tool both for describing intermediaries in themselves, but also showing how they enable a distribution system to cope with variety. Variety can lead to the need for hybrid arrangements, i.e. serving customers with different distribution channels. This will typically increase the need for intermediaries, expanding their opportunities and the roles they can occupy. Thus, in relation to the over-all project, there are basically five major contributions from this dissertation and the corresponding case studies.
(1) The study has contributed to our understanding of the roles of intermediaries in a distribution system and given us a framework for describing these roles
(2) The study has demonstrated how intermediaries can enable a distribution system to cope with variety
(3) It has also been demonstrated how intermediaries are dependent upon being able to be a bridge between several distribution systems

286
(4) The study has demonstrated how the use of intermediaries creates interorganisational coordination challenges
(5) Finally, the study and the corresponding case studies have demonstrated how increased variety in distribution creates new business opportunities for logistics service providers.
11.4 Future research An interesting question when trying to sum up the experiences and conclusions from a project is of course how to proceed. Looking at the results of this project and comparing the results and outputs with the starting point of the project, we can see that the contributions of the research have been in the interface between logistics, marketing, and supply chain management as well as in the area of the organisation of distribution arrangements. Basically, this has been achieved through a systems level approach to logistics and distribution issues. In our review of the earlier research, we also made two other statements concerning research in this area that have not been covered in this study. The first statement concerned value creating in supply chains and networks, and we stated, that (1) to understand value creation in supply chains and networks, it is important to realize that there are other interdependencies in distribution settings than those serial activities defined by a supply chain or a supply process.
a. The supply chain concept was partly developing from Porter’s value chain concept in the mid eighties. The value chain logic represents a value creation model particularly describing the value creation process in a manufacturing environment. Fjeldstad and Stabel (1998) have developed a framework based on Thompson’s (1967) typology of technologies, adding value shops and value networks as two alternative value configuration models to the value chain. The models represent three different interdependencies.
b. An interesting issue in this context is that the value network configuration model better represent the value creation process of logistics service providers than the value chain model. Different actors in a supply chain or a supply network play different roles and have different value creation logic. While
287
being a key issue in the channel literature, this issue have been neglected in both the logistics and the supply chain management literature.
Thus, we concluded by saying that to enhance our understanding of supply chains and networks, there is a need for research not only covering how individual companies or business units create value, but also how value is created in an interorganisational context or setting. The second statement concerned the dynamics of distribution arrangements, and we argued that (2) so far SCM, as well as logistics and marketing channel theories and
models, can be characterized as deterministic, and to a limited extent covering the changing patterns in the materials flows.
a. To understand the dynamics of supply chains and networks, one has to realize that there are interdependencies not only between activities, but also between resources (resource ties) and actors (actor bonds).
b. These interdependencies and interfaces are as important, if not even more important than the interdependencies between activities for understanding what creates the dynamics of supply chains and networks.
Thus, we concluded by arguing that to enhance our understanding of supply chain and networks, there is a need for interorganisational research not only focusing on dyads, but also on the dynamics of chains and networks. Both these road maps represent interesting approaches for future research regarding distribution networks. Hopefully we will come back to these aspects in future research programs.