Embed Size (px)
Citation preview

See discussions, stats, and author profiles for this publication at: https://www.researchgate.net/publication/273144877
A Comparison of Measurement Techniques for Porosity and Pore Size
Distribution in Shales (Mudrocks): A Case Study of Haynesville, Niobrara,
Monterey and Eastern European Silurian F...
Chapter in AAPG Memoir · January 2015
DOI: 10.1306/13592019M1123695
CITATIONS
6READS
674
6 authors, including:
Some of the authors of this publication are also working on these related projects:
Fracture-permeability behavior of rock View project
The rockphysicists.org posted my writeup View project
Milad Saidian
BP America Inc.
34 PUBLICATIONS 134 CITATIONS
SEE PROFILE
Utpalendu Kuila
Polish Academy of Sciences
24 PUBLICATIONS 640 CITATIONS
SEE PROFILE
Manika Prasad
Colorado School of Mines
156 PUBLICATIONS 2,296 CITATIONS
SEE PROFILE
All content following this page was uploaded by Manika Prasad on 07 January 2016.
The user has requested enhancement of the downloaded file.
1
A Comparison of Measurement Techniques for Porosity and Pore Size Distribution in 1
Mudrocks: A Case Study of Haynesville, Niobrara, Monterey and Eastern European 2
Silurian Formations 3
Milad Saidian*1, Utpalendu Kuila1a, Manika Prasad1, Leo Alcantar-Lopez2, Saul Rivera1b, 4
Lemuel J. Godinez1c, 1Colorado School of Mines, 2Chesapeak Energy, aNow at Cairn India, b 5
Now at Chesapeake Energy, c Now at Oasis Petroleum 6
1. Abstract 7
Porosity and pore size distribution (PSD) are required to calculate reservoir quality and volume. 8
Numerous inconsistencies have been reported in measurements of these properties in mudrocks. 9
We investigate these inconsistencies by evaluating the effects of fine grains, small pores, high 10
clay content, swelling clay minerals and pores hosted in organic content. Using mudrocks from 11
the Haynesville, Eastern European Silurian, Niobrara and Monterey formations, we measured 12
porosity and pore or throat size distribution using subcritical nitrogen (N2) gas adsorption at 77.3 13
K, mercury intrusion (MI), water immersion (WI), and helium porosimetry based on Gas 14
Research Institute standard methodology (GRI). We used Scanning Electron Microscope (SEM) 15
images to understand the pore structure at a microscopic scale. We find that differences in the 16
porosity and PSD measurement techniques can be explained with thermal maturity, texture and 17
mineralogy, specifically clay content and type and total organic matter (TOC) variations. We 18
separated the samples from each formation into groups based on their clay and TOC contents and 19
further investigated the effects of geochemical and mineralogical variations on porosity and 20
PSD. We find that porosity and PSD measurement techniques can provide complementary 21
information within each group provided the comparison is made between methods appropriate 22

2
for that group. Our intent is to provide a better understanding of the inconsistencies in porosity 23
measurements when different techniques are used. 24
2. Introduction 25
Thanks to new technologies such as hydraulic fracturing and horizontal drilling in the last 26
decade, unconventional reservoirs gained oil and gas industry’s attention as valuable resources 27
for energy production. Passey et al. (2010) define “unconventional reservoirs” as a wide range of 28
hydrocarbon-bearing rocks that are not economically producible without stimulation techniques. 29
Although the term unconventional reservoir lacks adequate lithologic definition, in this paper, we 30
refer to tight oil, or gas-producing reservoirs which may or may not be organic rich and are often 31
called “shales”. In today's terminology, shale reservoirs are either siliciclastic or carbonate 32
mudrocks. They need not necessarily contain clay minerals. Although alternate terms have been 33
used for shale reservoirs such as unconventionals, self-resourcing rocks, organic-rich rocks and 34
mudstones, the term shale has endured. In this work we use the term mudrock to refer to these 35
reservoirs. 36
Mudrocks are fine-grained rocks containing silt-size particles with 50 % of the grain diameters 37
less than 62.5 µm (Folk, 1974, Friedman 2003, and Javadpour, 2005). Like other sedimentary 38
rocks, they are composed of a wide range of minerals such as clay, quartz, feldspar, carbonates, 39
and heavy minerals such as pyrite (Passey et al., 2010). Besides mineral components, mudrocks 40
may contain organic matter as a significant component of the rock (Bohacs et al., 2013). 41
Porosity and pore size distribution are used for reservoir evaluation (Ambrose et al., 2010), 42
permeability prediction (Nelson, 2009), and elastic property calculations (Kuila and Prasad, 43
2011). A major challenge in estimating transport and storage capacity of mudrocks is the poor 44
3
understanding of their pore properties including size, distribution and pore hosting components 45
(Nelson, 2009, Chalmers et al., 2012, Loucks et al., 2012, Kuila et al., 2014a, Kuila et al., 46
2014b). Lack of accessibility of the displacement fluid to the pore system is the main deterrent to 47
reliable and accurate laboratory measurements. Limited accessibility can be due to extremely 48
low permeability, complicated mineral surface-fluid interactions, or insufficient equilibration 49
time. 50
It is important to not only quantify pore space with visual techniques such as Scanning Electron 51
Microscopy (SEM) (for example, Ambrose et al., 2010, Curtis et al., 2010, Lemmens et al., 52
2010, Bernard et al., 2012, Curtis et al., 2012, Alcantar-Lopez and Chipera, 2013, Zargari et al., 53
2013) or CT-Scanning (Coshell et al., 1994, Wildenschild and Sheppard, 2012, Milliken et al., 54
2013) but also with non-visual techniques. Some examples of non-visual techniques are nitrogen 55
gas adsorption (N2) (Echeverria et al., 1999, Chalmers et al., 2012, Kuila et al., 2012), mercury 56
intrusion (MI) (Howard, 1991), water immersion porosimetry (WI) (Howard, 1991, Kuila et al., 57
2014a) and nuclear magnetic resonance (NMR) (Sondergeld et al., 2010a, Jiang et al., 2013, 58
Rylander et al., 2013, Rivera et al., 2014, Saidian et al., 2015,). 59
Porosity and pore size distribution are commonly measured with techniques such as mercury 60
intrusion and helium expansion. These approaches yield consistent values for conventional rocks 61
(Hossain et al., 2011). For mudrocks, however, the methods to measure porosity and PSD need 62
careful selection. Large variations in their pore sizes and shapes can result in up to 50% 63
inconsistency in porosity values (Howard, 1991; Katsube and Scromeda, 1991; Katsube et al., 64
1992; Dorsch and Katsube, 1996, Sondergeld et al., 2010b). Discrepancies in results arise 65
because the techniques are based on specific physical phenomena and use different displacement 66
fluids. Since accessibility to the pore space depends on the fluid, each technique yields different 67
4
results. These differences can be exploited considering the fact that each technique measures a 68
different portion of the pore space. A combination of methods can help fully characterize 69
complex pore spaces. Furthermore, within each technique, repeatability can be compromised due 70
to different pretreatment methods such as grinding and sieving, laboratory conditions such as 71
relative humidity and temperature, and millimeter scale heterogeneity which hinders the ability 72
to produce sample aliquots for multiple measurements (Passey et al., 2010; Kuila, 2013). 73
Differences in porosity values measured by different laboratories or under different pretreatment 74
conditions are well documented (Passey et al, 2010, Sondergeld et al., 2010b, Comisky et al., 75
2011). A methodical comparison of porosity values in mud rocks determined by various 76
techniques that examines the compositional, textural and geochemical reasons for data variations 77
is lacking. 78
The main objective of our work is to understand various pore sensing techniques on the basis of 79
textural, mineralogical and geochemical differences. We present porosity obtained from helium 80
expansion, mercury intrusion, water immersion and nitrogen adsorption. We also present pore-81
size distribution data obtained from mercury intrusion and nitrogen adsorption. We investigate 82
the controlling factors on the results of each experimental method and evaluate data variations 83
together with textural, mineralogical and geochemical differences. Further, we compare porosity 84
values measured with various techniques with the pore size distributions measured with three 85
different techniques. Finally, we provide recommendations for a new approach for pore size 86
distribution comparison in mudrocks. 87
In this study we use the pore size classification suggested by Rouquerol et al. (1994). In this 88
classification micro, meso and macro pores have <2 nm, 2-50 nm and >50 nm pore width. All 89

5
the pore or throat size distribution spectra are plotted using the diameter or width of the pores 90
and these terminologies are used interchangeably. 91
3. Materials 92
Below we briefly describe the dominant mineralogy, thermal maturity, organic matter type, and 93
organic matter content for the samples used for this study. The details of each sample set have 94
been published by Rivera, 2014 and Godinez; 2014 (Monterey), Kuila, 2013 (Haynesville, 95
Niobrara, and Silurian). 96
3.1 Haynesville Formation 97
34 samples were taken from Upper Jurassic Haynesville Formation (Kuila, 2013). The samples 98
were clay-rich (up to 73 wt% mainly illite with <5% to 9% expandable smectite layers) with 99
moderate amounts of quartzo-feldspathic (average of 26 wt%) and a variable amount of calcite 100
(between 1 to 35 wt%). A moderate amount of dolomite (up to 44 wt%) was observed in 2 101
samples (Figure1a). In the Haynesville sample set the TOC varied between 0.5-6.3 wt%; the 102
kerogen was in the gas window based on average Tmax of 424 °C and HI which varied from 19 to 103
57 with an average of 36. RockEval S2 data between 350-400 °C showed a moderate amount of 104
bitumen. Figure 2a and b show the SEM images for two Haynesville samples. Figure 2a shows 105
silt-sized quartz, calcite and plagioclace particles surrounded by a mixture of illite and clay-sized 106
quartz. Organic matter is dispersed between clay-sized particles. Figure 2b represents a dolomite 107
rich sample with intergranular spaces filled with a mixture of quartz and clay minerals as well as 108
organic matter. 109
3.2 Silurian Formation 110

6
The fourth sample set consisted of 22 samples taken from the Silurian play in Eastern Europe 111
(Kuila, 2013). The samples contained up to 52 wt% quartz and up to 57 wt% clay which is 112
mostly illite (Figure 1b). The kerogen was thermally mature in the gas window and TOC ranged 113
between 1-6 wt %. No pyrogram peaks were observed in the Rock Eval results up to 550 °C 114
which confirmed the absence of any pyrolyzable kerogen or bitumen in these samples. The HI 115
varied from 0 to 9 with an average of 3. Figure 3a and b show SEM images of two Silurian 116
samples. Silt-size particles such as quartz, pyrite, and dolomite are surrounded by a matrix of 117
illite and chlorite and organic matter is dispersed between clay particles. 118
3.3 Niobrara Formation 119
22 marl and chalk samples came from a well in the Berthoud Field, Larimer County, CO, USA 120
(Kuila, 2013), specifically from the Fort Hays limestone and the overlying Smoky Hill members 121
of the Niobrara formation. They were calcite-rich rocks with moderate amounts of clay (up to 35 122
wt% with an average of 16.5 wt%), quartz (average of 11 wt%) and pyrite (Figure 1c). Type II 123
kerogen was thermally mature and was in the oil window based on average Tmax of 436 °C and 124
HI which varied from 119 to 386 with an average of 306. TOC varied from 0.1 to 5.3 wt% and 125
RockEval programs between 450-500 °C showed an abundance of bitumen in these samples. 126
SEM images for two samples are shown in Figure 4a and 4b. Figure 4a shows relatively more 127
homogeneous intercrystalline pore distribution which is filled with organic matter. Figure 4b 128
shows larger intercrystalline pores filled with organic matter. Note that the larger intercrystalline 129
pores are within the peloid structures. 130
3.4 Monterey Formation 131
7
A combination of 12 sidewall and conventional core samples were taken from an oil producing 132
well drilled at the western flank of the southern San Joaquin Basin in California. The samples 133
were predominantly quartz phase porcellanites containing moderate amounts of clay (up to 24 134
wt% with an average of 8 wt%) and pyrite (up to 7 wt% with an average of 3 wt%). A smaller 135
sample set (3 samples) were calcite-rich (Figure 1d). TOC varied from 0.85-4.95 wt% and 136
RockEval S2 data showed an abundance of bitumen (Rivera, 2014). Kerogen was Type II with 137
thermal maturity in the oil window based on average Tmax of 438 °C and the hydrogen index (HI) 138
varying from 184 to 473 with an average of 374. SEM images of Monterey samples (Figure 5) 139
show moderate carbonate and dominant quartz grains with the presence of organic matter filling 140
up the intergranular and intercrystalline pores. 141
4. Methods 142
Several methods have been used to measure porosity and pore or throat size distribution. In this 143
section, we describe the pretreatments, displacement fluids, and methods as well as the 144
associated challenges for each measurement. In the results and discussion part we will 145
investigate how these challenges and limitations affect the porosity measurement for different 146
sample sets. 147
4.1 Helium Expansion using the Gas Research Institute (GRI) Method and Helium Injection 148
Under Confining Stress 149
The porosity was measured by a commercial laboratory using the Gas Research Institute (GRI) 150
helium porosimetry technique. Due to sample limitations only Silurian and the Haynesville 151
samples were used for these measurements. The porosity was also measured using helium 152
injection under confining stress for the Monterey samples. In the GRI technique, bulk rock 153
volume is measured by mercury immersion using Archimedes’ principle and crushed rock grain 154

8
volume is measured by Boyle’s Law (Luffel and Guidry, 1992; Luffel et al., 1992; GRI-155
95/0496). We measured the porosity of cleaned and dried cylindrical Monterey samples with a 156
CMS300TM helium injection porosimeter. 157
Helium expansion, using either crushed or intact samples, measures pores that are connected and 158
accessible by helium gas. In nanodarcy permeability rocks, temperature fluctuations can 159
compromise pressure equilibration and decrease the measurement accuracy. On the other hand, 160
using crushed samples allows the gas to access isolated pores that might be inaccessible 161
otherwise. Sondergeld et al. (2010b) and Passey et al. (2010) reported very high disparities in the 162
porosity and permeability values measured by different laboratories using same samples. Kuila et 163
al. (2014a) provided a thorough discussion of the GRI technique and investigated the effect of 164
pretreatment and laboratory conditions on the final grain density and porosity results. For 165
example, the Dean-Stark extraction pretreatment with a hot solvent can create porosity in 166
thermally mature samples, such as the Niobrara and Monterey, by dissolving bitumen and lead to 167
porosity overestimation. Luffel and Guidry (1992) suggested 30 minutes as the equilibration time 168
for shales as opposed to 1 minute for conventional rocks. 169
4.2 Water Immersion (WI) 170
The original protocol for WI porosity measurements was recommended by the American 171
Petroleum Institute (API RP40). In this study, we used the adapted protocol for mudrocks 172
developed by Kuila et al. (2014a). In this adapted protocol, approximately 5 grams of rock chips 173
are first dried and weighed in air. They are then saturated and weighed again in water. This 174
protocol of using intact samples and measuring grain density at low humidity increases the 175
repeatability of the experiment (Kuila et al., 2013). 176

9
Immersion porosity measurements assess the pores available to the saturating fluid (water or oil). 177
Thus, the fluid type, the pore surface wettability, and the saturation method affect the porosity 178
values. Also presence of expandable clays such as smectite would affect the accuracy of this 179
technique. 180
4.3 Mercury Intrusion (MI) 181
In MI porosimetry, small intact rock chips are heated up to 200 °C for 12 hours and degassed for 182
30 minutes at 50 µmHg to remove water and volatile hydrocarbons. Mercury is then injected in 183
the sample at uniform pressure steps from 0.14 to 420 MPa. Pressure is considered equilibrated 184
when the injection rate falls below 0.001 µl/g/s. The Washburn model (Washburn, 1921) is used 185
to convert the pressure data to pore throat size distribution. A conformance correction, for 186
example, the Bailey method from Comisky et al. (2011) must be applied to high pressure 187
measurements to account for mineral compressibility. The porosity is calculated by measuring 188
the bulk volume of the sample submerged in the mercury and the pore volume measured by the 189
volume of intruded mercury. 190
We used MI to measure porosity and pore throat size distributions for all sample sets. The MI 191
technique measures pore and bulk volume as well as pore-throat size distribution. Since MI can 192
only measure the volume of pores with throat-diameter larger than 3.6 nm (at 420 MPa), a 193
significant portion of the pore space in fine-grained rocks is neglected. 194
4.4 Nitrogen Adsorption (N2) 195
This technique has traditionally been used to measure total specific surface areas (TSSA) in 196
conventional reservoir rocks. Due to practical limitations N2 technique can only assess the 197
volume of pores with a diameter of less than 200 nm (Gregg and Sing, 1983). 1-3 grams of 198

10
samples are crushed, sieved through a 40 mesh (420 µm) sieve, and then degassed under vacuum 199
at 200 °C until the outgassing rate is less than 0.005 Torr/min over a 15 minute interval. Nitrogen 200
is injected into the analysis chamber and adsorption of nitrogen to the degassed sample starts. 201
The adsorption takes place under constant temperature of liquid nitrogen. Pressure and adsorbed 202
quantity of nitrogen are recorded as isotherms and used to calculate pore size distribution. We 203
used the Barrett, Joyner and Halenda (BJH) inversion (Barrett et al., 1951) as recommended by 204
Kuila (2013) for mudrocks. This inversion method calculates the PSD assuming non-connecting 205
cylindrical pores. The total pore volume is calculated by measuring the amount of nitrogen 206
adsorbed in the sample. The Harkins and Jura (1944) thickness curve is utilized for both BJH 207
inversion and micropore (pores smaller than 1.7 nm) volume calculation with t-plot analysis. The 208
total pore volume is calculated by combining the micropore volume and the total volume 209
measured from 1.7 nm to 200 nm. We used this technique to measure pore size distribution and 210
pore volume in all samples. 211
5. Results 212
We analyzed samples with representation from major lithology types (Figure 1): predominantly 213
carbonate (Niobrara); predominantly quartz (Monterey); predominantly clay (Haynesville); and a 214
mineral mixture (Silurian). Each sample set has varying amounts of clay and TOC contents. This 215
richness of data allowed us to analyze and explain porosity mismatch between the methods for 216
mineralogy, pore size distribution, and measurement condition effects. 217
5.1 Haynesville Formation 218
Porosity values are measured by N2, WI, GRI and MI techniques (Figure 6). The following 219
observations can be made from this figure: 220

11
• MI underestimates the porosity when compared with N2 and WI (Figure 6a and 6b). 221
• WI and N2 porosities are comparable within 2 p.u. difference (Figure 6c). 222
• GRI and N2 are comparable within 2 p.u. difference (Figure 6d). 223
• Except some low content samples that show higher GRI porosity, the WI and GRI 224
porosity show similar porosities within 2 p.u. difference (Figure 6e). Note that in Figure 6 225
N2 and WI and GRI experiments are not performed for all samples. 226
• The presence of clays does not affect the porosity measurements and porosity value 227
increases with clay content. 228
The PSD was measured using the N2 technique (Figure 7). As shown in this figure the PSD 229
spectra varies significantly for different samples. Figure 7a and 7b show the PSD colorcoded by 230
clay and TOC content, respectively. Samples with high clay (low TOC) show large amplitudes at 231
the small mesopore range (< 10nm). Samples with low clay (high TOC) show large amplitudes at 232
the big mesopores (10-50 nm) and macropore range (>50 nm). MI throat size distribution was 233
also measured for a subset of Haynesville samples (Figure 8). The MI spectra suggests that there 234
are pores with throats smaller then 3.6 nm which are not assessed by this technique. 235
5.2 Silurian Formation 236
We measured the porosity of the Silurian samples using WI, MI and N2 techniques (Figure 9). 237
The following observations can be made: 238
• MI, N2 and WI measurements show an increase in porosity with increase in TOC (Figure 239
9a to 9c). 240
• MI highly underestimates the porosity compared to WI and N2 techniques (Figure 9a and 241
9b). 242

12
• WI and N2 porosities are comparable withing 2 p.u. difference (Figure 9c). 243
• GRI generally underestimates the porosity compared to WI and N2 in these samples 244
(Figure 9d and 9e). 245
We measured PSD using N2 (Figure 10) and MI (Figure 11) techniques for all Silurian samples. 246
The N2 PSD spectra are colorcoded by both clay (Figure 10a) and TOC (Figure 10b) contents. 247
We make the following observatins: 248
• Significant variation in amplitude in the small mesopore range (<10 nm) is observed. 249
• The big mesopore (10-50 nm) and macropore range (>50 nm) show similar spectra with 250
small variations in amplitude. 251
• TOC and clay content do not show a clear effect on the PSD spectra. 252
• The MI PSD results (Figure 11) suggest that there are pores that are not accessible using 253
the MI technique. 254
• Clay content does not show a effect on the MI spectra amplitude (Figure 11a) whereas 255
TOC and spectra amplitude show a direct correlation (Figure 11b). 256
5.3 Niobrara Formation 257
Figure 12 shows the comparison between porosity values measured using the N2, MI and WI 258
techniques. Two distinct groups of data are observed in Figure 12a. Group 1 (data circled by a 259
blue dashed line in Figure 12a) shows higher WI porosity compared to N2 porosity, whereas 260
Group 2 (data circled by a red solid line in Figure 12a) shows more comparable WI and N2 261
porosities (within 2 p.u. difference). We make the following observations for samples with a 262
wide distribution of pore sizes and high clay content such as the Niobrara samples: 263

13
• Comparing N2 and WI samples show that N2 underestimates the porosity for some 264
samples and WI overestimates the porosity for some samples (Figure 12a). 265
• WI and MI porosities are comparable within 2 p.u. for low clay content (<10 wt%) 266
samples. WI overestimates the porosity for high clay samples (>10 wt%) (Figure 12b). 267
• N2 shows higher porosity for high clay content samples and MI shows higher porosity for 268
low clay samples (Figure 12c). 269
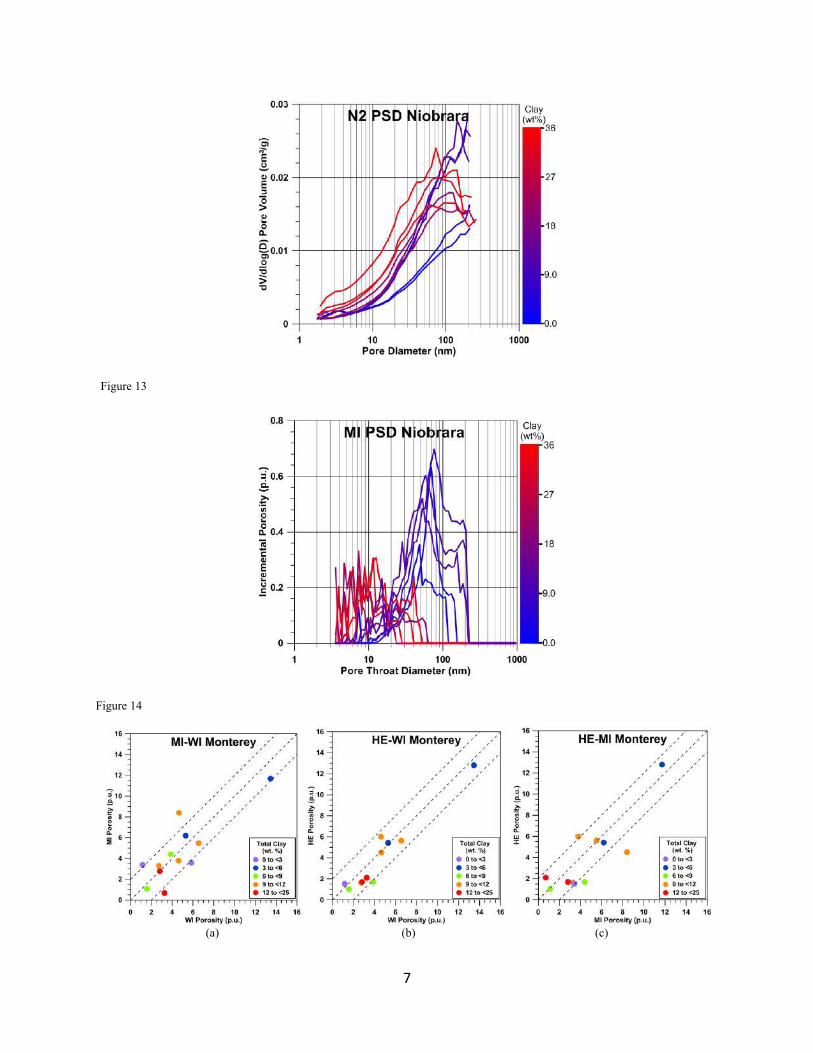
We measured PSD for Niobrara samples using the N2 (Figure 13) and MI (Figure 14) 270
techniques: 271
• The shapes of the PSD spectra (Figure 13) for low clay content samples show increasing 272
PSD amplitude which suggests the presence of pores larger than 200 nm. The high clay 273
content samples show a dominant pore size of 80-100 nm. 274
• Similar to N2-PSD data, the MI PSD data (Figure 14) show two different sets of spectra. 275
One set shows a PSD spectrum with a dominant pore size 80-100 nm (low clay content) 276
and the other set shows an abundance of small pores smaller than 20 nm (high clay 277
content) (Figure 14). 278
• The shape of MI spectra for high clay samples indicates the presence of pores that are not 279
accessible by mercury. 280
5.4 Monterey Formation 281
Porosity values were measured for Monterey samples using WI, MI, HE and N2 techniques 282
(Figure 15). We make the following observations: 283
• WI, MI and HE porosities show comparable values within 2 p.u. difference (Figure 15a 284
to 15c). 285

14
• HE and WI show the best correlation (Figure 15b). 286
• N2 significantly underestimates the porosity for high porosity (>5 p.u.) samples. 287
• N2 and HE show comparable values (within 2 p.u.) for low porosity samples (<5 p.u.). 288
• Clay content does not affect the porosity measurements. 289
Pore size distributions were measured for Monetery samples using N2 (Figure 16) and MI 290
(Figure 17) techniques, colorcoded by clay content: 291
• The N2 pore size amplitude (Figure 16) for pores larger than 10 nm varies significantly 292
and shows no correlation with the clay content. 293
• The amplitide for small mesopores (<10 nm) is small except for one high clay content 294
sample (Figure 16). 295
• The MI throat size distributions (Figure 17) also show a significant variation in both 296
amplitude and throat size. 297
• For these spectra clay content does not show any correlation with the shape and 298
amplitude either. 299
6. Discussion 300
The main driver for this comparative study was to analyze the differences in each method and to 301
exploit these differences to learn more about the samples honoring the mineralogical and 302
geochemical properties of each sample set. Samples were chosen from different formations. 303
Haynesville and Silurian formations are highly mature (gas window) with a very low hydrogen 304
index (average of 36 and 3, respectively). The Niobrara and Monterey samples are less mature 305
(oil window) with a very high hydrogen index (average of 306 and 374). We discussed the 306
results considering the effect of thermal maturity, TOC and clay content on the porosity, pore 307
size distribution and pore types. We worked with the strengths and drawbacks of each method as 308

15
listed in Table 2 for porosity and pore size distribution measurement. Here, we discuss our 309
results and evaluate the benefits and applicability of each technique for organic-rich mudrocks. 310
As mentioned in Table 2 MI technique measures the porosity for pores with a throat diameter 311
smaller than 3.6 nm. Underestimation of MI porosity values for Haynesville (Figure 6a and 6b) 312
and Silurian (Figure 9a and b) is because of the high thermal maturity (low HI) and consequently 313
the abundance of organic matter (OM)-hosted pores in these samples. OM-hosted pores are in 314
the mesopore (2-50 nm) and small macropore size (50-200 nm) range and not accessible by MI 315
technique. MI porosity values for low clay content (< 10 wt%) Niobrara (Figure 12b) and 316
Monterey samples (Figure 15a and c) are comparable with other techniques. The porosity in 317
these samples are mainly intercrystalline and accessible by mercury. 318
WI porosity measures the pores that are filled with distilled water. The presence of expandable 319
clays in the samples causes overestimation of porosity. Mineralogy of Niobrara samples showed 320
presence of expandable clays (smectite) in these samples. The clay content in other sample sets 321
mainly consisted of Kaolinite and illite which are less expandable. The effect of expandble clays 322
in Niobrara high clay (> 10 wt%) samples can be seen when WI is compared against N2 (Figure 323
12a) and MI (Figure 12b). In more thermally mature samples such as Haynesville (Figure 6c) 324
and Silurian (Figure 9c) and low clay content samples such as Monterey (Figure 15a and 15b) 325
the clay swelling is not significant and WI porosity is comparable with other techniques within 2 326
p.u. difference. As mentioned in Table 2 water might not be able to fill the hydro-phobic organic 327
hosted pores. We can not directly observe this phenomena in the porosity data presented in this 328
study but there are some indications of the effect of hydrophobic pores on WI porosity 329
measurement. There is higher scatter in the WI-N2 porosity comparison for Haynesville (Figure 330
6c) and Silurian (Figure 9c) samples compared to the HE-WI porosity comparison for Monterey 331

16
samples (Figure 15b). Monterey samples are in the oil window and intercrystalline pores are the 332
dominant pore types, but Haynesville and Silurian are in the gas window and OM-hosted pores 333
form the dominant pore type which is hydrophobic. 334
Since the N2 technique can not assess pores with a diameter larger than 200 nm, the comparable 335
N2 porosity for Haynesville (Figure 6c and 6d) and Silurian (Figure 9c) shows the abundance of 336
pores within the mentioned range in these samples. High Clay (> 10 wt%) Niobrara samples also 337
show the presence of OM-hosted pores. The N2 technique is able to measure the porosity in 338
High Clay (> 10 wt%) Niobrara samples while the MI technique underestimates and WI 339
overestimates the porosity. OM-hosted pores are not abundant in the low porosity (< 5 p.u.) 340
Monterey samples. The similarity of N2 porosity with other techniques (Figure 15a to 15c), for 341
these samples is due to the presence of intercrystalline pores with a diameter smaller than 200 342
nm. 343
GRI porosity was measured for Haynesville samples and a limited number of Silurian samples. 344
The higher scatter in low clay (<35 wt%) Haynesville samples (Figure 6e) is due to hot solvent 345
extraction prior to GRI measurements. Removal of soluable organic matter increases the porosity 346
measured by the GRI technique. This effect is ruled out for Silurian samples since no soluble 347
bitumen was observed in these samples. The underestimation of GRI for Silurian samples might 348
be due to inacscessibility of gas to the micropores. The HE technique successfully measures 349
porosity for the Monterey samples since no OM-hosted pores are present in these samples. 350
Comparison of porosity values measured by different techniques show that when the N2 and MI 351
techniques measure comparable porosity with other techniques, the pore size distribution 352
assessed by these techniques can be used to study the pore structure. For example the N2 pore 353

17
size distribution can be used to study the pore structure for highly mature gas window samples 354
(Haynesville and Silurian), Clay rich oil window samples (Niobrara with clay content more than 355
10 wt%), and oil window tight samples ( Monterey samples with porosity lower than 5 p.u.). MI 356
pore throat size distribution spectra can not be used in gas window samples (Haynesville and 357
Silurian), but it is an appropriate technique for studying the pore structure in oil window low clay 358
(<10 wt%) Niobrara and high porosity Monterey (>5 p.u.) samples. 359
The pore size distributions in Figure 7 are divided into 5 groups based on the PSD spectra shapes 360
(Figure 18). The correlation between the TOC and clay content for the Haynesville samples 361
(Figure 19) shows an inverse correlation between TOC and clay content. Clay content cut offs 362
for different groups are defined as <35 wt%, 35-50 wt%, 50-60 wt% and >60 wt%. Group 5 363
samples are dolomite rich samples with >30 wt% dolomite content. Group 1 samples (Figure 364
18a) show dominant pore size of 20 nm. These samples have high TOC and consequently an 365
abundance of OM-hosted pores (Figure 20). Group 2 to 5 (Figure 18b to d) show an increase in 366
the small mesopore size range (<10 nm) and decrease in the big mesopore (10-50 nm) and 367
macropore size (>50 nm) range. Group 2 samples have slightly lower TOC and higher clay 368
content compared to Group 1. They show an abundance of OM-hosted pores and the presence of 369
intercrystalline pores in clay minerals (Figure 21). SEM images for Group 3 samples (Figure 22) 370
confirm the N2 PSD results (Figure 18c) which demonstrate both intercystalline (< 10 nm) and 371
OM-hosted pores (> 10 nm). Group 4 samples are clay rich (60-80 wt%) and show an abundance 372
of small mesopores (<10 nm) measured by N2 PSD (Figure 18d). SEM images (Figure 23) show 373
that intercrystalline pores in clay minerals are the dominant pores in these samples. Group 5 374
samples are dolomite rich (> 30 wt%) with a very low TOC content (< 1.5 wt%). The spaces 375
18
between dolomite grains are filled with a mixture of clay and quartz particles which host the 376
intercrystalline pores in these samples (Figure 24). 377
N2 PSD for Silurian samples (Figure 10) show relatively similar amplitudes for large mesopores 378
(10-50 nm) and macropores (>50 nm). The PSD amplitude for pores with a diameter smaller than 379
10 nm varies significantly. The TOC-Clay content correlation for the Silurian samples (Figure 380
25) shows two different trends; low clay-low TOC samples (Group 1) and high clay-high TOC 381
samples (Group 2). In Group 1 the amplitude for pores with a diameter less than 10 nm increases 382
as the clay content increases (Figure 26a). However in Group 2 the peak amplitude for pores 383
smaller than 10 nm increases as the TOC increases (Figure 26b). The SEM images for a sample 384
from Group 1 (Figure 27) show the presence of both OM-hosted pores and intercrystalline pores. 385
However, Group 2 sample SEM images show an abundance of OM-hosted pores. The 386
intercrystalline pores are filled with organic matter which hosts the majority of the pores (Figure 387
28). 388
Although both Haynesville and Silurian are in the gas window and show relatively similar TOC-389
Clay content correlations, there are key differences between the pore structure of these samples: 390
• The clay content varies between 30 to 60 wt% for the Silurian samples and 20-80 wt% for 391
the Haynesville samples. 392
• The dominant pore type for the Silurian samples is OM-hosted and the pore structure is 393
dictated mainly by TOC, whereas for the Haynesville samples both clay content and TOC 394
control the pore structure. 395
• Silurian samples belong to a geologically older formation than the Upper Jurrasic 396
Haynesville samples which come from an over-pressured formation. 397

19
N2 PSD for the Niobrara samples are divided into two groups based on the PSD spectra shapes 398
(Figure 29). The PSD of the Group 1 samples (Figure 29a) shows the presence of pores larger 399
than 200 nm that were not assessed by the N2 technique. The PSD of the majority of Group 2 400
samples (Figure 29b) show that the dominant pore size is close to 100 nm. These groups 401
correspond to the groups shown in Figure 12a. Group 1 samples belong to Chalky and Group 2 402
samples belong to the Marly formations. TOC-Clay correlation for these samples (Figure 30) 403
demonstrates that the majority of Group 1 samples show TOC less than 2 wt% and Group 2 404
samples show TOC higher than 2 wt%. In Group 1 samples the pores are mainly intercrystalline 405
and reside in the clay minerals that fill the space between calcite grains (Figure 31). Figure 31a 406
shows how quartz, calcite and clay particles fill the space between calcite grains and form the 407
intercrystalline pore structure. No organic matter or organic-hosted pores are present in this 408
sample. Figure 31b shows a connected network of intercrystalline pores which are accessible to 409
displacement fluids for porosity measurements. The pores in the Group 2 samples (Figure 32) 410
reside in the organic matter and show smaller pores compared to Group 1. A significant amount 411
of TOC is visible in this sample which fills the intercrystalline pores (Figure 32a). Figure 32b 412
shows the organic-hosted porosity. As shown by the annotations in this figure the pores are 413
smaller than 100 nm. Small pore size and possibly lack of connectivity limit the accessibility of 414
the displacement fluids to these pores for porosity measurements. 415
The clay content range (20-40 wt%) and TOC-Clay content correlation for the Group 1 Niobrara 416
samples (Figure 25) are similar to the Group 2 Haynesville samples (Figure 19). The N2 PSD 417
measured for these samples are also similar (Figure 18b and Figure 29b). Since both groups of 418
samples have high TOC and an abundance of OM-hosted pores, this similarity confirms that 100 419
nm is the signature pore diameter for these pore types. 420

20
Based on the porosity comparisons presented in Figure 15 the Monterey samples can be divided 421
into two groups; Group 1 with low porosity samples (< 5 p.u.) and Group 2 with high porosity 422
samples (>5 p.u.). N2 PSD data for both groups are shown in Figure 33a and b, respectively. 423
Both groups show very low amplitudes at small mesopores range (<10 nm), except one high clay 424
sample in Group 1. N2 PSD of Group 1 samples represents the whole pore structure whereas the 425
Group 2 PSD spectra only represents pores smaller than 200 nm. Since the Monetery samples 426
have very low clay content there is no correlation between the PSD spectra and clay content for 427
either groups. The PSD spectra are mainly a function of the intercrystalline pores in the quartz 428
phase. Group 1 samples have intercrystalline pores in the clay phase and interacrystalline pores 429
within the quartz and calcite grains (Figure 34). The intercrystalline space is filled with organic 430
matter which holds very low OM-hosted porosity. Group 2 samples show larger intercrystalline 431
pores compared to Group 1 samples. The pores are developed in the space between quartz grains 432
(Figure 35). 433
Although the N2 technique does not assess the whole pore space for either Group 1 Niobrara 434
(Figure 29a) or Group 2 Monterey (Figure 33b) samples, the N2 PSD spectra shapes are 435
different. Since MI PSD is the appropriate technique for pore structure characterization for these 436
samples we will discuss the main reason for this difference in the following section. 437
Throat size distribution for Group 2 Haynesville samples (Figure 8) indicates that there are pores 438
with throat diameter smaller than 3.6 nm that are not assessed by the MI technique. Based on N2 439
PSD results, Group 2 samples have the highest macropore volume amongst all groups in this 440
sample set, so the MI technique would not be able to assess a major part of the pore space for the 441
other groups either. 442

21
Similar to Haynesville samples, Silurian MI throat size distribution also showed that there are 443
pores with throat diameter smaller than 3.6 nm that are not reached by the mercury. The MI 444
spectra for Group 1 samples (Figure 36a) do not demonstrate the same clay content dependency 445
as N2 spectra for these samples (Figure 26a). On the other hand MI spectra amplitude of Group 2 446
samples (Figure 36b) increases with increasing TOC, similar to N2 PSD (Figure 26b). 447
Throat size distributions assessed by the MI technique for Groups 1 and 2 Niobrara samples are 448
shown in Figure 37a and 37b, respectively. For the samples in Group 1 (Figure 37a) mercury 449
successfully accessed the pores which were not accessible by N2. On the other hand, the pore 450
throat size spectra for Group 2 show that there are pores associated with throats smaller than 3.6 451
nm. 452
MI PSD spectra show more heterogeneity in the Monterey samples (Figure 38) compared to the 453
Niobrara samples (Figure 37). The dominant throat size distributions for Monterey samples vary 454
significantly from less than 20 nm for Group 1 samples (Figure 38a) to more than 200 nm for 455
Group 2 samples (Figure 38b). Besides heterogeneity, Group 2 samples show a wider range of 456
throat size distribution for individual samples, whereas in Group 1, Niobrara samples MI PSD 457
shows a more uniform PSD with variable amplitudes (Figure 37a). 458
7. Conclusions 459
The porosity and pore size distribution were measured for four sample sets from different 460
formations ranging from high thermal maturity (gas window Haynesville and Silurian) to low 461
maturity (oil window Niobrara and Monterey). The clay content and TOC vary significantly 462
within each sample set. Based on the results presented in this study the following conclusions 463
can be drawn: 464

22
- Using samples from different formations and maturities, we have shown that without a 465
priori knowledge regarding thermal maturity, TOC, clay type and content porosity and pore 466
size distributions in mudrocks cannot be assessed or studied using a single method. Our 467
assessment of pore size sensitivity for each technique emphasizes the significance of 468
combining various techniques to describe the full pore topology in organic-rich mudrocks. 469
- MI technique underestimates the porosity for thermally mature samples (Haynesville) with 470
an abundance of OM-hosted pores. It also underestimates the porosity in less mature 471
Niobrara samples when TOC is high and tight Monterey samples (<5 p.u.). 472
- WI provides reliable porosity when samples are thermally mature or when no expandable 473
clays are present. 474
- N2 technique is appropriate for porosity and pore size distribution assessment for thermally 475
mature samples (Haynesville and Silurian) or samples with an abundance of OM-hosted 476
pores (Niobrara). It also successfully assesses the low porosity Monterey samples. 477
- The reliability of the measured porosities depends on the accessibility of the displacement 478
fluid to the pores. Thus, pore accessibility or wettability of the solid to the probe fluid can 479
be investigated by comparing the pore size distributions measured by different techniques. 480
A combination of methods is required to reliably measure porosity and pore size 481
distribution in mudrocks. 482
8. Acknowledgements 483
We would like to thank Douglas McCarty, Arkadiusz Derkowski, Benjamin Harrell and Cesar 484
Mapeli for their help with the experiments and fruitful discussions. We thank Chesapeake 485
Energy Reservoir technology Center and Don Harville for their collaboration. We also thank 486
OCLASSH and Center for Rock Abuse groups for support and funding of the research. 487

23
9. References 488
Alcantar-Lopez, L., and Chipera, S., 2013, Improving our understanding of porosity in 489
source rock reservoirs through advanced imaging techniques: Unconventional Resources 490
Technology Conference, SPE Paper 168916, doi: 10.1190/URTEC2013-164. 491
Ambrose, R. J., Hartman, R. C., Diaz-Campos, M., Akkutlu, I. Y., and C. H. Sondergeld, 492
2010, New pore-scale considerations for shale gas in place calculations: Society of Petroleum 493
Engineers Unconventional Gas Conference, February 23–25, Pittsburgh, PA, SPE Paper 131772, 494
doi: 10.2118/131772-MS. 495
Barrett, E. P., Joyner, L. G., and Halenda, P. P., 1951, The determination of pore volume and 496
area distributions in porous substances. I. computations from nitrogen isotherms, Journal of the 497
American Chemical Society, v. 73, n.1, p. 373–380. 498
Bernard, S., Wirth, R., Schreiber, A., Schulz, H. M., and Horsfield, B., 2012, Formation of 499
nanoporous pyrobitumen residues during maturation of the Barnett Shale (Fort Worth Basin): 500
International Journal of Coal Geology, v. 103, p. 3-11, doi: 10.1016/j.coal.2012.04.010. 501
Bohacs, K. M., Passey, Q.R., Rudnicki, M., Esch, W. L., and Lazar, O. R., 2013, The 502
spectrum of fine-grained reservoirs from 'shale gas' to 'shale oil'/tight liquids: essential attributes, 503
key controls, practical characterization: 6th International Petroleum Technology Conference, 504
Paper IPTC 16676, doi: 10.2523/16676-MS. 505
Chalmers, G. R., Bustin, R. M., and Power, I. M., 2012, Characterization of gas shale pore 506
systems by porosimetry, pycnometry, surface area, and field emission scanning electron 507
microscopy/transmission electron microscopy image analyses: examples from the Barnett, 508
Woodford, Haynesville, Marcellus, and Doig Units: AAPG Bulletin, v. 96, n. 6, p. 1099-1119. 509
24
Comisky, J., Santiago, M., McCollom, B., Buddahala, A., and Newsham, K., 2011, Sample 510
size effects on the application of mercury injection capillary pressure for determining the storage 511
capacity of tight gas and oil shales: Canadian Unconventional Resources Conference, SPE Paper 512
149432, doi: 10.2118/149432-MS. 513
Coshell, L., Mclver, R. G., and Chang, R., 1994, X-ray computed tomography of Australian 514
oil shales: non-destructive visualization and density determination: Journal of Fuel, v. 73, n. 8, p. 515
1317-1321. 516
Curtis, M. E., Ambrose, R. J., Sondergeld, C. H., and Rai, C. S., 2010, Structural 517
characterization of gas shales on the micro- and nano-scales, Canadian Unconventional 518
Resources & International Petroleum Conference, Paper CUSG/SPE 137693, doi: 519
10.2118/137693-MS. 520
Curtis, M. E., Sondergeld, C. H., Ambrose, R. J., and Chandra, S. R., 2012, Microstructural 521
investigation of gas shales in two and three dimensions using nanometer-scale resolution 522
imaging: AAPG Bulletin, v. 96, n. 4, p. 665-677. 523
Dorsch, J., and Katsube, T. J., 1996, Effective porosity and pore-throat sizes of mudrock 524
saprolite from the Nolichucky shale within Bear Creek Valley on the Oak Ridge Reservation: 525
Implications for contaminant transport and retardation through matrix diffusion, n. 526
ORNL/GWPO - 025. Technical Report Oak Ridge National Lab., Environmental Sciences Div., 527
TN (United States). 528
Echeverria, J. C., Morera, M. T., Mazkiaran, C., and Garrido, J. J., 1999, Characterization of 529
porous structure of soils: adsorption of nitrogen (77 K) and carbon dioxide (273 K), and mercury 530

25
porosimetry: European Journal of Soil Science, v. 50, p. 497-503, doi: 10.1046/j.1365-531
2389.1999.00261.x. 532
Folk, R. L., 1974, Petrology of sedimentary rocks, Hemphill Publishing Company. 533
Friedman, G., 2003, Classification of sedimentary rocks. In G. V. Middleton (Ed.), Encyclo- 534
pedia of sediments and sedimentary rocks Kluwer Academic encyclopedia of earth sciences 535
series. Dordrecht, The Netherlands, Boston: Kluwer Academic Publishers. 536
Gaucher, 537
Godinez, L. J., 2013, Control factors for fluid saturation and pore size distributions based on 538
gas adsorption, cec and 2d dielecric microscopy: A case study of the quartz phase porcelanites in 539
the Miocene Monterey formation: M.Sc. Thesis, Colorado School of Mines. 540
Gregg, S. J., and Sing, K. S. W., 1983, Adsorption, Surface Area, and Porosity. (2nd edition). 541
New York: Academic Press. 542
Harkins, D. W., and Jura, G., 1944, Surfaces of Solids. XII. An Absolute Method for the 543
Determination of the Area of a Finely Divided Crystalline Solid, Journal of the American 544
Chemical Society, v. 66, n. 8, p. 1362-1366, 10.1021/ja01236a048. 545
Hossain, Z., Grattoni, C. A., Solymar, M., and Fabricius, I. L., 2011, Petrophysical properties 546
of greensand as predicted from NMR measurements: Journal of Petroleum Geoscience, v. 17, p. 547
111-125, doi: 10.1144/1354-079309-038. 548
Howard, J. J., 1991, Porosimetry measurement of shale fabric and its relationship to 549
illite/smectite diagenesis: Journal of Clays and Clay Minerals, v. 39, n. 4, p. 355-361. 550
Javadpour, F., 2009, Nanopores and apparent permeability of gas flow in mudrocks (shales 551
and siltstone), Journal of Canadian Petroleum Technology, v. 48, p. 16–21. 552

26
Jiang, T., Rylander, E., Singer, P. M., Lewis R. E., Sinclair, S. M., 2013, Integrated 553
petrophysical interpretation of Eagle Ford shale with 1-D and 2-D nuclear magnetic resonance 554
(NMR): SPWLA 54th Annual Logging Symposium, Paper LL. 555
Katsube, T. J., and N. Scromeda, 1991, Effective porosity measuring procedure for low 556
porosity rocks: Geological Survey of Canada, Paper 91-1E, p. 291–297. 557
Katsube, T. J., Scromeda, N., and Williamson, M., 1992, Effective porosity of tight shales 558
from the Venture gas field, Offshore Nova Scotia: Geological Survey of Canada, Paper 92-1D, p. 559
111-119. 560
Kuila, U., and Prasad, M., 2011, Surface area and pore-size distribution in clays and shales: 561
Geophysical Prospecting, v. 61, n. 2, p. 341-362, doi: 10.1111/1365-2478.12028. 562
Kuila, U., Prasad, M., Derkowski, A., and McCarty, D., 2012, Compositional controls on 563
mudrock pore-size distribution: An example from Niobrara formation: SPE Annual Technical 564
Conference and Exhibition, SPE Paper 160141, doi: 10.2118/160141-MS. 565
Kuila, U., 2013, Measurement and Interpretation of Porosity and Pore-Size Distribution in 566
Mudrocks: the Hole Story of Shales: Ph.D. Thesis, Colorado School of Mines. 567
Kuila, U., McCarty, D. K., Derkowski, A., Fischer, T. B., and Prasad, M., 2014a, Total 568
porosity measurement in gas shales by the water immersion porosimetry (WIP) method: Journal 569
of Fuel, v. 117, Part B, p. 1115-1129, doi: 10.1016/j.fuel.2013.09.073. 570
Kuila, U., McCarty, D. K., Derkowski, A., Fischer, T. B., Topór, T., and Prasad, M., 2014b, 571
Nano-scale texture and porosity of organic matter and clay minerals in organic-rich mudrocks: 572
Journal of Fuel, v. 135, p. 359-373, doi: 10.1016/j.fuel.2014.06.036. 573

27
Lemmens, H. J., Butcher, A. R., and Botha, P., 2011, FIB/SEM and SEM/EDX: A new dawn 574
for the SEM in the core lab?: International Symposium of the Society of Core Analysts, Paper 575
SCA2010-08. 576
Loucks, R. G., Reed, R. M., Rupple, S. C., and Hammes, U., 2012, Spectrum of pore types 577
and networks in mudrocks and a descriptive classification for matrix-related mudrock pores: 578
AAPG Bulletin, v. 96, n. 6, p. 1071-1098. 579
Luffel, D.L., Guidry, F. K., and Curtis, J. B., 1992, Evaluation of Devonian shale with new 580
core and log analysis methods: Journal of Petroleum Technology, v. 44, no. 11, p. 1192-1197. 581
Luffel, D. L. and Guidry, F. K. 1992, New core analysis-methods for measuring reservoir 582
rock properties of Devonian shale: Journal of Petroleum Technology, v. 44, no. 11, p. 1184-583
1190, doi: 10.2118/20571-PA. 584
Milliken, K. L., Rudnicki, M., Awwiller, D. N., and Zhang, T., 2013, Organic matter-hosted 585
pore system, Marcellus Formation (Devonian), Pennsylvania: AAPG Bulletin, v. 97, no. 2, p. 586
177-200. 587
Nelson, P., 2009, Pore-throat sizes in sandstones, tight sandstones, and shales: AAPG 588
Bulletin, v. 93, no. 3, p. 329-340. 589
Passey, Q. R., Bohacs, K. M., Esch, W.L., Klimentidis, R., and Sinha, S., 2010, From oil-590
prone source rock to gas-producing shale reservoir–geologic and petrophysical characterization 591
of unconventional shale-gas reservoirs: International Oil and Gas Conference and Exhibition, 592
SPE Paper 131350, doi: 10.2118/131350-MS. 593
Rivera, S., 2013, Petrophysical properties of the Monterey Formation – San Joaquin Valley: 594
M.Sc. Thesis, Colorado School of Mines. 595
28
Rivera, S., Saidian, M., Godinez, L. J., and Prasad, M., 2014, Effect of mineralogy on NMR, 596
sonic, and resistivity: A case study of the Monterey Formation, Unconventional Resources 597
Technology Conference, August 25-27, Denver, CO, URTeC 1922872, doi: 10.15530/urtec-598
2014-1922872. 599
Rouquerol, J., Avnir, D., Fairbridge, C.W., Everett, D. H., Haynes, J.M., Pernicone, N., Sing, 600
J.D. F., and Unger, K. K., 1994, Recommendations for the characterization of porous solids 601
(Technical Report): Pure and Applied Chemistry, v. 66, n. 8, p. 1739–1758, doi: 602
10.1351/pac199466081739. 603
Rylander, E., Singer, P. M., Jiang, T., Lewis, R., McLin, R., and Sinclair, S., 2013, NMR T2 604
distributions in the Eagle Ford shale: Reflections on pore size, Unconventional Resources 605
Conference, SPE Paper 164554, doi: 10.2118/164554-MS. 606
Saidian, M., Rasmussen, T., Nasser, M., and Tobin, R., 2015, Qualitative and quantitative 607
reservoir bitumen characterization: A core to log correlation methodology, Interpretation, v. 3, 608
no.1, p. SA143-SA158, doi: 10.1190/INT-2014-0052.1. 609
Sondergeld, C., Ambrose, R., and Rai, C. S., 2010a, Micro-structural studies of gas shales, 610
SPE Unconventional Gas Conference, SPE Paper 131771, doi: 10.2118/131771-MS. 611
Sondergeld, C. H., Newsham, K. E., Thomas, J., Rice, M. C., and Rai, C. S., 2010b, 612
Petrophysical considerations in evaluating and producing shale gas resources, SPE 613
Unconventional Gas Conference, SPE Paper 131768, doi: 10.2118/131768-MS. 614
Washburn, E. W., 1921, The dynamics of capillary flow, Physical Review Letters, v. 17, no. 615
3, p. 273-283, doi: 10.1103/PhysRev.17.273. 616

29
Wildenschild, D., and Sheppard, A. P., 2012, X-ray Imaging and Analysis Techniques for 617
Quantifying Pore-Scale Structure and Processes in Subsurface Porous Systems, Advances in 618
Water Recourses, v. 51, p. 217-246, doi: 10.1016/j.advwatres.2012.07.018. 619
Zargari, S., Prasad, M., Kenechukwu, M. C., and Mattson, E. D., 2013, Organic maturity, 620
elastic properties, and textural characteristics of self-resourcing reservoirs, v. 78, n. 4, p. D223-621
D235, doi: 10.1190/geo2012-0431.1. 622
Biographies 623
Milad Saidian is currently a petroleum engineering PhD candidate at Colorado School of 624
Mines. He holds BS degree from Petroleum University of Technology and MS degree from 625
Sharif University of technology. His PhD research interest is fluid properties and pore space 626
characterization using Nuclear Magnetic Resonance for conventional and unconventional 627
reservoir rocks focusing on porosity and pore size distribution measurement methods. His 628
industrial work experience includes internships at BP America and Maersk Oil Houston Inc. as 629
petrophysicist, NIOC as reservoir engineer and Maroon Oil and Gas Production Company as 630
production field engineer. 631
Utpalendu Kuila is Senior Petrophysicist with Rajasthan Exploration Team at Cairn India Ltd. 632
He has a B.Sc. and M.Sc. in geology and a Ph.D. in Petroleum Engineering. He has a worked as 633
a visiting scholar in CSIRO Petroleum, Perth Australia and as an Associate Researcher in 634
Institute of Geological Sciences, Polish Academy of Science. 635
636

30
Manika Prasad is Associate Professor at Colorado School of Mines. She has a BS, an MS 637
(Diplom-Geologie), and a PhD (magna cum laude) in geophysics. Manika worked at University 638
of Hawaii's Mineral Physics Laboratory and at Stanford Rock Physics Laboratory, and now co-639
directs the Center for Rock Abuse at CSM. Her students have won student paper awards. She 640
was named Outstanding Mentor to Native American students at Stanford. Manika's quest is to 641
understanding how ant-sized phenomena control elephant-sized features. 642
Leo Alcantar-Lopez holds B.S. degree in Biology from National University of Mexico at 643
1985. He worked at Chesapeake Energy, Oklahoma City, from March 2007 to present as Sr. 644
Staff Scientist with main focus on SEM analysis and research on shale organic matter structural 645
development. Experience includes 25 years in instrumental analysis seven of which have been 646
on SEM. Attended Lehigh Microscopy School in 2013. 647
Saul Rivera is currently a petrophysicist at Chesapeake Energy working on unconventional and 648
conventional plays. His topics of interest include porosity, permeability, and mechanical 649
properties. He holds a BSc and MSc in Petroleum Engineering from Colorado School of Mines. 650
Saul is an active member of SPWLA, SPE, and AAPG. 651
Lemuel J. Godinez Graduated from Colorado School of Mines in 2011 and 2014 with a BS and 652
MSc in Petroleum Engineering. His MSc research focused on the relationship between 653
mineralogy and fluid saturation distribution in the Miocene Monterey formation. He has been an 654
intern for Venoco Inc., as a Petrophysical Engineer, Operations Engineer and a Field Engineer. 655
He is currently a Reservoir Engineer for an E&P operator based in Houston. 656
657
658

1
Figure 1: Mineralogy of (a) Haynesville, (b) Silurian, (c) Niobrara (Chalk, Marl and Fort Hays),
and (d) Monterey samples measured by QXRD and colorcoded by TOC. See sample discriptions
for more information. The TOC values for Monterey samples used in this study are not available.
Figure 2: SEM images for two Haynesville samples. (a) Silt-sized quartz, calcite and plagioclace
particles surrounded by a mixture of illite and clay-sized quartz. Organic matter is dispersed
between clay-sized particles. (b) Dolomite rich sample with intergranular spaces filled with a
mixture of quartz and clay minerals as well as organic matter. The Haynesville samples are clay-
rich (illite and smectite) with moderate amounts of quartz and calcite. Moderate amount of
dolomite is observed in some samples. The TOC varies between 0.5-6.3 wt%; the kerogen is in
the gas window based on average Tmax of 424 °C and HI varying from 19 to 57 with an average
of 36. RockEval S2 data between 350-400 °C show a moderate amount of bitumen. Qz= Quartz,
Cal=Calcite, Dol=Dolomite, Py=Pyrite, Pl=Plagioclase, Ilt=Illite, Chl=Chlorite, OM=Organic
Matter.
Figure 3: SEM images for two Silurian samples. (a) and (b) Silt-size particles such as quartz,
pyrite, and dolomite are surrounded by a matrix of illite and chlorite. Organic matter is dispersed
between clay particles.The Silurian samples are quartz- and clay-rich (mostly illite and smectite).
The kerogen is thermally mature in the gas window and TOC ranges between 1-6 wt %. No
pyrogram peaks were observed in the Rock Eval results up to 550 °C which confirms the
absence of any pyrolyzable kerogen or bitumen in these samples. The HI varies from 0 to 9 with
an average of 3. Qz= Quartz, Cal=Calcite, Dol=Dolomite, Py=Pyrite, Pl=Plagioclase, Ilt=Illite,
Chl=Chlorite, OM=Organic Matter, TiO2=Titanium Dioxide.

2
Figure 4: SEM images for two Niobrara samples. (a) shows relatively more homogeneous
intercrystalline pore distribution which is filled with organic matter. (b) shows larger
intercrystalline pores filled with organic matter. Note that the larger intercrystalline pores are
within the peloid structures. Niobrara samples are calcite-rich rocks with moderate amounts of
clay, quartz and pyrite. Type II kerogen is thermally mature and is in oil window based on
average Tmax of 436 °C and HI varying from 119 to 386 with an average of 306. TOC varies
from 0.1 to 5.3 wt% and RockEval programs between 450-500 °C show abundance of bitumen in
these samples. Qz= Quartz, Cal=Calcite, Dol=Dolomite, Py=Pyrite, Hem= Hematite,
Pl=Plagioclase, Ilt=Illite, OM=Organic Matter, TiO2=Titanium Dioxide, Ms=Mascovite.
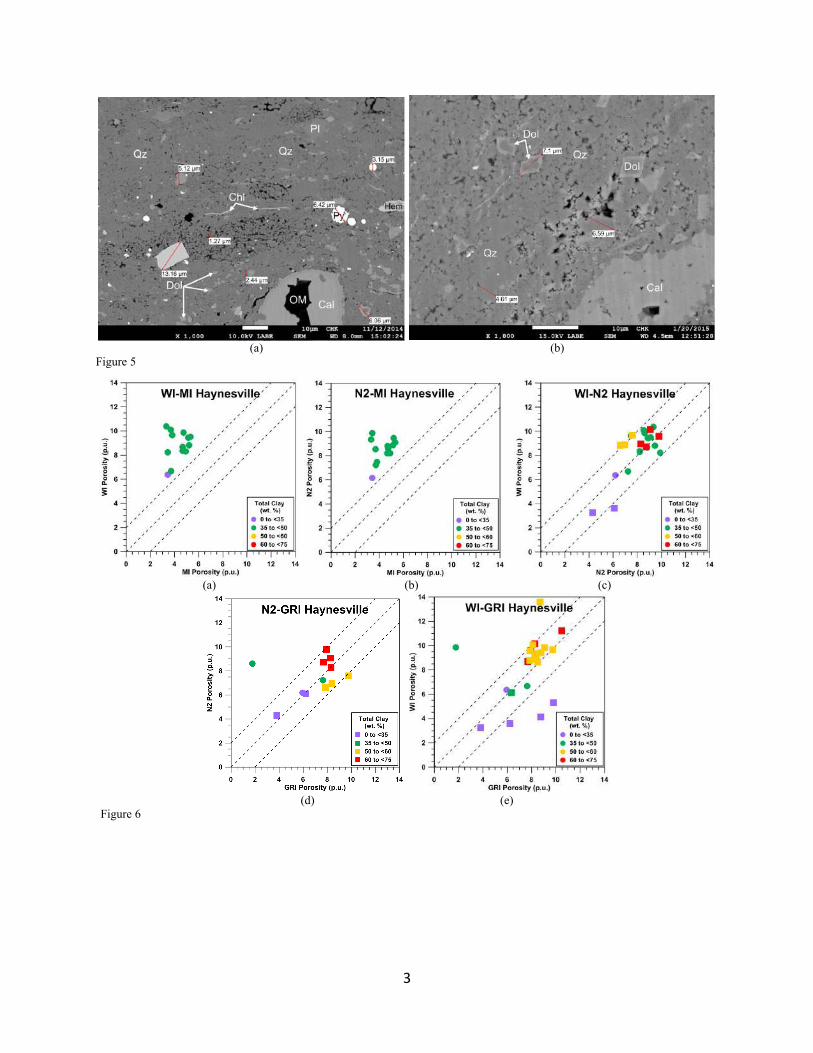
Figure 5: SEM images for two Monterey samples. (a) and (b) moderate carbonate and dominant
quartz grains with presence of organic matter filling up the intergranular and intercrystalline
pores. The Monetery samples are predominantly porcellanites containing moderate amounts of
clay and pyrite. A smaller sample set is calcite-rich. TOC varies from 0.85-4.95 wt% and
RockEval S2 data show an abundance of bitumen (Rivera, 2014). Kerogen is Type II with
thermal maturity in the oil window based on average Tmax of 438 °C and hydrogen index (HI)
varying from 184 to 473 with an average of 374. Qz= Quartz, Cal=Calcite, Dol=Dolomite,
Py=Pyrite, Hem= Hematite, Pl=Plagioclase, OM=Organic Matter.
Figure 6: Porosity comparison for Haynesville samples. The porosities are measured by (a) WI
and MI, (b) N2 and MI, (c) WI and N2, (d) N2 and GRI and (e) WI and GRI. Data points are
color-coded by clay content. Since all the measurements are not performed for all samples, circle
and square symbols are used to differentiate different samples with similar measurements. (a)
and (b) MI underestimates the porosity when compared with WI and N2. (c) WI and N2 show
comparable porosity values within 2 p.u.. (d) and (d) GRI and N2 show similar porosity values

3
within 2 p.u. and (e) Except some low content samples that show higher GRI porosity, the WI
and GRI porosity show similar porosities within 2 p.u. difference
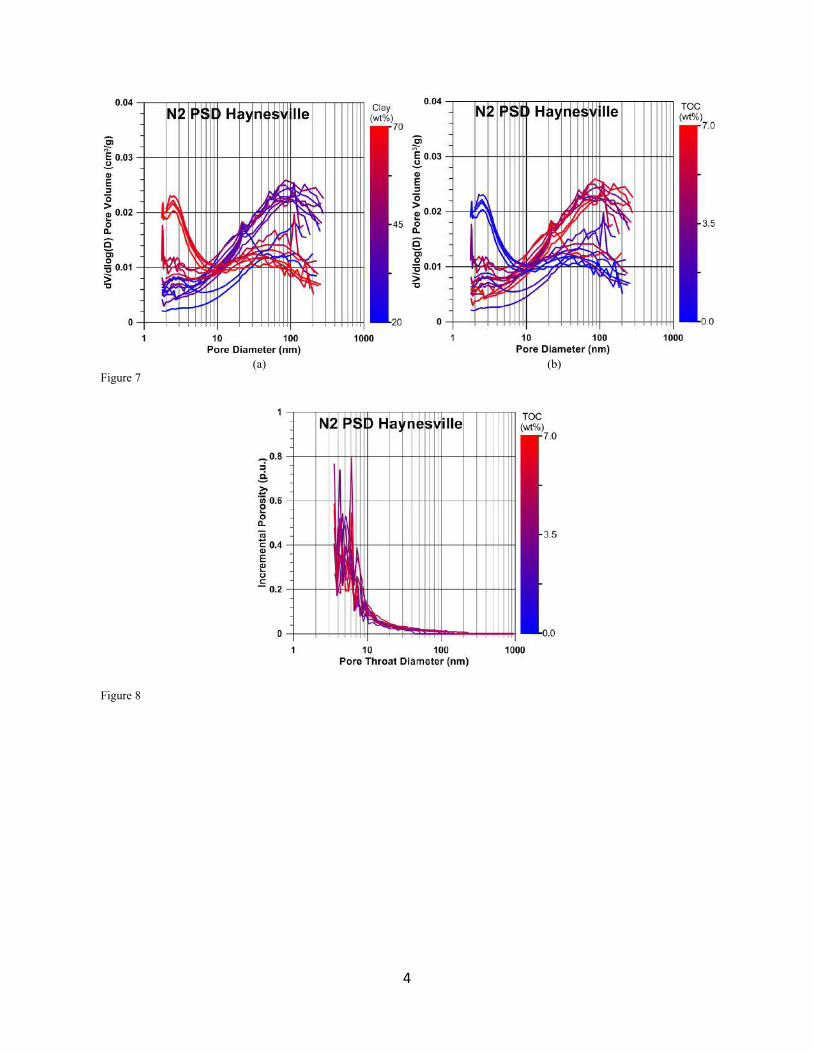
Figure 7: N2 PSD spectra of Haynesville samples colorcoded by (a) clay content and (b) TOC
content. Samples with high clay and low TOC show high amplitudes at small mesopore range (<
10nm) and samples with low clay and high TOC show high amplitudes at big meso pores (10-50
nm) and macropores range (>50 nm).
Figure 8: MI throat size distributions for Group 2 which has the highest macropore volume
compared to other gropus. The MI porosity was highly underestimated compared to other
techniques. This implies that the throat size distributions do not assess the whole pore space.
Figure 9: Porosity comparison for Silurian samples. The porosities are measured by (a) WI and
MI, (b) N2 and MI, (c) WI and N2, (d) WI and GRI and (e) N2 and GRI, all colorcoded by TOC
content. (a) to (c) MI, N2 and WI measurements show an increase in porosity with increase in
TOC. (a) and (b) MI highly underestimates the porosity compared to WI and N2 techniques (c)
WI and N2 porosities are comparable withing 2 p.u. difference. (d) and (e) GRI generally
underestimates the porosity compared to WI and N2 in these samples.
Figure 10: The pore size distribution measured by N2 technique for Silurian samples colorcoded
by (a) clay content and (b) TOC content. (a) and (b) Significant variation in amplitude in small
mesopore range (<10 nm) is observed. The big mesopore (10-50 nm) and macropore range (>50
nm) show similar spectra with small variations in amplitude. TOC and clay content do not show
a clear effect on the PSD spectra.

4
Figure 11: The throat size distribution measured by MI technique for Silurian samples
colorcoded by (a) clay content and (b) TOC content. The MI PSD results suggest that there are
pores that are not accessible by MI technique. (a) Clay content does not show a effect on the MI
spectra amplitude whereas (b) TOC and spectra amplitude show a direct correlation.
Figure 12: Porosity comparison for Niobrara samples. The porosities are measured by (a) WI and
N2, (b) WI and MI, and (c) MI and N2, all colorcoded by total clay content. (a) Comparing N2
and WI samples show that N2 underestimates the porosity for some samples and WI
overestimates the porosity for some samples. (b) WI and MI porosities are comparable within 2
p.u. for low clay content (<10 wt%) samples and WI overestimates the porosity for high clay
samples (>10 wt%). (c) N2 shows higher porosity for high clay content samples and MI shows
higher porosity for low clay samples.
Figure 13: PSD for Niobrara samples using N2 technique, colorcoded by clay content Some of
the spectra (low clay content) show an increasing PSD amplitude which suggest the presence of
pores larger than 200 nm. The other group of spectra (high clay content) shows a dominant pore
size of 80-100 nm.
Figure 14: The PSD measured by MI technique, colorcoded by clay content. The MI PSD data
show two different sets of spectra. One set shows a PSD spectrum with a dominant pore size 80-
100 nm (low clay content) and the other set shows abundance of small pores smaller than 20 nm
(high clay content). The shape of MI spectra for high clay samples indicates the presence of
pores that are not accessible by mercury.
Figure 15: Porosity comparison for Monterey samples. The porosities are measured by (a) MI
and WI, (b) HE and WI, (c) HE and MI, (d) N2 and WI, (e) N2 and MI, and (f) N2 and HE, all
5
colorcoded by total clay content. (a) to (c) WI, MI and HE porosities show comparable values
within 2 p.u. difference. (b) HE and WI show the best correlation. (d) to (f) N2 significantly
underestimates the porosity for high porosity (>5 p.u.) samples. N2 shows comparable values
(within 2 p.u.) for low porosity samples (<5 p.u.). Clay content does not affect the porosity
measurements.
Figure 16: Pore size distribution spectra measured for Monetery samples using N2 technique,
colorcoded by clay content. The N2 pore size amplitude for pores larger than 10 nm varies
significantly and shows no correlation with the clay content. The amplitide for small mesopores
(<10 nm) is small except for one high clay content sample.
Figure 17: Throat size distribution spectra measured for Monetery samples using MI technique
colorcoded by clay content. The MI throat size distributions also show a significant variation in
both amplitude and throat size. For these spectra clay content does not show any correlation with
the spectra and amplituse either.
Figure 18: N2 PSD spectra of Haynesville samples for (a) Group 1, (b) Group 2, (c) Group 3, (d)
Group 4 and (e) Group 5. The samples are grouped based on the PSD spectra shape. The specttra
can be divided in two parts; pores smaller than 10 nm and larger than 10 nm. Feom Group 1 to 4
the amplitude of small pores increases and the amplitude of large pores decreases. Group 5
samples are dolomite rich and behave differently compared to the rest of groups.
Figure 19: Correlation between TOC and clay content for Haynesville samples. The samples can
be divided in five groups based on the TOC and clay content. Clay content cut offs for different
groups are defined as <35 wt%, 35-50 wt%, 50-60 wt% and >60 wt%. Group 5 samples are
dolomite rich samples with more than 30 wt% dolomite content.

6
Figure 20: SEM images of Haynesville samples in Group 1. These samples are TOC rich (> 6
wt%) and show dominant pore size of 20 nm (Figure 18a). As a result of thermal maturation lots
of pores are developed within the organic matter. Qz=Quartz, Cal=Calcite, Ilt=Illite,
OM=Organic Matter.
Figure 21: SEM images of Haynesville samples in Group 2. These samples have slightly lower
TOC and higher clay content compared to Group 1. Although OM-hosted pores are the dominant
pore types, the images demonstrate presence of intercrystalline pores in clay minerals.
Qz=Quartz, Py=Pyrite, Ilt=Illite, Chl=Chlorite, OM=Organic Matter.
Figure 22: SEM images of Haynesville samples in Group 3. These samples have a combination
of organic- and mineral- hosted pores. The N2 PSD results (Figure 18c) also indicates the
presence both intercystalline (< 10 nm) and OM-hosted pores (> 10 nm). As a result of thermal
maturation lots of pores are developed within the organic matter. Qz=Quartz, Ilt=Illite,
OM=Organic Matter.
Figure 23: SEM images of Haynesville samples in Group 4. These samples are clay rich (60-80
wt%) and show abundance of small mesopores (<10 nm) measured by N2 PSD (Figure 18d).
The SEM images show that intercrystalline pores in clay minerals are the dominant pores in
these samples. Qz=Quartz, Ilt=Illite.
Figure 24: SEM images of Haynesville samples in Group 5. These samples are dolomite rich (>
30 wt%) which have very low TOC content (< 1.5 wt%). The space between dolomite grains are
filled with a mixture of clay and quartz particles which host the intercrystalline pores in these
samples. Although the organic content is minimal in this Group, organic-hosted pores are
developed where OM is present. Qz=Quartz, Cal=Calcite, Dol=Dolomite, Py=Pyrite, Ilt=Illite.
7
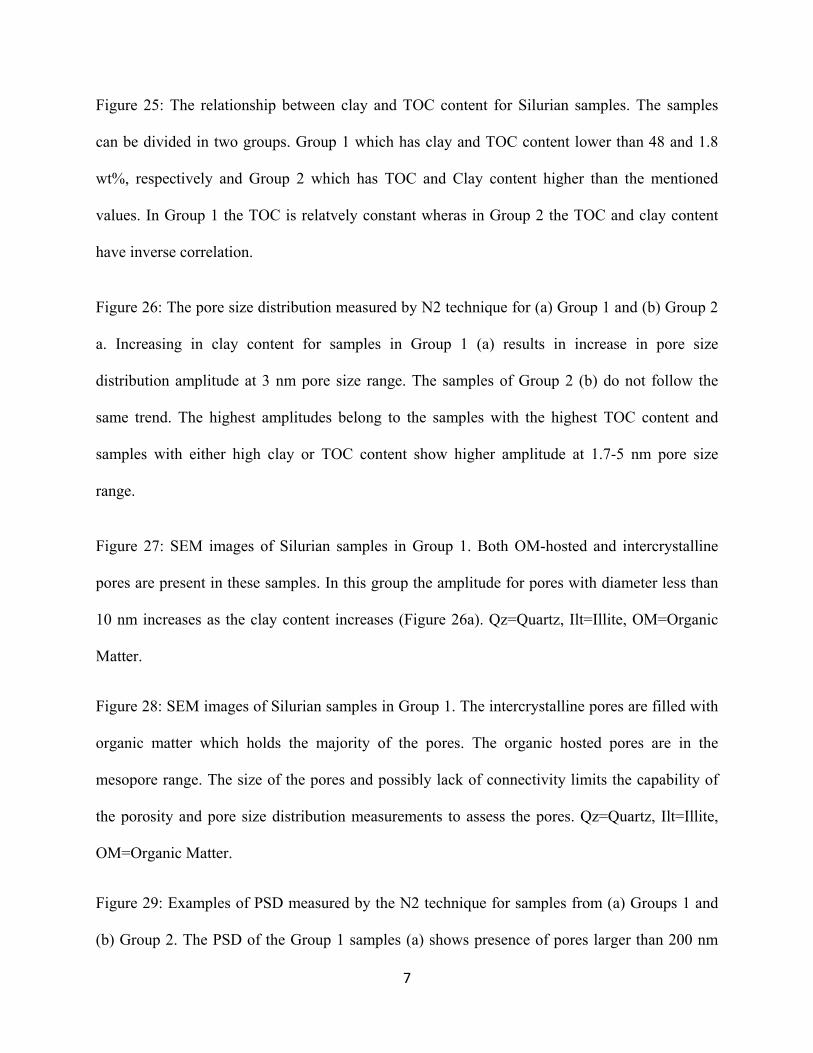
Figure 25: The relationship between clay and TOC content for Silurian samples. The samples
can be divided in two groups. Group 1 which has clay and TOC content lower than 48 and 1.8
wt%, respectively and Group 2 which has TOC and Clay content higher than the mentioned
values. In Group 1 the TOC is relatvely constant wheras in Group 2 the TOC and clay content
have inverse correlation.
Figure 26: The pore size distribution measured by N2 technique for (a) Group 1 and (b) Group 2
a. Increasing in clay content for samples in Group 1 (a) results in increase in pore size
distribution amplitude at 3 nm pore size range. The samples of Group 2 (b) do not follow the
same trend. The highest amplitudes belong to the samples with the highest TOC content and
samples with either high clay or TOC content show higher amplitude at 1.7-5 nm pore size
range.
Figure 27: SEM images of Silurian samples in Group 1. Both OM-hosted and intercrystalline
pores are present in these samples. In this group the amplitude for pores with diameter less than
10 nm increases as the clay content increases (Figure 26a). Qz=Quartz, Ilt=Illite, OM=Organic
Matter.
Figure 28: SEM images of Silurian samples in Group 1. The intercrystalline pores are filled with
organic matter which holds the majority of the pores. The organic hosted pores are in the
mesopore range. The size of the pores and possibly lack of connectivity limits the capability of
the porosity and pore size distribution measurements to assess the pores. Qz=Quartz, Ilt=Illite,
OM=Organic Matter.
Figure 29: Examples of PSD measured by the N2 technique for samples from (a) Groups 1 and
(b) Group 2. The PSD of the Group 1 samples (a) shows presence of pores larger than 200 nm
8
that were not assessed by the N2 technique. The PSD of the majority of Group 2 samples (b)
shows that the dominant pore size lies around 100 nm.
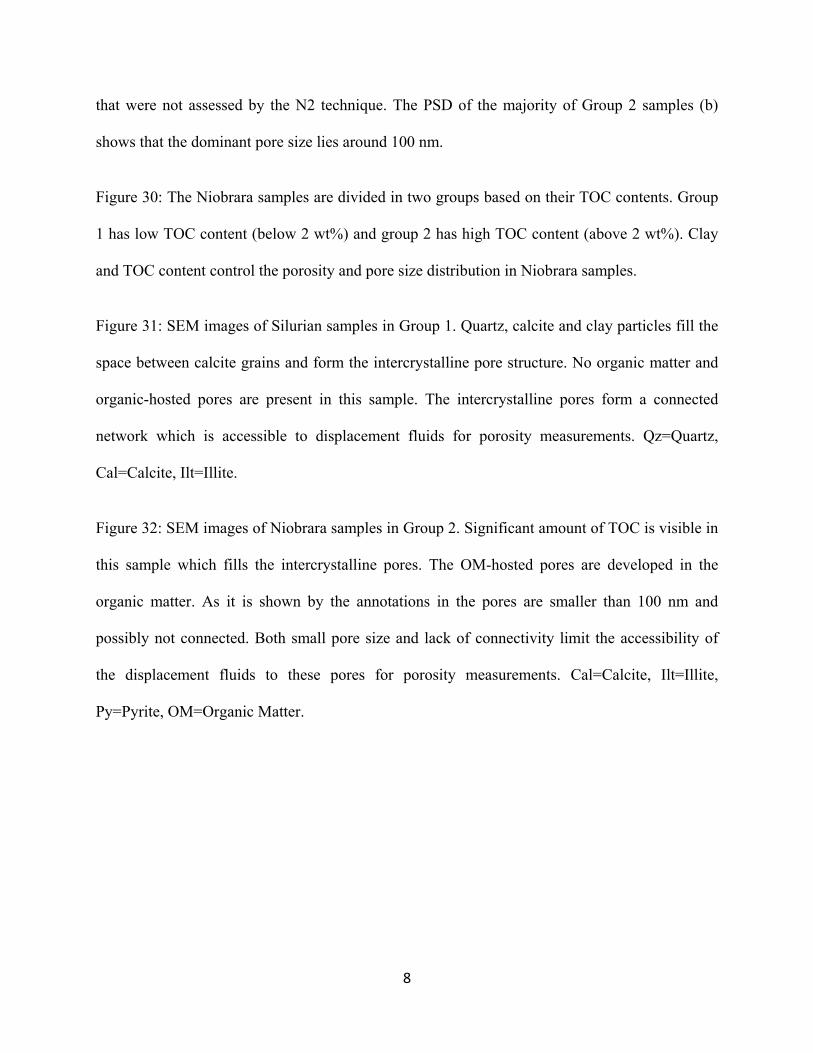
Figure 30: The Niobrara samples are divided in two groups based on their TOC contents. Group
1 has low TOC content (below 2 wt%) and group 2 has high TOC content (above 2 wt%). Clay
and TOC content control the porosity and pore size distribution in Niobrara samples.
Figure 31: SEM images of Silurian samples in Group 1. Quartz, calcite and clay particles fill the
space between calcite grains and form the intercrystalline pore structure. No organic matter and
organic-hosted pores are present in this sample. The intercrystalline pores form a connected
network which is accessible to displacement fluids for porosity measurements. Qz=Quartz,
Cal=Calcite, Ilt=Illite.
Figure 32: SEM images of Niobrara samples in Group 2. Significant amount of TOC is visible in
this sample which fills the intercrystalline pores. The OM-hosted pores are developed in the
organic matter. As it is shown by the annotations in the pores are smaller than 100 nm and
possibly not connected. Both small pore size and lack of connectivity limit the accessibility of
the displacement fluids to these pores for porosity measurements. Cal=Calcite, Ilt=Illite,
Py=Pyrite, OM=Organic Matter.

9
Figure 33: Pore size distribution spectra measured for Monetery samples using N2 technique for
(a) Group 1 and (b) Group 2. Since samples in Group 1 (a) show more comparable N2 porosty
values when compared with HE and MI techniques we can consider the spectra in (a) a suitable
representation of pore size distribution for these samples. N2 measures a highly underestimated
porosity for Group 2 samples, so N2 spectra (b) does not represent the whole pore space.
Figure 34: SEM images of Monterey samples in Group 1. These samples have intercrystalline
pores in clay phase and interacrystalline pores within the quartz and calcite grains which are
exposed due to polishing. The intercrystalline space is filled with organic matter which holds
very low OM-hosted porosity. Qz= Quartz, Cal=Calcite, Dol=Dolomite, Ilt=Illite, Py=Pyrite.
Figure 35: SEM images of Monterey samples in Group 2. These samples show larger
intercrystalline pores compared to Group 1 samples. The pores are developed in the space
between quartz grains. Qz= Quartz, Ilt=Illite, OM=Organic Matter.
Figure 36: The throat size distribution measured by MI technique for (a) Group 1 colorcoded by
caly and (b) Group 2 colorcoded by TOC. (a) The MI spectra for Group 1 samples do not
demonstrate the same clay content dependency as N2 spectra for these samples (Figure 26a). (b)
On the other hand MI spectra amplitude of Group 2 samples increases with increasing TOC,
similar to N2 PSD (Figure 26b).
Figure 37: Throat size distributions assessed by MI technique for samples in (a) Group 1 and (b)
Group 2, colorcoded by clay content. (a) For Group 1 samples mercury successfully assessed the
pores which were not accessible by N2 (Figure 29a). (b) On the other hand for samples in Group
2 mercury did not reach the small pores hosted by the organic matter, these pores were assessed
by N2 (Figure 29b).

10
Figure 38: Throat size distribution spectra measured for Monetery samples using MI technique
for (a) Group 1 and (b) Group 2. The dominant throat size distributions for Monterey samples
vary significantly from less than 20 nm for Group 1 (a) and more than 200 nm for Group 2
samples (b).

1
(a) (b)
(c) (d)
Figure 1
(a) (b)
Figure 2

2
(a) (b)
Figure 3
(a) (b)
Figure 4
3
(a) (b)
Figure 5
(a) (b) (c)
(d) (e)
Figure 6
4
(a) (b)
Figure 7
Figure 8

5
(a) (b) (c)
(d) (e)
Figure 9
(a) (b) Figure 10

6
(a) (b) Figure 11
(a) (b) (c)
Figure 12
7
Figure 13
Figure 14
(a) (b) (c)

8
(d) (e) (f)
Figure 15
Figure 16
Figure 17

9
(a) (b) (c)
(d) (e)
Figure 18
Figure 19

10
(a) (b)
Figure 20
(a) (b)
Figure 21
(a) (b)
Figure 22

11
(a) (b)
Figure 23
(a) (b)
Figure 24

12
Figure 25
(a) (b) Figure 26

13
(a) (b)
Figure 27
(a) (b)
Figure 28

14
(a) (b)
Figure 29
Figure 30

15
(a) (b)
Figure 31
(a) (b)
Figure 32

16
(a) (b) Figure 33
(a) (b)
Figure 34
Figure 35

17
(a) (b)
Figure 36
(a) (b)
Figure 37

18
(a) (b)
Figure 38

Table 1. Summary of measurement techniques and number of samples measured. Method Haynesville Monterey Niobrara Silurian
GRI 23 NA NA 9 Helium Injection (HE) NA 11 NA NA Water Immersion (WI) 34 12 18 21 Mercury Intrusion (MI) 13 12 10 22 Nitrogen Adsorption (N2) 22 12 22 19
Table 2. Summary of the disadvantages of each measurement technique and the resulting effect on porosity measurements. Methods Disadvantage Effect on Porosity Measurement
GRI - Hot solvent extraction removes soluble bitumen
- Creates artificial porosity and causes overestimation
- Causes higher grain volume and porosity underestimation
Water Immersion
- Clay minerals can swell with water
- Water might not fill organic-hosted pores and these pores might be hydrophobic
- Porosity overestimation in smectite rich samples
- Partial saturation of organic-hosted pores and porosity underestimation
Mercury Intrusion
- Does not measure pores associated with throat smaller than 3.6 nm
- Clay tactoid pores are missed
- Misses pores with throat smaller than 3.6 nm and causes porosity underestimation
- Causes porosity underestimation in clay-rich samples
Nitrogen Adsorption
- Does not measure pore bodies larger than 200 nm
- Gas might get sorbed in certain minerals or organic matter
- Misses pore bodies larger than 200 nm and causes porosity underestimation
View publication statsView publication stats