Embed Size (px)
Citation preview
Distribution Changes of Small Fishes
in Streams of Missouri
from the 1940s to the 1990s
by MATTHEW R. WINSTON
Missouri Department of Conservation, Columbia, MO 65201
February 2003

2
CONTENTS Page
Abstract……………………………………………………………………………….. 8
Introduction…………………………………………………………………………… 10
Methods……………………………………………………………………………….. 17
The Data Used………………………………………………………………… 17
General Patterns in Species Change…………………………………………... 23
Conservation Status of Species……………………………………………….. 26
Results………………………………………………………………………………… 34
General Patterns in Species Change………………………………………….. 30
Conservation Status of Species……………………………………………….. 46
Discussion…………………………………………………………………………….. 63
General Patterns in Species Change………………………………………….. 53
Conservation Status of Species………………………………………………. 63
Acknowledgments……………………………………………………………………. 66
Literature Cited……………………………………………………………………….. 66
Appendix……………………………………………………………………………… 72
FIGURES
1. Distribution of samples by principal investigator…………………………. 20
2. Areas of greatest average decline…………………………………………. 33
3. Areas of greatest average expansion………………………………………. 34
4. The relationship between number of basins and ……………………….. 39
5. The distribution of for each reproductive group………………………... 40

3
6. The distribution of for each family……………………………………… 41
7. The distribution of for each trophic group……………...………………. 42
8. The distribution of for each faunal region………………………………. 43
9. The distribution of for each stream type………………………………… 44
10. The distribution of for each range edge…………………………………. 45
11. Modified IUCN categories versus existing state rank…………………… 52
12. Time path of samples made by Harry……………………………………. 55
13. Water level differences before and during the two sample periods……… 56
TABLES
1. Species analyzed in this paper……………………………………………. 11
2. The IUCN and modified criteria for critically endangered,
endangered, and vulnerable………………………………………………. 26
3. Change in species occurrence, 1940s versus 1990s………………………. 30
4. Species showing regional decline………………………………………… 36
5. Species showing regional expansion……………………………………... 37
6. Extinction correlates and sample adequacy………………………………. 46
7. Abundance of Ozark species in 1990s samples where they
showed expansion into the southern and western plains…………………. 57
APPENDIX TABLES
1. Species traits used in this analysis………………………………………… 72

4
APPENDIX FIGURES (in alphabetical order)
1. Arkansas River orangethroat darter……………...………………………... 75
2. Banded darter…………………………………………………………….... 76
3. Banded sculpin…………………………………………………………….. 77
4. Bigeye chub……………………………………………………………… 78
5. Bigeye shiner…………………………………………………………….. 79
6. Bigmouth shiner……………………….…………………………………. 80
7. Blacknose shiner…………………………………………………………… 81
8. Blackside darter……………………………………………………………. 82
9. Blackspotted topminnow………………………………………………… 83
10. Blackstripe topminnow…………………………………………………….. 84
11. Blacktail shiner…………………………………………………………... 85
12. Bleeding shiner…………………………………………………………….. 86
13. Bluegill…………………………………………………………………… 87
14. Bluestripe darter…………………………………………………................. 88
15. Bluntface shiner……………………………………………………………. 89
16. Bluntnose darter………………………………………………………….. 90
17. Bluntnose minnow……………………………………………….………. 91
18. Brook silverside………………………………………………………….. 92
19. Bullhead minnow…………………………………………………………. 93
20. Cardinal shiner…………………………………………………………… 94
21. Central stoneroller………………………………………………………… 95
22. Common shiner……………………………………………………………. 96

5
23. Creek chub…………………………………………………………………. 97
24. Creek chubsucker………………………………………………………….. 98
25. Duskystripe shiner…………………………………………………………. 99
26. Eastern redfin shiner………………………………………………………. 100
27. Emerald shiner…………………………………………………………… 101
28. Fathead minnow……………………………………………………………. 102
29. Freckled madtom………………………………………………………… 103
30. Ghost shiner……………………………………………………………… 104
31. Gilt darter………………………………………………………………… 105
32. Golden shiner…………………………………………………………….. 106
33. Gravel chub………………………………………………………………. 107
34. Greenside darter……………………………………………….................. 108
35. Green sunfish……………………………………………………………... 109
36. Hornyhead chub……………………………………………….................. 110
37. Johnny darter……………………………………………………………... 111
38. Largescale stoneroller…………………………………………………….. 112
39. Longear sunfish…………………………………………………………… 113
40. Meramec River saddled darter……………………………………………. 114
41. Mimic shiner……………………………………………………………… 115
42. Mississippi silvery minnow………………………………………………. 116
43. Missouri saddled darter…………………………………………………… 117
44. Mottled/Ozark sculpin………………………………………..................... 118
45. Northern logperch…………………………………………………………. 119

6
46. Northern orangethroat darter………………………………………………..120
47. Northern studfish………………………………………………………… 121
48. Ohio logperch…………………………………………………….................122
49. Orangespotted sunfish……………………………………………………… 123
50. Ozark chub……………………………………………………………….. 124
51. Ozark logperch…………………………………………………………… 125
52. Ozark madtom……………………………………………………………… 126
53. Ozark minnow………………………………………………….................... 127
54. Ozark shiner……………………………………………………………… 128
55. Pallid shiner……………………………………………………………… 129
56. Peppered chub……………………………………………………………… 130
57. Plains minnow……………………………………………………………. 131
58. Plains topminnow………………………………………………………… 132
59. Pugnose minnow…………………………………………………………… 133
60. Rainbow darter…………………………………………………………… 134
61. Red shiner………………………………………………………………… 135
62. Redspot chub…………………………………………………….................. 136
63. Redspotted sunfish…………………………………………………………. 137
64. Ribbon shiner……………………….…………………………………….. 138
65. Rosyface shiner…………………………………………………………….. 139
66. Sand shiner…………………………………………………………………. 140
67. Silver chub…………………………………………………………………. 141
68. Slenderhead darter…………………………………………………………. 142
7
69. Slender madtom……………………………………………………………. 143
70. Slough darter…………………………………………………….................. 144
71. Southern redbelly dace…………………………………………………… 145
72. Speckled darter…………………………………………………………… 146
73. Spotfin shiner…………………………………………………………….. 147
74. Steelcolor shiner…………………………………………………………….148
75. Stippled darter……………………………………………………………. 149
76. Stonecat…………………………………………………………………… 150
77. Striped fantail darter……………………………………………………… 151
78. Striped shiner…………………………………………………………….. 152
79. Suckermouth minnow…………………………………………................. 153
80. Tadpole madtom…………………………………………………………. 154
81. Telescope shiner………………………………………………………….. 155
82. Topeka shiner…………………………………………………………….. 156
83. Trout-perch……………………………………………………................. 157
84. Warmouth………………………………………………………………… 158
85. Wedgespot shiner………………………………………………………… 159
86. Weed shiner………………………………………………………………. 160
87. Western mosquitofish…………………………………………………….. 161
88. Western redfin shiner……………………………………………………... 162
89. White River orangethroat darter……………………………….................. 163
90. Whitetail shiner…………………………………………………………… 164
91. Yoke darter………………………………….…………………................. 165

8
ABSTRACT
One of the strategic goals of the Missouri Department of Conservation is to
preserve and restore the state’s biodiversity including the 232 fish species and subspecies
in Missouri. Meeting this goal requires knowledge of changes in distribution and habitat
of each species. I compared data from fish community samples made with seines
throughout most of the state between 1938 and 1941 with samples made similarly
between 1986 and 2001. My first objective was to investigate whether species
distributions in Missouri had changed, where the most change occurred, and what species
traits were associated with change. My second objective was to apply the International
Union for the Conservation of Species (IUCN) criteria to each species to assess
probability of extirpation in the state. My methods were based on five measures. For each
species, I assessed change in distribution over time. In the reaches where a species was
known to occur in the 1990s, I assessed total length of the reaches, the proportion of
samples with the species, isolation of reaches, and an index of population size in isolated
reaches. Of the 91 species with large enough sample sizes for analysis, four showed no
change in distribution over time, 49 declined, and 38 expanded. Decline was greatest in
the northern Ozarks; expansion was greatest in the western and southern plains. Over half
of the species that showed decline in the Ozarks were plains species, and over half of the
species that expanded into the plains were Ozark species. Out of 32 species’ traits tested,
seven were associated with decline: membership in the family Cyprinidae (minnows),
species characteristic of large Ozark rivers, large plains rivers, small plains rivers, plains
headwaters, clear lowland ditches, and species with the northwestern edge of their range
in Missouri. Membership in the family Cyprinidae was by far the most important trait

9
associated with decline. Over 96% of the species that declined were associated with at
least one of these seven trait categories. Expansion was associated with species
characteristic of small Ozark rivers, Ozark creeks, and lowland standing waters, but these
were not strong relationships. I discuss nine alternative explanations for the general
patterns I found: sampling bias, grazing in riparian forests, plowing of soils for row-crop
agriculture, predation, range size, climate change, Missouri River modifications, drought,
and channel downcutting. Four species met the IUCN criteria for highly endangered,
eight species met the criteria for endangered, and eight species met the criteria for
vulnerable. Agreement between the IUCN categories and the existing state ranks was
fairly strong; however, the IUCN categories encompassed only the most endangered
ranks of the state list. Three unlisted species, Arkansas saddled darter (Etheostoma
euzonum euzonum), Current River saddled darter (E. e. erizonum), and weed shiner
(Notropis texanus), met the IUCN criteria and should be added to the Missouri species of
conservation concern checklist. IUCN policy states that species not be downlisted until
another survey at least five years later corroborates the earlier downlisting
recommendation. Periodic community samples are the most cost-effective way to
monitor fish species distributions in Missouri. As shown in this analysis, community
samples can provide insight into general distribution changes and provide information to
assess conservation status.

10
INTRODUCTION
As of 2002 there were 200 native and 12 introduced species of fishes that
reproduce in Missouri waters. If one includes the well-defined forms that have been
described for some species (such as the cave-inhabiting form of the banded sculpin
Cottus carolinae), species that migrate into Missouri (such as the bull shark Carcharinus
leucas), and the one species extirpated from the state (the pallid shiner Notropis amnis), a
total of 230 species or easily recognizable forms make up the Missouri fish fauna.
The most efficient way to monitor the fish species of Missouri is to make
community samples. A community is defined as all organisms that can potentially
interact (i.e., eating each other, competing for habitat, etc.). So a community includes the
fishes as well as all the other organisms in and around a section of stream. A community
sample is a sample of organisms from the community made with a particular sample gear.
Community samples are efficient because one gear often samples many species so
information is gained on multiple species. However, because all sample gears are
selective, most community samples include only a small part of the entire community.
This study includes only those species that are efficiently caught, as adults, with
small seines. This includes small stream fishes and excludes large fish species (those
reaching maximum lengths of 12 inches or more), cave species, obligate big river species
(too deep to seine), and lampreys (can be seined only in early spring). Although
crayfishes and the glass shrimp (Palaemonetes kadiakensis) are also efficiently caught
with seines, they were not included in this analysis because data on these species was not
consistently collected. Most small stream fishes of Missouri are described in Pflieger
(1997). Taxonomic changes that have occurred since 1997 include the splitting off of the

11
brook darter (Etheostoma burri) and current darter (E. uniporum) from the orangethroat
darter (E. spectabile; Ceas and Page 1997), the splitting of the Missouri saddled darter (E.
tetrazonum) into two species (Switzer and Wood 2002), and the renaming of the speckled
chub (Macrhybopsis aestivalis) to the peppered chub (M. tetranema; Eisenhour 1999).
For the central stoneroller, I use the binomial Campostoma anomalum (Robins et al.
1991) rather than C. pullum as used in Pflieger (1997). This makes 143 species or forms
(called species from here on) that are included in this study (Table 1).
Table 1. Species analyzed in this paper. Common name Scientific name Alabama shad Alosa alabamae Arkansas darter Etheostoma cragini Arkansas River orangethroat darter Etheostoma spectabile squamosum Arkansas saddled darter Etheostoma euzonum euzonum Banded pigmy sunfish Elassoma zonatum Banded sculpin Cottus carolinae Bantam sunfish Lepomis symmetricus Barred fantail darter Etheostoma flabellare flabellare Banded darter Etheostoma zonale Bigeye chub Notropis amblops Bigeye shiner Notropis boops Bigmouth shiner Notropis dorsalis Blacknose shiner Notropis heterolepis Blackside darter Percina maculata Blackspotted topminnow Fundulus olivaceus Blackstripe topminnow Fundulus notatus Blacktail shiner Cyprinella venusta Bleeding shiner Luxilus zonatus Bluegill Lepomis macrochirus Bluestripe darter Percina cymatotaenia Bluntface shiner Cyprinella camura Bluntnose darter Etheostoma chlorosomum Bluntnose minnow Pimephales notatus Brassy minnow Hybognathus hankinsoni Brindled madtom Noturus miurus Brook darter Etheostoma burri Brook silverside Labidesthes sicculus Bullhead minnow Pimephales vigilax

12
Table 1 (continued). Species analyzed in this paper. Common name Scientific name Cardinal shiner Luxilus cardinalis Central mudminnow Umbra limi Central stoneroller Campostoma anomalum Channel darter Percina copelandi Checkered madtom Noturus flavater Common shiner Luxilus cornutus Creek chub Semotilus atromaculatus Creek chubsucker Erimyzon oblongus Crystal darter Crystallaria asprella Current darter Etheostoma uniporum Current River saddled darter Etheostoma euzonum erizonum Cypress darter Etheostoma proleiare Cypress minnow Hybognathus hayi Dollar sunfish Lepomis marginatus Dusky darter Percina sciera Duskystripe shiner Luxilus pilsbryi Eastern redfin shiner Lythrurus umbratilis cyanocephalus Eastern slim minnow Pimephales tenellus parviceps Emerald shiner Notropis atherinoides Fathead minnow Pimephales promelas Flier Centrarchus macropterus Freckled madtom Noturus nocturnus Ghost shiner Notropis buchanani Gilt darter Percina evides Golden shiner Notemigonus crysoleucas Golden topminnow Fundulus chrysotus Goldstripe darter Etheostoma parvipinne Gravel chub Erimystax x-punctatus Green sunfish Lepomis cyanellus Greenside darter Etheostoma blennioides Harlequin darter Etheostoma histrio Hornyhead chub Nocomis biguttatus Ironcolor shiner Notropis chalybaeus Johnny darter Etheostoma nigrum Lake chubsucker Erimyzon sucetta Largescale stoneroller Campostoma oligolepis Least darter Etheostoma microperca Longear sunfish Lepomis megalotis Longnose darter Percina nasuta Meramec River saddled darter Etheostoma tetrazonum Mimic shiner Notropis volucellus Mississippi silvery minnow Hybognathus nuchalis Missouri saddled darter Etheostoma tetrazonum Mottled sculpin Cottus bairdi*
13
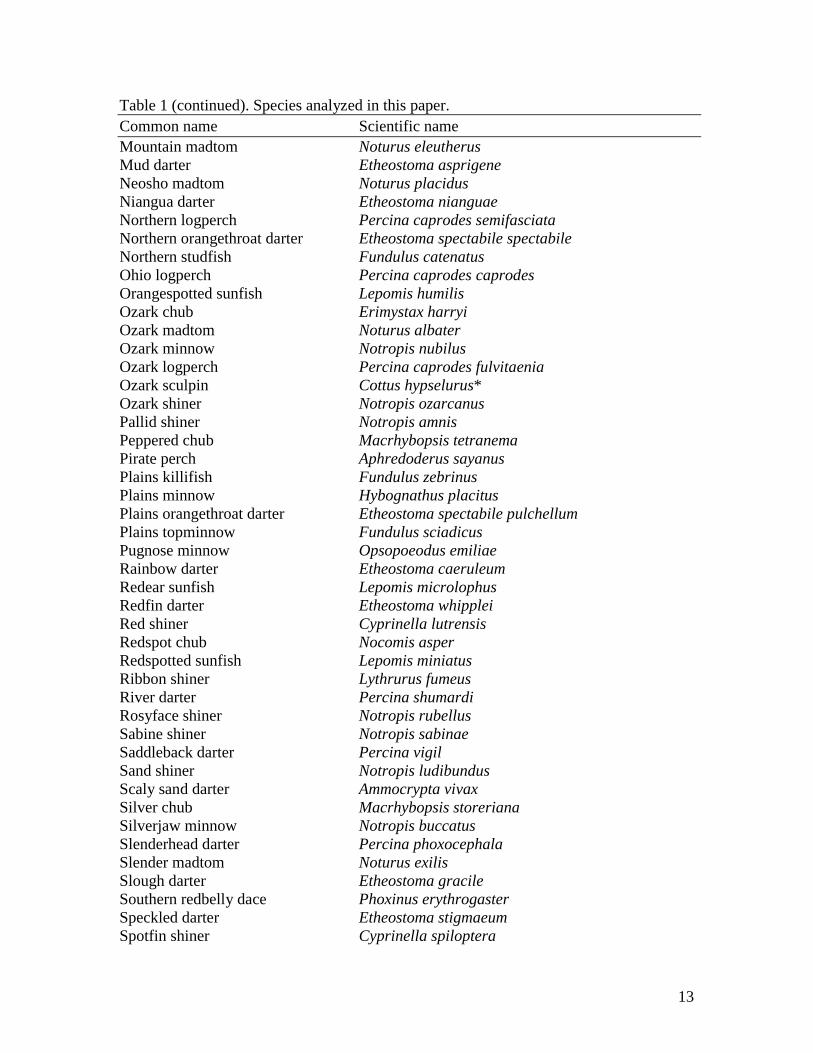
Table 1 (continued). Species analyzed in this paper. Common name Scientific name Mountain madtom Noturus eleutherus Mud darter Etheostoma asprigene Neosho madtom Noturus placidus Niangua darter Etheostoma nianguae Northern logperch Percina caprodes semifasciata Northern orangethroat darter Etheostoma spectabile spectabile Northern studfish Fundulus catenatus Ohio logperch Percina caprodes caprodes Orangespotted sunfish Lepomis humilis Ozark chub Erimystax harryi Ozark madtom Noturus albater Ozark minnow Notropis nubilus Ozark logperch Percina caprodes fulvitaenia Ozark sculpin Cottus hypselurus* Ozark shiner Notropis ozarcanus Pallid shiner Notropis amnis Peppered chub Macrhybopsis tetranema Pirate perch Aphredoderus sayanus Plains killifish Fundulus zebrinus Plains minnow Hybognathus placitus Plains orangethroat darter Etheostoma spectabile pulchellum Plains topminnow Fundulus sciadicus Pugnose minnow Opsopoeodus emiliae Rainbow darter Etheostoma caeruleum Redear sunfish Lepomis microlophus Redfin darter Etheostoma whipplei Red shiner Cyprinella lutrensis Redspot chub Nocomis asper Redspotted sunfish Lepomis miniatus Ribbon shiner Lythrurus fumeus River darter Percina shumardi Rosyface shiner Notropis rubellus Sabine shiner Notropis sabinae Saddleback darter Percina vigil Sand shiner Notropis ludibundus Scaly sand darter Ammocrypta vivax Silver chub Macrhybopsis storeriana Silverjaw minnow Notropis buccatus Slenderhead darter Percina phoxocephala Slender madtom Noturus exilis Slough darter Etheostoma gracile Southern redbelly dace Phoxinus erythrogaster Speckled darter Etheostoma stigmaeum Spotfin shiner Cyprinella spiloptera

14
Table 1 (continued). Species analyzed in this paper. Common name Scientific name Spring cavefish Forbesichthys agassizi Stargazing darter Percina uranidea Starhead topminnow Fundulus dispar Steelcolor shiner Cyprinella whipplei Stippled darter Etheostoma punctulatum Stonecat Noturus flavus Striped fantail darter Etheostoma flabellare lineolatum Striped shiner Luxilus chrysocephalus Suckermouth minnow Phenacobius mirabilis Swamp darter Etheostoma fusiforme Tadpole madtom Noturus gyrinus Taillight shiner Notropis maculatus Telescope shiner Notropis telescopus Topeka shiner Notropis topeka Trout-perch Percopsis omiscomaycus Warmouth Lepomis gulosus Wedgespot shiner Notropis greenei Weed shiner Notropis texanus Western mosquitofish Gambusia affinis Western redfin shiner Lythrurus umbratilis umbratilis Western sand darter Ammocrypta clara Western silvery minnow Hybognathus argyritis Western slim minnow Pimephales tenellus tenellus Whitetail shiner Cyprinella galactura White River fantail darter Etheostoma flabellare White River orangethroat darter Etheostoma spectabile Yoke darter Etheostoma juliae ------------------------------------------------------------------------------------------------------------ *Cottus hypselurus was combined with C. bairdi.
In this study, I used community samples made statewide in two time periods,
1938-1941 (the 1940s) and 1986-2001 (the 1990s). From these data, I calculated the
change in distribution over time for each species. I then asked two questions: Where in
the state has change occurred most intensively? What types of species (e.g., minnow
species, Ozark species) have changed? This information can help generate hypotheses on
what has caused the change. It can also provide surrogate data for rare species. It is
difficult to obtain good data on rare species precisely because they are rare. However, if a

15
rare species happens to be a minnow species, for example, and if most common minnow
species have declined, then one can conclude that the rare species is likely to have
declined as well.
Community samples can also provide estimates of each species’ probability of
extinction, which is the basic measure for species conservation. The International Union
for the Conservation of Nature (IUCN) has developed criteria to estimate the probability
of extinction for a species (Mace and Lande 1991; Mace 1994; www.iucn.org/themes/ssc/
redlists/ssc-rl-c.htm). Six basic measures are used to estimate probability of extinction:
abundance, rate of reduction in abundance over time, fluctuation in abundance over time,
area of occurrence, number of subpopulations, and fragmentation of subpopulations.
These basic measures are often costly to obtain. They are usually only estimated for
species listed under the U.S. Endangered Species Act or for economically valuable
species, but they are correlated with other measures that can be derived from inexpensive
community samples. Abundance is correlated with proportion of sites occupied (Gaston
1996; Hanski and Gyllenberg 1997; Johnson 1998). The same correlation can be used for
the rate of reduction in abundance over time and fluctuation in abundance over time. For
area of occurrence, IUCN recommends using the area of a convex polygon around known
occurrences. From community samples, we know the stream reaches where a species is
found. From this, the length of stream can be calculated. Because streams are almost
linear features, this should be highly correlated with the area of the stream. For number of
subpopulations, the number of reaches in which a species occurs can be used. A reach
can be defined as a length of stream bounded by changes in stream order. By this
definition, each reach is a well-defined landscape unit that is internally homogenous

16
compared to other reaches, and each reach will be connected to other reaches at (usually)
no more than two points. The distribution of the federally listed tan riffleshell mussel
(Epioblasma florentina walkeri) provides a vivid example of the importance of this
definition of reach (Shaffer and Stein 2000). In 1998, the only two populations of this
species in the world existed in the Clinch River, Virginia, and Indian Creek, a small
tributary to the Clinch River. A toxic spill completely killed off the population in the
Clinch River, leaving only the one population in Indian Creek. Although the toxic spill
flowed past the mouth of Indian Creek, it did not affect the mussels upstream of the
mouth in Indian Creek. Lastly, isolation of subpopulations can be estimated by looking
for reaches in which a species occurs separated by reaches in which the species does not
occur (e.g., Echelle et al. 1975).
The IUCN criteria are structured as thresholds. If a species meets certain criteria,
it is listed as critically endangered, endangered, or threatened. The criteria are based on
the six measures of probability of extinction. A threshold can either be an individual
measure (e.g., “Population estimated to number less than 50 mature individuals”) or it
can be a combination of measures (e.g., “Population estimated to number less than 250
mature individuals and an estimated continuing decline of at least 25% within 3 years”).
Likewise, variables derived from community samples can be used to construct these
thresholds.
The state of Missouri has a list of species of conservation concern (Missouri
Natural Heritage Program 2003). One of the functions of this list is to draw attention to
species which are in danger of being extirpated from the state or, in the case of state
endemics, which are in danger of complete extinction. Also, the state status “endangered”

17
provides a small amount of protection by law. The list should be regularly updated with
the best data available. The IUCN thresholds are objective criteria for making listing
evaluations.
I had two primary objectives for this study. My first primary objective was to look
for general patterns in the change of species distributions over time. I looked for spatial
patterns in the overall decline or expansion in the range of species within the state of
Missouri. I asked: Do particular regions within the state show greater change compared to
other regions? I then correlated general species traits with expansion and decline of
species. I asked: What types of species changed in distribution? Although pinpointing the
causes of decline or expansion of species was beyond the scope of this study, I used
general patterns to generate hypotheses of why species have changed.
My second primary objective concerned individual species. I used modified
IUCN criteria to evaluate each species’ probability of extinction. I compared the present
rank of species listed in the Missouri Species of Conservation Concern Checklist with the
ranks calculated using the modified IUCN criteria. Corollary to this, I evaluated the
number and distribution of samples within the range of each species. The goal for
establishing baseline data for future evaluations should be an adequate number of
samples evenly distributed throughout the range of each species.
METHODS
The Data Used
The Missouri Department of Conservation (MDC) maintains a database of fish
community samples made in the state since 1929. Copies of field and laboratory data
18
sheets are also on file. The data are highly heterogeneous and unstandardized, as would
be expected. My first task was to select the data to be used for the analysis.
In 1940 and 1941, George V. Harry, a graduate student under Carl Hubbs at the
University of Michigan, made 345 community samples in the state. He used a 25-ft bag
seine, a 20-ft seine, and a 6-ft seine. He recorded locality and species caught for all
samples. He recorded effort, in terms of total time spent sampling, for 288 of the samples.
He did not record number of specimens caught. I assumed that total time spent sampling
was the time from when the first seine haul was begun to when the last seine haul was
finished. He sampled throughout the state except in the Eleven Point, Current, Black, St.
Francis, Castor, and Whitewater river systems.
Harry made 23 samples in reaches that would be inundated in the future by
reservoirs. I did not include these samples in the analysis for several reasons. First,
although most of the species that occurred in those reaches are probably now gone, I
could not say for certain which ones were gone. There is some evidence that even state-
listed Ozark endemics such as the checkered madtom and the longnose darter may be
able to live in reservoirs. No systematic research has been done in Missouri on this
question. Second, for those that are gone, the cause of their extirpation is obvious. It
requires little analysis. The effects of reservoirs have been known for a long time and
certainly have been accounted for in past conservation evaluations. Third, there is little
chance that the habitats will be restored to an uninundated state at any time in the
medium-term future. Fourth, reservoirs affect so many species that if I included Harry’s
samples in the analysis and assumed that all small species have disappeared from
inundated reaches, almost every species would show strong decline, obscuring other

19
possible patterns.
Harry also made nine samples in the Missouri and Mississippi Rivers. I did not
include Missouri River or Mississippi River samples in the analysis because seines are
inefficient even for small species in these systems.
At the same time as Harry was sampling, two biologists sampled the systems that
Harry skipped. Carl B. Obrecht made 49 samples in the Eleven Point and Current river
systems, and Aden C. Baumann made 71 samples in the Black, St. Francis, Castor, and
Whitewater river systems. They used seines of unknown size and recorded locality and
species caught, but did not make any record of effort such as total time spent sampling or
number of specimens caught.
Although MDC has records of 246 other samples made in Missouri before 1947,
only 19 have effort recorded. Most of these samples were made by Hugh Denny in 1938
and were concentrated in the middle reaches of the main channels of the Eleven Point and
Current Rivers. He used seines of unknown size. He recorded the total number of
individuals of each species he caught but did not record total time spent sampling.
For this analysis, I used all of Harry’s samples (except those inundated by
reservoirs and in the big rivers), eight of Denny’s samples, and three others for a total of
269 samples (Figure 1). I decided not to use Obrecht’s or Baumann’s samples because
effort was not recorded. This left a large area of the southeastern Ozarks without samples.
So, this analysis is statewide except for the Black, St. Francis, Castor, and Whitewater
river systems, and parts of the Eleven Point and Current river systems (Figure 1).
I paired each past sample with a present sample that was nearby (in the same
location, if possible), of similar stream order, and of similar total time spent sampling or

20
total number of individuals. I had 2029 community samples made in the state from 1986
to 2001 from which to choose. Paired t-tests on total time spent sampling and total
number of specimens caught were not significant (P > 0.10). I repeated the tests for the
samples within the range of each species. Some species showed significant differences (P
< 0.05), so I substituted other samples from the 1990s until there was no significant
difference. Of the 269 present samples chosen, 96 were made by Sue A. Bruenderman, 62
by William L. Pflieger, and the remaining 111 samples made by 17 other MDC biologists
(Figure 1). Eighteen samples were made from 1986 to 1989, 75 from 1990 to 1992, 120
from 1993 to 1996, and 56 from 1997 to 2001. Gear used was seines; 80% of the samples
were taken using 15-ft by 6-ft and 6-ft by 4-ft seines; the rest used 25-ft bag, 15-ft, and 6-
ft seines. From here on, I refer to the 269 earlier samples as 1940s samples and the 269

21
later samples as 1990s samples. All samples were made at one location on one date, i.e.,
no samples were made up of more than one sample pooled from different dates or
different locations.
Because a longer seine was used for the 1940s samples, I expected that more large
fish were caught in the 1940s. Although large fish pass through a small fish stage during
development that would be vulnerable to capture by both 15-ft and 25-ft seines, size
classes were not differentiated in the data. So in order to avoid introducing bias into the
analysis, I omitted large species from the analysis. I defined large species as those with
maximum length greater than 12 inches.
The IUCN criteria are based on adult individuals. However, there was no
differentiation between adult and immature fish in either the 1940s or 1990s samples.
Because the modified IUCN criteria used in this analysis are based on presence/absence,
this inconsistency should not invalidate the analysis.
For the purposes of analysis, I combined data for the mottled sculpin and Ozark
sculpin because there seemed to be confusion in identification of the two species.
Although the Alabama shad reaches a maximum length greater than 12 inches, I included
it in the analysis because adults are almost never caught with small seines, and the young-
of-year are present in streams and are vulnerable to seines throughout the warm months.
I defined the range of a species as all the reaches in Missouri where the species
had ever been collected as found in the MDC Fish Community Database (consisting of
5,182 samples in October 2002). The less common a species was, the more likely it was
that all reaches where it occurred would have been sampled, because less common
species have been surveyed more intensively.

22
I wanted to be sure that the samples used in this analysis were dispersed evenly or
randomly within the range of each species rather than being clumped in one part of the
range. I used a runs test (Sokal and Rohlf 1981) to check if the sampled reaches were
clumped within all the reaches that make up the range of a species. All reaches in
Missouri have been assigned a hierarchical stream number (Pflieger et al. 1982) in such a
way that, from the number, the upstream and downstream reaches can be ascertained as
well as the hierarchy of basins in which the reach is situated. When the reaches are sorted
in ascending sequence, those close together in the sequence will be both close in x and y
coordinates on a map and close in stream connectivity. Sampled reaches were assigned a
‘1’, unsampled reaches a ‘0’. If sampled reaches were clumped, they formed a series of
1’s and this pattern showed up as a runs-test z score less than zero. I deleted reaches from
the middle of the longest runs until the z score was greater than zero. This meant that
sampled reaches were distributed randomly or evenly relative to all the reaches where a
species had ever been sampled. A z score close to zero would result from a random
interspersion of 1’s and 0’s. The more positive the z score, the more the distribution of
reaches would resemble an even distribution of 1’s and 0’s (a distribution approaching
the form ‘01010101’). I considered both random and even distributions of sampled
reaches within unsampled reaches as adequate for further analysis.
Once I was assured that sampled reaches were distributed evenly or randomly
within the known range of each species, I needed to test whether the number of samples
within sampled reaches was evenly or randomly distributed for each species. I did not
want one reach to have many samples while the other reaches had few samples. To do
this, I checked that the mean-to-variance ratio of the number of samples per reach was

23
less than one. I applied this test to a diverse and representative subsample of species. In
all cases, the mean-to-variance ratio was less than one, so I did not apply this test to all
species. I expected this anyway because of the dispersed manner in which the 1940s
samples were distributed.
General Patterns in Species Change
My first primary objective was to look for general patterns in the change of
species distributions over time. I calculated the proportion of samples in which a species
was collected out of all samples made within its range. Here, my definition of range
changed from the way I used it above. Above, I defined a species’ range as all the reaches
in Missouri where the species had ever been collected according to the records in the
MDC fish community database. Here, I defined a species’ range as all the reaches where
the species had been collected in the samples selected for this analysis. This reduced
extent of a species’ range was necessary to exclude reaches in which the species had not
been collected in the samples selected for this analysis but that had been collected in
other samples in the MDC fish community database. These reaches did not add any
information concerning the difference between the 1940s and 1990s; they only reduced
equally the proportion of samples in which a species occurred in the two periods. I
defined a reach as a length of stream bounded by changes in stream order. Reaches with
more than nine 3rd-order or larger tributaries were evenly divided into shorter reaches
(Pflieger et al. 1982).
I calculated change as the percent change in proportion over time. Change varied
from -100 to greater than 100. A change of -100 meant that a species was collected in the

24
1940s but not in the 1990s. A change greater than 100 meant that a species more than
doubled the number of samples in which it was found over time. I calculated change only
for species with greater than or equal to five samples within their range in each period. A
sample large enough to actually test for a change in proportions over time with adequate
power would require at least 20 samples and often many more (Sokal and Rohlf 1981).
Because five was a low sample size, I did not do the test but I was able to include many
more species in the analysis.
I divided change into decline (change < 0) and expansion (change > 0), and
asked, “Where has most of the decline and expansion occurred?” To answer this, I
calculated for each species in each 8-digit USGS hydrological unit, the proportion of sites
occupied within the species’ range in the 1940s and in the 1990s. A low proportion in the
1940s would indicate expansion, and a low proportion in the 1990s would indicate
decline. I chose the 8-digit hydrological unit after experimenting with larger (6-digit) and
smaller (11-digit) scales; the 8-digit scale seemed the smallest scale feasible given the
number of samples per hydrological unit. I then calculated an average expansion and
average decline over all species within each 8-digit hydrological unit and mapped the
results using different shades for classes of the averages.
To interpret change further, I mapped each species separately. For the 1940s and
1990s, I mapped where the species was present and the samples made within the range of
the species. I looked for and noted areas with samples but no presences. These showed
local range expansion or contraction. I then tabulated which species declined or expanded
in different regions. I defined regions as follows. I used the plains, Ozark, and lowland
regions according to the aquatic faunal regions defined in Pflieger (1989a). The east

25
Ozarks included all streams flowing directly into the Mississippi River. The west Ozarks
included the Neosho and Sac river basins. The south Ozarks included the Eleven Point
and Current river basins. The north Ozarks included all Missouri River basin streams
except the Sac River basin. I also defined the White River basin as a separate region. The
east plains included all streams flowing directly into the Mississippi River. The west
plains included the west Osage River basin, the South Grand River basin, small Missouri
River tributaries just east of Kansas City, and all Missouri River tributaries upstream of
Kansas City. The south plains included the Saline River and Black River basins, and the
small tributaries to the Missouri River around Jefferson City. The northern plains
included all Grand River tributaries. I considered the lowlands as one region.
Along with where change occurred, I looked at what species traits were
associated with change. I first transformed change to make the values symmetrical about
zero change. I used the equation = loge(change + 101). This made the values bell-
shaped in distribution and put them on a scale of 1 (change = -100) to 4.615 (change = 0)
to 5.303 or more (change > 100). I looked at seven species traits (Appendix Table 1).
First, I plotted versus the number of 8-digit hydrological units in which a species was
ever collected according to the MDC fish community database and calculated a linear
regression and the proportion of variability explained by the linear model (R2). I
constructed box plots for the remaining traits. If the 25th percentile was near or above =
4.615 or the 75th percentile was near or below = 4.615, I concluded that a large
majority of the species with a particular trait had expanded or declined. I examined traits
that were known for all species in the analysis (Berkman and Rabeni 1987; Rabeni and
Smale 1995; Pflieger 1989; Pflieger 1997): family, reproductive group, feeding group,

26
region where species is most characteristic, characteristic stream type in its most
characteristic region, and range edge in Missouri not defined by a drainage boundary. It
should be noted that only trait categories with multiple species were examinable. I then
looked at which traits were most important by comparing unique species, i.e., those only
in one category.
Conservation Status of Species
My second primary objective was to evaluate the conservation status of each
species. I first designed thresholds similar to those used by the IUCN (Mace and Lande
1991; Mace 1994; www.redlist.org/info/categories_criteria2001.html).
The first IUCN threshold was based on straight population reduction (Table 2). I
measured this with change. Because the IUCN threshold was over a time period of ten
years, I had to take their thresholds and compound them to 50 years.
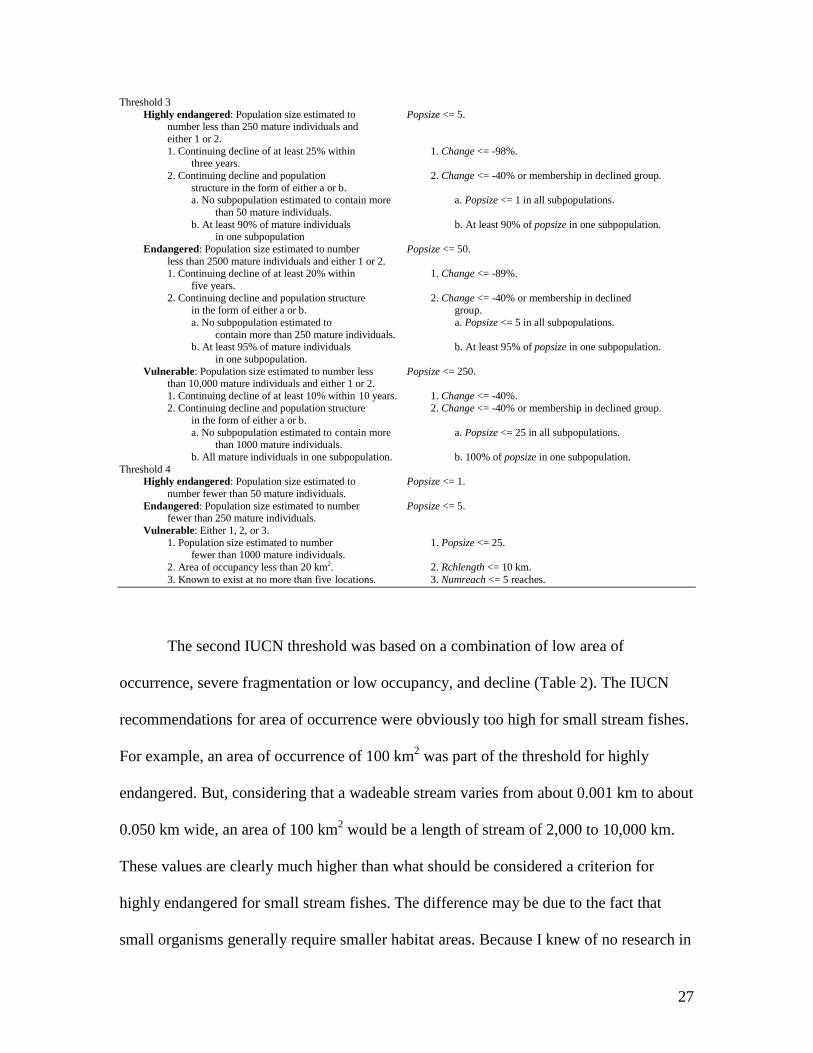
Table 2. The IUCN and modified criteria for critically endangered, endangered, and vulnerable. For clarity, details that do not apply to this analysis have been left out of the IUCN criteria. IUCN Modified Threshold 1 Highly endangered: A population size reduction of Change <= -99%. >= 80% within the next 10 years. Endangered: A population size reduction of >= Change <= -96%. 50% within the next 10 years. Vulnerable: A population size reduction of >= 30% Change <= -83%. within the next 10 years. Threshold 2 Highly endangered: Extent of occurrence estimated Rchlength <= 10 km. to be less than 100 km2 and both 1 and 2. 1. Severely fragmented or known to exist at 1. Fragmentation >= 0.5 or numreach <= 1 reach. only a single location. 2. Continuing decline. 2. Change <= -40% or membership in declined group. Endangered: Extent of occurrence estimated to be Rchlength <= 70 km. less than 5000 km2 and both 1 and 2. 1. Severely fragmented or known to exist at 1. Fragmentation >= 0.5 or numreach <= 5 reaches. no more than five locations. 2. Continuing decline. 2. Change <= -40% or membership in declined group. Vulnerable: Extent of occurrence estimated to be Rchlength <= 140 km. less than 20,000 km2 and both 1 and 2. 1. Severely fragmented or known to exist at 1. Fragmentation >= 0.5 or numreach <= 10 reaches. no more than 10 locations. 2. Continuing decline. 2. Change <= -40% or membership in declined group.
27
Threshold 3 Highly endangered: Population size estimated to Popsize <= 5. number less than 250 mature individuals and either 1 or 2. 1. Continuing decline of at least 25% within 1. Change <= -98%. three years. 2. Continuing decline and population 2. Change <= -40% or membership in declined group. structure in the form of either a or b. a. No subpopulation estimated to contain more a. Popsize <= 1 in all subpopulations. than 50 mature individuals. b. At least 90% of mature individuals b. At least 90% of popsize in one subpopulation. in one subpopulation Endangered: Population size estimated to number Popsize <= 50. less than 2500 mature individuals and either 1 or 2. 1. Continuing decline of at least 20% within 1. Change <= -89%. five years. 2. Continuing decline and population structure 2. Change <= -40% or membership in declined in the form of either a or b. group. a. No subpopulation estimated to a. Popsize <= 5 in all subpopulations. contain more than 250 mature individuals. b. At least 95% of mature individuals b. At least 95% of popsize in one subpopulation. in one subpopulation. Vulnerable: Population size estimated to number less Popsize <= 250. than 10,000 mature individuals and either 1 or 2. 1. Continuing decline of at least 10% within 10 years. 1. Change <= -40%. 2. Continuing decline and population structure 2. Change <= -40% or membership in declined group. in the form of either a or b. a. No subpopulation estimated to contain more a. Popsize <= 25 in all subpopulations. than 1000 mature individuals. b. All mature individuals in one subpopulation. b. 100% of popsize in one subpopulation. Threshold 4 Highly endangered: Population size estimated to Popsize <= 1. number fewer than 50 mature individuals. Endangered: Population size estimated to number Popsize <= 5. fewer than 250 mature individuals. Vulnerable: Either 1, 2, or 3. 1. Population size estimated to number 1. Popsize <= 25. fewer than 1000 mature individuals.
2. Area of occupancy less than 20 km2. 2. Rchlength <= 10 km. 3. Known to exist at no more than five locations. 3. Numreach <= 5 reaches.
The second IUCN threshold was based on a combination of low area of
occurrence, severe fragmentation or low occupancy, and decline (Table 2). The IUCN
recommendations for area of occurrence were obviously too high for small stream fishes.
For example, an area of occurrence of 100 km2 was part of the threshold for highly
endangered. But, considering that a wadeable stream varies from about 0.001 km to about
0.050 km wide, an area of 100 km2 would be a length of stream of 2,000 to 10,000 km.
These values are clearly much higher than what should be considered a criterion for
highly endangered for small stream fishes. The difference may be due to the fact that
small organisms generally require smaller habitat areas. Because I knew of no research in

28
this area for small stream fishes, I simply took the square root of the IUCN values. I
calculated rchlength as the total length of the reaches where a species was known to
occur, using data from the MDC fish community database collected since 1986. Because
I had to measure the length of each reach by hand, I did it only for species I judged from
other data to be the most likely to meet the thresholds. I calculated fragmentation as the
proportion of isolated reaches. I considered isolated reaches as those with a species
separated by reaches that had been sampled but without finding the species. Isolated
reaches reflected the IUCN definition of a subpopulation. The IUCN considered
occupancy as the number of locations where a species was known to exist. I translated
this as the number of reaches in which a species was known to exist and called this
variable numreach. The IUCN criterion for long-term decline was any decline that was
not just due to population fluctuation. Because I could not discern fluctuation from long-
term decline, I chose change < -40 as a threshold. A decline greater than 40% was a
criterion for vulnerable in the next IUCN threshold and, even if it was only fluctuation, it
was a high level of fluctuation, which would be a threat in itself. If the species had a trait
associated with decline, then I inferred this as significant long-term decline as well.
The third IUCN threshold consisted of a low number of mature individuals plus
high decline or long-term decline plus a weak population structure (Table 2). To estimate
the number of mature individuals, I first calculated the proportion of samples in which a
species was collected within each reach making up its range, averaged over all the
reaches making up its range, using data from the MDC fish community database
collected since 1986. This proportion has been shown to be positively related to local
abundance (Gaston 1996; Hanski and Gyllenberg 1997; Johnson 1998); therefore, I used

29
it as an index of local abundance. I then multiplied this times the total length of stream
making up the range of the species (i.e., rchlength) to obtain popsize, an index of total
number of mature individuals. For high change, I again used the IUCN compounded
values. For long-term decline, I again used change <= -40 or membership in a trait group
associated with decline. The IUCN defined weak population structure as isolated
subpopulations each with very small numbers of mature individuals or all or most mature
individuals in one subpopulation. I estimated both using popsize calculated for each
isolated reach or set of reaches.
The fourth IUCN threshold was based on a very low number of mature
individuals, with criteria based on area occupied and number of locations added to the
vulnerable category (Table 2).
After calculating the modified IUCN categories for each species, I downgraded
those species with populations that extended out of the sampled area. For these species,
there had to be good evidence that the probability of extinction would be less than
expected because of continual immigration into the state (Gardenfors et al. 2001).
I plotted the modified IUCN categories against the state categories of
conservation concern of listed species (Missouri Natural Heritage Program 2003). I then
made recommendations on the conservation status of the small stream fishes of Missouri.
Lastly, I evaluated the adequacy, in terms of sample size and distribution of
samples among reaches, of present data for the purposes of future analyses. I calculated
the average number of samples per reach within the range of each species then multiplied
this times the number of reaches. This value would be close to the number of samples
available in the present to calculate change at some time in the future assuming an even

30
distribution of samples among reaches. Species with low values (<15) would need
additional samples to be made within their range now so that change can be assessed in
the future.
RESULTS
General Patterns in Species Change
Change varied from -100% to 457% for the 91 species with five or more samples
within their ranges (Table 3). Four species showed no change, 49 declined and 38
expanded.
Table 3. Change in species occurrence, 1940s versus 1990s. pres40 = samples in 1940s in which the species was present; all40 = all samples within the range of the species in the 1940s; prop40 = pres40/all40; pres90 = samples in 1990s in which the species was present; all90 = all samples within the range of the species in the 1990s; prop90 = pres90/all90; change = the percent change in proportion. Species pres40 all40 prop40 pres90 all90 prop90 change Arkansas River orangethroat darter 15 16 0.94 14 14 1 7 Banded darter 43 58 0.74 43 59 0.73 -2 Banded sculpin 40 57 0.70 46 58 0.79 13 Bigeye chub 34 37 0.92 19 40 0.48 -48 Bigeye shiner 45 63 0.71 56 70 0.8 12 Bigmouth shiner 39 63 0.62 56 66 0.85 37 Blacknose shiner 7 10 0.7 3 11 0.27 -61 Blackside darter 19 23 0.83 10 22 0.45 -45 Blackspotted topminnow 82 113 0.73 97 114 0.85 17 Blackstripe topminnow 48 75 0.64 51 74 0.7 8 Blacktail shiner 7 12 0.58 10 12 0.83 43 Bleeding shiner 63 73 0.86 67 71 0.94 9 Bluegill 55 181 0.30 165 187 0.88 190 Bluestripe darter 4 13 0.31 11 15 0.73 138 Bluntface shiner 10 10 1 4 9 0.44 -56 Bluntnose darter 14 17 0.82 6 20 0.3 -64 Bluntnose minnow 197 222 0.89 191 223 0.86 -3 Brook silverside 73 105 0.7 83 106 0.78 13 Bullhead minnow 28 39 0.72 32 38 0.84 17 Cardinal shiner 8 9 0.89 8 9 0.89 0

31
Table 3 (continued). Change in species occurrence, 1940s versus 1990s. pres40 = samples in 1940s in which the species was present; all40 = all samples within the range of the species in the 1940s; prop40 = pres40/all40; pres90 = samples in 1990s in which the species was present; all90 = all samples within the range of the species in the 1990s; prop90 = pres90/all90; change = the percent change in proportion, 1940s to 1990s. Species pres40 all40 prop40 pres90 all90 prop90 change Central stoneroller 174 203 0.86 170 201 0.85 -1 Common shiner 14 26 0.54 24 32 0.75 39 Creek chub 100 158 0.63 126 162 0.78 23 Creek chubsucker 14 16 0.88 4 15 0.27 -70 Duskystripe shiner 16 16 1 15 15 1 0 Eastern redfin shiner 37 48 0.77 33 49 0.67 -13 Emerald shiner 27 47 0.57 34 46 0.74 29 Fathead minnow 88 96 0.92 46 89 0.52 -44 Freckled madtom 6 7 0.86 1 6 0.17 -81 Ghost shiner 26 30 0.87 12 32 0.38 -57 Gilt darter 12 15 0.8 5 14 0.36 -55 Golden shiner 46 68 0.68 37 66 0.56 -17 Gravel chub 20 28 0.71 12 29 0.41 -42 Greenside darter 70 87 0.80 73 85 0.86 7 Green sunfish 192 228 0.84 169 224 0.75 -10 Hornyhead chub 87 88 0.99 64 88 0.73 -26 Johnny darter 86 116 0.74 90 118 0.76 3 Largescale stoneroller 64 84 0.76 75 85 0.88 16 Longear sunfish 118 141 0.84 124 139 0.89 7 Meramec River saddled darter 10 14 0.71 10 14 0.71 0 Mimic shiner 13 21 0.62 14 23 0.61 -2 Mississippi silvery minnow 8 10 0.8 4 10 0.4 -50 Missouri saddled darter 19 21 0.90 12 22 0.55 -40 Mottled/Ozark sculpin 18 42 0.43 48 51 0.94 120 Northern logperch 5 13 0.38 10 13 0.77 100 Northern orangethroat darter 95 133 0.71 127 136 0.93 31 Northern studfish 71 86 0.83 79 91 0.87 5 Ohio logperch 4 12 0.33 6 11 0.55 64 Orangespotted sunfish 132 142 0.93 61 134 0.46 -51 Ozark chub 4 7 0.57 2 6 0.33 -42 Ozark logperch 61 82 0.74 57 91 0.63 -16 Ozark madtom 4 13 0.31 11 15 0.73 138 Ozark minnow 77 88 0.88 79 89 0.89 1 Ozark shiner 7 9 0.78 3 10 0.3 -61 Pallid shiner 9 11 0.82 0 10 0 -100 Peppered chub 5 10 0.5 8 8 1 100 Plains minnow 19 20 0.95 2 15 0.13 -86 Plains topminnow 10 16 0.62 10 16 0.62 0 Pugnose minnow 5 9 0.56 4 10 0.4 -28 Rainbow darter 70 86 0.81 87 91 0.96 18 Red shiner 167 172 0.97 126 164 0.77 -21 Redspot chub 9 9 1 7 9 0.78 -22

32
Table 3 (continued). Change in species occurrence, 1940s versus 1990s. pres40 = samples in 1940s in which the species was present; all40 = all samples within the range of the species in the 1940s; prop40 = pres40/all40; pres90 = samples in 1990s in which the species was present; all90 = all samples within the range of the species in the 1990s; prop90 = pres90/all90; change = the percent change in proportion, 1940s to 1990s. Species pres40 all40 prop40 pres90 all90 prop90 change Redspotted sunfish 6 8 0.75 2 7 0.29 -62 Ribbon shiner 9 9 1 3 7 0.43 -57 Rosyface shiner 73 87 0.84 57 88 0.65 -23 Sand shiner 135 156 0.87 113 153 0.74 -15 Silver chub 18 25 0.72 6 20 0.3 -58 Slenderhead darter 42 49 0.86 28 51 0.55 -36 Slender madtom 56 102 0.55 77 108 0.71 30 Slough darter 7 8 0.88 6 11 0.55 -38 Southern redbelly dace 19 35 0.54 25 39 0.64 18 Speckled darter 5 9 0.56 7 10 0.7 26 Spotfin shiner 22 24 0.92 9 22 0.41 -55 Steelcolor shiner 13 20 0.65 12 21 0.57 -12 Stippled darter 21 37 0.57 15 33 0.45 -20 Stonecat 14 28 0.5 19 32 0.59 19 Striped fantail darter 60 108 0.56 93 109 0.85 54 Striped shiner 52 74 0.70 75 87 0.86 23 Suckermouth minnow 111 128 0.87 78 127 0.61 -29 Tadpole madtom 22 30 0.73 12 28 0.43 -42 Telescope shiner 14 17 0.82 14 18 0.78 -6 Topeka shiner 12 14 0.86 1 14 0.07 -92 Trout-perch 9 11 0.82 1 12 0.08 -90 Warmouth 8 17 0.47 14 18 0.78 65 Wedgespot shiner 27 36 0.75 27 39 0.69 -8 Weed shiner 9 9 1 0 5 0 -100 Western mosquitofish 17 104 0.16 111 122 0.91 457 Western redfin shiner 80 96 0.83 64 92 0.7 -17 White River orangethroat darter 6 14 0.43 12 14 0.86 100 Whitetail shiner 12 13 0.92 5 13 0.38 -58 Yoke darter 10 13 0.77 11 14 0.79 2
Decline was greatest in the northern Ozarks and the White River basin (Figure 2).
Expansion was greatest in the southern and western plains (Figure 3).

33

34

35
From examination of distribution maps of individual species (Appendix Figures
Arkansas River Orangethroat Darter – Yoke Darter), I saw regions of decline in 45
species (Table 4) and of expansion in 33 species (Table 5). One unexpected pattern was
the decline of plains species from the Ozarks, including blacknose shiner, blackstripe
topminnow, eastern redfin shiner, johnny darter, orangespotted sunfish, red shiner, sand
shiner, slenderhead darter, suckermouth minnow, and western redfin shiner. Ten of the 18
species that showed decline in the Ozarks were plains species. Another surprising pattern
was the expansion of Ozark species into the plains, including bigeye shiner, blackspotted
topminnow, bluntnose minnow, brook silverside, central stoneroller, gravel chub, longear
sunfish, northern orangethroat darter, northern studfish, Ozark logperch, slender madtom,
steelcolor shiner, striped fantail darter, and striped shiner. Ozark species made up 14 of
the 26 species that showed expansion in the plains. Thirteen species showed decline in
one part of their range and expansion in another part. Species that declined out of the
Ozarks and expanded into the plains were blackstripe topminnow, bluntnose minnow,
gravel chub, johnny darter, mimic shiner, Ozark logperch, slenderhead darter, and
steelcolor shiner. Six species declined in the lowlands while none expanded in it. Large
river species declined in the White River basin, which is not surprising given the
impoundment of the entire length of the mainstem White River in Missouri.

36
Table 4. Species showing regional decline. Lowlands Ozarks White R. Plains ----------------- ----------------- N W S E N W S E Bigeye chub X X X Blacknose shiner X X Blackside darter X Blackstripe topminnow X X X Bluntface shiner X Bluntnose darter X Bluntnose minnow X X X X X X Creek chubsucker X X Eastern redfin shiner X Fathead minnow X X X X Freckled madtom X X Ghost shiner X X X Gilt darter X X X Golden shiner X Gravel chub X Hornyhead chub X X X X X X Johnny darter X Largescale stoneroller X Mimic shiner X X Mississippi silvery minnow X X Missouri saddled darter X Orangespotted sunfish X X X X X X X Ozark logperch X X X Ozark shiner X Pallid shiner X X Plains minnow X X X Red shiner X X X Redspotted sunfish X Ribbon shiner X Rosyface shiner X Sand shiner X X X Silver chub X X X X Slenderhead darter X X X Southern redbelly dace X Spotfin shiner X X Steelcolor shiner X Suckermouth minnow X X X X Tadpole madtom X X Topeka shiner X X X Trout-perch X X Wedgespot shiner X Weed shiner X Western redfin shiner X X Whitetail shiner X

37
Table 5. Species showing regional expansion. Lowlands Ozarks White R. Plains ----------------- ----------------- N W S E N W S E Bigeye shiner X X Bigmouth shiner X X Blackspotted topminnow X Blackstripe topminnow X X Bluegill X X X X X X X X Bluestripe darter X Bluntnose minnow X X Brook silverside X X Central stoneroller X X Creek chub X X X X Eastern redfin shiner X X Emerald shiner X X Fathead minnow X X Golden shiner X Gravel chub X Johnny darter X Largescale stoneroller X X Longear sunfish X Mimic shiner X Mottled/Ozark sculpin X X X X X Northern logperch X Northern orangethroat darter X X X Northern studfish X X Ozark logperch X X Ozark madtom X X Slenderhead darter X Slender madtom X X X Southern redbelly dace X X X Steelcolor shiner X Striped fantail darter X X X X Striped shiner X X X Western mosquitofish X X X X X X X X White River orangethroat darter X
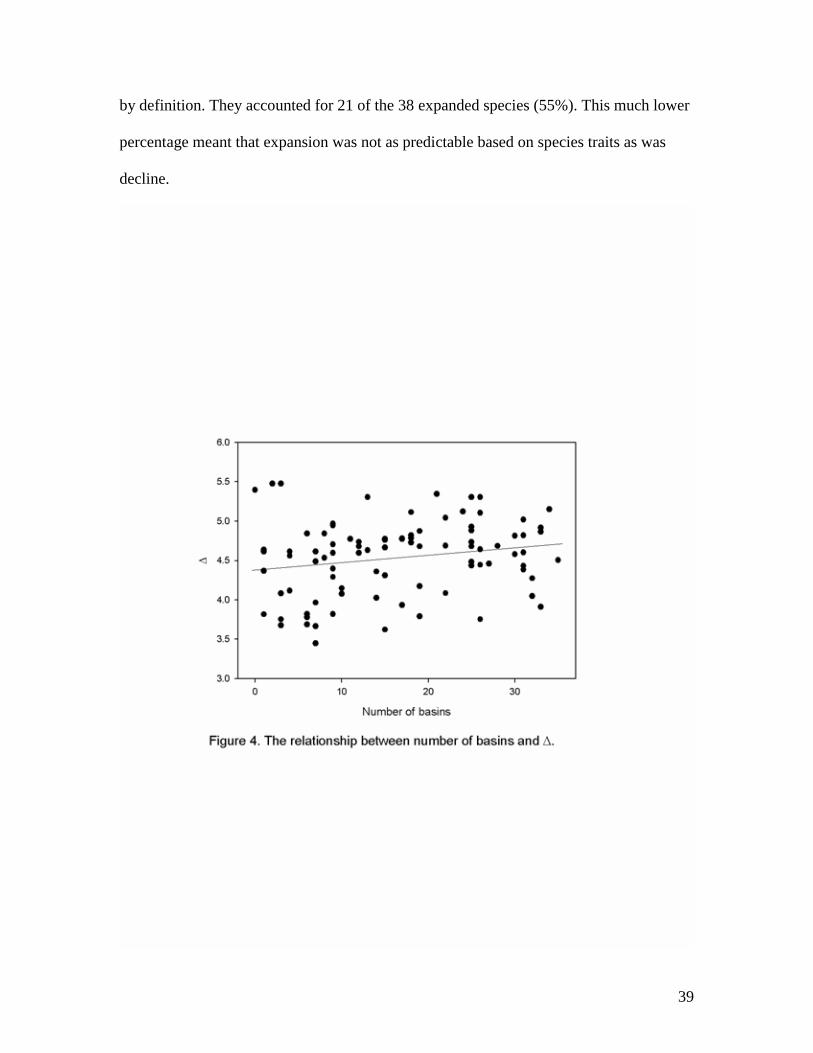
There were relationships between and species traits. The number of basins in
which a species was known to occur in Missouri was significantly related to (P =
0.0192, N = 90) but the proportion of the variation explained by a straight line was very
low (R2 = 0.06, Figure 4). Reproductive groups showed no relation to (Figure 5). A

38
majority (33 of 48 species, 69%) of the Cyprinidae declined (Figure 6). Three of four
herbivores declined (75%, Figure 7). Thirteen of 19 plains species declined (68%, Figure
8). For stream type (Figure 9), declines occurred in species characteristic of clear lowland
ditches (six of six species, 100%), large Ozark rivers (14 of 17 species, 82%), plains
headwaters (three of four species, 75%), and plains small and large rivers combined
(seven of eight species, 88%). Expansion occurred in species characteristic of lowland
standing waters (three of four species, 75%), Ozark creeks (seven of 10 species, 70%),
and small Ozark rivers (11 of 15 species, 73%). Species in which Missouri was at the
western or northwestern edge of the range declined (four of five [80%] and 11 of 14
[79%] species respectively, Figure 10). Species in which Missouri was at the eastern or
northeastern edge of the range also declined (three of four species, 75%). Of the species
that declined and the trait categories associated with decline, Cyprinidae had 15 unique
species, small plains rivers and large Ozark rivers had three unique species each,
northwestern edge of the range had two unique species, and plains headwaters, large
plains rivers, and clear lowland ditches had one unique species each. Herbivore, plains,
small plains rivers, western, eastern, and northeastern edges of the range had no unique
species. Altogether, the trait categories with unique species accounted for 47 of the 49
declined species (96%). If the common species (those for which change could be
calculated) represent the same distribution of traits as the rare species, then any rare
species with any of the seven traits associated with decline likely would have declined as
well; conversely, any rare species that did not fit one of the seven trait categories
associated with decline likely would not have declined. The three trait categories
associated with expansion were mutually exclusive, so would have no common species
39
by definition. They accounted for 21 of the 38 expanded species (55%). This much lower
percentage meant that expansion was not as predictable based on species traits as was
decline.

40

41

42

43

44

45

46
Conservation Status of Species
The number of reaches in which a species had been recently collected (numreach)
varied from zero for the extirpated species pallid shiner to 905 for green sunfish (Table
6). The proportion of samples with a species within the reaches where it had been
recently collected (proportion) varied from zero for pallid shiner and longnose darter to
1.0 for spring cavefish. Although spring cavefish was found only in one small spring, it
was always found there. Longnose darter was last seen in the state in 1987 and the
observation was not part of a community sample. All community samples within the
reach where it was seen have been negative for this species.
Table 6. Extinction correlates and sample adequacy. Numreach = the number of reaches in which a species has been found between 1986 and 2001. Proportion = the proportion of samples with the species within these reaches. Rchlength = the total length of these reaches in km. Fragmentation = the proportion of reaches that are isolated. Baseline = an estimate of the number of samples available as a baseline for calculating change in the future. Species Numreach Proportion Rchlength Fragmentation Baseline Alabama shad 10 0.35 51 Arkansas darter 61 0.84 159 Arkansas River orangethroat darter 97 0.95 218 Arkansas saddled darter 2 0.24 44.3 1.00 10 Banded pigmy sunfish 40 0.80 119 Banded sculpin 202 0.84 437 Bantam sunfish 13 0.81 0.23 31 Barred fantail darter 25 0.88 35 Banded darter 125 0.82 354 Bigeye chub 67 0.78 157 Bigeye shiner 213 0.85 468 Bigmouth shiner 317 0.92 544 Blacknose shiner 18 0.82 49 Blackside darter 53 0.65 168 Blackspotted topminnow 392 0.91 765 Blackstripe topminnow 188 0.86 372 Blacktail shiner 59 0.87 166 Bleeding shiner 274 0.96 519 Bluegill 781 0.88 1474 Bluestripe darter 17 0.69 66 Bluntface shiner 10 0.81 28 Bluntnose darter 52 0.75 147 Bluntnose minnow 727 0.93 1375 Brassy minnow 13 0.92 28

47
Table 6 (continued). Extinction correlates and sample adequacy. Numreach = the number of reaches in which a species has been found between 1986 and 2001. Proportion = the proportion of samples with the species within these reaches. Rchlength = the total length of these reaches in km. Fragmentation = the proportion of reaches that are isolated. Baseline = an estimate of the number of samples available as a baseline for calculating change in the future. Species Numreach Proportion Rchlength Fragmentation Baseline Brindled madtom 13 0.60 62 Brook darter 24 0.90 55 Brook silverside 281 0.84 658 Bullhead minnow 93 0.80 269 Cardinal shiner 51 0.92 104 Central mudminnow 2 0.67 1.5 1.00 4 Central stoneroller 827 0.93 1459 Channel darter 10 0.53 54 Checkered madtom 7 0.34 250.0 0.71 26 Common shiner 122 0.92 200 Creek chub 743 0.93 1266 Creek chubsucker 59 0.83 120 Crystal darter 6 0.41 362.9 0.50 58 Current darter 20 0.85 42 Current River saddled darter 5 0.85 161.9 0.30 10 Cypress darter 58 0.88 141 Cypress minnow 2 0.62 145.7 1.00 18 Dollar sunfish 10 0.90 36.6 0.33 12 Dusky darter 25 0.75 104 Duskystripe shiner 50 0.99 90 Eastern redfin shiner 192 0.87 371 Eastern slim minnow 1 0.23 84.0 1.00 22 Emerald shiner 94 0.74 255 Fathead minnow 286 0.83 543 Flier 13 0.66 52 Freckled madtom 19 0.53 100 Ghost shiner 19 0.75 41 Gilt darter 30 0.69 120 Golden shiner 329 0.80 682 Golden topminnow 5 0.65 42.5 0.20 22 Goldstripe darter 11 0.83 5.7 0.18 21 Gravel chub 39 0.70 123 Green sunfish 905 0.89 1665 Greenside darter 226 0.83 559 Harlequin darter 8 0.64 405.2 0.50 62 Hornyhead chub 202 0.90 395 Ironcolor shiner 7 0.95 63.8 0.25 16 Johnny darter 408 0.87 806 Lake chubsucker 10 0.71 40 Largescale stoneroller 284 0.92 555 Least darter 30 0.62 101 Longear sunfish 476 0.92 937 Longnose darter 1 0.00 23.2 1.00 2 Meramec River saddled darter 20 0.95 48 Mimic shiner 50 0.73 167 Mississippi silvery minnow 22 0.77 86 Missouri saddled darter 45 0.85 121 Mottled sculpin 170 0.87 115 Mountain madtom 1 0.23 84.0 1.00 22 Mud darter 13 0.63 67

48
Table 6 (continued). Extinction correlates and sample adequacy. Numreach = the number of reaches in which a species has been found between 1986 and 2001. Proportion = the proportion of samples with the species within these reaches. Rchlength = the total length of these reaches in km. Fragmentation = the proportion of reaches that are isolated. Baseline = an estimate of the number of samples available as a baseline for calculating change in the future. Species Numreach Proportion Rchlength Fragmentation Baseline Neosho madtom 1 0.71 12.8 1.00 8 Niangua darter 16 0.38 0.44 34 Northern logperch 22 0.69 49 Northern orangethroat darter 498 0.94 844 Northern studfish 277 0.92 544 Ohio logperch 37 0.73 130 Orangespotted sunfish 227 0.76 536 Ozark chub 20 0.72 69 Ozark madtom 44 0.75 119 Ozark minnow 291 0.93 572 Ozark logperch 190 0.78 412 Ozark sculpin * * 197 Ozark shiner 13 0.91 27 Pallid shiner 0 0.00 0.0 1.00 Peppered chub 20 0.79 38 Pirate perch 57 0.81 144 Plains killifish 4 0.67 77.6 0.75 16 Plains minnow 7 0.64 208.2 0.14 17 Plains orangethroat darter 24 0.86 46 Plains topminnow 33 0.77 76 Pugnose minnow 33 0.62 129 Rainbow darter 298 0.94 570 Redear sunfish 41 0.52 135 Redfin darter 3 0.60 59.0 0.33 23 Red shiner 509 0.94 907 Redspot chub 33 0.90 64 Redspotted sunfish 55 0.75 150 Ribbon shiner 29 0.78 109 River darter 13 0.64 55 Rosyface shiner 205 0.82 487 Sabine shiner 1 0.64 84.0 1.00 22 Saddleback darter 11 0.55 60 Sand shiner 394 0.92 738 Scaly sand darter 15 0.67 68 Silver chub 16 0.67 36 Silverjaw minnow 17 0.84 30 Slenderhead darter 72 0.70 249 Slender madtom 280 0.78 620 Slough darter 80 0.80 206 Southern redbelly dace 207 0.85 374 Speckled darter 26 0.66 110 Spotfin shiner 43 0.67 156 Spring cavefish 1 1.00 0.4 1.00 1 Stargazing darter 2 0.19 127.1 1.00 26 Starhead topminnow 17 0.82 0.18 41 Steelcolor shiner 52 0.91 97 Stippled darter 123 0.74 316 Stonecat 54 0.59 181 Striped fantail darter 377 0.87 736 Striped shiner 233 0.91 458

49
Table 6 (continued). Extinction correlates and sample adequacy. Numreach = the number of reaches in which a species has been found between 1986 and 2001. Proportion = the proportion of samples with the species within these reaches. Rchlength = the total length of these reaches in km. Fragmentation = the proportion of reaches that are isolated. Baseline = an estimate of the number of samples available as a baseline for calculating change in the future. Species Numreach Proportion Rchlength Fragmentation Baseline Suckermouth minnow 241 0.83 504 Swamp darter 6 0.66 41.3 0.33 18 Tadpole madtom 58 0.68 158 Taillight shiner 6 0.47 196.0 0.33 44 Telescope shiner 77 0.92 141 Topeka shiner 19 0.87 27.0 0.27 42 Trout-perch 15 0.57 51 Warmouth 113 0.80 283 Wedgespot shiner 90 0.83 246 Weed shiner 24 0.81 112 Western mosquitofish 409 0.85 889 Western redfin shiner 273 0.86 540 Western sand darter 13 0.35 80 Western silvery minnow 1 0.25 17.4 1.00 4 Western slim minnow 8 0.61 232.0 0.11 26 Whitetail shiner 30 0.83 94 White River fantail darter 13 0.68 34 White River orangethroat darter 42 0.86 82 Yoke darter 14 0.84 35 *Combined with mottled sculpin.
I calculated the total length of the reaches in which a species had been collected
recently (rchlength) for the 27 species that I estimated would have the shortest lengths.
This varied from 0.0 km for pallid shiner and 0.4 km for spring cavefish to 405.2 km for
harlequin darter. Isolation of populations (fragmentation) varied from 0.11 for eastern
slim minnow to 1.0 for 12 species. Again, I calculated fragmentation only for species in
few reaches and other species that I judged beforehand to have a potentially high value.
Pallid shiner had a value of 1.0 because it was extirpated from the state. Seven other
species had a value of 1.0 because they were found in only one reach. Seven species
found in more than one reach had fragmentation values >= 0.5. I analyzed 26 species for
weak population structure and found popsize < 5 in all subpopulations of central
mudminnow and popsize < 25 in all subpopulations of Arkansas saddled darter, swamp

50
darter, goldstripe darter, redfin darter, golden topminnow, plains killifish, dollar sunfish,
taillight shiner, and stargazing darter. Swamp darter had 100% of its total popsize in one
subpopulation, as did all species with numreach = 1 (Table 6). Goldstripe darter had 96%
of its total popsize in one subpopulation, and plains killifish had 92% of its total popsize
in one subpopulation.
One or more of the modified IUCN thresholds were met by 23 species. Five of
these species were downgraded one step because the population extended outside of the
sampled region. Pflieger (1997) reported large numbers of stargazing darters in the
Current River just south of the border in Arkansas. If the reach south of the border is
considered a separate reach, fragmentation for this species decreases to 0.33 and
population structure would improve. Likewise, large numbers just south of the border
would offset the low proportion of sites occupied on the Missouri side of the Current
River and increase the number of reaches and length of stream occupied. They are also
present in the Black River, which was excluded from this analysis. So, stargazing darter
would be downgraded from vulnerable to off the list. The population centers of western
silvery minnow and plains minnow are in the Missouri River. This would downgrade
western silvery minnow from highly endangered to endangered and plains minnow to off
the list. Most of the population of Neosho madtom is just across the border in Kansas,
therefore, this species should be downgraded from endangered to vulnerable. The weed
shiner is widespread and abundant in the mainstems of the Black and St. Francis Rivers
in Missouri which were not included in the 1940s samples. It should be downgraded to
endangered. Even though it is presently abundant, it should be monitored carefully
because of its historically extremely high rate of decline. In summary, four species met
51
the criteria for highly endangered: central mudminnow, longnose darter, pallid shiner,
and spring cavefish. Eight species met the criteria for endangered: Arkansas saddled
darter, eastern slim minnow, golden topminnow, goldstripe darter, mountain madtom,
redfin darter, Topeka shiner, weed shiner, and western silvery minnow. Eight species met
the criteria for vulnerable: Current River saddled darter, cypress minnow, ironcolor
shiner, Neosho madtom, plains killifish, Sabine shiner, taillight shiner, and trout-perch.
Agreement between the modified IUCN categories calculated here and the
existing state ranks was fairly strong (Figure 11). Between the state ranks of SX
(extirpated) and S1? (S1 but questionable), 15 of the19 state-listed species met the
modified IUCN criteria. Between the state ranks of S2 (imperiled) and SU (status
unknown), three of the 29 state-listed species met the modified IUCN criteria. In general,
the IUCN criteria encompassed only the most endangered ranks of the state list. Three
state-unlisted species, Arkansas saddled darter, Current River saddled darter, and weed
shiner, met the modified IUCN criteria. Four species listed as state endangered (the most
critical level of endangerment that can be assigned at the state level), crystal darter,
harlequin darter, Niangua darter, and swamp darter did not meet the modified IUCN
criteria.

52
Eight species did not have adequate baseline sample sizes within their ranges to
be able to calculate future change (Table 6). Two of these, central mudminnow and
spring cavefish, were found in such small habitats that making multiple community
samples would be impractical. The western silvery minnow was collected only once and
was probably a stray from the Missouri River. Further sampling for this species in the one
reach where it was found would probably not be useful. The Neosho madtom is a
federally threatened species that is being monitored intensively; therefore, probably does
not need to be monitored with community samples within its range. The other four
species, Arkansas saddled darter, dollar sunfish, longnose darter, and White River
saddled darter, and must be sampled now if adequate estimates of change are to be
calculated in the future.

53
DISCUSSION
General Patterns in Species Change
Greatest expansion of species was in the southern and western plains. Over half of
the species were Ozark species. Greatest decline was in the northern Ozarks. Over half of
these species were plains species. Membership in the family Cyprinidae was the most
important trait associated with decline. Species characteristic of small Ozark rivers and
creeks generally expanded.
The first explanation for these patterns is sampling bias. There was relatively little
standardization in the samples; only total time spent sampling or total number of
individuals. Seine sizes were different. Harry made almost all the samples in the 1940s,
which should help the consistency of sampling, but samples in the 1990s were made by
many biologists.
The pattern of expansion in the southern and western plains (over half of these
species characteristic of the Ozarks) and decline from the Ozarks (over half of these
species characteristic of the plains) was counter-intuitive. Unexpected results like this
make one wonder about the robustness of the data. There is a pressing need, therefore, to
be sure that the pattern is not due to sampling bias.
In the 1940s, the southern and western plains were sampled by Harry. In the
1990s, 49 of 58 samples were made by four biologists: Bruenderman, Pflieger, Bayless,
and Winston. One way an illusion of expansion could have been created is if the 1990s
samplers did a better job than Harry. The 1990s samplers had advantages, even given the
same effort as Harry. For one, they had Harry’s data as a benchmark. They would know
what species to expect at the site and in the vicinity and could focus on finding those that

54
were not easily caught. A competitive or professional attitude could have pushed the
samplers to do better than Harry. The 1990s samplers probably had a better knowledge of
the fish and their habitats, given books like The Fishes of Missouri. Harry was a young
graduate student at the time he made the samples; most of the 1990s samplers were
experienced fisheries biologists. Supporting this contention, a t-test on species richness of
sample pairs in the south and east plains was significant (P<0.0001, N=55). Species
richness of samples was 2.618 species lower in the 1940s on average. Effort in terms of
sample time did not differ (P=0.1234, N=55) as expected from the way the data were put
together. Results did not change with log transformation of the data.
However, there are several reasons to think that sampling bias was not the reason
for the pattern of expansion. First, the species that expanded were collected by Harry in
other places, so we know that he had experience collecting them. He sampled in Missouri
from June through September in 1940 and in July and August 1941 (Figure 12). These
sample times extended through most of the summer of two years, giving confidence that
local, short-term weather events did not have large effects on the results. Annual mean
stream flow in 1940 and 1941 was at or below average (Figure 13), so long-term high
water does not seem to be the explanation. If Ozark species were rare in the southern and
western plains both in the 1940s and 1990s, then better sampling in the 1990s might have
captured them more often. However, this explanation is contradicted by the relatively
high abundances of Ozark species in the plains in the 1990s (Table 7). Only northern
studfish was rare in the 1990s samples. Lastly, the expansion of species was consistent
and region wide.

55

56

57
Table 7. Abundance of Ozark species in 1990s samples where they showed expansion into the southern and western plains. N = number of samples; mean = mean abundance; SD = standard deviation of abundance; range = range of abundance. Species N mean SD Range Blackspotted topminnow 4 20.5 20.3 1-40 Bluntnose minnow 7 26.9 44.1 2-121 Brook silverside 10 11.7 12.6 1-39 Central stoneroller 6 21.8 22.4 1-59 Gravel chub 3 3.7 2.3 1-5 Longear sunfish 9 11.8 17.6 1-57 Northern orangethroat darter 9 11.8 10.8 1-30 Northern studfish 1 1.0 Ozark logperch 7 3.1 2.7 1-7 Slender madtom 5 5.6 4.0 1-10 Striped fantail darter 6 5.3 3.7 1-10
If Harry did a better job of sampling than Bruenderman, Pflieger, and the others,
then the pattern of decline in the northern Ozarks might be an artifact of sampling. A t-
test on species richness of sample pairs in the northern Ozarks was significant (P=0.0059,
N=90). Species richness of samples was 1.3556 species higher in the 1940s on average.
Effort in terms of sample time did not differ (P=0.0964, N=90). Results did not change
with log transformation of the data. However, we know that Bruenderman and Pflieger
made adequate community samples. They sampled all habitats extensively. Probably 90%
or more of the small fish species in a reach were sampled.
Although standardization was weak, the strong patterns do not seem to be artifacts
of biased sampling.
There were 64 trait categories represented in the species for which change could
be calculated. Seven of these accounted for 96% of the species that declined. What is the
significance that most Cyprinidae declined but not Ictaluridae, Centrarchidae, or
Percidae; that most plains species declined but not Ozark species; that most Ozark large-

58
river species declined but other Ozark species expanded; that lowland clear-ditch and
natural river species declined but standing water species expanded; that species with
western and eastern range edges in Missouri declined but not those with northern and
southern range edges?
In the 1800s, the Ozark region was the center of a large timber industry, but
profitable virgin timber harvest was exhausted by about 1915 (Rafferty 1980). A large
human population remained in the Ozarks, however, relying heavily on subsistence
hunting and fishing. Open-range grazing was practiced on the cutover lands, and regular
burning was used to increase forage. Between 1920 and 1960, riparian vegetation was
widely destroyed in small Ozark valleys due to concentration of livestock near water in
the valley bottoms (Jacobson and Primm 1997). This encouraged headward migration of
channels and released gravel from storage in the small valleys. The gravel moved
downstream and filled pools and channels. Downstream channels were shallower in the
1990s than they were in the 1940s. This could be part of the explanation for the decline in
the Ozarks of large river species and the expansion of small-river and creek species.
However, it does not seem to explain why plains species declined from the Ozarks.
In the plains region of Missouri, deeply plowed fields were made possible with
the general adoption of the moldboard plow during the latter half of the 19th century.
From then up through the early 20th century were times of intensive land drainage, stream
channelization, and rapid increase in row cropping. The relative rate of both
environmental and faunal change probably has declined since about 1940 (Larimore and
Smith 1963; King 1973; Menzel et al. 1984; Cross and Collins 1985). However, the
extent of plowed land is one of the most obvious differences between the Ozarks and the

59
plains, and there is no doubt that plowing increases sedimentation of streams (Meade et
al. 1990). This explanation for the greater relative decline of plains species compared to
Ozark species is supported by a partitioning of simple lithophilous spawners into plains
and Ozark species. This spawning category is considered the most sensitive to
sedimentation (Berkman and Rabeni 1987; Rabeni and Smale 1995). In the plains, seven
of eight species declined; in the Ozarks, 13 of 25 species declined (I included species
known to spawn on the nests of other species, such as Ozark minnow, Topeka shiner, and
western redfin shiner in this count).
Predation is another potential explanation. In the early 1900’s, Canada geese,
whitetail deer, and wild turkey were either extirpated or very rare in the state due to
intensive subsistence hunting and no regulation. These species are now so abundant that
they are considered nuisances in many places. It is reasonable to expect the same for
large fishes. Not only has management of wild populations improved, but there are also
widespread stocking programs in public and private waters. Larimore and Bayley (1996)
reported increases in large piscivorous fish in Champaign County, Illinois since 1959.
Predation may explain many of the patterns found in this analysis. Small, lowland
standing-water species expanded. These would be pre-adapted to living with large
predators such as largemouth bass (Micropterus salmoides). The Cyprinidae, which
strongly declined, have been found to be especially susceptible to increased predation
(Whittier et al. 1997) and likely to be extirpated (Angermeier 1995). Loss of minnows
has been associated with farm ponds, impoundments, and largemouth bass (Schrank et al.
2001; Jackson 2002; Mammoliti 2002; Winston 2002). Farm ponds are often perched
high in the watershed and are a source of predators into headwater streams. This would

60
explain the decline of plains species even in the headwaters. However, predation does not
seem to explain the expansion of Ozark species into the plains and the loss of plains
species from the Ozarks.
Another explanation is that species’ range sizes tend to be positively correlated
with their environmental tolerances (Scott and Helfman 2001). Thus, declining or
extirpated species would tend to have small geographic ranges (Angermeier 1995). This
may explain the pattern I found between change and the number of basins in which a
species was known to occur, but it does not seem to explain any of the other patterns.
Warming from climate change has been of intense recent interest (e.g., Wood and
McDonald 1997; Hill et al. 1999; Hellberg et al. 2001). I found no evidence for this in
this study. Plains fishes declined out of the Ozarks. One would expect the opposite
because plains fish are more tolerant of higher temperatures. Furthermore, the cool-water
sculpins expanded as a group, as did the spring-associated southern redbelly dace.
Species with northern or southern range edges in Missouri also did not change as a group.
The Missouri River has become less turbid since the 1940s with the construction
of multiple large impoundments between Montana and Nebraska. Fishes characteristic of
clear water have been expanding their ranges into the Missouri River and its plains
tributaries (Hesse 1987; Pflieger and Grace 1987; Galat et al. 1996). For example, the
bullhead minnow, a small species characteristic of the much clearer Mississippi River,
has become abundant in the Missouri River and its plains tributaries in the last 10 years
(MDC fish community database, unpublished). This could be part of the explanation for
the pattern of expansion in the southern and western plains. However, the Missouri River
still seems a formidable barrier to small Ozark species (see Table 7). Furthermore, the

61
area of expansion also includes the western Osage River, which is disconnected from the
Missouri River by two large dams. Seven Ozark species have expanded in the western
Osage basin: central stoneroller, creek chub, northern orangethroat darter, Ozark
logperch, slenderhead darter, slender madtom, and striped fantail darter. Missouri River
changes probably explain the decline of plains minnow and western silvery minnow and,
possibly, silver chub.
The pattern of decline in the northern Ozarks might also be attributable to the
major changes in habitat and fauna in the Missouri River. However, most of the northern
Ozarks was not directly connected to the Missouri River. In the 1940s, the Osage River
tributaries were disconnected from the Missouri River by Bagenal Dam. The Meramec
River drains to the Mississippi River, and the Spring River drains to the Arkansas River.
Three small, plains species (ghost shiner, red shiner, sand shiner) increased in distribution
in the Missouri River from the 1940s to the 1990s (Pflieger and Grace 1987), opposite of
the pattern found in the northern Ozarks.
Another explanation is drought. Water levels were extremely low in the 1930s for
at least eight years before the sampling was done (Figure 13). This could explain the
phenomenon of plains species widespread in the northern Ozarks if water temperatures
were higher due to less spring influence. In Kansas, the drought caused complete fish
kills in many streams and, in Missouri, six rescue crews were employed to salvage fish
from shrinking pools (James 1934). One might expect that Ozark species at the edge of
their range in the southern and western plains would be more susceptible to this type of
disturbance than plains species. At the time that Harry sampled, the aquatic community
might not have fully recovered from the disturbance. This could explain the expansion of
62
Ozark species into the southern and western plains.
Lastly, a variety of human activities could have produced geomorphic conditions
that extended Ozark-like stream conditions into the plains. Examples include channel
downcutting from enhanced runoff and headcuts from gravel mining and channelization.
The overlying fine sediments could have been removed, leaving bedrock and large rocks
that are not easily moved, and making better habitat for Ozark species. Forests more
characteristic of the Ozarks increased in area in the plains of Missouri over the 20th
century (e.g., Hrabik 1992) and may have made streams more Ozark-like. Compaction of
soils by intensive livestock grazing and establishment of fescue monocultures has
decreased infiltration, drying up headwater streams in the plains, possibly making them
more like headwater Ozark streams.
The findings of the present study were similar to those of King (1973) in Boone
County, Iowa between 1947 and 1972, but dissimilar to those of Larimore and Bayley
(1996) in Champaign County, Illinois between 1928 and 1988. The four species that King
(1973) noted as expanding also expanded in the present study in the region bordering
Iowa. The other common species he analyzed showed no change. As for Larimore and
Bayley (1996) and the present study, six species expanded in both studies, nine species
expanded in one study and declined in the other, and five species declined in both studies.
The results reported here represent two snapshots in time in a particular region. A
sample size of two in a time series does not allow one to differentiate between trends and
temporary changes. If something like drought is responsible for some of the patterns, then
these results show that large shifts in range for many species can occur in a relatively
short time.

63
Except for the White River basin, the rest of the state did not show as strong a
pattern. For example, 13 species declined from the east plains and 12 species expanded,
and five species declined from the north plains and five species expanded. The types of
species that changed in these two regions were mostly the same plains species that
changed in the south and west plains. A possible pattern can be seen in the seven, mostly
clear-ditch, species that declined from the lowlands (no species expanded into the
lowlands). This decline seems to have been concentrated in the western part of the
Bootheel of Missouri. The eastern Bootheel has a stronger groundwater influence from
the Mississippi River, creating more clear-ditch habitat. This type habitat may have
declined in the west.
Conservation Status of Species
Progress in listing species at the state level should tend toward greater objectivity.
This includes logical criteria based on stronger theory, better data, and clearer
documentation. The biggest obstacle is that there are many species and not enough
resources for adequate research. I have applied here a simplification of the IUCN criteria
based on presence/absence in community samples. The Missouri Species of Conservation
Concern Checklist (Missouri Natural Heritage Program 2003) is based on an element
state ranking database that contains the documentation for the criteria used to list a
species. These criteria are similar to the IUCN criteria, such as the estimated number of
element occurrences, abundance, range, and trend. There are also comments on each of
these and additional information such as degree of protection and types of threats. In my
experience, these data are used more for reference than as thresholds. The main source

64
for making listing recommendations is consensus of expert opinion. Although the criteria
are documented, the discussion made in the process of getting to consensus is not.
Implementation of the IUCN criteria, even partially or in a simplified form as in this
study, can provide two avenues for greater objectivity. First, implementation of the IUCN
criteria would move the listing procedure towards more reliance on the data and less on
expert opinion. This would make the listing procedure more defensible and easier to
improve. It would provide clearer goals for recovery of a species. Second, the
combination of criteria into thresholds based on population biology theory would seem to
be an improvement over giving all criteria equal and independent weight.
As far as specific recommendations, the IUCN recommends not downlisting a
species until another survey at least five years later corroborates the downlisting
recommendation. Therefore, the four state-endangered species that did not meet the
modified IUCN criteria, crystal darter, swamp darter, harlequin darter, and Niangua
darter, should not be immediately downlisted. The three unlisted species that met the
modified IUCN criteria, Arkansas saddled darter, Current River saddled darter, and weed
shiner, should be listed.
The IUCN criteria evidently do not encompass the range of the element state
ranking criteria. The IUCN does provide another category of threat, near threatened,
which they define as “close to qualifying for or is likely to qualify for a threatened
category in the near future.” This category seems to encompass the state ranks of S2
(imperiled) through S4 (of long-term concern) and S? (status unknown).
There is, of course, plenty of room for improvement in how the community
samples are made. One big improvement would be to standardize the way the samples are
65
made. This would reduce variability in the criteria estimates.
The simplifications I had to make can all be made more robust. At some time, it
may become feasible to estimate absolute numbers within a certain area; or, if
presence/absence is used, a more precise relationship between distribution and abundance
may be developed. Mature individuals and juveniles could be differentiated. The
estimates of range based on stream order might be improved by including other habitat
measures. Seasonal changes in species distribution, such as spawning migrations or
dispersal of young into habitats where survival is relatively low, may need to be
accounted for (Fausch et al. 2002; M. D. Combes and M. R. Winston, manuscript in
review).
Periodic community samples may be the most cost-effective way to monitor
species, ecosystems, and landscapes (Noss 1987; Kareiva and Wennergren 1995). As
shown in this analysis, community samples can provide data for listing criteria for
individual species. Listing criteria, in turn, are essential for prioritizing management
resources for the preservation of species diversity. Common but economically valuable
species, such as sport fish, are also caught in community samples, allowing monitoring of
the fisheries resource. This analysis also showed that community samples can illuminate
spatial patterns on the landscape. Monitoring these patterns over time can provide
managers with insight into the importance of various natural and anthropogenic
influences on the environment. Finally, ecosystem function and diversity can be
monitored with community samples, although this was not done in the present analysis.
The index of biotic integrity (Karr 1981; Simon 1999), for example, is derived from
community samples and can provide local information on the environment.

66
ACKNOWLEDGMENTS
Bill Pflieger initiated this project in 1992 and began the field work. Sue Bruenderman
finished most of the field work from 1994 to 1996. Many other MDC fisheries biologists
also contributed to the field work. Thanks to Tom Russell, Mike Roell, Bob Hrabik, and
Ron Dent for reviewing the manuscript and making many useful suggestions for
improvement.
LITERATURE CITED
Angermeier, P. L. 1995. Ecological attributes of extinction-prone species: loss of
freshwater fishes of Virginia. Conservation Biology 9:143-158.
Berkman, H. E., and C. F. Rabeni. 1987. Effect of siltation on stream fish communities.
Environmental Biology of Fishes 18:285-294.
Ceas, P. A., and L. M. Page. 1997. Systematic studies of the Etheostoma spectabile
complex (Percidae; subgenus Oligocephalus), with descriptions of four new
species. Copeia 1997:496-522.
Cross, F. B., and J. T. Collins. 1995. Fishes in Kansas. University of Kansas Natural
History Museum, Lawrence, Kansas. 316 pp.
Echelle, A. A., A. F. Echelle, M. H. Smith, and L. G. Hill. 1975. Analysis of genic
continuity in a headwater fish, Etheostoma radiosum (Percidae). Copeia 1975:197-
204.
Eisenhour, D. J. 1999. Systematics of Macrhybopsis tetranema (Cypriniformes:
Cyprinidae). Copeia 1999:969-980.
Fausch, K. D., C. E. Torgersen, C. V. Baxter, and H. W. Li. 2002. Landscapes to

67
riverscapes: bridging the gap between research and conservation of stream fishes.
BioScience 52(6):483-498.
Galat, D. L., J. W. Robinson, and L. W. Hesse. 1996. Restoring aquatic resources to the
lower Missouri River: issues and initiatives. Pages 192-237 in R. A. Schoettger, ed.
Problems of aquatic toxicology, biotesting and water quality management. U.S.
Environmental Protection Agency, Research Triangle Park, North Carolina.
Gardenfors, U., C. Hilton-Taylor, G. M. Mace, and J. P. Rodriguez. 2001. The
application of IUCN Red List criteria at regional levels. Conservation Biology
15:1206-1212.
Gaston, K. J. 1996. The multiple forms of the interspecific abundance-distribution
relationship. Oikos 76:211-220.
Hanski, I., and M. Gyllenberg. 1997. Uniting two general patterns in the distribution of
species. Science 275:397-400.
Hellberg, M.E., D.P. Balch, and K. Roy. 2001. Climate-driven range expansion and
morphological evolution in a marine gastropod. Science 292:1707-1709.
Hesse, L. W. 1987. Taming the wild Missouri River: what has it cost? Fisheries 12(2):2-
9.
Hill, K. J., C. D. Thomas, and B. Huntley. 1999. Climate and habitat availability
determine 20th century changes in a butterfly’s range margin. Proceedings of the
Royal Society of London B 266:1197-1206.
Hrabik, R. A. 1992. Fox River watershed inventory and assessment. Missouri Department
of Conservation, Jefferson City (available at:
www.conservation.state.mo.us/fish/watershed/fox).

68
Jackson, D. A. 2002. Ecological impacts of Micropterus introductions: the dark side of
black bass. In: Black bass: ecology, conservation and management (D. Phillip and
M. Ridgway, eds), pp. 221-232. American Fisheries Society, Bethesda, MD.
Jacobson, R. B., and A. T. Primm. 1997. Historical land-use changes and potential effects
on stream disturbance in the Ozark Plateaus, Missouri. U.S. Geological Survey
Water-Supply Paper 2484, U.S. Geological Survey, Denver, Colorado.
James, M. C. 1934. Effect of 1934 drought on fish life. Transactions of the American
Fisheries Society 64:57-62.
Johnson, C. N. 1998. Species extinction and the relationship between distribution and
abundance. Nature 394:272-274.
Kareiva, P., and U. Wennergren. 1995. Connecting landscape patterns to ecosystem and
population processes. Nature 373:299-302.
Karr, J. R. 1981. Assessment of biotic integrity using fish communities. Fisheries
6(6):21-27.
King, L. R. 1973. Comparison of the Distribution of Minnows and Darters Collected in
1947 and 1972 in Boone County, Iowa. Proceedings of the Iowa Academy of
Science 80:133-135.
Larimore, R. W., and P. B. Bayley. 1996. The fishes of Champaign County, Illinois,
during a century of alterations of a prairie ecosystem. Illinois Natural History
Survey Bulletin 35(2):1-183.
Larimore, R. W., and P. W. Smith. 1963. The fishes of Champaign County, Illinois, as
affected by 60 years of stream changes. Illinois Natural History Survey Bulletin
28(2):299-382.
69
Lee, D. S., C. R. Gilbert, C. H. Hocutt, R. E. Jenkins, D. E. McAllister, J. R. Stauffer.
1980. Atlas of North American freshwater fishes. North Carolina State Museum
Natural History, Raleigh.
Mace, G. M. 1994. Classifying threatened species: means and ends. Philosophical
Transactions of the Royal Society of London, Series B 344:91-97.
Mace, G. M., and R. Lande. 1991. Assessing extinction threats: towards a re-evaluation
of IUCN threatened species categories. Conservation Biology 5:148-157.
Mammoliti, C. S. 2002. The effects of small watershed impoundments on native stream
fishes: a focus on Topeka shiner and hornyhead chub. Transactions of the Kansas
Academy of Science 105(3-4):219-231.
Meade, R. H., T. R. Yuzyk, and T. J. Day. 1990. Movement and storage of sediment in
rivers of the United States and Canada. Pages 255-280 in Wolman, M. G., and
Riggs, H. C., eds. The geology of North America, Vol. O-1, surface water
hydrology. Geological Society of America, Boulder, CO.
Menzel, B. W., J. B. Barnum, and L. M. Antosch. 1984. Ecological alterations of Iowa
prairie-agricultural streams. Iowa State Journal of Research 59(1):5-30.
Missouri Natural Heritage Program. 2003. Missouri species and communities of
conservation concern checklist. Missouri Department of Conservation. Jefferson
City, Missouri. xv + 29 pp.
Noss, R. F. 1987. From plant communities to landscapes in conservation inventories: a
look at The Nature Conservancy (USA). Biological Conservation 41:11-37.
Pflieger, W. L. 1989a. Aquatic community classification system for Missouri. Missouri
Department of Conservation, Jefferson City, Missouri, USA. 70 pp.

70
Pflieger, W. L. 1989b. Aquatic community classification system for Missouri,
supplement. Aquatic Series No. 19, Missouri Department of Conservation,
Jefferson City, Missouri.
Pflieger, W. L. 1997. The fishes of Missouri. Missouri Department of Conservation,
Jefferson City. 372 pp.
Pflieger, W. L. and T. B. Grace. 1987. Changes in the fish fauna of the lower Missouri
River, 1940-1983. Pages 166-177 in W. J. Matthews and D. C. Heins, eds.
Community and evolutionary ecology of North American stream fishes. University
of Oklahoma Press, Norman, 310 pp.
Pflieger, W. L., P. S. Haverland, and M. A. Schene, Jr. 1982. Missouri’s system for
storage retrieval and analysis of stream resource data. Acquisition and utilization of
aquatic inventory information. Pages 284-290 in N. B. Armantrout, editor.
Acquisition and utilization of aquatic habitat inventory information: proceedings of
a symposium. American Fisheries Society, Bethesda, Maryland.
Rabeni, C. F., and M. A. Smale. 1995. Effects of siltation on stream fishes and the
potential mitigating role of the buffering riparian zone. Hydrobiologia 303:211-
219.
Rafferty, M. D. 1980. The Ozark lumber industry: development and geography. Pages
173-190 in: The Ozarks: Land and Life. University of Oklahoma Press, Norman.
Robins, C. R., R. M. Bailey, C. E. Bond, J. R. Brooker, E. A. Lachner, R. N. Lea, and W.
B. Scott. 1991. A list of common and scientific names of fishes from the United
States and Canada (fifth edition). American Fisheries Society Special Publication,
20:1-183.

71
Schrank, S. J., C. S. Guy, M. R. Whiles, and B. L. Brock. 2001. Influence of instream and
landscape-level factors on the distribution of Topeka shiners Notropis topeka in
Kansas streams. Copeia 2001(2):413-421.
Scott, M. C., and G. S. Helfman. 2001. Native invasions, homogenization, and the
mismeasure of integrity of fish assemblages. Fisheries 26(11):6-15.
Shaffer, M. L., and B. A. Stein. 2000. Safeguarding our precious heritage. Pages 301-321
in Precious heritage: the status of biodiversity in the United States. Oxford
University Press, New York, New York.
Simon, T. P. (editor). 1999. Assessing the sustainability and biological integrity of water
resources using fish communities. CRC Press, Boca Raton, FL.
Sokal, R. R. and F. J. Rohlf. 1981. Biometry, second edition. W. H. Freeman and Co.,
New York, 858 pp.
Switzer, J. F., and R. M. Wood. 2002. Molecular systematics and historical biogeography
of the Missouri saddled darter Etheostoma tetrazonum (Actinopterygii: Percidae).
Copeia 2002:450-455.
Whittier, T. R., D. B. Halliwell, and S. G. Paulsen. 1997. Cyprinid distributions in
northeast U.S.A. lakes: evidence of regional-scale minnow biodiversity losses.
Canadian Journal of Fisheries and Aquatic Sciences 54:1593-1607.
Winston, M. R. 2002. Spatial and temporal species associations with the Topeka shiner
(Notropis topeka) in Missouri. Journal of Freshwater Ecology 17:249-261.
Wood, C. M., and D. G. McDonald (editors). 1997. Global warming: implications for
freshwater and marine fish. Cambridge University Press, Cambridge, UK.

72
APPENDIX
Appendix Table 1. Species traits used in this analysis. Number of basins = number of 8-digit hydrological units in which a species was ever collected according to the MDC fish community database. Trophic type = trophic level or feeding group (FF=filter feeder, BI=benthic invertivore, O=omnivore, H=herbivore, GI=general invertivore, IP=invertivore/piscivore [Berkman and Rabeni 1987; Rabeni and Smale 1995; Pflieger 1997]). Spawning substrate = substrate on which species spawns or reproductive group (SL=simple-lithophilous, SM=simple miscellaneous, CPC=complex-parental care, CNPC=complex-no parental care [Berkman and Rabeni 1987; Rabeni and Smale 1995; Pflieger 1997]). Range edge = range edge in Missouri not defined by a drainage boundary (N, S, E, W, NW, NE, SW, SE [Lee et al. 1980; Pflieger 1997]). Region type = region for which species is most characteristic (lowland, Ozark, prairie, river [Pflieger 1989]). Stream type = characteristic stream type in its most characteristic region (prairie headwater, prairie creek, prairie small river, prairie large river, Ozark headwater, Ozark creek, Ozark small river, Ozark large river, lowland large natural, lowland small natural, lowland clear ditch, lowland muddy ditch, lowland standing, river lower Mississippi, river upper Mississippi, river Missouri [Pflieger 1989]). Number Trophic Spawning Range Region Stream of basins Family type substrate edge type type Alabama shad 6 Clupeidae GI SL N Ozark large river Arkansas darter 1 Percidae BI SL Ozark headwater Arkansas River orangethroat darter 25 Percidae BI SL Ozark headwater Arkansas saddled darter 2 Percidae BI SL Ozark large river Banded darter 9 Percidae BI SM Ozark small river Banded fantail darter 22 Percidae BI C-PC Ozark creek Banded pigmy sunfish 5 Elassomatidae GI SM NW lowland standing Banded sculpin 12 Cottidae BI C-PC Ozark small river Bantam sunfish 2 Centrarchidae GI C-PC N lowland standing Bigeye chub 7 Cyprinidae BI SL NW Ozark large river Bigeye shiner 18 Cyprinidae GI SL NW Ozark small river Bigmouth shiner 25 Cyprinidae O SL S plains creek Blacknose shiner 6 Cyprinidae BI SL S plains creek Blackside darter 14 Percidae BI SL plains small river Blackspotted topminnow 15 Fundulidae GI SM N Ozark creek Blackstripe topminnow 22 Fundulidae GI SM plains creek Blacktail shiner 9 Cyprinidae GI SM N lowland large natural Bleeding shiner 9 Cyprinidae GI C-NPC N Ozark small river Bluegill 34 Centrarchidae GI C-PC lowland standing Bluestripe darter 2 Percidae BI SL Ozark small river Bluntface shiner 1 Cyprinidae GI SM Ozark large river Bluntnose darter 15 Percidae BI SM NW lowland clear ditch Bluntnose minnow 30 Cyprinidae O C-PC Ozark large river Brassy minnow 4 Cyprinidae H SM S plains creek Brindled madtom 5 Ictaluridae BI C-PC NW Ozark small river Brook darter 1 Percidae BI SL Ozark headwater Brook silverside 25 Atherinidae GI SM Ozark large river Bullhead minnow 17 Cyprinidae O C-PC lowland large natural Cardinal shiner 1 Cyprinidae GI C-NPC Ozark small river Central mudminnow 2 Umbridae BI SM SW plains headwater Central stoneroller 31 Cyprinidae H SL Ozark headwater Checkered madtom 2 Ictaluridae BI C-PC Ozark small river Channel darter 1 Percidae BI SL NW plains small river Common shiner 9 Cyprinidae GI C-NPC S plains creek Creek chub 31 Cyprinidae IP C-NPC plains headwater Creek chubsucker 7 Catastomidae O SL NW Ozark headwater Crystal darter 5 Percidae BI SL W Ozark large river Current darter 1 Percidae BI SL Ozark headwater Current River saddled darter 2 Percidae BI SL Ozark large river Cypress darter 6 Percidae BI SM N lowland standing Cypress minnow 3 Cyprinidae H SM N lowland large natural Dollar sunfish 2 Centrarchidae GI C-PC N lowland small natural Dusky darter 6 Percidae BI SL NW lowland turbid ditch Duskystripe shiner 1 Cyprinidae GI C-NPC Ozark creek Eastern redfin shiner 25 Cyprinidae GI C-NPC Ozark creek Eastern slim minnow 5 Cyprinidae O C-PC NW Ozark large river Emerald shiner 33 Cyprinidae GI SM river lower MS Fathead minnow 32 Cyprinidae O C-PC plains headwater Flier 6 Centrarchidae GI C-PC NW lowland standing Freckled madtom 16 Ictaluridae BI C-PC NW lowland large natural

73
Appendix Table 1 (continued). Species traits used in this analysis. Number of basins = number of 8-digit hydrological units in which a species was ever collected according to the MDC fish community database. Trophic type = trophic level or feeding group (FF=filter feeder, BI=benthic invertivore, O=omnivore, H=herbivore, GI=general invertivore, IP=invertivore/piscivore [Berkman and Rabeni 1987; Rabeni and Smale 1995; Pflieger 1997]). Spawning substrate = substrate on which species spawns or reproductive group (SL=simple-lithophilous, SM=simple miscellaneous, CPC=complex-parental care, CNPC=complex-no parental care [Berkman and Rabeni 1987; Rabeni and Smale 1995; Pflieger 1997]). Range edge = range edge in Missouri not defined by a drainage boundary (N, S, E, W, NW, NE, SW, SE [Lee et al. 1980; Pflieger 1997]). Region type = region for which species is most characteristic (lowland, Ozark, prairie, river [Pflieger 1989]). Stream type = characteristic stream type in its most characteristic region (prairie headwater, prairie creek, prairie small river, prairie large river, Ozark headwater, Ozark creek, Ozark small river, Ozark large river, lowland large natural, lowland small natural, lowland clear ditch, lowland muddy ditch, lowland standing, river lower Mississippi, river upper Mississippi, river Missouri [Pflieger 1989]). Number Trophic Spawning Range Region Stream of basins Family type substrate edge type type Ghost shiner 19 Cyprinidae GI SM river lower MS Gilt darter 6 Percidae BI SL W Ozark large river Golden shiner 31 Cyprinidae O SM plains headwater Golden topminnow 1 Fundulidae GI SM N lowland clear ditch Goldstripe darter 2 Percidae BI SM N lowland small natural Gravel chub 10 Cyprinidae BI SL Ozark large river Greenside darter 12 Percidae BI SM NW Ozark small river Green sunfish 35 Centrarchidae GI C-PC plains headwater Harlequin darter 5 Percidae BI SM NW lowland large natural Hornyhead chub 15 Cyprinidae O C-NPC Ozark small river Ironcolor shiner 3 Cyprinidae GI SM W lowland clear ditch Johnny darter 26 Percidae BI C-PC plains creek Lake chubsucker 5 Catastomidae O SM NW lowland clear ditch Largescale stoneroller 15 Cyprinidae H SL Ozark small river Least darter 6 Percidae BI SM Ozark headwater Longear sunfish 19 Centrarchidae GI C-PC Ozark small river Longnose darter 2 Percidae BI SL Ozark large river Meramec River saddled darter 4 Percidae BI SL Ozark large river Mimic shiner 12 Cyprinidae GI SM lowland large natural Mississippi silvery minnow 17 Cyprinidae H SM W lowland large natural Missouri saddled darter 4 Percidae BI SL Ozark large river Mottled sculpin 6 Cottidae BI C-PC Ozark creek Mountain madtom 2 Ictaluridae BI C-PC NW Ozark large river Mud darter 10 Percidae BI SM W lowland clear ditch Neosho madtom 1 Ictaluridae BI C-PC NE Ozark large river Niangua darter 1 Percidae BI SL Ozark small river Northern logperch 26 Percidae BI SL river upper MS Northern orangethroat darter 25 Percidae BI SL Ozark headwater Northern studfish 15 Fundulidae GI SM N Ozark small river Ohio logperch 26 Percidae BI SL Ozark large river Orangespotted sunfish 33 Centrarchidae GI C-PC plains small river Ozark chub 3 Cyprinidae BI SL Ozark large river Ozark logperch 26 Percidae BI SL Ozark large river Ozark madtom 3 Ictaluridae BI C-PC Ozark small river Ozark minnow 13 Cyprinidae O C-NPC W Ozark creek Ozark sculpin 9 Cottidae BI C-PC Ozark creek Ozark shiner 3 Cyprinidae BI SL Ozark large river Pallid shiner 7 Cyprinidae BI SM W lowland large natural Peppered chub 13 Cyprinidae BI SM river lower MS Pirate perch 9 Aphredoderidae GI SM W lowland clear ditch Plains killifish 5 Fundulidae O SL E plains creek Plains minnow 16 Cyprinidae H SM E river Missouri Plains orangethroat darter 25 Percidae BI SL plains headwater Plains topminnow 7 Fundulidae GI SM E Ozark headwater Pugnose minnow 9 Cyprinidae GI C-PC NW lowland standing Rainbow darter 11 Percidae BI SL Ozark creek Redear sunfish 9 Centrarchidae GI C-PC N Ozark large river Redfin darter 1 Percidae BI SM N plains small river Red shiner 31 Cyprinidae GI SM plains large river Redspot chub 1 Cyprinidae O C-NPC Ozark small river Redspotted sunfish 7 Centrarchidae GI C-PC NW lowland clear ditch Ribbon shiner 6 Cyprinidae GI C-NPC NW lowland clear ditch River darter 11 Percidae BI SL river middle MS Rosyface shiner 14 Cyprinidae GI C-NPC Ozark large river

74
Appendix Table 1. Species traits used in this analysis. Number of basins = number of 8-digit hydrological units in which a species was ever collected according to the MDC fish community database. Trophic type = trophic level or feeding group (FF=filter feeder, BI=benthic invertivore, O=omnivore, H=herbivore, GI=general invertivore, IP=invertivore/piscivore [Berkman and Rabeni 1987; Rabeni and Smale 1995; Pflieger 1997]). Spawning substrate = substrate on which species spawns or reproductive group (SL=simple-lithophilous, SM=simple miscellaneous, CPC=complex-parental care, CNPC=complex-no parental care [Berkman and Rabeni 1987; Rabeni and Smale 1995; Pflieger 1997]). Range edge = range edge in Missouri not defined by a drainage boundary (N, S, E, W, NW, NE, SW, SE [Lee et al. 1980; Pflieger 1997]). Region type = region for which species is most characteristic (lowland, Ozark, prairie, river [Pflieger 1989]). Stream type = characteristic stream type in its most characteristic region (prairie headwater, prairie creek, prairie small river, prairie large river, Ozark headwater, Ozark creek, Ozark small river, Ozark large river, lowland large natural, lowland small natural, lowland clear ditch, lowland muddy ditch, lowland standing, river lower Mississippi, river upper Mississippi, river Missouri [Pflieger 1989]). Number Trophic Spawning Range Region Stream of basins Family type substrate edge type type Sabine shiner 1 Cyprinidae O SM N lowland large natural Saddleback darter 5 Percidae BI SL lowland turbid ditch Sand shiner 27 Cyprinidae O SL SE plains small river Scaly sand darter 4 Percidae BI SL N lowland large natural Silver chub 26 Cyprinidae BI SM river lower MS Silverjaw minnow 5 Cyprinidae BI SL W Ozark creek Slenderhead darter 19 Percidae BI SL plains large river Slender madtom 19 Ictaluridae BI C-PC Ozark creek Slough darter 10 Percidae BI SM NW lowland clear ditch Southern redbelly dace 17 Cyprinidae O C-NPC Ozark headwater Speckled darter 6 Percidae BI SL Ozark small river Spotfin shiner 9 Cyprinidae GI SM Ozark large river Spring cavefish 1 Amblyopsidae GI C-PC NW lowland standing Starhead topminnow 4 Fundulidae GI SM W lowland standing Steelcolor shiner 7 Cyprinidae GI SM NW Ozark large river Stargazing darter 1 Percidae BI SL NW Ozark large river Stippled darter 9 Percidae BI SL N Ozark headwater Stonecat 18 Ictaluridae BI C-PC S plains large river Striped fantail darter 22 Percidae BI C-PC Ozark creek Striped shiner 18 Cyprinidae GI C-NPC NW Ozark creek Suckermouth minnow 32 Cyprinidae BI SL plains small river Swamp darter 1 Percidae BI SM N lowland turbid ditch Tadpole madtom 22 Ictaluridae BI C-PC lowland clear ditch Taillight shiner 3 Cyprinidae O SM NW lowland turbid ditch Telescope shiner 4 Cyprinidae GI SL NW Ozark creek Topeka shiner 7 Cyprinidae BI C-NPC SE plains creek Trout-perch 10 Percopsidae BI SM S plains small river Warmouth 18 Centrarchidae GI C-PC lowland standing Wedgespot shiner 8 Cyprinidae BI SL N Ozark large river Weed shiner 5 Cyprinidae GI SM W lowland clear ditch Western mosquitofish 32 Poecilliidae GI C-PC N lowland standing Western redfin shiner 25 Cyprinidae GI C-NPC plains creek Western sand darter 6 Percidae BI SL river upper MS Western silvery minnow 14 Cyprinidae H SM SE river Missouri Western slim minnow 5 Cyprinidae O C-PC NE Ozark large river White River fantail darter 22 Percidae BI C-PC Ozark creek White River orangethroat darter 25 Percidae BI SL Ozark headwater Whitetail shiner 3 Cyprinidae GI SM NW Ozark large river Yoke darter 1 Percidae BI SL Ozark small river

75
Appendix Figure 1. Arkansas River orangethroat darter (Etheostoma spectabile
squamosum).

76
Appendix Figure 2. Banded darter (Etheostoma zonale).

77
Appendix Figure 3. Banded sculpin (Cottus carolinae).

78
Appendix Figure 4. Bigeye chub (Notropis amblops).

79
Appendix Figure 5. Bigeye shiner (Notropis boops).

80
Appendix Figure 6. Bigmouth shiner (Notropis dorsalis).

81
Appendix Figure 7. Blacknose shiner (Notropis heterolepis).

82
Appendix Figure 8. Blackside darter. (Percina maculata).

83
Appendix Figure 9. Blackspotted topminnow (Fundulus olivaceus).

84
Appendix Figure 10. Blackstripe topminnow (Fundulus notatus).
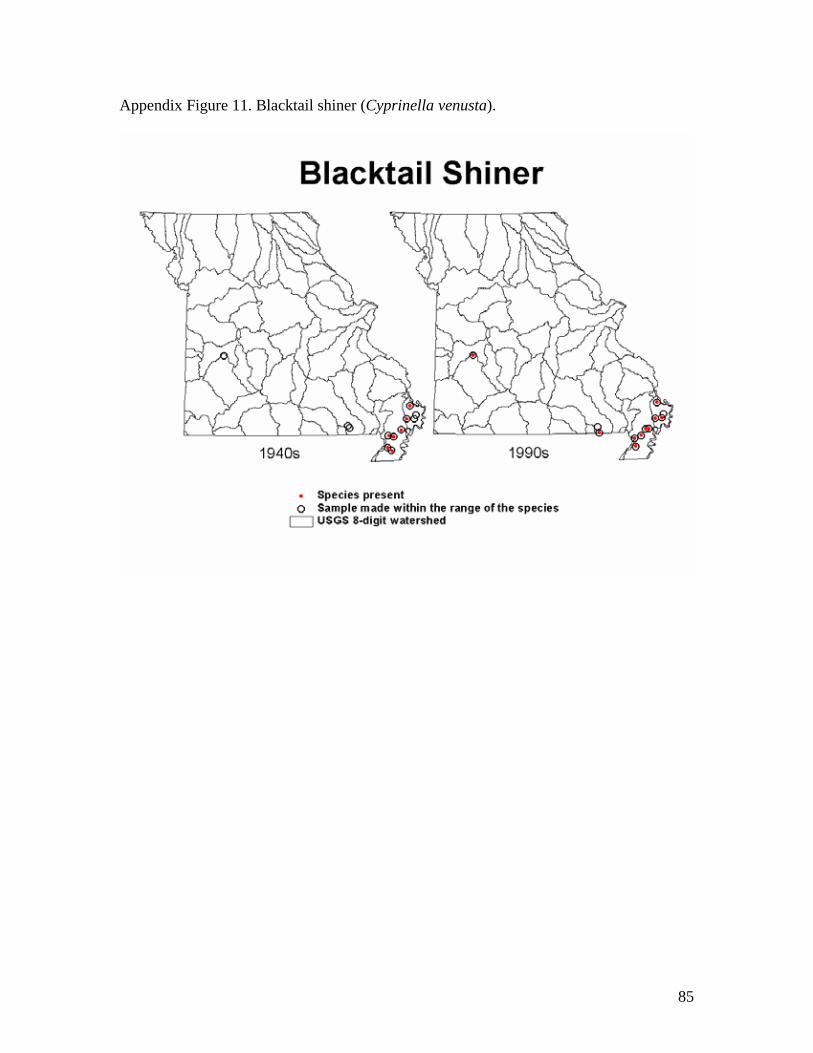
85
Appendix Figure 11. Blacktail shiner (Cyprinella venusta).

86
Appendix Figure 12. Bleeding shiner (Luxilus zonatus).

87
Appendix Figure 13. Bluegill (Lepomis macrochirus).

88
Appendix Figure 14. Bluestripe darter (Percina cymatotaenia).

89
Appendix Figure 15. Bluntface shiner (Cyprinella camura).

90
Appendix Figure 16. Bluntnose darter (Etheostoma chlorosomum).

91
Appendix Figure 17. Bluntnose minnow (Pimephales notatus).

92
Appendix Figure 18. Brook silverside (Labidesthes sicculus).

93
Appendix Figure 19. Bullhead minnow (Pimephales vigilax).

94
Appendix Figure 20. Cardinal shiner (Luxilus cardinalis).

95
Appendix Figure 21. Central stoneroller (Campostoma anomalum).
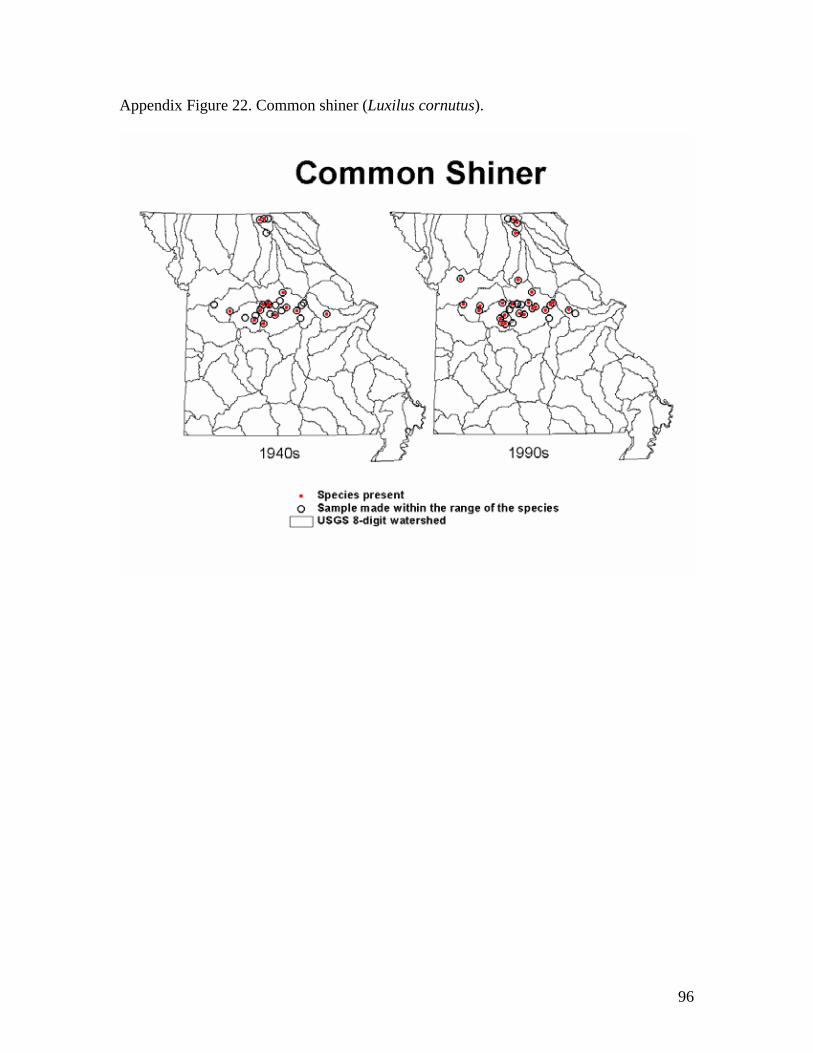
96
Appendix Figure 22. Common shiner (Luxilus cornutus).

97
Appendix Figure 23. Creek chub (Semotilus atromaculatus).

98
Appendix Figure 24. Creek chubsucker (Erimyzon oblongus).
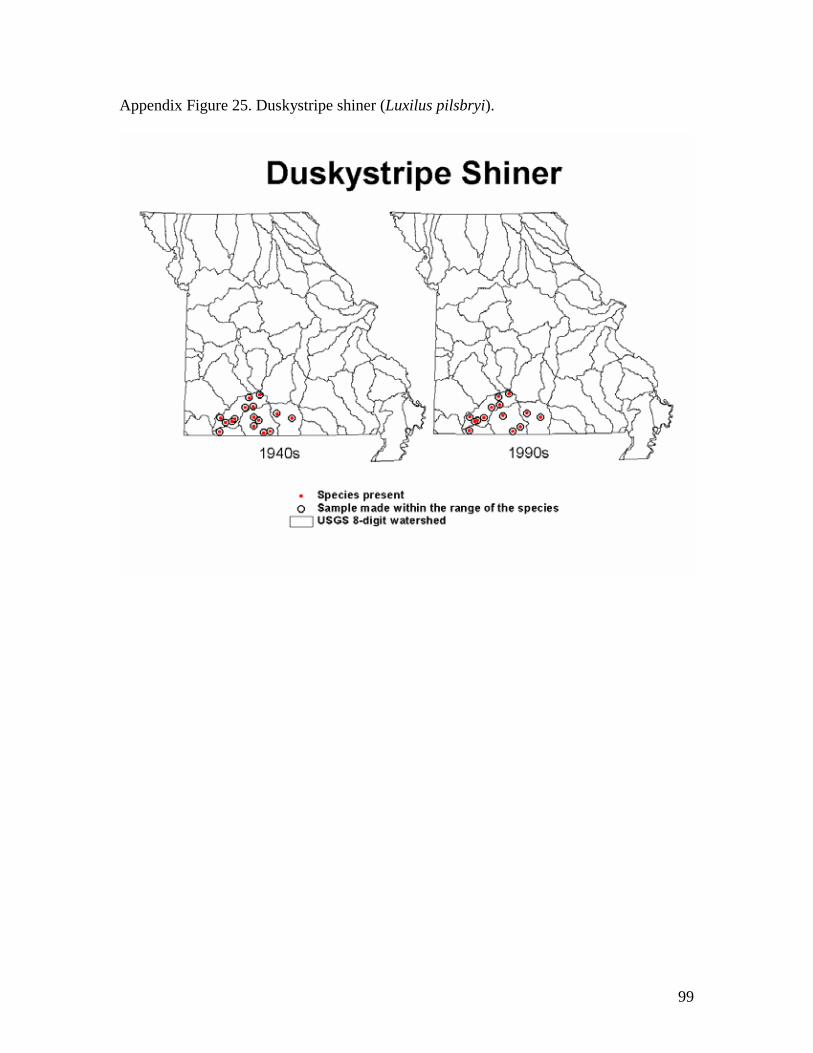
99
Appendix Figure 25. Duskystripe shiner (Luxilus pilsbryi).

100
Appendix Figure 26. Eastern redfin shiner (Lythrurus umbratilis cyanocephalus).

101
Appendix Figure 27. Emerald shiner (Notropis atherinoides).

102
Appendix Figure 28. Fathead minnow (Pimephales promelas).

103
Appendix Figure 29. Freckled madtom (Noturus nocturnus).

104
Appendix Figure 30. Ghost shiner (Notropis buchanani).

105
Appendix Figure 31. Gilt darter (Percina evides).
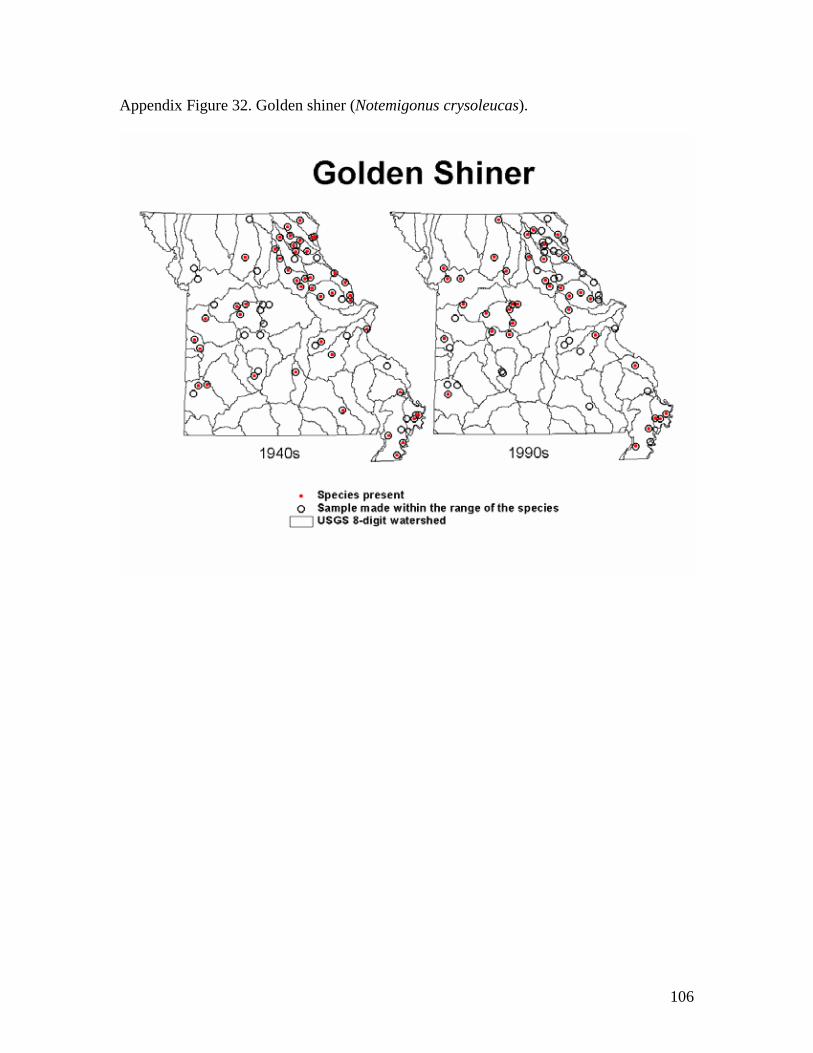
106
Appendix Figure 32. Golden shiner (Notemigonus crysoleucas).

107
Appendix Figure 33. Gravel chub (Erimystax x-punctatus).

108
Appendix Figure 34. Greenside darter (Etheostoma blennioides).

109
Appendix Figure 35. Green sunfish (Lepomis cyanellus).

110
Appendix Figure 36. Hornyhead chub (Nocomis biguttatus).

111
Appendix Figure 37. Johnny darter (Etheostoma nigrum).

112
Appendix Figure 38. Largescale stoneroller (Campostoma oligocephalus).

113
Appendix Figure 39. Longear sunfish (Lepomis megalotis).

114
Appendix Figure 40. Meramec River saddled darter (Etheostoma tetrazonum).

115
Appendix Figure 41. Mimic shiner (Notropis volucellus).

116
Appendix Figure 42. Mississippi silvery minnow (Hybognathus nuchalis).

117
Appendix Figure 43. Missouri saddled darter (Etheostoma tetrazonum).

118
Appendix Figure 44. Mottled sculpin/Ozark sculpin (Cottus bairdi/Cottus hypselurus).

119
Appendix Figure 45. Northern logperch (Percina caprodes semifasciata).

120
Appendix Figure 46. Northern orangethroat darter (Etheostoma spectabile spectabile).

121
Appendix Figure 47. Northern studfish (Fundulus catenatus).

122
Appendix Figure 48. Ohio logperch (Percina caprodes caprodes).
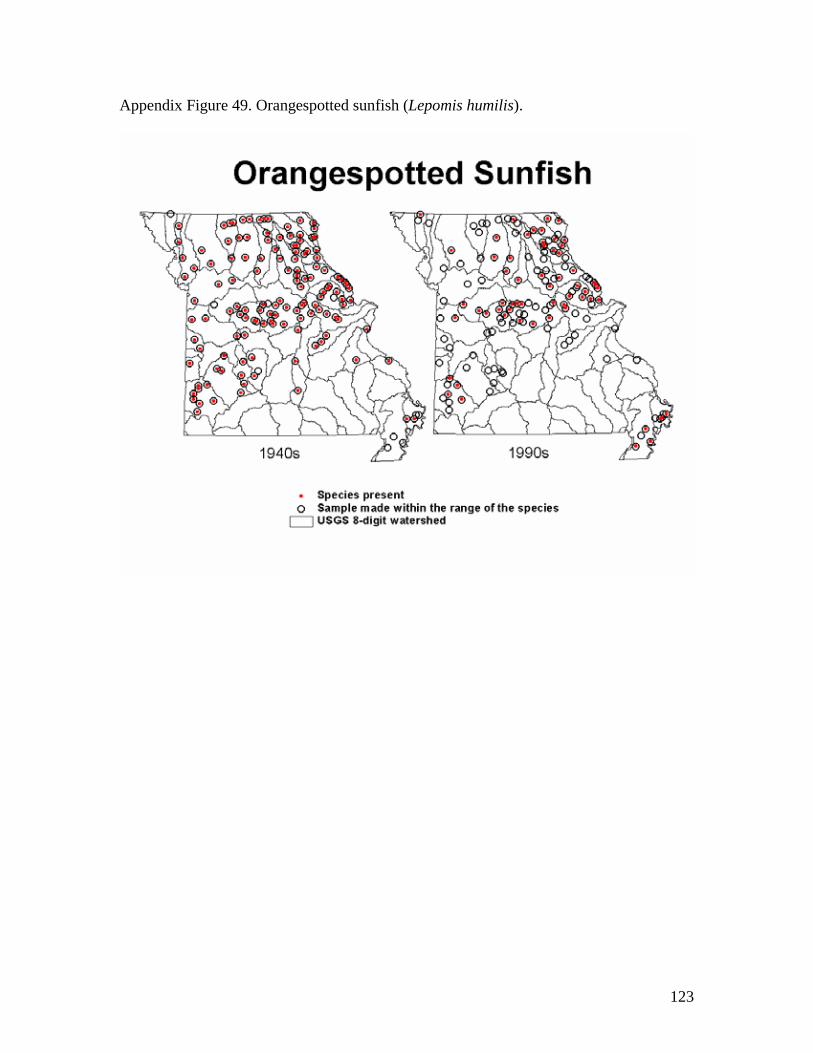
123
Appendix Figure 49. Orangespotted sunfish (Lepomis humilis).

124
Appendix Figure 50. Ozark chub (Erimystax harryi).

125
Appendix Figure 51. Ozark logperch (Percina caprodes fulvitaenia).

126
Appendix Figure 52. Ozark madtom (Noturus albater).

127
Appendix Figure 53. Ozark minnow (Notropis nubilus).

128
Appendix Figure 54. Ozark shiner (Notropis ozarcanus).

129
Appendix Figure 55. Pallid shiner (Notropis amnis).

130
Appendix Figure 56. Peppered chub (Macrhybopsis tetranema).

131
Appendix Figure 57. Plains minnow (Hybognathus placitus).
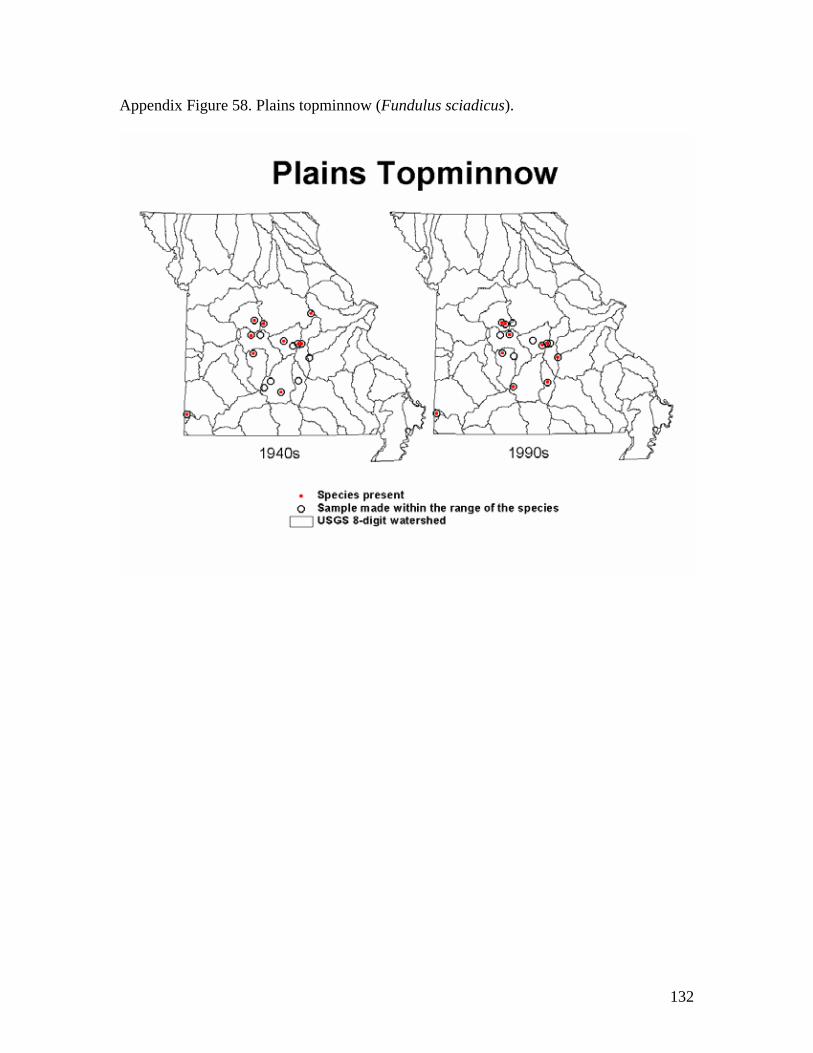
132
Appendix Figure 58. Plains topminnow (Fundulus sciadicus).

133
Appendix Figure 59. Pugnose minnow (Opsopoeodus emiliae).
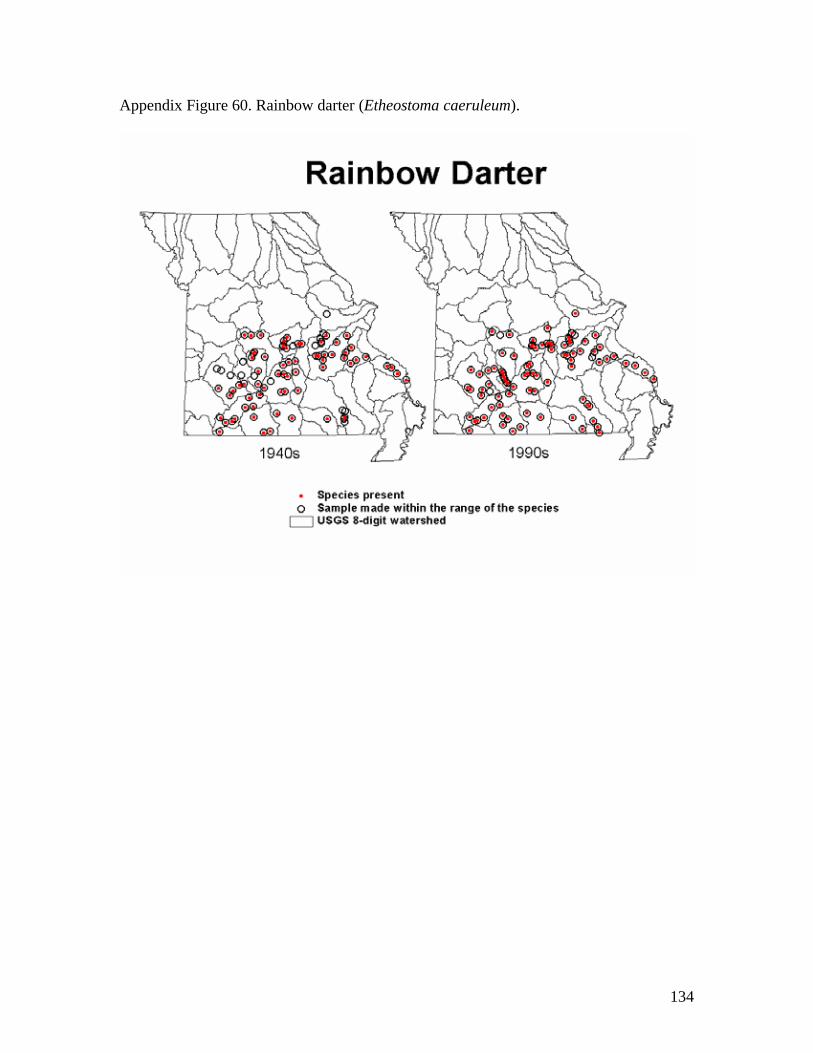
134
Appendix Figure 60. Rainbow darter (Etheostoma caeruleum).

135
Appendix Figure 61. Red shiner (Cyprinella lutrensis).
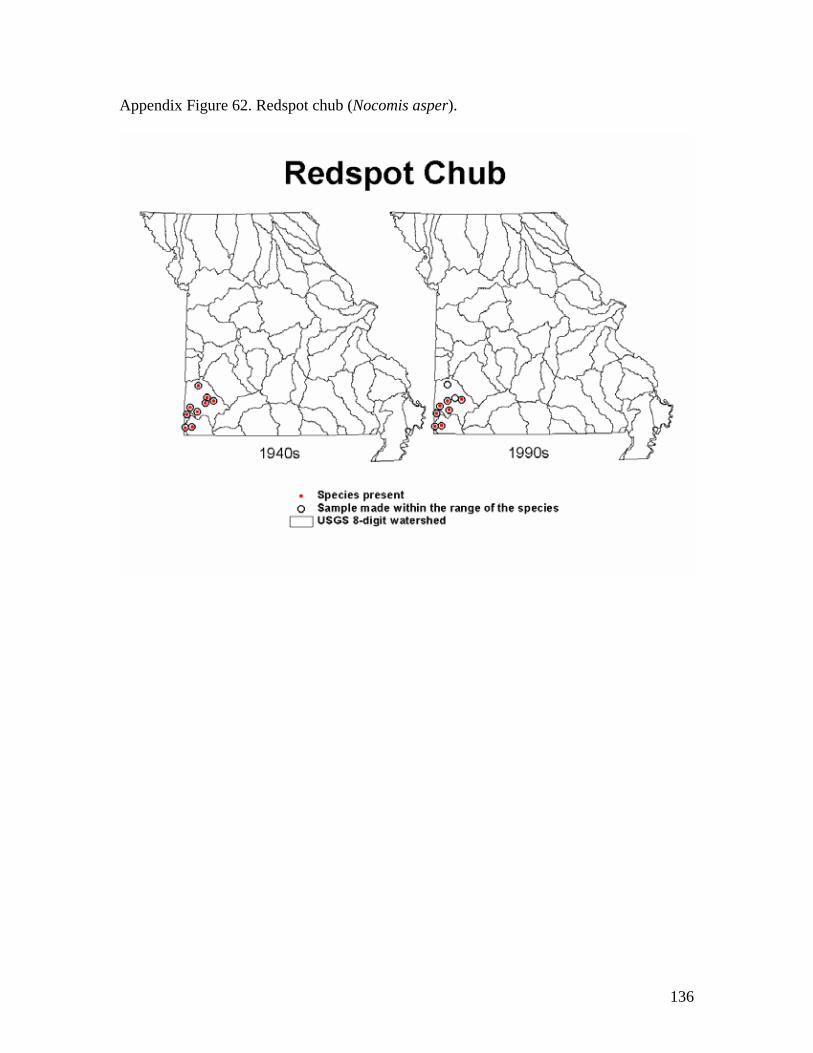
136
Appendix Figure 62. Redspot chub (Nocomis asper).
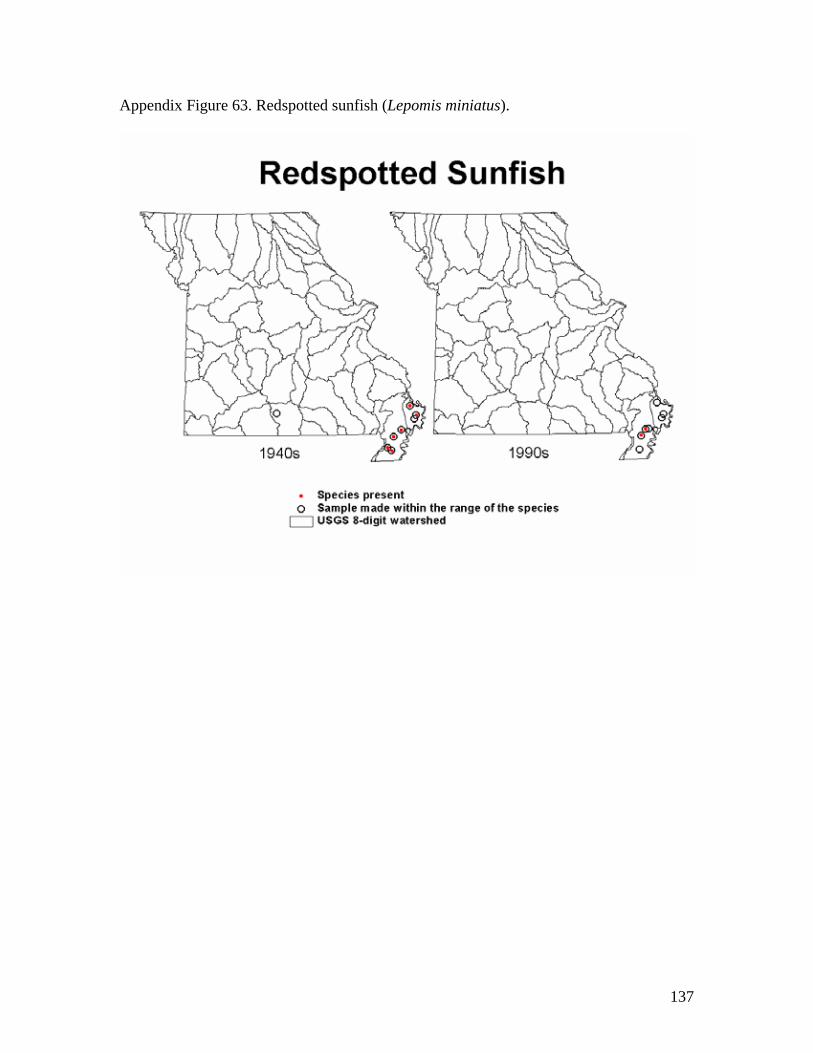
137
Appendix Figure 63. Redspotted sunfish (Lepomis miniatus).

138
Appendix Figure 64. Ribbon shiner (Lythrurus fumeus).

139
Appendix Figure 65. Rosyface shiner (Notropis rubellus).

140
Appendix Figure 66. Sand shiner (Notropis ludibundus).

141
Appendix Figure 67. Silver chub (Macrhybopsis storeriana).

142
Appendix Figure 68. Slenderhead darter (Percina phoxocephala).

143
Appendix Figure 69. Slender madtom (Noturus exilis).
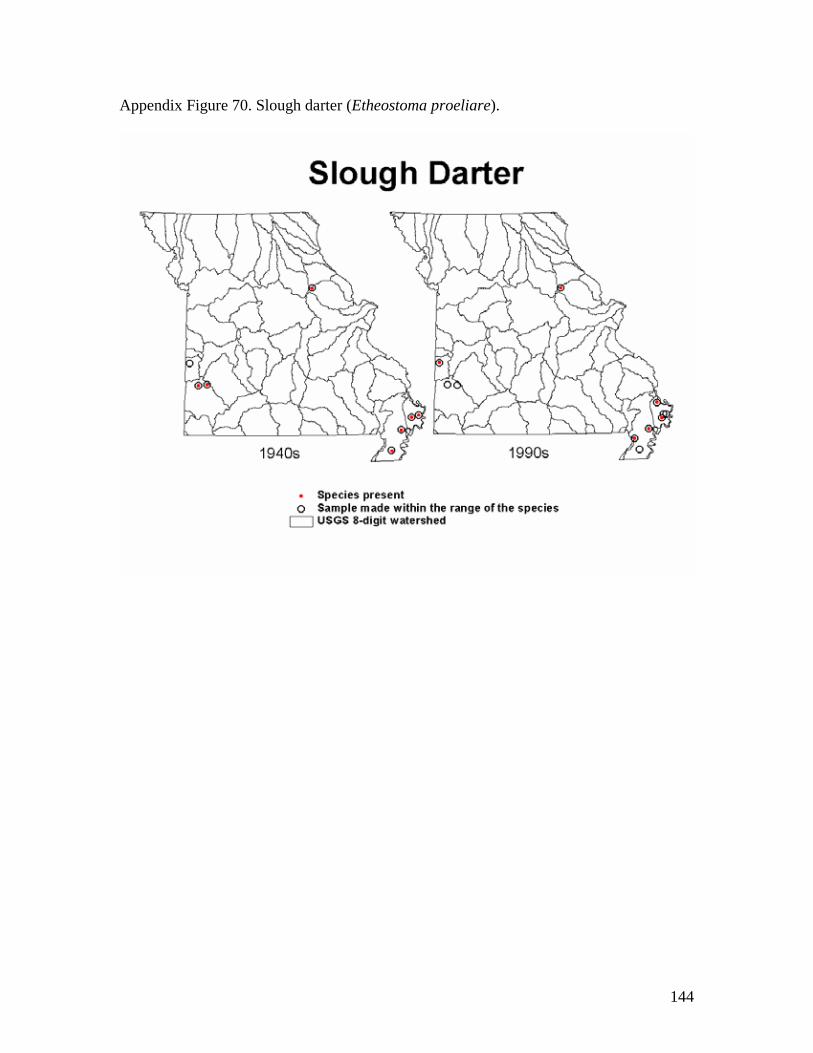
144
Appendix Figure 70. Slough darter (Etheostoma proeliare).

145
Appendix Figure 71. Southern redbelly dace (Phoxinus erythrogaster).

146
Appendix Figure 72. Speckled darter (Etheostoma stigmaeum).

147
Appendix Figure 73. Spotfin shiner (Cyprinella spiloptera).
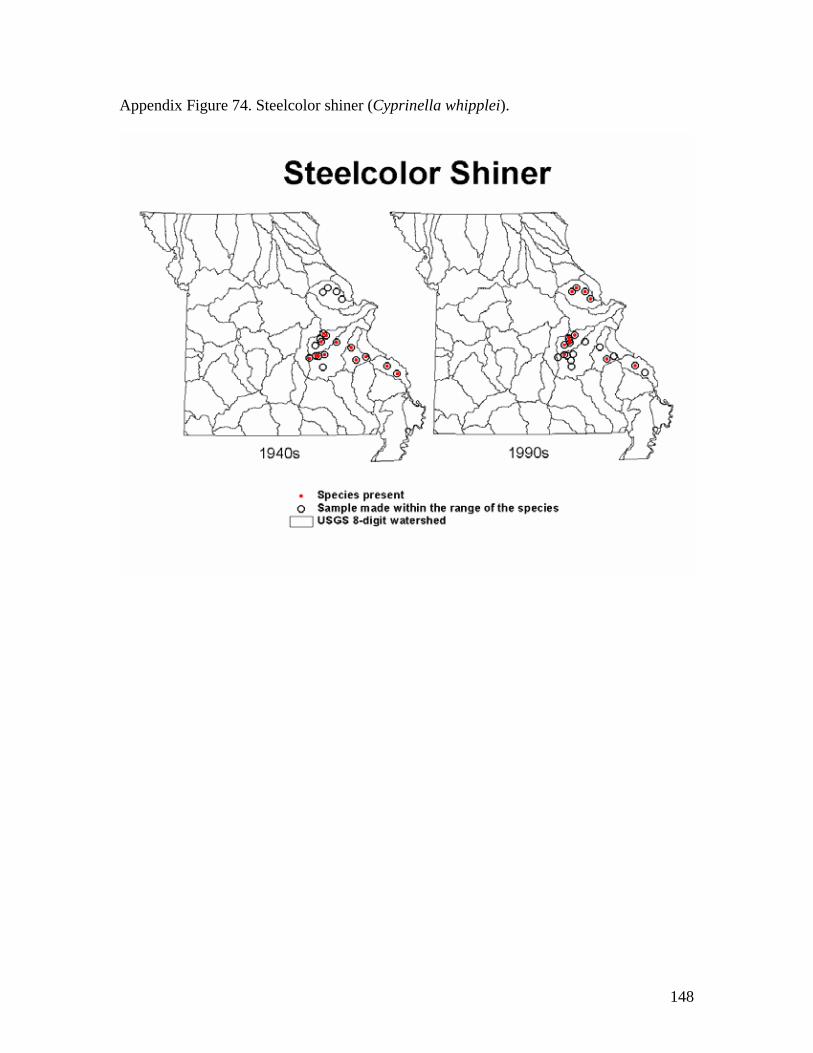
148
Appendix Figure 74. Steelcolor shiner (Cyprinella whipplei).

149
Appendix Figure 75. Stippled darter (Etheostoma punctulatum).

150
Appendix Figure 76. Stonecat (Noturus flavus).

151
Appendix Figure 77. Striped fantail darter (Etheostoma flabellare lineolatum).

152
Appendix Figure 78. Striped shiner (Luxilus chrysocephalus).

153
Appendix Figure 79. Suckermouth minnow (Phenacobius mirabilis).

154
Appendix Figure 80. Tadpole madtom (Noturus gyrinus).

155
Appendix Figure 81. Telescope shiner (Notropis telescopus).

156
Appendix Figure 82. Topeka shiner (Notropis topeka).

157
Appendix Figure 83. Trout-perch (Percopsis omiscomaycus).

158
Appendix Figure 84. Warmouth (Lepomis gulosus).

159
Appendix Figure 85. Wedgespot shiner (Notropis greenei).
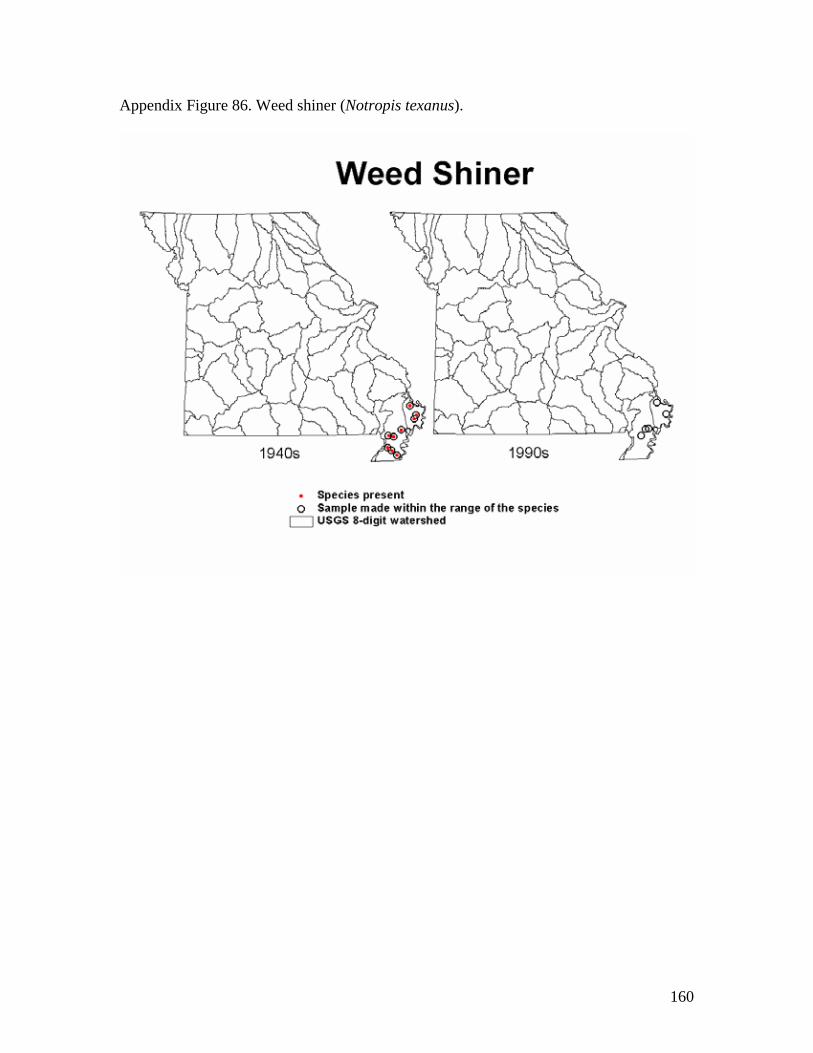
160
Appendix Figure 86. Weed shiner (Notropis texanus).

161
Appendix Figure 87. Western mosquitofish (Gambusia affinis).

162
Appendix Figure 88. Western redfin shiner (Lythrurus umbratilis umbratilis).

163
Appendix Figure 89. White River orangethroat darter (Etheostoma spectabile).

164
Appendix Figure 90. Whitetail shiner (Cyprinella galactura).

165
Appendix Figure 91. Yoke darter (Etheostoma juliae).