Embed Size (px)
Citation preview
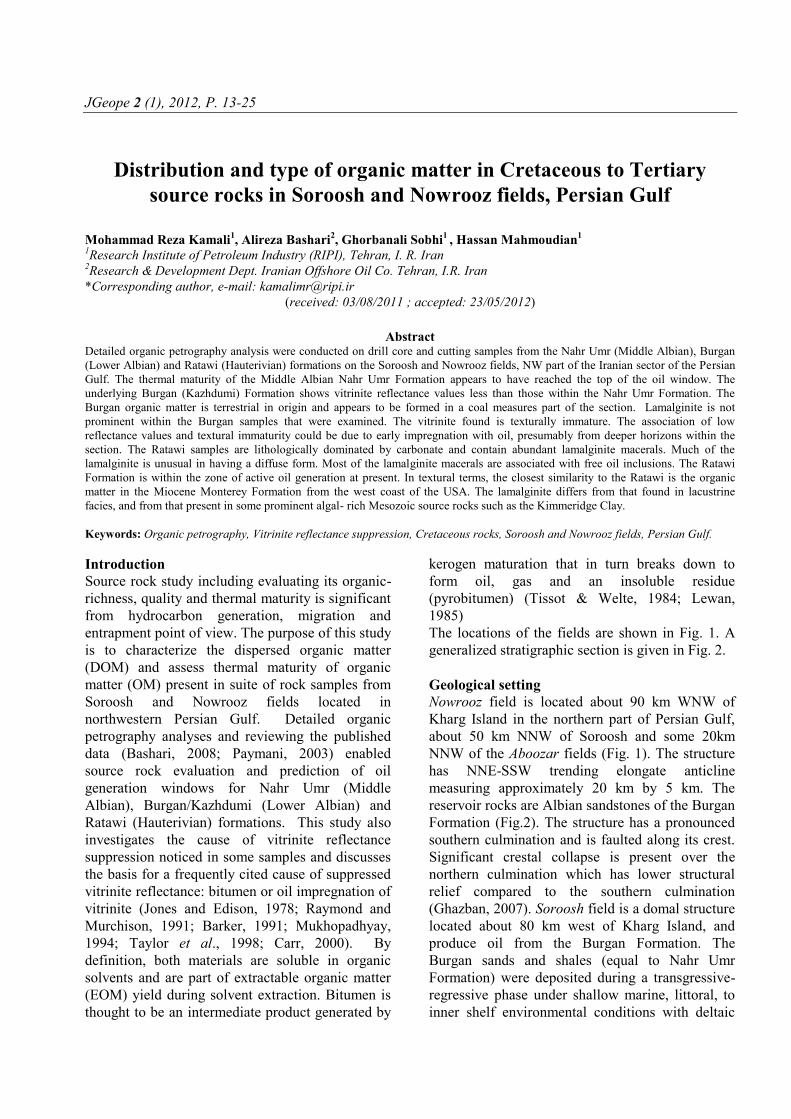
JGeope 2 (1), 2012, P. 13-25
Distribution and type of organic matter in Cretaceous to Tertiary
source rocks in Soroosh and Nowrooz fields, Persian Gulf
Mohammad Reza Kamali
1, Alireza Bashari
2, Ghorbanali Sobhi
1 , Hassan Mahmoudian
1
1Research Institute of Petroleum Industry (RIPI), Tehran, I. R. Iran
2Research & Development Dept. Iranian Offshore Oil Co. Tehran, I.R. Iran
*Corresponding author, e-mail: [email protected]
(received: 03/08/2011 ; accepted: 23/05/2012)
Abstract
Detailed organic petrography analysis were conducted on drill core and cutting samples from the Nahr Umr (Middle Albian), Burgan
(Lower Albian) and Ratawi (Hauterivian) formations on the Soroosh and Nowrooz fields, NW part of the Iranian sector of the Persian
Gulf. The thermal maturity of the Middle Albian Nahr Umr Formation appears to have reached the top of the oil window. The
underlying Burgan (Kazhdumi) Formation shows vitrinite reflectance values less than those within the Nahr Umr Formation. The
Burgan organic matter is terrestrial in origin and appears to be formed in a coal measures part of the section. Lamalginite is not
prominent within the Burgan samples that were examined. The vitrinite found is texturally immature. The association of low
reflectance values and textural immaturity could be due to early impregnation with oil, presumably from deeper horizons within the
section. The Ratawi samples are lithologically dominated by carbonate and contain abundant lamalginite macerals. Much of the
lamalginite is unusual in having a diffuse form. Most of the lamalginite macerals are associated with free oil inclusions. The Ratawi
Formation is within the zone of active oil generation at present. In textural terms, the closest similarity to the Ratawi is the organic
matter in the Miocene Monterey Formation from the west coast of the USA. The lamalginite differs from that found in lacustrine
facies, and from that present in some prominent algal- rich Mesozoic source rocks such as the Kimmeridge Clay.
Keywords: Organic petrography, Vitrinite reflectance suppression, Cretaceous rocks, Soroosh and Nowrooz fields, Persian Gulf.
Introduction
Source rock study including evaluating its organic-
richness, quality and thermal maturity is significant
from hydrocarbon generation, migration and
entrapment point of view. The purpose of this study
is to characterize the dispersed organic matter
(DOM) and assess thermal maturity of organic
matter (OM) present in suite of rock samples from
Soroosh and Nowrooz fields located in
northwestern Persian Gulf. Detailed organic
petrography analyses and reviewing the published
data (Bashari, 2008; Paymani, 2003) enabled
source rock evaluation and prediction of oil
generation windows for Nahr Umr (Middle
Albian), Burgan/Kazhdumi (Lower Albian) and
Ratawi (Hauterivian) formations. This study also
investigates the cause of vitrinite reflectance
suppression noticed in some samples and discusses
the basis for a frequently cited cause of suppressed
vitrinite reflectance: bitumen or oil impregnation of
vitrinite (Jones and Edison, 1978; Raymond and
Murchison, 1991; Barker, 1991; Mukhopadhyay,
1994; Taylor et al., 1998; Carr, 2000). By
definition, both materials are soluble in organic
solvents and are part of extractable organic matter
(EOM) yield during solvent extraction. Bitumen is
thought to be an intermediate product generated by
kerogen maturation that in turn breaks down to
form oil, gas and an insoluble residue
(pyrobitumen) (Tissot & Welte, 1984; Lewan,
1985)
The locations of the fields are shown in Fig. 1. A
generalized stratigraphic section is given in Fig. 2.
Geological setting
Nowrooz field is located about 90 km WNW of
Kharg Island in the northern part of Persian Gulf,
about 50 km NNW of Soroosh and some 20km
NNW of the Aboozar fields (Fig. 1). The structure
has NNE-SSW trending elongate anticline
measuring approximately 20 km by 5 km. The
reservoir rocks are Albian sandstones of the Burgan
Formation (Fig.2). The structure has a pronounced
southern culmination and is faulted along its crest.
Significant crestal collapse is present over the
northern culmination which has lower structural
relief compared to the southern culmination
(Ghazban, 2007). Soroosh field is a domal structure
located about 80 km west of Kharg Island, and
produce oil from the Burgan Formation. The
Burgan sands and shales (equal to Nahr Umr
Formation) were deposited during a transgressive-
regressive phase under shallow marine, littoral, to
inner shelf environmental conditions with deltaic
14 Kamali et al. JGeope, 2 (1), 2012
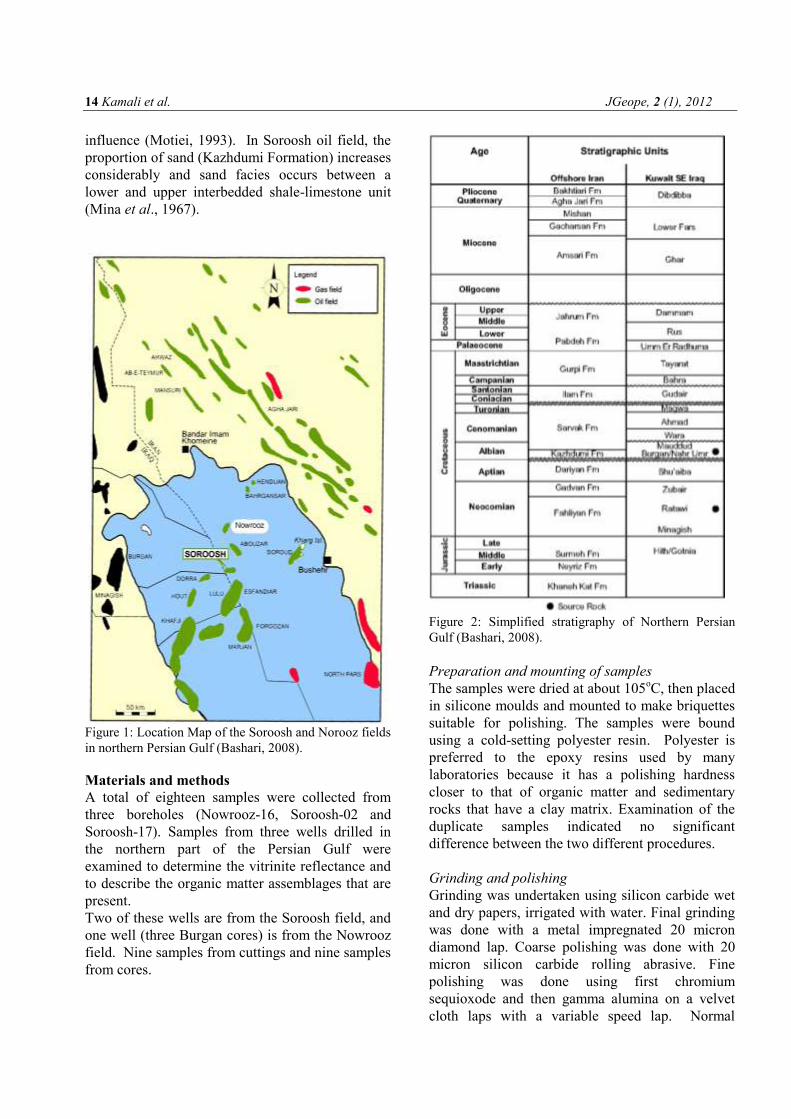
influence (Motiei, 1993). In Soroosh oil field, the
proportion of sand (Kazhdumi Formation) increases
considerably and sand facies occurs between a
lower and upper interbedded shale-limestone unit
(Mina et al., 1967).
Figure 1: Location Map of the Soroosh and Norooz fields
in northern Persian Gulf (Bashari, 2008).
Materials and methods
A total of eighteen samples were collected from
three boreholes (Nowrooz-16, Soroosh-02 and
Soroosh-17). Samples from three wells drilled in
the northern part of the Persian Gulf were
examined to determine the vitrinite reflectance and
to describe the organic matter assemblages that are
present.
Two of these wells are from the Soroosh field, and
one well (three Burgan cores) is from the Nowrooz
field. Nine samples from cuttings and nine samples
from cores.
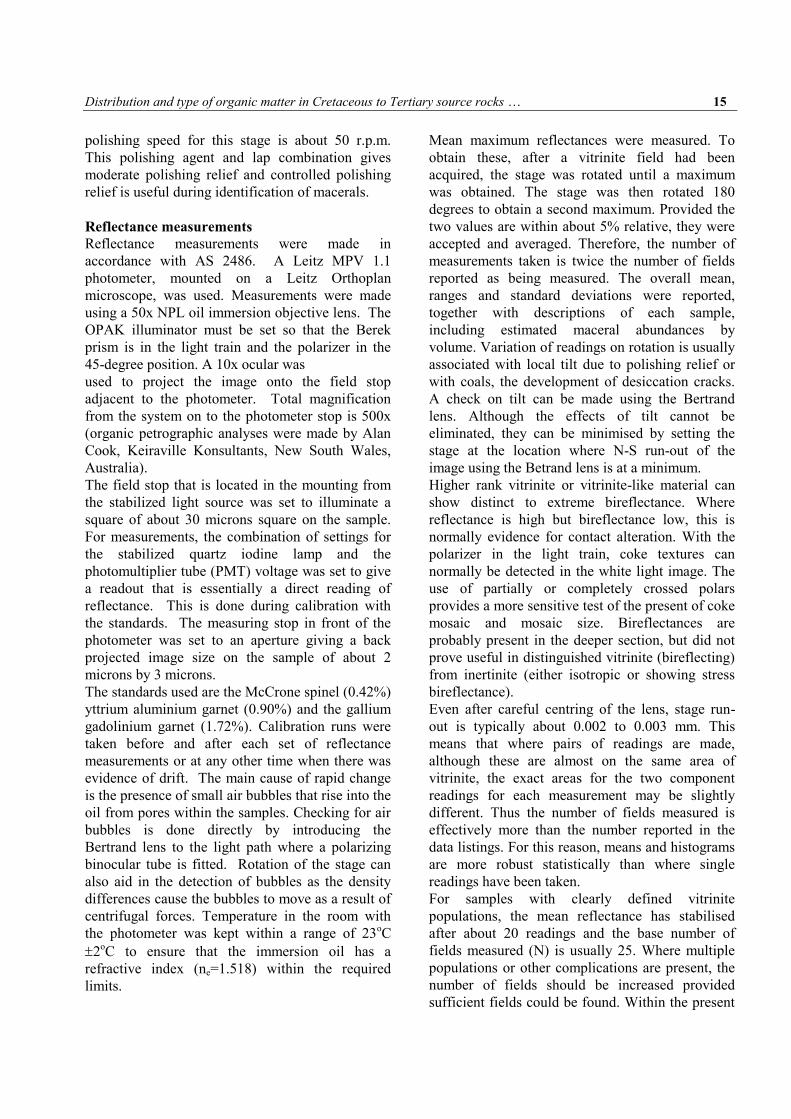
Figure 2: Simplified stratigraphy of Northern Persian
Gulf (Bashari, 2008).
Preparation and mounting of samples
The samples were dried at about 105oC, then placed
in silicone moulds and mounted to make briquettes
suitable for polishing. The samples were bound
using a cold-setting polyester resin. Polyester is
preferred to the epoxy resins used by many
laboratories because it has a polishing hardness
closer to that of organic matter and sedimentary
rocks that have a clay matrix. Examination of the
duplicate samples indicated no significant
difference between the two different procedures.
Grinding and polishing
Grinding was undertaken using silicon carbide wet
and dry papers, irrigated with water. Final grinding
was done with a metal impregnated 20 micron
diamond lap. Coarse polishing was done with 20
micron silicon carbide rolling abrasive. Fine
polishing was done using first chromium
sequioxode and then gamma alumina on a velvet
cloth laps with a variable speed lap. Normal
Distribution and type of organic matter in Cretaceous to Tertiary source rocks … 15
polishing speed for this stage is about 50 r.p.m.
This polishing agent and lap combination gives
moderate polishing relief and controlled polishing
relief is useful during identification of macerals.
Reflectance measurements
Reflectance measurements were made in
accordance with AS 2486. A Leitz MPV 1.1
photometer, mounted on a Leitz Orthoplan
microscope, was used. Measurements were made
using a 50x NPL oil immersion objective lens. The
OPAK illuminator must be set so that the Berek
prism is in the light train and the polarizer in the
45-degree position. A 10x ocular was
used to project the image onto the field stop
adjacent to the photometer. Total magnification
from the system on to the photometer stop is 500x
(organic petrographic analyses were made by Alan
Cook, Keiraville Konsultants, New South Wales,
Australia).
The field stop that is located in the mounting from
the stabilized light source was set to illuminate a
square of about 30 microns square on the sample.
For measurements, the combination of settings for
the stabilized quartz iodine lamp and the
photomultiplier tube (PMT) voltage was set to give
a readout that is essentially a direct reading of
reflectance. This is done during calibration with
the standards. The measuring stop in front of the
photometer was set to an aperture giving a back
projected image size on the sample of about 2
microns by 3 microns.
The standards used are the McCrone spinel (0.42%)
yttrium aluminium garnet (0.90%) and the gallium
gadolinium garnet (1.72%). Calibration runs were
taken before and after each set of reflectance
measurements or at any other time when there was
evidence of drift. The main cause of rapid change
is the presence of small air bubbles that rise into the
oil from pores within the samples. Checking for air
bubbles is done directly by introducing the
Bertrand lens to the light path where a polarizing
binocular tube is fitted. Rotation of the stage can
also aid in the detection of bubbles as the density
differences cause the bubbles to move as a result of
centrifugal forces. Temperature in the room with
the photometer was kept within a range of 23oC
2oC to ensure that the immersion oil has a
refractive index (ne=1.518) within the required
limits.
Mean maximum reflectances were measured. To
obtain these, after a vitrinite field had been
acquired, the stage was rotated until a maximum
was obtained. The stage was then rotated 180
degrees to obtain a second maximum. Provided the
two values are within about 5% relative, they were
accepted and averaged. Therefore, the number of
measurements taken is twice the number of fields
reported as being measured. The overall mean,
ranges and standard deviations were reported,
together with descriptions of each sample,
including estimated maceral abundances by
volume. Variation of readings on rotation is usually
associated with local tilt due to polishing relief or
with coals, the development of desiccation cracks.
A check on tilt can be made using the Bertrand
lens. Although the effects of tilt cannot be
eliminated, they can be minimised by setting the
stage at the location where N-S run-out of the
image using the Betrand lens is at a minimum.
Higher rank vitrinite or vitrinite-like material can
show distinct to extreme bireflectance. Where
reflectance is high but bireflectance low, this is
normally evidence for contact alteration. With the
polarizer in the light train, coke textures can
normally be detected in the white light image. The
use of partially or completely crossed polars
provides a more sensitive test of the present of coke
mosaic and mosaic size. Bireflectances are
probably present in the deeper section, but did not
prove useful in distinguished vitrinite (bireflecting)
from inertinite (either isotropic or showing stress
bireflectance).
Even after careful centring of the lens, stage run-
out is typically about 0.002 to 0.003 mm. This
means that where pairs of readings are made,
although these are almost on the same area of
vitrinite, the exact areas for the two component
readings for each measurement may be slightly
different. Thus the number of fields measured is
effectively more than the number reported in the
data listings. For this reason, means and histograms
are more robust statistically than where single
readings have been taken.
For samples with clearly defined vitrinite
populations, the mean reflectance has stabilised
after about 20 readings and the base number of
fields measured (N) is usually 25. Where multiple
populations or other complications are present, the
number of fields should be increased provided
sufficient fields could be found. Within the present
16 Kamali et al. JGeope, 2 (1), 2012
sample suite, at least 25 fields could be found in all
but one of the samples and over 40 fields were
measured for one sample. Inertinite reflectances
are reported. The inertinite measurements tended
to be biased towards low reflecting inertinite.
Maceral analyses
The macerals were recognized following the
classification used in ICCP 1994 and Taylor et al.,
(1998) with slight differences (see Appendix 1).
The major differences related to the combination of
terms for lower rank vitrinite macerals (termed
huminite in Taylor et al., 1998) and to the macerals
within alginite. The use of term vitrinite over the
full range of rank or maturation simplifies
descriptions and does not result in the loss of any
information.
Point counts are reliable only where organic matter
is at least a major component (>10% and desirably
>25%) and this was not the case for most of the
samples in the present suite. For samples with low
organic matter abundance (the great majority of all
of the samples in the present study), the errors
associated with point counts become unacceptably
high, unless very large numbers of points are
counted. Therefore, visual estimates were made for
abundances of organic matter. This was done using
comparison charts.
Examinations in fluorescence-mode were made
using the plane slip illuminator and fluorescence-
mode was used for all fields for the samples where
fluorescing liptinite was present. Fluorescence-
mode illumination is also used to determine mineral
fluorescence characteristics. Where organic matter
is a minor component, abundance estimation is
more reliable than the point-count technique.
Sequence during examination of sample
Samples were examined first using a low power air
immersion lens in order to examine the overall
textures. After immersion oil was placed on the
sample, reflectance measurements are made as soon
as possible. Experience shows that reflectance
values can decrease following immersion in oil,
usually after a period of some hours. Therefore, the
possibility of this occurring was eliminated by
making reflectance measurements within an hour of
initial immersion. Some fluorescence examinations
were undertaken concurrently with the
measurement of reflectance, mostly for the lower
vitrinite reflectance samples to check on the
presence or absence of fluorescence from the
vitrinite.
Following the measurement of reflectances, the
samples were examined in fluorescence and white
light modes to obtain the maceral analyses. For the
samples with lower levels of maturation
examination was made using both white light and
fluorescence-modes.
Especially for samples that have present maturation
levels within the oil generation window,
fluorescence intensity tends to increase on exposure
to the fluorescence excitation beam. For some of
the early to mid-mature samples, some fields were
subjected to prolonged irradiation to check on
alteration properties of the organic matter and
minerals. No marked alteration was noted. Oil haze
was not prominent but appears to be present in
some of the deeper samples.
Where abundance terms are used, these are defined
as follows:
Category Percentage (by volume)
Absent 0.0
Rare <0.1
Sparse 0.1-0.4
Common 0.5-1.9
Abundant 2.0-9.9
Major 10.0-49.9
Dominant 50.0-100
Organic matter assemblages
Organic facies present
Organic matter ranges from sparse to major. Within
the Tertiary section, organic matter is absent to rare
with liptinite being present in the Ghar Formation.
In the Cretaceous samples, organic matter is
generally more abundant compared to the overlying
Tertiary and ranges from rare to major. Apart from
the Burgan Formation, marine liptinite is the most
prominent component (Plate 2).
The Ahmadi to Nahr section contains typical
marine assemblages. Liptinite is typically the most
abundant maceral group, but dispersed organic
matter (dom) is rare to sparse.
The upper part of the Burgan contains lamalginite
and some of the samples show evidence of a
lacustrine origin. The sample from 2303.5 m in the
Burgan Limestone contains Botryococcus-related
telalginite. This alga forms resistant tests, that can
be transported, but it has origin from non-marine
settings and usually its presence indicates a
Distribution and type of organic matter in Cretaceous to Tertiary source rocks … 17
lacustrine depositional setting (Cook &
Struckmeyer, 1986).
The Burgan B samples contain common
sporinite and vitrinite ranges from common to
major. Two samples from the Burgan B coaly
interval examined from Soroosh-17 were similar in
facies to reference samples from Nowrooz-16. The
organic matter assemblages are consistent with a
fluvio-deltaic origin. This interval is illustrated in
Plates 1 to 8. Most of the illustrations show the
well-developed telovitrinite and some of the
features that indicate textural immaturity (plate 5).
Plates 1 and 2 shows telovitrinite with inclusions of
resinite and a small v-shaped vein of exsudatinite
and plates 3 and 4 exhibit detrovitrinite, sporinite
and cutinite in claystone for Nowrooz-16, 2328.5
m, Burgan, Cretaceous sample under white
reflected and fluorescence-mode respectively. Plate
6 shows the abundant oil inclusions that are present
in some lithologies from the Burgan. A sample of
Burgan reservoir sand was examined. Although the
sand is dark, oil traces are difficult to observe and
from this limited observation it appears that the oil
within the reservoir is too mobile for easy
examination using petrographic techniques. It
should be noted that this apparent difficulty is
unusual because oils within many other reservoirs
can be observed easily.
The samples from Soroosh-02 are from the
Ratawi Formation and show an abundance of algal
material. Terrestrial influences are minor, but can
be seen in Plates 7 and 8. Plate 7 illustrates the
diffuse lamalginite that is the main component of
the Ratawi samples (Bashari, 2008). Oil inclusions
are prominent and it appears that the Ratawi is
currently within the zone of active generation of oil
(Paymani, 2003).
PLATES AND PLATE CAPTIONS
The Plates were taken using Kodak 400 ASA negative
film and scanned at 2900 dpi from the negatives or at 300
dpi from 15x10 cm prints. The illustrations in this
document were prepared from Jpeg files at 3
compression.
The Plates used were all taken using a 50x oil
immersion objective. Where reflected white light and
fluorescence-mode pairs are used the two plates are close
to being in registration, with any differences being due to
cropping during preparation of the Jpeg files.
The fluorescence of the liptinite is generally weak and
the appearance has been enhanced during the
photographic and digital processes that have been used to
produce the Plates.
The Plates are organised in depth order, with exception
of Plate 14, which was moved to keep reflected white
light and fluorescence-mode plate together on the same
page. The Plates were selected to illustrate both the range
of organic matter present and to try to illustrate its
variation within depth.
The following abbreviations are used in lettering the
Plates:
Tv= telovitrinit, Dv= detrovitrinite, Lam= lamalginite, D
lam= diffuse lamalginite,
Sp= sporinite, X= exsudatinite, O= oil, O haze= oil haze,
Qtz= quartz
The numbers on some of the Plates relate to the
reflectance of that part of the field.
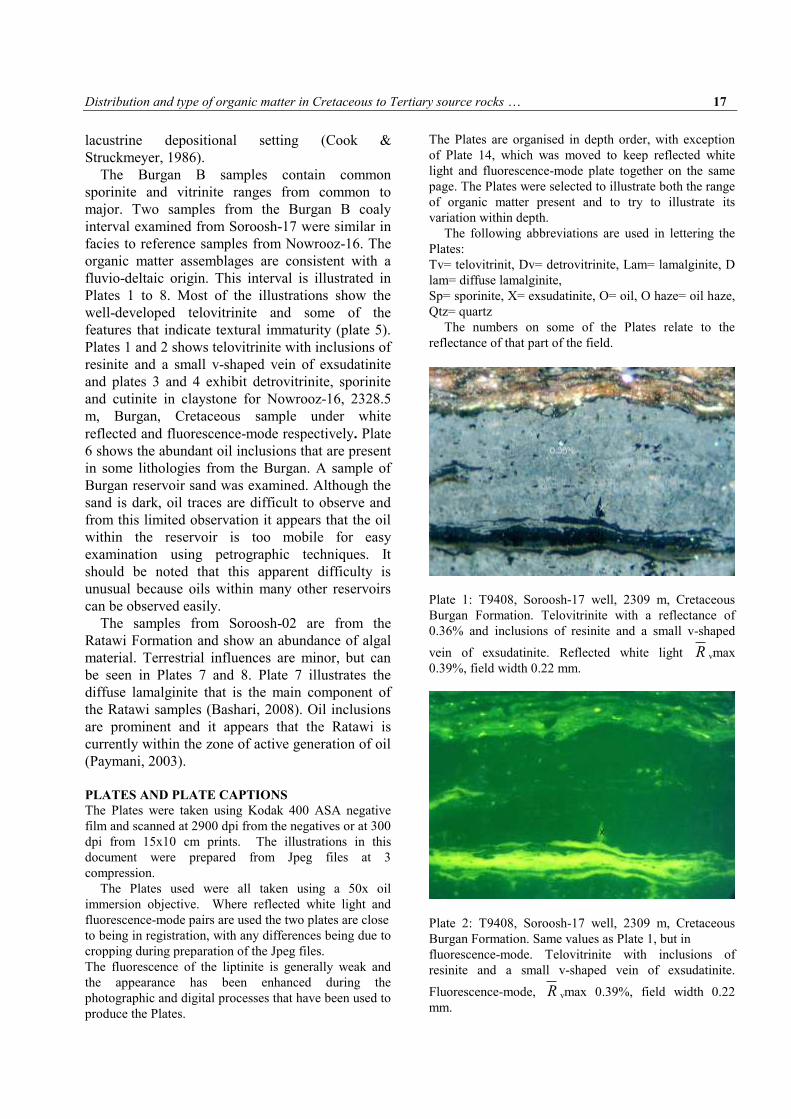
Plate 1: T9408, Soroosh-17 well, 2309 m, Cretaceous
Burgan Formation. Telovitrinite with a reflectance of
0.36% and inclusions of resinite and a small v-shaped
vein of exsudatinite. Reflected white light R vmax
0.39%, field width 0.22 mm.
Plate 2: T9408, Soroosh-17 well, 2309 m, Cretaceous
Burgan Formation. Same values as Plate 1, but in
fluorescence-mode. Telovitrinite with inclusions of
resinite and a small v-shaped vein of exsudatinite.
Fluorescence-mode, R vmax 0.39%, field width 0.22
mm.
18 Kamali et al. JGeope, 2 (1), 2012
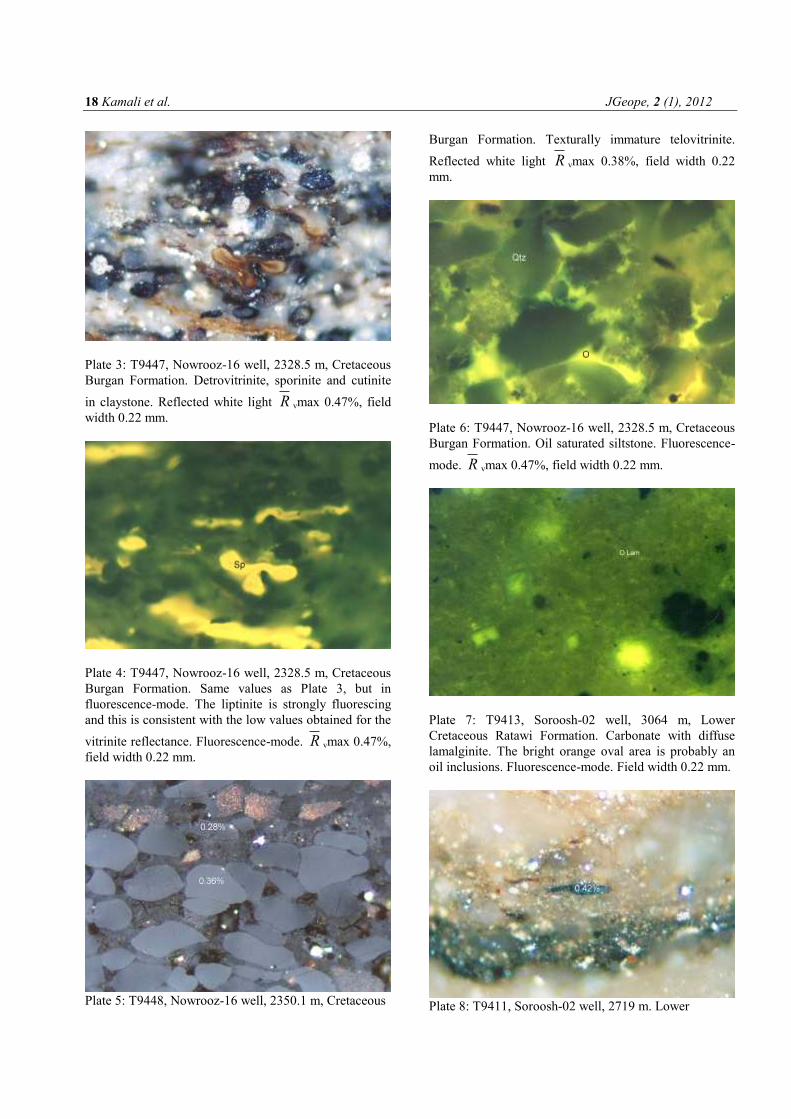
Plate 3: T9447, Nowrooz-16 well, 2328.5 m, Cretaceous
Burgan Formation. Detrovitrinite, sporinite and cutinite
in claystone. Reflected white light R vmax 0.47%, field
width 0.22 mm.
Plate 4: T9447, Nowrooz-16 well, 2328.5 m, Cretaceous
Burgan Formation. Same values as Plate 3, but in
fluorescence-mode. The liptinite is strongly fluorescing
and this is consistent with the low values obtained for the
vitrinite reflectance. Fluorescence-mode. R vmax 0.47%,
field width 0.22 mm.
Plate 5: T9448, Nowrooz-16 well, 2350.1 m, Cretaceous
Burgan Formation. Texturally immature telovitrinite.
Reflected white light R vmax 0.38%, field width 0.22
mm.
Plate 6: T9447, Nowrooz-16 well, 2328.5 m, Cretaceous
Burgan Formation. Oil saturated siltstone. Fluorescence-
mode. R vmax 0.47%, field width 0.22 mm.
Plate 7: T9413, Soroosh-02 well, 3064 m, Lower
Cretaceous Ratawi Formation. Carbonate with diffuse
lamalginite. The bright orange oval area is probably an
oil inclusions. Fluorescence-mode. Field width 0.22 mm.
Plate 8: T9411, Soroosh-02 well, 2719 m. Lower
Distribution and type of organic matter in Cretaceous to Tertiary source rocks … 19
Cretaceous Ratawi Formation. Detrovitrinite with a
reflectance of 0.42% and weakly fluorescing lamalginite
in claystone. Reflected white light R vmax 0.39%, field
width 0.22 mm.
Reflectance Data
Vitrinite reflectance data were obtained from all of
the Burgan samples and from three of the overlying
Cretaceous section in Soroosh-17 and from one of
the Ratawi Formation cores. Although vitrinite
reflectance data are limited to the Cretaceous
section, they appear to indicate that the top of oil
generation window is currently about 2150 m. At
the top of the Burgan, a mean vitrinite reflectance
of 0.54% was obtained. Three samples below this
contain common to abundant vitrinite but show
lower vitrinite reflectance values that range from
0.51% at 2303.5 m to 0.36% at 2327.4 m. Below
that, the basal shale shows a slightly higher mean
vitrinite reflectance of 0.49%.
These values for the Burgan are similar to those
found at similar depths in the Burgan cores from
Nowrooz-16 and it is assumed that the effects
found for Soroosh-17 are similar to those that occur
within the Nowrooz-16 section.
Immature textures are found within the
telovitrinite for both wells. The greater prominence
of the immature textures seen in the Plates from
Nowrooz-16 may be due to the presence of coal
rather than shaly coal in the Nowrooz-16 samples.
Fluorescence from telovitrinite is prominent both in
Plate 2 (Soroosh-17) and in Plate 5 (Nowrooz-16).
The most likely explanation for both the low
vitrinite reflectance values in the Burgan and the
textural immaturity is that the oil was emplaced
early within this unit and the fluid pressures have
prevented the development of mature vitrinite
textures.
This has implication both for the source of the
oil and for the timing of generation. Although the
Burgan is currently marginally mature for oil
generation, it is unlikely that oil generated from the
organic matter in the Burgan could preserve the cell
textures. This would require that the oil had come
from a deeper source and has migrated into the
section before compaction to bituminous coal
textures could occur. In general terms, this suggest
emplacement of oil within the Burgan at depths of
overburden less than about 1500 m.
Thermal history interpretation of VR data
Results of new vitrinite reflectance (VR) analyses
carried out for this paper are summarised in Table
1.
Maximum paleotemperature estimates from the VR
in Soroosh-02
Maximum paleotemperatures derived from the
measured VR values and the equivalent VR values
from the Lower Ratawi Formation, are summarized
in Table 1.
Estimated temperature ranges from 62ºC for the
measured VR data in sample GC 873-82.1 to 116ºC
from inertinite reflectance in the same sample. A
maximum paleotemperture of 100ºC is estimated
from liptinite fluorescence observations.
A paleotemperature estimate of 62ºC from the
single measured VR value in sample GC873-82.1 is
anomalously low, being significantly less than the
present temperature. Conversely, the estimate of
116ºC from inertinite reflectance in the same
sample is higher than that the present day
temperature, but this is not considered to be robust
estimate as it is based on only a single
measurement. On the other hand, the estimate
of~100ºC over the sampled interval from liptinite
fluorescence observations plots close to the present
day temperature profile, suggesting that the Lower
Ratawi Formation is currently at maximum
paleotemperatures at the present day. This is
consistent with the results obtained from more
extensive data in the Soroosh-02 (Bashari, 2008).
The Lower Ratawi Formation, in terms of type of
organic matter, shares some similarities with algal-
rich Mesozoic source rocks of the Kimmeridge
Clay of NW Europe (Bray, et al., 1992; Cook, &
Struckmeyer, 1986; Cook & Sherwood, 1990).
Vitrinite reflectance suppression in Soroosh-02 and
Nowrooz-16
Mean random reflectance (Rv, in %) of normal
vitrinite is an optical property of sedimentary
organic matter (SOM) that is widely used in
assessing the thermal history of organic matter
leading to the evaluation of remaining hydrocarbon
generation potential, among many other
applications. However, over the last few decades,
numerous studies suggest that besides thermal
history, other factors, primarily operator bias in
vitrinite selection, natural variations in maceral
precursors and diagenesis, may act to suppress
vitrinite reflectance. Through the process of
20 Kamali et al. JGeope, 2 (1), 2012
primary and secondary hydrocarbon migration,
vitrinite impregnation could occur by retention of
internally generated bitumen within vitrinite or
migration of externally generated bitumen into
vitrinite (Hutton & Cook, 1980; Crick et al., 1988).
Table 1: Vitrinite reflectance measurements and maximum paleotemperature data for wells Soroosh-17, Soroosh -02 and
Norooz-16.
Sample number Depth
(m) Sample type Stratigraphic subdivision
Stratigra-
phic age
(Ma)
VR
Range (%)
Maximum Paleo-
temperature (ºC)
Soroosh-17
GC873-3.1 400 cuttings Bakhtiari-Agha Jari 5-2.6
5.80*
5.48-6.12 -
GC873-6.3 680 cuttings Ghar Fm
(L. Miocene) 24-15 - -
GC873-11.1 1815 cuttings Ahmadi (Sarvak)
(Cenomanian) 94-91
1.42*
0.96-2.10 99
GC873-16.1 1956 cuttings Ahmadi sh (Sarvak)
(Cenomanian) 98-94
1.15*
0.80-1.60 72
GC873-23.1 1980 cuttings Mauddud (Sarvak)
(U. Albian) 99-98 0.34* 50
GC873-27.1 2148 cuttings Nahr - Umr (Kazhdumi)(M.
Albian) 101-99
0.50*
0.36-0.65 83
GC873-30.1 2175 cuttings Dair lst (Kazhdumi)
(M. Albian) 103-101
0.51*
(0.39-0.65) 86
GC873-40.1 2220 cuttings Burgan 'A' (Kazhdumi) (M.
Albian) 104-103
0.54*
(0.40-0.66) 92
GC873-49.1 2304 core Burgan lst (Kazhdumi)
(M. Albian) 105-104
0.51*
(0.42-0.62) 85
GC873-50.1 2309 core Burgan 'B' (Kazhdumi)
(M. Albian) 106-105
0.39*
(0.34-0.47) 62
GC873-52.1 2327 core Burgan 'B' (Kazhdumi)
(M. Albian) 106-105
0.36*
(0.26-0.47) 55
GC873-55.1 2412 cuttings Burgan basal sh (Kazhdumi)
(M. Albian) 108-106
0.49*
(0.31-0.62) 82
Soroosh-02
GC873-82.1 2719 cuttings L. Ratawi (Fahliyan) 141-130
0.39*
(0.33-0.47) 62
GC873-84.1 3052 cuttings L. Ratawi (Fahliyan) 141-130 - -
GC873-89.1 3064 cuttings L. Ratawi (Fahliyan) 141-130 - -
Nowrooz-16
GC873-58.1 2329 core L. Ratawi (Fahliyan) 106-105
0.47*
(0.38-0.64) 83
GC873-60.1 2350 core L. Ratawi (Fahliyan) 106-105 0.38*
(0.28-0.46) 65
GC873-62.1 2357 core L. Ratawi (Fahliyan) 106-105 0.49*
(0.40-0.58) 87
*Inertinite
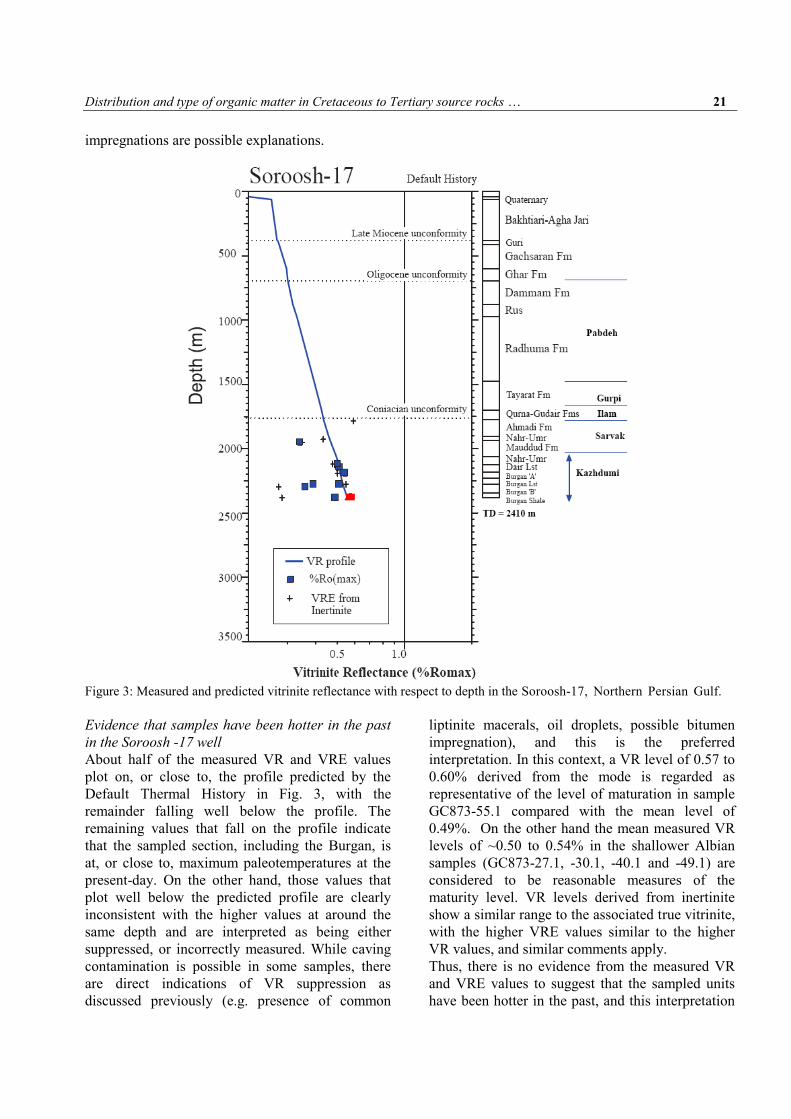
Mean VR and inertinite-derived equivalent VR
values (VRE) are plotted against depth (with
respect to kb) (Fig. 3). The red square symbol in
this plot represents the best estimate of VR analysis
(0.57-0.60%) and the true VR level in the deepest
sample was achieved based on the fluorescence
observations.
As shown in Fig. 3, the VR profile is predicted on
the basis of the Default Thermal History- i.e. the
thermal history predicted for samples from this well
if they have never been hotter than their present
temperatures at any time in the past. This history is
based on the burial history derived from the units
intersected in the well (shown in Fig. 3), combined
with the present-day thermal gradient of
31.6°C/km, derived from corrected BHT values as
defined by Bashari (2008).
Two of the three measured VR values, all from the
Kazhdumi sequence near TD, plot on or very near
the predicted profile (Fig. 4), which suggests this
formation at Nowrooz-16 has not been heated
above the present-day temperatures at any time
since deposition. The third value is lower, and is
clearly anomalously low when compared with the
two adjacent higher values. There appears to be a
relationship between low VR and the abundance of
telovitrinite in this sample, which was also noted
for Soroosh-17. This anomalously low measured
VR values are therefore attributed to some form of
geochemical suppression, of unknown cause,
although the presence of hydrogen-rich organic
matter, high lipinite abundance and pervasive oil
Distribution and type of organic matter in Cretaceous to Tertiary source rocks … 21
impregnations are possible explanations.
Figure 3: Measured and predicted vitrinite reflectance with respect to depth in the Soroosh-17, Northern Persian Gulf.
Evidence that samples have been hotter in the past
in the Soroosh -17 well
About half of the measured VR and VRE values
plot on, or close to, the profile predicted by the
Default Thermal History in Fig. 3, with the
remainder falling well below the profile. The
remaining values that fall on the profile indicate
that the sampled section, including the Burgan, is
at, or close to, maximum paleotemperatures at the
present-day. On the other hand, those values that
plot well below the predicted profile are clearly
inconsistent with the higher values at around the
same depth and are interpreted as being either
suppressed, or incorrectly measured. While caving
contamination is possible in some samples, there
are direct indications of VR suppression as
discussed previously (e.g. presence of common
liptinite macerals, oil droplets, possible bitumen
impregnation), and this is the preferred
interpretation. In this context, a VR level of 0.57 to
0.60% derived from the mode is regarded as
representative of the level of maturation in sample
GC873-55.1 compared with the mean level of
0.49%. On the other hand the mean measured VR
levels of ~0.50 to 0.54% in the shallower Albian
samples (GC873-27.1, -30.1, -40.1 and -49.1) are
considered to be reasonable measures of the
maturity level. VR levels derived from inertinite
show a similar range to the associated true vitrinite,
with the higher VRE values similar to the higher
VR values, and similar comments apply.
Thus, there is no evidence from the measured VR
and VRE values to suggest that the sampled units
have been hotter in the past, and this interpretation
22 Kamali et al. JGeope, 2 (1), 2012
is highly consistent with the interpretation of the
AFTA carried out by Bashari (2008).
Evidence that samples have been hotter in the past
in the Nowrooz-16 well
Two of the three measured VR values, all from the
Kazhdumi sequence near TD, plot on or very near
the predicted profile (Fig. 4), which at face value
suggests that the section has not been heated above
the present-day temperatures at any time since
deposition. The third value is lower, and is clearly
anomalously low when compared with the two
adjacent higher values as reported by Duddy
(2004). There appears to be a relationship between
low VR and the abundance of telovitrinite in this
sample, which was also noted for Soroosh-17. Oil
cut was also noted from the telovitrinite, although
there is no direct evidence that the presence of oil
has lowered the reflectance of the telovitrinite. On
the other hand, even the highest VR values are
systematically lower than expected. These
anomalously low measured VR values are therefore
attributed to some form of geochemical
suppression, of unknown cause, although the
presence of hydrogen-rich organic matter, high
liptinite abundance and pervasive oil impregnation
are possible explanations.
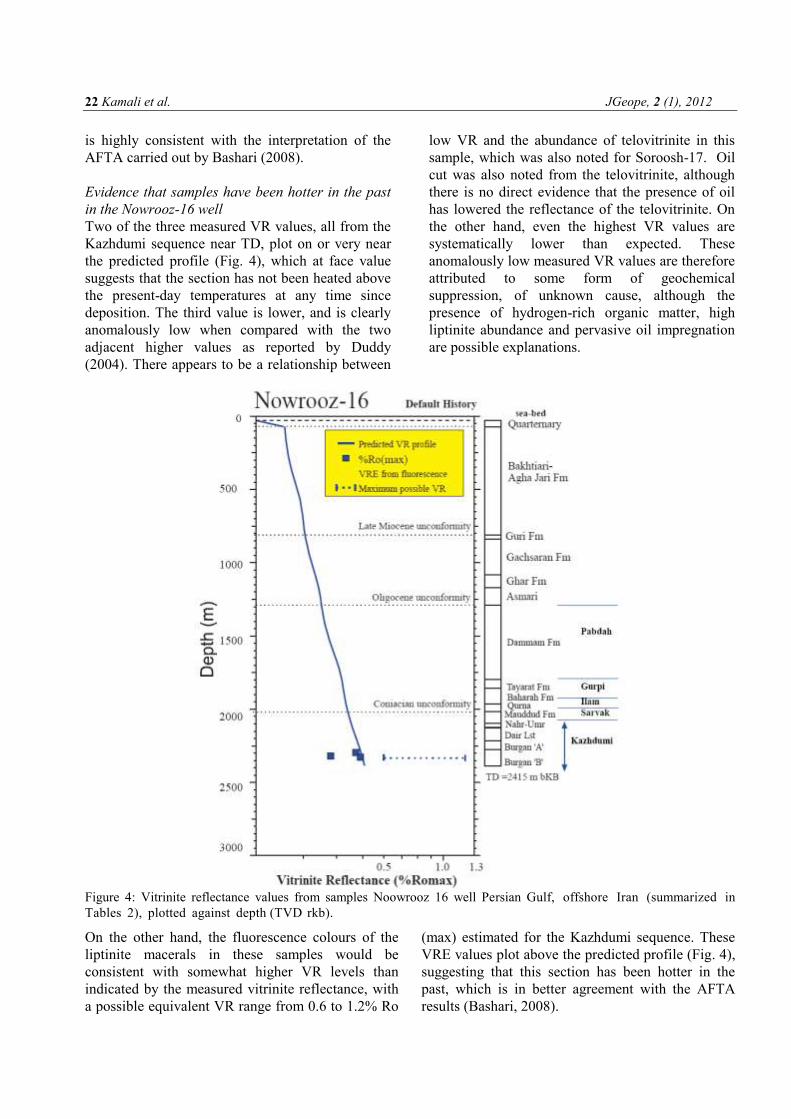
Figure 4: Vitrinite reflectance values from samples Noowrooz 16 well Persian Gulf, offshore Iran (summarized in
Tables 2), plotted against depth (TVD rkb).
On the other hand, the fluorescence colours of the
liptinite macerals in these samples would be
consistent with somewhat higher VR levels than
indicated by the measured vitrinite reflectance, with
a possible equivalent VR range from 0.6 to 1.2% Ro
(max) estimated for the Kazhdumi sequence. These
VRE values plot above the predicted profile (Fig. 4),
suggesting that this section has been hotter in the
past, which is in better agreement with the AFTA
results (Bashari, 2008).
A committee machine approach for predicting permeability from well log data: a case study… 23
Conclusions
The organic petrographic observations show that the
Burgan (Kazhdumi) organic matter in Soroosh-17
and Nowrooz-16 is largely terrestrial in origin from a
coal measures part of the section without much
lamalginite. In contrast, the Fahlyian section (Lower
Ratawi Formation) samples examined from Soroosh-
02 are dominated by carbonate and contain abundant
to major lamalginite. Much of the lamalginite is
unusual in having a diffuse form and is associated
with free oil inclusions. These observations are
interpreted as indicating that the Fahlyian section
(Lower Ratawi Formation) underlying the
Soroosh reservoirs is currently within the zone of
active oil generation.
The sections examined in Soroosh-17 and Nowrooz-
16 appear to reach the top of the oil window in the
Middle Albian Nahr Umr Formation. The
underlying Burgan (Kazhdumi) shows a zone of
vitrinite reflectance values that are lower than
those within the Nahr Umr Formation. The vitrinite
found is texturally immature. The association of low
reflectances and textural immaturity could be due
to early impregnation with oil, presumably from
deeper within the section.
It is probable that the Lower Ratawi Formation is
currently within the zone of active oil generation. In
textural terms, the closest similarities to the Lower
Ratawi Formation are with the organic matter that is
present in the Monterey Formation from the west
coast of the USA. The lamalginite differs from that
found in lacustrine facies, and from that present in
some prominent algal rich Mesozoic source rocks
such as the Kimmeridge Clay of NW Europe.
Measured vitrinite reflectance data from all three
wells sections indicate that the pattern of vitrinite
reflectance distribution is complex. Reflectances that
are assessed to be anomalously low are associated
with both the Burgan B and with the Ratawi
Formation. However, the causes of the lower
reflectances are different for these two different
units.
In the case of the Ratawi, the low vitrinite
reflectance values are associated with abundant to
major lamalginite. The association between low
vitrinite reflectance values and abundant lamalginite
is a well known process considered for vitrinite
reflectance suppression.
The Burgan coaly unit also shows anomalously low
reflectances. This tentatively is assigned to the
presence of the oil charge in this unit which is an
indication of early emplacement of the oil within this
unit.
Acknowledgments
The authors wish to acknowledge the managing
Director of the Iranian Offshore Oil Co. for
permission to access company data. Organic matter
analyses were carried out by Allen Cook (Keirvalle,
NSW, Australia) who is much appreciated.
References
Barker, C.E., 1991. An update on the suppression of vitrinite reflectance. TSOP Newsletter, 8 (4), 8–11.
Bashari, A., 2008. Thermal history reconstruction in the Soroosh and the Nowrooz Field, the Persian Gulf, based on
apatite fission track analysis and vitrinite reflection data. Journal of Petroleum Geology, 31 (2), 1-14.
Bray, R.J., Green, P.F., Duddy, I.R., 1992. Thermal history reconstruction using apatite fission track analysis and vitrinite
reflectance: a case study from the UK East Midlands and the southern North Sea. In: Hardman, R.F.P. (ed.),
Exploration Britain: Into the next decade. Geological Society of London Special Publication, 67, 3-25.
Carr, A.D., 2000. Suppression and retardation of vitrinite reflectance, parts 1 and 2. Journal of Petroleum Geology, 23,
313–343 and 475–496.
Cook, A.C., Sherwood, N.R., 1990. Classification of oil shales, coals and other organic-rich rocks. Organic Geochemistry,
TSOP Special Issue, 17, 2, 211-222.
Cook, A.C., Struckmeyer, H., 1986. The role of coal as a source rock for oil. In: Glenie R.C. (Ed.) Second Southeastern
Australia Oil Exploration Symposium, Technical papers, pp. 419-432.
Crick, I.H., Boreham, C.J., Cook, A.C., Powell, T.G. 1988. Petroleum Geology and geochemistry of Middle Proterozoic
McArthur Basin, Northern Australia II: Assessment of source rock potential. American Association of Petroleum
Geologists Bulletin, 72, 1495-1514.
Duddy, I. R., 2004. Thermal, burial and source rock maturation history reconstruction in the Soroosh and Nowrooz fields
Persian Gulf, Iran. Iranian Offshore Oil Company Report.
Ghazban, F., 2007. Petroleum Geology of the Persian Gulf. Tehran University and National Iranian Oil Company
Publications, Tehran,
24 Kamali et al. JGeope, 2 (1), 2012
Hutton, A.C., Cook, A.C., 1980. Influence of alginite on the reflectance of vitrinite from Joadja, N.S.W. and some other
coals and oil shales containing alginite. Fuel, 59, 711-714.
ICCP, 1995. Vitrinite Classification, ICCP System 1994. ICCP, Aachen, Germany, 1995, 24p.
ICCP Website, 2003. Accreditation. Http://www.iccop.org.
Jones, R., Edison, T., 1978. Microscopic observations of kerogen related to geochemical parameters with emphasis on
thermal maturity. In: Oltz, D.F. (Ed.), Symposium in Geochemistry, Low Temperature Metamorphism of Kerogen and
Clay Minerals Society of Economic Paleontologists and Mineralogists, Pacific Section, pp. 1–12.
Lewan, M.D., 1985. Evaluation of petroleum generation by hydrous pyrolysis experimentation. Philosophical
Transactions of the Royal Society of London, A 315, 123–134.
Mina, P., Razaghnia, M., T., Paran, Y., 1967. Geological and geophysical studies and exploratory drilling of the Iranian
continental shelf-Persian Gulf: Mexico, Seventh World Petroleum Congress proceedings, v. 2, p. 771-903.
Motiei, H., 1993. Stratigraphy of Zagros. In: A. Hushmandzadeh (Ed.) Treatise on the Geology of Iran. Geological Survey
of Iran.
Mukhopadhyay, P.K., 1994. Vitrinite reflectance as maturity parameter. Petrographic and molecular characterization and
its applications to basin modeling. In: Mukhopadhyay, P.K., Dow, W.G. (Eds.), Vitrinite Reflectance as a Maturity
Parameter: Applications and Limitations. Symposium Series, vol. 570. American Chemical Society, Washington, DC,
pp. 1–24.
Paymani, M., 2003. Burial history reconstruction and thermal modelling in the northern Persian Gulf. Master Thesis,
Petroleum University of Technology (unpublished).
Raymond, A.C., Murchison, D.G., 1991. Influence of exinitic macerals on the reflectance of vitrinite in Carboniferous
sediments of the Midland Valley of Scotland. Fuel, 70, 155–161.
Standards Association of Australia, 2000. Methods for Microscopical Determination of Reflectance of Coal Macerals.
AS 2486.
Standards Association of Australia, 1986. Coal Maceral Analysis. AS 2856, 22 p.
Taylor G. H, Teichmüller M., Davis, A., Diessel, C. F. K, Littke, R., Robert, P., 1998. Organic Petrology. (Gebrüder
Borntraeger, Berlin-Stuttgart) 704p.
Tissot, B.P.,Welte, D.H., 1984. Petroleum Formation and Occurrence, second edition. Springer-Verlag, Berlin. 699 pp.
A committee machine approach for predicting permeability from well log data: a case study… 25
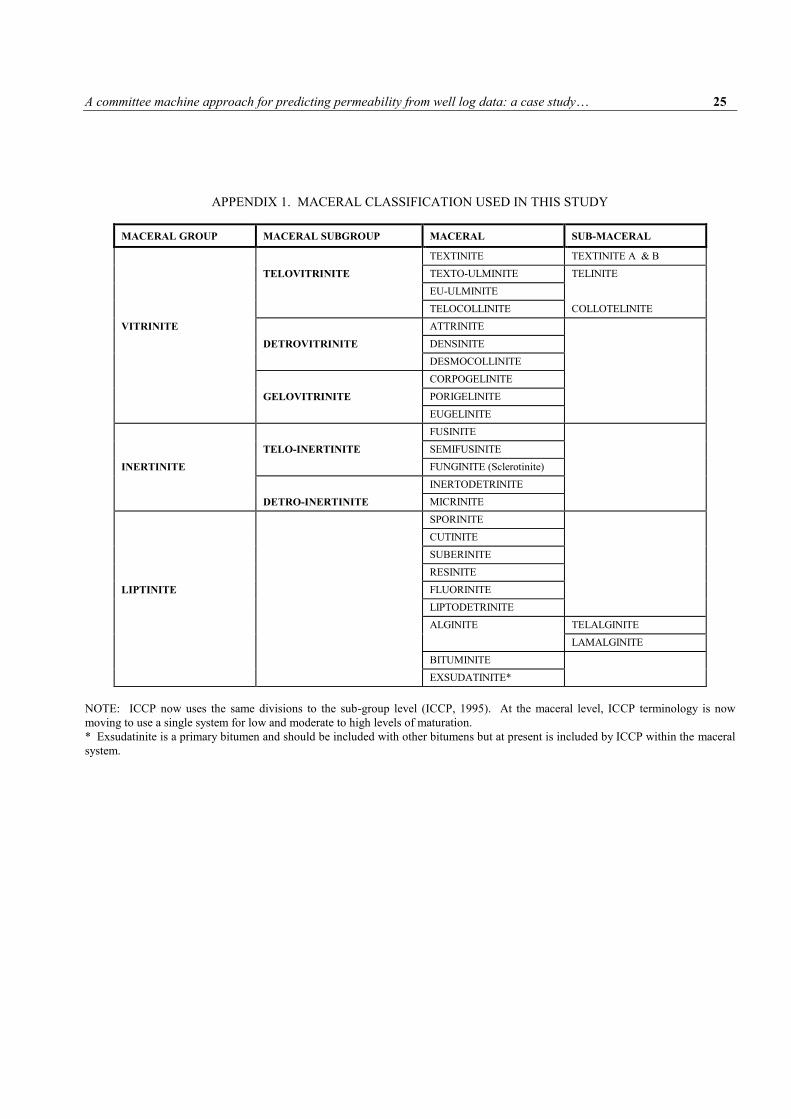
APPENDIX 1. MACERAL CLASSIFICATION USED IN THIS STUDY
MACERAL GROUP MACERAL SUBGROUP MACERAL SUB-MACERAL
TEXTINITE TEXTINITE A & B
TELOVITRINITE TEXTO-ULMINITE TELINITE
EU-ULMINITE
TELOCOLLINITE COLLOTELINITE
VITRINITE ATTRINITE
DETROVITRINITE DENSINITE
DESMOCOLLINITE
CORPOGELINITE
GELOVITRINITE PORIGELINITE
EUGELINITE
FUSINITE
TELO-INERTINITE SEMIFUSINITE
INERTINITE FUNGINITE (Sclerotinite)
INERTODETRINITE
DETRO-INERTINITE MICRINITE
SPORINITE
CUTINITE
SUBERINITE
RESINITE
LIPTINITE FLUORINITE
LIPTODETRINITE
ALGINITE TELALGINITE
LAMALGINITE
BITUMINITE
EXSUDATINITE*
NOTE: ICCP now uses the same divisions to the sub-group level (ICCP, 1995). At the maceral level, ICCP terminology is now
moving to use a single system for low and moderate to high levels of maturation.
* Exsudatinite is a primary bitumen and should be included with other bitumens but at present is included by ICCP within the maceral
system.