Embed Size (px)
Citation preview
REVIEW Open Access
Distribution- and anchor-based methods todetermine the minimally importantdifference on patient-reported outcomequestionnaires in oncology: a structuredreviewAhmad Ousmen1*†, Célia Touraine2†, Nina Deliu3, Francesco Cottone3, Franck Bonnetain1,4, Fabio Efficace3,Anne Brédart5,6, Caroline Mollevi2,4,7 and Amélie Anota1,4
Abstract
Background: Interpretation of differences or changes in patient-reported outcome scores should not onlyconsider statistical significance, but also clinical relevance. Accordingly, accurate determination of theminimally important difference (MID) is crucial to assess the effectiveness of health care interventions, as wellas for sample size calculation. Several methods have been proposed to determine the MID. Our aim was toreview the statistical methods used to determine MID in patient-reported outcome (PRO) questionnaires incancer patients, focusing on the distribution- and anchor-based approaches and to present the variability ofcriteria used as well as possible limitations.
Methods: We performed a systematic search using PubMed. We searched for all cancer studies related toMID determination on a PRO questionnaire. Two reviewers independently screened titles and abstracts toidentify relevant articles. Data were extracted from eligible articles using a predefined data collection form.Discrepancies were resolved by discussion and the involvement of a third reviewer.
Results: Sixty-three articles were identified, of which 46 were retained for final analysis. Both distribution- and anchor-based approaches were used to assess the MID in 37 studies (80.4%). Different time points were used to apply thedistribution-based method and the most frequently reported distribution was the 0.5 standard deviation at baseline. Achange in a PRO external scale (N = 13, 30.2%) and performance status (N = 15, 34.9%) were the most frequently usedanchors. The stability of the MID over time was rarely investigated and only 28.2% of studies used at least 3 assessmenttimepoints. The robustness of anchor-based MID was questionable in 37.2% of the studies where the minimal numberof patients by anchor category was less than 20.
Conclusion: Efforts are needed to improve the quality of the methodology used for MID determination in PROquestionnaires used in oncology. In particular, increased attention to the sample size should be paid to guaranteereliable results. This could increase the use of these specific thresholds in future studies.
Keywords: Patient-reported outcomes, Minimally important difference, Anchor-based approach, Distribution-basedapproach
* Correspondence: [email protected]†Ahmad Ousmen and Célia Touraine contributed equally to this work.1Methodology and Quality of Life in Oncology Unit (INSERM UMR 1098),University Hospital of Besançon, Besançon, FranceFull list of author information is available at the end of the article
© The Author(s). 2018 Open Access This article is distributed under the terms of the Creative Commons Attribution 4.0International License (http://creativecommons.org/licenses/by/4.0/), which permits unrestricted use, distribution, andreproduction in any medium, provided you give appropriate credit to the original author(s) and the source, provide a link tothe Creative Commons license, and indicate if changes were made. The Creative Commons Public Domain Dedication waiver(http://creativecommons.org/publicdomain/zero/1.0/) applies to the data made available in this article, unless otherwise stated.
Ousmen et al. Health and Quality of Life Outcomes (2018) 16:228 https://doi.org/10.1186/s12955-018-1055-z
IntroductionThe use of patient-reported outcomes (PRO), includinghealth-related quality of life (HRQOL), in cancer clinicaltrials has substantially increased over the years [1]. PROsare critical to fully understand overall treatment effect-iveness and to establish the benefit of a given experi-mental drug over the standard of care in a particularcancer population [2, 3]. Thus, assessment and analysisof PRO data must be carried out in compliance with arigorous and appropriate methodology to ensure robustinterpretation of the results [4].The interpretation of PRO scores and their clinical im-
portance is a major challenge, in terms of both clinicallyrelevant score differences between two measurementtimes and two treatment arms [5]. A statistically signifi-cant result may not be clinically relevant, as it shouldalso reflect changes or differences that are meaningfulfor the patient, i.e., they should take into account a min-imally important difference (MID). The MID was de-fined by Jaeschke et al. as “the smallest change in anoutcome that a patient would identify as important” [6].Hence, the determination of the MID is crucial in orderto assess the effectiveness of health care interventions,as well as for sample size calculation when HRQOL isthe primary or co-primary endpoint in clinical trials.Different methods have been proposed to determine
the MID. These methods are generally grouped into twocategories, namely anchor-based and distribution-basedapproaches [7, 8]. The anchor-based approaches use anexternal indicator, called an “anchor”, and differencescan be determined either cross-sectionally (differencesbetween clinically-defined groups at one time point) orlongitudinally (change in the scores of a single groupover time). The anchor can be either an objective meas-ure (e.g., Karnofsky or ECOG performance status) or asubjective measure, generally reflecting the patient’spoint of view, which is of interest (for example, the pa-tient rating of change). Distribution-based approachesare based on statistical criteria from the PRO scores.These approaches include fractions of the standard devi-ation (SD) of PRO scores, the effect size [9], and thestandard error of measurement (SEM) [10] as estimatesfor the MID. Distribution-based approaches have the ad-vantage of simplicity of use, since they do not require anexternal criterion. However, they produce similar MIDresults for both deterioration and improvement. Thissimplifies the interpretation but may be questionable,since a larger MID is often observed for deteriorationthan for improvement [11].Some recommendations have been proposed regarding
the best method to apply, depending on the design ofthe study. For instance, analysis must rely primarily onrelevant patient-based and clinical anchors [12]. More-over, both distribution- and anchor-based approaches
remain the most commonly used methods to determinethe MID [13]. However, robust and reliable determin-ation of the MID remain challenging. In fact, due to thelongitudinal design often used in MID analyses, a poten-tial response shift effect may bias the results. The impactof the response shift effect on the longitudinal analysisof PRO is well established and has been widely studied[14]. However, studies investigating the impact of re-sponse shift effect on MID determination remain sparse[15]. Another important possible limitation of studiesaiming to determine the MID is the sample size. Indeed,most studies aiming to explore the MID on a given PROquestionnaire use data from an existing cohort or ran-domized clinical trial. Thus, the volume of available datamay not be sufficient to provide a reliable MID, in par-ticular due to the number of possible categories for theanchor.To date, longitudinal studies in oncology generally
used the thresholds proposed by Osoba et al. in 1998 [5]for HRQOL for the interpretation of results, i.e. an MIDof 5 or 10 points. However, these thresholds were ob-tained only on data collected with the European Organ-isation for Research and Treatment of Cancer (EORTC)QLQ-C30 cancer-specific questionnaire. A more recentmeta-analysis proposed specific thresholds for eachHRQOL scale of the EORTC QLQ-C30, and for eachdirection, i.e. improvement or deterioration [16]. Otherstudies proposed MID for specific cancer site question-naires, such as the EORTC QLQ-BN20 for brain cancer[17], but few studies use these specific thresholds to in-terpret HRQOL results.In this context, the objective of this structured review
was to assess the most common practices used by thedistribution and anchor-based approaches to determinethe MID for PRO questionnaires in oncology, as well asthe characteristics and the possible limitations relative toeach approach.
MethodsSearch and selection strategyA systematic literature search was performed in thePubmed database, of all articles published betweenJanuary 2000 and May 2018. Eligible studies includedoriginal articles aiming to determine the MID ofself-administered questionnaires in cancer, using distri-bution- and/or anchor based approaches. Only staticquestionnaires were considered, i.e. questionnaires thathave a fixed number of questions answered by patient. Itmeans, all patients will answer to the same questions inthe same order. Accordingly, computer adaptive testswere not included in this review. Indeed, all studiesusing Item Response Theory models were not includedsince these types of models are very specific and resultscould not be directly comparable to studies using the
Ousmen et al. Health and Quality of Life Outcomes (2018) 16:228 Page 2 of 12
summary score. All non-cancer studies were excluded aswell as reviews and meta-analysis. The following searchstrategy was used:(MCID OR MID OR MCIDs OR MIDs OR “minimal
clinically important” OR “minimum clinically important”OR “minimally clinically important” OR “minimal im-portant” OR “minimally important” OR “clinically mean-ingful” OR “meaningful change” OR “meaningfulchanges” OR “meaningful difference” OR “meaningfuldifferences” OR “cutoff score” OR “cutoff scores”) AND(“quality of life” OR QoL OR “patient-reported out-comes” OR “patient-reported outcome” OR PRO ORPROs OR HRQOL OR symptom OR symptoms) AND(“anchor-based” OR “distribution-based” OR anchoredOR anchor) AND cancer AND (“2000/01/01”[Date -MeSH]: “2018/05/31”[Date - MeSH])
Data extractionTwo reviewers (A.O., C.T.) independently screened firsttitles and abstracts and secondly full paper to identifyrelevant articles. Then, they independently extracted in-formation from eligible studies using a predefined dataextraction form (DEF). All discrepancies were resolvedby mutual consensus. In case of disagreement, a thirdauthor (A.A.) was consulted to reach a final consensus.This literature review was performed according to the
Preferred Reporting Items for Systematic Reviews andMeta-Analysis (PRISMA) statement guidelines [18] andthe following details were extracted:
– General items, namely, year of publication, numberof patients, disease stage, type of study (randomizedclinical trial, prospective cohort, or other), studylocation, international and multicenter study or not.
– Items regarding the PRO assessment, including thename of the PRO questionnaire for which the MIDwas determined, the time windows and number ofmeasurement times considered for the MIDdetermination.
– Items regarding the MID determination, including theterm used for the MID designation (e.g., minimalimportant difference or minimal clinically importantdifference), name and number of PRO scales analyzed,level for statistical significance if appropriate, type (e.g.distribution or anchor based approach) and number ofapproaches used (1 or 2), and the design considered(cross-sectional or longitudinal). Regarding theanchor-based approach, information on the numberand type of anchors used, the threshold considered toqualify the minimal important change, whether thecorrelation between the anchor and HRQOL/PROscores was assessed, and the minimum number ofpatients included in each category of the anchorwere collected. For the distribution-based
approach, different criteria were extracted. Finally,whatever the method(s) used, we also recordedthe recommendations proposed for the MID to beused in future studies, the limitations highlightedby the authors, and the potential risks of bias (forinstance, missing data, bias in the selectionpopulation and bias in the statistical analysis (e.g.correlation between anchor and HRQOL scorenot assessed for longitudinal studies)).
Data analysisA descriptive analysis of eligible publications was per-formed. Qualitative variables were summarized bytabulating frequency distribution and percentages andquantitative data by median and interquartile range(IQR). Analyses were performed using SAS version 9.3.(SAS Institute Inc., Cary, NC, USA).
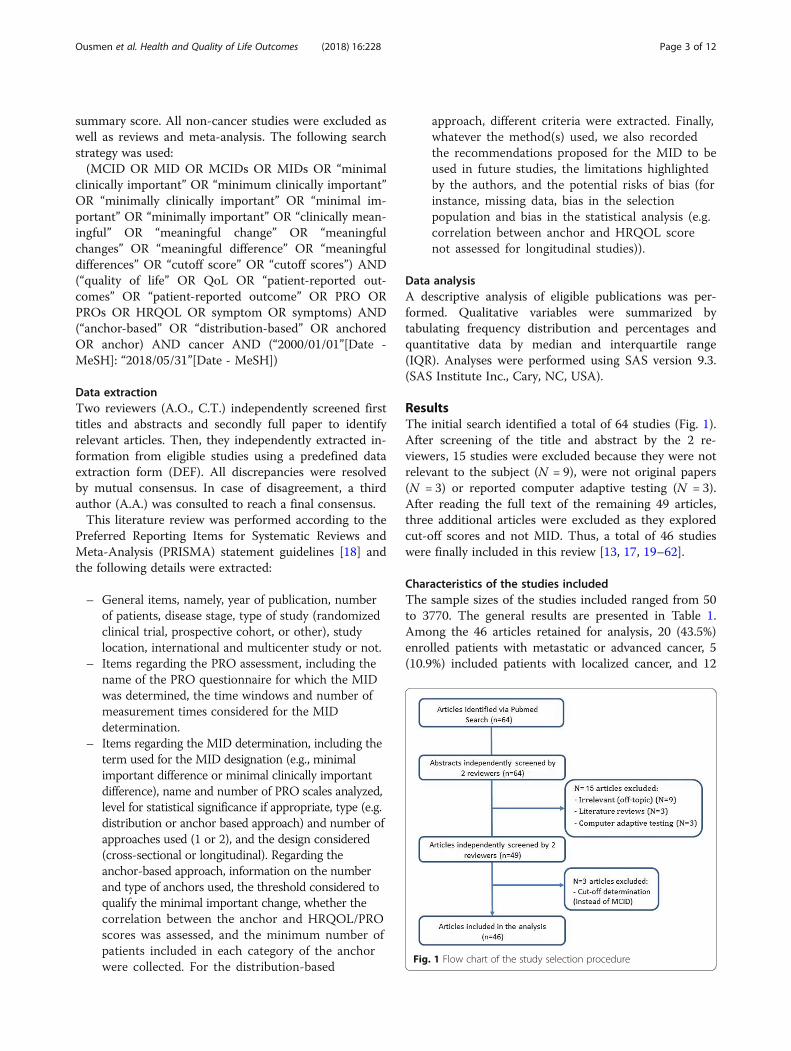
ResultsThe initial search identified a total of 64 studies (Fig. 1).After screening of the title and abstract by the 2 re-viewers, 15 studies were excluded because they were notrelevant to the subject (N = 9), were not original papers(N = 3) or reported computer adaptive testing (N = 3).After reading the full text of the remaining 49 articles,three additional articles were excluded as they exploredcut-off scores and not MID. Thus, a total of 46 studieswere finally included in this review [13, 17, 19–62].
Characteristics of the studies includedThe sample sizes of the studies included ranged from 50to 3770. The general results are presented in Table 1.Among the 46 articles retained for analysis, 20 (43.5%)enrolled patients with metastatic or advanced cancer, 5(10.9%) included patients with localized cancer, and 12
Fig. 1 Flow chart of the study selection procedure
Ousmen et al. Health and Quality of Life Outcomes (2018) 16:228 Page 3 of 12
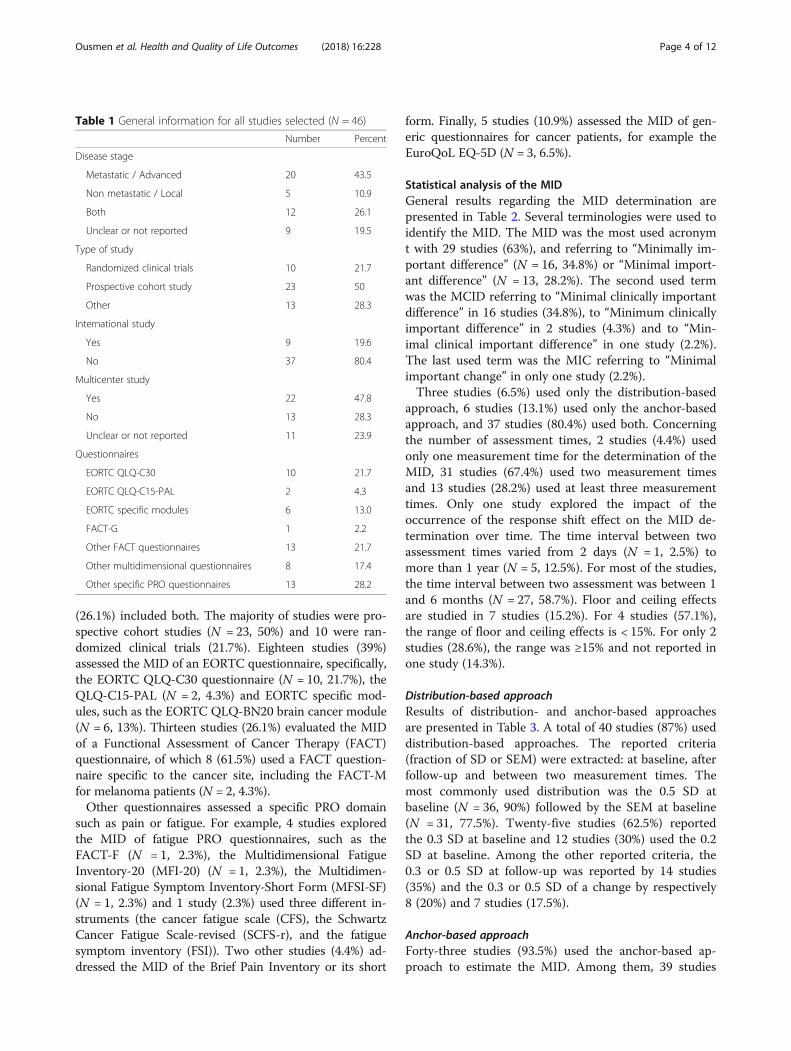
(26.1%) included both. The majority of studies were pro-spective cohort studies (N = 23, 50%) and 10 were ran-domized clinical trials (21.7%). Eighteen studies (39%)assessed the MID of an EORTC questionnaire, specifically,the EORTC QLQ-C30 questionnaire (N = 10, 21.7%), theQLQ-C15-PAL (N = 2, 4.3%) and EORTC specific mod-ules, such as the EORTC QLQ-BN20 brain cancer module(N = 6, 13%). Thirteen studies (26.1%) evaluated the MIDof a Functional Assessment of Cancer Therapy (FACT)questionnaire, of which 8 (61.5%) used a FACT question-naire specific to the cancer site, including the FACT-Mfor melanoma patients (N = 2, 4.3%).Other questionnaires assessed a specific PRO domain
such as pain or fatigue. For example, 4 studies exploredthe MID of fatigue PRO questionnaires, such as theFACT-F (N = 1, 2.3%), the Multidimensional FatigueInventory-20 (MFI-20) (N = 1, 2.3%), the Multidimen-sional Fatigue Symptom Inventory-Short Form (MFSI-SF)(N = 1, 2.3%) and 1 study (2.3%) used three different in-struments (the cancer fatigue scale (CFS), the SchwartzCancer Fatigue Scale-revised (SCFS-r), and the fatiguesymptom inventory (FSI)). Two other studies (4.4%) ad-dressed the MID of the Brief Pain Inventory or its short
form. Finally, 5 studies (10.9%) assessed the MID of gen-eric questionnaires for cancer patients, for example theEuroQoL EQ-5D (N = 3, 6.5%).
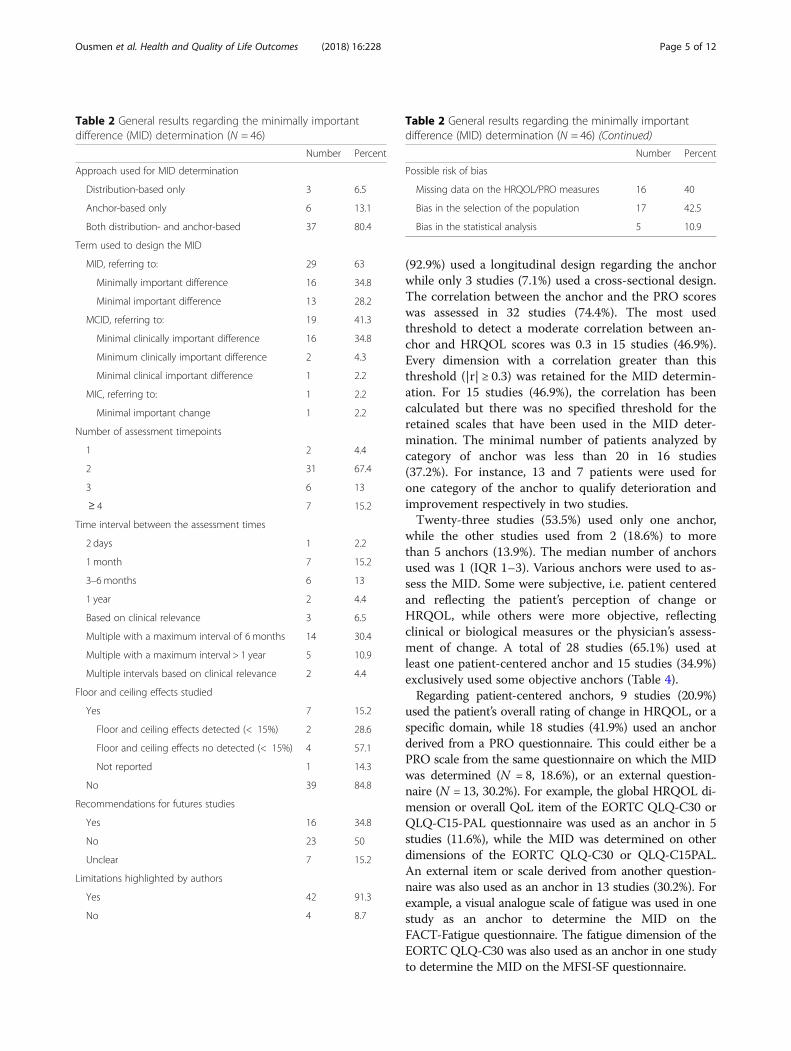
Statistical analysis of the MIDGeneral results regarding the MID determination arepresented in Table 2. Several terminologies were used toidentify the MID. The MID was the most used acronymt with 29 studies (63%), and referring to “Minimally im-portant difference” (N = 16, 34.8%) or “Minimal import-ant difference” (N = 13, 28.2%). The second used termwas the MCID referring to “Minimal clinically importantdifference” in 16 studies (34.8%), to “Minimum clinicallyimportant difference” in 2 studies (4.3%) and to “Min-imal clinical important difference” in one study (2.2%).The last used term was the MIC referring to “Minimalimportant change” in only one study (2.2%).Three studies (6.5%) used only the distribution-based
approach, 6 studies (13.1%) used only the anchor-basedapproach, and 37 studies (80.4%) used both. Concerningthe number of assessment times, 2 studies (4.4%) usedonly one measurement time for the determination of theMID, 31 studies (67.4%) used two measurement timesand 13 studies (28.2%) used at least three measurementtimes. Only one study explored the impact of theoccurrence of the response shift effect on the MID de-termination over time. The time interval between twoassessment times varied from 2 days (N = 1, 2.5%) tomore than 1 year (N = 5, 12.5%). For most of the studies,the time interval between two assessment was between 1and 6 months (N = 27, 58.7%). Floor and ceiling effectsare studied in 7 studies (15.2%). For 4 studies (57.1%),the range of floor and ceiling effects is < 15%. For only 2studies (28.6%), the range was ≥15% and not reported inone study (14.3%).
Distribution-based approachResults of distribution- and anchor-based approachesare presented in Table 3. A total of 40 studies (87%) useddistribution-based approaches. The reported criteria(fraction of SD or SEM) were extracted: at baseline, afterfollow-up and between two measurement times. Themost commonly used distribution was the 0.5 SD atbaseline (N = 36, 90%) followed by the SEM at baseline(N = 31, 77.5%). Twenty-five studies (62.5%) reportedthe 0.3 SD at baseline and 12 studies (30%) used the 0.2SD at baseline. Among the other reported criteria, the0.3 or 0.5 SD at follow-up was reported by 14 studies(35%) and the 0.3 or 0.5 SD of a change by respectively8 (20%) and 7 studies (17.5%).
Anchor-based approachForty-three studies (93.5%) used the anchor-based ap-proach to estimate the MID. Among them, 39 studies
Table 1 General information for all studies selected (N = 46)
Number Percent
Disease stage
Metastatic / Advanced 20 43.5
Non metastatic / Local 5 10.9
Both 12 26.1
Unclear or not reported 9 19.5
Type of study
Randomized clinical trials 10 21.7
Prospective cohort study 23 50
Other 13 28.3
International study
Yes 9 19.6
No 37 80.4
Multicenter study
Yes 22 47.8
No 13 28.3
Unclear or not reported 11 23.9
Questionnaires
EORTC QLQ-C30 10 21.7
EORTC QLQ-C15-PAL 2 4.3
EORTC specific modules 6 13.0
FACT-G 1 2.2
Other FACT questionnaires 13 21.7
Other multidimensional questionnaires 8 17.4
Other specific PRO questionnaires 13 28.2
Ousmen et al. Health and Quality of Life Outcomes (2018) 16:228 Page 4 of 12
(92.9%) used a longitudinal design regarding the anchorwhile only 3 studies (7.1%) used a cross-sectional design.The correlation between the anchor and the PRO scoreswas assessed in 32 studies (74.4%). The most usedthreshold to detect a moderate correlation between an-chor and HRQOL scores was 0.3 in 15 studies (46.9%).Every dimension with a correlation greater than thisthreshold (|r| ≥ 0.3) was retained for the MID determin-ation. For 15 studies (46.9%), the correlation has beencalculated but there was no specified threshold for theretained scales that have been used in the MID deter-mination. The minimal number of patients analyzed bycategory of anchor was less than 20 in 16 studies(37.2%). For instance, 13 and 7 patients were used forone category of the anchor to qualify deterioration andimprovement respectively in two studies.Twenty-three studies (53.5%) used only one anchor,
while the other studies used from 2 (18.6%) to morethan 5 anchors (13.9%). The median number of anchorsused was 1 (IQR 1–3). Various anchors were used to as-sess the MID. Some were subjective, i.e. patient centeredand reflecting the patient’s perception of change orHRQOL, while others were more objective, reflectingclinical or biological measures or the physician’s assess-ment of change. A total of 28 studies (65.1%) used atleast one patient-centered anchor and 15 studies (34.9%)exclusively used some objective anchors (Table 4).Regarding patient-centered anchors, 9 studies (20.9%)
used the patient’s overall rating of change in HRQOL, or aspecific domain, while 18 studies (41.9%) used an anchorderived from a PRO questionnaire. This could either be aPRO scale from the same questionnaire on which the MIDwas determined (N = 8, 18.6%), or an external question-naire (N = 13, 30.2%). For example, the global HRQOL di-mension or overall QoL item of the EORTC QLQ-C30 orQLQ-C15-PAL questionnaire was used as an anchor in 5studies (11.6%), while the MID was determined on otherdimensions of the EORTC QLQ-C30 or QLQ-C15PAL.An external item or scale derived from another question-naire was also used as an anchor in 13 studies (30.2%). Forexample, a visual analogue scale of fatigue was used in onestudy as an anchor to determine the MID on theFACT-Fatigue questionnaire. The fatigue dimension of theEORTC QLQ-C30 was also used as an anchor in one studyto determine the MID on the MFSI-SF questionnaire.
Table 2 General results regarding the minimally importantdifference (MID) determination (N = 46)
Number Percent
Approach used for MID determination
Distribution-based only 3 6.5
Anchor-based only 6 13.1
Both distribution- and anchor-based 37 80.4
Term used to design the MID
MID, referring to: 29 63
Minimally important difference 16 34.8
Minimal important difference 13 28.2
MCID, referring to: 19 41.3
Minimal clinically important difference 16 34.8
Minimum clinically important difference 2 4.3
Minimal clinical important difference 1 2.2
MIC, referring to: 1 2.2
Minimal important change 1 2.2
Number of assessment timepoints
1 2 4.4
2 31 67.4
3 6 13
≥ 4 7 15.2
Time interval between the assessment times
2 days 1 2.2
1 month 7 15.2
3–6 months 6 13
1 year 2 4.4
Based on clinical relevance 3 6.5
Multiple with a maximum interval of 6 months 14 30.4
Multiple with a maximum interval > 1 year 5 10.9
Multiple intervals based on clinical relevance 2 4.4
Floor and ceiling effects studied
Yes 7 15.2
Floor and ceiling effects detected (< 15%) 2 28.6
Floor and ceiling effects no detected (< 15%) 4 57.1
Not reported 1 14.3
No 39 84.8
Recommendations for futures studies
Yes 16 34.8
No 23 50
Unclear 7 15.2
Limitations highlighted by authors
Yes 42 91.3
No 4 8.7
Table 2 General results regarding the minimally importantdifference (MID) determination (N = 46) (Continued)
Number Percent
Possible risk of bias
Missing data on the HRQOL/PRO measures 16 40
Bias in the selection of the population 17 42.5
Bias in the statistical analysis 5 10.9
Ousmen et al. Health and Quality of Life Outcomes (2018) 16:228 Page 5 of 12
Regarding clinical anchors, the performance status (ei-ther Karnofsky or ECOG) was used in 15 studies(34.9%). Weight loss and the Mini-Mental State Examin-ation (MMSE) score were both used in one study (2.3%).Studies using the same anchor did not necessarily use
the same threshold to qualify the minimal change forthe anchor. For example, among the 5 studies using theglobal HRQOL dimension or its items individually as ananchor, 2 studies used a 10-point difference in the globalscore as a minimal change and 3 studies used only oneitem of the overall QoL scale by considering a change oftwo units (N = 2) or one unit (N = 1) as the minimalchange. When these single items are standardized on a 0to 100 scale, a change of one unit corresponds to achange of 16.7 points and a change of two units corre-sponds to a change of 33.3 points. Regarding studiesusing physician-reported performance status as an an-chor, they generally used a 10 point difference for theKarnofsky index and change of one category for theECOG as a clinically relevant change.To complement these results, we summarized the infor-
mation collected for the main questionnaires used in ourreview, namely the EORTC QLQ-C30 and the FACTquestionnaire in the Additional file 1: Table S1. Amongthe 23 studies using either the EORTC QLQ-C30 or theFACT questionnaire, 18 (78.3%) used both distributionand anchor-based method to determine the MID. Amongthe 21 studies that used the anchor-based approach to de-termine the MID for either EORTC QLQ-C30 or FACTquestionnaires, 4 studies (19%) determined the MID with-out distinction between improvement and deterioration.Sixteen studies (34.8%) proposed recommendations for
MID for use in futures studies. In the majority of studies(N = 42, 91.3%), some limitations were reported by theauthors. Regarding the possible risk of bias, 16 studies(43.2%) were impacted by the occurrence of missing dataon the PRO measures; in 17 studies (47.2%), the selec-tion of the population could be subject to a risk of bias,and for 5 studies (19.2%) there was a risk of bias due tothe statistical analysis.
DiscussionThe objective of this structured review was to assess themost common practices used by the distribution and
Table 3 Results of distribution and anchor based approaches(N = 46)
Number Percent
Distribution-based approach (N = 40)
Distribution-reported
0.2 SD at baseline 12 30
0.3 SD at baseline 25 62.5
0.5 SD at baseline 36 90
SEM at baseline 31 77.5
0.2 SD at follow-up 7 17.5
0.3 SD at follow-up 14 35
0.5 SD at follow-up 14 35
SEM at follow-up 13 32.5
0.2 SD of change 2 5
0.3 SD of change 8 20
0.5 SD of change 7 17.5
SEM of change 5 12.5
Anchor-based approach (N = 43)
Study design
Cross-sectional 3 7.1
Longitudinal design 39 92.9
Number of anchors
1 23 53.5
2 8 18.6
3 3 7
4 3 7
≥ 5 6 13.9
Anchors
Overall rating of change 9 20.93
Anchor derived from an external questionnaire 13 30.2
Anchor derived from one dimension of thequestionnaire studied
8 18.6
Performance status 15 34.9
MMSE 1 2.3
Weight loss 1 2.3
Other 10 23.3
Correlation checked between anchorand the studied questionnaire
Yes 32 76.2
No 9 21.4
Criteria used to detect a moderate correlation (N = 32)
≥ 0.3 15 46.9
≥ 0.4 1 3.1
≥ 0.5 1 3.1
Not reported 15 46.9
Table 3 Results of distribution and anchor based approaches(N = 46) (Continued)
Number Percent
Minimum N by anchor category
≤ 20 16 37.2
> 20 18 41.9
Not reported 9 20.9
SD standard deviation, SEM standard error of measurement, MMSE mini mentalstate examination
Ousmen et al. Health and Quality of Life Outcomes (2018) 16:228 Page 6 of 12
anchor based approaches to determine the MID for PROquestionnaires in oncology, and to present the variabilityof criteria used as well as possible limitations relative toeach approach. We limited our research to year 2000 be-cause we think a review of papers published since almosttwo decades would be reasonable and enough to con-duct this review. Eligible studies included original arti-cles aiming to determine the MID of self-administeredquestionnaires in cancer, using distribution- and/or an-chor based approaches.Using both the distribution and anchor-based ap-
proaches, as was the case in the majority of studies (80%),makes it possible to compare results for consistency, tohighlight the strengths and weaknesses of each method,and to retain the most appropriate MID value or range toapply in further studies [12].For the distribution-based approach, several criteria
were reported at different assessment times. As alreadyhighlighted in previous reviews [63], the most frequentlyreported criterion was 0.5 SD at baseline, reported in90% of studies using the distribution-based method.Despite the simplicity and the widespread use of this ap-proach in the determination of the MID, no distinctioncan be made between improvement and deterioration.Regarding the anchor-based approach, most studies
used a longitudinal design (92.9%). Various anchors wereapplied, and were either patient- or physician-reportedmeasures, as well as clinical or biological measures withclinical relevance. The most commonly used anchor wasa PRO score or item, derived from the questionnaire ofinterest or from another questionnaire (41.9%). Whenthis anchor was derived from the questionnaire forwhich the MID was being determined, then the MID onthe corresponding dimension could not be assessed. Thisis the case for example when the overall HRQOL scoreis used as an anchor to estimate the MID on theQLQ-C30. Moreover, this requires to fix a threshold toqualify the clinically meaningful change on one dimen-sion of the studied questionnaire. Finally, the choice ofthis kind of anchor could be questionable since theproperty of external criteria for the anchor is not entirelyrespected.Another frequently used patient-centered anchor (used
in 20.9% of the studies using the anchor-based approach)is the patient’s overall rating of change. This anchor re-flects the patient’s perception of change, but it needs tobe planned in the design of the study.A large proportion of studies also used physician-reported
measures such as performance status or MMSE score.These anchors could be considered as objective evaluationsof the patient’s health status. However, they may not be ap-propriate for the assessment of the MID on all HRQOL di-mensions. Given that performance status reflects thephysical condition of the patient, it is generally correlated to
the physical dimensions of HRQOL. Similarly, the MMSE ismostly correlated with the cognitive dimension of HRQOL.Thus, these anchors preclude assessment of the MID formore physiological or emotional dimensions of HRQOL[17]. This also means that several anchors are needed to ac-curately assess the MID and to check the robustness andcomplementarity of the results obtained using different an-chors [12]. In our review, half the studies (53.5%) using ananchor-based approach used only one anchor. For the ma-jority of the studies, the correlation between the anchor andscores of the studied questionnaire has been checked. Thethreshold of 0.3 was the most used criteria to detect a mod-erate correlation. On the other side, an important frequencyof studies (46.9%) from those who checked correlation didnot reported the criteria to identify a moderate correlation.Generally, checking correlation is important to know towhat extent the anchor used is linked to HRQOL measure.Hence, the correlation between the anchor and the PROscores must be assessed and only dimensions that aresignificantly correlated with the anchor (correlation coeffi-cient |r| > 0.3) should be analyzed. In this review, 76.2% ofthe studies using an anchor-based approach verified thiscorrelation.The majority of the studies with a longitudinal design
(58.7%) used a time interval between 1 and 6 months be-tween two consecutive assessments. However, wide vari-ation was observed between studies. A standard periodremains to be determined, and further research is war-ranted to determine a suitable time window. This pointis particularly important when the patient’s overall ratingof change is used as an anchor, since long periods be-tween assessments could induce a recall bias.The majority of studies (71.7%) used one or two meas-
urement times to determine the MID, but the stabilityover time was rarely investigated. For example, a changein PRO score of 5 points could be insignificant for thepatients at the time of diagnosis, whereas it might behighly relevant after surgery. Therefore, it is stronglyrecommended to assess the MID with more than twomeasurement times [62]. This change in the patients’perception of HRQOL change over time could reflectthe occurrence of a response shift effect [64]. In our re-view, only one study investigated the impact of the oc-currence of response shift on the MID determinationusing the patient’s overall rating of change as the anchor.However, the response shift effect could differentiallyimpact on the results of the MID depending on the an-chor used. Future studies are warranted to investigatethis possible risk of bias and take it into account in theMID determination [15].Several terminologies were used to identify the MID.
However, using a standardized term and acronym refer-ring to the MID should be investigated in future studiesto avoid variability in terminology and to obtain more
Ousmen et al. Health and Quality of Life Outcomes (2018) 16:228 Page 7 of 12
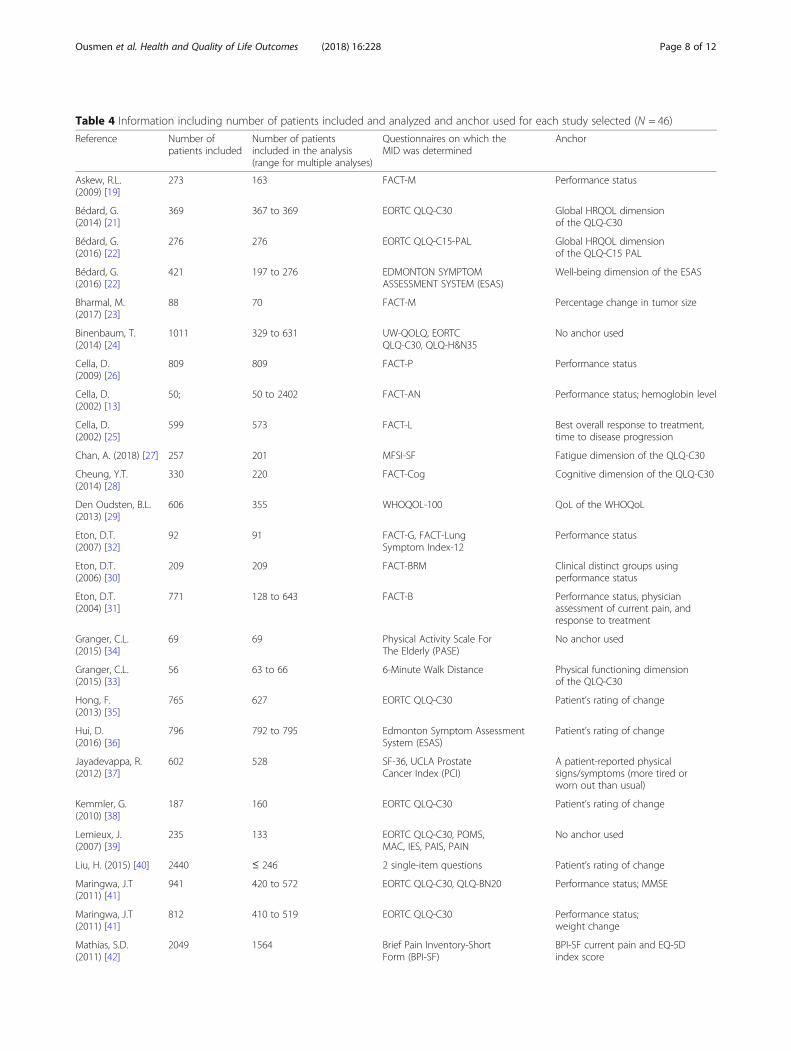
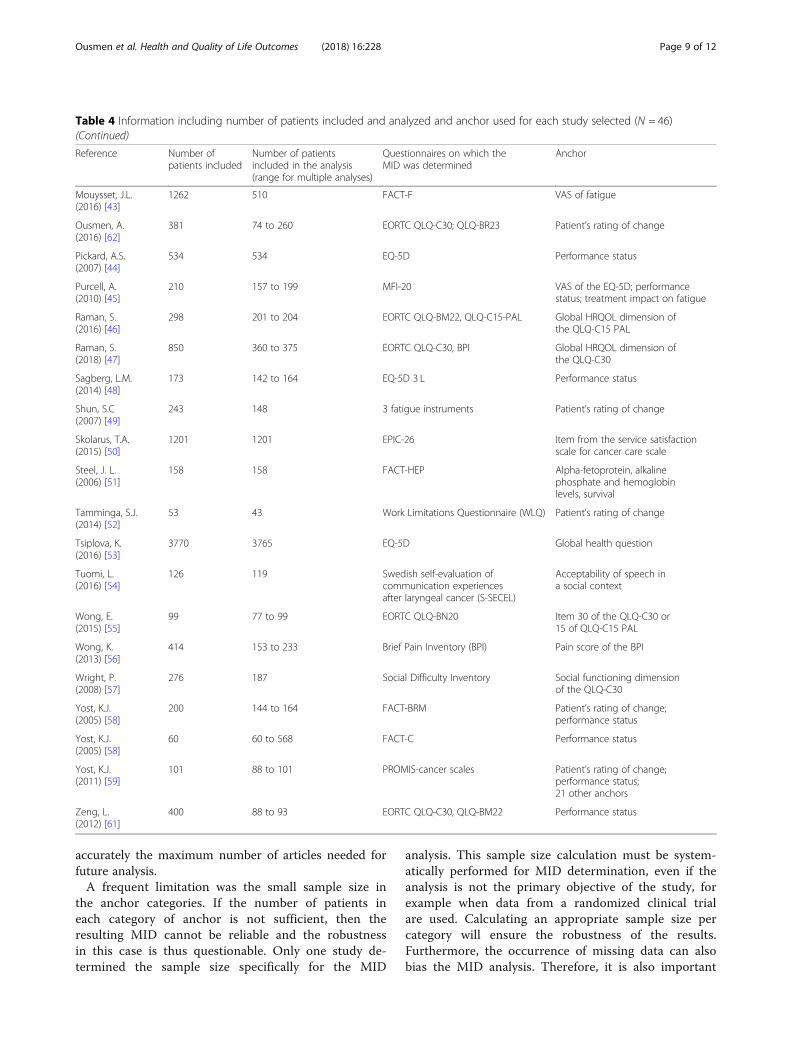
Table 4 Information including number of patients included and analyzed and anchor used for each study selected (N = 46)
Reference Number ofpatients included
Number of patientsincluded in the analysis(range for multiple analyses)
Questionnaires on which theMID was determined
Anchor
Askew, R.L.(2009) [19]
273 163 FACT-M Performance status
Bédard, G.(2014) [21]
369 367 to 369 EORTC QLQ-C30 Global HRQOL dimensionof the QLQ-C30
Bédard, G.(2016) [22]
276 276 EORTC QLQ-C15-PAL Global HRQOL dimensionof the QLQ-C15 PAL
Bédard, G.(2016) [22]
421 197 to 276 EDMONTON SYMPTOMASSESSMENT SYSTEM (ESAS)
Well-being dimension of the ESAS
Bharmal, M.(2017) [23]
88 70 FACT-M Percentage change in tumor size
Binenbaum, T.(2014) [24]
1011 329 to 631 UW-QOLQ, EORTCQLQ-C30, QLQ-H&N35
No anchor used
Cella, D.(2009) [26]
809 809 FACT-P Performance status
Cella, D.(2002) [13]
50; 50 to 2402 FACT-AN Performance status; hemoglobin level
Cella, D.(2002) [25]
599 573 FACT-L Best overall response to treatment,time to disease progression
Chan, A. (2018) [27] 257 201 MFSI-SF Fatigue dimension of the QLQ-C30
Cheung, Y.T.(2014) [28]
330 220 FACT-Cog Cognitive dimension of the QLQ-C30
Den Oudsten, B.L.(2013) [29]
606 355 WHOQOL-100 QoL of the WHOQoL
Eton, D.T.(2007) [32]
92 91 FACT-G, FACT-LungSymptom Index-12
Performance status
Eton, D.T.(2006) [30]
209 209 FACT-BRM Clinical distinct groups usingperformance status
Eton, D.T.(2004) [31]
771 128 to 643 FACT-B Performance status, physicianassessment of current pain, andresponse to treatment
Granger, C.L.(2015) [34]
69 69 Physical Activity Scale ForThe Elderly (PASE)
No anchor used
Granger, C.L.(2015) [33]
56 63 to 66 6-Minute Walk Distance Physical functioning dimensionof the QLQ-C30
Hong, F.(2013) [35]
765 627 EORTC QLQ-C30 Patient’s rating of change
Hui, D.(2016) [36]
796 792 to 795 Edmonton Symptom AssessmentSystem (ESAS)
Patient’s rating of change
Jayadevappa, R.(2012) [37]
602 528 SF-36, UCLA ProstateCancer Index (PCI)
A patient-reported physicalsigns/symptoms (more tired orworn out than usual)
Kemmler, G.(2010) [38]
187 160 EORTC QLQ-C30 Patient’s rating of change
Lemieux, J.(2007) [39]
235 133 EORTC QLQ-C30, POMS,MAC, IES, PAIS, PAIN
No anchor used
Liu, H. (2015) [40] 2440 ≤ 246 2 single-item questions Patient’s rating of change
Maringwa, J.T(2011) [41]
941 420 to 572 EORTC QLQ-C30, QLQ-BN20 Performance status; MMSE
Maringwa, J.T(2011) [41]
812 410 to 519 EORTC QLQ-C30 Performance status;weight change
Mathias, S.D.(2011) [42]
2049 1564 Brief Pain Inventory-ShortForm (BPI-SF)
BPI-SF current pain and EQ-5Dindex score
Ousmen et al. Health and Quality of Life Outcomes (2018) 16:228 Page 8 of 12
accurately the maximum number of articles needed forfuture analysis.A frequent limitation was the small sample size in
the anchor categories. If the number of patients ineach category of anchor is not sufficient, then theresulting MID cannot be reliable and the robustnessin this case is thus questionable. Only one study de-termined the sample size specifically for the MID
analysis. This sample size calculation must be system-atically performed for MID determination, even if theanalysis is not the primary objective of the study, forexample when data from a randomized clinical trialare used. Calculating an appropriate sample size percategory will ensure the robustness of the results.Furthermore, the occurrence of missing data can alsobias the MID analysis. Therefore, it is also important
Table 4 Information including number of patients included and analyzed and anchor used for each study selected (N = 46)(Continued)
Reference Number ofpatients included
Number of patientsincluded in the analysis(range for multiple analyses)
Questionnaires on which theMID was determined
Anchor
Mouysset, J.L.(2016) [43]
1262 510 FACT-F VAS of fatigue
Ousmen, A.(2016) [62]
381 74 to 260 EORTC QLQ-C30; QLQ-BR23 Patient’s rating of change
Pickard, A.S.(2007) [44]
534 534 EQ-5D Performance status
Purcell, A.(2010) [45]
210 157 to 199 MFI-20 VAS of the EQ-5D; performancestatus; treatment impact on fatigue
Raman, S.(2016) [46]
298 201 to 204 EORTC QLQ-BM22, QLQ-C15-PAL Global HRQOL dimension ofthe QLQ-C15 PAL
Raman, S.(2018) [47]
850 360 to 375 EORTC QLQ-C30, BPI Global HRQOL dimension ofthe QLQ-C30
Sagberg, L.M.(2014) [48]
173 142 to 164 EQ-5D 3 L Performance status
Shun, S.C(2007) [49]
243 148 3 fatigue instruments Patient’s rating of change
Skolarus, T.A.(2015) [50]
1201 1201 EPIC-26 Item from the service satisfactionscale for cancer care scale
Steel, J. L.(2006) [51]
158 158 FACT-HEP Alpha-fetoprotein, alkalinephosphate and hemoglobinlevels, survival
Tamminga, S.J.(2014) [52]
53 43 Work Limitations Questionnaire (WLQ) Patient’s rating of change
Tsiplova, K.(2016) [53]
3770 3765 EQ-5D Global health question
Tuomi, L.(2016) [54]
126 119 Swedish self-evaluation ofcommunication experiencesafter laryngeal cancer (S-SECEL)
Acceptability of speech ina social context
Wong, E.(2015) [55]
99 77 to 99 EORTC QLQ-BN20 Item 30 of the QLQ-C30 or15 of QLQ-C15 PAL
Wong, K.(2013) [56]
414 153 to 233 Brief Pain Inventory (BPI) Pain score of the BPI
Wright, P.(2008) [57]
276 187 Social Difficulty Inventory Social functioning dimensionof the QLQ-C30
Yost, K.J.(2005) [58]
200 144 to 164 FACT-BRM Patient’s rating of change;performance status
Yost, K.J.(2005) [58]
60 60 to 568 FACT-C Performance status
Yost, K.J.(2011) [59]
101 88 to 101 PROMIS-cancer scales Patient’s rating of change;performance status;21 other anchors
Zeng, L.(2012) [61]
400 88 to 93 EORTC QLQ-C30, QLQ-BM22 Performance status
Ousmen et al. Health and Quality of Life Outcomes (2018) 16:228 Page 9 of 12
to determine the profile of missing data, and considerimputing missing data using the appropriate method.Using only one electronic database (PubMed searches)
was the main limitation of this work. Unfortunately, dueto lack of resource, we could not use other databases toperform this review. A risk of bias could thus be ob-served since other interesting papers may not be cap-tured in this database. Hopefully, a manual researchconducted to the same papers obtained via our algo-rithm in Pubmed.This review must be expanded in future studies to
address all methods that have been used to determinethe MID either if they are including or not includingin distribution-based or anchor-based methods (i.e.minimal detectable change, Receiver operating charac-teristic (ROC) curve, Item Response Theory, etc.).In light of these results, greater attention should
be paid to the methodology in future studies investi-gating the MID of a given PRO questionnaire, inorder to ensure reliable results. This will also makeit possible to use the MID for sample size determin-ation when designing clinical trials with HRQOL orPRO as a primary endpoint, as well as for facilitatinginterpretation of the results. In the context of clin-ical trials in oncology, the MID is rarely used to in-terpret results in a clinically meaningful way. In arecent review of phase III trials in non-small celllung cancer including a PRO endpoint, only 20% ofstudies interpreted the results in light of the MID[65]. The time-to-HRQOL-deterioration is a recentlyproposed method to analyze longitudinal HRQOLdata [66]. One advantage of this method is to in-corporate the MID in the definition of the event toqualify the deterioration. This guarantees the clinicalsignificance of the results, but the choice of theMID is crucial since it has a direct impact on theresults of the analysis.
ConclusionsFurther research is mandatory to improve the qualityof the methodology used to determine the MID inHRQOL questionnaires used in oncology. In particu-lar, the choice of an appropriate anchor(s) when usingthe anchor-based approach, or appropriate criteriawhen using the distribution-based approach is essen-tial. The sample size should also be taken into ac-count to produce reliable results. This could increasethe use of these specific thresholds in future studies.
Additional file
Additional file 1: Table S1. Information about Minimal importantdifference determination of the most used questionnaires (EORTC QLQ-C30 and FACT) (DOCX 32 kb)
AbbreviationsEORTC: European organization for research and treatment of cancer;FACT: Functional assessment of cancer therapy; HRQOL: Health-relatedquality of life; MID: Minimally important difference; MMSE: Mini-Mental StateExamination; PRO: Patient-reported outcome; SD: Standard deviation;SEM: Standard error of measurement
AcknowledgmentsThe authors thank Fiona Ecarnot (EA3920, University Hospital Besancon,University of Franche-Comté, Besançon, France) for editorial assistance. Weacknowledge also the Professor Woronoff-Lemsi (University Hospital Besancon,University of Franche-Comté, Besançon, France) for supporting this work.
FundingThis work was supported by a grant from the “Institut National du Cancer(INCA_10846)”. The study sponsor had no role in the conception, the designof the study, the data acquisition and analysis or in the manuscriptpreparation.
Availability of data and materialsPlease contact author for data requests.
Authors’ contributionsAO and CT contributed equally in the statistical analyses and the writing ofthe manuscript. AA coordinated the study and participated in writing themanuscript. All authors: ND, FC, FB, FE, AB, CM, and AA read and approvedthe final manuscript.
Ethics approval and consent to participateNot applicable
Consent for publicationNot applicable
Competing interestsNone of the authors have competing interests in relation to this manuscript.
Publisher’s NoteSpringer Nature remains neutral with regard to jurisdictional claims inpublished maps and institutional affiliations.
Author details1Methodology and Quality of Life in Oncology Unit (INSERM UMR 1098),University Hospital of Besançon, Besançon, France. 2Montpellier CancerInstitute (ICM) – Val d’Aurelle, University of Montpellier, Montpellier, France.3Italian Group for Adult Hematologic Diseases (GIMEMA), Data Center andHealth Outcomes Research Unit, Rome, Italy. 4French National PlatformQuality of Life and Cancer, Besançon, France. 5Institut Curie, Supportive CareDepartment, Psycho-Oncology Unit, Paris, France. 6University Paris Descartes,Psychopathology and health process laboratory EA 4057,Boulogne-Billancourt, France. 7IRCM, University of Montpellier, ICM, INSERM,Montpellier, France.
Received: 4 July 2018 Accepted: 28 November 2018
References1. Efficace F, Fayers P, Pusic A, Cemal Y, Yanagawa J, Jacobs M, la Sala A,
Cafaro V, Whale K, Rees J, et al. Quality of patient-reported outcomereporting across cancer randomized controlled trials according to theCONSORT patient-reported outcome extension: a pooled analysis of 557trials. Cancer. 2015;121:3335–42.
2. Beitz J, Gnecco C, Justice R. Quality-of-life end points in cancer clinical trials: the U.S.Food and Drug Administration perspective. J Natl Cancer Inst Monogr. 1996:7–9.
3. Vodicka E, Kim K, Devine EB, Gnanasakthy A, Scoggins JF, Patrick DL.Inclusion of patient-reported outcome measures in registered clinicaltrials: evidence from ClinicalTrials.gov (2007-2013). Contemp Clin Trials.2015;43:1–9.
4. Bonnetain F, Fiteni F, Efficace F, Anota A. Statistical challenges in theanalysis of health-related quality of life in Cancer clinical trials. J Clin Oncol.2016;34:1953–6.
Ousmen et al. Health and Quality of Life Outcomes (2018) 16:228 Page 10 of 12
5. Osoba D, Rodrigues G, Myles J, Zee B, Pater J. Interpreting thesignificance of changes in health-related quality-of-life scores. J ClinOncol. 1998;16:139–44.
6. Jaeschke R, Singer J, Guyatt GH. Measurement of health status.Ascertaining the minimal clinically important difference. Control ClinTrials. 1989;10:407–15.
7. Crosby RD, Kolotkin RL, Williams GR. Defining clinically meaningful changein health-related quality of life. J Clin Epidemiol. 2003;56:395–407.
8. Lydick E, Epstein RS. Interpretation of quality of life changes. Qual Life Res.1993;2:221–6.
9. Kazis LE, Anderson JJ, Meenan RF. Effect sizes for interpreting changes inhealth status. Med Care. 1989;27:S178–89.
10. Wyrwich KW, Tierney WM, Wolinsky FD. Further evidence supporting anSEM-based criterion for identifying meaningful intra-individual changes inhealth-related quality of life. J Clin Epidemiol. 1999;52:861–73.
11. Cella D, Hahn EA, Dineen K. Meaningful change in cancer-specific quality oflife scores: differences between improvement and worsening. Qual Life Res.2002;11:207–21.
12. Revicki D, Hays RD, Cella D, Sloan J. Recommended methods fordetermining responsiveness and minimally important differences forpatient-reported outcomes. J Clin Epidemiol. 2008;61:102–9.
13. Cella D, Eton DT, Lai JS, Peterman AH, Merkel DE. Combining anchor anddistribution-based methods to derive minimal clinically importantdifferences on the functional assessment of Cancer therapy (FACT) anemiaand fatigue scales. J Pain Symptom Manag. 2002;24:547–61.
14. Hamidou Z, Dabakuyo TS, Bonnetain F. Impact of response shift onlongitudinal quality-of-life assessment in cancer clinical trials. Expert RevPharmacoecon Outcomes Res. 2011;11:549–59.
15. Kvam AK, Wisloff F, Fayers PM. Minimal important differences and responseshift in health-related quality of life; a longitudinal study in patients withmultiple myeloma. Health Qual Life Outcomes. 2010;8:79.
16. Cocks K, King MT, Velikova G, de Castro GJ, Martyn St-James M, Fayers PM,Brown JM. Evidence-based guidelines for interpreting change scores for theEuropean organisation for the research and treatment of Cancer quality oflife questionnaire Core 30. Eur J Cancer. 2012;48:1713–21.
17. Maringwa J, Quinten C, King M, Ringash J, Osoba D, Coens C, Martinelli F,Reeve BB, Gotay C, Greimel E, et al. Minimal clinically meaningful differencesfor the EORTC QLQ-C30 and EORTC QLQ-BN20 scales in brain cancerpatients. Ann Oncol. 2011;22:2107–12.
18. Moher D, Liberati A, Tetzlaff J, Altman DG, Group P. Preferred reportingitems for systematic reviews and meta-analyses: the PRISMA statement.PLoS Med. 2009;6:e1000097.
19. Askew RL, Xing Y, Palmer JL, Cella D, Moye LA, Cormier JN. Evaluatingminimal important differences for the FACT-melanoma quality of lifequestionnaire. Value Health. 2009;12:1144–50.
20. Bedard G, Zeng L, Zhang L, Lauzon N, Holden L, Tsao M, Danjoux C, BarnesE, Sahgal A, Poon M, Chow E. Minimal clinically important differences in theEdmonton symptom assessment system in patients with advanced cancer. JPain Symptom Manag. 2013;46:192–200.
21. Bedard G, Zeng L, Zhang L, Lauzon N, Holden L, Tsao M, Danjoux C, BarnesE, Sahgal A, Poon M, Chow E. Minimal important differences in the EORTCQLQ-C30 in patients with advanced cancer. Asia Pac J Clin Oncol. 2014;10:109–17.
22. Bedard G, Zeng L, Zhang L, Lauzon N, Holden L, Tsao M, Danjoux C, BarnesE, Sahgal A, Poon M, et al. Minimal important differences in the EORTCQLQ-C15-PAL to determine meaningful change in palliative advancedcancer patients. Asia Pac J Clin Oncol. 2016;12:e38–46.
23. Bharmal M, Fofana F, Barbosa CD, Williams P, Mahnke L, Marrel A,Schlichting M. Psychometric properties of the FACT-M questionnaire inpatients with Merkel cell carcinoma. Health Qual Life Outcomes. 2017;15:247.
24. Binenbaum Y, Amit M, Billan S, Cohen JT, Gil Z. Minimal clinically importantdifferences in quality of life scores of oral cavity and oropharynx cancerpatients. Ann Surg Oncol. 2014;21:2773–81.
25. Cella D, Eton DT, Fairclough DL, Bonomi P, Heyes AE, Silberman C, Wolf MK,Johnson DH. What is a clinically meaningful change on the functionalassessment of Cancer therapy-lung (FACT-L) questionnaire? Results fromeastern cooperative oncology group (ECOG) study 5592. J Clin Epidemiol.2002;55:285–95.
26. Cella D, Nichol MB, Eton D, Nelson JB, Mulani P. Estimating clinicallymeaningful changes for the functional assessment of Cancer therapy--
prostate: results from a clinical trial of patients with metastatic hormone-refractory prostate cancer. Value Health. 2009;12:124–9.
27. Chan A, Yo TE, Wang XJ, Ng T, Chae JW, Yeo HL, Shwe M, Gan YX. Minimalclinically important difference of the multidimensional fatigue symptominventory-short form (MFSI-SF) for fatigue worsening in Asian breast Cancerpatients. J Pain Symptom Manag. 2018;55:992–7 e992.
28. Cheung YT, Foo YL, Shwe M, Tan YP, Fan G, Yong WS, Madhukumar P, OoiWS, Chay WY, Dent RA, et al. Minimal clinically important difference (MCID)for the functional assessment of cancer therapy: cognitive function (FACT-cog) in breast cancer patients. J Clin Epidemiol. 2014;67:811–20.
29. Den Oudsten BL, Zijlstra WP, De Vries J. The minimal clinical importantdifference in the World Health Organization quality of life instrument--100.Support Care Cancer. 2013;21:1295–301.
30. Eton DT, Cella D, Bacik J, Motzer RJ. A brief symptom index for advancedrenal cell carcinoma. Health Qual Life Outcomes. 2006;4:68.
31. Eton DT, Cella D, Yost KJ, Yount SE, Peterman AH, Neuberg DS, Sledge GW,Wood WC. A combination of distribution- and anchor-based approachesdetermined minimally important differences (MIDs) for four endpoints in abreast cancer scale. J Clin Epidemiol. 2004;57:898–910.
32. Eton DT, Cella D, Yount SE, Davis KM. Validation of the functionalassessment of cancer therapy--lung symptom index-12 (FLSI-12). LungCancer. 2007;57:339–47.
33. Granger CL, Holland AE, Gordon IR, Denehy L. Minimal importantdifference of the 6-minute walk distance in lung cancer. Chron RespirDis. 2015;12:146–54.
34. Granger CL, Parry SM, Denehy L. The self-reported physical activity scale forthe elderly (PASE) is a valid and clinically applicable measure in lung cancer.Support Care Cancer. 2015;23:3211–8.
35. Hong F, Bosco JL, Bush N, Berry DL. Patient self-appraisal of change andminimal clinically important difference on the European organization forthe research and treatment of cancer quality of life questionnaire core 30before and during cancer therapy. BMC Cancer. 2013;13:165.
36. Hui D, Shamieh O, Paiva CE, Khamash O, Perez-Cruz PE, Kwon JH, MuckadenMA, Park M, Arthur J, Bruera E. Minimal clinically important difference in thephysical, emotional, and Total symptom distress scores of the Edmontonsymptom assessment system. J Pain Symptom Manag. 2016;51:262–9.
37. Jayadevappa R, Malkowicz SB, Wittink M, Wein AJ, Chhatre S. Comparison ofdistribution- and anchor-based approaches to infer changes in health-relatedquality of life of prostate cancer survivors. Health Serv Res. 2012;47:1902–25.
38. Kemmler G, Zabernigg A, Gattringer K, Rumpold G, Giesinger J, Sperner-Unterweger B, Holzner B. A new approach to combining clinical relevanceand statistical significance for evaluation of quality of life changes in theindividual patient. J Clin Epidemiol. 2010;63:171–9.
39. Lemieux J, Beaton DE, Hogg-Johnson S, Bordeleau LJ, Goodwin PJ. Threemethods for minimally important difference: no relationship was found withthe net proportion of patients improving. J Clin Epidemiol. 2007;60:448–55.
40. Liu H, Tan AD, Qin R, Sargent DJ, Grothey A, Buckner JC, Schaefer PL, SloanJA. Comparing and validating simple measures of patient-reportedperipheral neuropathy for oncology clinical trials: NCCTG N0897 (Alliance) apooled analysis of 2440 patients. SOJ Anesthesiol Pain Manag. 2015;2.
41. Maringwa JT, Quinten C, King M, Ringash J, Osoba D, Coens C, Martinelli F,Vercauteren J, Cleeland CS, Flechtner H, et al. Minimal important differencesfor interpreting health-related quality of life scores from the EORTC QLQ-C30 in lung cancer patients participating in randomized controlled trials.Support Care Cancer. 2011;19:1753–60.
42. Mathias SD, Crosby RD, Qian Y, Jiang Q, Dansey R, Chung K. Estimatingminimally important differences for the worst pain rating of the brief paininventory-short form. J Support Oncol. 2011;9:72–8.
43. Mouysset JL, Freier B, van den Bosch J, Levache CB, Bols A, Tessen HW,Belton L, Bohac GC, Terwey JH, Tonini G. Hemoglobin levels and quality oflife in patients with symptomatic chemotherapy-induced anemia: theeAQUA study. Cancer Manag Res. 2016;8:1–10.
44. Pickard AS, Neary MP, Cella D. Estimation of minimally importantdifferences in EQ-5D utility and VAS scores in cancer. Health Qual LifeOutcomes. 2007;5:70.
45. Purcell A, Fleming J, Bennett S, Burmeister B, Haines T. Determining theminimal clinically important difference criteria for the multidimensionalfatigue inventory in a radiotherapy population. Support Care Cancer.2010;18:307–15.
46. Raman S, Ding K, Chow E, Meyer RM, Nabid A, Chabot P, Coulombe G, AhmedS, Kuk J, Dar AR, et al. Minimal clinically important differences in the EORTC
Ousmen et al. Health and Quality of Life Outcomes (2018) 16:228 Page 11 of 12
QLQ-BM22 and EORTC QLQ-C15-PAL modules in patients with bonemetastases undergoing palliative radiotherapy. Qual Life Res. 2016;25:2535–41.
47. Raman S, Ding K, Chow E, Meyer RM, van der Linden YM, Roos D,Hartsell WF, Hoskin P, Wu JSY, Nabid A, et al. Minimal clinicallyimportant differences in the EORTC QLQ-C30 and brief pain inventoryin patients undergoing re-irradiation for painful bone metastases. QualLife Res. 2018;27:1089–98.
48. Sagberg LM, Jakola AS, Solheim O. Quality of life assessed with EQ-5D inpatients undergoing glioma surgery: what is the responsiveness andminimal clinically important difference? Qual Life Res. 2014;23:1427–34.
49. Shun SC, Beck SL, Pett MA, Richardson SJ. Assessing responsiveness ofcancer-related fatigue instruments: distribution-based and individualanchor-based methods. Oncologist. 2007;12:495–504.
50. Skolarus TA, Dunn RL, Sanda MG, Chang P, Greenfield TK, Litwin MS, Wei JT,Consortium P. Minimally important difference for the expanded prostateCancer index composite short form. Urology. 2015;85:101–5.
51. Steel JL, Eton DT, Cella D, Olek MC, Carr BI. Clinically meaningful changes inhealth-related quality of life in patients diagnosed with hepatobiliarycarcinoma. Ann Oncol. 2006;17:304–12.
52. Tamminga SJ, Verbeek JH, Frings-Dresen MH, De Boer AG. Measurementproperties of the work limitations questionnaire were sufficient amongcancer survivors. Qual Life Res. 2014;23:515–25.
53. Tsiplova K, Pullenayegum E, Cooke T, Xie F. EQ-5D-derived health utilitiesand minimally important differences for chronic health conditions: 2011Commonwealth Fund survey of sicker adults in Canada. Qual Life Res. 2016;25:3009–16.
54. Tuomi L, Johansson M, Andrell P, Finizia C. Interpretation of theSwedish self evaluation of communication experiences after laryngealcancer: cutoff levels and minimum clinically important differences. HeadNeck. 2016;38:689–95.
55. Wong E, Zhang L, Kerba M, Arnalot PF, Danielson B, Tsao M, Bedard G,Thavarajah N, Cheon P, Danjoux C, et al. Minimal clinically importantdifferences in the EORTC QLQ-BN20 in patients with brain metastases.Support Care Cancer. 2015;23:2731–7.
56. Wong K, Zeng L, Zhang L, Bedard G, Wong E, Tsao M, Barnes E, Danjoux C,Sahgal A, Holden L, et al. Minimal clinically important differences in thebrief pain inventory in patients with bone metastases. Support Care Cancer.2013;21:1893–9.
57. Wright P, Marshall L, Smith AB, Velikova G, Selby P. Measurement andinterpretation of social distress using the social difficulties inventory (SDI).Eur J Cancer. 2008;44:1529–35.
58. Yost KJ, Cella D, Chawla A, Holmgren E, Eton DT, Ayanian JZ, West DW.Minimally important differences were estimated for the functionalassessment of Cancer therapy-colorectal (FACT-C) instrument using acombination of distribution- and anchor-based approaches. J ClinEpidemiol. 2005;58:1241–51.
59. Yost KJ, Eton DT, Garcia SF, Cella D. Minimally important differences wereestimated for six patient-reported outcomes measurement informationsystem-Cancer scales in advanced-stage cancer patients. J Clin Epidemiol.2011;64:507–16.
60. Yost KJ, Sorensen MV, Hahn EA, Glendenning GA, Gnanasakthy A, Cella D.Using multiple anchor- and distribution-based estimates to evaluateclinically meaningful change on the functional assessment of Cancertherapy-biologic response modifiers (FACT-BRM) instrument. Value Health.2005;8:117–27.
61. Zeng L, Chow E, Zhang L, Tseng LM, Hou MF, Fairchild A, Vassiliou V,Jesus-Garcia R, Alm El-Din MA, Kumar A, et al. An internationalprospective study establishing minimal clinically important differencesin the EORTC QLQ-BM22 and QLQ-C30 in cancer patients with bonemetastases. Support Care Cancer. 2012;20:3307–13.
62. Ousmen A, Conroy T, Guillemin F, Velten M, Jolly D, Mercier M, Causeret S,Cuisenier J, Graesslin O, Hamidou Z, et al. Impact of the occurrence of aresponse shift on the determination of the minimal important difference ina health-related quality of life score over time. Health Qual Life Outcomes.2016;14:167.
63. Norman GR, Sloan JA, Wyrwich KW. Interpretation of changes in health-related quality of life: the remarkable universality of half a standarddeviation. Med Care. 2003;41:582–92.
64. Sprangers MA, Schwartz CE. Integrating response shift into health-relatedquality of life research: a theoretical model. Soc Sci Med. 1999;48:1507–15.
65. Fiteni F, Anota A, Westeel V, Bonnetain F. Methodology of health-related quality of life analysis in phase III advanced non-small-cell lungcancer clinical trials: a critical review. BMC Cancer. 2016;16:122.
66. Bonnetain F, Dahan L, Maillard E, Ychou M, Mitry E, Hammel P, LegouxJL, Rougier P, Bedenne L, Seitz JF. Time until definitive quality of lifescore deterioration as a means of longitudinal analysis for treatmenttrials in patients with metastatic pancreatic adenocarcinoma. Eur JCancer. 2010;46:2753–62.
Ousmen et al. Health and Quality of Life Outcomes (2018) 16:228 Page 12 of 12


![Solving Location Problem of Distribution Center Based on ... · problem about . location. of . distribution center [1], [2] is to determine the optimal . location of the distribution](https://img.pdfslide.us/doc/110x75/6056932d4eccde274045f834/solving-location-problem-of-distribution-center-based-on-problem-about-location.jpg)