Embed Size (px)
Citation preview

Distributed Power Source Using LENRs ∗ George H. Miley ∗ Erik Ziehm, Tapan Patel, Anais Osouf, Kyu-Jung Kim, Bert Stunkard ∗ University of Illinois ∗ Champaign IL, 61821 USA ∗ [email protected]
∗ Work done in support of LENUCO
1
2
Based on present power density results Assumes long run times and control achievable

3
∗ Pu238: 540 W/kg 3 kW = 5.6kg; 0.28L
∗ LENR: 1kW/kg at 4 atm and room temperature (present data) 3kW = 3kg; 2.3 L nanoparticles Thus on a weight basis LENR unit offers approximately
same power, but uses somewhat larger volume.
LENR heat unit compares favorably with Radioisotope sources such as Pu238
Basis for power scaling

∗ Conceptual design for modules for distributed power illustrates how simple the configuration is, leading to compactness for ease of location and reduced costs.

Reactor housing
Thermoelectric generator
Fin Motor Turbo-fan
Air
Nano-particle
Filter Mesh
H2
Air
A Hydride Gas-Loaded Nanoparticle Electrode Cell one concept for 1.5 kW units for distributed power. Could be scaled to higher power units with some thermal power handling modification. Alternately for some uses these could be combined in parallel or series for higher powers and for voltage-current matching.

∗Average household requires 1.5 kWe electrical
∗A 7 kW thermal giving, after conversion to electricity.
∗ 1.5 kWe = our standard model for this market.
∗Would use heat for co-generation applications.
∗ The cost analysis is based on this unit

∗ Capital Costs for first generation 1.5 kWe LENR unit in the $ 2 / W range
∗ Estimated total unit cost = $3,000 or $ 2/W installed.
∗ Comparison: 1/2 to 1/5 of the installed cost for equal size of Solar, Wind or Fuel Cell.
∗ 2nd Generation of LENR units would lower price even more due to continuing R&D.

∗ Operational Cost is comparatively low after the Initial Investment.
∗ Replace nano-particles every 6-months, using recycled particles.
∗ $500 per reload of nano-particles.
∗ Gas and Maintenance costs are low
chamber components should not wear out for many years thus particle reloading dominates the operational cost

∗ Gives operational cost of 7 cents/kWh vs. 15 cents current household average.
∗ Note: nano-particle reloading costs are equivalent to the cost of natural gas for high-temperature fuel cells, or the cost of energy storage/electrical purchase for solar when the sun is down.

∗ First generation LENRs payback times are very short 3 years.
∗ COE of 7 cents/kWh for first generation LENRs
3 year payback period, after which a cost savings/unit
$ 1000/yr is enjoyed.

∗ Compare: solar panels are quoted to have about a 10 year payback, and fuel cells even longer.
∗ Future price reduction of 5~20% / yr are projected due to nano- particle improvements.
∗ Historically, other renewable power has received government and state incentives to off-set costs.
∗ But incentives may not be necessary for LENR .

Very marketable
100s of billions/year
3-yrs initial investment pay-back
period
Compact size (vs. other renewable:
solar and wind)
No greenhouse gas emission
24 hour operation combined

objectives for the 2-yr R&D plan.
nano-particle manufacturing
costs
ability for recycling

Operation based on clusters
14
Previous experiments using thin-film beads and plate type electrodes formation.
Evidence for Clusters and Nuclear Reactions.
Gas loaded nano-particle experiments.
LENR Power Source Applications.

15

16
Pd thin film = 12 µm
Loading and unloading of D/H
done by cyclically cathodizing
and anodizing of Pd film
dislocation loop and cluster
formation
Pd PdO PdO
PdO PdO

17
2 12 1
2 1
ln( / ) 0.65( )H B
T Tk P P eVT T
ε = =−
Binding Energy calculation – close to the binding energy between hydrogen and dislocations
The magnetic moment of H2- cycled PdHx samples in the temperature range of 2 ≤ T < 70 K is significantly lower than M(T) for the original Pd/PdO.
H:Pd = 10-4

∗ The thin film cluster results are quite encouraging for laser acceleration of high energy D beam, warranting experimental validation
∗ First step – initial experiment at TRIDENT ∗ Goals ∗ Verify extraction from cluster in tradition TNSA mode ∗ Verify earlier estimate of accelerated deuteron beam
energies
18
19
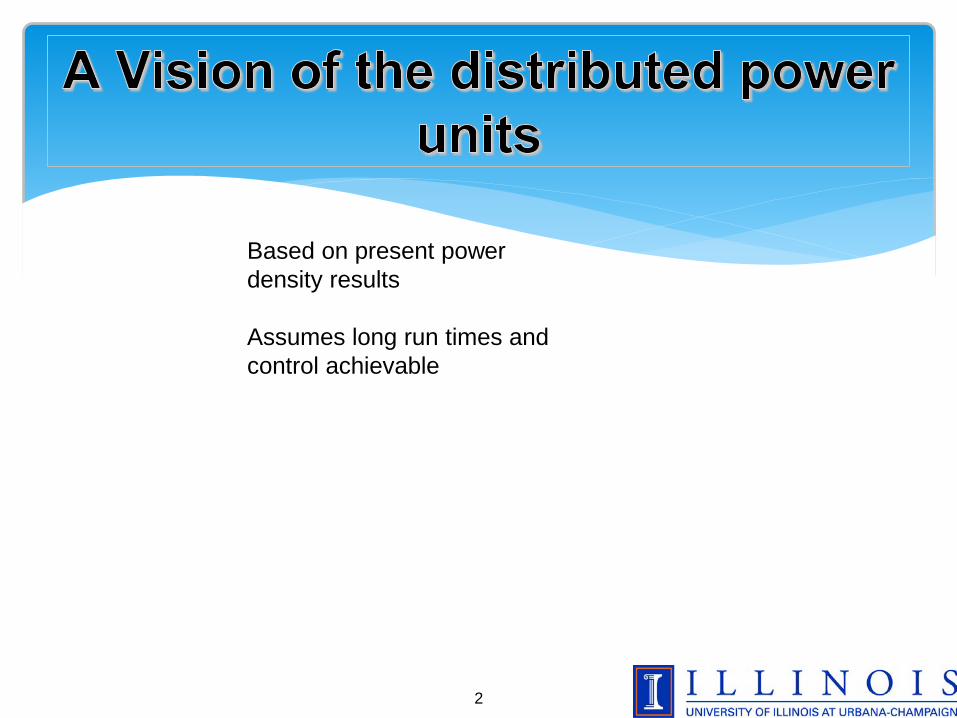
Ion Beams
Film Detector / Nuclear Activation
Stack
Target
Neutron Bubble Detectors
(thermal or >10 MeV)
Operated by Los Alamos National Security, LLC for the U.S. Department of Energy’s NNSA
U N C L A S S I F I E D
Thomson Parabola Ion Energy Analyzer
Deuteron Acceleration Experiment In LANL
Vacuum Vessel
Vacuum Vessel Supports
Laser Beam

∗ Peak Intensity was 2 * 10^20 W/cm^2 ∗ Laser was focused with an f/3 Off-Axis-Parabolic M
irror ∗And focused to a near diffraction limited s
pot ∗ Pulse length 600 +/- 100 fs ∗ Energy 80 =/-10 J ∗ Center wavelength 1.054 microns ∗ Pre-pulse contrast >10^10 (in intensity)
20
21
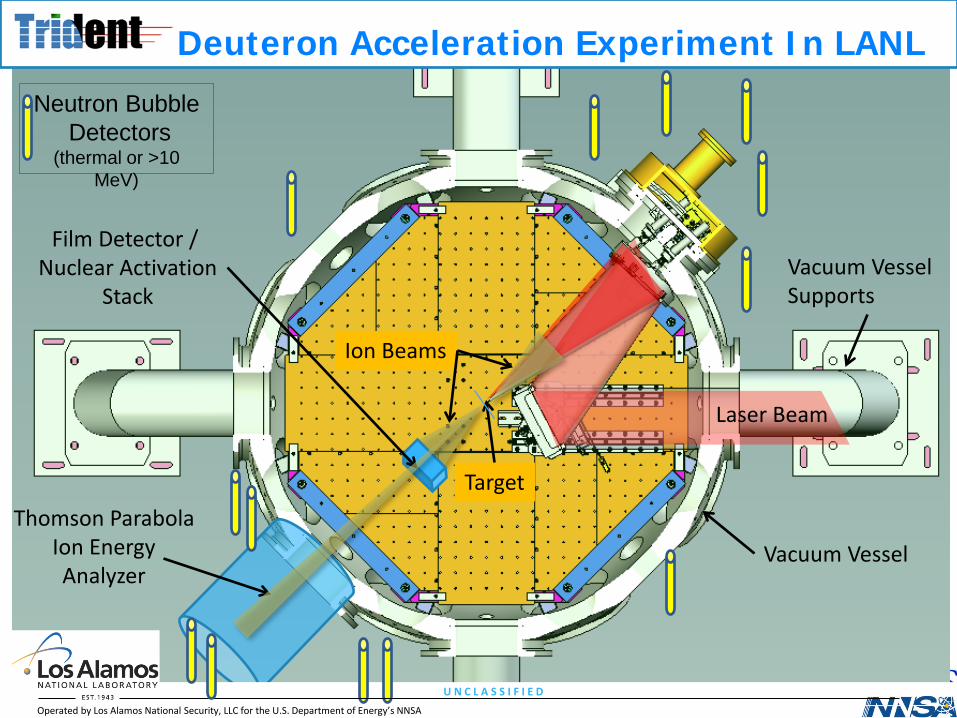
∗ Diameter of the Vacuum Chamber: 1.5m. ∗ Diameter of the laser beam: 7 um ∗ RCF stack 5x5cm2
∗ Pinhole diameter on RCF: 3mm
∗ D cluster target ∗ 2X2mm, 12micrmeter thick, supported on glass fiber.

22
Thomson parabola
(Radiochromic Film) RCF stack
In some cases, a 100 micron Ti foil was placed in front of image plate to filter out C ions below 100 MeV and deuterons below 5 MeV. (according to SRIM calculation)
Imaging plate: made by FUJIFILM GlobalTM. It uses a phosphor layer (BaFBr0.85I0.15:Eu) that when exposed to radiation stores energy as defect centers in the crystal lattice
Ti Filter
Imaging plate is behind Ti Filter
Magnets and electrodes

∗ Three shots performed in first study to gain insight into this ne type of convertor foil and deuteron acceleration from clusters.
∗ Some representative data are shown next ∗ After improvements, a next campaign will involve
more target shots to study scaling issues and to obtain better quantitative data
23

24
Proton C6+ and D+
C4+ and T+
Laser Energy in 91.2J out 75.1J , Duration 559 fs
Bandwidth 2.31nm
Image Plate

25
D+
P
Zoom In View
Laser Energy in 81.9 J out 67.1
Image Plate
∗ Demonstrates acceleration from clusters ∗ Flux and energy depressed by impurity protons
(and C?) ∗ Conclusions - next experimental campaign ∗ Continue to improve cluster packing fraction ∗ Reduce contamination (p and C). ∗ Obtain more insight from ongoing supporting
simulation studies.
26

27
∗ Future experiment should focus on removing surface contamination layer to avoid interference with deuteron acceleration.
∗ In-chamber glow discharge cleaning will be used
Added evidence (and use of) cluster formation and systematics

28
Larger surface area particles
Lower input power needed
Larger “Excess Power”.
Recent work is designed to extend the thin-film technique
to gas loaded nanoparticles for LENR

29
Cluster Formation in Nano-Materials
Nano-particles Thin film
Almost no clusters
Pd
vs.

30
Gas Loading System for Nanoparticle
2.2cm inner diameter 25cm3 total volume
D2 Gas
To Vacuum
Cold Trap
Vacuum pump
Insulation around
chamber
H2 Gas

31
Vacuum pump
Outer Chamber D2 or H2 Gas
Heating coil
Sample chamber
Valve
Sample
Valve
Valve Turbo- molecular pump
* In some experiments, outer chamber is replaced with insulation for ease of assembly
Schematic view

32
Comments about Nano-Particles

33
Particle Type Particle Composition Type A Pd-Zr Type B Pd-Zr-Ni (High Ni, Pd) Type C Pd-Zr-Ni (High Ni, Low Pd)
Particle composition
34

35
Kinetic Measurement Using Our Gas Loading System to Illustrate Key Features.
High purity (99.999%) D2 gas at 4 atm, Room Temp, 23g nanoparticles Type A
Absorption: Exothermic chemical
reaction
Desorption: Endothermic chemical
reaction
Chemical reaction Energy = ∆H×MD2
∆H = 35,100J per mole of D2

36
Energy analysis of this 300 second Kinetic Measurement Shows “Excess Energy”
production attributed to LENR. Absorption Exothermic energy from chemical reaction --- 690J Actual measured energy : 1479J – roughly double the possible chemical contribution. Added energy is attributed to LENR reactions.
Desorption Endothermic chemical Reaction – should show rapid temperature drop, but instead an increase is observed – attributed to continuing LENRs produced by increased ion flow out of particle during desorption = “life after death”
LENR (Nuclear) Power Density : ca. 1kW/kg at 4 atm., over short run 300 sec. time
37
0
20
40
60
80
100
120
140
0 13 26 39 52 65 78 91 104
117
130
143
156
169
182
195
208
221
234
247
260
Tem
p. (C
elsi
us)
Time (min)
Temp. (Celsius) vs Time for nanoparticle #1
Side 2
Side 1
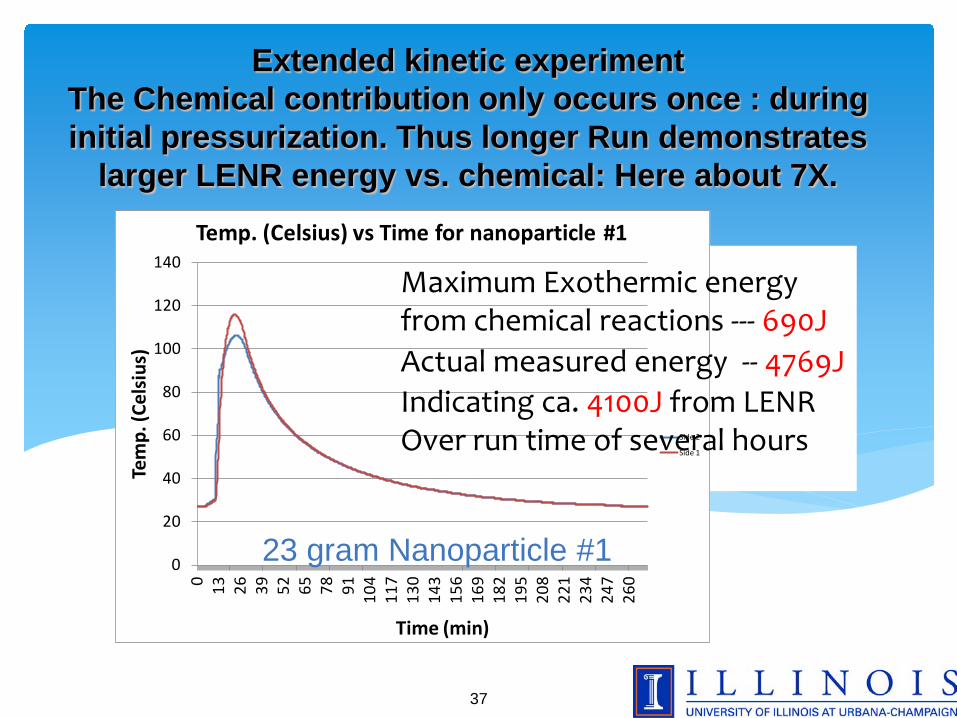
Extended kinetic experiment The Chemical contribution only occurs once : during initial pressurization. Thus longer Run demonstrates
larger LENR energy vs. chemical: Here about 7X.
Maximum Exothermic energy from chemical reactions --- 690J Actual measured energy -- 4769J Indicating ca. 4100J from LENR Over run time of several hours
23 gram Nanoparticle #1

38

39
40
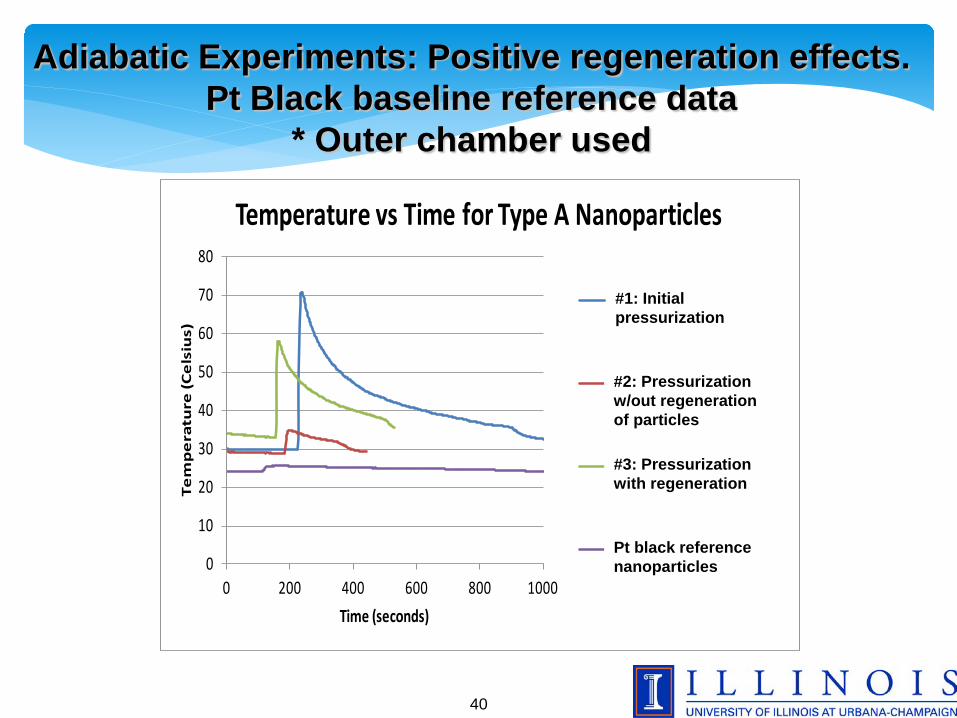
Adiabatic Experiments: Positive regeneration effects. Pt Black baseline reference data
* Outer chamber used
0
10
20
30
40
50
60
70
80
0 200 400 600 800 1000
Tem
pe
ratu
re (C
els
ius)
Time (seconds)
Temperature vs Time for Type A Nanoparticles
#1: 2.2g at 90 psi
#2: 1.9g of #1's particles at 100 psi#3: regeneration of #2 1.8g at 105 psi1g of Pt Black at 75 psi
#1: Initial pressurization
#2: Pressurization w/out regeneration of particles
#3: Pressurization with regeneration
Pt black reference nanoparticles

41
ADIABATIC EXPERIMENTS FOR COMPARISON OF NANOPARTICLES.
Measured Output Energy for the Initial Temperature Increase Compared to Exothermic Energy from Chemical Reactions
Run #
Nano Particle
Type Mass
(grams) Delta T
(Celsius)
Total Energy (Peak)
Total Energy density (J/g)
Initial
Temp. to Peak Temp.
(sec)
Peak Power
Density (W/g)
Chemical Energy (J)
Measured Peak Energy minus
Chemical Energy (J) Gain
1 Type A 2.2 31.55 972.05 441.84 14.00 31.56 74.85 897.21 12.0
2
Type A (same
particles from run 1) 1.9 4.95 151.96 79.98 16.00 5.00 64.64 87.32 1.3
3 Type A 1.8 25.05 768.01 426.67 10.00 42.67 61.24 706.77 11.5
4 Type B 11.1 90.90 3588.88 323.32 95.00 3.40 271.29 3317.59 12.2
5 Type C 6.4 84.90 2754.00 430.31 98.00 4.39 170.76 2583.24 15.1
6
Type C (same
particles from run 5) 6.4 6.80 220.58 34.47 76.00 0.45 170.76 49.82 0.3
7 Type C 3.2 27.10 846.04 264.39 78.00 3.39 85.38 760.66 9.3

42
Peak Power as a function of temperature: Particles A & B
Particle A Particle B
# Average starting
temp ( C ) Run Peak Power (W/g) Peak Power (W/g) 1 23 1 2.76 2.40 2 100 1 N/A 14.20 3 150 1 1.56 14.41 4 150 2 N/A 3.65 5 200 1 2.93 14.18 6 200 2 0.79 14.62 7 250 1 7.05 2.94 8 250 2 0.56 14.92 9 300 1 2.25 12.84
10 300 2 0.56 11.85

43
High Temperature Baking
∗ Samples usually baked overnight at 300 C under high vacuum to drive off excess oxygen
∗ Two samples baked at 750 C for 3 hours prior to pressurization
∗ TPD (temperature programmed desorption) used to study oxygen concentration
∗ Samples then pressurized to determine effect of baking temperature on peak power of particles

44
High Temperature Baking
1.0E-10
1.0E-09
1.0E-08
1.0E-07
1.0E-06
1.0E-05
1.0E-04
1.0E-03
1.0E-02
1.0E-01
1.0E+000 200 400 600 800
Concentration
Temperature (Celcius)
Concentration of various molecules as a function of temperature
during baking process
H2
H2O
N2
O2
45
High Temperature Baking
∗ Most oxygen is driven off at temperatures above 650 C
∗ Pressurization after baking at theses high temperatures had reduced power generation
∗ Indicates deactivation of particles at these high temperature bakes
∗ Optimum temperature for cleaning w/o deactivation about 4-500 C

Metal Hydride Heat of absorption
Reference kJ / mol ∙ H2 kJ / g ∙ metal
ZrH2 106 1.16 R. Griessen, T. Riesterer, in: L. Schlapbach (Ed.), Hydrogen in Intermetallic Compounds I, Springer-Verlag, Berlin, 1988. p. 266
ZrH1.5 174 1.43 P. Dantzer, W. Luo, Ted B. Flanagan, And J.D. Clewley, Calorimetrically Measured Enthalpies for the Reaction of Ha (g) with Zr and Zr Alloys, Metallurgical Transactions A, volume 24A, july 1993. p. 1471
Zr0.9Ti0.1Cr1.1Fe0.9
32.6 0.18 LG Electronics + KAIST joint research
Nano-Alloy-A n/a 13.15 Lenuco
Nano-Alloy-B n/a 19.01 Lenuco
cf. H2 combustion by O2 = 10 J/cc Assume 20cc of H2 + 5cc of O2 0.2 kJ from 25 cc reactor

47
∗ Type C has highest gain ∗ Type B has a higher peak power compared to Type
A (W/g) ∗ Regeneration after runs for Type B is encouraging
– relatively consistent peak power output ∗ Particle A – increased power with increased initial
temperature ∗ Particle B – no clear temperature dependence on
peak power ∗ High temperature baking (750C) causes possible
deactivation of particles
Summary of the Nanoparticle Comparison

48
Loaded Nanoparticles composition SIMS measurements
SIMS ∗ Gold ion beam ionizes the surface of a sample and emits
ions that are directed to strike a target ∗ Evaluates mass of atoms/molecules and creates a spectrum ∗ Quantitative results are only obtained by comparison
between two or more samples
Preliminary remarks on pressurized particles ∗ The nanoparticles are suspected to have contamination
from the stainless pressure vessel ∗ New elements detection : Ca, Na ∗ Possible contamination from environment

49
Sample of blank alloys
Sample of pressurized
nanoparticles
03/11/13 Control alloy
03/11/13 Pressurized sample
Ratios over main isotope of Palladium Ratios over main isotope of Zirconium
Increasing of the ratio
5,85%
6,7%
Noise or hydrocarbonates
Noise or hydrocarbonates
Loaded Nanoparticles composition Stainless steel chamber contamination: Fe, Cr, Ni…
12,6%
15,6%

50
This image cannot currently be displayed. This image cannot currently be displayed.
SEM image of the nanoparticles A before (left) and after (right) deuterium gas loading experiment
Illustration of nanoparticle run time issue: coagulation can occur

51
∗ Increase surface oxide layer thickness ∗ Changes in composition ∗ Embed particles in substrate ∗ Control reactor temperature profile to avoid
hot spots
Proposed methods to prevent aglomeration of nanoparticles and allow
higher control point temperatures

52
Heat transfer simulations using Comsol Multiphysics
Thermocouples in experimental set up
Reference simulation
1 2
3
∗ Geometrical model of the chamber ∗ It is being calibrated to determine accurate
heat transfer coefficients ∗ Comsol will give access to internal
temperatures field and more accurate values for energy and power generation

53
Heat transfer simulations using Comsol Multiphysics
∗ Goal : Validate the model at many initial conditions ∗ See Below : Reference cooling process at initial temperature of 300°C We are on the process to reach a quadratic error between experimental
data and simulation of less than 6% for all thermocouples.

54
Conclusion
∗ Experimental results with cluster loaded materials are very encouraging
∗Work concentrating on run time and control issues is needed to develop a commercial unit
∗ Vision and goal – distributed power units in wide use for co-generation.
∗ Negotiating with several companies for early demonstration units.

55
∗ George H. Miley ∗ Erik Ziehm, Tapan Patel, Anais Osouf, ∗ Dr. Kyu-Jung Kim, Bert Stunkard ∗ University of Illinois ∗ Champaign IL, 61821 USA ∗ [email protected] ∗ 217-333-3772
For more information: Recent results from gas loaded nanoparticle-type cluster power units.
Patel, T., Miley, G., Osouf, A., Stunkard, B., Kyu-Jung, K., & Ziehm, E. (2013, July). Poster session. ICCF-18, University of Missouri, Columbia.
Study of Composition of Nanoparticles during Gas Loaded LENR Power Cell Operation. Osouf, A., Miley, G., Patel, T., Stunkard, B., Kyu-Jung, K., & Ziehm, E (2013, July). Poster session. ICCF-18, University of Missouri, Columbia.