Embed Size (px)
Citation preview
Distributed Neural Systems Underlying the Timing of Movements
Stephen M. Rao,1,2 Deborah L. Harrington,3 Kathleen Y. Haaland,3 Julie A. Bobholz,1 Robert W. Cox,2 andJeffrey R. Binder1,2
1Department of Neurology and the 2Biophysics Research Institute, Medical College of Wisconsin, Milwaukee, Wisconsin53226, and 3Research and Psychology Services, Veterans Affairs Medical Center and the University of New Mexico,Albuquerque, New Mexico 87108
Timing is essential to the execution of skilled movements, yetour knowledge of the neural systems underlying timekeepingoperations is limited. Using whole-brain functional magneticresonance imaging, subjects were imaged while tapping withtheir right index finger in synchrony with tones that were sep-arated by constant intervals [Synchronization (S)], followed bytapping without the benefit of an auditory cue [Continuation(C)]. Two control conditions followed in which subjects listenedto tones and then made pitch discriminations (D). Both the Sand the C conditions produced equivalent activation within theleft sensorimotor cortex, the right cerebellum (dorsal dentatenucleus), and the right superior temporal gyrus (STG). Only theC condition produced activation of a medial premotor system,including the caudal supplementary motor area (SMA), the left
putamen, and the left ventrolateral thalamus. The C conditionalso activated a region within the right inferior frontal gyrus(IFG), which is functionally interconnected with auditory cortex.Both control conditions produced bilateral activation of theSTG, and the D condition also activated the rostral SMA. Theseresults suggest that the internal generation of precisely timedmovements is dependent on three interrelated neural systems,one that is involved in explicit timing (putamen, ventrolateralthalamus, SMA), one that mediates auditory sensory memory(IFG, STG), and another that is involved in sensorimotor pro-cessing (dorsal dentate nucleus, sensorimotor cortex).
Key words: functional magnetic resonance imaging; move-ment; timing; basal ganglia; thalamus; supplementary motorarea; cerebellum
The capacity to precisely time events is important for skilledactions, such as playing a musical instrument. Several decades ofresearch have advanced our knowledge of temporal mechanisms,so that now there is broad support for the view that some aspectsof time are explicitly represented in the CNS. Studies of paced-finger tapping (PFT) support the existence of a cognitively based,internal timekeeping system that is independent of motor imple-mentation or feedback mechanisms (Wing and Kristofferson,1973; Ivry and Keele, 1989; Sergent et al., 1993). In PFT, subjectstap their index finger in synchrony with a series of tones separatedby a constant interval [Synchronization (S)]. The tones are thendiscontinued, and the subject continues to tap at the same pace[Continuation (C)]. Timing competency is assessed when the toneis absent, because performance depends entirely on an internalrepresentation of the interval duration.
Some research in patients (Ivry et al., 1988) suggests thattiming is controlled by the lateral cerebellum and its primaryoutput nucleus, the dentate. This research, however, did notdistinguish between damage to the dorsal and the ventral portionsof the dentate, which have different output pathways. The dorsaldentate projects principally to the primary motor and ventral
premotor cortices, which are associated with sensorimotor func-tions, whereas the ventral dentate projects to dorsolateral pre-frontal areas, which are associated with higher-level cognitiveprocessing (Strick et al., 1993; Middleton and Strick, 1994; Leineret al., 1995). Hence, motor timing deficits after cerebellar damage(Ivry et al., 1988; Ivry and Keele, 1989) could be caused by adisruption in sensorimotor mechanisms or cognitive processes,such as timing.
Patients with Parkinson’s disease also demonstrate abnormaltiming on the PFT task (Pastor et al., 1992; O’Boyle et al., 1996)(D. L. Harrington, K. Y. Haaland, N. Hermanowicz, unpublishedobservations). Pathological changes in Parkinson’s disease includea loss of nigral dopaminergic neurons projecting to the dorsalputamen (Brooks et al., 1990), the major output of which is to thesupplementary motor area (SMA) (Alexander et al., 1986). In fact,patients with SMA lesions are impaired in the reproduction ofrhythms in the absence of an auditory cue (Halsband et al., 1993).
Patient studies, therefore, suggest that timing may be mediatedby the lateral cerebellum, the putamen, and/or the SMA. Toexamine this issue directly, we conducted whole-brain functionalmagnetic resonance imaging (FMRI) on healthy volunteers whilethey performed the S and C conditions of the PFT task. Wepredicted that the neural systems specific to controlling timingshould show greater activation in the C than in the S condition,because the C condition makes greater demands on an internaltimekeeping system. In contrast, performance in the S conditionis based largely on the perception of the synchronization errorand afferent delays from stimulus events (Kolers and Brewster,1985; Mates, 1994), although some temporal processing presum-ably occurs when predictable stimuli are tracked.
A listening task (L), in which subjects passively attended to
Received Feb. 21, 1997; revised April 16, 1997; accepted May 5, 1997.This research was funded by grants from the National Institute of Mental Health
(P01-MH-51358), National Institute of Neurological Disorders and Stroke (R01-NS-33576), National Institute of Drug Abuse (R01-DA-09465), National Multiple Scle-rosis Society (RG2605-A-4), and Department of Veterans Affairs. We thank J. Frost,S. Fuller, J. Kummer, T. Prieto, and L. Stapp for technical assistance, and J.Cunningham, E. DeYoe, T. Hammeke, J. Hyde, A. Rosen, E. Stein, P. Strick, andS. Woodley for helpful comments.
Correspondence should be addressed to Dr. Stephen M. Rao, Section of Neuro-psychology, Medical College of Wisconsin, 9200 W. Wisconsin Avenue, Milwaukee,WI 53226.Copyright © 1997 Society for Neuroscience 0270-6474/97/175528-08$05.00/0
The Journal of Neuroscience, July 15, 1997, 17(14):5528–5535

tones, and a pitch discrimination (D) task controlled for theauditory sensory processing in the S condition. In addition, wepredicted that the D task would elicit activation patterns specificto the processing of frequency information and therefore distinctfrom the activation patterns of the PFT tasks.
MATERIALS AND METHODSSubjects. Thirteen healthy volunteers (ten females and three males; meanage 23.2 years, range 18–31 years) were studied. All were stronglyright-handed on the Edinburgh Handedness Inventory (mean lateralityquotient 5 88.8; range, 64–100) (Oldfield, 1971). Potential subjects wereexcluded if they had a history of neurological disease, a major psychiatricdisturbance, or substance abuse, or if they were taking psychoactiveprescription medications. Informed consent was obtained from subjectsaccording to institutional guidelines established by the Medical Collegeof Wisconsin Human Subjects Review Committee.
Activation conditions. Subjects performed a series of four consecutiveactivation conditions consisting of two experimental (S, C) and twocontrol tasks (L, D), which were preceded and followed by a rest period.In the S condition, subjects made right index finger key presses in timewith a series of tones separated by a constant interval of either 300 or 600msec, target intervals close to those that have been studied in patients.Two pacing intervals were studied to assess the reliability of the FMRIfindings across different temporal intervals. The auditory stimulus con-sisted of trains of 50 msec, 380 Hz pure tones presented binaurally atprecise intervals using a computer playback system. Sounds were ampli-fied near the scanner using a magnetically shielded transducer system andwere delivered to the subject via air conduction through 180 cm pairedplastic tubes. The tubes were threaded through tightly occlusive earinserts that attenuated background scanner noise to ;75 dB soundpressure level (SPL). Background scanner noise consisted of pulsesoccurring every 205 msec; this pulse was constant throughout the imagingrun. Intensity of the tone stimuli averaged 100 dB SPL.
The C condition immediately followed the S condition. Subjects wereinstructed to maintain the same tapping rate as in the S condition (300 or600 msec pacing intervals) but without benefit of the pacing tone.
The C condition was immediately followed by the L condition, whereinsubjects passively attended to the same pacing tone as presented in the Scondition (tone intervals separated by 300 or 600 msec) but were in-structed not to tap their finger. The L condition controlled for theauditory sensory perception processes in the S condition.
After the L condition, subjects performed the D condition, in whichthey listened to a series of tone pairs separated by 300 or 600 msec andpressed a key with their right index finger whenever a transition in pitchoccurred. Auditory stimuli consisted of 12 pairs of 40 msec tones (220 or380 Hz pure tones). A tone pair was presented every 1.5 sec. Half of thetone pairs were of the same pitch (220–220 or 380–380 Hz), and theremaining pairs were of a different pitch (220–380 or 380–220 Hz), withthe order of the pairs randomized. This task controlled for higher levelauditory processing of time-independent information.
FMRI. Whole-brain FMRI, a technique for detecting regional changesin blood oxygenation associated with increased neural activity (Ogawa etal., 1990; Ogawa and Lee, 1991), was conducted on a commercial 1.5Tesla scanner (Signa, General Electric Medical Systems, Milwaukee, WI)equipped with a prototype 30.5 cm inner diameter, three-axis localgradient head coil and an elliptical endcapped quadrature radiofre-quency coil (Wong et al., 1992a,b). Echo-planar images were collectedusing a single-shot, blipped, gradient-echo echo-planar pulse sequence[echo time (TE) 5 40 msec; field of view (FOV) 5 24 cm; matrix size 564 3 64] (Bandettini et al., 1992). Twenty-two contiguous sagittal 6-mm-thick slices were selected to provide coverage of the entire brain (voxelsize: 3.75 3 3.75 3 6 mm). Before FMRI, high resolution, three-dimensional (3-D) spoiled gradient-recalled at steady-state (SPGR) an-atomic images were collected [TE 5 5 msec; repetition time 5 24 msec;40° flip angle; number of excitations 5 1; slice thickness 5 1.2 or 1.3 mm;FOV 5 24 cm; resolution 5 256 3 192]. Foam padding was used to limithead motion within the coil. A nonferrous key press device made fromforce-sensing resistors was used to record response times and accuracy.
Subjects underwent six functional imaging series, three each at the 300and 600 msec pacing intervals, in an alternating sequence, the order ofwhich was counterbalanced across subjects. During each imaging series,104 sequential echo-planar images were collected with an interscaninterval (TR) of 4.5 sec (total scanning duration 5 7 min, 45 sec). Aseries consisted of five cycles of rest and activation, with each cycle
beginning and ending with an 18 sec rest period. The activation periodconsisted of the four consecutive 18 sec epochs, during which subjectsperformed the S, C, L, and D conditions in a fixed order. Subjects werepresented visual word cues to inform them of the current condition(“TAP,” “CONTINUE,” “LISTEN,” “PITCH,” and “REST” for the S,C, L, D, and rest epochs, respectively). Words were computer-generatedand rear-projected onto the center of an opaque screen located at thesubject’s feet (viewing distance 5 200 cm). Subjects viewed the screen ina darkened room though prism glasses and corrective lenses, if necessary.Subjects briefly practiced the four conditions before scanning.
Image processing and statistical analysis. Minor anatomic distortions inthe EP images attributable to local field inhomogeneities were correctedusing a field map generated by increasing the TE by 1 msec on the lasttwo images of the time series (Jezzard and Balaban, 1995). Each imagetime series was spatially registered in-plane to reduce the effects of headmotion, using an iterative linear least squares method (Keren et al.,1988). Linear drift in each 104-image time series was removed using aregression analysis (Bandettini et al., 1993). Specifically, a line is fitthrough each voxel time series. The slope and intercept parameters aresubtracted from the raw voxel data at each corresponding point in time.
Functional images were created by generating statistical parametricmaps (SPMs) of t deviates reflecting differences between the conditionand the rest states at each voxel location for each subject. Specifically, ttests were conducted at each voxel to measure changes in signal intensitybetween each of the four activation conditions and a local baseline (rest).The first two images (9 sec) in each of the four activation conditions andthe two rest periods were discarded from analysis because of the rise andfall time of the hemodynamic response (Bandettini et al., 1992). The firststage of the analysis involved averaging the final two images in each ofthe four activation condition epochs. Next, the final two images of therest periods preceding and following each condition epoch (four imagesin all) were averaged. A difference image was created for each of the fourconditions by subtracting the average rest image from the correspondingaverage activation condition image. Each activation condition was com-pared with the neutral, rest image so that all areas involved in each taskcould be localized, guarding against errors associated with incorrectassumptions about the nature of processes underlying performance ineach task (Sanders, 1980; Parsons et al., 1995; Shulman, 1996). In all, 15difference images (five cycles/image series 3 three image series/session)were generated per subject for each of the eight experimental conditions(four activation conditions 3 two pacing intervals). Finally, these meandifference values were compared on a voxel-by-voxel basis against ahypothetical mean of zero using pooled-variance Student’s t tests.
Individual SPGR anatomical scans and SPMs were linearly interpolatedto volumes with 1 mm 3 voxels, co-registered, and transformed into standardstereotaxic space (Talairach and Tournoux, 1988) using the “MCW-AFNI” software package (Cox, 1996). To compensate for normal variationin anatomy across subjects (Thompson et al., 1996), the stereotaxicallyresampled 3-D SPMs were spatially averaged at each point over a sphere ofradius of 4 mm. The SPMs for each condition were averaged across the 13subjects on a voxel-by-voxel basis. Thus each voxel in the resulting averagedSPM contains an averaged t statistic. The procedure of averaging statisticswas chosen to guard against nonequal MR signal variances between sub-jects. A threshold was then applied to the averaged t statistics to identifyvoxels in which the mean change in MR signal between rest and activationconditions was unlikely to be zero. The average of a set of t deviates is nota tabulated distribution. Therefore, the Cornish–Fisher expansion ofthe inverse distribution of a sum of random deviates (Fisher and Cornish,1960) was used to select a threshold (t 5 1.96; p , 10 28) for rejection ofthe null hypothesis. This threshold effectively eliminates false–positivevoxels from the functional maps.
Individual 3-D SPGR data from the 13 subjects were merged toproduce an “average brain” for anatomical reference. To examine theconsistency between the individual and group averaged functional maps,we identified the number of subjects demonstrating significantly (t $1.96) increased changes within the individual functional maps for eachsignificant activation foci identified by the group functional maps.
RESULTSBehavioral findingsFigure 1 displays the reaction time findings from the S and Cconditions of the PFT task. Inter-response intervals (IRIs) thatexceeded 50% of the target interval duration were excluded fromthe reaction time data. This occurred on 5% of the trials and
Rao et al. • Neural Systems Underlying Timing of Movements J. Neurosci., July 15, 1997, 17(14):5528–5535 5529

often was caused by the failure of subjects to fully depress theresponse key. The results demonstrated that the subjects wereable to reproduce the timing intervals with a high degree ofaccuracy in both the S and C conditions (Fig. 1A). There was asmall but significant increase in the duration of the mean IRIbetween the S and C conditions [F(1,12) 5 6.56; p , 0.05]. Asexpected, total variability (Fig. 1B), which is the SD of the IRI,also was significantly greater in the C than in the S condition[F(1,12) 5 28.59; p , 0.001]. Consistent with previous findings(Wing, 1980), variability was greater [F(1,12) 5 38.5; p , 0.001] forthe longer (600 msec) pacing interval. The two-way interactions(condition X pacing interval) were not significant ( p . 0.10) foreither mean IRI or total variability.
Subjects were highly accurate in discriminating changes inpitch in the D condition. The mean rate of accuracy was 94.5 and96.5% for the 300 and 600 msec intervals, respectively ( p . 0.10).
Functional imaging findingsTable 1 shows the center of mass, volume, and peak intensity(maximum t) of the activation foci, as well as the number ofsubjects demonstrating significantly activated tissue within eachfoci. For all four activation conditions, the anatomical location,magnitude, size, and consistency of the foci were nearly identicalfor the two pacing intervals. Two conclusions may be drawn fromthis observation. First, the pacing interval has a negligible effecton patterns of functional brain activity, at least for the intervals
Figure 1. Mean (6SEM) inter-response in-terval (A) and total variability ( B) as a func-tion of pacing interval (300 or 600 msec) andcondition (Synchronization, Continuation).Total variability is expressed as SD.
Table 1. Activation foci as a function of task and pacing interval
Pacing interval 5 300 msec Pacing interval 5 600 msec
Region
Coordinates(mm) Maxi-
mumt
Volume(ml)
Number(%) ofsubjects Region
Coordinates(mm) Maxi-
mumt
Volume(ml)
Number(%) ofsubjectsx y z x y z
Synchronization L SMC (4) 236 223 54 4.5 8.0 12 (92) L SMC (4) 234 225 56 4.3 10.0 13 (100)R cerebellum 14 252 219 3.3 2.3 11 (85) R cerebellum 15 251 218 3.7 3.8 13 (100)R STG (22) 64 215 13 2.1 0.3 9 (69) R STG (22) 61 218 15 2.4 0.2 10 (77)
Continuation L SMC (4) 235 224 55 5.0 13.9 13 (100) L SMC (4) 235 224 56 4.6 14.3 13 (100)R cerebellum 15 253 219 3.2 3.6 11 (85) R cerebellum 15 253 217 3.1 3.4 11 (85)M SMA (6) 21 24 54 3.5 3.1 11 (85) M SMA (6) 23 29 56 3.1 2.8 12 (92)L putamen 228 211 6 2.5 0.6 8 (62) L putamen 226 28 7 2.6 0.7 9 (69)L vl thalamus 212 220 7 2.4 0.2 10 (77) L vl thalamus 215 221 4 2.0 ,0.1 7 (54)R STG (22) 60 219 18 2.6 0.5 9 (69) R STG (22) 61 218 16 2.6 0.4 10 (77)R IFG (44) 56 10 7 2.2 0.4 9 (69) R IFG (44) 49 7 7 2.2 0.1 8 (62)
Listening R STG (22) 60 216 12 2.4 0.4 8 (62) R STG (22) 61 219 13 2.2 ,0.1 8 (62)L STG (22) 255 221 9 2.8 0.8 12 (92)
Discrimination R STG (22) 58 225 14 2.2 0.2 8 (62) R STG (22) 61 218 15 2.5 0.2 8 (62)L STG (22) 257 223 8 2.8 0.8 10 (77) L STG (22) 258 224 10 2.8 0.7 10 (77)M SMA (6) 21 7 50 2.7 0.5 9 (69) M SMA (6) 23 7 50 2.3 0.9 9 (69)
Foci characterized by center of mass (coordinates), maximum t value, volume (ml), and number (percent) of subjects demonstrating significantly increased signal intensitychanges (t $ 1.96) in region. Coordinates are in millimeters ( x , y, z) from the 0, 0, 0 point situated at the midline of the brain (x), at the anterior commissure ( y), and at thelevel of the anterior and posterior commissure (z). SMC, Sensorimotor cortex; STG, superior temporal gyrus; SMA, supplementary motor area; IFG, inferior frontal gyrus;vl, ventrolateral; R, right; L, left; M, midline. Numbers in parentheses refer to Brodmann areas.
5530 J. Neurosci., July 15, 1997, 17(14):5528–5535 Rao et al. • Neural Systems Underlying Timing of Movements
used in this study. Second, the functional images were highlyreproducible, because the two sets of images generated for eachpacing interval were derived from separate imaging series.
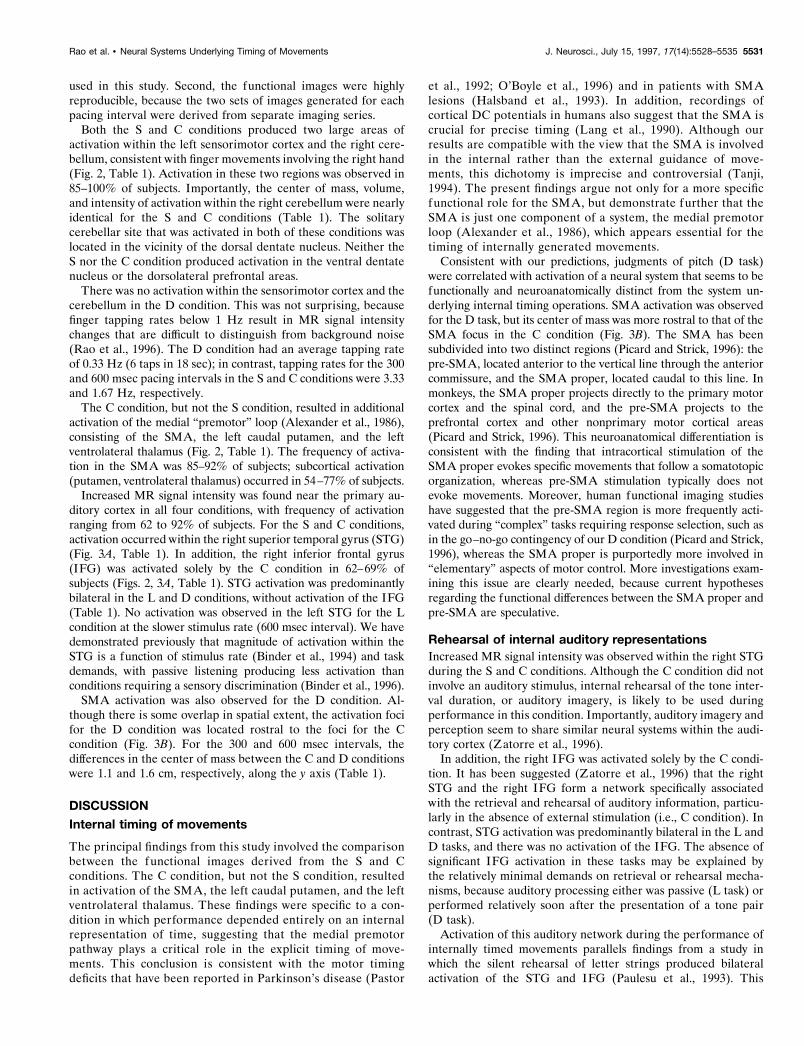
Both the S and C conditions produced two large areas ofactivation within the left sensorimotor cortex and the right cere-bellum, consistent with finger movements involving the right hand(Fig. 2, Table 1). Activation in these two regions was observed in85–100% of subjects. Importantly, the center of mass, volume,and intensity of activation within the right cerebellum were nearlyidentical for the S and C conditions (Table 1). The solitarycerebellar site that was activated in both of these conditions waslocated in the vicinity of the dorsal dentate nucleus. Neither theS nor the C condition produced activation in the ventral dentatenucleus or the dorsolateral prefrontal areas.
There was no activation within the sensorimotor cortex and thecerebellum in the D condition. This was not surprising, becausefinger tapping rates below 1 Hz result in MR signal intensitychanges that are difficult to distinguish from background noise(Rao et al., 1996). The D condition had an average tapping rateof 0.33 Hz (6 taps in 18 sec); in contrast, tapping rates for the 300and 600 msec pacing intervals in the S and C conditions were 3.33and 1.67 Hz, respectively.
The C condition, but not the S condition, resulted in additionalactivation of the medial “premotor” loop (Alexander et al., 1986),consisting of the SMA, the left caudal putamen, and the leftventrolateral thalamus (Fig. 2, Table 1). The frequency of activa-tion in the SMA was 85–92% of subjects; subcortical activation(putamen, ventrolateral thalamus) occurred in 54–77% of subjects.
Increased MR signal intensity was found near the primary au-ditory cortex in all four conditions, with frequency of activationranging from 62 to 92% of subjects. For the S and C conditions,activation occurred within the right superior temporal gyrus (STG)(Fig. 3A, Table 1). In addition, the right inferior frontal gyrus(IFG) was activated solely by the C condition in 62–69% ofsubjects (Figs. 2, 3A, Table 1). STG activation was predominantlybilateral in the L and D conditions, without activation of the IFG(Table 1). No activation was observed in the left STG for the Lcondition at the slower stimulus rate (600 msec interval). We havedemonstrated previously that magnitude of activation within theSTG is a function of stimulus rate (Binder et al., 1994) and taskdemands, with passive listening producing less activation thanconditions requiring a sensory discrimination (Binder et al., 1996).
SMA activation was also observed for the D condition. Al-though there is some overlap in spatial extent, the activation focifor the D condition was located rostral to the foci for the Ccondition (Fig. 3B). For the 300 and 600 msec intervals, thedifferences in the center of mass between the C and D conditionswere 1.1 and 1.6 cm, respectively, along the y axis (Table 1).
DISCUSSIONInternal timing of movements
The principal findings from this study involved the comparisonbetween the functional images derived from the S and Cconditions. The C condition, but not the S condition, resultedin activation of the SMA, the left caudal putamen, and the leftventrolateral thalamus. These findings were specific to a con-dition in which performance depended entirely on an internalrepresentation of time, suggesting that the medial premotorpathway plays a critical role in the explicit timing of move-ments. This conclusion is consistent with the motor timingdeficits that have been reported in Parkinson’s disease (Pastor
et al., 1992; O’Boyle et al., 1996) and in patients with SMAlesions (Halsband et al., 1993). In addition, recordings ofcortical DC potentials in humans also suggest that the SMA iscrucial for precise timing (Lang et al., 1990). Although ourresults are compatible with the view that the SMA is involvedin the internal rather than the external guidance of move-ments, this dichotomy is imprecise and controversial (Tanji,1994). The present findings argue not only for a more specificfunctional role for the SMA, but demonstrate further that theSMA is just one component of a system, the medial premotorloop (Alexander et al., 1986), which appears essential for thetiming of internally generated movements.
Consistent with our predictions, judgments of pitch (D task)were correlated with activation of a neural system that seems to befunctionally and neuroanatomically distinct from the system un-derlying internal timing operations. SMA activation was observedfor the D task, but its center of mass was more rostral to that of theSMA focus in the C condition (Fig. 3B). The SMA has beensubdivided into two distinct regions (Picard and Strick, 1996): thepre-SMA, located anterior to the vertical line through the anteriorcommissure, and the SMA proper, located caudal to this line. Inmonkeys, the SMA proper projects directly to the primary motorcortex and the spinal cord, and the pre-SMA projects to theprefrontal cortex and other nonprimary motor cortical areas(Picard and Strick, 1996). This neuroanatomical differentiation isconsistent with the finding that intracortical stimulation of theSMA proper evokes specific movements that follow a somatotopicorganization, whereas pre-SMA stimulation typically does notevoke movements. Moreover, human functional imaging studieshave suggested that the pre-SMA region is more frequently acti-vated during “complex” tasks requiring response selection, such asin the go–no-go contingency of our D condition (Picard and Strick,1996), whereas the SMA proper is purportedly more involved in“elementary” aspects of motor control. More investigations exam-ining this issue are clearly needed, because current hypothesesregarding the functional differences between the SMA proper andpre-SMA are speculative.
Rehearsal of internal auditory representationsIncreased MR signal intensity was observed within the right STGduring the S and C conditions. Although the C condition did notinvolve an auditory stimulus, internal rehearsal of the tone inter-val duration, or auditory imagery, is likely to be used duringperformance in this condition. Importantly, auditory imagery andperception seem to share similar neural systems within the audi-tory cortex (Zatorre et al., 1996).
In addition, the right IFG was activated solely by the C condi-tion. It has been suggested (Zatorre et al., 1996) that the rightSTG and the right IFG form a network specifically associatedwith the retrieval and rehearsal of auditory information, particu-larly in the absence of external stimulation (i.e., C condition). Incontrast, STG activation was predominantly bilateral in the L andD tasks, and there was no activation of the IFG. The absence ofsignificant IFG activation in these tasks may be explained bythe relatively minimal demands on retrieval or rehearsal mecha-nisms, because auditory processing either was passive (L task) orperformed relatively soon after the presentation of a tone pair(D task).
Activation of this auditory network during the performance ofinternally timed movements parallels findings from a study inwhich the silent rehearsal of letter strings produced bilateralactivation of the STG and IFG (Paulesu et al., 1993). This
Rao et al. • Neural Systems Underlying Timing of Movements J. Neurosci., July 15, 1997, 17(14):5528–5535 5531
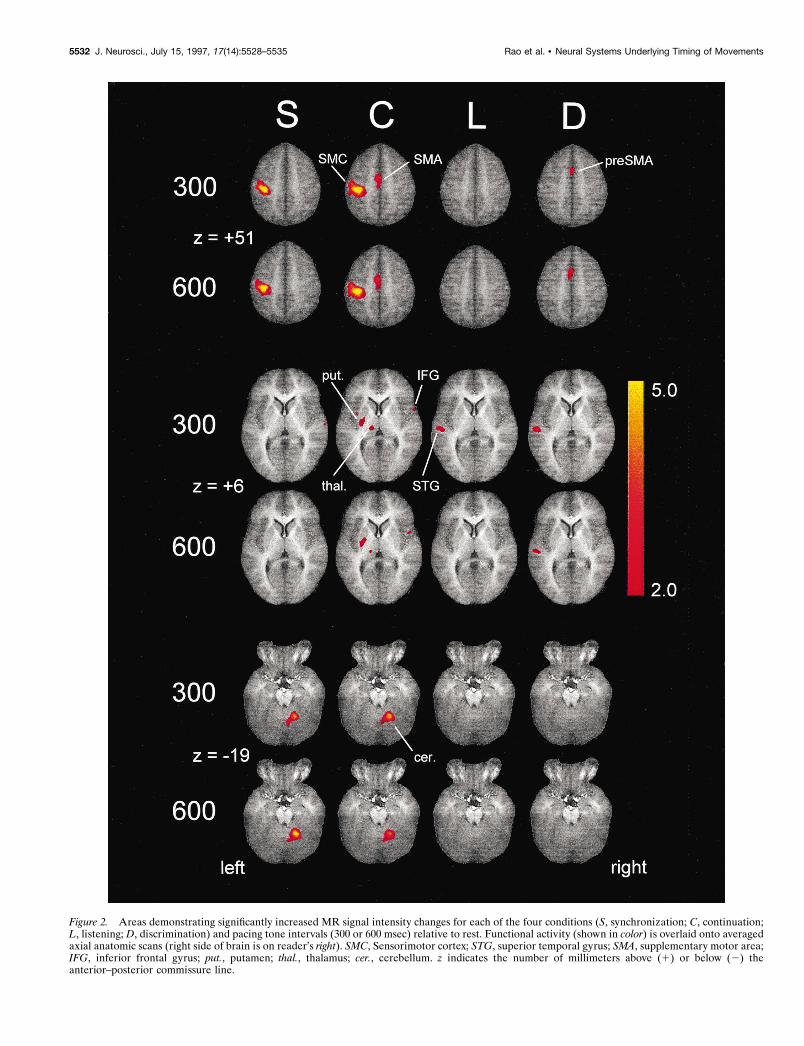
Figure 2. Areas demonstrating significantly increased MR signal intensity changes for each of the four conditions (S, synchronization; C, continuation;L, listening; D, discrimination) and pacing tone intervals (300 or 600 msec) relative to rest. Functional activity (shown in color) is overlaid onto averagedaxial anatomic scans (right side of brain is on reader’s right). SMC, Sensorimotor cortex; STG, superior temporal gyrus; SMA, supplementary motor area;IFG, inferior frontal gyrus; put., putamen; thal., thalamus; cer., cerebellum. z indicates the number of millimeters above (1) or below (2) theanterior–posterior commissure line.
5532 J. Neurosci., July 15, 1997, 17(14):5528–5535 Rao et al. • Neural Systems Underlying Timing of Movements
suggested to the authors that the articulatory loop of workingmemory includes a subvocal rehearsal system. This interpretationsuggests the possibility that in our study, an internal, nonlinguisticauditory representation of the target interval duration was sus-tained to guide the timing of sequential movements, just as a tonedoes in the S condition.
Sensorimotor control of paced finger tapping
Both PFT tasks produced two large areas of activation in the leftsensorimotor cortex and the right cerebellum, within the vicinityof the dorsal dentate nucleus. These areas form a circuit (Strick etal., 1993; Middleton and Strick, 1994), which likely supports
Figure 3. A, Areas of increased MR signal intensity for the synchronization (S) and continuation ( C ) conditions at two pacing tone intervals. The twosagittal slices are located 48 and 57 mm right of the interhemispheric fissure. STG activation is observed in both conditions, despite the absence of a tonestimulus in the C condition. IFG activation is observed only in the C condition. B, Areas of increased MR signal intensity for the continuation (C ) anddiscrimination (D) conditions at two pacing tone intervals. The sagittal slice is located 3 mm left of the interhemispheric fissure. The horizontal greenline indicates the intersection of the anterior and posterior commissures (z 5 0); the perpendicular vertical line crosses through the anterior commissure(VAC line; y 5 0). The functional activity for the C condition is located primarily within the SMA proper (located posterior to the VAC line), whereasactivity for the D condition is located largely within the pre-SMA region (anterior to the VAC line).
Rao et al. • Neural Systems Underlying Timing of Movements J. Neurosci., July 15, 1997, 17(14):5528–5535 5533
sensorimotor functions involved in the performance of both the Sand C conditions. This proposal suggests that motor timing im-pairments in patients with cerebellar damage (Ivry et al., 1988;Ivry and Keele, 1989) may be secondary to deficits in sensorim-otor processing that interact with internal timekeepingoperations.
Interestingly, no activation was found in the ventral portion ofthe dentate nucleus, which projects primarily to dorsolateralprefrontal areas (Middleton and Strick, 1994), which also werenot activated in either of the PFT tasks. The dorsolateral pre-frontal areas have been associated with “higher-level” cognitivefunctions, including working memory. This indicates that PFTdoes not significantly draw on these processes, regardless ofwhether an auditory pacing cue is available.
Concluding remarksIn summary, our findings indicated that the performance ofprecisely timed movements is dependent on three interrelatedneural systems, each of which supports a unique function. Themedial premotor system seems to be responsible for the explicittiming of movements. This system was activated for both timeintervals of the C condition, which suggests that a single neuralsystem regulates the explicit motor timing of the intervalssampled in this study. Our findings do not rule out the possi-bility that timekeeping operations may be distributed acrossother neural systems, for intervals outside of the narrow rangestudied here. This is especially true for intervals spanningdurations of .1–2 sec, wherein attentional biases and contex-tual variables increasingly contribute to marking the passage oftime.
Internal timing also is performed in association with the re-trieval and rehearsal of internal nonlinguistic auditory represen-tations of time intervals. The right STG and the right IFG forma system, which seems to support this process. This findingsuggests an alternative interpretation for interference effects dur-ing PFT (C condition) when subjects simultaneously performedan anagram solution task, which involves linguistic and nonlin-guistic processing (Sergent et al., 1993). The authors attributedthe increased IRI variability in PFT during dual-task perfor-mance to a disruption in the timing mechanism. Our findingsraise the possibility that the interference could be attributableinstead to a disruption in subvocal, nonlinguistic rehearsalprocesses.
Finally, the dorsal dentate nucleus and the sensorimotor cortexform a circuit that seems to be principally responsible for pro-cessing the sensorimotor aspects of PFT (Leiner et al., 1995).One possibility is that the cerebellum is involved in coordinatingexternal (S condition) and internal (C condition) stimulus eventswith output from the motor system. This is consistent with theview that the cerebellum serves as an integrator of multisensoryinformation from the cerebral cortex into a motor frame ofreference (Bloedel, 1992), essential for the coordination ofmovement.
REFERENCESAlexander GE, DeLong MR, Strick PL (1986) Parallel organization of
functionally segregated circuits linking basal ganglia and cortex. AnnuRev Neurosci 9:357–381.
Bandettini PA, Wong EC, Hinks RS, Tikofsky RS, Hyde JS (1992) Timecourse EPI of human brain function during task activation. MagnReson Med 25:390–397.
Bandettini PA, Jesmanowicz A, Wong EC, Hyde JS (1993) Processingstrategies for time-course data sets in functional MRI of the humanbrain. Magn Reson Med 30:161–173.
Binder JR, Rao SM, Hammeke TA, Frost JA, Bandettini PA, Hyde JS(1994) Effects of stimulus rate on signal response during functionalmagnetic resonance imaging of auditory cortex. Cognit Brain Res2:31–38.
Binder JR, Frost JA, Hammeke TA, Rao SM, Cox RW (1996) Functionof the left planum temporale in auditory and linguistic processing.Brain 119:1239–1247.
Bloedel JR (1992) Functional heterogeneity with structural homogene-ity: how does the cerebellum operate? Behav Brain Sci 15:666–678.
Brooks DJ, Ibanez V, Sawle GV, Quinn N, Lees AJ, Mathias CJ, BannisterR, Marsden CD, Frackowiak RS (1990) Differing patterns of striatal18F-dopa uptake in Parkinson’s disease, multiple system atrophy andprogressive supranuclear palsy. Ann Neurol 28:547–555.
Cox RW (1996) AFNI: software for analysis and visualization of func-tional magnetic resonance neuroimages. Comput Biomed Res29:162–173.
Fisher RA, Cornish EA (1960) The percentile points of distributionshaving known cumulants. Technometrics 2:209–226.
Halsband U, Ito N, Tanji J, Freund HJ (1993) The role of premotorcortex and the supplementary motor area in the temporal control ofmovement in man. Brain 116:243–266.
Ivry RB, Keele SW (1989) Timing functions of the cerebellum. J CognitNeurosci 1:134–150.
Ivry RB, Keele SW, Diener HC (1988) Dissociation of the lateral andmedial cerebellum in movement timing and movement execution. ExpBrain Res 73:167–180.
Jezzard P, Balaban RS (1995) Correction for geometric distortion in echoplanar images from Bo field distortions. Magn Reson Med 34:65–73.
Keren D, Peleg S, Brada R (1988) Image sequence enhancement usingsub-pixel displacements. IEEE Conference on Computer Vision andPattern Recognition, pp 742–746.
Kolers PA, Brewster JM (1985) Rhythms and responses. J Exp Psychol11:150–167.
Lang W, Obrig H, Lindinger G, Cheyne D, Deecke L (1990) Supple-mentary motor area activation while tapping bimanually differentrhythms in musicians. Exp Brain Res 79:504–514.
Leiner HC, Leiner AL, Dow RS (1995) The underestimated cerebellum.Hum Brain Mapp 2:244–254.
Mates J (1994) A model of synchronization of motor acts to a stimulusresponse. I. Timing and error corrections. Biol Cybern 70:463–473.
Middleton FA, Strick PL (1994) Anatomical evidence for cerebellar andbasal ganglia involvement in higher cognitive function. Science266:458–461.
O’Boyle DJ, Freeman JS, Cody FWJ (1996) The accuracy and precisionof timing of self-paced, repetitive movements in subjects with Parkin-son’s disease. Brain 119:51–70.
Ogawa S, Lee T-M (1991) Magnetic resonance imaging of blood vesselsat high fields: in vivo and in vitro measurements and image stimulation.Magn Reson Med 16:9–18.
Ogawa S, Lee T-M, Nayak AS, Glynn P (1990) Oxygenation-sensitivecontrast in magnetic resonance image of rodent brain at high magneticfields. Magn Reson Med 14:68–78.
Oldfield RC (1971) The assessment and analysis of handedness: theEdinburgh inventory. Neuropsychologia 9:97–113.
Parsons LM, Fox PT, Downs JH, Glass T, Hirsch TB, Martin CC, JerabekPA, Lancaster JL (1995) Use of implicit motor imagery for visualshape discrimination as revealed by PET. Nature 375:54–58.
Pastor MA, Artieda J, Jahanshahi M, Obeso JA (1992) Performanceof repetitive wrist movements in Parkinson’s disease. Brain 115:875– 891.
Paulesu E, Frith CD, Frackowiak RS (1993) The neural correlates of theverbal component of working memory. Nature 362:342–345.
Picard N, Strick PL (1996) Motor areas of the medial wall: a review oftheir location and functional activation. Cereb Cortex 6:342–353.
Rao SM, Bandettini PA, Binder JR, Bobholz J, Hammeke TA, Stein EA,Hyde JS (1996) Relationship between finger movement rate and func-tional magnetic resonance signal change in human primary motorcortex. J Cereb Blood Flow Metab 16:1250–1254.
Sanders AF (1980) Stage analysis of reaction processes. In: Tutorials inmotor behavior (Stelmach GE, Vroon PA, eds), pp 331–354. Amster-dam: North-Holland.
Sergent V, Hellige JB, Cherry B (1993) Effects of responding hand andconcurrent verbal processing on time-keeping and motor-implementation processes. Brain Cogn 23:243–262.
Shulman, R (1996) Interview. J Cognit Neurosci 8:474–480.
5534 J. Neurosci., July 15, 1997, 17(14):5528–5535 Rao et al. • Neural Systems Underlying Timing of Movements

Strick PL, Hoover JE, Mushiake H (1993) Evidence for “output chan-nels” in the basal ganglia and cerebellum. In: Role of the cerebellumand basal ganglia in voluntary movement (Mano N, Hamada I, DeLongMR, eds), pp 171–180. New York: Elsevier Science.
Talairach J, Tournoux P (1988) Co-planar stereotaxic atlas of the humanbrain. New York: Thieme.
Tanji J (1994) The supplementary motor area in the cerebral cortex.Neurosci Res 19:251–268.
Thompson PM, Schwartz C, Lin RT, Khan AA, Toga AW (1996) Three-dimensional statistical analysis of sulcal variability in the human brain.J Neurosci 16:4261–4274.
Wing AM (1980) The long and short of timing in response sequences. In:
Tutorials in motor behavior (Stelmach G, Requin J, eds), pp 469–486.New York: North Holland.
Wing AM, Kristofferson AB (1973) Response delays and the timing ofdiscrete motor responses. Percept Psychophys 14:5–12.
Wong EC, Bandettini PA, Hyde JS (1992a) Echo-planar imaging of thehuman brain using a three axis local gradient coil. Proc Soc MagnReson Med (11th meeting), p 105.
Wong EC, Boskamp E, Hyde JS (1992b) A volume optimized quadra-ture elliptical endcap birdcage brain coil. Proc Soc Magn Reson Med(11th meeting), p 4015.
Zatorre RJ, Halpern AR, Perry DW, Meyer E, Evans AC (1996)Hearing in the mind’s ear: a PET investigation of musical imagery andperception. J Cognit Neurosci 8:29–46.
Rao et al. • Neural Systems Underlying Timing of Movements J. Neurosci., July 15, 1997, 17(14):5528–5535 5535