Embed Size (px)
Citation preview
1 Copyright © 2005 by ASME
Proceedings of IPACK2005 ASME InterPACK '05
July 17-22, San Francisco, California, USA
IPACK2005-73273
DISTRIBUTED LEAKAGE FLOW IN RAISED-FLOOR DATA CENTERS
Amir Radmehr Innovative Research, Inc.
Plymouth, MN, USA
Roger R. Schmidt IBM Corporation
Poughkeepsie, NY, USA
Kailash C. Karki and Suhas V. Patankar Innovative Research, Inc.
Plymouth, MN, USA ABSTRACT
In raised-floor data centers, distributed leakage flow—the airflow through seams between panels on the raised floor—reduces the amount of cooling air available at the inlets of the computer equipment. This airflow must be known to determine the total cooling air requirement in a data center. The amount of distributed leakage flow depends on the area of the seams and the plenum pressure, which, in turn, depends on the amount of airflow into the plenum and the total open area (combined area of perforated tiles, cutouts, and seams between panels) on the raised floor. The goal of this study is to outline a procedure to measure leakage flow, to provide data on the amount of the distributed leakage flow, and to show the quantitative relationship between the leakage flow and the leakage area. It also uses a computational model to calculate the distributed leakage flow, the flow through perforated tiles, and the plenum pressure. The results obtained from the model are verified using the measurements. Such a model can be used for design and maintenance of data centers.
The measurements show that the leakage flow in a typical data center is between 5-15% of the available cooling air. The measured quantities were used to estimate the area of the seams; for this data center, it was found to be 0.35% of the floor area. The computational model represents the actual physical scenarios very well. The discrepancy between the calculated and measured values of leakage flow, flow through perforated tiles, and plenum pressure is less than 10%.
KEYWORDS
Data Center, Leakage Flow, Airflow, TileFlow
INTRODUCTION This study deals with the air leakage from the gaps (seams)
between the panels in a raised-floor data center. Although these gaps are very small (almost unnoticeable), they are dispersed throughout the raised floor, and the resulting airflow can be
significant. This distributed leakage flow reduces the total amount of cooling air available for direct cooling of the computer equipment and must be known to determine the total cooling air requirement in a data center and to ensure that the cooling air need of individual computer equipment is met.
The distributed leakage flow depends on the quality of floor installation and wear and tear on the floor. It increases with time as the wear and tear causes the gap size to increase. In some newer data centers, rubber gaskets are used between the panels and the metal bars holding them in place to reduce the air leakage. However, over time, the gaskets lose their sealing quality or come off, and the leakage flow increases.
The subject of distributed leakage flow has received little attention so far. Our literature search produced no published work in this area except for a product newsletter [1], which presents a parametric study on the effect of leakage area on the leakage flow and the plenum pressure. This study was conducted using TileFlow [2]. The subject of airflow distribution through perforated tiles, on the other hand, has been studied extensively, both computationally and experimentally [3-6].
This paper reports on a combined experimental/modeling study directed towards quantification of distributed leakage flow. This study has following objectives:
To outline an experimental procedure, involving measurements of plenum pressure, return flow to the air-conditioning (A/C) units, and airflow through perforated tiles, to determine the distributed leakage flow.
To illustrate the dependence of leakage flow on plenum pressure and leakage area, and to show the effect of the leakage flow on the airflow distribution through perforated tiles.
2 Copyright © 2005 by ASME
To use a computational model to predict the cooling-airflow distribution in the presence of distributed leakage flow and compare the results with the measurements.
The measurements were conducted on an actual data
center. A part of the data center was partitioned off to create a laboratory-scale test area. The number of perforated tiles was varied to create different plenum pressures. For each layout, two sets of measurements were made: one with open seams and the other with sealed seams. For each scenario, the return flow to the A/C unit, the airflow through each perforated tile, and the static pressure under each perforated tile were measured. The flow resistance of the perforated tiles was measured independently in a wind tunnel. The modeling work was conducted using the commercial software package TileFlow [2]. TileFlow uses the technique of Computational Fluid Dynamics (CFD) to calculate the three-dimensional velocity and pressure fields in the plenum under the raised floor, airflow rates through perforated tiles on the raised floor, and leakage flow through the seams. The results obtained from the computational model were compared with those from measurement. The agreement was found to be very satisfactory.
MEASUREMENTS
Description of the Raised-Floor Data Center
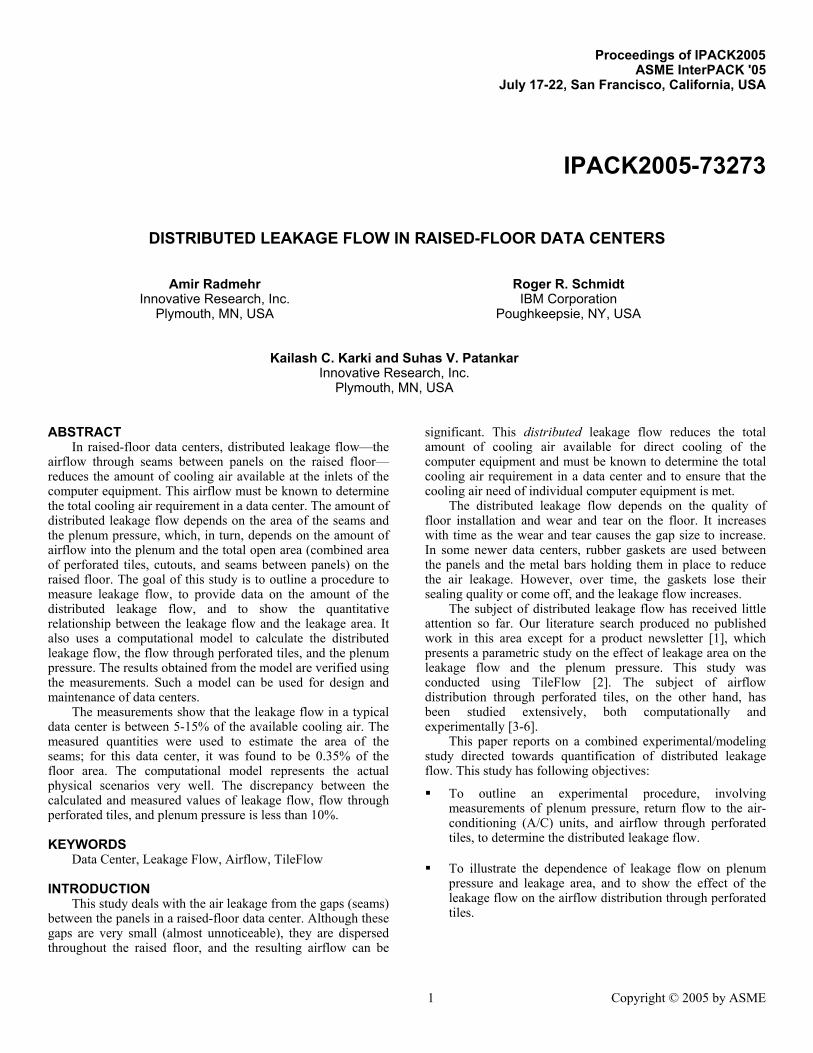
The measurements were performed in a data center located at the IBM facility in Poughkeepsie, N.Y. The data center is more than 20 years old and was not fully operational at the time of the measurements. The raised floor height from the subfloor to the bottom of the tiles is 16.5 inches. The thickness of the perforated tiles is about 1.5 inch. A small section of the data center was selected as a test area. The selected section was separated from the rest of the data center by placing cardboard partitions under the raised floor. The partitions were placed on the three sides of the test area. The fourth side was a concrete wall. The partitions were taped to the subfloor and false floor to minimize the leakage flow through the perimeter. Figure 1 shows the partition used to form the test area.
Figure 1. Cardboard partition used to seal the perimeter of the test area
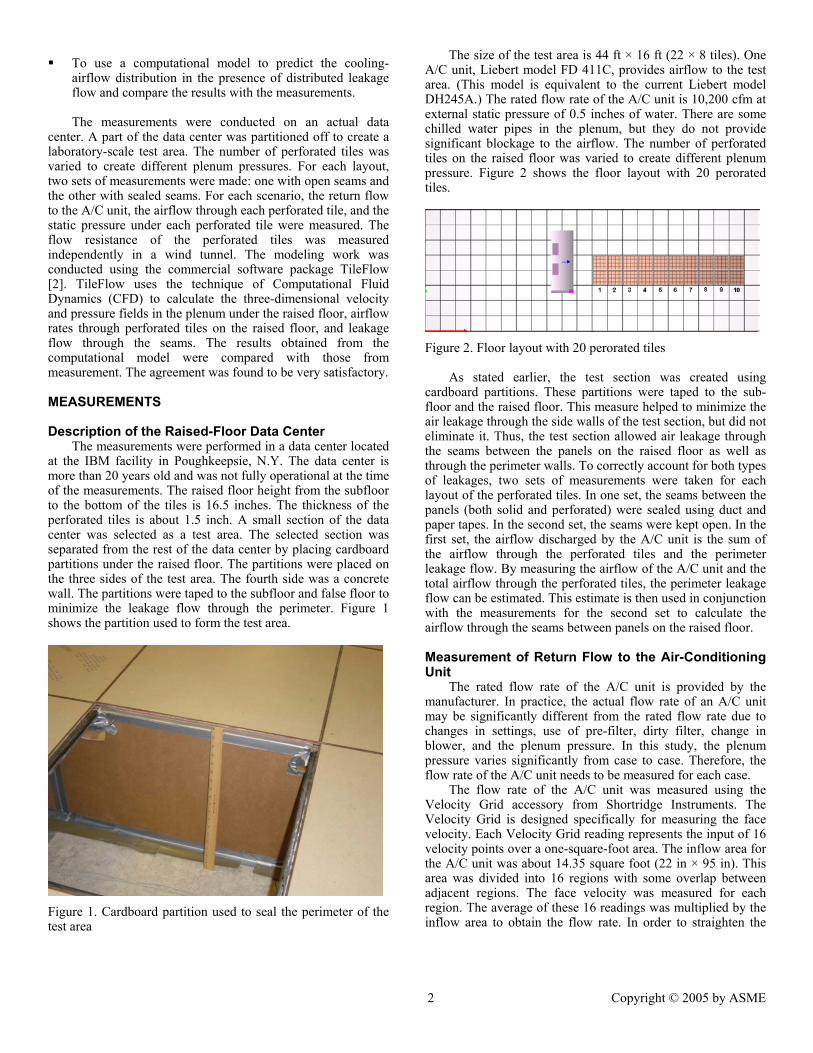
The size of the test area is 44 ft × 16 ft (22 × 8 tiles). One A/C unit, Liebert model FD 411C, provides airflow to the test area. (This model is equivalent to the current Liebert model DH245A.) The rated flow rate of the A/C unit is 10,200 cfm at external static pressure of 0.5 inches of water. There are some chilled water pipes in the plenum, but they do not provide significant blockage to the airflow. The number of perforated tiles on the raised floor was varied to create different plenum pressure. Figure 2 shows the floor layout with 20 perorated tiles.
Figure 2. Floor layout with 20 perorated tiles
As stated earlier, the test section was created using cardboard partitions. These partitions were taped to the sub-floor and the raised floor. This measure helped to minimize the air leakage through the side walls of the test section, but did not eliminate it. Thus, the test section allowed air leakage through the seams between the panels on the raised floor as well as through the perimeter walls. To correctly account for both types of leakages, two sets of measurements were taken for each layout of the perforated tiles. In one set, the seams between the panels (both solid and perforated) were sealed using duct and paper tapes. In the second set, the seams were kept open. In the first set, the airflow discharged by the A/C unit is the sum of the airflow through the perforated tiles and the perimeter leakage flow. By measuring the airflow of the A/C unit and the total airflow through the perforated tiles, the perimeter leakage flow can be estimated. This estimate is then used in conjunction with the measurements for the second set to calculate the airflow through the seams between panels on the raised floor. Measurement of Return Flow to the Air-Conditioning Unit
The rated flow rate of the A/C unit is provided by the manufacturer. In practice, the actual flow rate of an A/C unit may be significantly different from the rated flow rate due to changes in settings, use of pre-filter, dirty filter, change in blower, and the plenum pressure. In this study, the plenum pressure varies significantly from case to case. Therefore, the flow rate of the A/C unit needs to be measured for each case.
The flow rate of the A/C unit was measured using the Velocity Grid accessory from Shortridge Instruments. The Velocity Grid is designed specifically for measuring the face velocity. Each Velocity Grid reading represents the input of 16 velocity points over a one-square-foot area. The inflow area for the A/C unit was about 14.35 square foot (22 in × 95 in). This area was divided into 16 regions with some overlap between adjacent regions. The face velocity was measured for each region. The average of these 16 readings was multiplied by the inflow area to obtain the flow rate. In order to straighten the
3 Copyright © 2005 by ASME
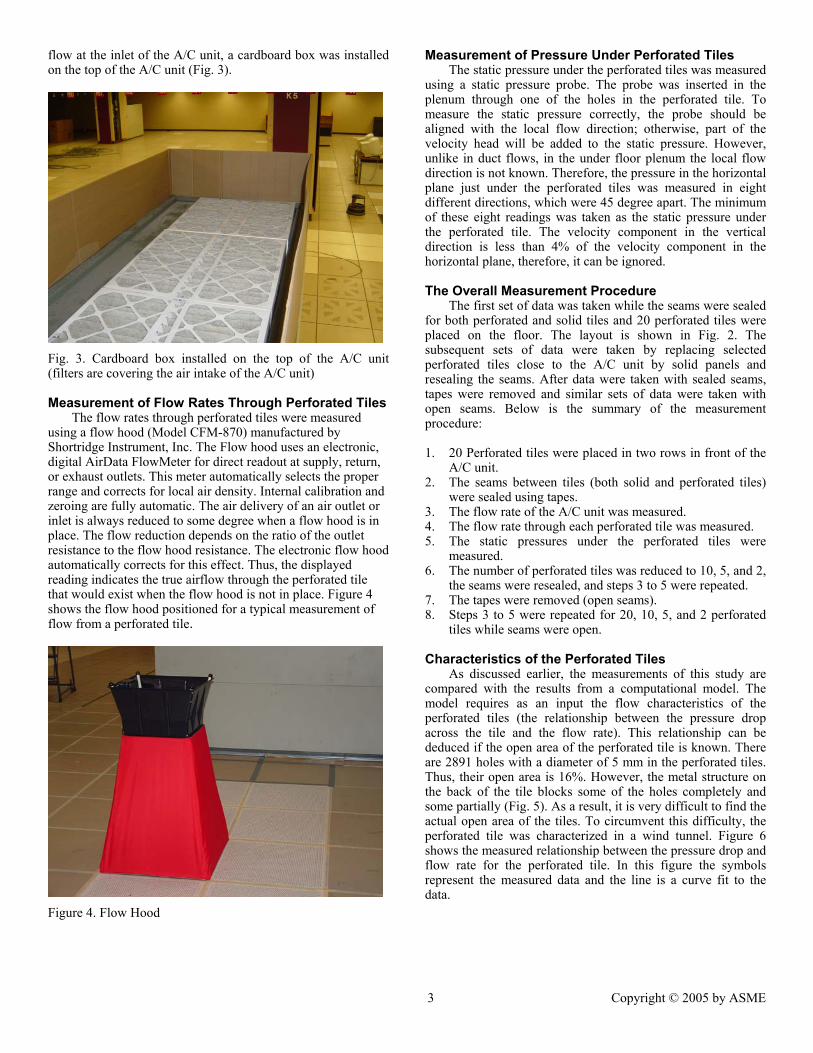
flow at the inlet of the A/C unit, a cardboard box was installed on the top of the A/C unit (Fig. 3).
Fig. 3. Cardboard box installed on the top of the A/C unit (filters are covering the air intake of the A/C unit)
Measurement of Flow Rates Through Perforated Tiles
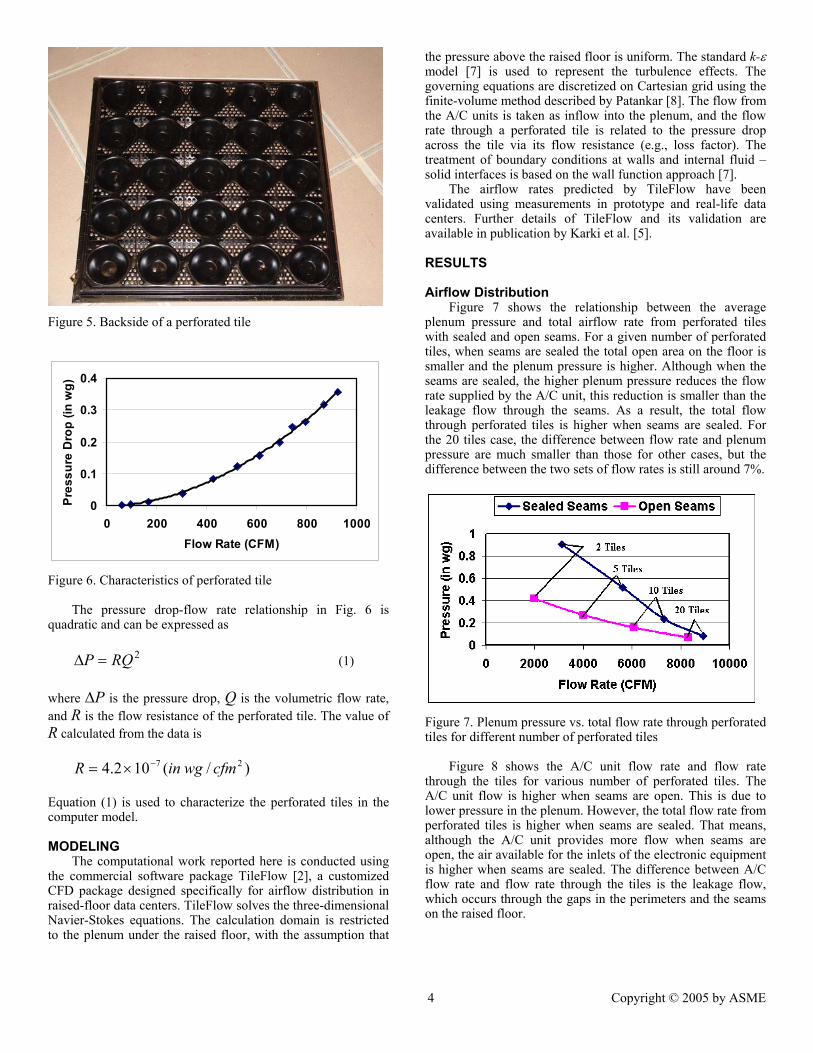
The flow rates through perforated tiles were measured using a flow hood (Model CFM-870) manufactured by Shortridge Instrument, Inc. The Flow hood uses an electronic, digital AirData FlowMeter for direct readout at supply, return, or exhaust outlets. This meter automatically selects the proper range and corrects for local air density. Internal calibration and zeroing are fully automatic. The air delivery of an air outlet or inlet is always reduced to some degree when a flow hood is in place. The flow reduction depends on the ratio of the outlet resistance to the flow hood resistance. The electronic flow hood automatically corrects for this effect. Thus, the displayed reading indicates the true airflow through the perforated tile that would exist when the flow hood is not in place. Figure 4 shows the flow hood positioned for a typical measurement of flow from a perforated tile.
Figure 4. Flow Hood
Measurement of Pressure Under Perforated Tiles The static pressure under the perforated tiles was measured
using a static pressure probe. The probe was inserted in the plenum through one of the holes in the perforated tile. To measure the static pressure correctly, the probe should be aligned with the local flow direction; otherwise, part of the velocity head will be added to the static pressure. However, unlike in duct flows, in the under floor plenum the local flow direction is not known. Therefore, the pressure in the horizontal plane just under the perforated tiles was measured in eight different directions, which were 45 degree apart. The minimum of these eight readings was taken as the static pressure under the perforated tile. The velocity component in the vertical direction is less than 4% of the velocity component in the horizontal plane, therefore, it can be ignored. The Overall Measurement Procedure
The first set of data was taken while the seams were sealed for both perforated and solid tiles and 20 perforated tiles were placed on the floor. The layout is shown in Fig. 2. The subsequent sets of data were taken by replacing selected perforated tiles close to the A/C unit by solid panels and resealing the seams. After data were taken with sealed seams, tapes were removed and similar sets of data were taken with open seams. Below is the summary of the measurement procedure:
1. 20 Perforated tiles were placed in two rows in front of the
A/C unit. 2. The seams between tiles (both solid and perforated tiles)
were sealed using tapes. 3. The flow rate of the A/C unit was measured. 4. The flow rate through each perforated tile was measured. 5. The static pressures under the perforated tiles were
measured. 6. The number of perforated tiles was reduced to 10, 5, and 2,
the seams were resealed, and steps 3 to 5 were repeated. 7. The tapes were removed (open seams). 8. Steps 3 to 5 were repeated for 20, 10, 5, and 2 perforated
tiles while seams were open.
Characteristics of the Perforated Tiles As discussed earlier, the measurements of this study are
compared with the results from a computational model. The model requires as an input the flow characteristics of the perforated tiles (the relationship between the pressure drop across the tile and the flow rate). This relationship can be deduced if the open area of the perforated tile is known. There are 2891 holes with a diameter of 5 mm in the perforated tiles. Thus, their open area is 16%. However, the metal structure on the back of the tile blocks some of the holes completely and some partially (Fig. 5). As a result, it is very difficult to find the actual open area of the tiles. To circumvent this difficulty, the perforated tile was characterized in a wind tunnel. Figure 6 shows the measured relationship between the pressure drop and flow rate for the perforated tile. In this figure the symbols represent the measured data and the line is a curve fit to the data.
4 Copyright © 2005 by ASME
Figure 5. Backside of a perforated tile
0
0.1
0.2
0.3
0.4
0 200 400 600 800 1000Flow Rate (CFM)
Pres
sure
Dro
p (in
wg)
Figure 6. Characteristics of perforated tile
The pressure drop-flow rate relationship in Fig. 6 is quadratic and can be expressed as
2RQP =∆ (1)
where ∆P is the pressure drop, Q is the volumetric flow rate, and R is the flow resistance of the perforated tile. The value of R calculated from the data is
)/ (102.4 27 cfmwginR −×=
Equation (1) is used to characterize the perforated tiles in the computer model.
MODELING
The computational work reported here is conducted using the commercial software package TileFlow [2], a customized CFD package designed specifically for airflow distribution in raised-floor data centers. TileFlow solves the three-dimensional Navier-Stokes equations. The calculation domain is restricted to the plenum under the raised floor, with the assumption that
the pressure above the raised floor is uniform. The standard k-ε model [7] is used to represent the turbulence effects. The governing equations are discretized on Cartesian grid using the finite-volume method described by Patankar [8]. The flow from the A/C units is taken as inflow into the plenum, and the flow rate through a perforated tile is related to the pressure drop across the tile via its flow resistance (e.g., loss factor). The treatment of boundary conditions at walls and internal fluid –solid interfaces is based on the wall function approach [7].
The airflow rates predicted by TileFlow have been validated using measurements in prototype and real-life data centers. Further details of TileFlow and its validation are available in publication by Karki et al. [5].
RESULTS
Airflow Distribution
Figure 7 shows the relationship between the average plenum pressure and total airflow rate from perforated tiles with sealed and open seams. For a given number of perforated tiles, when seams are sealed the total open area on the floor is smaller and the plenum pressure is higher. Although when the seams are sealed, the higher plenum pressure reduces the flow rate supplied by the A/C unit, this reduction is smaller than the leakage flow through the seams. As a result, the total flow through perforated tiles is higher when seams are sealed. For the 20 tiles case, the difference between flow rate and plenum pressure are much smaller than those for other cases, but the difference between the two sets of flow rates is still around 7%.
Figure 7. Plenum pressure vs. total flow rate through perforated tiles for different number of perforated tiles
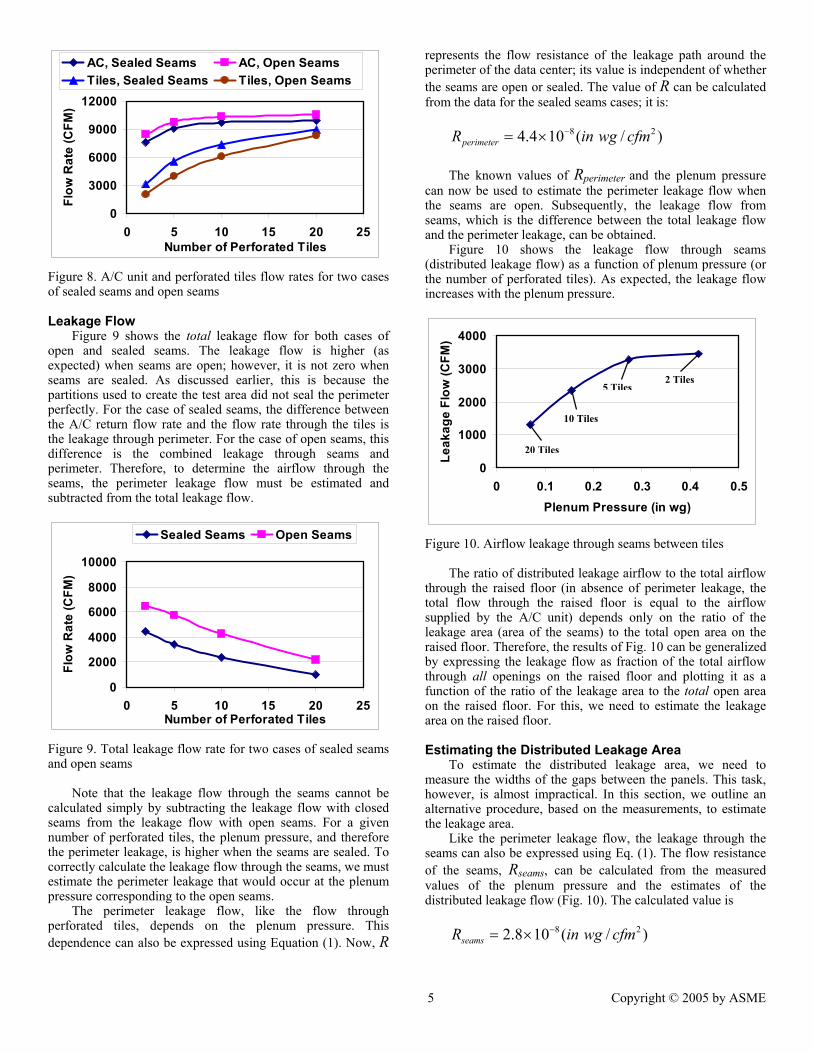
Figure 8 shows the A/C unit flow rate and flow rate through the tiles for various number of perforated tiles. The A/C unit flow is higher when seams are open. This is due to lower pressure in the plenum. However, the total flow rate from perforated tiles is higher when seams are sealed. That means, although the A/C unit provides more flow when seams are open, the air available for the inlets of the electronic equipment is higher when seams are sealed. The difference between A/C flow rate and flow rate through the tiles is the leakage flow, which occurs through the gaps in the perimeters and the seams on the raised floor.
5 Copyright © 2005 by ASME
0
3000
6000
9000
12000
0 5 10 15 20 25Number of Perforated Tiles
Flow
Rat
e (C
FM)
AC, Sealed Seams AC, Open SeamsTiles, Sealed Seams Tiles, Open Seams
Figure 8. A/C unit and perforated tiles flow rates for two cases of sealed seams and open seams Leakage Flow
Figure 9 shows the total leakage flow for both cases of open and sealed seams. The leakage flow is higher (as expected) when seams are open; however, it is not zero when seams are sealed. As discussed earlier, this is because the partitions used to create the test area did not seal the perimeter perfectly. For the case of sealed seams, the difference between the A/C return flow rate and the flow rate through the tiles is the leakage through perimeter. For the case of open seams, this difference is the combined leakage through seams and perimeter. Therefore, to determine the airflow through the seams, the perimeter leakage flow must be estimated and subtracted from the total leakage flow.
0
2000
4000
6000
8000
10000
0 5 10 15 20 25Number of Perforated Tiles
Flow
Rat
e (C
FM)
Sealed Seams Open Seams
Figure 9. Total leakage flow rate for two cases of sealed seams and open seams
Note that the leakage flow through the seams cannot be calculated simply by subtracting the leakage flow with closed seams from the leakage flow with open seams. For a given number of perforated tiles, the plenum pressure, and therefore the perimeter leakage, is higher when the seams are sealed. To correctly calculate the leakage flow through the seams, we must estimate the perimeter leakage that would occur at the plenum pressure corresponding to the open seams.
The perimeter leakage flow, like the flow through perforated tiles, depends on the plenum pressure. This dependence can also be expressed using Equation (1). Now, R
represents the flow resistance of the leakage path around the perimeter of the data center; its value is independent of whether the seams are open or sealed. The value of R can be calculated from the data for the sealed seams cases; it is:
)/(104.4 28 cfmwginRperimeter
−×= The known values of Rperimeter and the plenum pressure
can now be used to estimate the perimeter leakage flow when the seams are open. Subsequently, the leakage flow from seams, which is the difference between the total leakage flow and the perimeter leakage, can be obtained.
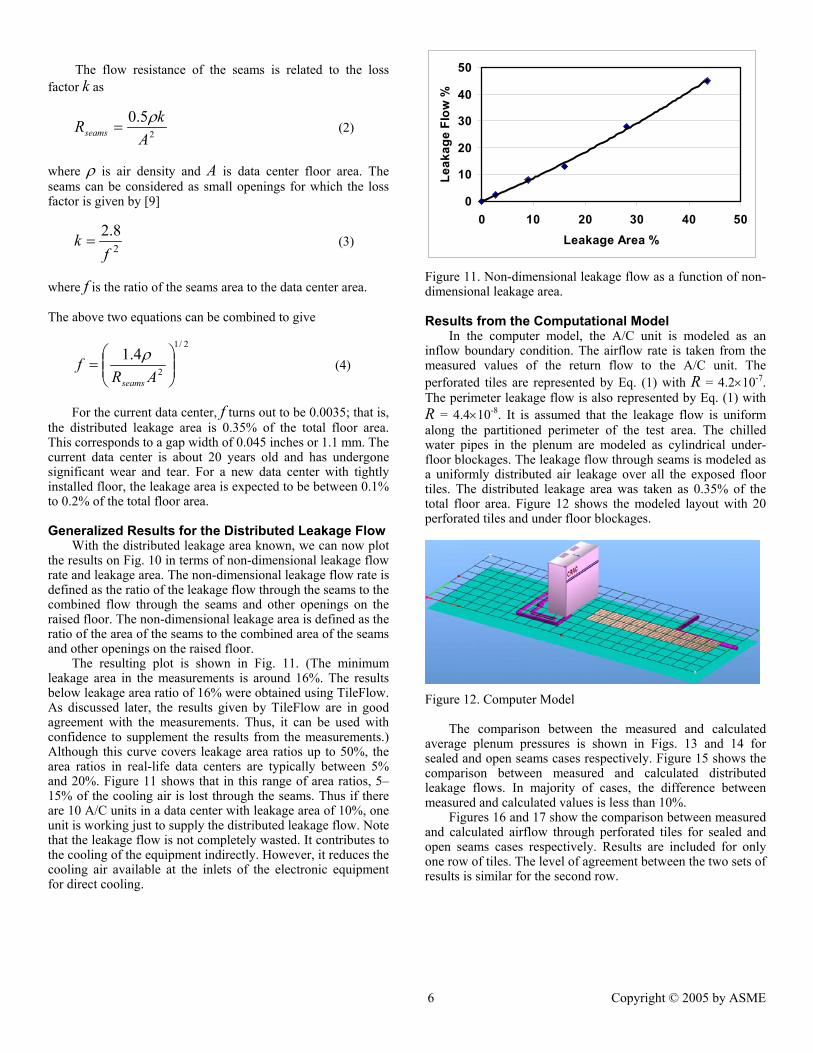
Figure 10 shows the leakage flow through seams (distributed leakage flow) as a function of plenum pressure (or the number of perforated tiles). As expected, the leakage flow increases with the plenum pressure.
0
1000
2000
3000
4000
0 0.1 0.2 0.3 0.4 0.5Plenum Pressure (in wg)
Leak
age
Flow
(CFM
)20 Tiles
10 Tiles
5 Tiles2 Tiles
Figure 10. Airflow leakage through seams between tiles
The ratio of distributed leakage airflow to the total airflow through the raised floor (in absence of perimeter leakage, the total flow through the raised floor is equal to the airflow supplied by the A/C unit) depends only on the ratio of the leakage area (area of the seams) to the total open area on the raised floor. Therefore, the results of Fig. 10 can be generalized by expressing the leakage flow as fraction of the total airflow through all openings on the raised floor and plotting it as a function of the ratio of the leakage area to the total open area on the raised floor. For this, we need to estimate the leakage area on the raised floor. Estimating the Distributed Leakage Area
To estimate the distributed leakage area, we need to measure the widths of the gaps between the panels. This task, however, is almost impractical. In this section, we outline an alternative procedure, based on the measurements, to estimate the leakage area.
Like the perimeter leakage flow, the leakage through the seams can also be expressed using Eq. (1). The flow resistance of the seams, Rseams, can be calculated from the measured values of the plenum pressure and the estimates of the distributed leakage flow (Fig. 10). The calculated value is
)/(108.2 28 cfmwginRseams−×=
6 Copyright © 2005 by ASME
The flow resistance of the seams is related to the loss
factor k as
2
5.0A
kRseamsρ
= (2)
where ρ is air density and A is data center floor area. The seams can be considered as small openings for which the loss factor is given by [9]
28.2
fk = (3)
where f is the ratio of the seams area to the data center area. The above two equations can be combined to give
2/1
2
4.1
=
ARf
seams
ρ (4)
For the current data center, f turns out to be 0.0035; that is,
the distributed leakage area is 0.35% of the total floor area. This corresponds to a gap width of 0.045 inches or 1.1 mm. The current data center is about 20 years old and has undergone significant wear and tear. For a new data center with tightly installed floor, the leakage area is expected to be between 0.1% to 0.2% of the total floor area.
Generalized Results for the Distributed Leakage Flow
With the distributed leakage area known, we can now plot the results on Fig. 10 in terms of non-dimensional leakage flow rate and leakage area. The non-dimensional leakage flow rate is defined as the ratio of the leakage flow through the seams to the combined flow through the seams and other openings on the raised floor. The non-dimensional leakage area is defined as the ratio of the area of the seams to the combined area of the seams and other openings on the raised floor.
The resulting plot is shown in Fig. 11. (The minimum leakage area in the measurements is around 16%. The results below leakage area ratio of 16% were obtained using TileFlow. As discussed later, the results given by TileFlow are in good agreement with the measurements. Thus, it can be used with confidence to supplement the results from the measurements.) Although this curve covers leakage area ratios up to 50%, the area ratios in real-life data centers are typically between 5% and 20%. Figure 11 shows that in this range of area ratios, 5–15% of the cooling air is lost through the seams. Thus if there are 10 A/C units in a data center with leakage area of 10%, one unit is working just to supply the distributed leakage flow. Note that the leakage flow is not completely wasted. It contributes to the cooling of the equipment indirectly. However, it reduces the cooling air available at the inlets of the electronic equipment for direct cooling.
0
10
20
30
40
50
0 10 20 30 40 50Leakage Area %
Leak
age
Flow
%
Figure 11. Non-dimensional leakage flow as a function of non-dimensional leakage area. Results from the Computational Model
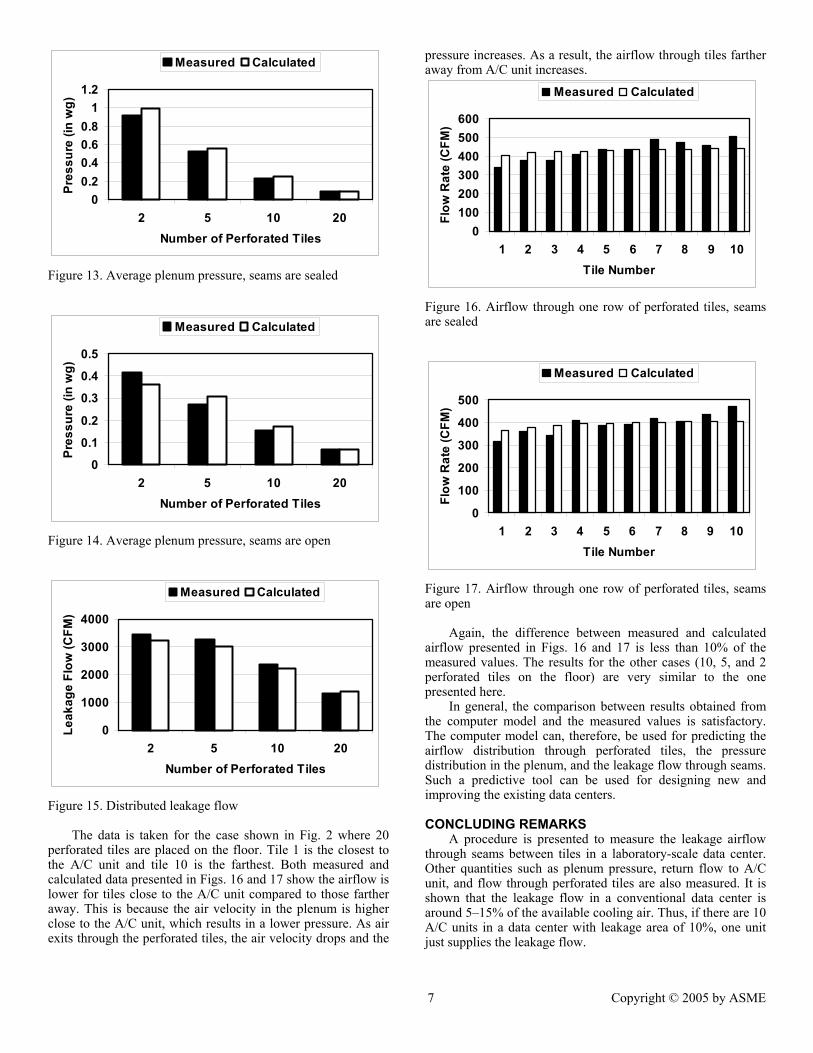
In the computer model, the A/C unit is modeled as an inflow boundary condition. The airflow rate is taken from the measured values of the return flow to the A/C unit. The perforated tiles are represented by Eq. (1) with R = 4.2×10⁻⁷. The perimeter leakage flow is also represented by Eq. (1) with R = 4.4×10⁻⁸. It is assumed that the leakage flow is uniform along the partitioned perimeter of the test area. The chilled water pipes in the plenum are modeled as cylindrical under-floor blockages. The leakage flow through seams is modeled as a uniformly distributed air leakage over all the exposed floor tiles. The distributed leakage area was taken as 0.35% of the total floor area. Figure 12 shows the modeled layout with 20 perforated tiles and under floor blockages.
Figure 12. Computer Model
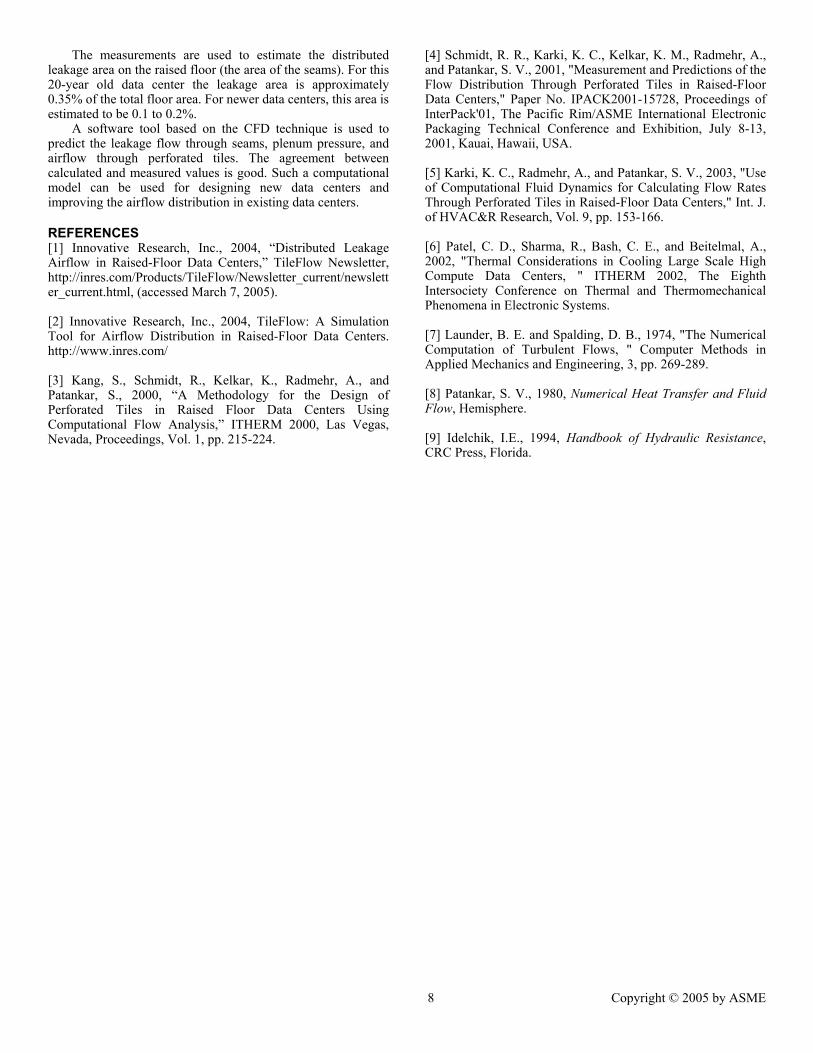
The comparison between the measured and calculated
average plenum pressures is shown in Figs. 13 and 14 for sealed and open seams cases respectively. Figure 15 shows the comparison between measured and calculated distributed leakage flows. In majority of cases, the difference between measured and calculated values is less than 10%.
Figures 16 and 17 show the comparison between measured and calculated airflow through perforated tiles for sealed and open seams cases respectively. Results are included for only one row of tiles. The level of agreement between the two sets of results is similar for the second row.
7 Copyright © 2005 by ASME
00.20.40.60.8
11.2
2 5 10 20Number of Perforated Tiles
Pres
sure
(in
wg)
Measured Calculated
Figure 13. Average plenum pressure, seams are sealed
0
0.1
0.2
0.3
0.4
0.5
2 5 10 20Number of Perforated Tiles
Pres
sure
(in
wg)
Measured Calculated
Figure 14. Average plenum pressure, seams are open
0
1000
2000
3000
4000
2 5 10 20Number of Perforated Tiles
Leak
age
Flow
(CFM
)
Measured Calculated
Figure 15. Distributed leakage flow
The data is taken for the case shown in Fig. 2 where 20 perforated tiles are placed on the floor. Tile 1 is the closest to the A/C unit and tile 10 is the farthest. Both measured and calculated data presented in Figs. 16 and 17 show the airflow is lower for tiles close to the A/C unit compared to those farther away. This is because the air velocity in the plenum is higher close to the A/C unit, which results in a lower pressure. As air exits through the perforated tiles, the air velocity drops and the
pressure increases. As a result, the airflow through tiles farther away from A/C unit increases.
0100200300400500600
1 2 3 4 5 6 7 8 9 10Tile Number
Flow
Rat
e (C
FM)
Measured Calculated
Figure 16. Airflow through one row of perforated tiles, seams are sealed
0
100
200
300
400
500
1 2 3 4 5 6 7 8 9 10Tile Number
Flow
Rat
e (C
FM)
Measured Calculated
Figure 17. Airflow through one row of perforated tiles, seams are open
Again, the difference between measured and calculated airflow presented in Figs. 16 and 17 is less than 10% of the measured values. The results for the other cases (10, 5, and 2 perforated tiles on the floor) are very similar to the one presented here.
In general, the comparison between results obtained from the computer model and the measured values is satisfactory. The computer model can, therefore, be used for predicting the airflow distribution through perforated tiles, the pressure distribution in the plenum, and the leakage flow through seams. Such a predictive tool can be used for designing new and improving the existing data centers. CONCLUDING REMARKS
A procedure is presented to measure the leakage airflow through seams between tiles in a laboratory-scale data center. Other quantities such as plenum pressure, return flow to A/C unit, and flow through perforated tiles are also measured. It is shown that the leakage flow in a conventional data center is around 5–15% of the available cooling air. Thus, if there are 10 A/C units in a data center with leakage area of 10%, one unit just supplies the leakage flow.
8 Copyright © 2005 by ASME
The measurements are used to estimate the distributed leakage area on the raised floor (the area of the seams). For this 20-year old data center the leakage area is approximately 0.35% of the total floor area. For newer data centers, this area is estimated to be 0.1 to 0.2%.
A software tool based on the CFD technique is used to predict the leakage flow through seams, plenum pressure, and airflow through perforated tiles. The agreement between calculated and measured values is good. Such a computational model can be used for designing new data centers and improving the airflow distribution in existing data centers.
REFERENCES [1] Innovative Research, Inc., 2004, “Distributed Leakage Airflow in Raised-Floor Data Centers,” TileFlow Newsletter, http://inres.com/Products/TileFlow/Newsletter_current/newsletter_current.html, (accessed March 7, 2005). [2] Innovative Research, Inc., 2004, TileFlow: A Simulation Tool for Airflow Distribution in Raised-Floor Data Centers. http://www.inres.com/ [3] Kang, S., Schmidt, R., Kelkar, K., Radmehr, A., and Patankar, S., 2000, “A Methodology for the Design of Perforated Tiles in Raised Floor Data Centers Using Computational Flow Analysis,” ITHERM 2000, Las Vegas, Nevada, Proceedings, Vol. 1, pp. 215-224.
[4] Schmidt, R. R., Karki, K. C., Kelkar, K. M., Radmehr, A., and Patankar, S. V., 2001, "Measurement and Predictions of the Flow Distribution Through Perforated Tiles in Raised-Floor Data Centers," Paper No. IPACK2001-15728, Proceedings of InterPack'01, The Pacific Rim/ASME International Electronic Packaging Technical Conference and Exhibition, July 8-13, 2001, Kauai, Hawaii, USA. [5] Karki, K. C., Radmehr, A., and Patankar, S. V., 2003, "Use of Computational Fluid Dynamics for Calculating Flow Rates Through Perforated Tiles in Raised-Floor Data Centers," Int. J. of HVAC&R Research, Vol. 9, pp. 153-166. [6] Patel, C. D., Sharma, R., Bash, C. E., and Beitelmal, A., 2002, "Thermal Considerations in Cooling Large Scale High Compute Data Centers, " ITHERM 2002, The Eighth Intersociety Conference on Thermal and Thermomechanical Phenomena in Electronic Systems. [7] Launder, B. E. and Spalding, D. B., 1974, "The Numerical Computation of Turbulent Flows, " Computer Methods in Applied Mechanics and Engineering, 3, pp. 269-289. [8] Patankar, S. V., 1980, Numerical Heat Transfer and Fluid Flow, Hemisphere. [9] Idelchik, I.E., 1994, Handbook of Hydraulic Resistance, CRC Press, Florida.