Embed Size (px)
Citation preview


NOTICE
This report was prepared as an account of work sponsored by an agency of the United States government. Neither the United States government nor any agency thereof, nor any of their employees, makes any warranty, express or implied, or assumes any legal liability or responsibility for the accuracy, completeness, or usefulness of any information, apparatus, product, or process disclosed, or represents that its use would not infringe privately owned rights. Reference herein to any specific commercial product, process, or service by trade name, trademark, manufacturer, or otherwise does not necessarily constitute or imply its endorsement, recommendation, or favoring by the United States government or any agency thereof. The views and opinions of authors expressed herein do not necessarily state or reflect those of the United States government or any agency thereof.
Available electronically at http://www.osti.gov/bridge
Available for a processing fee to U.S. Department of Energy and its contractors, in paper, from:
U.S. Department of Energy Office of Scientific and Technical Information P.O. Box 62 Oak Ridge, TN 37831-0062 phone: 865.576.8401 fax: 865.576.5728 email: mailto:[email protected]
Available for sale to the public, in paper, from: U.S. Department of Commerce National Technical Information Service 5285 Port Royal Road Springfield, VA 22161 phone: 800.553.6847 fax: 703.605.6900 email: [email protected] online ordering: http://www.ntis.gov/ordering.htm
This publication received minimal editorial review at NREL
Printed on paper containing at least 50% wastepaper, including 20% postconsumer waste
Table of Contents
1. Panel Summary Report .....................................................................................................................2
2. Background .......................................................................................................................................3
3. Panel Objective .................................................................................................................................3
4. Data Collection .................................................................................................................................3
5. Discussions with Industry.................................................................................................................5
6. Panel H2A Analysis..........................................................................................................................7
6.1 H2A Introduction ........................................................................................................................7 6.2 H2A Analyses Provided..............................................................................................................8 6.3 Panel Baseline H2A Analysis .....................................................................................................8 6.4 Sensitivity Analysis ..................................................................................................................10 6.5 Range of Costs ..........................................................................................................................13 6.6 Opportunities for Future Cost Reductions ................................................................................13
7. Conclusions.....................................................................................................................................14
Appendix A: Reviewer Biographies ...................................................................................................16
Page 1 of 16
1. Panel Summary Report May 31, 2006 From: Independent Review Panel, Cost of Distributed Production of Hydrogen from Natural Gas To: Dale A. Gardner, NREL, DOE Hydrogen Systems Integrator Subject: Independent Review Panel Report Per the tasks and criteria of the Independent Review Plan the following is our Independent Review Panel’s unanimous technical conclusion, arrived at from data collection, review/study, and deliberations over the period March-May, 2006. Conclusion Statement: The distributed hydrogen production Independent Review Panel has assessed the information available from NREL, DOE, and related industry efforts and has determined, through use of the H2A model, that the range in the total cost of producing hydrogen including a 10% internal rate of return (hereafter, total cost) is $2.75-$3.50 per kilogram. The “Distributed Hydrogen Production from Natural Gas -2005 Cost Goal” of $3.00 gge (or kg) is well within that range and thus adequate progress has been completed to meet the cost target.
Rationale for Conclusion: The Panel reviewed available information concerning the technologies needed for forecourts producing 1500 kg/day of hydrogen reformed from natural gas. The Panel conducted discussions with interested parties including government interests, a variety of vendors, and numerous utilities. As a result, and assuming 500 new forecourt stations per year, the Panel concluded the following:
- The hydrogen production technology presented is scaleable to 1500 kg/day through a combination of scaling-up of existing designs and the use of multiple units.
- The cost estimates provided by the Department of Energy and various vendors are realistic and in-line with the experience of the Panel.
- It is reasonable to conclude the technologies to produce hydrogen from natural gas (reforming, hydrogen clean-up, and compression, storage, and dispensing) will be mature and capable of licensing and certification resulting in short (≤3 month) installation times.
- The skid-mounted-system approach (sheet metal enclosed and fence protected following a universal set of codes and standards as opposed to specific designs and approvals for each site) is rational given that such a design could be standardized, licensed, and certified by all the appropriate agencies, following on the safety experience gained through hydrogen handling and storage in fuel cell vehicles.
- The consumption volume of the mature hydrogen fueling industry could result in near-industrial natural gas and industrial electricity prices for most new forecourts.
The Panel utilized existing DOE developed H2A analyses as a starting point for the assessment. The above conclusions, Panel experience, and the input from various parties were used to evaluate, adjust, and develop the Panel-defined baseline H2A analysis. The baseline analysis, which utilized industrial rates for natural gas and electricity, resulted in a hydrogen total cost of $3.00 per kilogram. Sensitivity studies were performed to fully understand the impact of essential parameters on the hydrogen cost. Forecourt capacity, hydrogen storage costs, and natural gas costs, specifically whether industrial or commercial rates were applicable, were the key contributors to the cost uncertainty. The Panel evaluated the various parameters and the associated uncertainties and projects a hydrogen total cost range of $2.75-3.50 per kilogram.
Dr. James Fletcher Mr. Vincent Callaghan PE
Page 2 of 16

2. Background The mission of the Department of Energy (DOE) Hydrogen Program is to research, develop, and validate fuel cell and hydrogen production, delivery, and storage technologies. Hydrogen from diverse domestic resources will then be used in a clean, safe, reliable, and affordable manner in fuel cell vehicles and stationary power applications. The President's Hydrogen Fuel Initiative accelerates research, development, and demonstration of hydrogen production, delivery, storage, and fuel cell technologies to enable technology readiness by 2015 and subsequent commercialization by industry. Distributed production may be the most viable approach for introducing hydrogen as an energy carrier. It requires less capital investment for the smaller volume of hydrogen needed initially, and it does not require a substantial hydrogen transport and delivery infrastructure. The DOE measures progress against the research and development technical targets it established in conjunction with its industry partners. In addition, independent verifications of progress for many of the key technical targets are commissioned by the DOE. The DOE has assigned the National Renewable Energy Laboratory’s (NREL’s) Systems Integration Office to coordinate an Independent Review Panel to examine the progress toward the research and development technical target called "Distributed Hydrogen Production from Natural Gas - 2005 Cost.” This report provides the results of the Independent Review Panel’s examination of the progress toward the 2005 total cost of hydrogen derived from natural gas at distributed facilities. 3. Panel Objective
The Independent Review Panel’s objective is to assess progress toward the 2005 Program Technical Target “production of $3/gallon of gasoline equivalent (gge) using distributed natural gas reforming.” The Independent Review Panel collected and analyzed the available data and utilized the Hydrogen Analysis (H2A) model to predict the total cost of delivered hydrogen with the assumption of 500 new forecourt stations installed per year. The Panel defined the total cost as that which includes all costs associated with producing the hydrogen and a 10% discounted rate of return. 4. Data Collection
The data available to the Independent Review Panel included DOE and NREL documents, briefings, presentations, and reports. In addition, the Panel conducted interviews with the following groups: government personnel; vendors associated with hydrogen production, compression, and storage technologies; natural gas supply groups; and utility companies. Presentations addressing technical approaches and total cost were provided by the vendors that have DOE-sponsored programs, and Table 1 provides a high level summary of those hydrogen generation approaches and status. As shown in Table 1, a number of small units producing typically less than 100 kg of H2/day, have been constructed and tested or are in the process of being developed and built. The existing experience base provides a good foundation for projecting costs, especially in the areas of hydrogen production and gas clean-up.
Page 3 of 16

Table 1: High Level Summary of Hydrogen Production Technology and Prototypes.
Company System Status
H2 Gen Innovations
Steam Methane Reformer (SMR) Pressure Swing Absorption (PSA)
M-2000 in commercial service
Optimize HGM 2000 Proceed with HGM 10000 Extrapolate to HGM 26450
(1500 kg/day)
Air Products
SMR Air Products PSA
Compressor Dispenser
Penn State system; 6 month
validation ongoing
Chevron Technology
Ventures (CTV)
Chino - Natural gas fired autothermal reformer + PSA, compressor, multi bank compressed gas storage and dispenser
AC Transit – 2 steam methane reforming
units + PSA,
Both Chino and AC Transit stations in normal daily use
Three further stations in construction; 2 steam
reformer based (Orlando, FL; Selfridge, MI), 1 electrolyzer (Rosemead, CA). All to be in
operation by early 2007
compressors, multi bank compressed gas storage and
dispensers H2 production only PRAXAIR
DMI Lockport
and Boothroid-Dewhurst
Low-cost H2 Production Platform (LCHPP) SMR Detailed design and
optimization complete mid 2006
Shift PSA
Prototype mid 2007
GE Global Research
U of Minn and
ANL for catalyst
Staged Catalytic Partial Oxidizer (SCPO) (PO into SMR)
Shift PSA
Compressor
Planned three year project
GTI
SMR Shift PSA
Cascade Storage Dispensing Optimization Dispensing
Technology development 2002-2006
Regional demonstration 2005-2008
System infrastructure deployment, refinement
2007-2010
NUVERA
SMR Shift
Alfa prototype Q3 2006 - Beta prototypes Q1 2007
Commercial launch Q2 2007 - East Penn manufacturing
site
Compressor PSA H Pac Compressor Storage
Dispensing
PRAXAIR
LAX H2 fueling station Electrolysis 24 kg/day Compressor, Storage, Dispensing Future, replace electrolyzer
with LCHPP
GE Global Research
GE Autothermal-cyclic-reformer (ACR) GE Shift
PSA (Praxair) Compressor (Hydro-Pac),
Storage, Dispenser (Fueling Technologies) 60 kg/day
Operated at U of C Irvine
Page 4 of 16

5. Discussions with Industry A number of interviews were conducted with a variety of sources including DOE personnel, vendors that primarily supply hydrogen generation and forecourt equipment, natural gas suppliers, utilities, and others. Typically, a wide range of views were obtained regarding each subject. The subjects addressed and the information gathered are summarized below. Multiple units vs. scale-up Many of the prototype units developed to date have been on the scale of 100 kg of H2 per day or smaller. To achieve the DOE target of 1500 kg/day there are diverse opinions regarding the approach to scale-up. Some vendors indicated that a modified design may be required to accommodate the 1500 kg/day from a single fuel processor. Other vendors indicated that a certain amount of scale-up is possible with existing designs. However there are boundaries based on the structural capabilities (thermal and pressure induced loads) of the weldments inside the fuel processor. There may be an optimum mix between modifying existing designs and the use of multiple smaller units to achieve the capacity of 1500 kg/day. During the vendor discussions it was noted that the performance efficiencies associated with fuel processing are normally due to catalyst activity and the ability to move heat within the fuel processing unit. Fortunately the characteristics that can improve performance can also support lower cost components. For example, as the reformer approaches a catalyzed wall reactor, the physical unit size and amount of catalyst can decrease. Catalyst Selection Interviews with vendors indicated that multiple types of catalysts are being utilized. While the move towards non-noble catalysts (e.g., nickel catalysts) may help with the cost picture for the reformers, it is encouraging that even those units that utilize noble metal catalyst have fairly attractive cost parameters. This attractiveness is in part due to the fact that processes using noble metal catalysts require less complex and costly balance-of-plant equipment than those that use non-noble catalysts. Non-noble catalysts require the additional balance-of-plant equipment to prevent formation of undesired compounds like nickel carbonyl.
BOC /MRT /HERA
Fluidized Bed Reactor with Integrated Membrane
Hydride Compression System
MRT (membrane reactor technology) HERA (hydride compression system)
50 kg/day
Proof of concept Mar 2006 to Jan 2007
Advanced prototype Jan 2007 to Mar 2008
Commercial concept Apr 2008 to Jun 2008
Valencia, CA and MISSISSAUGA, Ontario
Electrolysis
Hydrogenics USA Not available
Future at Chevron AC transit fueling station Harvest Energy
Technology
SMR Low and high pressure Air Products Penn State
3 more deliveries mid 2006
Velocys SMR
Large microchannel reactors focused on large-scale
applications (5 - 30 MMSCFD)
Page 5 of 16
Compressor performance experience A major portion of the capital cost in the hydrogen fueling station is associated with compression, storage, and dispensing so optimization of this area is important. Cascade storage systems offer the opportunity to optimize the fill process by utilizing low pressure hydrogen at the beginning of a fill sequence followed by sequentially higher pressure so that H2 compression work/cost is minimized. Additional effort is underway to optimize the storage systems to minimize compression cost including optimizing the cascades for both vehicle and multistage compressor interfaces. Compressor durability Discussions related to the durability and trouble-free operation of compressors indicated a wide range of experiences. In general the feedback on compressor durability was positive. However, in some cases, compressors required frequent maintenance. Others reported that the compressors most likely will require redesign to accommodate the higher pressures anticipated for future storage. Those familiar with the natural gas industry compressors indicated they are mature components and perform well and noted that the higher pressures typical of hydrogen compression would likely require compressor modifications. Skid-mounted system vs. industrial plant There are a wide range of views on the approach to safety in the forecourt installation. A number of vendors envisioned that their product will be similar to an appliance; that is, it would be standardized, licensed, and certified by all the appropriate agencies. Others indicated that an industrial approach is required for the forecourt installations. As would be expected, if the industrial approach is followed increased capital cost are incurred as well as almost prohibitive site preparation costs. Others suggested that while the industry is in a learning phase, the industrial approach is appropriate with a gradual move to the skid-mounted-system approach as operating experience warrants. Cost parameter sensitivity Extensive discussions concerning cost sensitivity indicated the two critical parameters for reaching the 1500 kg of H2/day target were the natural gas cost and the capacity factor. Many other parameters, such as compressor efficiency, are approaching thermodynamic limits on efficiency. H2A salvage and decommissioning The Panel notes that the H2A analyses used does not include salvage and decommissioning costs. Considerable resources are allocated to maintaining and refurbishing these installations so they meet all performance, licensing, certification, and permitting requirements—and thus many will have lifetimes in excess of the 20 year default assumption. Availability for active components It is expected that the hydrogen fueling stations will be available more than 98% of the time, which is reasonable for the fuel processing passive components such as a reformer and shift converter and PSA unit. However active components such as pumps, valves, and compressors are more likely to have lower availability. Interviews with the various vendors indicated several viable approaches to this issue. The first approach is to provide redundancy for active components. The second approach is to provide online monitoring with predictive capability for maintenance and/or change out of key components coupled with the spare part availability and quick responding service teams. Storage costs Compressed gas storage is presently expensive. Discussions with the various vendors and the FreedomCAR and Fuel Partnership Hydrogen Production Technical Team indicated that the forged steel tanks used for stationary storage are provided by a single vendor. It is envisioned that the increased
Page 6 of 16
production of the tanks and the opportunity for competition amongst tank vendors should lower tank costs. It was also noted that with experience the tank safety factor, typically 3 or 4, may be reduced with attendant cost savings. In addition, substantial efforts are underway to lower the cost of the carbon filament wound tanks. System turndown capability versus storage capacity Several vendors indicated that improved turndown capability for the fuel processor would mitigate the high cost of hydrogen storage. The resulting lower storage cost, however, is in part offset by the increased cost of the production hardware (reformer and balance-of-plant). Future trade-off studies are required as production costs and storage costs are minimized and the fueling duty cycle is optimized. Industrial vs. commercial methane costs Discussions with the hydrogen production vendors, gas industry representatives, and utilities indicated a wide range of views regarding the applicability of industrial natural gas and electricity costs for forecourt stations. In general, it was believed that as multiple stations in an area are installed (increasing the volume of natural gas consumed), near-industrial costs are feasible. Odorants and peak shave in natural gas Discussions with the various vendors regarding how to handle odorants and peak shave gas indicated that most have already accommodated the sulfur compounds associated with odorants. It was noted that the widespread production and dispensing of hydrogen derived from natural gas will most likely involve a partnership between the natural gas supply and the hydrogen supply vendors which will include a shared responsibility for the quality of the gas supplied to the forecourt facility. Therefore this subject is viewed by many as an opportunity to reduce future costs. 6. Panel H2A Analysis
6.1 H2A Introduction1
Realistic economic- and technology-based assumptions are critical to an accurate analytical study. DOE's H2A Analysis Group was organized to develop the building blocks and frameworks needed to conduct rigorous and consistent analysis of a wide range of hydrogen technologies and the transition to a hydrogen economy. Established in FY 2003, H2A brings together the analysis expertise in the hydrogen community, drawing from industry, academia, and the national laboratories. The foundation of H2A is to improve the transparency and consistency of analysis, improve the understanding of the differences among analyses, and seek better validation of analysis studies by industry. H2A, which stands for Hydrogen Analysis, is also the name of a Microsoft Excel-based tool developed by the group to “establish a consistent set of financial parameters and methodology for analyses” related to the production and delivery of hydrogen fuel within the envisioned hydrogen economy. H2A allows a direct economic comparison of different technologies with a goal of providing transparency and consistency. The model is available through the DOE Hydrogen Program website at http://www.hydrogen.energy.gov/h2a_analysis.html. There is a well-defined set of default parameters, with further information provided within a series of users’ guides, such as the “H2A Forecourt Hydrogen Production Model Users Guide.” The H2A tool can model large, central production plants (>50,000 kg/day) as well as forecourt hydrogen production (100-1500 kg/day). The results include the total cost per kilogram of hydrogen
1 Information in this section is summarized from DOE websites discussing the H2A analysis tool.
Page 7 of 16

(approximately a gallon of gasoline equivalent or gge) as well as detailed category breakdown of cost contributors.
6.2 H2A Analyses Provided The DOE provided the following two H2A analyses:
• h2a_forecourt_smr_1500kgperday_current_final_2015 EIA High A1 • h2a_forecourt_smr_100kgperday_current_final_2015 EIA High A1
The values provided with the 1500 kg/day model were used as a starting point for the Panel’s analysis, specifically for sensitivity analysis to identify the areas with the largest impact on the total cost of delivered hydrogen. Many of the contractors provided 1500 kg/day H2A analysis for their technologies. The resulting hydrogen total cost varied by $0.80 per kilogram. The total cost predicted by the DOE inputs fell in the middle of the range. It should be noted that the values provided often represented a scale-up of costs associated with approximately 100 kg/day units. As well, some of the H2A analyses focused on the reforming step and used default values for all other parameters (e.g., compression, storage, and dispensing). Industry H2A analyses were also presented for approximately 100 kg/day forecourts, with total costs varying by over $3.00 per kilogram. The primary reason for the wide range of total costs is related to the envisioned use, specifically in the expected capacity factor.2 The H2A default is 70% capacity, while many of the smaller units are expected to operate more continuously resulting in capacity factors as high as 90%. Typically, the hydrogen total cost for 100 kg/day forecourt was always higher than for 1500 kg/day forecourt as expected, although the difference was mitigated with the assumption of increased capacity.
6.3 Panel Baseline H2A Analysis The analysis presented in this report focuses on 1500 kg/day forecourt production of hydrogen from reforming of natural gas, although information provided for 100 kg/day forecourt production is also discussed. For the Panel baseline analysis, the H2A default assumptions and hardware cost projections (critical parameters are listed in Table 2) provided within the analysis entitled “h2a_forecourt_smr_1500kgperday_current_final_2015 EIA High A1,” were used with the following exceptions:
• Start-up Time (years): The default value is one year. For high capital investment projects, a delay of one year has significant impact on total costs. Although up-front tasks, such as permitting, can be time consuming, all would be accomplished before large capital investments. Gas stations are typically built in less than 3-6 months. In addition, once 500 units a year are achieved, the potential for skid-mounting the hardware will likely reduce the start-up time further. As a result, a default 3-month start-up time is assumed.
• % of Variable Operating Costs During Start-up (%): The variable operating costs are primarily
the feedstock fuel costs and the utility costs. If revenues during the start-up period are 50% (H2A default assumption), we would expect that the percent of variable cost would be less than the
2 The capacity factor default value of 70% attempts to account for daily variations in consumption, including weekday to weekend, as well as seasonal variations (summer to winter). In addition, the effect of maintenance shutdowns and inclement weather days must also be accounted for.
Page 8 of 16

100% default assumption. As a result, the default value used in this analysis is 50%, equal to the percent of revenues during start-up.
• % of Fixed Operating Costs During Start-up (%): The fixed costs include rent and taxes, but also costs associated with dispensing labor and hardware maintenance. Thus the actual percent of fixed costs is expected to be less than the H2A default assumption of 100%. A default value of 75% was assumed.
It should be noted that the three exceptions to the default assumptions detailed above resulted in a $0.15-$0.17 reduction in the cost of delivered hydrogen per kilogram. Table 2 provides a range of the key H2A parameters encompassing the Panel-defined baseline and the range provided by vendor responses. Most of the values presented are for 1500 kg/day stations; those with two values have notes distinguishing which are for 1500 kg/day stations and which are for 100 kg/day stations.
Table 2: Range of Key H2A Input Parameters Encompassing Vendor Responses and Baseline Values.
H2A Parameter Minimum Vendor Provided Value Baseline Value
Maximum Vendor
Provided Value
Total System Efficiency (%) 60.2/67.91 64.1 68.7
Operating Capacity Factor (%) 70 70 70/902
Start-up time (years) .083/13 0.254 1
Total Production Initial Capital Investment (Depreciable) ($) $1,111,000 $1,289,726 $1,373,869
Total Compression/Storage/Dispensing Initial Capital Investment (Depreciable) ($) $1,520,085 $1,520,085 $1,748,098
Total Depreciable Capital Costs ($) $2,844,843 $3,225,136 $3,568,508
Total Fixed O&M Costs ($/year) $151,706 $218,798 $287,841
Total Variable Production Costs ($/year)5 $422,747 $454,952 $434,223
Total Replacement Costs for 20 yr period ($) $576,000 $1,722,109 $2,004,0591 The value of 60.2% was the minimum vendor provided value for a 100 kg/day unit, while 67.9% was the minimum vendor
provided value for a 1500 kg/day station. 2 All 1500 kg/day units reported the capacity factor of 70%. The maximum value of 90% was reported for a 100 kg/day unit. 3 All 1500 kg/day units reported a start-up time of one year. The minimum value of 0.083 years (1 month) was reported for a
100 kg/day unit. 4 DOE default value is 1 year. 5 The values presented are for 1500 kg/day units beginning operation in 2015. In addition, given the assumption of 500 new forecourts per year, the Panel assumed near-industrial natural gas and industrial electricity costs were feasible and an appropriate selection for the baseline analysis. Table 3 provides a detailed breakdown for the cost contributors for the Panel baseline case.
Page 9 of 16
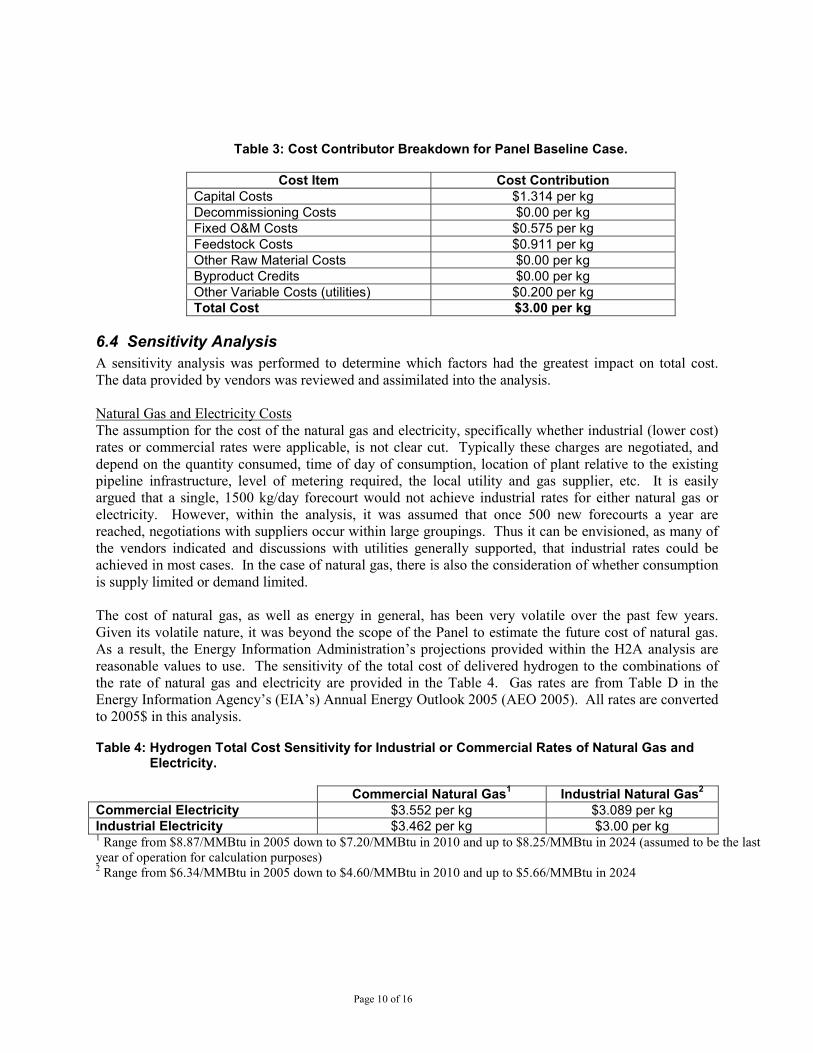
Table 3: Cost Contributor Breakdown for Panel Baseline Case.
Cost Item Cost Contribution Capital Costs $1.314 per kg Decommissioning Costs $0.00 per kg Fixed O&M Costs $0.575 per kg Feedstock Costs $0.911 per kg Other Raw Material Costs $0.00 per kg Byproduct Credits $0.00 per kg Other Variable Costs (utilities) $0.200 per kg Total Cost $3.00 per kg
6.4 Sensitivity Analysis A sensitivity analysis was performed to determine which factors had the greatest impact on total cost. The data provided by vendors was reviewed and assimilated into the analysis. Natural Gas and Electricity Costs The assumption for the cost of the natural gas and electricity, specifically whether industrial (lower cost) rates or commercial rates were applicable, is not clear cut. Typically these charges are negotiated, and depend on the quantity consumed, time of day of consumption, location of plant relative to the existing pipeline infrastructure, level of metering required, the local utility and gas supplier, etc. It is easily argued that a single, 1500 kg/day forecourt would not achieve industrial rates for either natural gas or electricity. However, within the analysis, it was assumed that once 500 new forecourts a year are reached, negotiations with suppliers occur within large groupings. Thus it can be envisioned, as many of the vendors indicated and discussions with utilities generally supported, that industrial rates could be achieved in most cases. In the case of natural gas, there is also the consideration of whether consumption is supply limited or demand limited. The cost of natural gas, as well as energy in general, has been very volatile over the past few years. Given its volatile nature, it was beyond the scope of the Panel to estimate the future cost of natural gas. As a result, the Energy Information Administration’s projections provided within the H2A analysis are reasonable values to use. The sensitivity of the total cost of delivered hydrogen to the combinations of the rate of natural gas and electricity are provided in the Table 4. Gas rates are from Table D in the Energy Information Agency’s (EIA’s) Annual Energy Outlook 2005 (AEO 2005). All rates are converted to 2005$ in this analysis. Table 4: Hydrogen Total Cost Sensitivity for Industrial or Commercial Rates of Natural Gas and
Electricity.
Commercial Natural Gas1 Industrial Natural Gas2 Commercial Electricity $3.552 per kg $3.089 per kg Industrial Electricity $3.462 per kg $3.00 per kg 1 Range from $8.87/MMBtu in 2005 down to $7.20/MMBtu in 2010 and up to $8.25/MMBtu in 2024 (assumed to be the last year of operation for calculation purposes) 2 Range from $6.34/MMBtu in 2005 down to $4.60/MMBtu in 2010 and up to $5.66/MMBtu in 2024
Page 10 of 16
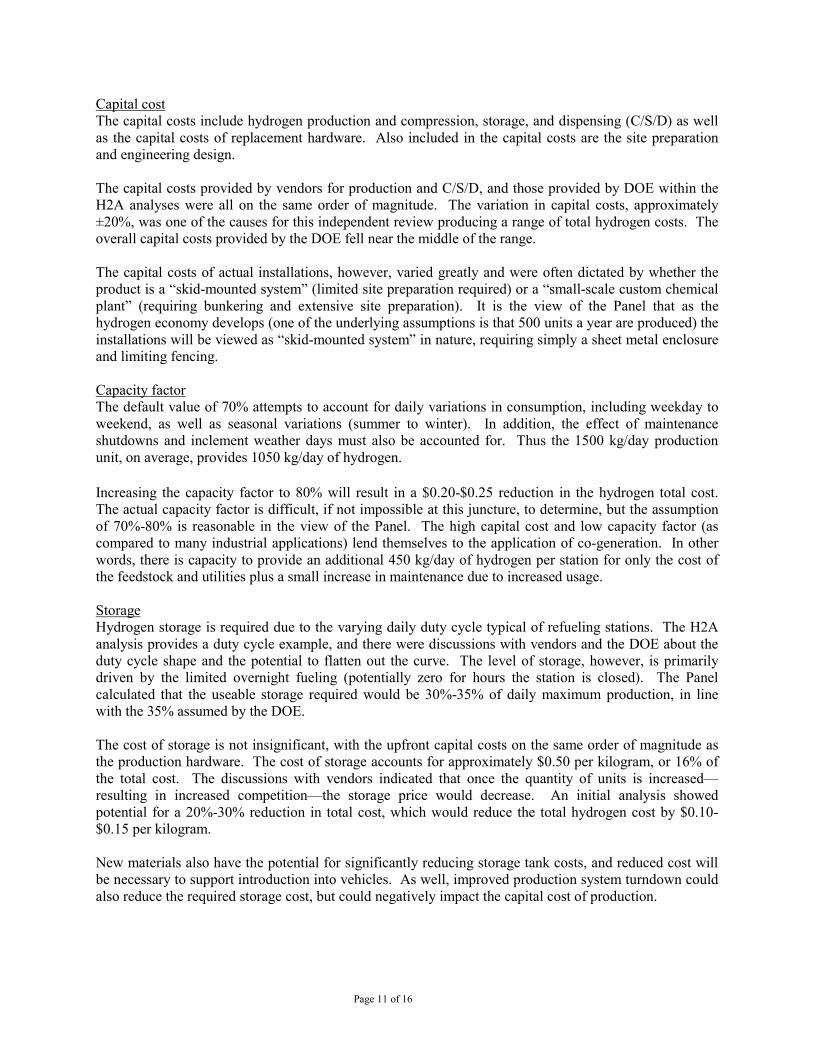
Capital cost The capital costs include hydrogen production and compression, storage, and dispensing (C/S/D) as well as the capital costs of replacement hardware. Also included in the capital costs are the site preparation and engineering design. The capital costs provided by vendors for production and C/S/D, and those provided by DOE within the H2A analyses were all on the same order of magnitude. The variation in capital costs, approximately ±20%, was one of the causes for this independent review producing a range of total hydrogen costs. The overall capital costs provided by the DOE fell near the middle of the range. The capital costs of actual installations, however, varied greatly and were often dictated by whether the product is a “skid-mounted system” (limited site preparation required) or a “small-scale custom chemical plant” (requiring bunkering and extensive site preparation). It is the view of the Panel that as the hydrogen economy develops (one of the underlying assumptions is that 500 units a year are produced) the installations will be viewed as “skid-mounted system” in nature, requiring simply a sheet metal enclosure and limiting fencing. Capacity factor The default value of 70% attempts to account for daily variations in consumption, including weekday to weekend, as well as seasonal variations (summer to winter). In addition, the effect of maintenance shutdowns and inclement weather days must also be accounted for. Thus the 1500 kg/day production unit, on average, provides 1050 kg/day of hydrogen. Increasing the capacity factor to 80% will result in a $0.20-$0.25 reduction in the hydrogen total cost. The actual capacity factor is difficult, if not impossible at this juncture, to determine, but the assumption of 70%-80% is reasonable in the view of the Panel. The high capital cost and low capacity factor (as compared to many industrial applications) lend themselves to the application of co-generation. In other words, there is capacity to provide an additional 450 kg/day of hydrogen per station for only the cost of the feedstock and utilities plus a small increase in maintenance due to increased usage. Storage Hydrogen storage is required due to the varying daily duty cycle typical of refueling stations. The H2A analysis provides a duty cycle example, and there were discussions with vendors and the DOE about the duty cycle shape and the potential to flatten out the curve. The level of storage, however, is primarily driven by the limited overnight fueling (potentially zero for hours the station is closed). The Panel calculated that the useable storage required would be 30%-35% of daily maximum production, in line with the 35% assumed by the DOE. The cost of storage is not insignificant, with the upfront capital costs on the same order of magnitude as the production hardware. The cost of storage accounts for approximately $0.50 per kilogram, or 16% of the total cost. The discussions with vendors indicated that once the quantity of units is increased—resulting in increased competition—the storage price would decrease. An initial analysis showed potential for a 20%-30% reduction in total cost, which would reduce the total hydrogen cost by $0.10-$0.15 per kilogram. New materials also have the potential for significantly reducing storage tank costs, and reduced cost will be necessary to support introduction into vehicles. As well, improved production system turndown could also reduce the required storage cost, but could negatively impact the capital cost of production.
Page 11 of 16

Fixed O&M The cost associated with fixed operation and maintenance (O&M) includes land rent, dispensing labor hours, taxes and insurances, and recurring maintenance. The default maintenance values were the following:
• 5% of production capital investment • 3% of compression capital investment • 1% of storage capital investment • $800 per dispenser
Overall, the fixed O&M costs were on the order of $200,000-$300,000 per year with maintenance accounting for 25%-40% of the value. The Panel believed these values were realistic, especially given that the overall unit is continually maintained to meet all codes and requirements. Therefore, the cost of maintenance is approximately $0.25 per kilogram. Some vendors believed the costs of maintaining the production unit would be high, especially given replacement costs associated with catalysts and the production unit in year 11. Other vendors indicated maintenance for some sub-systems, specifically the compressor, would be much higher. A ±25% change in maintenance costs, or approximately $20,000-$25,000 per year, changes the price of hydrogen by ±$0.06 per kilogram. Feedstock costs Beyond the cost of the feedstock natural gas discussed above, the overall system efficiency affects the quantity of feedstock required to deliver the average 1050 kg/day. The overall system efficiency is compiled from the production efficiency, the clean-up efficiency, and the compression/storage/delivery efficiency. The overall efficiency assumed by the DOE is 64.1% (LHV H2 out/total energy input) which is in agreement with the experience of the Panel. A few of the vendors indicated slightly better performance. Increasing the overall system efficiency to 67.5% (a 5% relative improvement), lowers the total cost of hydrogen by $0.06 per kilogram. Replacement Costs The default replacement costs for a 20 year lifetime in the H2A model are shown in Table 5. The replacement of minor components (sensors, valves, etc.) is included in the yearly O&M costs.
Table 5: H2A Baseline Replacement Costs
Time Frame Cost Description Year 6 $175,872
Assumes 15% of production unit cost for catalyst/reactor replacement
Year 11 $1,370,366 Assumes complete replacement of the reformer production unit and dispenser unit plus installation factor
Year 16 $175,872 Assumes 15% of production unit cost for catalyst/reactor replacement
The cost of replacing components through the 20-year lifetime of the unit is somewhat unknown. Certain component or subsystem lifetimes are better known, such as the catalyst lifetime, and thus replacement can be well estimated. Other subsystem lifetimes, including compressor lifetimes, are less well known given the required pressures and potential for transient flow rates. For example, if the compressor required a complete change in year 11 (half the required lifetime) it would increase the hydrogen total cost by $0.04 per kilogram.
Page 12 of 16
Replacement of components and subsystems will also be driven by development of improved technologies; thus replacement may be based on life cycle cost and not by end of useful life.
6.5 Range of Costs As described above, the cost of the natural gas is the significant cost driver in the sensitivity analysis. The baseline for analysis is defined as industrial natural gas and industrial electricity, resulting in $3.00 per kilogram of hydrogen. Table 6 details potential total cost range of various factors.
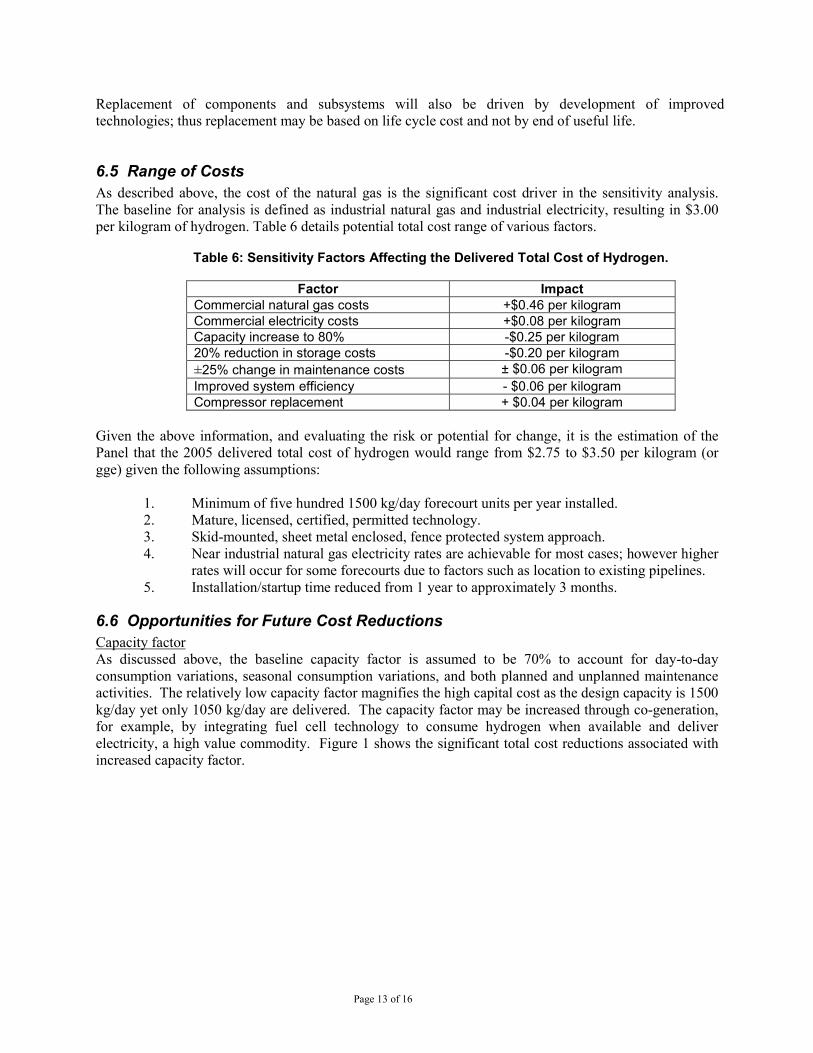
Table 6: Sensitivity Factors Affecting the Delivered Total Cost of Hydrogen.
Factor Impact Commercial natural gas costs +$0.46 per kilogram Commercial electricity costs +$0.08 per kilogram Capacity increase to 80% -$0.25 per kilogram 20% reduction in storage costs -$0.20 per kilogram ±25% change in maintenance costs ± $0.06 per kilogram Improved system efficiency - $0.06 per kilogram Compressor replacement + $0.04 per kilogram
Given the above information, and evaluating the risk or potential for change, it is the estimation of the Panel that the 2005 delivered total cost of hydrogen would range from $2.75 to $3.50 per kilogram (or gge) given the following assumptions:
1. Minimum of five hundred 1500 kg/day forecourt units per year installed. 2. Mature, licensed, certified, permitted technology. 3. Skid-mounted, sheet metal enclosed, fence protected system approach. 4. Near industrial natural gas electricity rates are achievable for most cases; however higher
rates will occur for some forecourts due to factors such as location to existing pipelines. 5. Installation/startup time reduced from 1 year to approximately 3 months.
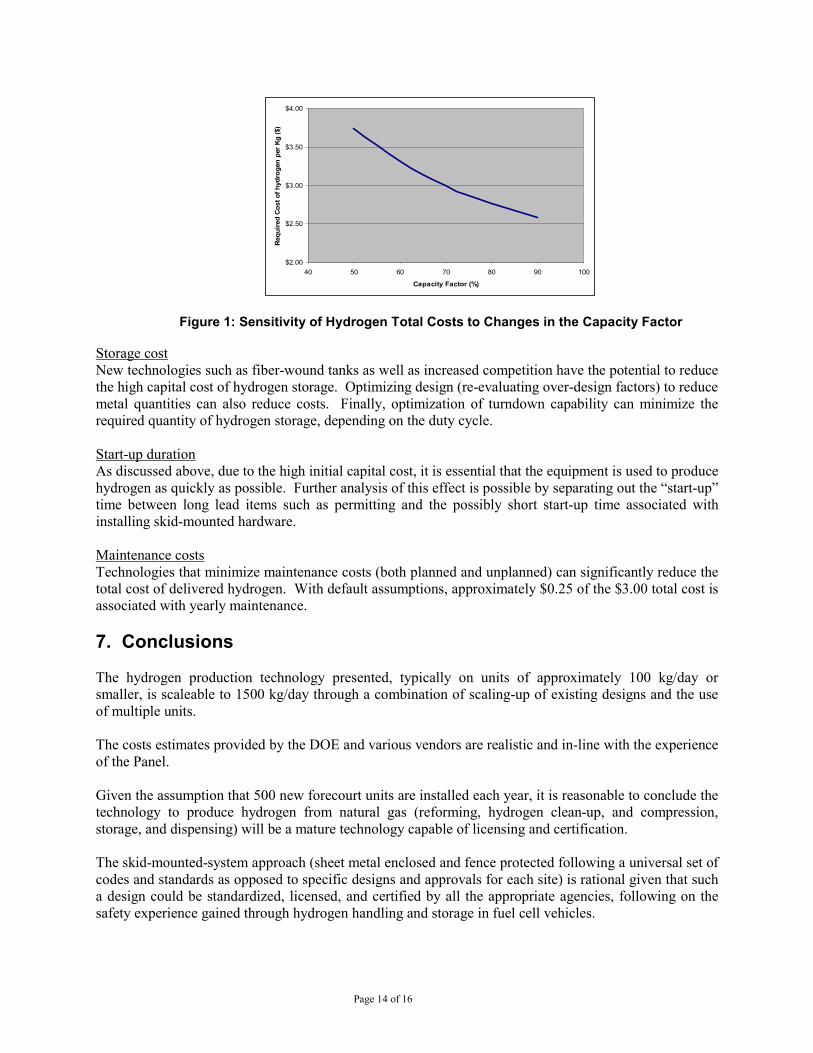
6.6 Opportunities for Future Cost Reductions Capacity factor As discussed above, the baseline capacity factor is assumed to be 70% to account for day-to-day consumption variations, seasonal consumption variations, and both planned and unplanned maintenance activities. The relatively low capacity factor magnifies the high capital cost as the design capacity is 1500 kg/day yet only 1050 kg/day are delivered. The capacity factor may be increased through co-generation, for example, by integrating fuel cell technology to consume hydrogen when available and deliver electricity, a high value commodity. Figure 1 shows the significant total cost reductions associated with increased capacity factor.
Page 13 of 16
$2.00
$2.50
$3.00
$3.50
$4.00
40 50 60 70 80 90 100
Capacity Factor (%)Re
quire
d Co
st o
f hyd
roge
n pe
r Kg
($)
Figure 1: Sensitivity of Hydrogen Total Costs to Changes in the Capacity Factor Storage cost New technologies such as fiber-wound tanks as well as increased competition have the potential to reduce the high capital cost of hydrogen storage. Optimizing design (re-evaluating over-design factors) to reduce metal quantities can also reduce costs. Finally, optimization of turndown capability can minimize the required quantity of hydrogen storage, depending on the duty cycle. Start-up duration As discussed above, due to the high initial capital cost, it is essential that the equipment is used to produce hydrogen as quickly as possible. Further analysis of this effect is possible by separating out the “start-up” time between long lead items such as permitting and the possibly short start-up time associated with installing skid-mounted hardware. Maintenance costs Technologies that minimize maintenance costs (both planned and unplanned) can significantly reduce the total cost of delivered hydrogen. With default assumptions, approximately $0.25 of the $3.00 total cost is associated with yearly maintenance. 7. Conclusions The hydrogen production technology presented, typically on units of approximately 100 kg/day or smaller, is scaleable to 1500 kg/day through a combination of scaling-up of existing designs and the use of multiple units. The costs estimates provided by the DOE and various vendors are realistic and in-line with the experience of the Panel. Given the assumption that 500 new forecourt units are installed each year, it is reasonable to conclude the technology to produce hydrogen from natural gas (reforming, hydrogen clean-up, and compression, storage, and dispensing) will be a mature technology capable of licensing and certification. The skid-mounted-system approach (sheet metal enclosed and fence protected following a universal set of codes and standards as opposed to specific designs and approvals for each site) is rational given that such a design could be standardized, licensed, and certified by all the appropriate agencies, following on the safety experience gained through hydrogen handling and storage in fuel cell vehicles.
Page 14 of 16

Once 500 new forecourts a year are installed, the consumption volume of the hydrogen fueling industry could result in near-industrial natural gas and industrial electricity prices for most new forecourts. The Panel has evaluated, through use of the H2A model, the hydrogen total cost range to be $2.75-$3.50 per kilogram. The 2005 total cost target of $3.00/gge for delivered hydrogen produced via natural gas reforming in the forecourt is well within the estimated range. Thus it is belief of the Independent Review Panel that with the information available, under the assumption of 500 new forecourts per year, that adequate progress has been completed to meet the total cost target.
Page 15 of 16

Appendix A: Reviewer Biographies Dr. James Fletcher Dr. Fletcher has worked in the clean energy field for the past 15 years. His graduate studies at the University of Florida included modeling, analysis, and testing of methanol-fueled Phosphoric Acid fuel cell engines and PEM fuel cell engines utilized in the DOE/DOT Fuel Cell Bus programs. As Department Head of Systems Engineering at XCELLSiS he was chief design engineer for limited-production hydrogen-PEM fuel cell engines presently used by DaimlerChrysler and Ford Motor Company as well as prototype hydrogen-PEM fuel cell engines utilized by most major automotive companies. In addition, he worked for UTC Fuel Cells as lead systems engineer on the Next Generation Bus Project. As Director of Clean and Renewable Energy Laboratory at the University of North Florida he is currently involved in a variety of clean energy and alternative fuels research. Dr. Fletcher has participated on various government panels including the DOE “Go/NoGo” Panel for “On-board Fuel Processing” and the National Academies of Science Panel to evaluate the “Benefits of Fuel Cell R&D”. Mr. Vincent Callaghan Mr. Callaghan provides technology services for the power industry. After 18 years in the nuclear power industry working for Westinghouse and Combustion Engineering and 18 years in the fuel cell industry working for United Technologies Corporation, UTC, Mr. Callaghan began his technology consulting activities. He currently supports Westinghouse on nuclear power industry engineering efforts and provides support for the Georgetown University fuel cell bus programs. Mr. Callaghan has a wide range of experience in engineering for power plant systems and component design and analysis, manufacturing and operations. He was the UTC Engineering and Program Manager for the all new 100 kW fuel cell power plant, compact light weight methane or methanol to H2 fuel processor and lightweight transient capable phosphoric acid fuel cell stack, that power the first Georgetown University full size transit bus. Mr. Callaghan graduated from the University of Detroit in 1967, BSME. He holds technology patents for both the nuclear and fuel cell industry components and systems.
Page 16 of 16

F1146-E(12/2004)
REPORT DOCUMENTATION PAGE Form Approved OMB No. 0704-0188
The public reporting burden for this collection of information is estimated to average 1 hour per response, including the time for reviewing instructions, searching existing data sources, gathering and maintaining the data needed, and completing and reviewing the collection of information. Send comments regarding this burden estimate or any other aspect of this collection of information, including suggestions for reducing the burden, to Department of Defense, Executive Services and Communications Directorate (0704-0188). Respondents should be aware that notwithstanding any other provision of law, no person shall be subject to any penalty for failing to comply with a collection of information if it does not display a currently valid OMB control number. PLEASE DO NOT RETURN YOUR FORM TO THE ABOVE ORGANIZATION. 1. REPORT DATE (DD-MM-YYYY)
October 2006 2. REPORT TYPE
Independent Review Report 3. DATES COVERED (From - To)
5a. CONTRACT NUMBER
DE-AC36-99-GO10337
5b. GRANT NUMBER
4. TITLE AND SUBTITLE Distributed Hydrogen Production from Natural Gas: Independent Review Panel Report
5c. PROGRAM ELEMENT NUMBER
5d. PROJECT NUMBER NREL/BK-150-40382
5e. TASK NUMBER HS061002
6. AUTHOR(S) James Fletcher and Vincent Callaghan
5f. WORK UNIT NUMBER
7. PERFORMING ORGANIZATION NAME(S) AND ADDRESS(ES) James Fletcher, Vincent Callaghan Independent Review Panel
8. PERFORMING ORGANIZATION REPORT NUMBER LAX-6-66007-01
10. SPONSOR/MONITOR'S ACRONYM(S) NREL
9. SPONSORING/MONITORING AGENCY NAME(S) AND ADDRESS(ES) National Renewable Energy Laboratory 1617 Cole Blvd. Golden, CO 80401-3393 11. SPONSORING/MONITORING
AGENCY REPORT NUMBER NREL/BK-150-40382
12. DISTRIBUTION AVAILABILITY STATEMENT National Technical Information Service U.S. Department of Commerce 5285 Port Royal Road Springfield, VA 22161
13. SUPPLEMENTARY NOTES NREL Technical Monitor: Mark Ruth
14. ABSTRACT (Maximum 200 Words) Independent review report on the available information concerning the technologies needed for forecourts producing 150 kg/day of hydrogen from natural gas.
15. SUBJECT TERMS indpendent review; hydrogen production; natural gas; reforming; H2A
16. SECURITY CLASSIFICATION OF: 19a. NAME OF RESPONSIBLE PERSON a. REPORT
Unclassified b. ABSTRACT Unclassified
c. THIS PAGE Unclassified
17. LIMITATION OF ABSTRACT
UL
18. NUMBER OF PAGES
19b. TELEPHONE NUMBER (Include area code)
Standard Form 298 (Rev. 8/98) Prescribed by ANSI Std. Z39.18