Embed Size (px)
Citation preview
International Journal of
Geo-Information
Article
Distributed Geoscience Algorithm Integration Basedon OWS Specifications: A Case Study of theExtraction of a River Network
Xicheng Tan 1,2 , Liping Di 3,*, Yanfei Zhong 4,* , Nengcheng Chen 4 , Fang Huang 5 ,Jinchuan Wang 6,7, Ziheng Sun 3 and Yahya Ali Khan 1
1 School of Remote Sensing and Information Engineering, Wuhan University, 129 Luoyu Road,Wuhan 430079, China; [email protected] (X.T.); [email protected] (Y.A.K.)
2 Engineering Research Center of Geospatial Information and Digital Technology, NASG, Wuhan University,129 Luoyu Road, Wuhan 430079, China
3 Center for Spatial Information Science and Systems, George Mason University, Fairfax, VA 22030, USA;[email protected]
4 State Key Laboratory for Information Engineering in Surveying, Mapping and Remote Sensing,Wuhan University, Wuhan 430079, China; [email protected]
5 School of Resources & Environment, University of Electronic Science and Technology of China,Chengdu 611731, China; [email protected]
6 College of Geography and Environment, Shandong Normal University, Jinan 250014, China;[email protected]
7 Beijing Key Laboratory of Urban Spatial Information Engineering, 15 Yangfangdian Road,Beijing 100038, China
* Correspondence: [email protected] (L.D.); [email protected] (Y.Z.)
Received: 25 September 2018; Accepted: 23 December 2018; Published: 28 December 2018 �����������������
Abstract: To understand and solve various natural environmental problems, geoscience researchactivities are becoming increasingly dependent on the integration of knowledge, data, and algorithmsfrom scientists at different institutes and with multiple perspectives. However, the facilitation ofthese integrations remains a challenge because such scientific activities require gathering numerousgeoscience researchers to provide data, knowledge, algorithms, and tools from different institutes andgeographically distributed locations. The pivotal issue that needs to be addressed is the identificationof a method to effectively combine geoscience algorithms in a distributed environment to promotecooperation. To address this issue, in this paper, a scheme for building a distributed geosciencealgorithm integration based on the Open Geospatial Consortium web service (OWS) specifications isproposed. The architecture of the geoscience algorithm integration, algorithm service managementmechanism, XML description method for algorithm integration, and integrated model executionstrategy are designed and implemented. The experiment implements the integration of geosciencealgorithms in a distributed cloud environment and evaluates the feasibility and efficiency of theintegrated geoscience model. The proposed method provides a theoretical basis and practicalguidance for promoting the integration of distributed geoscience algorithms; this approach can helpto aggregate the distributed geoscience capabilities to address natural challenges.
Keywords: OGC web service; geospatial service; geoscience algorithm; distributed algorithmintegration
1. Introduction
With the development of large and global geographical environment problems, fully andeffectively coordinating globally distributed domain experts and fully utilizing distributed knowledge,
ISPRS Int. J. Geo-Inf. 2019, 8, 12; doi:10.3390/ijgi8010012 www.mdpi.com/journal/ijgi
ISPRS Int. J. Geo-Inf. 2019, 8, 12 2 of 16
algorithms, data and technology to address increasingly serious regional and even global problemsis a key problem that Open Science is trying to solve. Many researchers utilize distributedcomputing technology to solve these challenges and they have achieved positive results [1–3].However, in practical applications, experts are usually constrained by various barriers related todifferent standards and patterns when solving geoscience problems, which leads to the inability tofully and efficiently cooperate. The specification of geoscience standards can improve algorithmsharing, although the integration of geoscience algorithms, especially distributed algorithms,requires great effort.
Geoscience algorithms represent the combined wisdom of scientists, and geoscience algorithmintegration can improve both the value of scientific research and the reusability of algorithm resources.Algorithms are built for certain subject fields; however, in regard to various and multidimensionalissues, it is necessary to integrate the algorithms from different experts, institutes, and communitiesto solve problems. Furthermore, certain algorithms, e.g., for disaster response and decision making,are very difficult to integrate in emergency situations because of heterogeneous interfaces and runtimeenvironments. Hence, the integration of distributed geoscience algorithms that are based on standardspecifications can provide strong support for the implementation of such applications.
Via the integration of distributed geoscience algorithms, the applications of spatial and temporalanalysis, decision support, and simulated predictions to solving large-scale and global geoscienceproblems can be improved. However, geoscience algorithm resources are heterogeneous and highlydistributed; therefore, research to uncover a standardized and effective method to achieve distributedintegration of geoscience algorithms is urgently needed.
To improve the ability to share distributed geoscience algorithms and promote the integration ofdistributed algorithm services for various geospatial analysis and decision-making applications,this paper proposes a distributed geoscience algorithm integration scheme that is based on theOWS standards. In the study, a management mechanism for geoscience algorithms is designedand implemented, which facilitates the registration of, search for, and invocation of the distributedgeoscience algorithms. Geoscience algorithm integration is implemented using an XML-based script.Finally, we utilize a river network extraction algorithm as a case study to demonstrate the feasibilityand efficiency of the proposed method.
This paper has significant importance to Open Science, and the proposed method contributesto the realization of Open Science by sharing, finding, reusing, and integrating the heterogeneousgeoscience data and algorithms in the distributed environment. Moreover, via utilizing the OWSstandard specifications, the proposed method can also foster the diffusion of geospatial knowledge,which is crucial to the cooperation between the experts and organizations in the geoscience communityor even cross-disciplinary communities.
2. Literature Review
As early as 1983, Blanning proposed the problem of managing various types of geosciencemodels and algorithms in the form of a document and proposed the concept of the model library,which managed models and algorithms with a defined model library query language (MQL) [4].However, due to the restrictions of network technologies, traditional geoscience algorithms mostlyexist in single-machine environments and they cannot be obtained through a network. Moreover,because of the different programming languages and operating environments, most of the algorithmsare not interactive. There are barriers to using aggregate distributed geoscience algorithms to build themodels that are required to solve complex geographic problems [5], because the various algorithms anddata were developed with different languages and interfaces; hence, the existing algorithms need to berewritten to meet the integration requirements. If various geoscience algorithms can be obtained andaggregated into a model in real time via the Internet and are no longer limited by platform, hardware,and software, emergency response times to earthquakes, landslides, floods, hurricanes, and otherdisasters can be shortened. To this end, it is necessary to study geoscience algorithm integration
ISPRS Int. J. Geo-Inf. 2019, 8, 12 3 of 16
technologies so that all users can access these distributed geoscience algorithms quickly and easily,or even integrate the distributed algorithms dynamically.
Driven by network technology, web service platforms have become a new solution for theintegration of network applications. Web service technologies have been widely used to constructdistributed, modular applications and service-oriented applications. Accordingly, with the applicationof geographical information technology in various fields, the technology is moving from a closed(tightly coupled standalone) system to an open and loosely coupled service. Users can accessand use geographic data, geoprocessing services, and mapping services on demand via theInternet [6]. Service-oriented applications have become the direction of new geoscience developments.Geospatial application activities are moving from a professional field to a networked, socialized,and popular service that is being accepted by various domain experts and even nonprofessionals [7].An algorithm service deployment strategy for sharing geoanalysis algorithms was proposed andimplemented to provide a collaboration-oriented method that allowed modeling participants to worktogether and integrate algorithms and computational resources across an open web environment [8].A virtual workflow system can provide an efficient Graphical User Interface (GUI) that users canutilize to integrate distributed scientific collaborative services and execute them on grid resources [9].
With continuous advancements in the sharing, exchanging, and use of spatial data, the sharingand interoperability of processing functions have received increased attention. A web service providesan open platform for the sharing of spatial information and geoprocessing functions. It is critical toimplement the sharing of Earth observation data and geospatial analysis algorithms [10]. By accessingweb service resources, all geoprocessing functions from algorithm publishers can be provided toalgorithm users through the Internet. The emergence of common web services also enables geospatialdata sharing and algorithm interoperability, and, when compared with other distributed architectures,the geoscience algorithm sharing based on a common service-oriented architecture (SOA) has obviousadvantages. However, there is no standard scheme for the integration of common web service-basedgeospatial algorithms; hence, this method can only be used to share geospatial data and geosciencealgorithms within a limited scope and community. Moreover, it is difficult to implement the automaticdiscovery and integration of widely accepted geoscience algorithms.
To meet the requirements of distributed geoscience data and algorithm sharing, the InternationalOrganization for Standardization/Technical Committee (ISO/TC 211) and the Open GeospatialConsortium (OGC) formulated a series of geographical data services and processing service standards,including a Web Map Service (WMS), Web Feature Service (WFS), Web Coverage Service (WCS),and Web Processing Service (WPS), to standardize data transmission and processing interfaces.
The WPS interface is proposed to address the deficiencies of web services in solving functionalinteroperability and the increasing demand for network-based spatial data processing. “Processing”can be an algorithm, computation, or model for processing spatial data. The WPS interface standardprovides rules for standardizing how to construct the inputs and outputs of geospatial processingservices and geographic computing in a standard way, making it easier for users to publish geospatialprocessing services and discover and bind these services. WPS also defines how the client invokesthe processing service and how to process the output of the processing service. The implementationof this standard allows any geospatial processing service, regardless of its source, to be encapsulatedand integrated into existing workflows using standard interfaces. The WPS standard defines a generalprocess model, which is designed to provide interoperability descriptions for geographic processingand computing and support service discovery in distributed environments.
These geospatial service specifications have been widely adopted in geographical modelbuilding [11–16]. By using web-based maps, geospatial data, geoprocessing services, and sensorweb services, researchers can efficiently use geographic information resources to support spatialdecision-making and geoscience applications [17–22]. Di demonstrated that the framework basedon the OGC web service (OWS) facilitates interoperability between Earth observation data andgeoprocessing modeling [23]. Specialists have also conducted geographic processing research that
ISPRS Int. J. Geo-Inf. 2019, 8, 12 4 of 16
is based on grid technology and a cloud computing environment [24–27]. WPS specifications areutilized to process geoscience data on different computing backends and platforms [28]. A newmethod of flexible service chaining using the standard Business Process Markup Notation (BPMN)has been proposed to access a centralized repository of processes and services to form a reusableworkflow [29]. Nativi developed the GEO model web initiative of environmental model access andinteroperability, in which the basic principles and technical challenges of implementing a modelweb are revealed [30]. Castronova designed a generic OpenMI-component that wraps OGC WPSmodeling services, and the model services can be leveraged and reused within multiple workflowenvironments and decision support systems; this approach can advance the work in SOAs forenvironmental modeling [16]. To address the emerging issue of integrating data sharing and computinge-infrastructures for multidisciplinary applications, a business process broker (BPB) was designedto take a formal description of a scientific business process and translate it in an executable process,and this method has been applied in satellite image mosaicking [31].
Countries and organizations have conducted geospatial information service projects, such asthe U.S. EarthCube program by the National Science Foundation (NSF), the Infrastructure for SpatialInformation in Europe (INSPIRE), and China’s TIANDITU. Geoscience services that are based ondistributed information infrastructures have been developed in recent years, including Spatial Dataand Information Infrastructure, e-Science, and Cyberinfrastructure [31–34]. The goal is to improvethe access, sharing, visualization, and analysis of all forms of geoscience data and related resources.In recent years, the virtual geographic environment was introduced as a new geoscience algorithmsharing and interaction technology, and it plays an important role in the managing and sharing ofgeographical knowledge and multiscale environmental change monitoring applications [5,35–38].Commercial organizations and enterprises have built cloud-based geocomputation services for spatialanalysis, mapping, and spatial processing [39,40].
All of these prior studies provide excellent examples of standard-based geoscience data processingand they can be seen as the source of inspiration for this study.
3. Methods
3.1. The Architecture of Geoscience Algorithm Integration
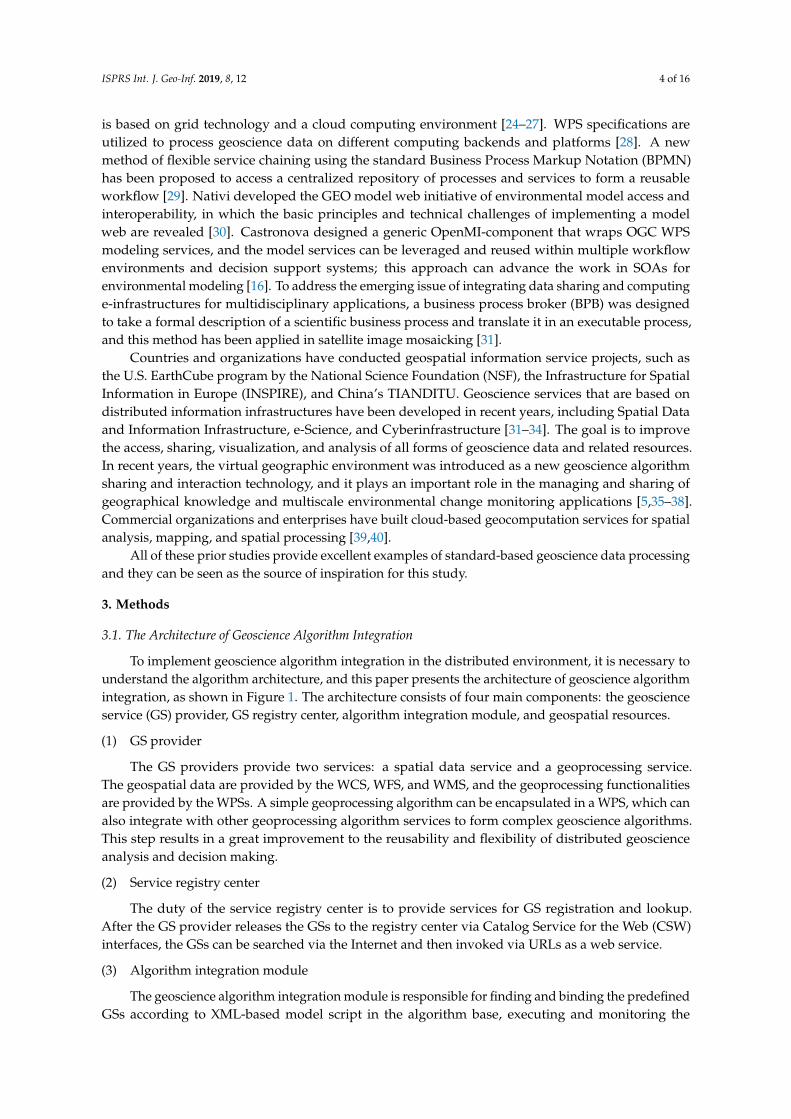
To implement geoscience algorithm integration in the distributed environment, it is necessary tounderstand the algorithm architecture, and this paper presents the architecture of geoscience algorithmintegration, as shown in Figure 1. The architecture consists of four main components: the geoscienceservice (GS) provider, GS registry center, algorithm integration module, and geospatial resources.
(1) GS provider
The GS providers provide two services: a spatial data service and a geoprocessing service.The geospatial data are provided by the WCS, WFS, and WMS, and the geoprocessing functionalitiesare provided by the WPSs. A simple geoprocessing algorithm can be encapsulated in a WPS, which canalso integrate with other geoprocessing algorithm services to form complex geoscience algorithms.This step results in a great improvement to the reusability and flexibility of distributed geoscienceanalysis and decision making.
(2) Service registry center
The duty of the service registry center is to provide services for GS registration and lookup.After the GS provider releases the GSs to the registry center via Catalog Service for the Web (CSW)interfaces, the GSs can be searched via the Internet and then invoked via URLs as a web service.
(3) Algorithm integration module
The geoscience algorithm integration module is responsible for finding and binding the predefinedGSs according to XML-based model script in the algorithm base, executing and monitoring the
ISPRS Int. J. Geo-Inf. 2019, 8, 12 5 of 16
integrated algorithms, and returning the results to the user. The algorithm can be a single GS or acombination of multiple GSs. The algorithm integration module executes the integrated geosciencemodel via the model execution engine.
(4) Geospatial resources
Geospatial resources represent the geoprocessing tools, geospatial data, and computing andstorage platforms. Geoprocessing tools can be published as a WPS. Data resources include geographicvector and raster data and remote sensing data, which can be published as the WCS, WFS,and WMS. The geospatial resources also include a physical geoprocessing server or grid/cloudcomputing resources.
ISPRS Int. J. Geo-Inf. 2019, 8, x FOR PEER REVIEW 5 of 16
integrated algorithms, and returning the results to the user. The algorithm can be a single GS or a combination of multiple GSs. The algorithm integration module executes the integrated geoscience model via the model execution engine.
(4) Geospatial resources
Geospatial resources represent the geoprocessing tools, geospatial data, and computing and storage platforms. Geoprocessing tools can be published as a WPS. Data resources include geographic vector and raster data and remote sensing data, which can be published as the WCS, WFS, and WMS. The geospatial resources also include a physical geoprocessing server or grid/cloud computing resources.
Figure 1. The architecture of distributed geoscience algorithm integration.
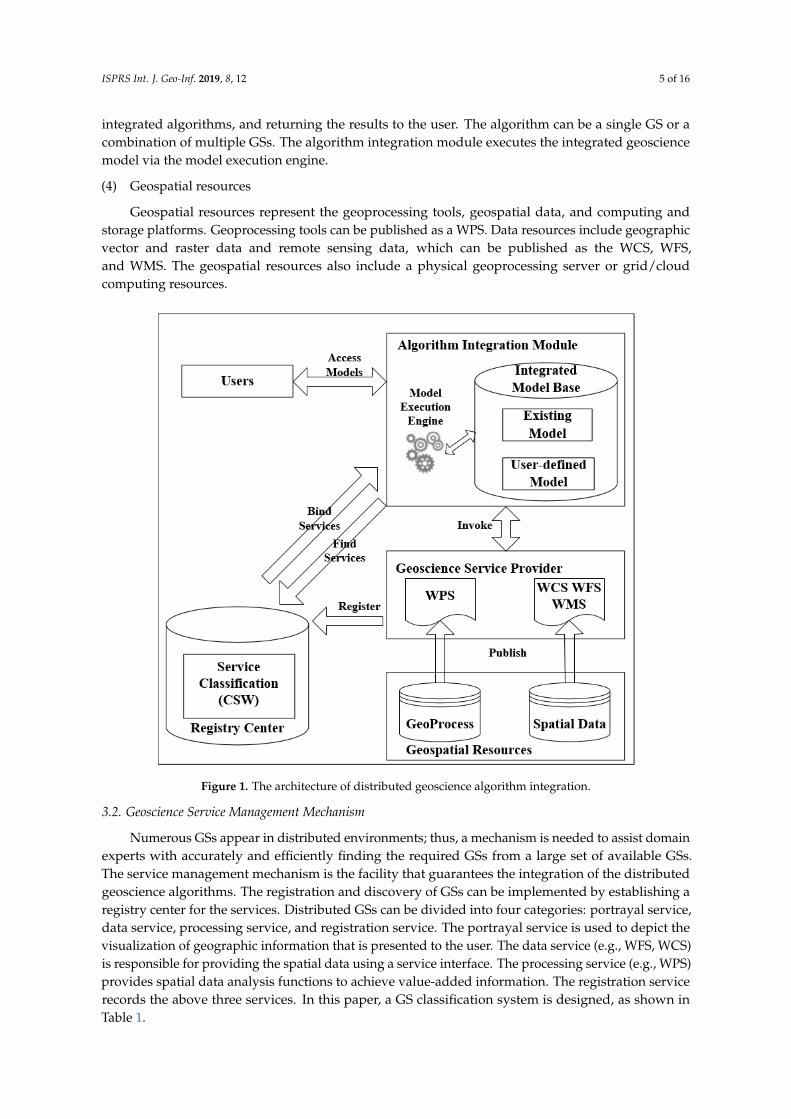
3.2. Geoscience Service Management Mechanism
Numerous GSs appear in distributed environments; thus, a mechanism is needed to assist domain experts with accurately and efficiently finding the required GSs from a large set of available GSs. The service management mechanism is the facility that guarantees the integration of the distributed geoscience algorithms. The registration and discovery of GSs can be implemented by establishing a registry center for the services. Distributed GSs can be divided into four categories: portrayal service, data service, processing service, and registration service. The portrayal service is used to depict the visualization of geographic information that is presented to the user. The data service (e.g., WFS, WCS) is responsible for providing the spatial data using a service interface. The processing service (e.g., WPS) provides spatial data analysis functions to achieve value-added information. The registration service records the above three services. In this paper, a GS classification system is designed, as shown in Table 1.
Figure 1. The architecture of distributed geoscience algorithm integration.
3.2. Geoscience Service Management Mechanism
Numerous GSs appear in distributed environments; thus, a mechanism is needed to assist domainexperts with accurately and efficiently finding the required GSs from a large set of available GSs.The service management mechanism is the facility that guarantees the integration of the distributedgeoscience algorithms. The registration and discovery of GSs can be implemented by establishing aregistry center for the services. Distributed GSs can be divided into four categories: portrayal service,data service, processing service, and registration service. The portrayal service is used to depict thevisualization of geographic information that is presented to the user. The data service (e.g., WFS, WCS)is responsible for providing the spatial data using a service interface. The processing service (e.g., WPS)provides spatial data analysis functions to achieve value-added information. The registration servicerecords the above three services. In this paper, a GS classification system is designed, as shown inTable 1.
ISPRS Int. J. Geo-Inf. 2019, 8, 12 6 of 16
Table 1. Distributed geoscience service classification system.
Geoscience ServiceClassification Services
Portrayal Web Map ServiceService Web Terrain Service
Data Web Feature ServiceService Web Coverage Service
Web Query Service
Extraction Service
Geospatial ProcessService
SpatialAnalysis
Hydrology ServiceOverlay Service
....
WebProcessing Service Conversion
Tool
CoordinateTransformation Service
Data FormatTransformation Service
Geocode ServiceThematic Process Service Gazetteer Service
Geoparse Service
Temporal Process ServiceMetadata Process Service
Registration Service Category Service for the Web
Table 1 shows the general classification of the geoscience data services and processing services,which can be effectively used to manage the services and facilitate the registration and lookup ofthe services. The classification system provides strong support for GS registration and discovery indistributed geoscience algorithm service integration. Distributed GSs and GS management mechanismsconstitute the foundation of distributed GS integration.
3.3. XML Description of the Algorithm Integration
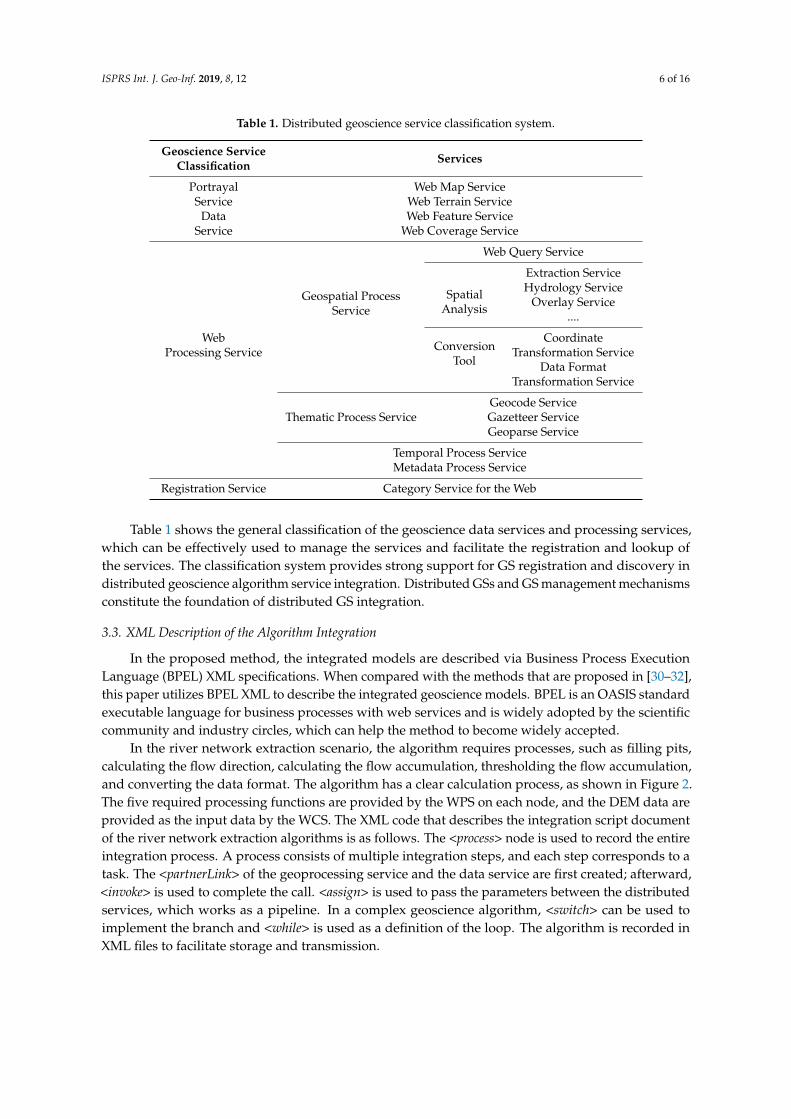
In the proposed method, the integrated models are described via Business Process ExecutionLanguage (BPEL) XML specifications. When compared with the methods that are proposed in [30–32],this paper utilizes BPEL XML to describe the integrated geoscience models. BPEL is an OASIS standardexecutable language for business processes with web services and is widely adopted by the scientificcommunity and industry circles, which can help the method to become widely accepted.
In the river network extraction scenario, the algorithm requires processes, such as filling pits,calculating the flow direction, calculating the flow accumulation, thresholding the flow accumulation,and converting the data format. The algorithm has a clear calculation process, as shown in Figure 2.The five required processing functions are provided by the WPS on each node, and the DEM data areprovided as the input data by the WCS. The XML code that describes the integration script documentof the river network extraction algorithms is as follows. The <process> node is used to record the entireintegration process. A process consists of multiple integration steps, and each step corresponds to atask. The <partnerLink> of the geoprocessing service and the data service are first created; afterward,<invoke> is used to complete the call. <assign> is used to pass the parameters between the distributedservices, which works as a pipeline. In a complex geoscience algorithm, <switch> can be used toimplement the branch and <while> is used as a definition of the loop. The algorithm is recorded inXML files to facilitate storage and transmission.
ISPRS Int. J. Geo-Inf. 2019, 8, 12 7 of 16
ISPRS Int. J. Geo-Inf. 2019, 8, x FOR PEER REVIEW 7 of 16
Process
Sequence
Filling pitsConverting data
format conversion
Thresholding flow
accumulation
Calculating flow direction
Calculating flow accumulation
<process name="stream" <sequence name="main">
<receive name="receiveInput" partnerLink="client" portType="tns:stream" operation="process" variable="input" createInstance="yes"/>
<assign validate="no" name="Assignwcs">...</assign> <invoke name="Invokewcs" partnerLink="wcslink" operation="getCoverage"
portType="ns:WCSproviderServicePortType" inputVariable="wcslinkRequest" outputVariable="wcslinkResponse"></invoke>
<assign validate="no" name="Assignfill">...</assign> <invoke name="Invokefill" partnerLink="wpslink" operation="wpsexecute2p"
portType="ns0:WPSexecuterServicePortType" inputVariable="wpslinkRequest" outputVariable="wpslinkResponse"></invoke>
<assign validate="no" name="Assigndir">...</assign> <invoke name="Invokedir" partnerLink="wpslink" operation="wpsexecute2p"
portType="ns0:WPSexecuterServicePortType" inputVariable="wpslinkRequest" outputVariable="wpslinkResponse"></invoke>
<assign validate="no" name="Assignacc">...</assign> <invoke name="Invokeacc" partnerLink="wpslink" operation="wpsexecute2p"
portType="ns0:WPSexecuterServicePortType" inputVariable="wpslinkRequest" outputVariable="wpslinkResponse"></invoke>
<assign validate="no" name="Assigngt">...</assign> <invoke name="Invokegt" partnerLink="wpslink" operation="wpsexecute3p"
portType="ns0:WPSexecuterServicePortType" inputVariable="wpslinkRequest1" outputVariable="wpslinkResponse1"></invoke>
<assign validate="no" name="Assignline">...</assign> <invoke name="Invokeline" partnerLink="wpslink" operation="wpsexecute2p"
portType="ns0:WPSexecuterServicePortType" inputVariable="wpslinkRequest" outputVariable="wpslinkResponse"></invoke>
<assign validate="no" name="Assignout">...</assign> <reply name="replyOutput" partnerLink="client" portType="tns:stream" operation="process" variable="output"/>
</sequence> </process>
Figure 2. Distributed geoscience algorithm integration XML script for river network extraction.
The details of each step are as follows:
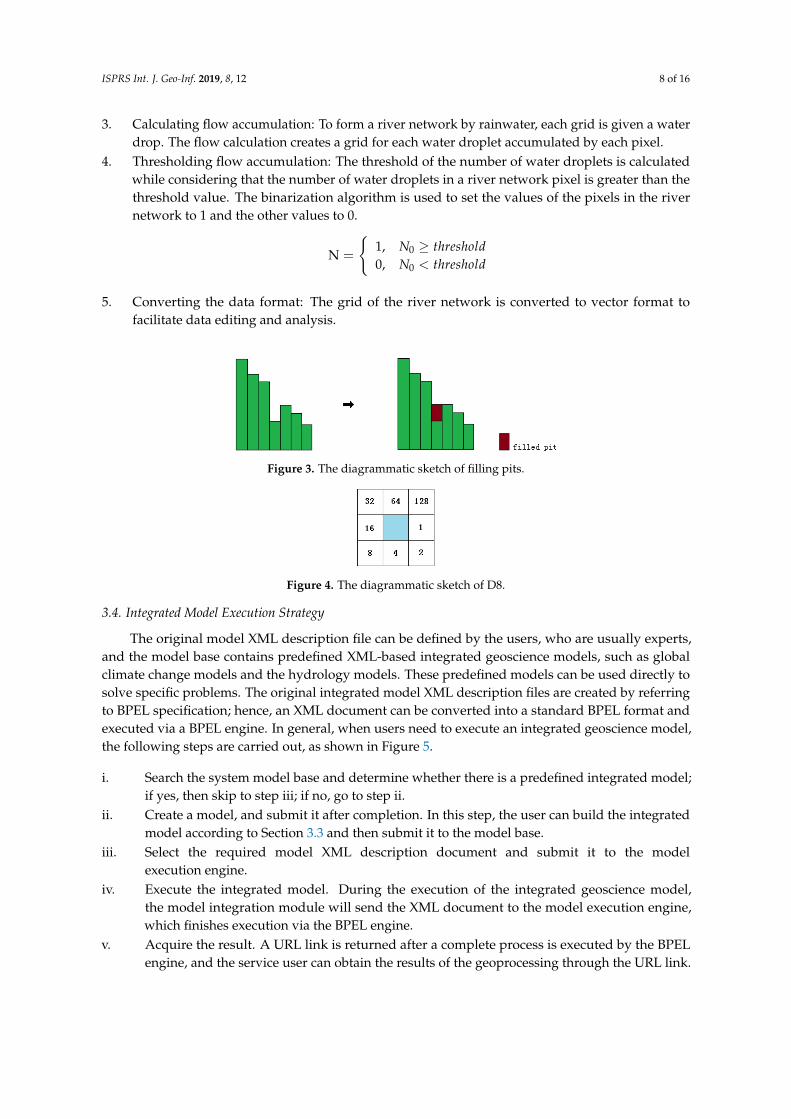
1. Filling pits: This step is used for data preprocessing. In the case of data errors, the original DEM data will have noise and there will be pits. In the D8 flow direction algorithm, a part of the river network is broken down, which contradicts the rules of river formation. The small defects in the data are removed by filling the pits in the DEM data, as shown in Figure 3.
Figure 2. Distributed geoscience algorithm integration XML script for river network extraction.
The details of each step are as follows:
1. Filling pits: This step is used for data preprocessing. In the case of data errors, the original DEMdata will have noise and there will be pits. In the D8 flow direction algorithm, a part of the rivernetwork is broken down, which contradicts the rules of river formation. The small defects in thedata are removed by filling the pits in the DEM data, as shown in Figure 3.
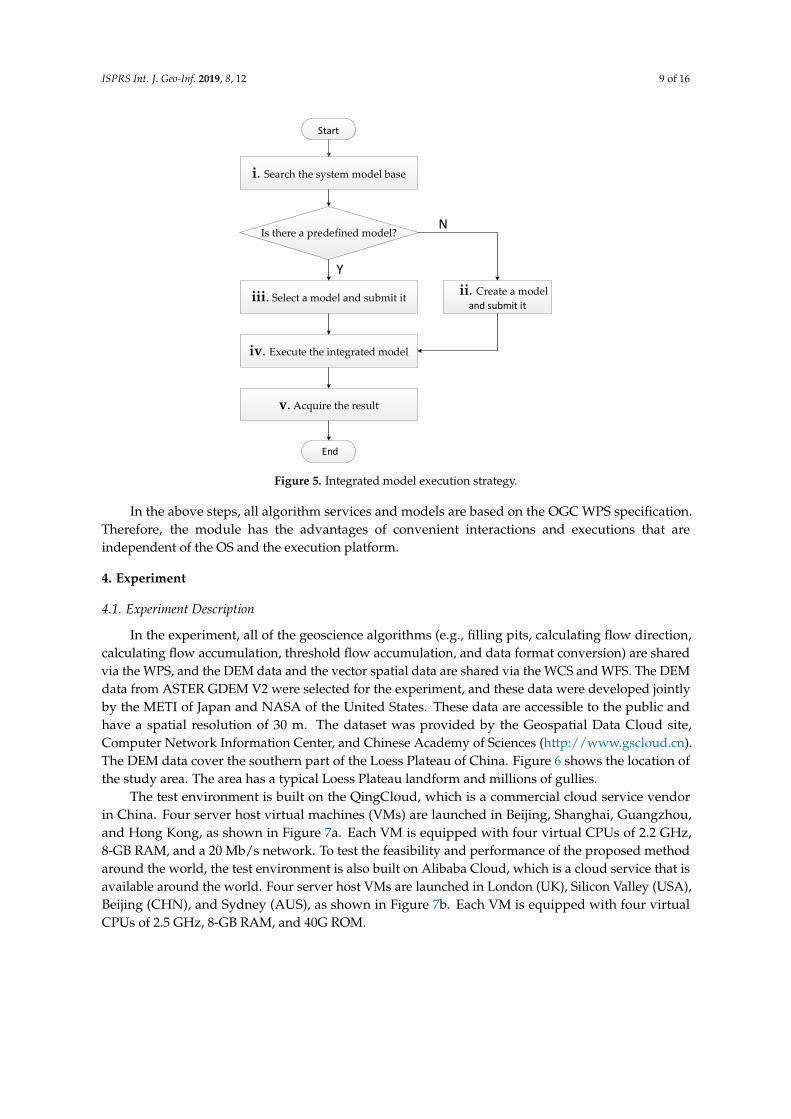
2. Calculating flow direction: After filling, the value of each center pixel is not smaller than thevalues of the eight pixels around it; thus, each water pixel will flow toward the pixels with lowervalues. This process is utilized to form the 8 flow directions. The grid flow is calculated by usingthe D8 algorithm to create the flow from each pixel toward the steepest downhill adjacent points.As shown in Figure 4, the values are 1, 2, 4, 8, 16, 32, 64, and 128 in each direction.
ISPRS Int. J. Geo-Inf. 2019, 8, 12 8 of 16
3. Calculating flow accumulation: To form a river network by rainwater, each grid is given a waterdrop. The flow calculation creates a grid for each water droplet accumulated by each pixel.
4. Thresholding flow accumulation: The threshold of the number of water droplets is calculatedwhile considering that the number of water droplets in a river network pixel is greater than thethreshold value. The binarization algorithm is used to set the values of the pixels in the rivernetwork to 1 and the other values to 0.
N =
{1, N0 ≥ threshold0, N0 < threshold
5. Converting the data format: The grid of the river network is converted to vector format tofacilitate data editing and analysis.
ISPRS Int. J. Geo-Inf. 2019, 8, x FOR PEER REVIEW 8 of 16
Figure 3. The diagrammatic sketch of filling pits.
2. Calculating flow direction: After filling, the value of each center pixel is not smaller than the values of the eight pixels around it; thus, each water pixel will flow toward the pixels with lower values. This process is utilized to form the 8 flow directions. The grid flow is calculated by using the D8 algorithm to create the flow from each pixel toward the steepest downhill adjacent points. As shown in Figure 4, the values are 1, 2, 4, 8, 16, 32, 64, and 128 in each direction.
Figure 4. The diagrammatic sketch of D8.
3. Calculating flow accumulation: To form a river network by rainwater, each grid is given a water drop. The flow calculation creates a grid for each water droplet accumulated by each pixel.
4. Thresholding flow accumulation: The threshold of the number of water droplets is calculated while considering that the number of water droplets in a river network pixel is greater than the threshold value. The binarization algorithm is used to set the values of the pixels in the river network to 1 and the other values to 0. N = 1, 𝑁 ≥ 𝑡ℎ𝑟𝑒𝑠ℎ𝑜𝑙𝑑 0, 𝑁 < 𝑡ℎ𝑟𝑒𝑠ℎ𝑜𝑙𝑑
5. Converting the data format: The grid of the river network is converted to vector format to facilitate data editing and analysis.
3.4. Integrated Model Execution Strategy
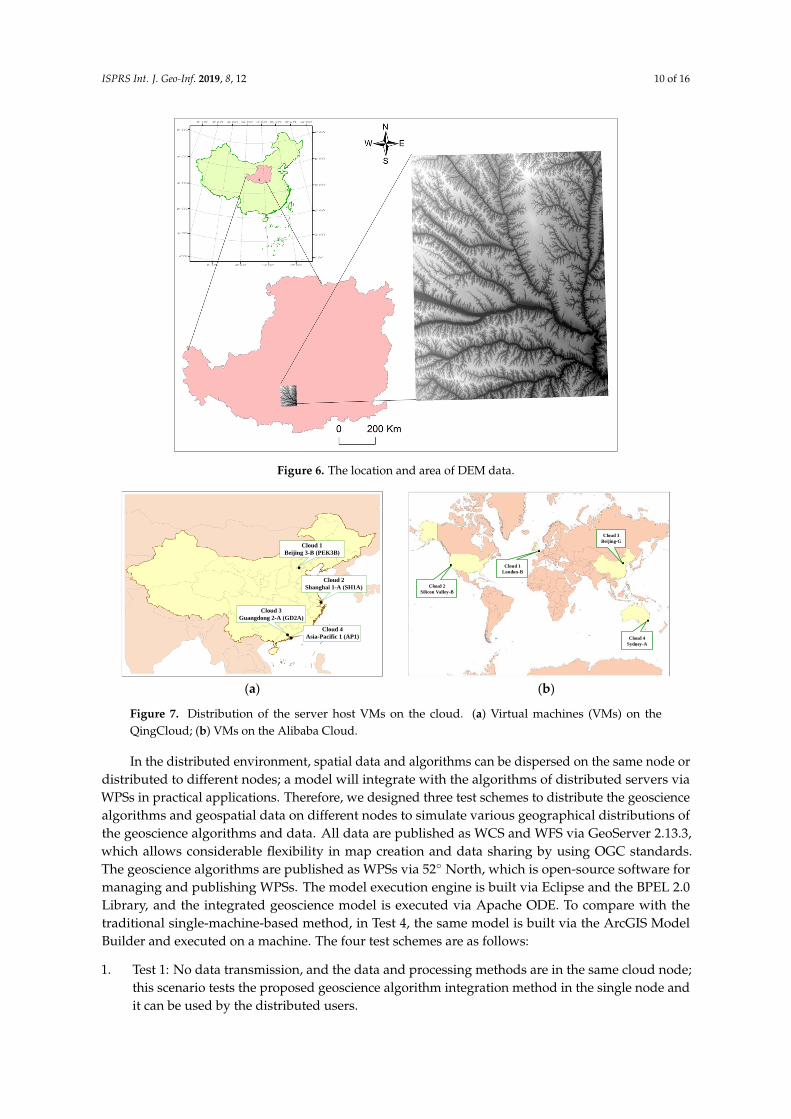
The original model XML description file can be defined by the users, who are usually experts, and the model base contains predefined XML-based integrated geoscience models, such as global climate change models and the hydrology models. These predefined models can be used directly to solve specific problems. The original integrated model XML description files are created by referring to BPEL specification; hence, an XML document can be converted into a standard BPEL format and executed via a BPEL engine. In general, when users need to execute an integrated geoscience model, the following steps are carried out, as shown in Figure 5.
Figure 3. The diagrammatic sketch of filling pits.
ISPRS Int. J. Geo-Inf. 2019, 8, x FOR PEER REVIEW 8 of 16
Figure 3. The diagrammatic sketch of filling pits.
2. Calculating flow direction: After filling, the value of each center pixel is not smaller than the values of the eight pixels around it; thus, each water pixel will flow toward the pixels with lower values. This process is utilized to form the 8 flow directions. The grid flow is calculated by using the D8 algorithm to create the flow from each pixel toward the steepest downhill adjacent points. As shown in Figure 4, the values are 1, 2, 4, 8, 16, 32, 64, and 128 in each direction.
Figure 4. The diagrammatic sketch of D8.
3. Calculating flow accumulation: To form a river network by rainwater, each grid is given a water drop. The flow calculation creates a grid for each water droplet accumulated by each pixel.
4. Thresholding flow accumulation: The threshold of the number of water droplets is calculated while considering that the number of water droplets in a river network pixel is greater than the threshold value. The binarization algorithm is used to set the values of the pixels in the river network to 1 and the other values to 0. N = 1, 𝑁 ≥ 𝑡ℎ𝑟𝑒𝑠ℎ𝑜𝑙𝑑 0, 𝑁 < 𝑡ℎ𝑟𝑒𝑠ℎ𝑜𝑙𝑑
5. Converting the data format: The grid of the river network is converted to vector format to facilitate data editing and analysis.
3.4. Integrated Model Execution Strategy
The original model XML description file can be defined by the users, who are usually experts, and the model base contains predefined XML-based integrated geoscience models, such as global climate change models and the hydrology models. These predefined models can be used directly to solve specific problems. The original integrated model XML description files are created by referring to BPEL specification; hence, an XML document can be converted into a standard BPEL format and executed via a BPEL engine. In general, when users need to execute an integrated geoscience model, the following steps are carried out, as shown in Figure 5.
Figure 4. The diagrammatic sketch of D8.
3.4. Integrated Model Execution Strategy
The original model XML description file can be defined by the users, who are usually experts,and the model base contains predefined XML-based integrated geoscience models, such as globalclimate change models and the hydrology models. These predefined models can be used directly tosolve specific problems. The original integrated model XML description files are created by referringto BPEL specification; hence, an XML document can be converted into a standard BPEL format andexecuted via a BPEL engine. In general, when users need to execute an integrated geoscience model,the following steps are carried out, as shown in Figure 5.
i. Search the system model base and determine whether there is a predefined integrated model;if yes, then skip to step iii; if no, go to step ii.
ii. Create a model, and submit it after completion. In this step, the user can build the integratedmodel according to Section 3.3 and then submit it to the model base.
iii. Select the required model XML description document and submit it to the modelexecution engine.
iv. Execute the integrated model. During the execution of the integrated geoscience model,the model integration module will send the XML document to the model execution engine,which finishes execution via the BPEL engine.
v. Acquire the result. A URL link is returned after a complete process is executed by the BPELengine, and the service user can obtain the results of the geoprocessing through the URL link.
ISPRS Int. J. Geo-Inf. 2019, 8, 12 9 of 16
ISPRS Int. J. Geo-Inf. 2019, 8, x FOR PEER REVIEW 9 of 16
i. Search the system model base
iii. Select a model and submit it
iv. Execute the integrated model
Start
Is there a predefined model?
ii. Create a model and submit it
Y
N
v. Acquire the result
End Figure 5. Integrated model execution strategy.
i. Search the system model base and determine whether there is a predefined integrated model; if yes, then skip to step iii; if no, go to step ii.
ii. Create a model, and submit it after completion. In this step, the user can build the integrated model according to Section 3.3 and then submit it to the model base.
iii. Select the required model XML description document and submit it to the model execution engine.
iv. Execute the integrated model. During the execution of the integrated geoscience model, the model integration module will send the XML document to the model execution engine, which finishes execution via the BPEL engine.
v. Acquire the result. A URL link is returned after a complete process is executed by the BPEL engine, and the service user can obtain the results of the geoprocessing through the URL link.
In the above steps, all algorithm services and models are based on the OGC WPS specification. Therefore, the module has the advantages of convenient interactions and executions that are independent of the OS and the execution platform.
4. Experiment
4.1. Experiment Description
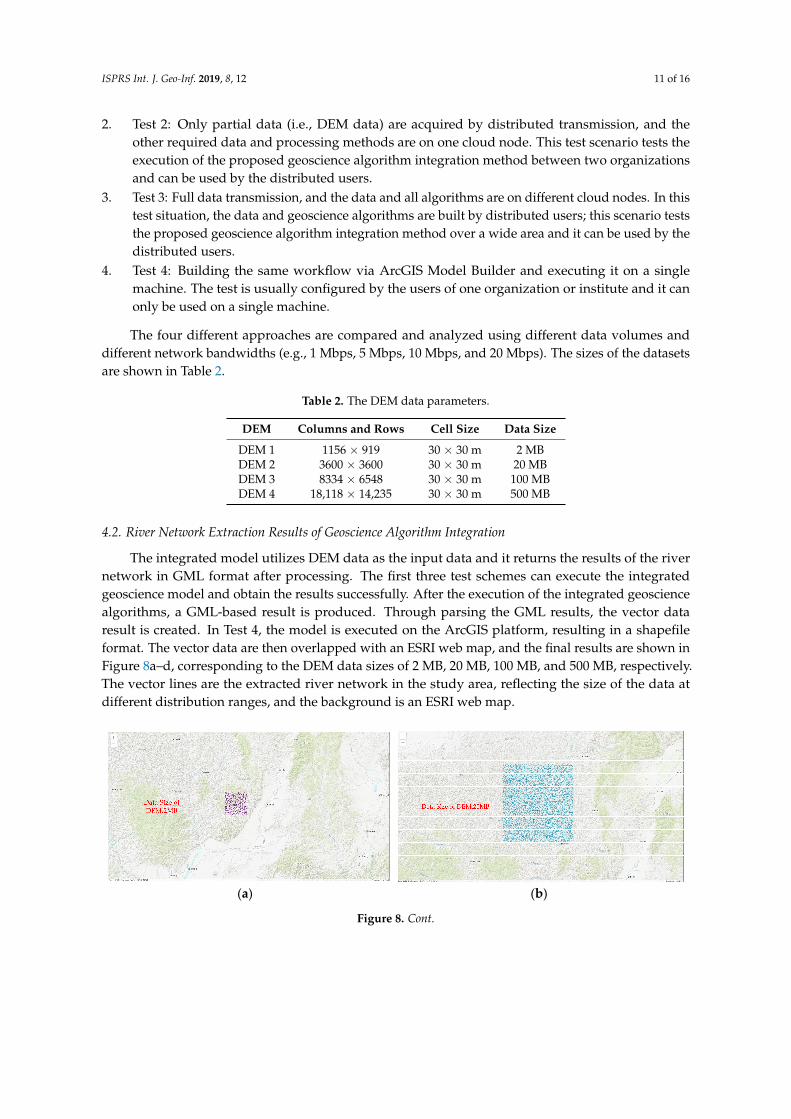
In the experiment, all of the geoscience algorithms (e.g., filling pits, calculating flow direction, calculating flow accumulation, threshold flow accumulation, and data format conversion) are shared via the WPS, and the DEM data and the vector spatial data are shared via the WCS and WFS. The DEM data from ASTER GDEM V2 were selected for the experiment, and these data were developed jointly by the METI of Japan and NASA of the United States. These data are accessible to the public and have a spatial resolution of 30 m. The dataset was provided by the Geospatial Data Cloud site, Computer Network Information Center, and Chinese Academy of Sciences (http://www.gscloud.cn). The DEM data cover the southern part of the Loess Plateau of China. Figure 6 shows the location of the study area. The area has a typical Loess Plateau landform and millions of gullies.
Figure 5. Integrated model execution strategy.
In the above steps, all algorithm services and models are based on the OGC WPS specification.Therefore, the module has the advantages of convenient interactions and executions that areindependent of the OS and the execution platform.
4. Experiment
4.1. Experiment Description
In the experiment, all of the geoscience algorithms (e.g., filling pits, calculating flow direction,calculating flow accumulation, threshold flow accumulation, and data format conversion) are sharedvia the WPS, and the DEM data and the vector spatial data are shared via the WCS and WFS. The DEMdata from ASTER GDEM V2 were selected for the experiment, and these data were developed jointlyby the METI of Japan and NASA of the United States. These data are accessible to the public andhave a spatial resolution of 30 m. The dataset was provided by the Geospatial Data Cloud site,Computer Network Information Center, and Chinese Academy of Sciences (http://www.gscloud.cn).The DEM data cover the southern part of the Loess Plateau of China. Figure 6 shows the location ofthe study area. The area has a typical Loess Plateau landform and millions of gullies.
The test environment is built on the QingCloud, which is a commercial cloud service vendorin China. Four server host virtual machines (VMs) are launched in Beijing, Shanghai, Guangzhou,and Hong Kong, as shown in Figure 7a. Each VM is equipped with four virtual CPUs of 2.2 GHz,8-GB RAM, and a 20 Mb/s network. To test the feasibility and performance of the proposed methodaround the world, the test environment is also built on Alibaba Cloud, which is a cloud service that isavailable around the world. Four server host VMs are launched in London (UK), Silicon Valley (USA),Beijing (CHN), and Sydney (AUS), as shown in Figure 7b. Each VM is equipped with four virtualCPUs of 2.5 GHz, 8-GB RAM, and 40G ROM.
ISPRS Int. J. Geo-Inf. 2019, 8, 12 10 of 16ISPRS Int. J. Geo-Inf. 2019, 8, x FOR PEER REVIEW 10 of 16
Figure 6. The location and area of DEM data.
The test environment is built on the QingCloud, which is a commercial cloud service vendor in China. Four server host virtual machines (VMs) are launched in Beijing, Shanghai, Guangzhou, and Hong Kong, as shown in Figure 7a. Each VM is equipped with four virtual CPUs of 2.2 GHz, 8-GB RAM, and a 20 Mb/s network. To test the feasibility and performance of the proposed method around the world, the test environment is also built on Alibaba Cloud, which is a cloud service that is available around the world. Four server host VMs are launched in London (UK), Silicon Valley (USA), Beijing (CHN), and Sydney (AUS), as shown in Figure 7b. Each VM is equipped with four virtual CPUs of 2.5 GHz, 8-GB RAM, and 40G ROM.
Cloud 3Beijing-G
Cloud 2 Silicon Valley-B
Cloud 1 London-B
Cloud 4Sydney-A
(a) (b)
Figure 7. Distribution of the server host VMs on the cloud. (a) Virtual machines (VMs) on the QingCloud; (b) VMs on the Alibaba Cloud.
In the distributed environment, spatial data and algorithms can be dispersed on the same node or distributed to different nodes; a model will integrate with the algorithms of distributed servers via WPSs in practical applications. Therefore, we designed three test schemes to distribute the geoscience algorithms and geospatial data on different nodes to simulate various geographical distributions of the geoscience algorithms and data. All data are published as WCS and WFS via GeoServer 2.13.3, which allows considerable flexibility in map creation and data sharing by using OGC standards. The geoscience algorithms are published as WPSs via 52° North, which is open-source software for managing and publishing WPSs. The model execution engine is built via Eclipse and the BPEL 2.0
Figure 6. The location and area of DEM data.
ISPRS Int. J. Geo-Inf. 2019, 8, x FOR PEER REVIEW 10 of 16
Figure 6. The location and area of DEM data.
The test environment is built on the QingCloud, which is a commercial cloud service vendor in
China. Four server host virtual machines (VMs) are launched in Beijing, Shanghai, Guangzhou, and
Hong Kong, as shown in Figure 7a. Each VM is equipped with four virtual CPUs of 2.2 GHz, 8-GB
RAM, and a 20 Mb/s network. To test the feasibility and performance of the proposed method around
the world, the test environment is also built on Alibaba Cloud, which is a cloud service that is
available around the world. Four server host VMs are launched in London (UK), Silicon Valley (USA),
Beijing (CHN), and Sydney (AUS), as shown in Figure 7b. Each VM is equipped with four virtual
CPUs of 2.5 GHz, 8-GB RAM, and 40G ROM.
Cloud 3
Beijing-G
Cloud 2
Silicon Valley-B
Cloud 1
London-B
Cloud 4
Sydney-A
(a) (b)
Figure 7. Distribution of the server host VMs on the cloud. (a) Virtual machines (VMs) on the
QingCloud; (b) VMs on the Alibaba Cloud.
In the distributed environment, spatial data and algorithms can be dispersed on the same node
or distributed to different nodes; a model will integrate with the algorithms of distributed servers via
WPSs in practical applications. Therefore, we designed three test schemes to distribute the geoscience
algorithms and geospatial data on different nodes to simulate various geographical distributions of
the geoscience algorithms and data. All data are published as WCS and WFS via GeoServer 2.13.3,
which allows considerable flexibility in map creation and data sharing by using OGC standards. The
geoscience algorithms are published as WPSs via 52° North, which is open-source software for
managing and publishing WPSs. The model execution engine is built via Eclipse and the BPEL 2.0
Cloud 1
Beijing 3-B (PEK3B)
Cloud 2
Shanghai 1-A (SH1A)
Cloud 3
Guangdong 2-A (GD2A)
Cloud 4
Asia-Pacific 1 (AP1)
Figure 7. Distribution of the server host VMs on the cloud. (a) Virtual machines (VMs) on theQingCloud; (b) VMs on the Alibaba Cloud.
In the distributed environment, spatial data and algorithms can be dispersed on the same node ordistributed to different nodes; a model will integrate with the algorithms of distributed servers viaWPSs in practical applications. Therefore, we designed three test schemes to distribute the geosciencealgorithms and geospatial data on different nodes to simulate various geographical distributions ofthe geoscience algorithms and data. All data are published as WCS and WFS via GeoServer 2.13.3,which allows considerable flexibility in map creation and data sharing by using OGC standards.The geoscience algorithms are published as WPSs via 52◦ North, which is open-source software formanaging and publishing WPSs. The model execution engine is built via Eclipse and the BPEL 2.0Library, and the integrated geoscience model is executed via Apache ODE. To compare with thetraditional single-machine-based method, in Test 4, the same model is built via the ArcGIS ModelBuilder and executed on a machine. The four test schemes are as follows:
1. Test 1: No data transmission, and the data and processing methods are in the same cloud node;this scenario tests the proposed geoscience algorithm integration method in the single node andit can be used by the distributed users.
ISPRS Int. J. Geo-Inf. 2019, 8, 12 11 of 16
2. Test 2: Only partial data (i.e., DEM data) are acquired by distributed transmission, and theother required data and processing methods are on one cloud node. This test scenario tests theexecution of the proposed geoscience algorithm integration method between two organizationsand can be used by the distributed users.
3. Test 3: Full data transmission, and the data and all algorithms are on different cloud nodes. In thistest situation, the data and geoscience algorithms are built by distributed users; this scenario teststhe proposed geoscience algorithm integration method over a wide area and it can be used by thedistributed users.
4. Test 4: Building the same workflow via ArcGIS Model Builder and executing it on a singlemachine. The test is usually configured by the users of one organization or institute and it canonly be used on a single machine.
The four different approaches are compared and analyzed using different data volumes anddifferent network bandwidths (e.g., 1 Mbps, 5 Mbps, 10 Mbps, and 20 Mbps). The sizes of the datasetsare shown in Table 2.
Table 2. The DEM data parameters.
DEM Columns and Rows Cell Size Data Size
DEM 1 1156 × 919 30 × 30 m 2 MBDEM 2 3600 × 3600 30 × 30 m 20 MBDEM 3 8334 × 6548 30 × 30 m 100 MBDEM 4 18,118 × 14,235 30 × 30 m 500 MB
4.2. River Network Extraction Results of Geoscience Algorithm Integration
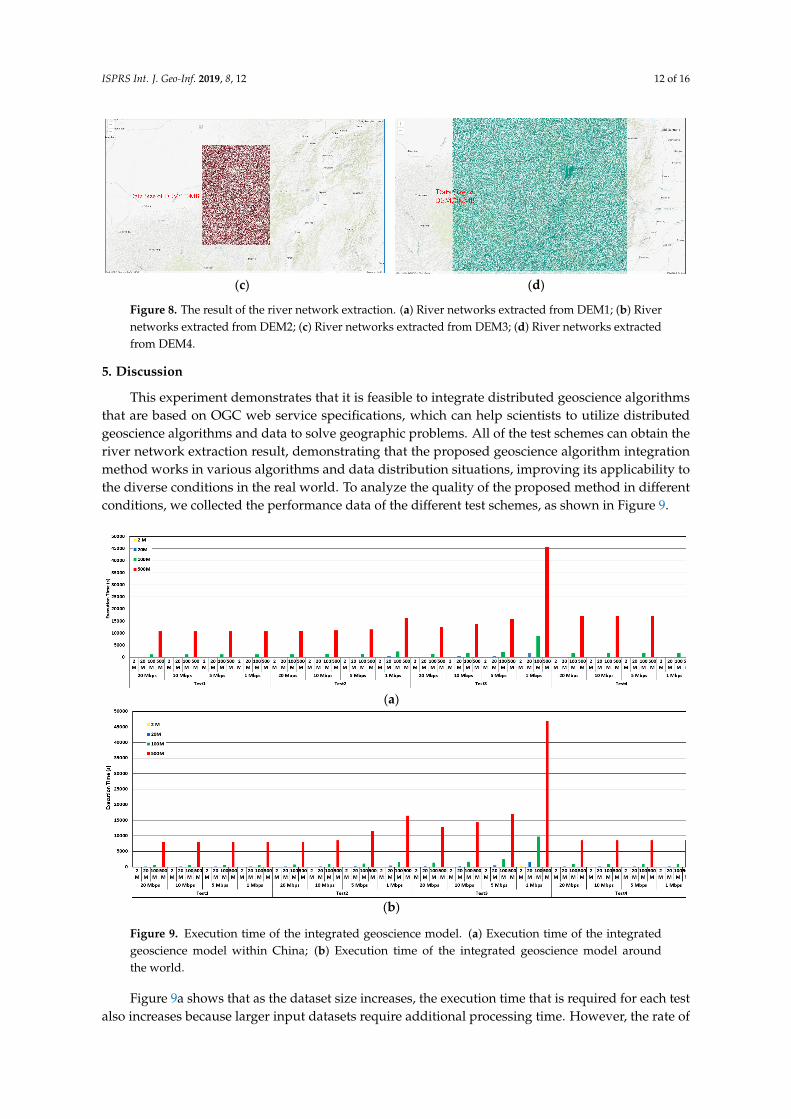
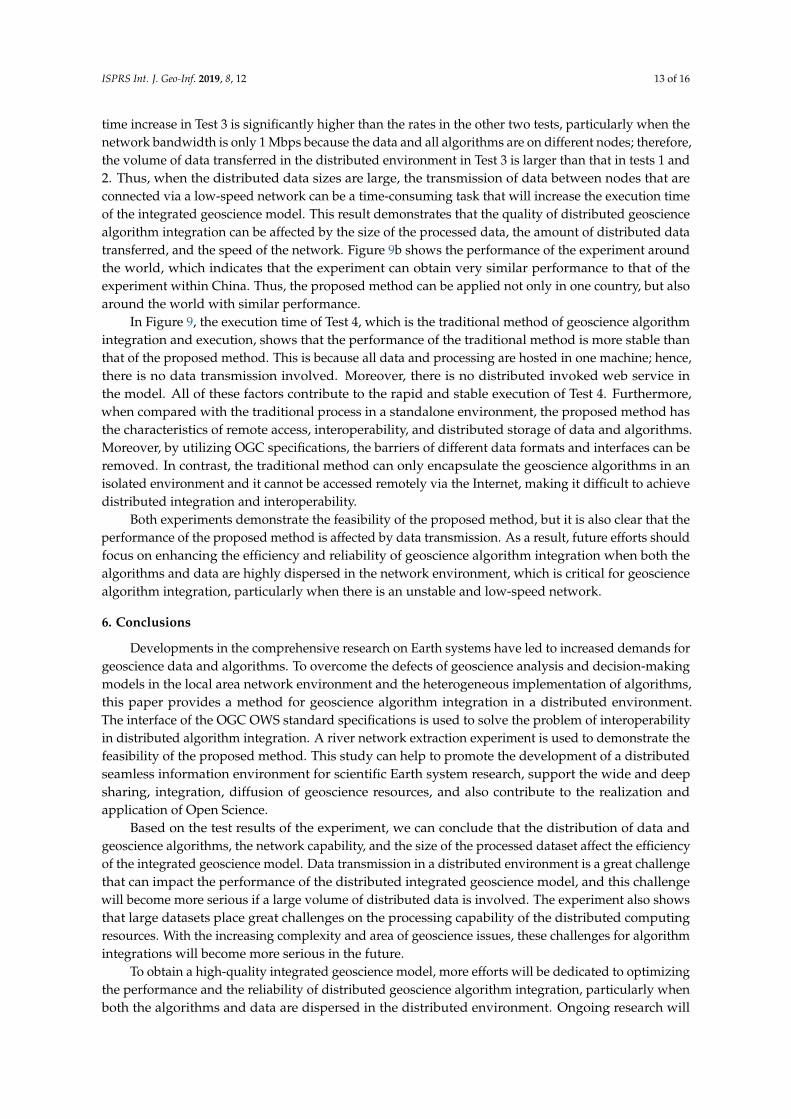
The integrated model utilizes DEM data as the input data and it returns the results of the rivernetwork in GML format after processing. The first three test schemes can execute the integratedgeoscience model and obtain the results successfully. After the execution of the integrated geosciencealgorithms, a GML-based result is produced. Through parsing the GML results, the vector dataresult is created. In Test 4, the model is executed on the ArcGIS platform, resulting in a shapefileformat. The vector data are then overlapped with an ESRI web map, and the final results are shown inFigure 8a–d, corresponding to the DEM data sizes of 2 MB, 20 MB, 100 MB, and 500 MB, respectively.The vector lines are the extracted river network in the study area, reflecting the size of the data atdifferent distribution ranges, and the background is an ESRI web map.
ISPRS Int. J. Geo-Inf. 2019, 8, x FOR PEER REVIEW 11 of 16
Library, and the integrated geoscience model is executed via Apache ODE. To compare with the traditional single-machine-based method, in Test 4, the same model is built via the ArcGIS Model Builder and executed on a machine. The four test schemes are as follows:
1. Test 1: No data transmission, and the data and processing methods are in the same cloud node; this scenario tests the proposed geoscience algorithm integration method in the single node and it can be used by the distributed users.
2. Test 2: Only partial data (i.e., DEM data) are acquired by distributed transmission, and the other required data and processing methods are on one cloud node. This test scenario tests the execution of the proposed geoscience algorithm integration method between two organizations and can be used by the distributed users.
3. Test 3: Full data transmission, and the data and all algorithms are on different cloud nodes. In this test situation, the data and geoscience algorithms are built by distributed users; this scenario tests the proposed geoscience algorithm integration method over a wide area and it can be used by the distributed users.
4. Test 4: Building the same workflow via ArcGIS Model Builder and executing it on a single machine. The test is usually configured by the users of one organization or institute and it can only be used on a single machine.
The four different approaches are compared and analyzed using different data volumes and different network bandwidths (e.g., 1 Mbps, 5 Mbps, 10 Mbps, and 20 Mbps). The sizes of the datasets are shown in Table 2.
Table 2. The DEM data parameters.
DEM Columns and Rows Cell Size Data Size DEM 1 1156 × 919 30 × 30 m 2 MB DEM 2 3600 × 3600 30 × 30 m 20 MB DEM 3 8334 × 6548 30 × 30 m 100 MB DEM 4 18,118 × 14,235 30 × 30 m 500 MB
4.2. River Network Extraction Results of Geoscience Algorithm Integration
The integrated model utilizes DEM data as the input data and it returns the results of the river network in GML format after processing. The first three test schemes can execute the integrated geoscience model and obtain the results successfully. After the execution of the integrated geoscience algorithms, a GML-based result is produced. Through parsing the GML results, the vector data result is created. In Test 4, the model is executed on the ArcGIS platform, resulting in a shapefile format. The vector data are then overlapped with an ESRI web map, and the final results are shown in Figure 8a–d, corresponding to the DEM data sizes of 2 MB, 20 MB, 100 MB, and 500 MB, respectively. The vector lines are the extracted river network in the study area, reflecting the size of the data at different distribution ranges, and the background is an ESRI web map.
(a) (b)
Figure 8. Cont.
ISPRS Int. J. Geo-Inf. 2019, 8, 12 12 of 16
ISPRS Int. J. Geo-Inf. 2019, 8, x FOR PEER REVIEW 12 of 16
(c) (d)
Figure 8. The result of the river network extraction. (a) River networks extracted from DEM1; (b) River networks extracted from DEM2; (c) River networks extracted from DEM3; (d) River networks extracted from DEM4.
5. Discussion
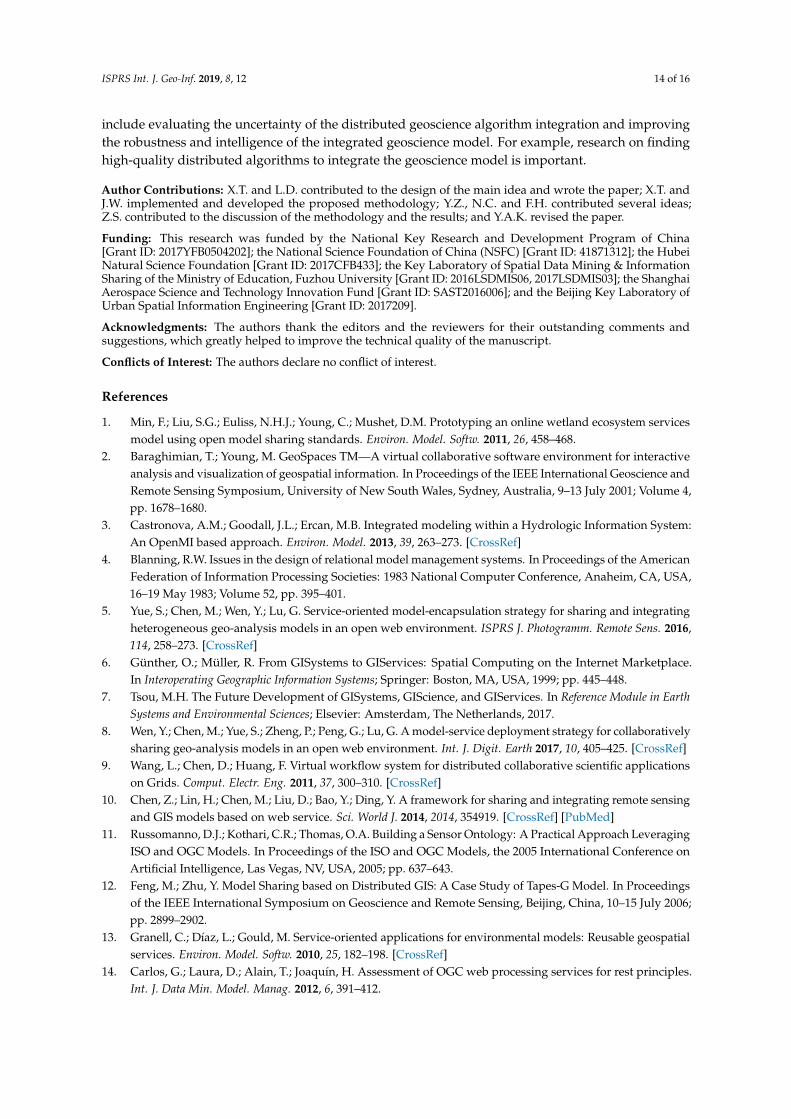
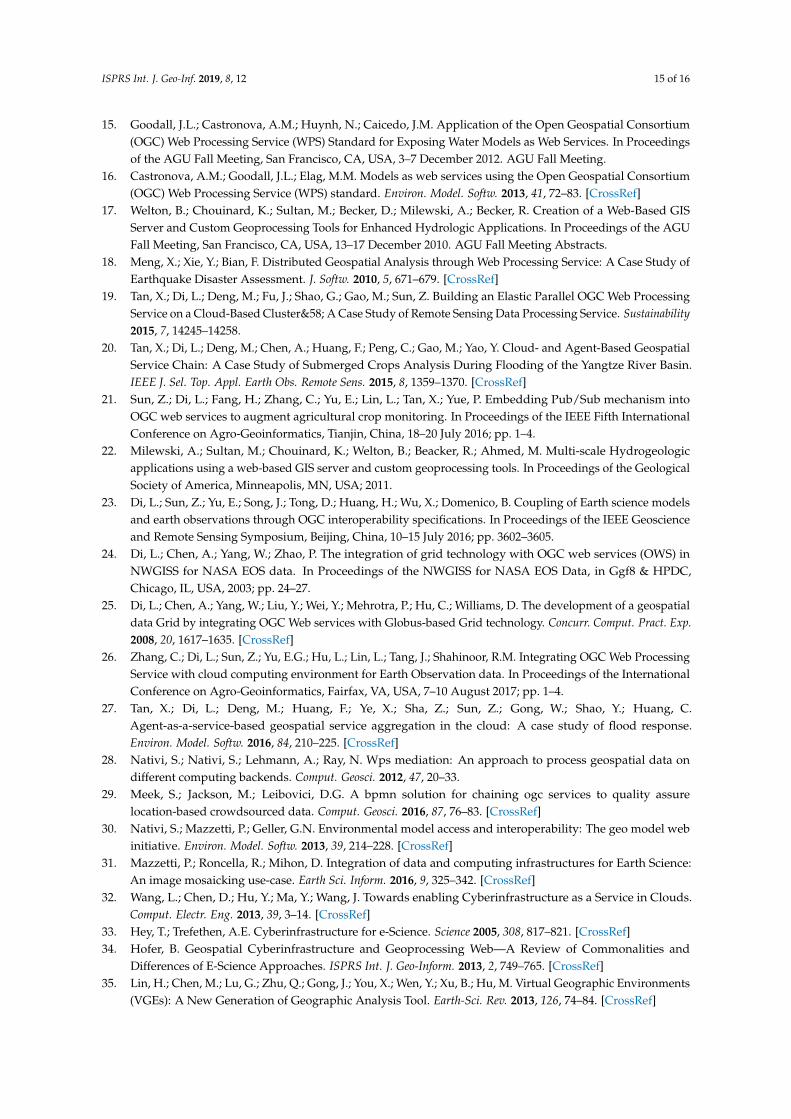
This experiment demonstrates that it is feasible to integrate distributed geoscience algorithms that are based on OGC web service specifications, which can help scientists to utilize distributed geoscience algorithms and data to solve geographic problems. All of the test schemes can obtain the river network extraction result, demonstrating that the proposed geoscience algorithm integration method works in various algorithms and data distribution situations, improving its applicability to the diverse conditions in the real world. To analyze the quality of the proposed method in different conditions, we collected the performance data of the different test schemes, as shown in Figure 9.
(a)
(b)
Figure 9 Execution time of the integrated geoscience model. (a) Execution time of the integrated geoscience model within China; (b) Execution time of the integrated geoscience model around the world.
Figure 9a shows that as the dataset size increases, the execution time that is required for each test also increases because larger input datasets require additional processing time. However, the rate of time increase in Test 3 is significantly higher than the rates in the other two tests, particularly when the network bandwidth is only 1 Mbps because the data and all algorithms are on different nodes;
Figure 8. The result of the river network extraction. (a) River networks extracted from DEM1; (b) Rivernetworks extracted from DEM2; (c) River networks extracted from DEM3; (d) River networks extractedfrom DEM4.
5. Discussion
This experiment demonstrates that it is feasible to integrate distributed geoscience algorithmsthat are based on OGC web service specifications, which can help scientists to utilize distributedgeoscience algorithms and data to solve geographic problems. All of the test schemes can obtain theriver network extraction result, demonstrating that the proposed geoscience algorithm integrationmethod works in various algorithms and data distribution situations, improving its applicability tothe diverse conditions in the real world. To analyze the quality of the proposed method in differentconditions, we collected the performance data of the different test schemes, as shown in Figure 9.
ISPRS Int. J. Geo-Inf. 2019, 8, x FOR PEER REVIEW 12 of 16
(c) (d)
Figure 8. The result of the river network extraction. (a) River networks extracted from DEM1; (b) River networks extracted from DEM2; (c) River networks extracted from DEM3; (d) River networks extracted from DEM4.
5. Discussion
This experiment demonstrates that it is feasible to integrate distributed geoscience algorithms that are based on OGC web service specifications, which can help scientists to utilize distributed geoscience algorithms and data to solve geographic problems. All of the test schemes can obtain the river network extraction result, demonstrating that the proposed geoscience algorithm integration method works in various algorithms and data distribution situations, improving its applicability to the diverse conditions in the real world. To analyze the quality of the proposed method in different conditions, we collected the performance data of the different test schemes, as shown in Figure 9.
(a)
(b)
Figure 9 Execution time of the integrated geoscience model. (a) Execution time of the integrated geoscience model within China; (b) Execution time of the integrated geoscience model around the world.
Figure 9a shows that as the dataset size increases, the execution time that is required for each test also increases because larger input datasets require additional processing time. However, the rate of time increase in Test 3 is significantly higher than the rates in the other two tests, particularly when the network bandwidth is only 1 Mbps because the data and all algorithms are on different nodes;
Figure 9. Execution time of the integrated geoscience model. (a) Execution time of the integratedgeoscience model within China; (b) Execution time of the integrated geoscience model aroundthe world.
Figure 9a shows that as the dataset size increases, the execution time that is required for each testalso increases because larger input datasets require additional processing time. However, the rate of
ISPRS Int. J. Geo-Inf. 2019, 8, 12 13 of 16
time increase in Test 3 is significantly higher than the rates in the other two tests, particularly when thenetwork bandwidth is only 1 Mbps because the data and all algorithms are on different nodes; therefore,the volume of data transferred in the distributed environment in Test 3 is larger than that in tests 1 and2. Thus, when the distributed data sizes are large, the transmission of data between nodes that areconnected via a low-speed network can be a time-consuming task that will increase the execution timeof the integrated geoscience model. This result demonstrates that the quality of distributed geosciencealgorithm integration can be affected by the size of the processed data, the amount of distributed datatransferred, and the speed of the network. Figure 9b shows the performance of the experiment aroundthe world, which indicates that the experiment can obtain very similar performance to that of theexperiment within China. Thus, the proposed method can be applied not only in one country, but alsoaround the world with similar performance.
In Figure 9, the execution time of Test 4, which is the traditional method of geoscience algorithmintegration and execution, shows that the performance of the traditional method is more stable thanthat of the proposed method. This is because all data and processing are hosted in one machine; hence,there is no data transmission involved. Moreover, there is no distributed invoked web service inthe model. All of these factors contribute to the rapid and stable execution of Test 4. Furthermore,when compared with the traditional process in a standalone environment, the proposed method hasthe characteristics of remote access, interoperability, and distributed storage of data and algorithms.Moreover, by utilizing OGC specifications, the barriers of different data formats and interfaces can beremoved. In contrast, the traditional method can only encapsulate the geoscience algorithms in anisolated environment and it cannot be accessed remotely via the Internet, making it difficult to achievedistributed integration and interoperability.
Both experiments demonstrate the feasibility of the proposed method, but it is also clear that theperformance of the proposed method is affected by data transmission. As a result, future efforts shouldfocus on enhancing the efficiency and reliability of geoscience algorithm integration when both thealgorithms and data are highly dispersed in the network environment, which is critical for geosciencealgorithm integration, particularly when there is an unstable and low-speed network.
6. Conclusions
Developments in the comprehensive research on Earth systems have led to increased demands forgeoscience data and algorithms. To overcome the defects of geoscience analysis and decision-makingmodels in the local area network environment and the heterogeneous implementation of algorithms,this paper provides a method for geoscience algorithm integration in a distributed environment.The interface of the OGC OWS standard specifications is used to solve the problem of interoperabilityin distributed algorithm integration. A river network extraction experiment is used to demonstrate thefeasibility of the proposed method. This study can help to promote the development of a distributedseamless information environment for scientific Earth system research, support the wide and deepsharing, integration, diffusion of geoscience resources, and also contribute to the realization andapplication of Open Science.
Based on the test results of the experiment, we can conclude that the distribution of data andgeoscience algorithms, the network capability, and the size of the processed dataset affect the efficiencyof the integrated geoscience model. Data transmission in a distributed environment is a great challengethat can impact the performance of the distributed integrated geoscience model, and this challengewill become more serious if a large volume of distributed data is involved. The experiment also showsthat large datasets place great challenges on the processing capability of the distributed computingresources. With the increasing complexity and area of geoscience issues, these challenges for algorithmintegrations will become more serious in the future.
To obtain a high-quality integrated geoscience model, more efforts will be dedicated to optimizingthe performance and the reliability of distributed geoscience algorithm integration, particularly whenboth the algorithms and data are dispersed in the distributed environment. Ongoing research will
ISPRS Int. J. Geo-Inf. 2019, 8, 12 14 of 16
include evaluating the uncertainty of the distributed geoscience algorithm integration and improvingthe robustness and intelligence of the integrated geoscience model. For example, research on findinghigh-quality distributed algorithms to integrate the geoscience model is important.
Author Contributions: X.T. and L.D. contributed to the design of the main idea and wrote the paper; X.T. andJ.W. implemented and developed the proposed methodology; Y.Z., N.C. and F.H. contributed several ideas;Z.S. contributed to the discussion of the methodology and the results; and Y.A.K. revised the paper.
Funding: This research was funded by the National Key Research and Development Program of China[Grant ID: 2017YFB0504202]; the National Science Foundation of China (NSFC) [Grant ID: 41871312]; the HubeiNatural Science Foundation [Grant ID: 2017CFB433]; the Key Laboratory of Spatial Data Mining & InformationSharing of the Ministry of Education, Fuzhou University [Grant ID: 2016LSDMIS06, 2017LSDMIS03]; the ShanghaiAerospace Science and Technology Innovation Fund [Grant ID: SAST2016006]; and the Beijing Key Laboratory ofUrban Spatial Information Engineering [Grant ID: 2017209].
Acknowledgments: The authors thank the editors and the reviewers for their outstanding comments andsuggestions, which greatly helped to improve the technical quality of the manuscript.
Conflicts of Interest: The authors declare no conflict of interest.
References
1. Min, F.; Liu, S.G.; Euliss, N.H.J.; Young, C.; Mushet, D.M. Prototyping an online wetland ecosystem servicesmodel using open model sharing standards. Environ. Model. Softw. 2011, 26, 458–468.
2. Baraghimian, T.; Young, M. GeoSpaces TM—A virtual collaborative software environment for interactiveanalysis and visualization of geospatial information. In Proceedings of the IEEE International Geoscience andRemote Sensing Symposium, University of New South Wales, Sydney, Australia, 9–13 July 2001; Volume 4,pp. 1678–1680.
3. Castronova, A.M.; Goodall, J.L.; Ercan, M.B. Integrated modeling within a Hydrologic Information System:An OpenMI based approach. Environ. Model. 2013, 39, 263–273. [CrossRef]
4. Blanning, R.W. Issues in the design of relational model management systems. In Proceedings of the AmericanFederation of Information Processing Societies: 1983 National Computer Conference, Anaheim, CA, USA,16–19 May 1983; Volume 52, pp. 395–401.
5. Yue, S.; Chen, M.; Wen, Y.; Lu, G. Service-oriented model-encapsulation strategy for sharing and integratingheterogeneous geo-analysis models in an open web environment. ISPRS J. Photogramm. Remote Sens. 2016,114, 258–273. [CrossRef]
6. Günther, O.; Müller, R. From GISystems to GIServices: Spatial Computing on the Internet Marketplace.In Interoperating Geographic Information Systems; Springer: Boston, MA, USA, 1999; pp. 445–448.
7. Tsou, M.H. The Future Development of GISystems, GIScience, and GIServices. In Reference Module in EarthSystems and Environmental Sciences; Elsevier: Amsterdam, The Netherlands, 2017.
8. Wen, Y.; Chen, M.; Yue, S.; Zheng, P.; Peng, G.; Lu, G. A model-service deployment strategy for collaborativelysharing geo-analysis models in an open web environment. Int. J. Digit. Earth 2017, 10, 405–425. [CrossRef]
9. Wang, L.; Chen, D.; Huang, F. Virtual workflow system for distributed collaborative scientific applicationson Grids. Comput. Electr. Eng. 2011, 37, 300–310. [CrossRef]
10. Chen, Z.; Lin, H.; Chen, M.; Liu, D.; Bao, Y.; Ding, Y. A framework for sharing and integrating remote sensingand GIS models based on web service. Sci. World J. 2014, 2014, 354919. [CrossRef] [PubMed]
11. Russomanno, D.J.; Kothari, C.R.; Thomas, O.A. Building a Sensor Ontology: A Practical Approach LeveragingISO and OGC Models. In Proceedings of the ISO and OGC Models, the 2005 International Conference onArtificial Intelligence, Las Vegas, NV, USA, 2005; pp. 637–643.
12. Feng, M.; Zhu, Y. Model Sharing based on Distributed GIS: A Case Study of Tapes-G Model. In Proceedingsof the IEEE International Symposium on Geoscience and Remote Sensing, Beijing, China, 10–15 July 2006;pp. 2899–2902.
13. Granell, C.; Díaz, L.; Gould, M. Service-oriented applications for environmental models: Reusable geospatialservices. Environ. Model. Softw. 2010, 25, 182–198. [CrossRef]
14. Carlos, G.; Laura, D.; Alain, T.; Joaquín, H. Assessment of OGC web processing services for rest principles.Int. J. Data Min. Model. Manag. 2012, 6, 391–412.
ISPRS Int. J. Geo-Inf. 2019, 8, 12 15 of 16
15. Goodall, J.L.; Castronova, A.M.; Huynh, N.; Caicedo, J.M. Application of the Open Geospatial Consortium(OGC) Web Processing Service (WPS) Standard for Exposing Water Models as Web Services. In Proceedingsof the AGU Fall Meeting, San Francisco, CA, USA, 3–7 December 2012. AGU Fall Meeting.
16. Castronova, A.M.; Goodall, J.L.; Elag, M.M. Models as web services using the Open Geospatial Consortium(OGC) Web Processing Service (WPS) standard. Environ. Model. Softw. 2013, 41, 72–83. [CrossRef]
17. Welton, B.; Chouinard, K.; Sultan, M.; Becker, D.; Milewski, A.; Becker, R. Creation of a Web-Based GISServer and Custom Geoprocessing Tools for Enhanced Hydrologic Applications. In Proceedings of the AGUFall Meeting, San Francisco, CA, USA, 13–17 December 2010. AGU Fall Meeting Abstracts.
18. Meng, X.; Xie, Y.; Bian, F. Distributed Geospatial Analysis through Web Processing Service: A Case Study ofEarthquake Disaster Assessment. J. Softw. 2010, 5, 671–679. [CrossRef]
19. Tan, X.; Di, L.; Deng, M.; Fu, J.; Shao, G.; Gao, M.; Sun, Z. Building an Elastic Parallel OGC Web ProcessingService on a Cloud-Based Cluster&58; A Case Study of Remote Sensing Data Processing Service. Sustainability2015, 7, 14245–14258.
20. Tan, X.; Di, L.; Deng, M.; Chen, A.; Huang, F.; Peng, C.; Gao, M.; Yao, Y. Cloud- and Agent-Based GeospatialService Chain: A Case Study of Submerged Crops Analysis During Flooding of the Yangtze River Basin.IEEE J. Sel. Top. Appl. Earth Obs. Remote Sens. 2015, 8, 1359–1370. [CrossRef]
21. Sun, Z.; Di, L.; Fang, H.; Zhang, C.; Yu, E.; Lin, L.; Tan, X.; Yue, P. Embedding Pub/Sub mechanism intoOGC web services to augment agricultural crop monitoring. In Proceedings of the IEEE Fifth InternationalConference on Agro-Geoinformatics, Tianjin, China, 18–20 July 2016; pp. 1–4.
22. Milewski, A.; Sultan, M.; Chouinard, K.; Welton, B.; Beacker, R.; Ahmed, M. Multi-scale Hydrogeologicapplications using a web-based GIS server and custom geoprocessing tools. In Proceedings of the GeologicalSociety of America, Minneapolis, MN, USA; 2011.
23. Di, L.; Sun, Z.; Yu, E.; Song, J.; Tong, D.; Huang, H.; Wu, X.; Domenico, B. Coupling of Earth science modelsand earth observations through OGC interoperability specifications. In Proceedings of the IEEE Geoscienceand Remote Sensing Symposium, Beijing, China, 10–15 July 2016; pp. 3602–3605.
24. Di, L.; Chen, A.; Yang, W.; Zhao, P. The integration of grid technology with OGC web services (OWS) inNWGISS for NASA EOS data. In Proceedings of the NWGISS for NASA EOS Data, in Ggf8 & HPDC,Chicago, IL, USA, 2003; pp. 24–27.
25. Di, L.; Chen, A.; Yang, W.; Liu, Y.; Wei, Y.; Mehrotra, P.; Hu, C.; Williams, D. The development of a geospatialdata Grid by integrating OGC Web services with Globus-based Grid technology. Concurr. Comput. Pract. Exp.2008, 20, 1617–1635. [CrossRef]
26. Zhang, C.; Di, L.; Sun, Z.; Yu, E.G.; Hu, L.; Lin, L.; Tang, J.; Shahinoor, R.M. Integrating OGC Web ProcessingService with cloud computing environment for Earth Observation data. In Proceedings of the InternationalConference on Agro-Geoinformatics, Fairfax, VA, USA, 7–10 August 2017; pp. 1–4.
27. Tan, X.; Di, L.; Deng, M.; Huang, F.; Ye, X.; Sha, Z.; Sun, Z.; Gong, W.; Shao, Y.; Huang, C.Agent-as-a-service-based geospatial service aggregation in the cloud: A case study of flood response.Environ. Model. Softw. 2016, 84, 210–225. [CrossRef]
28. Nativi, S.; Nativi, S.; Lehmann, A.; Ray, N. Wps mediation: An approach to process geospatial data ondifferent computing backends. Comput. Geosci. 2012, 47, 20–33.
29. Meek, S.; Jackson, M.; Leibovici, D.G. A bpmn solution for chaining ogc services to quality assurelocation-based crowdsourced data. Comput. Geosci. 2016, 87, 76–83. [CrossRef]
30. Nativi, S.; Mazzetti, P.; Geller, G.N. Environmental model access and interoperability: The geo model webinitiative. Environ. Model. Softw. 2013, 39, 214–228. [CrossRef]
31. Mazzetti, P.; Roncella, R.; Mihon, D. Integration of data and computing infrastructures for Earth Science:An image mosaicking use-case. Earth Sci. Inform. 2016, 9, 325–342. [CrossRef]
32. Wang, L.; Chen, D.; Hu, Y.; Ma, Y.; Wang, J. Towards enabling Cyberinfrastructure as a Service in Clouds.Comput. Electr. Eng. 2013, 39, 3–14. [CrossRef]
33. Hey, T.; Trefethen, A.E. Cyberinfrastructure for e-Science. Science 2005, 308, 817–821. [CrossRef]34. Hofer, B. Geospatial Cyberinfrastructure and Geoprocessing Web—A Review of Commonalities and
Differences of E-Science Approaches. ISPRS Int. J. Geo-Inform. 2013, 2, 749–765. [CrossRef]35. Lin, H.; Chen, M.; Lu, G.; Zhu, Q.; Gong, J.; You, X.; Wen, Y.; Xu, B.; Hu, M. Virtual Geographic Environments
(VGEs): A New Generation of Geographic Analysis Tool. Earth-Sci. Rev. 2013, 126, 74–84. [CrossRef]
ISPRS Int. J. Geo-Inf. 2019, 8, 12 16 of 16
36. Chen, M. Managing and sharing geographic knowledge in virtual geographic environments (VGEs). Ann.GIS2015, 21, 261–263.
37. Chen, M.; Lin, H.; Kolditz, O.; Chen, C. Developing dynamic virtual geographic environments (VGEs) forgeographic research. Environ. Earth Sci. 2015, 74, 6975–6980. [CrossRef]
38. Zhang, C.; Chen, M.; Li, R.; Ding, Y.; Lin, H. A virtual geographic environment system for multiscale airquality analysis and decision making: A case study of SO2, concentration simulation. Appl. Geogr. 2015, 63,326–336. [CrossRef]
39. GIS in the Cloud. Available online: http://www.esri.com/library/whitepapers/pdfs/gis-in-the-cloud-chappell.pdf (accessed on 17 November 2018).
40. Mapping and GeoSpatial Analysis in Amazon Web Services Using ArcGIS. Available online: https://aws.amazon.com/cn/whitepapers/mapping-geospatial-analysis-arcgis/ (accessed on 17 November 2018).
© 2018 by the authors. Licensee MDPI, Basel, Switzerland. This article is an open accessarticle distributed under the terms and conditions of the Creative Commons Attribution(CC BY) license (http://creativecommons.org/licenses/by/4.0/).