Embed Size (px)
Citation preview
1
Distributed Energy Resources: Maintaining Reliability & Integrating New Technology
Solar Stakeholder Collaborative for the District of Columbia
August 30, 2016 - Morning Session
2
Welcome to Pepco Holdings’ Distributed Energy Resources (DER) Meeting with Stakeholders
Purpose of this Meeting:
• Share information with our stakeholders concerning the implementation of DER and related topics
• Present a comprehensive review of established practices and policies
• Hear from stakeholders on questions, concerns and comments to help Pepco Holdings finalize design criteria
3
Background
March 23, 2016 - PHI completed its merger with Exelon, remaining committed to improved and enhanced facilitation of the interconnection of DER in the power delivery system
May 3, 2016 – PHI held a webinar for stakeholders on maintaining reliability and integrating new DER technology
June 21, 2016 – PHI utilities submitted a detailed report “Interconnection
of Distributed Energy Resources” in each utility’s service territory
Today – PHI and stakeholders hold a collaborative discussion on current processes and future plans related to DER
4
Overview of Meeting Discussion Topics:
• Interconnection Technical Review & Criteria Limits • DER Modeling Methodology and Tools • NREL/EPRI Survey of Utility Practice • Incorporating and Evaluating Energy Storage • Accounting for DER in the Distribution Planning Process
- Lunch/Break
• Green Power Connection (GPC) Enhanced Communication Plan -
Afternoon
5
Technical Review & Criteria Limits
Presented by Evan Hebert, Engineer
April 7, 2016
6
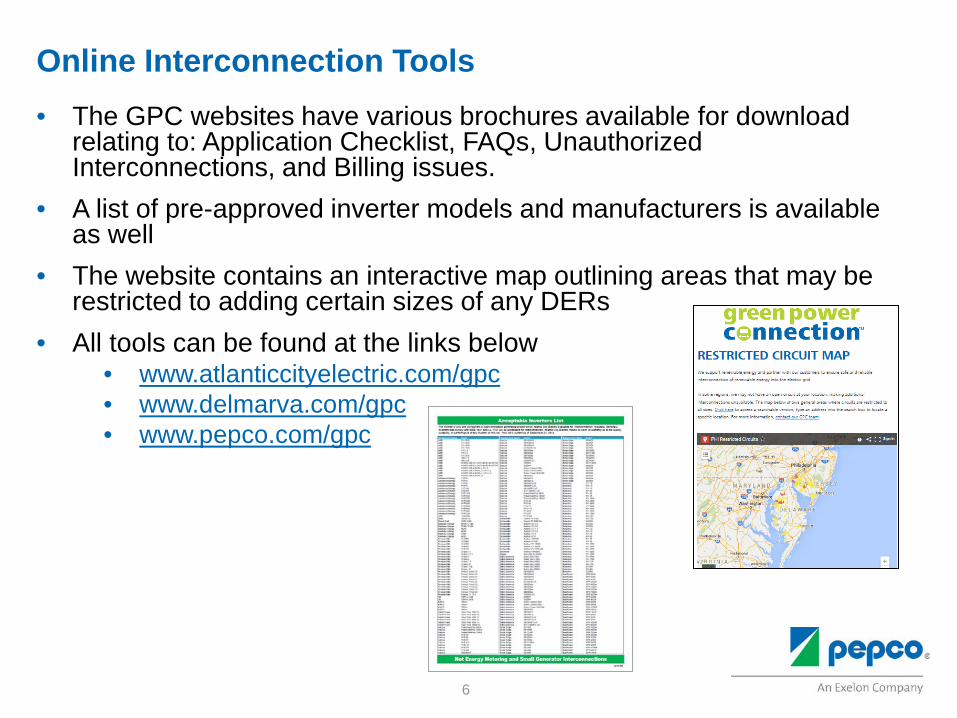
Online Interconnection Tools • The GPC websites have various brochures available for download
relating to: Application Checklist, FAQs, Unauthorized Interconnections, and Billing issues.
• A list of pre-approved inverter models and manufacturers is available as well
• The website contains an interactive map outlining areas that may be restricted to adding certain sizes of any DERs
• All tools can be found at the links below • www.atlanticcityelectric.com/gpc • www.delmarva.com/gpc • www.pepco.com/gpc
7
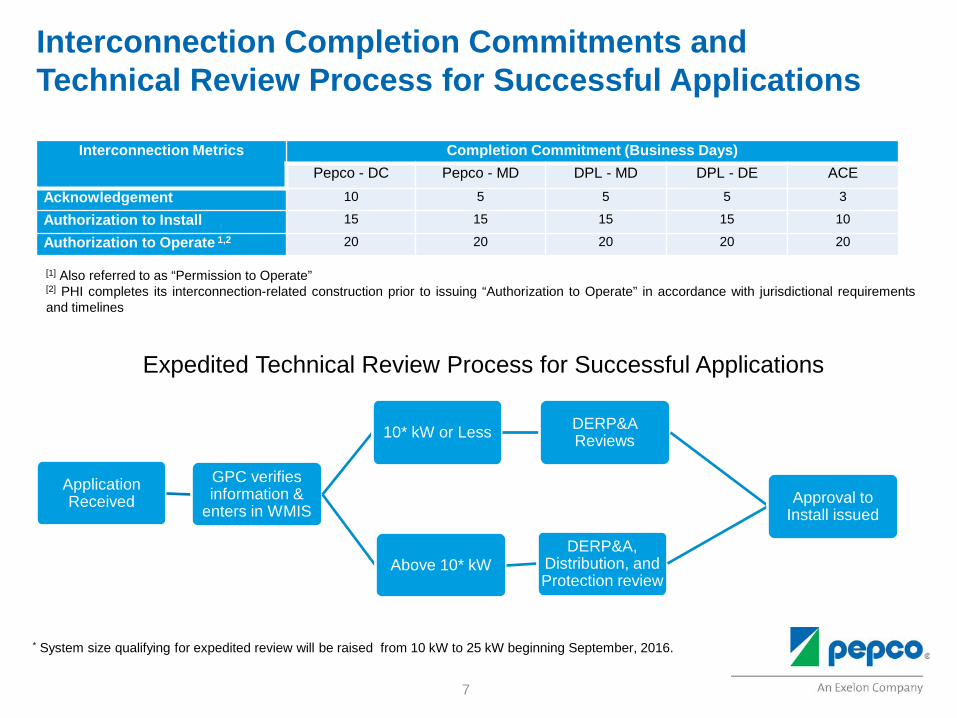
Application Received
GPC verifies information &
enters in WMIS
10* kW or Less DERP&A Reviews
Above 10* kW DERP&A,
Distribution, and Protection review
Approval to Install issued
Interconnection Completion Commitments and Technical Review Process for Successful Applications
Interconnection Metrics Completion Commitment (Business Days) Pepco - DC Pepco - MD DPL - MD DPL - DE ACE
Acknowledgement 10 5 5 5 3
Authorization to Install 15 15 15 15 10
Authorization to Operate 1,2 20 20 20 20 20
[1] Also referred to as “Permission to Operate” [2] PHI completes its interconnection-related construction prior to issuing “Authorization to Operate” in accordance with jurisdictional requirements and timelines
Expedited Technical Review Process for Successful Applications
* System size qualifying for expedited review will be raised from 10 kW to 25 kW beginning September, 2016.
8
Overview of Revised Technical Analysis
PHI’s criteria limits are designed to identify the potential for detrimental technical conditions that impact the power quality at the customer level and/or the reliability of the distribution system: High- and low-voltage conditions Voltage fluctuations Frequency deviations Harmonic distortions Overcurrent (Overload & Excessive Fault Current) Excessive impacts on the reliable service life of regulating equipment Reactive power issues – power factor variations Reverse power flow on equipment not designed for it Protection and coordination issues Impacts on the transmission system Impacts on other customers
9
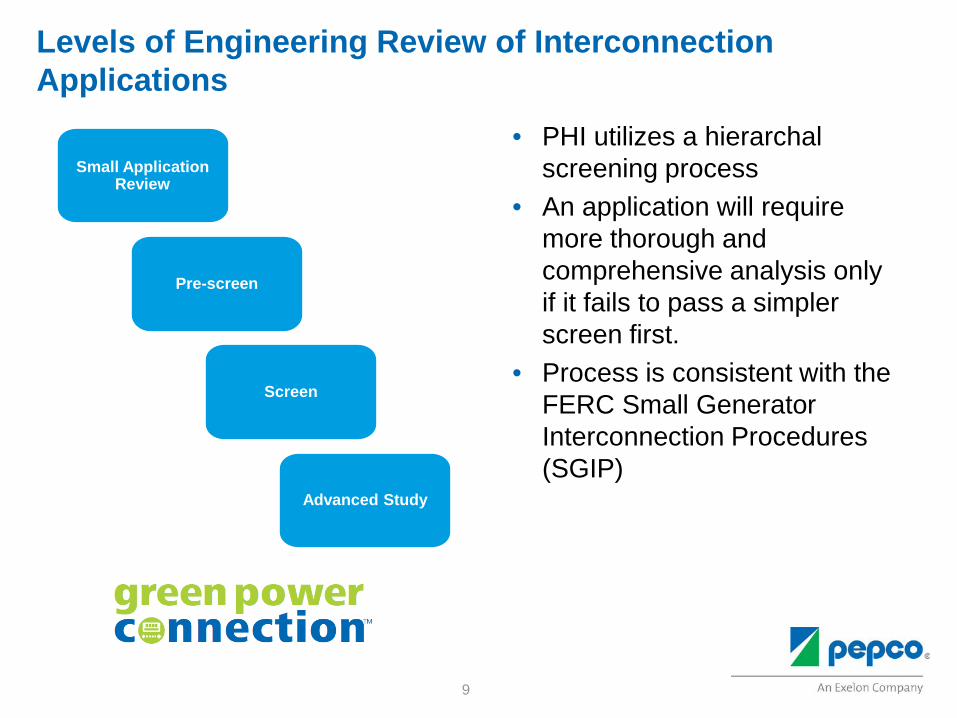
Levels of Engineering Review of Interconnection Applications
February 1, 2016
Small Application Review
Pre-screen
Screen
Advanced Study
• PHI utilizes a hierarchal screening process
• An application will require more thorough and comprehensive analysis only if it fails to pass a simpler screen first.
• Process is consistent with the FERC Small Generator Interconnection Procedures (SGIP)
10
Small System Application Review (50kW and below)
An expedited process for systems 10 kW and below has significantly improved response time and that process will be extended to 25 kW systems starting in September, 2016
Applications 25kW and below qualify for expedited review if they meet the following conditions: • Not currently served by a restricted or network feeder • Inverter is IEEE/UL certified • Total kW of PV Array(s) does not exceed the transformer rating
– Arrays that exceed 75% will receive a secondary voltage rise analysis • Typically, permission to install is received within 5 business days of
application submission
Applications that do not qualify or are between 25kW and 50kW will receive a full review by multiple engineering groups • Typically, permission to install will be received within 10-15 business
days of application submission
11
Engineering Pre-screens Required for systems between 50-250 kW Option 1: Determine distance from substation, radial or lateral
connection and voltage level • Main radial connections typically have larger wires, allowing
systems further away to interconnect without problems • Higher tolerance for larger voltage levels (25 kV vs 12 kV)
Option 2: Calculate impedance at point of interconnection (POI) Failed Pre-screen
• Distance from substation and size of system are not in the allowable range to pass the pre-screen or impedance is too high
• Screen is required • Operating requirements must be signed by customer (not required
if application passes pre-screen) • Projects that fail pre-screen or present additional issues for study
may require additional time for issuance of permission to install.
February 1, 2016
12
Engineering Screens
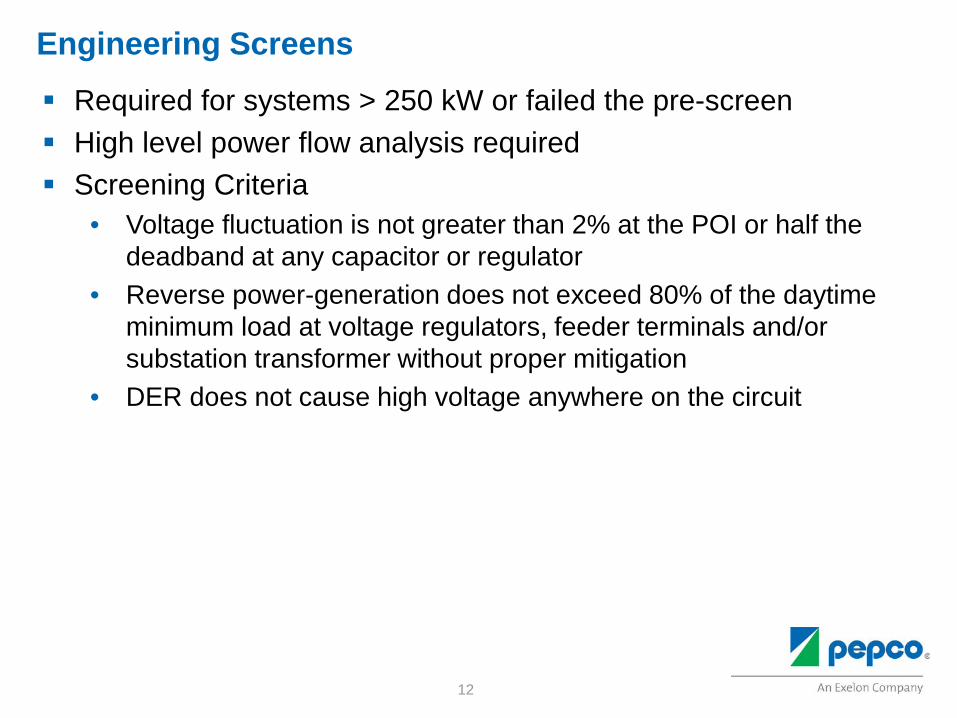
Required for systems > 250 kW or failed the pre-screen High level power flow analysis required Screening Criteria
• Voltage fluctuation is not greater than 2% at the POI or half the deadband at any capacitor or regulator
• Reverse power-generation does not exceed 80% of the daytime minimum load at voltage regulators, feeder terminals and/or substation transformer without proper mitigation
• DER does not cause high voltage anywhere on the circuit
February 1, 2016
13
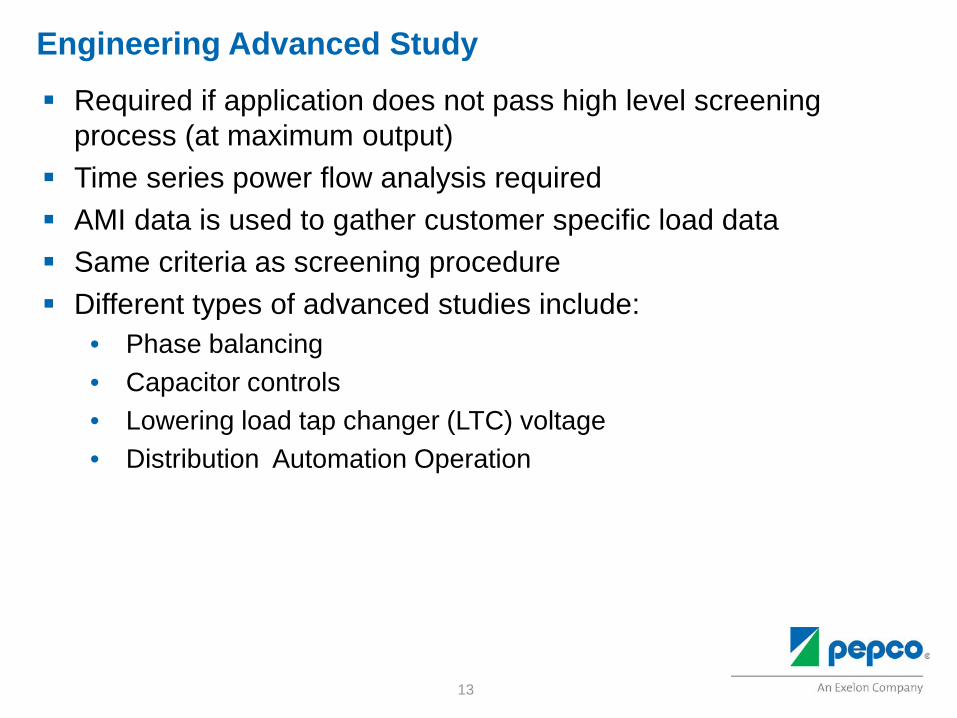
Engineering Advanced Study
Required if application does not pass high level screening process (at maximum output)
Time series power flow analysis required AMI data is used to gather customer specific load data Same criteria as screening procedure Different types of advanced studies include:
• Phase balancing • Capacitor controls • Lowering load tap changer (LTC) voltage • Distribution Automation Operation
February 1, 2016
14
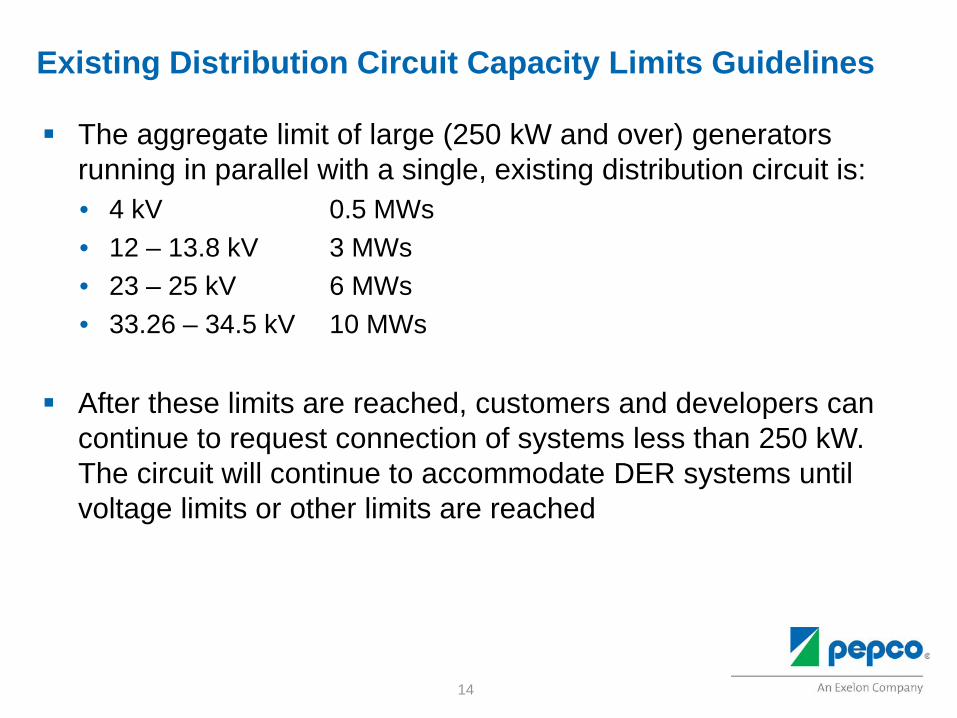
Existing Distribution Circuit Capacity Limits Guidelines
The aggregate limit of large (250 kW and over) generators running in parallel with a single, existing distribution circuit is: • 4 kV 0.5 MWs • 12 – 13.8 kV 3 MWs • 23 – 25 kV 6 MWs • 33.26 – 34.5 kV 10 MWs
After these limits are reached, customers and developers can continue to request connection of systems less than 250 kW. The circuit will continue to accommodate DER systems until voltage limits or other limits are reached
February 1, 2016
15
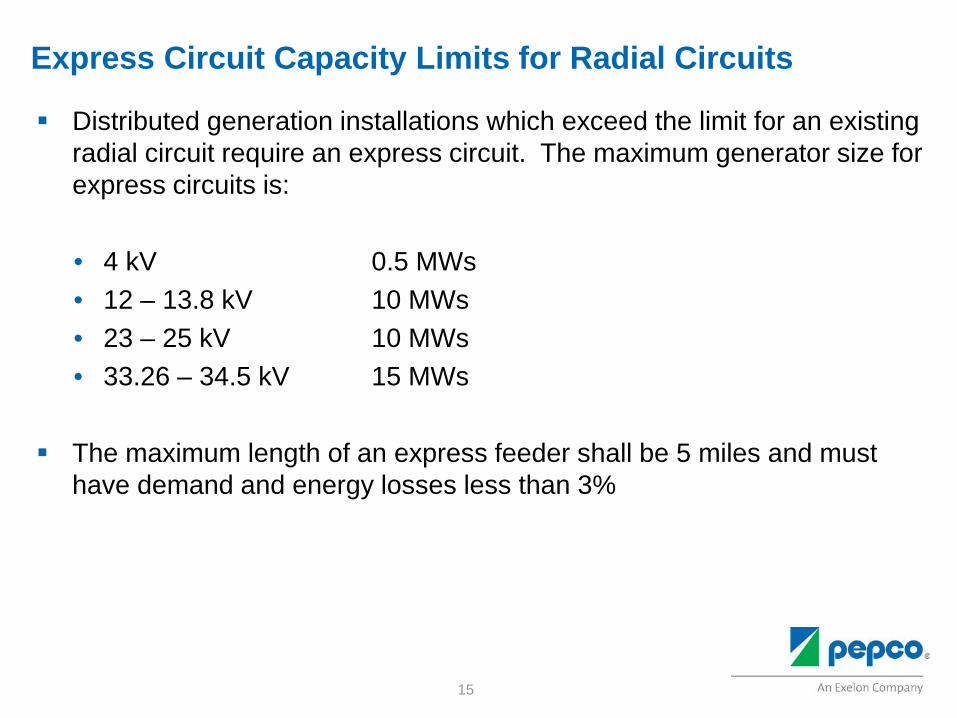
Express Circuit Capacity Limits for Radial Circuits
Distributed generation installations which exceed the limit for an existing radial circuit require an express circuit. The maximum generator size for express circuits is:
• 4 kV 0.5 MWs • 12 – 13.8 kV 10 MWs • 23 – 25 kV 10 MWs • 33.26 – 34.5 kV 15 MWs
The maximum length of an express feeder shall be 5 miles and must
have demand and energy losses less than 3%
February 1, 2016
16
Distribution Power Transformer Limit
The aggregate limit of large (250 kW and over) generator injection to a single distribution transformer of 22.5 MVA nameplate or larger is 10 MWs. Transformers with nameplate ratings lower than 22.5 MVA may be given lower generation limits.
We will consider adding a new transformer if there is no
availability on any of the existing transformers and space is available in an existing substation. Any proposed transformers would be PHI’s standard distribution transformer (37 MVA nameplate rating).
February 1, 2016
17
Spot and Area Networks — for all DER systems over 50 kW, to ensure that the proposed system output does not cause the network protector to operate, the following control scheme is required: • Customer shall install a monitoring system on the service(s) to the facility
and install inverters that can receive a control signal and curtail output to maintain the target level of import or export on each phase
• Customer system shall provide a web link and access to the utility to have read-only access to view the electrical parameters and operation of the system
• Customer system shall provide an alert to the utility via email or text message if the limit goes beyond a Company defined set point
• Customer monitoring system shall send a trip signal to the inverters if the limit goes beyond second Company determined set point and will send another alert to PHI
Network Solutions
February 1, 2016
18
Synchronous Generation Although synchronous generation must not cause high voltage or
adverse impact on automatic line equipment, there are several other criteria reviewed by Protection and Controls: Total short circuit current in relation to duty ratings of equipment The ratio of generation to minimum load in a protected section must be
less than 1/3 Coordination of fuses and reclosers must still function properly which
includes overall reach of the protecting devices. These applications normally are processed in the same manner as a
solar application but will normally require a more advanced engineering review.

19
Questions/Comments
20
DER Advanced Modeling Tools
Presented by Steve Steffel, Manager Regional Capacity Planning
February 1, 2016
21
Purpose for Pursuing Advanced Modeling Tools
• The need to do detailed time series studies for the interconnection of DER
• The ability to assess aggregate impact of DER continuing impact on the PHI electrical grid
• The need to quickly screen whether PV adoption will cause a violation
• The ability to assess the hosting capacity of radial distribution circuits or the secondary network
• The ability to model smart inverters along with other new types of DERs
• The need to understand gross load, net load and generation on each feeder
22
Advanced Modeling Software and Data
Distribution Engineering Workstation (DEW) – Software used to perform modeling and analysis
Three-phase Unbalanced Circuit Model • Build circuit maps from GIS system and models are geospatial • Simulates the movement of Voltage Regulators, Capacitors, etc. • Automatically maps all DERs to the correct location in the model • Brings in hourly load – customer load and SCADA • Interfaces and brings in historical irradiance for the specific location
Time Series Analysis • Hourly interval is standard • Finds the critical points looking at all hours of year
Measurement data (time synchronized) • Start of circuit (SCADA) • Customer load data (from AMI or profiled consumption data) • Generation measurements
23
DEW’s Advanced Modeling Tools to Complete High-Penetration PV Integration Studies Generation Time Series Analysis
• Determines the most critical time points for analysis by analyzing all intervals Minimum Daytime Load (MDL) Max Load Point Low Load Point Max PV Point Max PV/Load Ratio Max Difference Point
• Movement of utility control equipment
Generation Impact Analysis (Hourly data for critical days) • Detail Studies covering the periods of worst case circuit conditions • Analyze the loss and return of generation with and without regulation • Analyze PV power factor settings if needed
Generation Fault Analysis
• Screening & fault studies
24
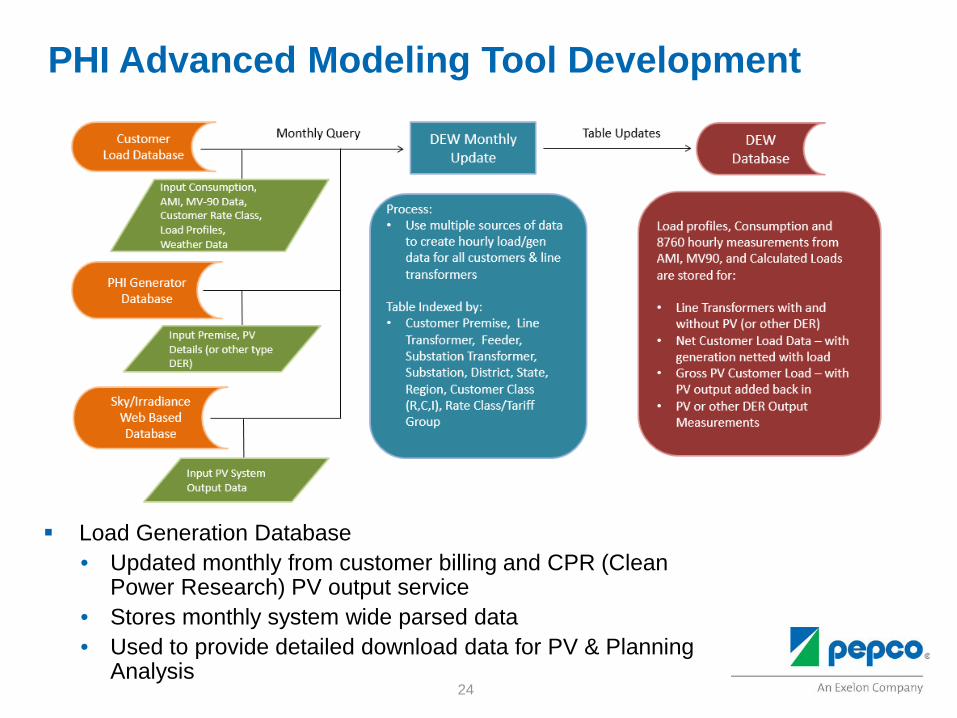
Load Generation Database • Updated monthly from customer billing and CPR (Clean
Power Research) PV output service • Stores monthly system wide parsed data • Used to provide detailed download data for PV & Planning
Analysis
PHI Advanced Modeling Tool Development
25
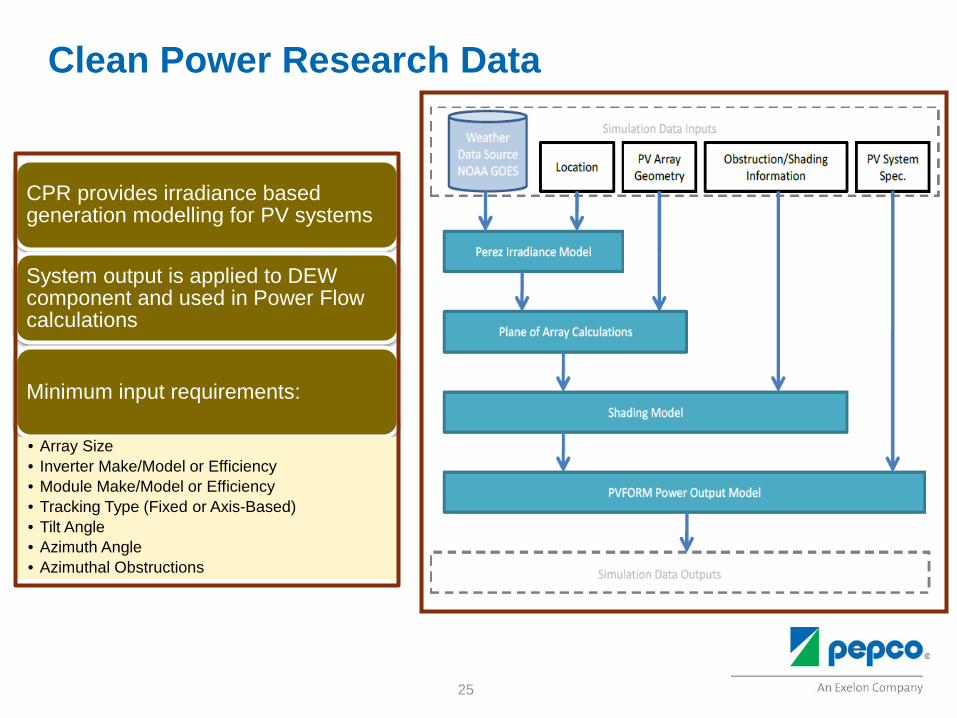
CPR provides irradiance based generation modelling for PV systems
System output is applied to DEW component and used in Power Flow calculations
Minimum input requirements:
• Array Size • Inverter Make/Model or Efficiency • Module Make/Model or Efficiency • Tracking Type (Fixed or Axis-Based) • Tilt Angle • Azimuth Angle • Azimuthal Obstructions
Clean Power Research Data
26
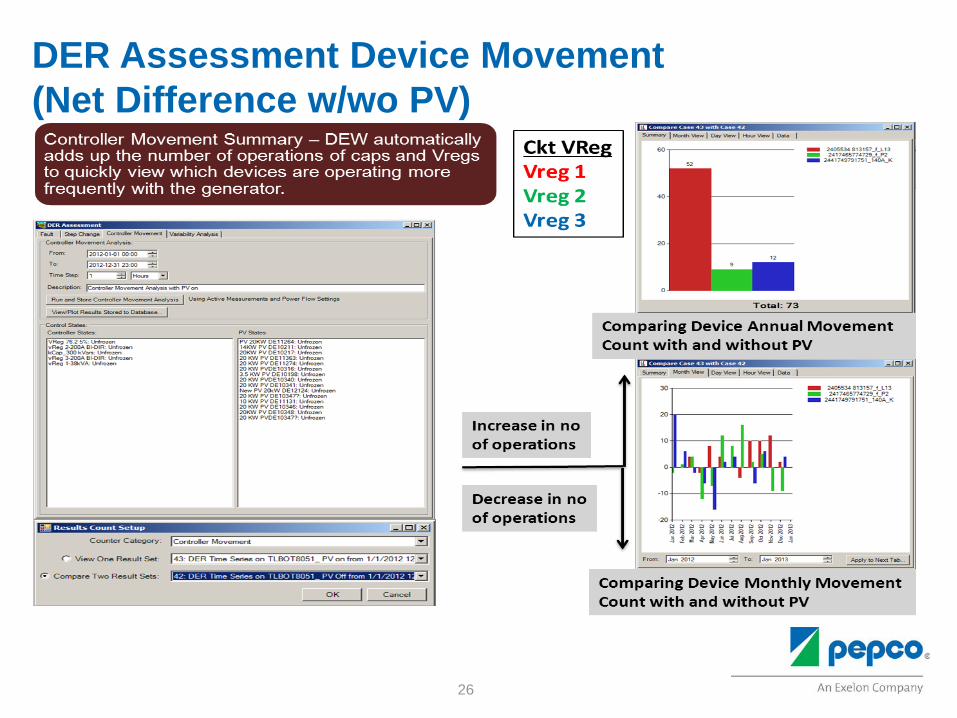
DER Assessment Device Movement (Net Difference w/wo PV)
27
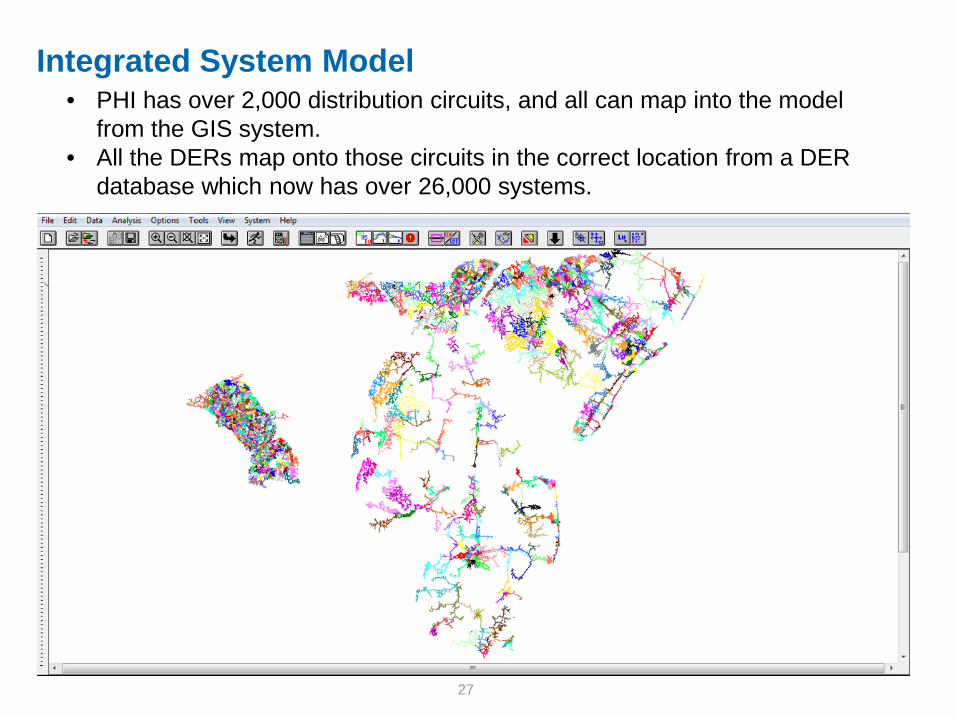
Integrated System Model • PHI has over 2,000 distribution circuits, and all can map into the model
from the GIS system. • All the DERs map onto those circuits in the correct location from a DER
database which now has over 26,000 systems.
28
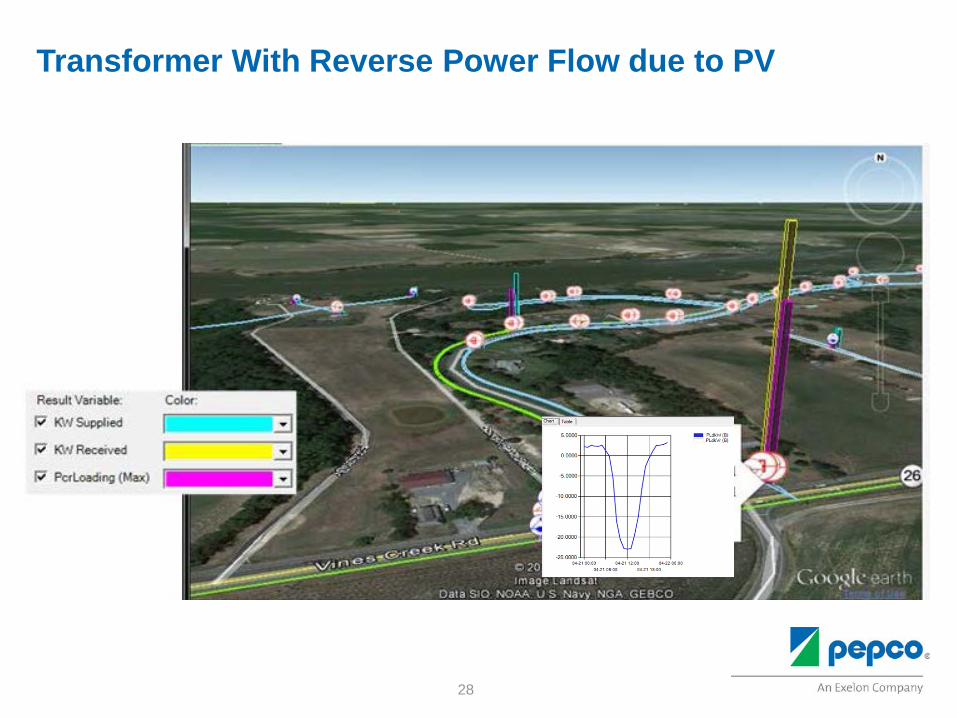
Transformer With Reverse Power Flow due to PV
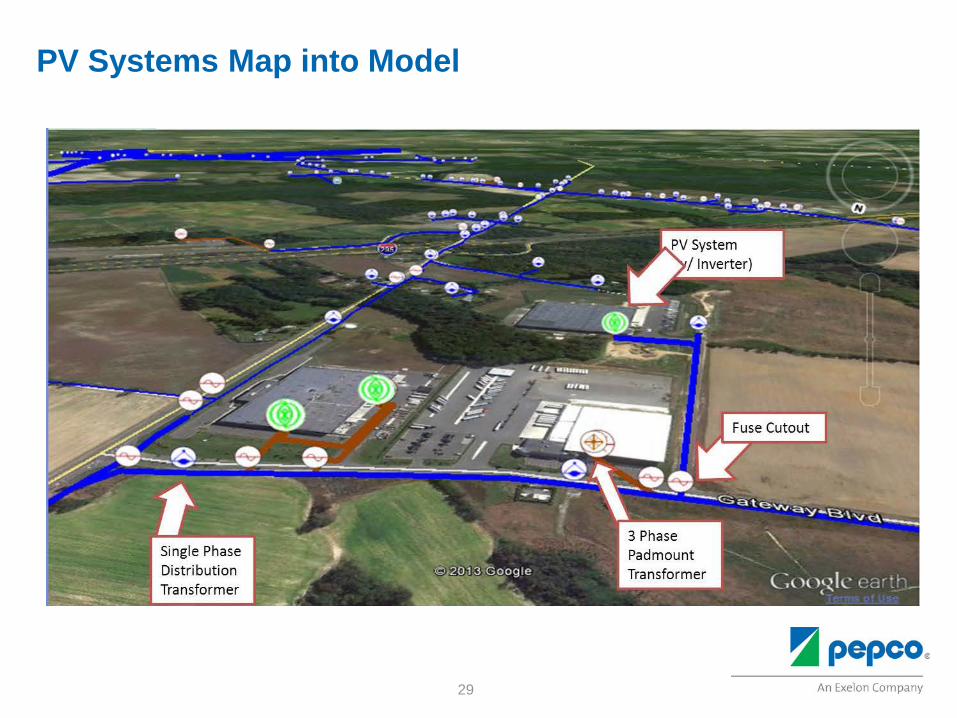
29
PV Systems Map into Model

30
Questions/Comments
31
Demonstration of DEW Modeling Tool
Presented by Amrita Acharya-Menon, Engineer
February 1, 2016
32
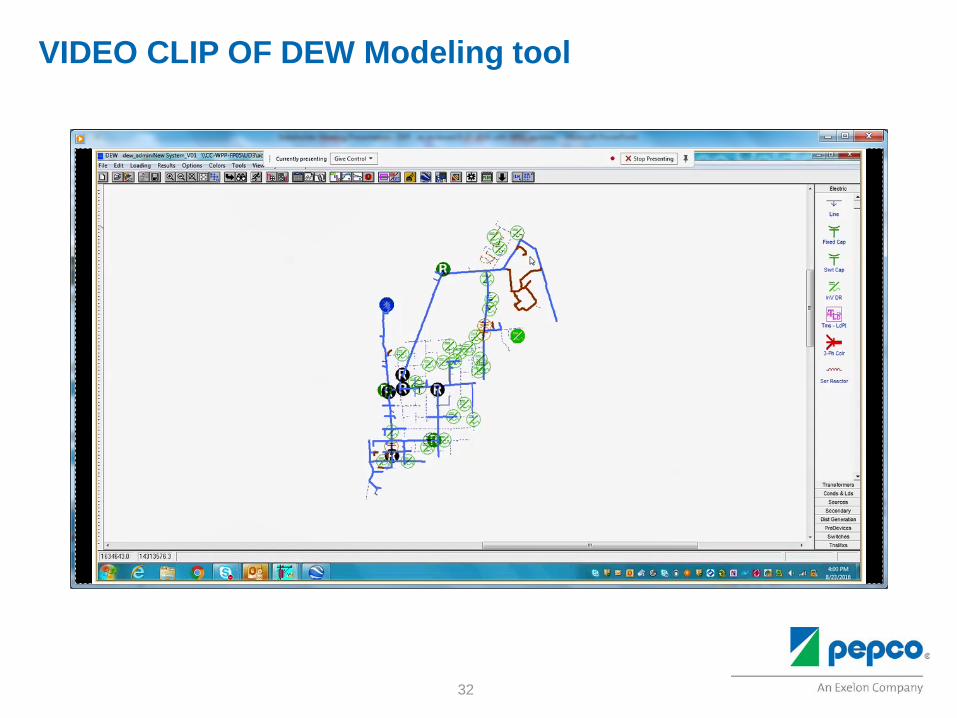
VIDEO CLIP OF DEW Modeling tool

33
NREL/EPRI Survey of Practice
Presented by Michael Coddington, NREL
February 1, 2016
Interconnection Processes and Procedures in 21 U.S. Utilities
Michael Coddington Principal Engineer
National Renewable Energy Laboratory
35
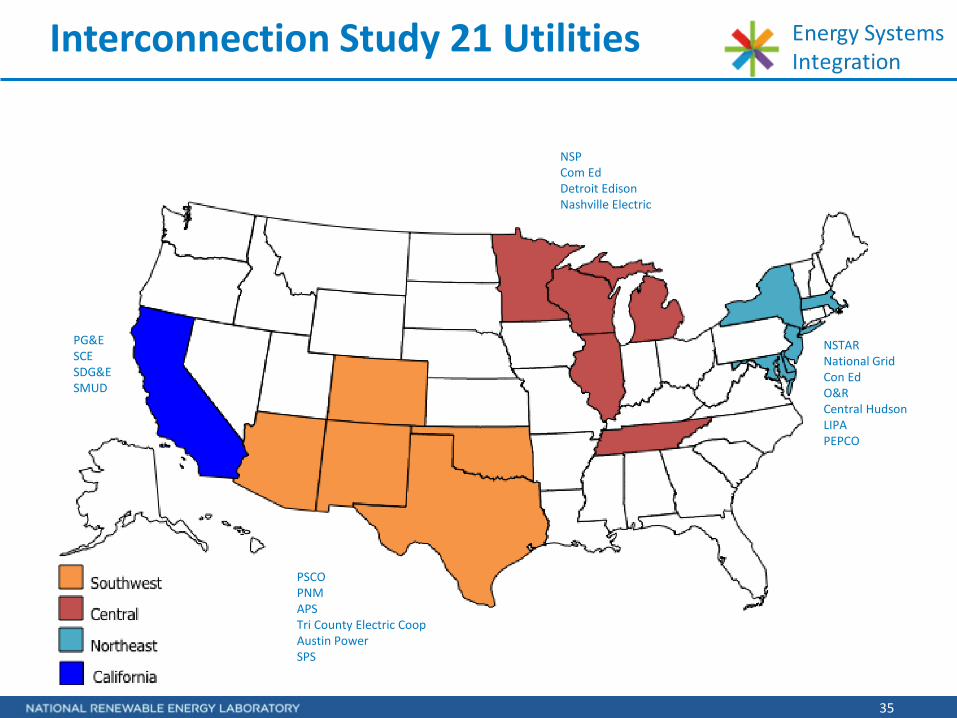
Interconnection Study 21 Utilities
PG&E SCE SDG&E SMUD
NSP Com Ed Detroit Edison Nashville Electric
PSCO PNM APS Tri County Electric Coop Austin Power SPS
NSTAR National Grid Con Ed O&R Central Hudson LIPA PEPCO
36
Questionnaire Areas of Focus
• Application Process • Screening procedures • Supplemental screening procedures • Utility concerns related to interconnection • Impact study approach & software used • Mitigation strategies
37
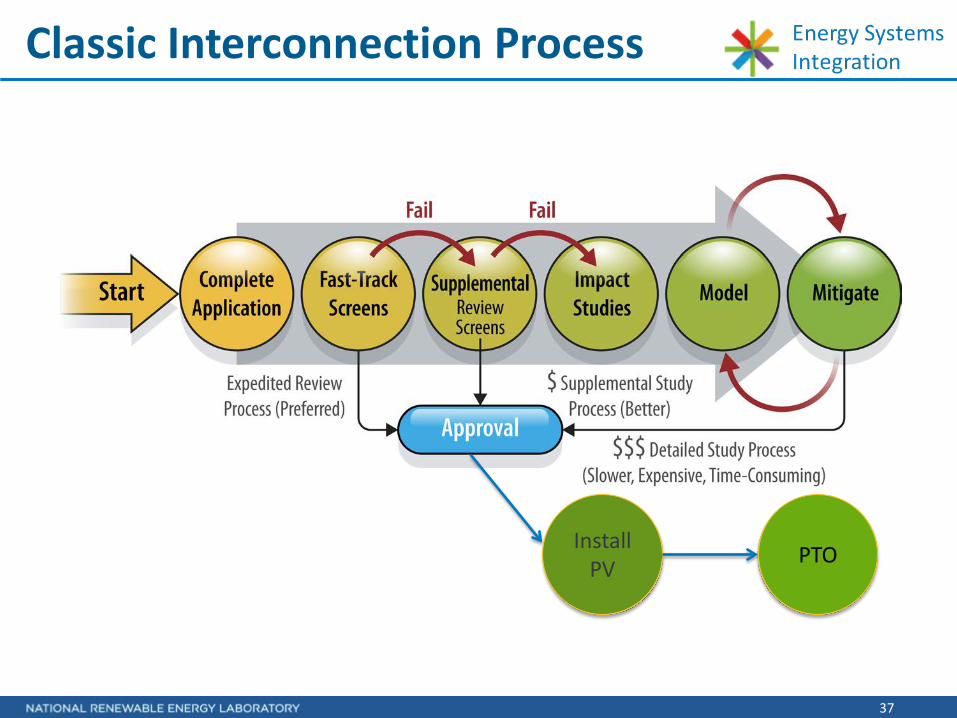
Classic Interconnection Process
Install PV PTO
38
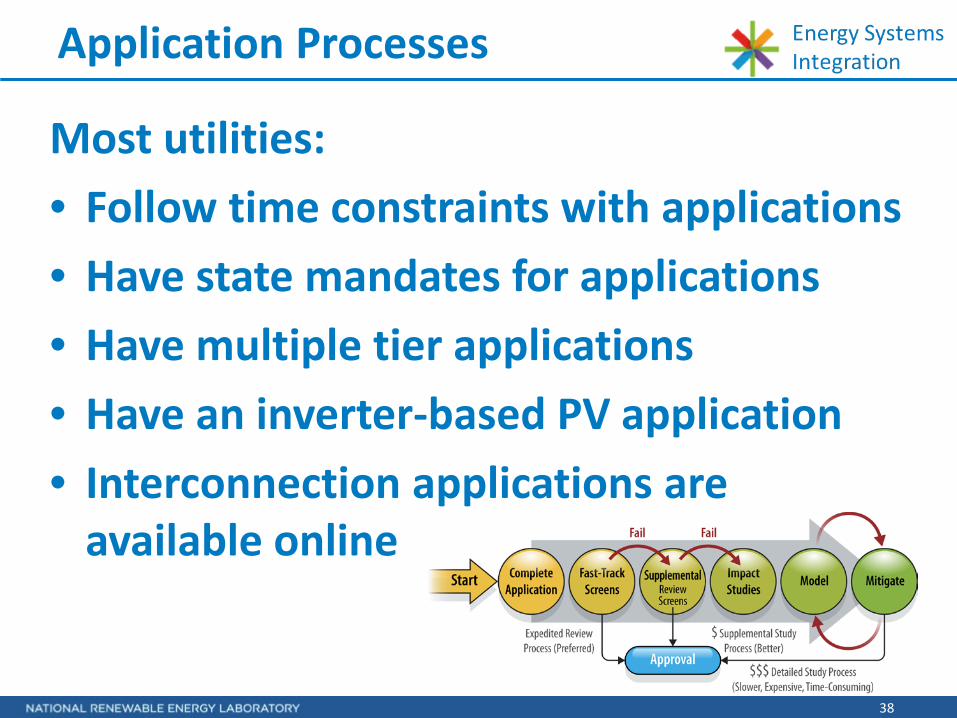
Application Processes
Most utilities: • Follow time constraints with applications • Have state mandates for applications • Have multiple tier applications • Have an inverter-based PV application • Interconnection applications are
available online
39
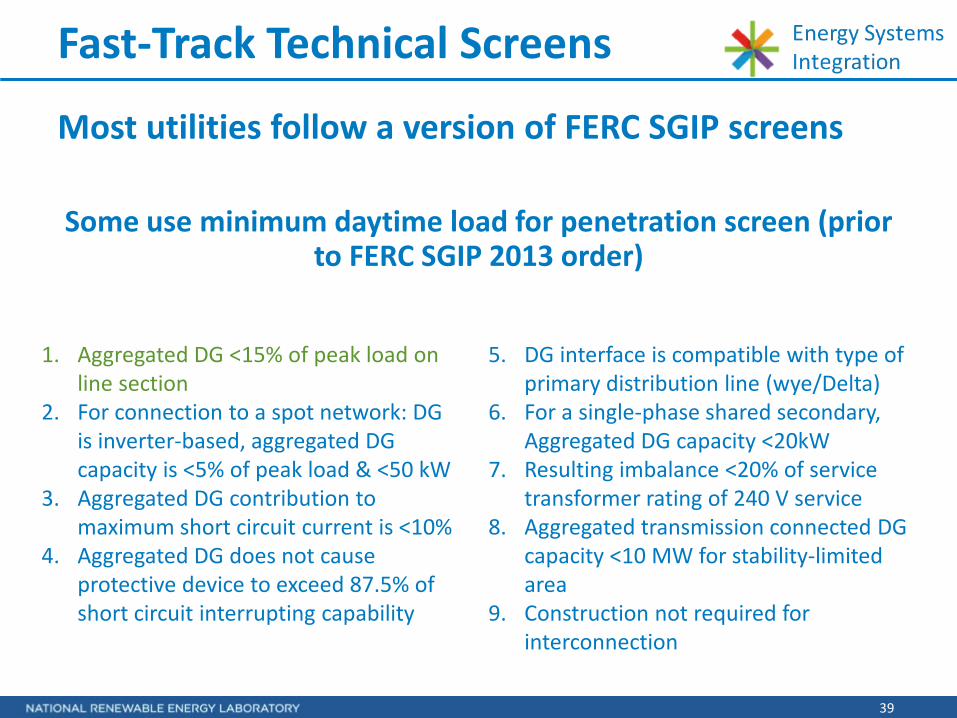
Fast-Track Technical Screens
Most utilities follow a version of FERC SGIP screens Some use minimum daytime load for penetration screen (prior
to FERC SGIP 2013 order)
1. Aggregated DG <15% of peak load on line section
2. For connection to a spot network: DG is inverter-based, aggregated DG capacity is <5% of peak load & <50 kW
3. Aggregated DG contribution to maximum short circuit current is <10%
4. Aggregated DG does not cause protective device to exceed 87.5% of short circuit interrupting capability
5. DG interface is compatible with type of primary distribution line (wye/Delta)
6. For a single-phase shared secondary, Aggregated DG capacity <20kW
7. Resulting imbalance <20% of service transformer rating of 240 V service
8. Aggregated transmission connected DG capacity <10 MW for stability-limited area
9. Construction not required for interconnection
40
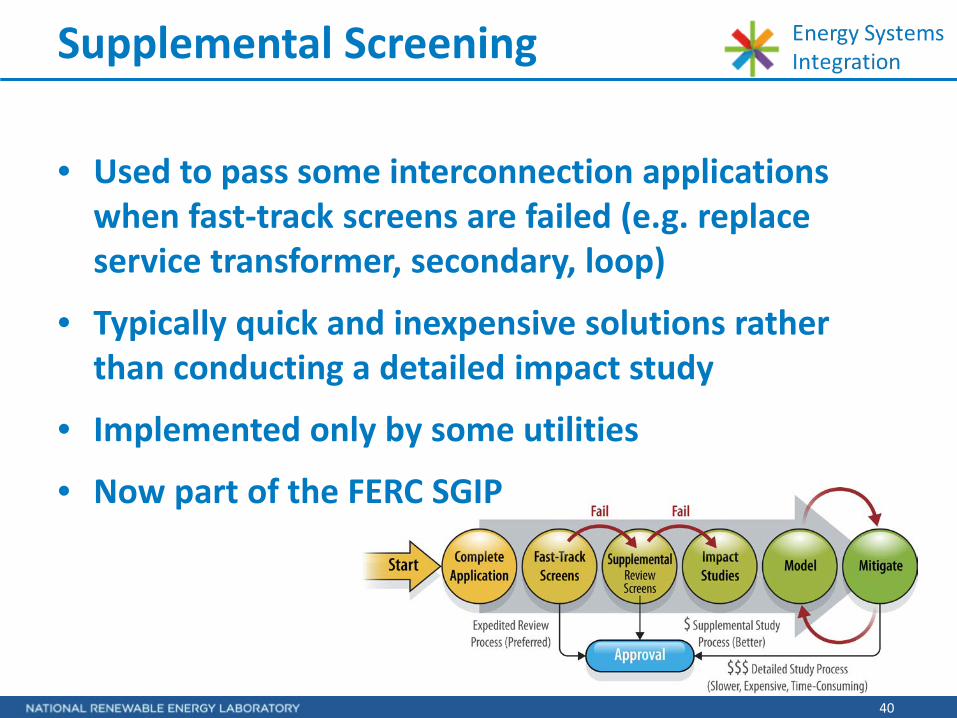
Supplemental Screening
• Used to pass some interconnection applications when fast-track screens are failed (e.g. replace service transformer, secondary, loop)
• Typically quick and inexpensive solutions rather than conducting a detailed impact study
• Implemented only by some utilities
• Now part of the FERC SGIP
41
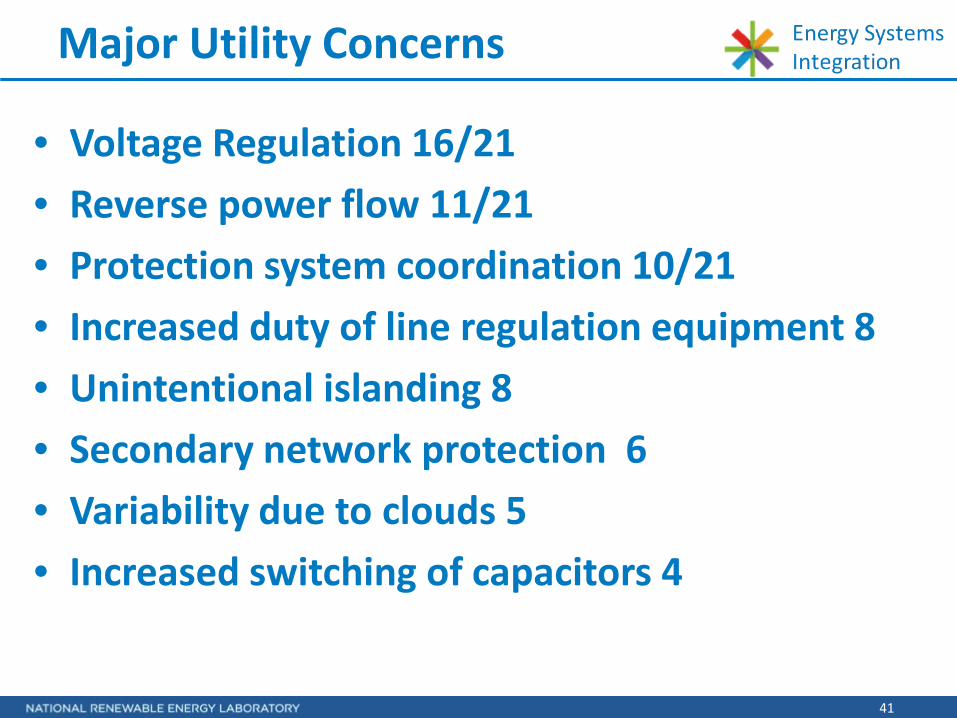
Major Utility Concerns
• Voltage Regulation 16/21 • Reverse power flow 11/21 • Protection system coordination 10/21 • Increased duty of line regulation equipment 8 • Unintentional islanding 8 • Secondary network protection 6 • Variability due to clouds 5 • Increased switching of capacitors 4
42
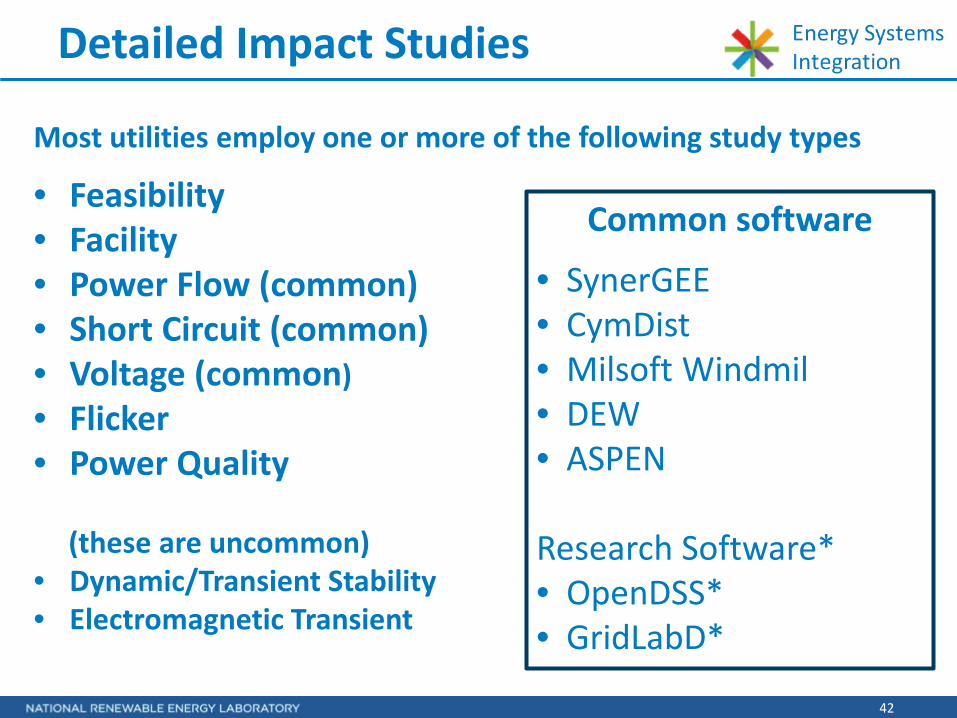
Detailed Impact Studies
Most utilities employ one or more of the following study types
• Feasibility • Facility • Power Flow (common) • Short Circuit (common) • Voltage (common) • Flicker • Power Quality
(these are uncommon)
• Dynamic/Transient Stability • Electromagnetic Transient
Common software
• SynerGEE • CymDist • Milsoft Windmil • DEW • ASPEN Research Software* • OpenDSS* • GridLabD*
43
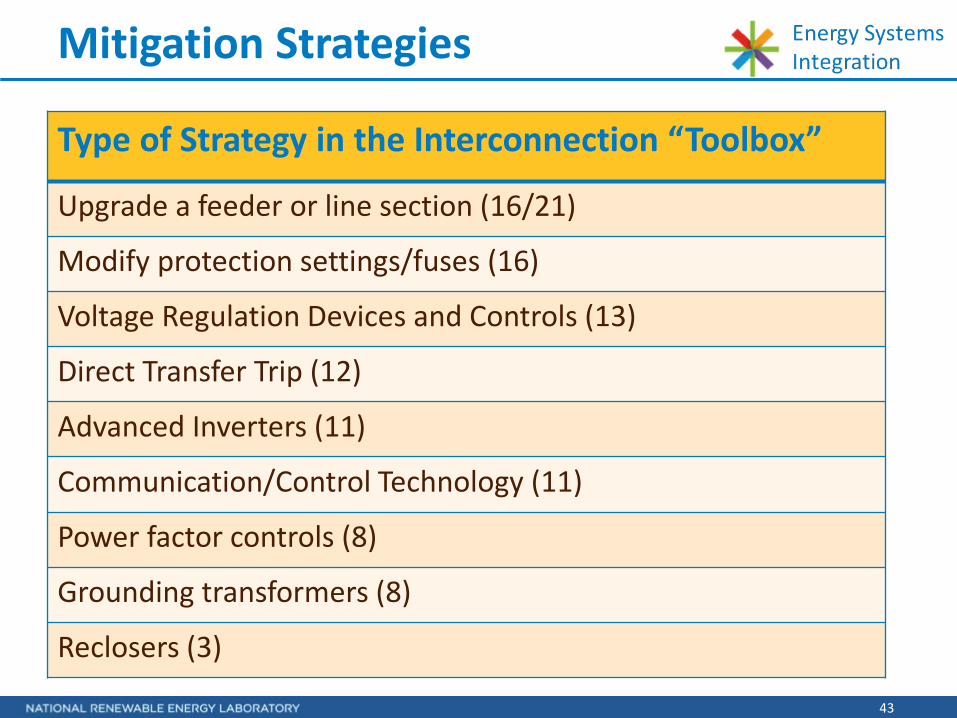
Mitigation Strategies
Type of Strategy in the Interconnection “Toolbox”
Upgrade a feeder or line section (16/21)
Modify protection settings/fuses (16)
Voltage Regulation Devices and Controls (13)
Direct Transfer Trip (12)
Advanced Inverters (11)
Communication/Control Technology (11)
Power factor controls (8)
Grounding transformers (8)
Reclosers (3)
44
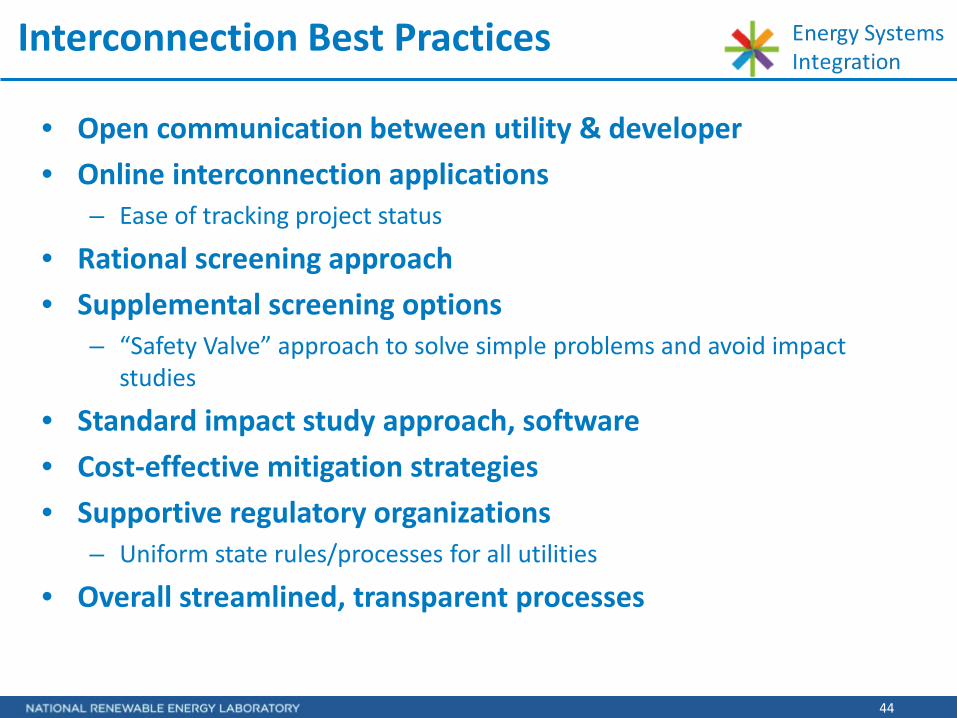
Interconnection Best Practices
• Open communication between utility & developer • Online interconnection applications
– Ease of tracking project status
• Rational screening approach • Supplemental screening options
– “Safety Valve” approach to solve simple problems and avoid impact studies
• Standard impact study approach, software • Cost-effective mitigation strategies • Supportive regulatory organizations
– Uniform state rules/processes for all utilities
• Overall streamlined, transparent processes
45
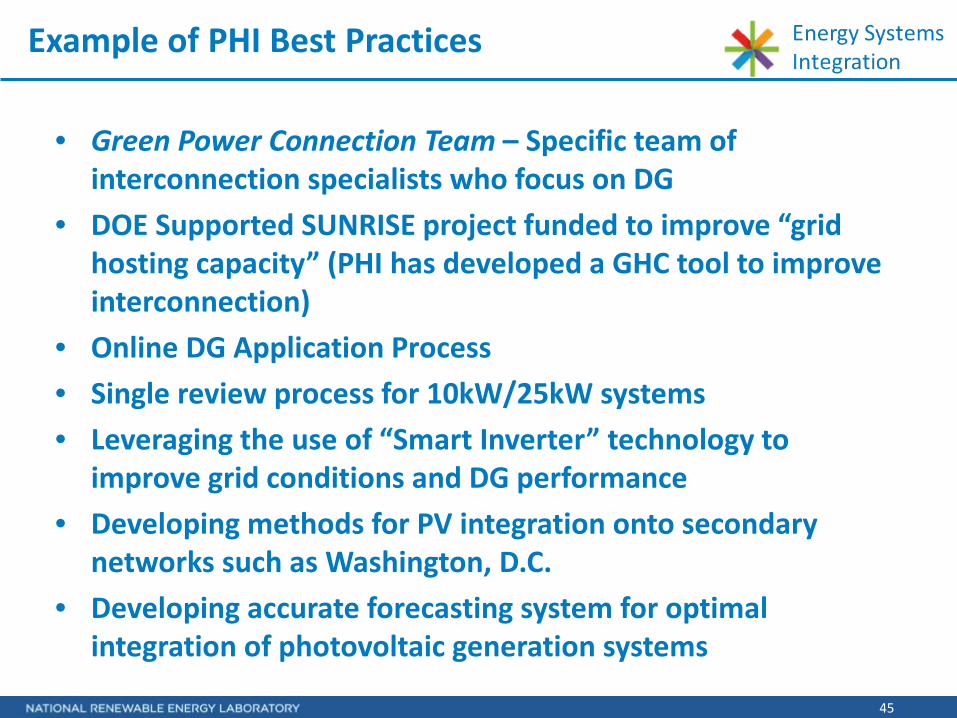
Example of PHI Best Practices
• Green Power Connection Team – Specific team of interconnection specialists who focus on DG
• DOE Supported SUNRISE project funded to improve “grid hosting capacity” (PHI has developed a GHC tool to improve interconnection)
• Online DG Application Process • Single review process for 10kW/25kW systems • Leveraging the use of “Smart Inverter” technology to
improve grid conditions and DG performance • Developing methods for PV integration onto secondary
networks such as Washington, D.C. • Developing accurate forecasting system for optimal
integration of photovoltaic generation systems
47
Incorporating and Evaluating Energy Storage
Presented by Steve Steffel, Manager Regional Capacity Planning
April 7, 2016
48
Multiple Configurations and Functions • Behind the meter or direct connect • Inverters shared or not shared with generation • Two-way flow capability • Participation in Ancillary Services Market • Use for customer such as demand management, premium power
Grid Interconnection • The grid needs to be capable of accommodating the battery as a source or
a load Applicability of Net Energy Metering
• Energy storage is not commonly viewed as a source of renewable generation
• Regulator must determine if energy storage meets requirements for NEM treatment
• If energy storage does meet requirements for NEM, can the system be supplied from the grid or only from renewable generation?
Incorporating Energy Storage
February 1, 2016
49
Renewable Energy Credits • Credit cannot be given for energy discharged from the battery that was
originally sourced by the grid. • Appropriate metering is required.
Technical and Operational Challenges • Operating characteristics may have different impacts on the grid • Degradation over time • Planned use of system may change
Incorporating Energy Storage (Cont’d)
February 1, 2016
50
Evaluating the Impact of Energy Storage
The evaluation follows a similar review/screening/study process as DER generation, based on size, with a few added items: • If the energy storage system shares an inverter with the generation, such as a
PV system, then the maximum power flow fluctuation would be the import to export range of the inverter. For example, a 10 kW inverter system that can import or export 10 kW will be evaluated for the scenario where the power flow may fluctuate by 20 kW.
• If the energy storage has a separate inverter from the generator, such as PV, then the aggregate impact of the power flow fluctuation of the battery and generation will be evaluated.
• If there are multiple energy storage systems on a feeder that will be used for frequency regulation (FR), then the aggregate will be studied as acting simultaneously. PHI may require different time delays for systems responding to regional transmission operator (RTO) FR signals.
• If a battery can only be used for back up purposes, then it will only be evaluated as a load.
51
Questions/Comments
52
Accounting for Distributed Energy, Energy Efficiency, and Demand Response in the Distribution Planning Process
Presented by Don Hall, Manager Capacity Planning
April 7, 2016
53
Distribution Planning – Mission
The Mission of Distribution System Planning at PHI is to provide for the safe, reliable, economic and orderly modification and expansion of the utility electric distribution system to meet existing and future customer demands in a reliable manner. This may include adding equipment and facilities to increase capacity, shifting or reconfiguring load among circuits, or reconductoring circuits among other alternatives. • Pepco Holdings companies maintain engineering and operating criteria
used in the design of new and modified portions of the distribution system. These criteria govern how: – Load carrying capacity of system facilities are determined and utilized – Required service voltage levels are maintained
Increasingly, planning has required improved processes for evaluating the future impacts of resources which may lead to reduction in load and demand.
54
Justification for Enhancing the Planning Process
PHI has proactively improved the distribution planning process towards a more integrated system planning approach for several reasons:
• Increasing penetrations of resources which may impact load and peak demand are being added which include:
• Solar PV • Energy Efficiency • Demand Response and Direct Load Control
• Greater transparency and justification for capital projects (or deferral)
• Consider regulatory mandates which have been implemented in other states (e.g. investment in non-wires alternatives) and ensure the planning process has a framework in place to evaluate the impact of these alternatives as appropriate
54
55
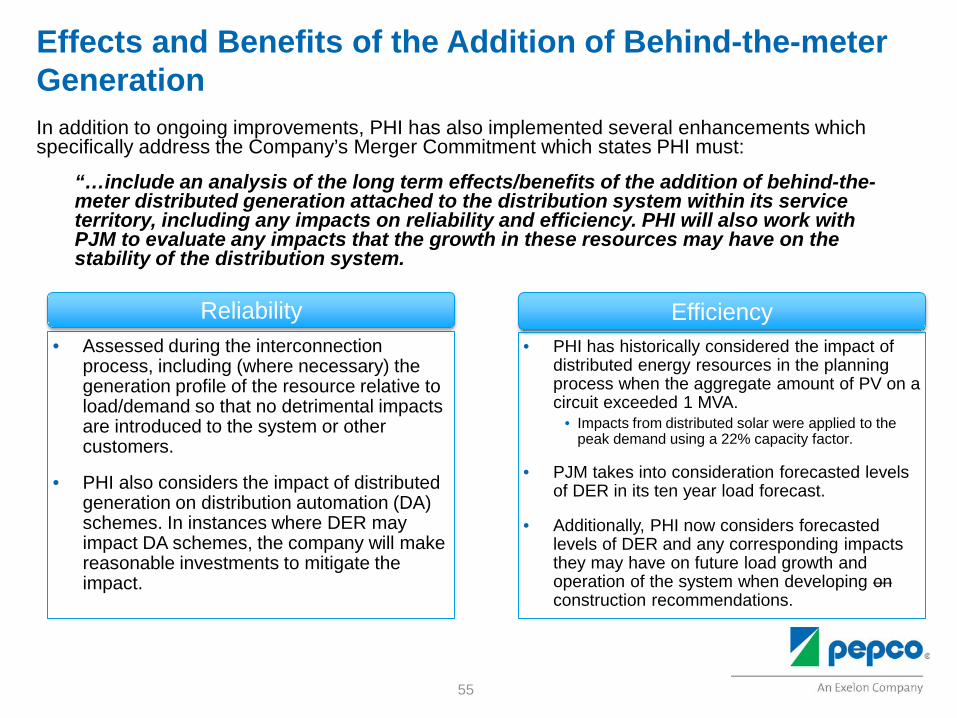
Effects and Benefits of the Addition of Behind-the-meter Generation In addition to ongoing improvements, PHI has also implemented several enhancements which specifically address the Company’s Merger Commitment which states PHI must:
“…include an analysis of the long term effects/benefits of the addition of behind-the-meter distributed generation attached to the distribution system within its service territory, including any impacts on reliability and efficiency. PHI will also work with PJM to evaluate any impacts that the growth in these resources may have on the stability of the distribution system.
• Assessed during the interconnection process, including (where necessary) the generation profile of the resource relative to load/demand so that no detrimental impacts are introduced to the system or other customers.
• PHI also considers the impact of distributed generation on distribution automation (DA) schemes. In instances where DER may impact DA schemes, the company will make reasonable investments to mitigate the impact.
Reliability Efficiency • PHI has historically considered the impact of
distributed energy resources in the planning process when the aggregate amount of PV on a circuit exceeded 1 MVA.
• Impacts from distributed solar were applied to the peak demand using a 22% capacity factor.
• PJM takes into consideration forecasted levels of DER in its ten year load forecast.
• Additionally, PHI now considers forecasted levels of DER and any corresponding impacts they may have on future load growth and operation of the system when developing on construction recommendations.
56
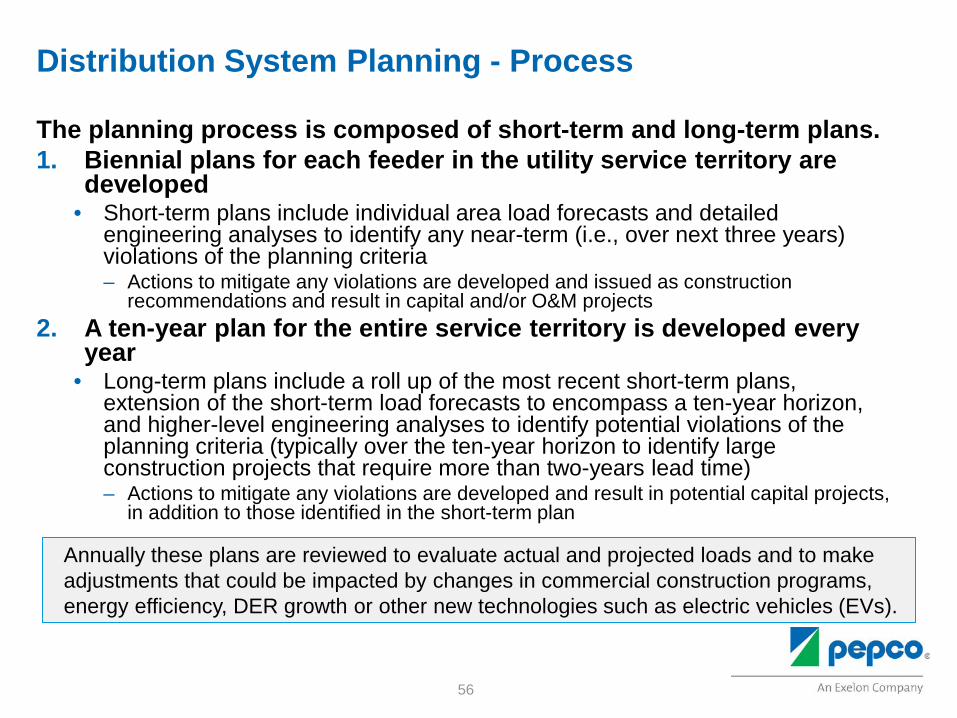
Distribution System Planning - Process
The planning process is composed of short-term and long-term plans. 1. Biennial plans for each feeder in the utility service territory are
developed • Short-term plans include individual area load forecasts and detailed
engineering analyses to identify any near-term (i.e., over next three years) violations of the planning criteria – Actions to mitigate any violations are developed and issued as construction
recommendations and result in capital and/or O&M projects 2. A ten-year plan for the entire service territory is developed every
year • Long-term plans include a roll up of the most recent short-term plans,
extension of the short-term load forecasts to encompass a ten-year horizon, and higher-level engineering analyses to identify potential violations of the planning criteria (typically over the ten-year horizon to identify large construction projects that require more than two-years lead time) – Actions to mitigate any violations are developed and result in potential capital projects,
in addition to those identified in the short-term plan
Annually these plans are reviewed to evaluate actual and projected loads and to make adjustments that could be impacted by changes in commercial construction programs, energy efficiency, DER growth or other new technologies such as electric vehicles (EVs).
57
Short Term Load Forecasting – Process
Short term planning begins with historical analysis of the peak load periods from the previous year • Each substation, substation transformer, and feeder is analyzed
– Actual loadings are obtained through PHI’s EMS or through field measurements
– Loadings are analyzed to develop a base history reflective of peak loadings during extreme (90/10) weather conditions for use in forecasting future facility loadings
Small area load forecasts are developed using Prospective New Business (PNB) information • PNBs are found through utility applications for service and through
media, developer, and government reports on new construction • Planners predict loading and timing from the customer/developer
provided information plus media reports and site visits • Effects of known pending DERs are incorporated recognizing the
typical output level coincident with distribution system facility peak loadings
58
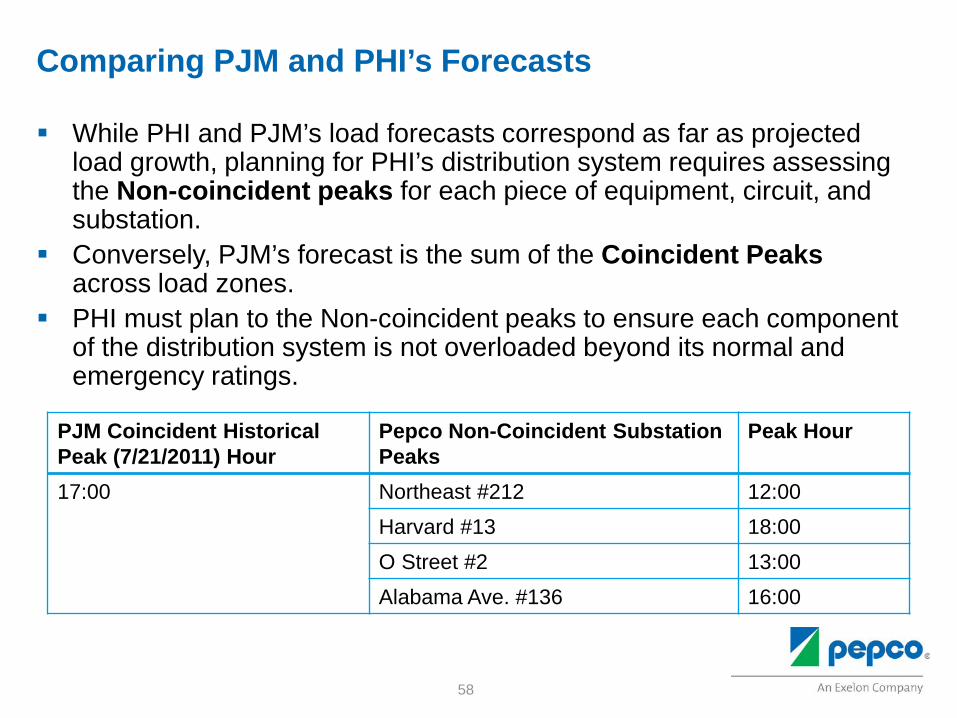
Comparing PJM and PHI’s Forecasts
While PHI and PJM’s load forecasts correspond as far as projected load growth, planning for PHI’s distribution system requires assessing the Non-coincident peaks for each piece of equipment, circuit, and substation.
Conversely, PJM’s forecast is the sum of the Coincident Peaks across load zones.
PHI must plan to the Non-coincident peaks to ensure each component of the distribution system is not overloaded beyond its normal and emergency ratings.
PJM Coincident Historical Peak (7/21/2011) Hour
Pepco Non-Coincident Substation Peaks
Peak Hour
17:00 Northeast #212 12:00 Harvard #13 18:00 O Street #2 13:00 Alabama Ave. #136 16:00
59
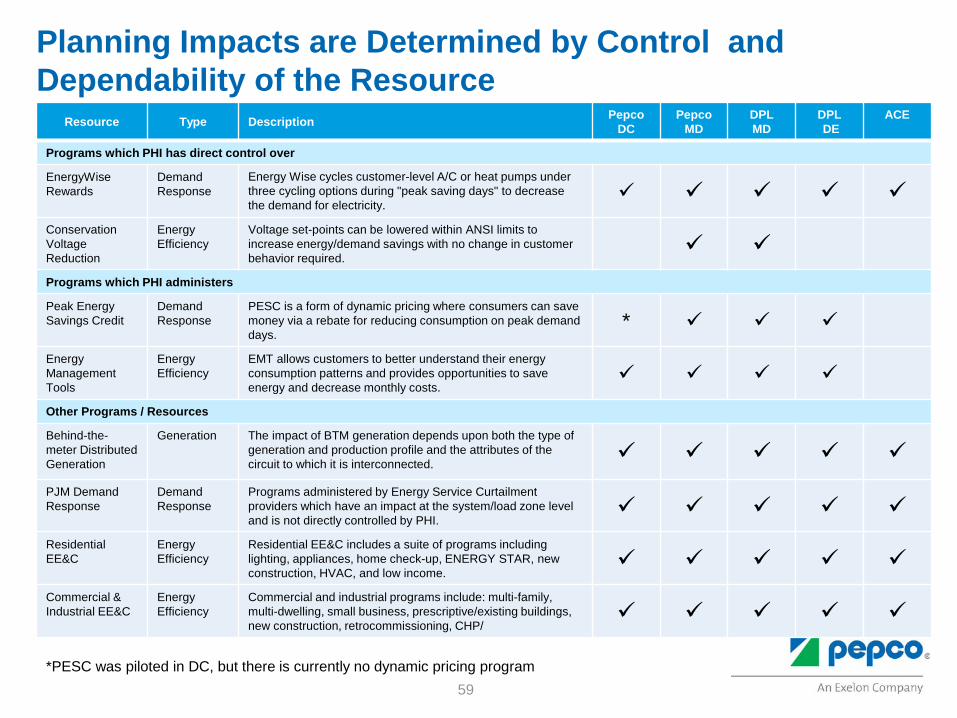
Planning Impacts are Determined by Control and Dependability of the Resource
Resource Type Description Pepco DC
Pepco MD
DPL MD
DPL DE
ACE
Programs which PHI has direct control over
EnergyWise Rewards
Demand Response
Energy Wise cycles customer-level A/C or heat pumps under three cycling options during "peak saving days" to decrease the demand for electricity.
Conservation Voltage Reduction
Energy Efficiency
Voltage set-points can be lowered within ANSI limits to increase energy/demand savings with no change in customer behavior required.
Programs which PHI administers
Peak Energy Savings Credit
Demand Response
PESC is a form of dynamic pricing where consumers can save money via a rebate for reducing consumption on peak demand days.
* Energy Management Tools
Energy Efficiency
EMT allows customers to better understand their energy consumption patterns and provides opportunities to save energy and decrease monthly costs.
Other Programs / Resources
Behind-the-meter Distributed Generation
Generation The impact of BTM generation depends upon both the type of generation and production profile and the attributes of the circuit to which it is interconnected.
PJM Demand Response
Demand Response
Programs administered by Energy Service Curtailment providers which have an impact at the system/load zone level and is not directly controlled by PHI.
Residential EE&C
Energy Efficiency
Residential EE&C includes a suite of programs including lighting, appliances, home check-up, ENERGY STAR, new construction, HVAC, and low income.
Commercial & Industrial EE&C
Energy Efficiency
Commercial and industrial programs include: multi-family, multi-dwelling, small business, prescriptive/existing buildings, new construction, retrocommissioning, CHP/
*PESC was piloted in DC, but there is currently no dynamic pricing program
60
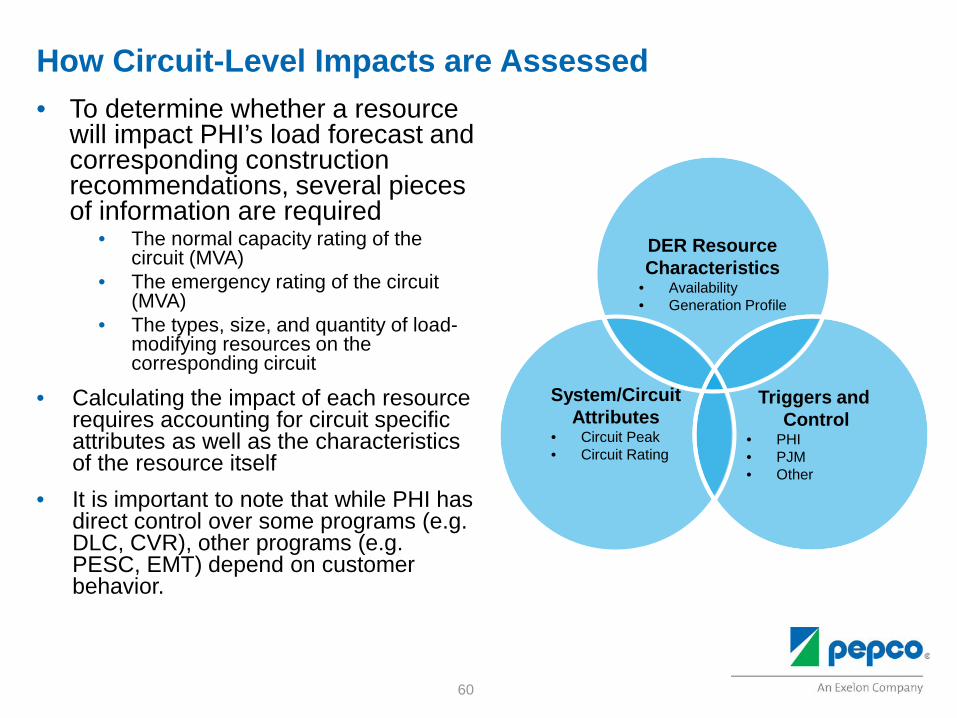
How Circuit-Level Impacts are Assessed • To determine whether a resource
will impact PHI’s load forecast and corresponding construction recommendations, several pieces of information are required
• The normal capacity rating of the circuit (MVA)
• The emergency rating of the circuit (MVA)
• The types, size, and quantity of load-modifying resources on the corresponding circuit
• Calculating the impact of each resource requires accounting for circuit specific attributes as well as the characteristics of the resource itself
• It is important to note that while PHI has direct control over some programs (e.g. DLC, CVR), other programs (e.g. PESC, EMT) depend on customer behavior.
System/Circuit Attributes
• Circuit Peak • Circuit Rating
DER Resource Characteristics
• Availability • Generation Profile
Triggers and Control
• PHI • PJM • Other
61
Accounting for Impacts in the Planning Process
• As a sensitivity analysis, effects of forecasted and installed DER, Direct Load Control and Peak Energy Savings Credit programs are removed from the predicted feeder/transformer/substation loadings (i.e. added back in)
• Those adjusted loads are compared to the emergency capacity of the feeder and transformer and the firm capacity of the substation.
• The effects of each of the aforementioned programs/resources will be calculated/derived by feeder where appropriate. When effects can only be calculated or derived by substation, the effects will be allocated to each feeder served by that substation based upon the ratio of feeder load versus total feeder load.
• The impacts of adding these resources back in will be evaluated and may trigger different recommendations at each level of the system (e.g. load transfer w/o PV may require different actions at the feeder level vs. at the substation level)
61
62
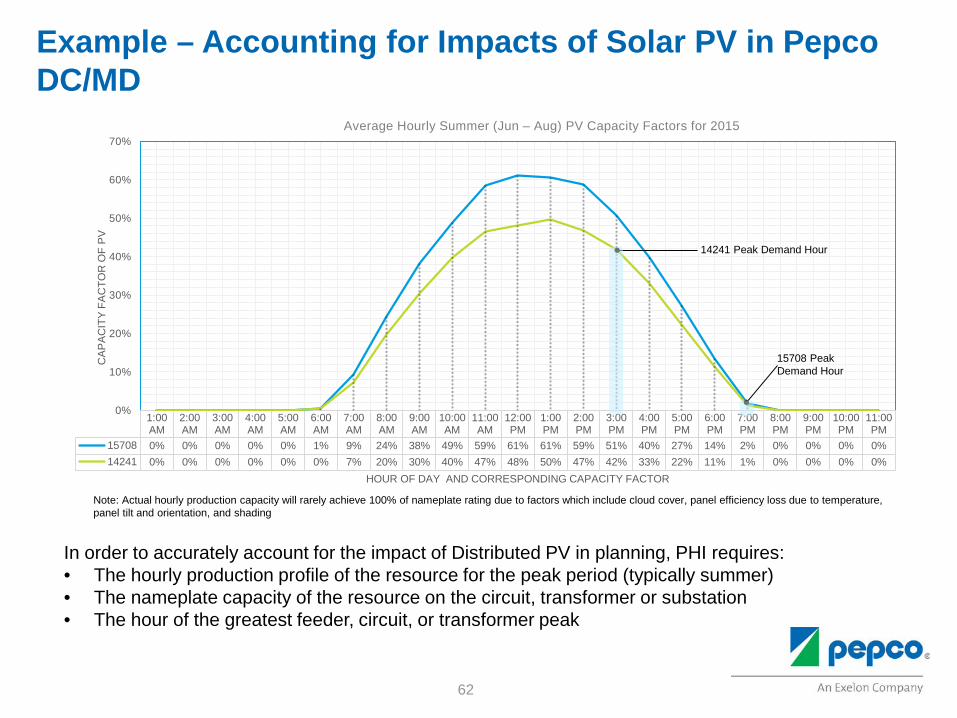
Example – Accounting for Impacts of Solar PV in Pepco DC/MD
1:00AM
2:00AM
3:00AM
4:00AM
5:00AM
6:00AM
7:00AM
8:00AM
9:00AM
10:00AM
11:00AM
12:00PM
1:00PM
2:00PM
3:00PM
4:00PM
5:00PM
6:00PM
7:00PM
8:00PM
9:00PM
10:00PM
11:00PM
15708 0% 0% 0% 0% 0% 1% 9% 24% 38% 49% 59% 61% 61% 59% 51% 40% 27% 14% 2% 0% 0% 0% 0%14241 0% 0% 0% 0% 0% 0% 7% 20% 30% 40% 47% 48% 50% 47% 42% 33% 22% 11% 1% 0% 0% 0% 0%
0%
10%
20%
30%
40%
50%
60%
70%
CA
PA
CIT
Y F
AC
TOR
OF
PV
HOUR OF DAY AND CORRESPONDING CAPACITY FACTOR
Average Hourly Summer (Jun – Aug) PV Capacity Factors for 2015
15708 Peak Demand Hour
14241 Peak Demand Hour
In order to accurately account for the impact of Distributed PV in planning, PHI requires: • The hourly production profile of the resource for the peak period (typically summer) • The nameplate capacity of the resource on the circuit, transformer or substation • The hour of the greatest feeder, circuit, or transformer peak
Note: Actual hourly production capacity will rarely achieve 100% of nameplate rating due to factors which include cloud cover, panel efficiency loss due to temperature, panel tilt and orientation, and shading
63
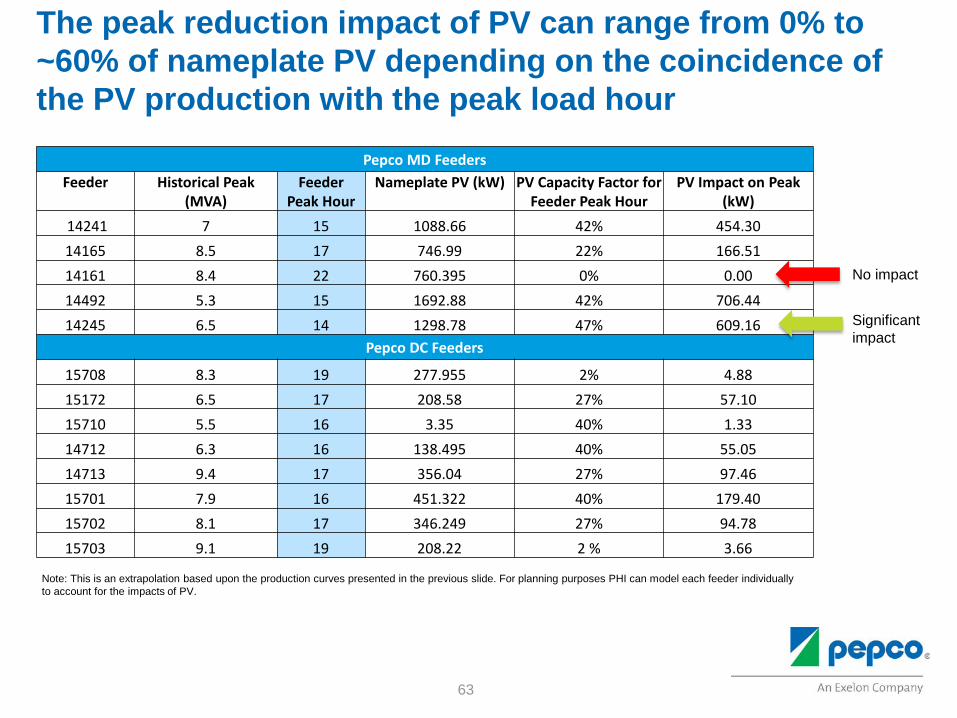
The peak reduction impact of PV can range from 0% to ~60% of nameplate PV depending on the coincidence of the PV production with the peak load hour
Pepco MD Feeders Feeder Historical Peak
(MVA) Feeder
Peak Hour Nameplate PV (kW) PV Capacity Factor for
Feeder Peak Hour PV Impact on Peak
(kW) 14241 7 15 1088.66 42% 454.30 14165 8.5 17 746.99 22% 166.51 14161 8.4 22 760.395 0% 0.00 14492 5.3 15 1692.88 42% 706.44 14245 6.5 14 1298.78 47% 609.16
Pepco DC Feeders
15708 8.3 19 277.955 2% 4.88 15172 6.5 17 208.58 27% 57.10 15710 5.5 16 3.35 40% 1.33 14712 6.3 16 138.495 40% 55.05 14713 9.4 17 356.04 27% 97.46 15701 7.9 16 451.322 40% 179.40 15702 8.1 17 346.249 27% 94.78 15703 9.1 19 208.22 2 % 3.66
No impact
Significant impact
Note: This is an extrapolation based upon the production curves presented in the previous slide. For planning purposes PHI can model each feeder individually to account for the impacts of PV.
64
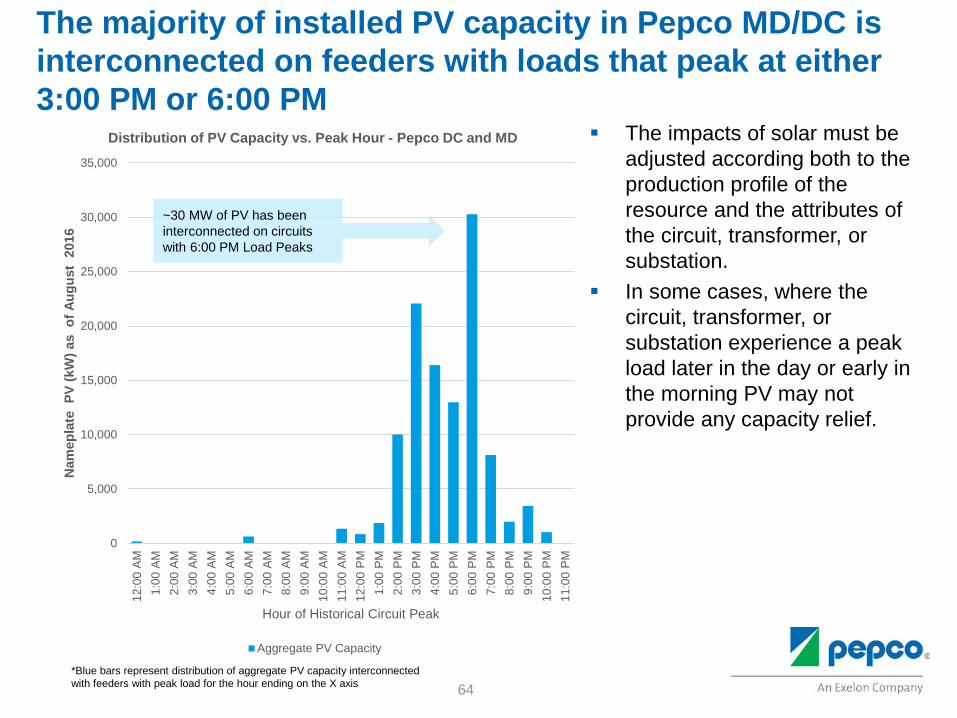
The majority of installed PV capacity in Pepco MD/DC is interconnected on feeders with loads that peak at either 3:00 PM or 6:00 PM
The impacts of solar must be adjusted according both to the production profile of the resource and the attributes of the circuit, transformer, or substation.
In some cases, where the circuit, transformer, or substation experience a peak load later in the day or early in the morning PV may not provide any capacity relief.
0
5,000
10,000
15,000
20,000
25,000
30,000
35,000
12:0
0 A
M1:
00 A
M2:
00 A
M3:
00 A
M4:
00 A
M5:
00 A
M6:
00 A
M7:
00 A
M8:
00 A
M9:
00 A
M10
:00
AM
11:0
0 A
M12
:00
PM
1:00
PM
2:00
PM
3:00
PM
4:00
PM
5:00
PM
6:00
PM
7:00
PM
8:00
PM
9:00
PM
10:0
0 P
M11
:00
PM
Nam
epla
te P
V (k
W) a
s o
f Aug
ust
2016
Hour of Historical Circuit Peak
Distribution of PV Capacity vs. Peak Hour - Pepco DC and MD
Aggregate PV Capacity
~30 MW of PV has been interconnected on circuits with 6:00 PM Load Peaks
*Blue bars represent distribution of aggregate PV capacity interconnected with feeders with peak load for the hour ending on the X axis

65
Questions/Comments
66
Summary and next steps
• In September, PHI will file its plans to incorporate the addition of behind-the-meter DER to the distribution system including impact on reliability and efficiency
• Additionally, PHI will address comments and questions raised during the stakeholder meetings in DC and the other PHI jurisdictions in a supplemental filing which will be submitted no later than six months after the completion of the last stakeholder meeting
Additional Questions
Email questions to [email protected]