Embed Size (px)
Citation preview
AD/A-O00 419
AIRCRAFT PENETRATION OF CLOUDS GENERATEDBY NUCLEAR BURSTS
Rayford P. Patrick, et al
Air Force Weapons LaboratoryKirtland Air Force Base, New Mexico
September 1974
DISTRIBUTED BY:
National Technical Information ServiceU. S. DEPARTMENT OF COMMERCE

AFWL-TR-73-82
This final report was prepared by the Air Force Weapons Laboratory, KirtlandAir %rce Base, New Mexico, under Job Order 88090327. Major Rayford P. Patrick(SAS) was the Laboratory Project Officer-in-Charge.
When US Government drawings, specifications, or othr data are used for anypurpose other than a definitely related Government procurement operation, theGovernment thereby incurs no responsibility nor any obligation whatsoever, andthe fact that the Government may have formulated, furnished, or in any waysupplied the said drawings, speci~ications, or other data, is not to be regardedby implication or otherwise, as in any manner licensing the holder or any otherpers n or corporation, or conveying any rights or permission to manufacture,use, or sell any patented invention that may in any way be related thereto.
This technical report has been reviewed and is approved for publication.
RAYF R P PATRICKMajcr, USAFProjzct Officer
NLt ERCHARLES C. HYRE, J1 ,Lt Colonel, Colonel USAFChief, Ss e S~~~v~
CheSystem uppo--rach Chief, Analysis vision
DO NOT RETURN THIS COPY.--R A!N OR DESTROY.
UNCLASSIFIED oo ,SECURI . CLASSIFICATION OF THIS PAGE (V,.D .. 114/.,4 - o
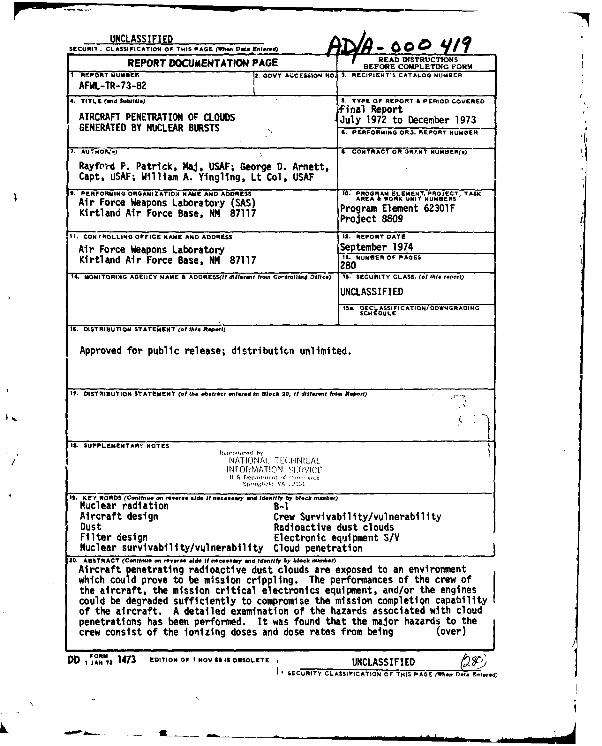
REPORT DOCUMENTATION PAGE "READ FOSTRUCIONSBEFORE COMPLETING FORM1, RF.PORT NUMEE 12. GOVT ACCESSION NO. 3. RECIPIENT'S CATALOG NUMBR
AFWI-TR-73-82 4. TITLE (end S- III.) S. TYPE OF REPORT & PERIOD COVEREO
inal ReportAIRCRAFT PENETRATION OF CLOUDS July 1972 to December 1973GENERATED BY NUCLEAR BURSTS 4. PERFORMING OR3. REPORT NUM3ER
7. AUTHO..I) N. CONTRACT OR GRANT NUMBER(e)
Rayfof.d P. Patrick, taJ, USAF; George D. Arnett,Capt. USAF; William A. Yingling, Lt Col, USAF
9. PERFORMING ORGANIZATION NMIE AND ADDRESS 10. PROGRAM ELEMENT. PROJECT, TASKAREA & WORK UNIT NUMBERSAir Force Weapons Laboratory (SAS) Program Element 62301FKirtland Air Force Base, NM 87117 Project 8809
II. CONTROLLING OFrICE NAME AND ADDRESS 12. REPORT DATE
Air Force Weapons Laboratory September 1974Kirtland Air Force Base, NM 87117 2. NUMBER OF PAGES280
I4. MONITORIMG AGEIJCY NAME & AODRESS(it difIIN. Inue C-Ol1.fnd Dll,.e) IS. SECURITY CLASS. (.1fh1i. r.pot)
UNCLASSIFIEDIS.. DECLASSIFICATIONDOWNGRADING
SCHEDULE
1N, DISTRIBUTION STATEMENT (e thi. R.P. .I
Approved for public release; distrlbuticn unlimited.
17. DISTRIBUTION STATEMENT (of iA .1btt1.1 ntI-erd I, BI,,b 20, If dit.f.Ite 1. P ,1) *)
IN. SUPPLEMENTARY NOTES
NA1 INAL TtUINICALINFORMATION I('CriI S Dep t. -t f I-, --
1u g,,. A '..';
1. KEY WORDS (Continue an ""ooI.de it n..e..v end Identify by block ntamber)
Nuclear radiation B-1Aircraft design Crew Survivability/vulnerabilityDust Radioactive dust cloudsFilter design Electronic equipment S/VNuclear survivability/vulnerability Cloud penetration
20, ABSTRACT (Centinue on l ,r ide It neeeav ., ded Identify by block nmber)Aircraft penetrating radioactive dust clouds are exposed to an environmentwhich could prove to be mission crippling. The performances of the crew ofthe aircraft, the mission critical electronics equipment, and/or the enginescould be degraded sufficiently to compromise the mission completion capabilityof the aircraft. A detailed examination of the hazards associated with cloudpenetrations has been performed. It was found that the major hazards to thecrew consist of the ionizing doses and dose rates from being (over)
DD I FJANM 1473 EDITION OF I NOV 5 OBSOLETE UNCLASSIFIEDI SECURITY CLASSIFICATION OF THIS PAGE (ND.n 1'.1. Enfeted)
AR---- --.. . ...- I
UNCLASSIFIEDSECURITY CLASSIFICATION OF THIS PAGK(W.Data 0.f E.I.-)
surrounded by the radioactive cloud and from dust which accumulates in thecocpit during penetration, and the rediation burns of skin in direct contactwith the dust. The major hazard to electronics equipment is due to the doseaccumulated from dust accumulated in the plenum chambers of black boxeswhich are cooled by an open cycle process. It is shown that significantprotection can be provided for the crew and avionics equipment by theinstallation of filters. General techniques are presented for selectingfilter design criteria for the crew and equipment environm.nt control systems.
K a
p.n
UNCLASSIFIEDSECURITY CLASSIFICATION OF THIS PAGE(USen Date RnItred)
AFWL-TR-71-82
PREFACE
Appreciation and thanks are given to Dr. T. Mobley and Mr. H. Murphy of the
Air Force-Weapons Laboratory for their technical advice.
Portions of Section V of this report were developed concurrently with an
article, "Potential Crew Hazard: Due to Radioactive Cloud Penetration," whichwas submitted for publication. Yhis article has been accepted and will be
published in'a future issue of Aerospace Medicine.
1/2
Jlt_
AFWL-TR-73-82
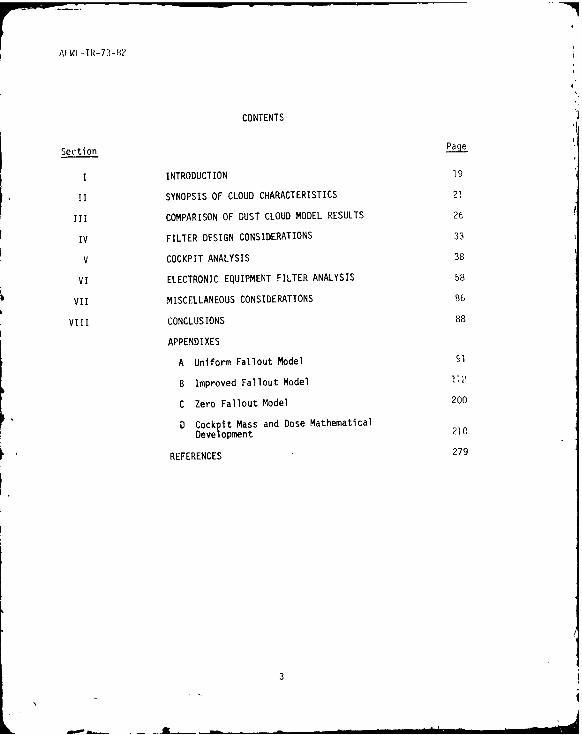
CONTENTS
Section Page
I INTRODUCTION 19
II SYNOPSIS OF CLOUD CHARACTERISTICS 21
III COMPARISON OF DUST CLOUD MODEL RESULTS 26
IV FILTER DFSIGN CONSIDERATIONS 33
V COCKPIT ANALYSIS 38
VI ELECTRONIC EQUIPMENT FILTER ANALYSIS 58
VII MISCELLANEOUS CONSIDERATIONS 86
VIII CONCLUSIONS 88
APPENDIXES
A Uniform Fallout Model S1
B Improved Fallout Model 112
C Zero Fallout Model 200
D Cockpit Mass and Dose MathematicalDevelopment 210
REFERENCES 279
3
AFWL-TR-73-82l
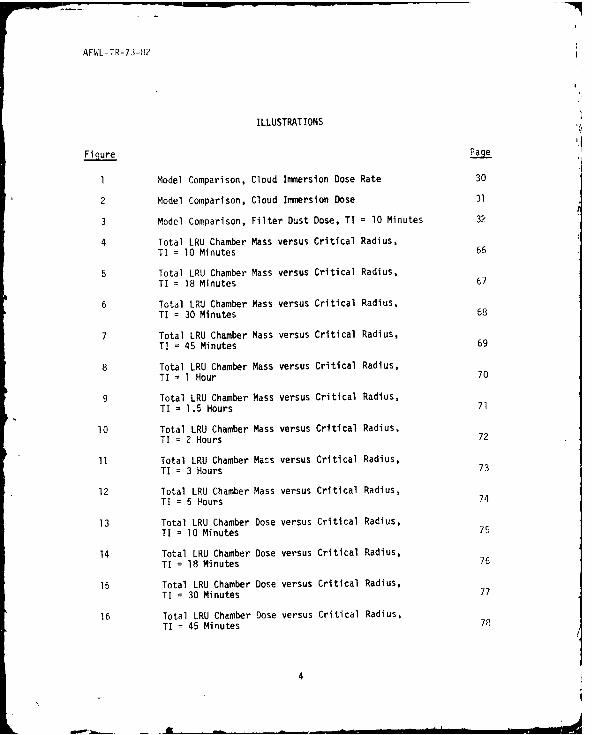
ILLUSTRATIONS
Figure Page
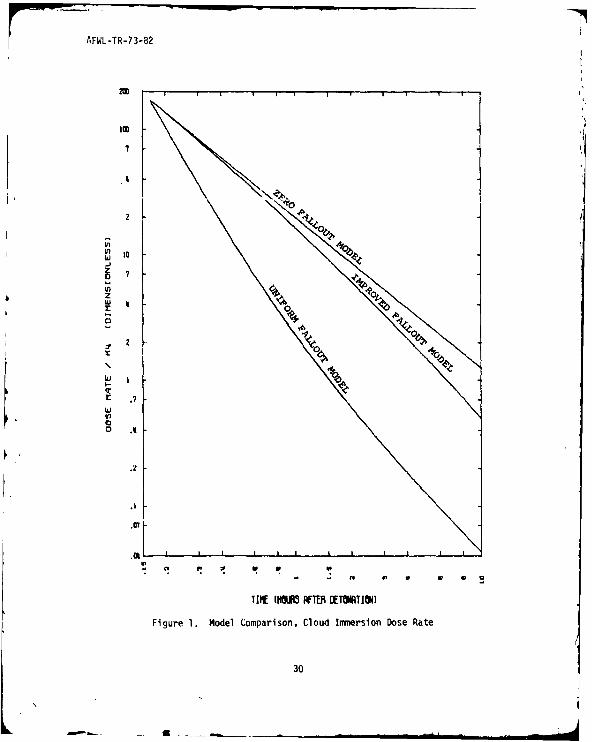
1 Model Comparison, Cloud Immersion Dose Rate 30
2 Model Comparison, Cloud Immersion Dose 31
3 Model Comparison, Filter Dust Dose, TI = 10 Minutes 32
4 Total LRU Chamber Mass versus Critical Radius,TI = 10 Minutes 66
5 Total LRU Chamber Mass versus Critical Radius,TI = 18 Minutes 67
6 Total LRU Chamber Mass versus Critical Radius,TI = 30 Minutes 68
7 Total LRU Chamber Mass versus Critical Radius,TI = 45 Minutes 69
8 Total LRU Chamber Mass versus Critical Radius,TI = 1 Hour 70
9 Total LRU Chamber Mass versus Critical Radius,
TI = 1.5 Hours 71
10 Total LRU Chamber Mass versus Critical Radius,TI = 2 Hours 72
11 Total LRU Chamber Mass versus Critical Radius,TI = 3 Hours 73
12 Total LRU Chamber Mass versus Critical Radius,TI = 5 Hours 74
13 Total LRU Chamber Dose versus Critical Radius,TI = 10 Minutes 75
14 Total LRU Chamber Dose versus Critical Radius,TI = 18 Minutes 76
15 Total LRU Chamber Dose versus Critical Radius,TI = 30 Minutes 77
16 Total LRU Chamber Dose versus Critical Radius,TI = 45 Minutes 7,
4
AFWL-TR-73-82
ILLUSTRATIONS (cont'd)
Figure Page
17 Total LRU Chamber Dose versus Critical Radius,TI = 1 Hour 79
18 Total LRU Chamber Dose versus Critical Radius,TI = 1.5 Hours 80
19 Total LRU Chamber Dose versus Critical Radius,TI = 2 Hours 81
20 Total LRU Chamber Dose versus Critical Radius,TI = 3 Hours 82
21 Total LRU Chamber Dose versus Critical Radius,TI = 5 Hours 83
22 Typical Aircraft LRU 84
23 Planar Distributed Source 85
Al Mass Rate of Flow of Dust to Engines or Filter 102
A2 Filter/Engine Dust Mass as a Function of Time 103
A3 Dose Rate from Dust in Filter, TI = 10 Minutes 104
A4 Dose Rate from Dust in Filter, TI = 1 Hour 105
A5 Radiation Dose from Dust in Filter, TI = 10 Minutes 106
A6 Radiation Dose from Dust in Filter, TI = 1 Hour 107
A7 Cloud Immersion Dose Rate 108
A8 Cloud Immersion Dose 109
A9 Dose Rate from Dust on Aircraft Exterior 110
A10 Radiation Dose from Dust on Aircraft Exterior I1
Bl Particle Size Distribution Function 129
B2 Particle Mass Distribution Function 130
83 Mass Rate of Dust into Filter versus Time and Size 131
B4 Mass of Dust Accumulated in the Filter versus Timeand Size 132
B5 Perfect Filter Mass Distribution Function, TI = 10 Minutes 133
5
AF14L-TR-73-82
ILLUSTRATIONS (cont'd)
Figure Page
B6 Perfect Filter Mass Distribution Function, TI = 18 Minutes 134
B7 Perfect Filter Mass Distribution Function, TI = 30 Minutes 135
B8 Perfect Filter Mass Distribution Function, TI = 4E Minutes 136
B9 Perfect Filter Mass Distribution Function, TI = I Hour 137
B10 Perfect Filter Mass Distribution Function, TI = 1.5 Hours 138
Bl Perfact Filter Mass Distribution Function, TI = 2 Hours 139
812 Perfect Filter Mass Distribution Function, TI = 3 Hours 140
B13 Perfect Filter Mass Distribution Function, TI = 5 Hours 141
B4 Cumulative Mass as a Function of Size, TI = 10 Minutes 142
815 Cumulative Mass as a Function of Size, TI = 18 Minutes 143
B16 Cumulative Mass as a Function of Size, TI = 30 Minutes 144
B17 Cumulative Mass as a Function of Size, TI = 45 Minutes 145
B18 Cumulative Mass as a Function of Size, TI = 1 Hour 146
B19 Cumulative Mass as a Function of Size, TI = 1.5 Hours 147
B20 Cumulative Mass as a Function of Size, TI , 2 Hours 148
B21 Cumulative Mass as a Function of Size, TI - 3 Hours 149
B22 CumulativE Mass as a Function of Size, TI = 5 Hours 150
B23 Filter Dust Mass as a Function of Time 151
B24 Dose from Filter Dust at 30 Hours, TI = 10 Minutes 152
B25 Dose from Filter Dust at 30 Hours, TI = 18 Minutes 153
B26 Dose from Filter Dust at 30 Hours, TI = 30 Minutes 154
B27 Dose from Filter )ust at 30 Hours, TI = 45 Minutes 155
B28 Dose from Filter Dust at 30 Hours, TI = 1 Hour 156
B29 Dose from Filter Dust at 30 Hours, TI = 1.5 Hours 157
B30 Dose from Filter Dust at 30 Hours, TI = 2 Hours 158
6
AFWL-TR-73-82
ILLUSTRATIONS (cont'd)
Figure _a,
B31 Dose from Filter Dust at 30 Hours, TI = 3 Hours 159
B32 Dose from Filter Dust at 30 Hours, TI = 5 Hours 160
B33 Cumulative Filter Dose at 30 Hours, TI = 10 ':inutes 161
B34 Cumulative Filter Dose at 30 Hours, TI = 18 Minutes 162
B35 Cumulative Filter Dose at 30 Hours, TI = 30 Minutes 163
B36 Cumulative Filter Dose at 30 Hours, TI = 45 Minutes 164
B37 Cumulative Filter Dose at 30 Hours, TI = 1 Hour 16S
B38 Cumulative Filter Dose at 30 Hours, TI = 1.5 Hours 166
B39 Cumulative Filter Dose at 30 Hours, TI = 2 Hours 167
B40 Cumulative Filter Dose at 30 Hours, TI = 3 Hours 168
B41 Cumulative Filter Dose at 30 Hours, TI = 5 Hours 169
B42 Cumulative Filter Dose at 30 Hours, TI = 10 Minutes 170
B43 Cumulative Filter Dose at 30 Hours, TI = 18 Minutes 17,
B44 Cumulative Filter Dose at 30 Hours, TI = 30 Minutes 172
B45 Cumulative Filter Dose at 30 Hours, TI = 45 Minutes 173
B46 Cumulative Filter Dose at 30 Hours, TI = I Hour 174
B47 Cumulative Filter Dose at 30 Hours, TI = 1.5 Hours 175
B48 Cumulative Filter Dose at 30 Hours, TI = 2 Hours 176
B49 Cumulative Filter Dose at 30 Hours, TI = 3 Hours 177
B50 Cumulative Filter Dose at 30 Hours, TI = 5 Hours 178
B51 Filter Dose as a Function of Time, TI = 10 Minutes 179
B52 Filter Dose as a Function of Time, TI = 18 Minutes 180
B53 Filter Dose as a Function of Time, TI = 30 Minutes 181
854 Filter Dose as a Function of Time, TI = 45 Minutes 182
B55 Filter Dose as a Function of Time, TI = 1 Hour 183
7

AIWL-TR-73-82
ILLUSTRATIONS (cont'd)
Figure Pace
B56 Filter Dose as a Function of Time, TI = 1.5 Hours 184
857 Filter Dose as a Function of Time, TI = ? Hours 185
B58 Filter Dose as a Function of Time, TI = 3 Hours 186
B59 Filter Dose as a Function of Time, TI = 5 Hours 187
B60 Cloud Immersion Dose Rate 188
861 Cloud Immersion Dose 189
B62 Filter Dust Dose Rate, TI = 10 Minutes 190
B63 Filter Dust Dose Rate, TI 18 Minutes 191
364 Filter Dust Dose Rate, TI = 30 Minutes 192
B65 Filter Dust Dose Rate, TI 45 Minutes 193
B66 Filter Dust Dose Rate, TI = 1 Hour 194
B67 Filter Dust Dose Rate, TI = 1.5 Hours 195
B68 Filter Dust Dose Rate, TI = 2 Hours 196
B69 Filter Dust Dose Rate, TI = 3 Hours 197
B70 F.Iter Dust Duse Rate, TI = 5 Hours 198
B71 Specific Activity Distribution Function 199
C1 Filter Dust Mass as a Function of Time 203
C2 Filter Dose Rate as a Function of Time, TI = 10 Minutes 204
C3 Filter Dose Rate as a Function of Time, TI = 1 Hour 205
C4 Filter Dose as a Function of Time, TI = 10 Minutes 206
C5 Filter Dose as a Function of Time, TI = 1 Hour 207
C6 Cloud Immersion Dose Rate 208
C7 Cloud Immersion Dose 209
Dl Cockpit Dust Mass Distribution Function, TI = 10 Minutes 224
D2 Cockpit Dust Mass Distribution Function, TI = 18 Minutes 225
8

AFWL-TR-73-82
ILLUSTRATIONS (cont'd)
Figure Page
D3 Cockpit Dust Mass Distribution Function, TI = 30 Minutes 226
D4 Cockpit Dust Mess Distribution Function, TI = 45 Minutes 227
D5 Cockpit Dust Mass Distribution Function, TI = 1 Hour 228
D6 Cockpit Dust Mass Distribution Function, TI = 1.5 Hours 229
D7 Cockpit Dust Mass Distribution Function, TI = 2 Hours 230
D8 Cockpit Dust Mass Distribution Function, TI = 3 Hours 231
09 Cockpit Dust Mass Distribution Function, TI n 5 Hours 232
DiO Cumulative Dust Mass in Cockpit, TI 10 Minutes 233
Dll Cumulative Dust Mass in Cockpit, TI = 18 Minutes 234
D12 Cumulative Dust Mass in Cockpit, TI = 30 Minutes 235
D13 Cumulative Dust Mass in Cockpit, ri = 45 Minutes 236
D14 Cumulative Dust Mass in Cockpi',, TI = 1 Hour 237
D15 Cumulative Dust Mass in Crckpit, TI = 1.5 Hours 238
D16 Cumulative Dust Mass in Cockpit, TI = 2 Hours 239
D17 Cumulative Dust Mass in Cockpit, TI = 3 Hours 240
D18 Cumulative Dust Mass in Cockpit, TI = 5 Hours 241
D19 Dust Mass Collected in the Cockpit 242
D20 Cockpit Dust Dose Distribution at 30 Hours,TI = 10 Minutes 243
D21 Cockpit Dust Dose Distribution at 30 Hours,TI = 18 Minutes 244
D22 Cockpit Dust Dose Distribution at 30 Hours,TI = 30 Minutes 245
D23 Cockpit Dust Dose Distribution at 30 Hours,TI - 45 Minutes 246
D24 Cockpit Dust Dose Distribution at 30 Hours,TI = 1 Hour 247
9
AFWL-TR-73-82
ILLUSTRATIONS (cont'd)
Figure Page
D25 Cockpit Dust Dose Distribution at 30 Hours,TI = 1.5 Hours 248
D26 Cockpit Dust Dose Distribution at 30 Hours,TI = 2 Hours 249
D27 Cockpit Dust Dose Distribution at 30 Hours,TI = 3 Hours 250
D28 Cockpit Dust Dose Distribution at 30 Hours,TI = 5 Hours 251
D29 Cumulative Cockpit Dose at 30 Hours, TI = 10 Minutes 252
D30 Cumulative Cockpit Dose at 30 Hours, TI = 18 Minutes 253
D31 Cumulative Cockpit Dose at 30 Hours, TI = 30 Minutes 254
D32 Cumulative Cockpit Dose at 30 Hours, TI = 45 Minutes 255
D33 Cumulative Cockpit Dose at 30 Hours, TI = 1 Hour 256
D34 Cumulative Cockpit Dose at 30 Hours, 71 = 1.5 Hours 257
D35 Cumulative Cockpit Dose at 30 Hours, TI = 2 Hours 258
D36 Cumulative Cockpit Dose at 30 Hours, TI = 3 Hours 259
D37 Cumulative Cockpit Dose at 30 Hours, TI = 5 Hours 260
D38 Cockpit Dust Dose, TI = 10 Minutes 261
D39 Cockpit Dust Dose, TI = 18 Minutes 262
D40 Cockpit Dust Dose, TI = 30 Minutes 263
D41 Cockpit Dust Dose, TI = 43 Minutes 264
D42 Cockpit Dust Dose, TI = 1 Hour 265
D43 Cockpit Dust Dose, TI = 1.5 Hours 266
D44 Cockpit Dust Dose, TI = 2 Hours 267
D45 Cockpit Dust Dose, TI = 3 Hours 268
D46 Cockpit Dust Dose, 7I = 5 Hours 269
10

AFWL-TR-73-82
ILLUSTRATIONS (cont'd)
Figure Pa.F
D47 Cockpit Dust Dose Rate, TI = 10 Minutes 270
D48 Cockpit Dust Dose Rate, TI = 18 Minutes 271
D49 Cockpit Dust Dose Rate, TI = 30 Minutes 272
D50 Cockpit Dust Dose Rate, TI = 45 Minutes 273
D51 Cockpit Dust Dose Rate, TI = 1 Hour 274
D52 Cockpit Dust Dose Rate, TI = 1.5 Hours 275
D53 Cockpit Dust Dose Rate, TI = 2 Hours 276
D54 Cockpit Dust Dose Rate, TI = 3 Hours 277
D55 Cockpit Dust Dose Rate, TI = 5 Hours 278
'.1
AFWL-TR-73-82
ABBREVIATIONS AND SYMBOLS
Acp Cross-sectional flow drea of the cockpit, cm2
A(t) Specific activity function, photonsihour-gram(dust)
A(r,t) Specific activity distribution, photons/hour-gram(dust)-micron
A (t) Beta particle specific activity, disintegrations/hour-gram(dust)
A (r,t) Beta particle specific activity distribution,disintegrations/hour-gram(dust)-micron
Al Constant
C Conversion factor, rads(tissue)-cm 2/photon
CD cp(r) Cumulative cockpit dose, rads(tissue)
CDf(r) Cumulative filter dose, rads(tissue)
C.F. Correction factor, point to vertical distributed source
C.F., Correction factor, point to horizontal distributed source
CM cp(r) Cumulatiie cockpit mass, grams
CMf(r) Cumulative filter mass, grams
C (r,t) Beta particle specific activity distribution,
microcuries/gram(dust)-micron
C Total microcurie dose, microcuries
D ae(t) Dose rate from dust on aircraft exterior, rads(tissue)/hour
D ae(t) Dose from dust on aircraft exterior, rads(tissue)
Dc(t) Cloud immersion dose rate, rads(tissue)/hour
Dc C Cloud immersion dose, rads(tissue)
Dc(t) Cloud immersion dose, rads(tissue)
Dcm Marginal crew dose, rads(tissue)
D cp(r,t) Cockpit dust dose rate distribution, rads(tissue)/hour-micron
D cp(r) Cockpit dust dose distribution, rads(tissue)/micron
12
As

AFWL-TR-73-82
f IATIONS AND SYMBOLS (cont'd)
D cp(t) Cockpit dust dose function, rads(tisstie)
D c(r,t) Cloud immersion dose rate distribution, rads(tissue)/Kour-micron
Ds Crew susceptibility threshold dose, rads(tissue)
Dem Marginal equipment dose, rads(Si)
Des Equipment susceptibility threshold dose, rads(Si)
Df(r,t) Filter dust dose rate distribution, rads(tissue)/hour-micron
Df(r) Filter dust dose distribution, rads(tissue)/micron
Df(t) Filter dust dose rate function, rads(tissue)/hour
Df(t) Filter dust dose function, rads(tissue)
DI(r,t) Dust inhalation mass rate distribution, grams/sec-micron
DIN(r) Nasal dust inhalation mass distribution, grams/micron
DIp(r) Pulmonary dust inhalation mass distribution, grams/micron
DN Dose from dust in nasal cavity, rads(tissue)
Dp Dose from dust in pulmonary tract, rads(tissue)
Dpp Dose rate at an electronics piecepact, rads(Si)/hour
DSD Dose rate due to cockpit suspended dust, rads(tissue)/hour
DT(t) Total dose, rads(tissue)
ED Relative dose effectiveness
ED10 Effective dose for 10 percent incidence of vomiting
FE(r) Filter trapping efficiency function
G Dust mass, grains
ILBcm Crew member initial lung burden, mci/kg
iv Inhaled volume rate, cm3/sec
Ki Nondimensionalizing constant, gm(dust)/hour
K2 Nondimensionalizing constant, gm(dust)/hour
K3 Nondiriensionalizing constant, rads(tissue)/hour
13
AFWL-TR-73-82
ABBREVIATIONS AND SYMBOLS (cont'd)
K4 Nondimensionalizing constant, rads(tissue)dhour
Ks Nondimensionalizing contant, rads(tissua)/hour
K Nondimeneionalizing constant, gm(dust)/cm
L Cockpit 'low length, cm
Lf Weapon loading factor, megatons/kilometer2
Lfo baseline weapon loading factor, megatons/kilometer2
Mcp(r,t) Cockpit dust mass rate of accumulation distribution,grams(dust)/hour-micron
M (rt) Cockpit dust mass distribution, grams(dust)/microncpScp(r) Cockpit dust mass distribution, grams(dust)/micron
Mcp(t) Cockpit dust mass function, grams(dust)
Me(t) Engine dust mass rate of flow, grams(dust)/hour
M e(t) Engine dust mass, g .ms(dust)
e/f(t) Engine/filter dust mass rate of flow, grams(dust)/hour
Me/f(t) Engine/filter dust mass, grams(dust)
Mi(r,t) Filter dust mass rate of flow distribution, grams/hour-micron
Mf(r,t) Filter dust mass distribution, grams/micron
Mf(t) Filter dust mass rate of flow, grams/hour
Mf(t) Filter dust mass, grams
Mt Total mass, grams
N Constant of proportionality
NA(r) Nasal dust accumulation distribution
Ps (r) Particle settling probability
PT(r) Pulmonary dust accumulation distribution
R Cloud radius, kilometers
Rc Critical settling radius, microns
14
AFWL-TR-73-82
ABBREVIATIONS AND SYMBOLS (cont'd)
Re Reynolds number
R(t) Particle size fallout (Nibbling Mouse) function, microns
TF Cloud 3xit time, hours after detonation
TI Cloud entry time, hours after detonation
Tmc Time of mission completion, hours after detonation
TSF Time scaling factor
T(t) Shorthand notation for a functional evaluation at t
TT(t) Shorthand notation for a functional evaluation at t
VH Horizontal velocity, cm/sec
Vs Settling velocity, cm/sec
Vs Critical settling velocity, cm/sec
W Weapon yield, megatons
a Length measurement, cm
ai Variable, grams(dust)/cm3
b Constant
b1 Cockpit radius, cm
d Distance measurement, cm
d 4 Distance from nasal cavity to epigastric region, cm
ds Distance from pulmonary tract to epigastric region, cm
f(r) Particle number distribution, particles/cml-micron
f(r,t) Particle number distribution function, particles/cm -micron
fl Constant
f2 Constant
g Length measurement, cm
h Cockpit height, cm
1 Constant
K
AFWL-TR-73-82
ABBREVIATIONS AND SYMBOLS (cont'd)
m Constant
mae Engine air mass rate of flow, gram/hour
maf Filter air mass rate of flow, gram/hour
m. ith mass element
m(r) Mass per volume distribution, grams/cm 3-micron
n Constant
p Radius length, cm
r Particle radius, microns
rn Particle radius defined by R(tn), microns
Si i th distance
t Time, hours after detonation
tf Cloud exit time, hours after detonation
t i Cloud entry time, hours after detonation
tL Last time dummy variable for numerical integration
tn Particular time point used in numerical integration ton generate rn via rn = R(tn)
x Cockpit settling distance, cm
y Plane radius, cm
z Distance above plane, cm
AT Cloud penetration time, hours
0 Angle measurement
6 Activity breakpoint, microns
u' Mass attenuation factor
Pa Density of air, grams/cm3
Pacp Density of air in the cockpit, grams/cm3
Pd(r,t) Dust density distribution, grams(dust)/cm3-micron
16
AFWL-TR-73-82
ABBREVIATIONIS AND SYMBOLS (cont'd)
Pd (r) Dust density distribution, grams(dust)/CM3-Micron
Od(t) Dust density function, grams(dust)/crn3
Pdo(t) Baseline dust density function, grams(dust)/cm'
Or Dust particle density, grams(dust)/cm3
Cockpit crossing time, sec
17/18

AFWL-TR-73-82
SECTION I
INTRODUCTION
In the event of a nuclear war, strategic aircraft are su)ject to accidental
or deliberate penetration of the late time (10 minutes or longer after detona-
tion) radioactive dust clouds generated by surface detonations of large-yield
nuclear weapnns. Because of the presence of numerous clouds from enemy first-
strike attacks, the majority of cloud penetrations will occur during the 1:gh-
altituoe, Continental United States (CONUS) exit phase of the strategic mission.
Penetrations of radioactive clouds by manned aircraft pose potential hazards
to the mission of the aircraft in three ways. First, the crew of the aircraft
is susceptible to ionizing radiation and to direct contact with the radioactive
particles. Second, the electronic equipment can be degraded by ionizing radia-
tion. Third, the dust ingested by the engines could cause erosion of the com-
pressor blades and/or other degradation.
Consider first the crew. They are subject to ionizing doses from immersion
in the "infinite"*radiating cloud, from dust accumulations on the aircraft
exterior, From the dust accumulated in the cockpit, and from dust accumulations
elsewhere in the aircraft. Dust accumulations in the interior of the aircraft
are due to the ingestion of large amounts of air to cool heavy-duty electronics
equipment and to provide cockpit pressurization and air conditioning. Because
of the continuous ingestion of outside, contaminated air, the crew is also
subjected to direct contact with the radioactive dust and to inhalation of the
dust suspended in the air. All of the factors above are potential crew-disabling
hazards. Each must be thoroughly investigated to determine the seriousness of
its impact on crew performance and to determine corrective actions required to
minimize this impact.
Because outside air is used to cool electronic equipment, radioactive dust
could be introduced into the innermost parts of the electronics. Although the
amount of dust accumulated in any one Line Replaceahle Unit (LRU) or "black box"
is relatively small, the doses accumulated by susceptible piece parts could be
quite large because of the nearness of the dust to piece parts requiring cooling,
*"Infinite" implies a spherical radius such that the majority of phctons emitted
outside the sphere are atsorbed b- the atmosphere, i.e., about 3000 meters.
19
AFWL-TR-73-82
i.e., as near as 1 centimeter. Therefore, ionizing dose is a potential cause
of degradation and must be investigated. (In today's electronics, the piece
parts are mounted on printed circuit cards which are not cooled directly by *he
air. The air flows through sealed plenum chambers and carries away heat in the
wall, generated by high-power devices. There is no direct contact between the
piece parts and the dust, and only ionizing gamma radiation is of concern.)
The potential problems caused by ingestion of the dust into the engine will
be addressed only to the extent that the amount and size distrib.tion of the
dust will be determined. This information could be used by engine desigo and
test engineers Lo determine whether or not a problem exists. Detailed investi-
gation of the &.fects of the ingested dust on engine performance is not within
the scope of this report.
The first stage of the investigation contained in this report is the deter-
mination of the clrad characteristics of interest and the formulation of simple
engineering model, which approximate the behavior of the cloud with time. Filter
design criteria are then discussed. (These are the inputs needed by a designer
to design and locate the filter in the aircraft.) Techniques necessary to select
a set of filter design criteria are presented. Next a detailed examination of
the cockpit dust accumulation, the effects of the cockpit dust on the crew, and
the application of the filter selection techniques to choose the optimum cockpit
filter are presented. A similar examination dealing with the electronics LRUs
is then presented.
In the detailed analyses, maximum effort was expended to make the results
general and applicable to any mission, threat, aircraft, and electronics equip-
ment. The results are generally presented in nondimensional form where the non-
dimensionalizing constants are functions of the mission, threat, etc. However,
the calculations of the dust and dose accumulations in the cockpit depend on
specific cockpit size and genmetry. Therefore, these results are presented for
a four to six man cockpit, representative of a manned bomber, transport, tanker,
and other large aircraft. If cockpits or cabins cannot be reasonably represented
by this model, the analysis must be reaccomplished with a more suitable model.
For example, the model and results for the cockpit presented herein may not be
adequately representative of fighter cockpits, or large pressurized cargo areas
of transports.
20
LS
AFL-TR-73-82
SECTION II
SYNOPSIS OF CLOUD CHARACTERISTICS
1. DUST DENSITY FOR BASELINE THREATS
To analyze the problems associated wit". an aircraft penetrating the high-
altitude, dusty, radioactive clouds associated with surface detonations of
nuclear weapons, one must first postulate a reasonable threat. In this work,
the starting point is the results obtained by WhitaKer (ref. 1), who postula-ed
two separate situations. The first was a single surface burst of a 4-megaton
nuclear weapon. The second was masive simultaneous surface detonations of four
hundred 5-megaton weapons distributed uniformly over a 200 x 200-kilometer
surface. The first threat may be likened to an attack on a single hard target.
The second may be likened to a first strike attack on USAF missile fields.
Based on output of complex dust computer -odes and his years of study of
nuclear dust clouds, Whitaker determined dut densities of the cloud as a func-
tion of time and the spatial extent of the clouds associated with the above
threats.
Several factors shooid be understood at the onset whirh bear directly on the
relation of the dust environment to specific mission and threat dependent
variables. First, surface bursts maximize the dust environments and for this
reason they are emphasized here. Second, attention is restricted to the dust
envi-onments at late times, i.e., aircraft cloud entry 10 minutes or more after
the uurst. This restriction is primarily based on the practical consideration
that at early times the aircraft crew would be more concerned with the immediate
hazards of encountering large solid particles (centimeter to meter range) and in
interactions with severe burst-induced turbulence. Third, at these late times
the major part of the burst-induced turbulence has subsided, very large particles
have fallen out, and the temperature of the cloud is relatively close to ambient.
Therefore, the 10-minute point marks the end of hydrodynamic motion and the
beginning of a phase which may be considered pure fallout in a comparatively
static atmosphere. The dust cloud is generally localized around the burst point
and has a relatively homogeneous spatial density distribution as a result of
21
A-
AFWL-TR-73-82
prior mixing. Finally, the effects of any spatial density gradients which exist
within the cloud are assumed to be of little importance to the aircraft b'cause
integral effects (e.g., total mass collected and associated doses), rather than
instantaneous effects, are more important in this analysis.
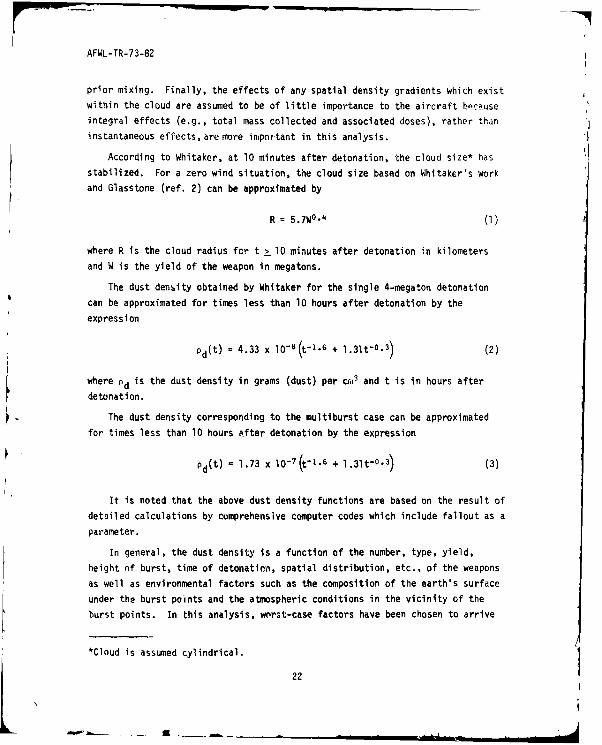
According to Whitaker, at 10 minutes after detonation, the cloud size* has
stabilized. For a zero wind situation, the cloud size based on Whitaker's work
and Glasstone (ref. 2) can be approximated by
R = 5.7W °.4 (1)
where R is the cloud radius for t > 10 minutes after detonation in kilometers
and W is the yield of the weapon in megatons.
The dust density obtained by Whitaker for the single 4-megaton detonation
can be approximated for times less than 10 hours after detonation by the
expression
Pd(t) = 4.33 x 10⁻⁸ -. + 1.31t-0.3) (2)
where Od is the dust density in grams (dust) per ca3 and t is in hours after
detonation.
The dust density corresponding to the multiburst case can be approximated
for times less than 10 hours after detonation by the expression
Pd(t) = 1.73 x 10⁻⁷ '(t-16 + 1.31t-0.3) (3)
It is noted that the above dust density functions are based on the result of
detailed calculations by comprehensive computer codes which include fallout as a
parameter.
In general, the dust density is a function of the number, type, yield,
height of burst, time of detonation, spatial distribution, etc., of the weapons
as well as environmental factors such as the composition of the earth's surface
under the burst points and the atmospheric conditions in the vicinity of the
burst points. In this analysis, worst-case factors have been chosen to arrive
*Cloud is assumed cylindrical. 22

AFWL-TR-73-82
at the distributions above. These assumptions include zero wind, representative
soil conditions, dry temperate atmosphere, and 1 megaton of dust aloft per
megaton yield at l? minutes after detonation. The densities above were obtained
based on these assumptions.
2. DUST DENSITY FOR A GENERAL THREAT
The dust densities Pbove are based on specific threats. To support a general
analysis addressing other threats, a general dust density is required. To
realize this objective, a weapon loading factor, Lf, was originated. This factor
is defined as
Lf = TOTAL MEGATONS OF WEAPON(S) (4)AREA OF DUST CLOUD IN km
2
Ciis factor is an indication of the intensity of the attack and is related to
the dust density because of the assumption that 1 megaton of dust is aloft at
10 minutes after detonation per megaton of yield.
Consider now the single, 4-megaton weapon detonation as a baseline load
factor, Lfo.L
4 (5)Lfo 0 R
2
where
R = 5.7(4)0.4
(6)
Therefore,
= 0.0125 MT (7)f0 km
2
The general dust density can be expressed in the form
Lf
Pd(t) = fo Pd (t) (8)
f f 0 o
or, usinq equations (2) and (7), this expression reduces to
23
AFWL-TR-73-82
Pd(t) = 3.46 x 10⁻⁶ Lf(t-.6 + 1.31t-0.3) (9)
As a check of this expression, consider the multiburst situation. The
weapon loading factor is
L 400 x 5 (10)f x 200
Lf 0.05 MT (11)km
2
The dust density is
Pd(t) = 3.46 x 10⁻⁶ (0.05) (t-1.6 + 1.31t-.3) (12)
or
Pd(t) = 1.73 x lO- 7 (t-1. 6 + 1.31 t-0. 3) (13)
which is identical to the result previously obtained by Whitaker.
The dust density for any iven threat then can be determined by first calcu-
lation of the weapon loading factor and substituting into the general expression.
It is emphasized again that this entire development is pertinent only for surface
detonations and megaton size weapons.
3. DUST CLOUD ACTIVITY
Now that the dust density is determined, the specific activity must be
investigated. It is assumed that fission fragments are generated at a rate of
3 x 1026 fission fragments per megaton (i.e., 100 percent fission yield) and are
uniformly distributed over the same volume as the dust cloud at 10 minutes after
detonation (ref. 2). Using the average decay relation of radioactive debris
from Glasstone (ref. 2) and Whitaker's 10-minute result, the fullowing relation
is obtained.
A(t) = 4.22 x 10¹² t- 1
.2 .hotons 00
hour-gram(dust)
where t is in hours after detonation.
24

AFWL-TR-73-82
It is noted that since the yield is assumed to be 100 percent fission,
neutron activation of surface materials is not a significant factor in the
cloud ra'ioactivity. If a significant portion of the yield is fusion, then
fcwer fission products will be generated. However, because of the higher
energy neutrons released from the fusion process, neutron activation of surface
materials can be significant. Therefore, in general, the cloud's radioactivity
is not a simple function of the yield as is assumed in this work, but is quite
complex. However, the 100 percent fission yield assumption should yield
results which provide an upper bound on the actual results.
25

AFWL-TR-73-82
SECTION III
COMPARISON OF DUST CLOUD MODEL RESULTS
1. DUST CLOUD MODELS
The expressions for the dust densities and specific activities developed in
the previous section were used in the development of three cloud models, which
approximate the actual JIoud behavior. These cloud models were used in a perfect
filter* analysis of an hircraft environmental control system. In this section,
the various cloud models developed will be discussed briefly, and the results of
the perfect filter analysis for each model will be compared. Based on this com-
parison, one dust cloud model will be chosen as the baseline model to be used in
the subsequent detailed analyses.
The first dust cloud model developed was the Uniform Fallout Model, described
in detail in appendix A. This model is a first-order approximation to the actual
dust cloud. It takes fallout into account, but in a rather simple fashion. The
dust cloud in this model may be considered to consist of dust particles uniform
in size and activity. Therefore, the governing equations are relatively simple
and easy to use, but are not functions of particle size. An obvious disadvantage
to this model then is that it would not furnish the filter designer a trapped
mass distribution as a function of particle size. Because of the lack of particle
size dependency, the results may also not be realistic.
The second model developed was the Improved Fallout Model (appendix B). In
this model, particle size was taken into account both in the rela'ion for the
dust density and the specific activity. The dens4ty distribution was obtained
through the consideration of a number-distribution function based on a typical
soil at the burst point. The activity as a function of partizle size was assum'ed
to be proportional to the particle volume for very small particles and to the
*A perfect filter is defined to be a filter which traps, or collects, all dustparticles which enter the environmental control systemregardless of the sizeof the particles.
26
U
7 ' AFIWL-TR-73-82
particle surface area for larger particles. This assumption is based on the
consideration that small particles are predominately condensed bomb debris,
whereas larger particles are composed of an inert cL.re of soil covered with a
surface coating of weapon debris. The specific activity (particle activity/
particle mass) is a function of particle size and time after detonation (to
account for the radioactive decay of the fission fragments). Fallout is
modeled after Stokes Law which states that for small particles, fallout
velocity is proportional to the square of the particle size. This model is a
great deal more representative of the actual cloud behavior but is still a
homogeneous cloud model, i.e., no variation in cloud parameters with altitude
or range from the point -f detonation.
The third and last model developed (appendix C) was the Zero Fallout Model.
Th-s model represents a limit case where there is no fallout and is useful in
tli~s report only as an extreme worst-case standard of comparison. The only
time dependence in this model is the radioactive decay of the fission products.
The dust density and the mass rate of flow to the filter are constant during
cloud penetration. The use of this crude model in a penetration analysis would
lead to gross overde-.ign of the filter and is presented only as a limit case
and as a standard of comparison.
It is noted that the detailed results from all cloud models in appendixes
A through C are nondimensional. The nondimensionalizing constants, Ki through
K5, (defined in equation (A-44)) take into account specific threat, aircraft,
mission profile, distance from source (when applicable), and photon energy.
It is also noted that the aircraft is assumed to enter the cloud at some
cloud entry time, TI, and exit the cloud at a time, TF .re TF = TI + AT, and
AT is the penetration duration.
2. PERFECT FILTER RESULTS
A major objective of this report is to provide results which can be used to
set aircraft filtration requirements. Because of the necessity to provide
adequate protection to the crew and electronic equipment, and the cost and weight
restraints on any aircraft filter design, the filter must provide protection
against any reasonable worst-case cloud penetration, but must not be grossly
overdesigned. The cloud model then must be capable of supporting the design
criteria selection and must produce realistic results.
27
-- - - - --
AFWL-TR-73-82
The two models which will be investigated as candidates to support the
penetration analyses are the Uniform Fallout Model and the Imp-oved Fallout
Model. It is apparent at first glance that the Zero Fallout Model would predict
results leading to gross overdesign of the f'Iter and is not a candidate.
Consider the dust mass trapped by a perfect filter during penetrations of
clouds modeled by the two candidates. The total mass trapped as a function oftime is identical. However, the Improved Fallout Model has the capability also
of predicting the particle size distribution of the trapped mass. This addedcapability is significant and would provide a designer with more information to
aid in the filter design.
The most significant differences in the two candidate models are in the dose
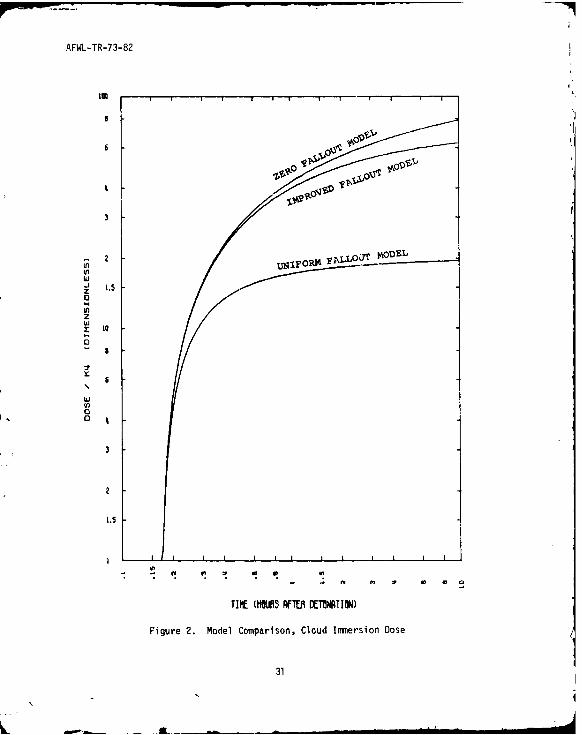
and dose rate predictions. Figures 1 and 2 depict the cloud immersion dose
rates and doses respectively as a function of time for the two candidate models
with the Zero Fallout Model results shown as a standard. The Uniform Fallout
Model dose rate decreases with time at early times at a significantly higher
rate than the Improved Fallout Model. This difference is caused by the differ-ences in the cloud models. The particle sizes and associated activities in the
Uniform Fallout Model are all equal. Therefore, fallout equally affects thedust density and the cloud activity. The dust density and the specific activity
of the dust in the Improved Fallout Model are dependent on the particle size.
The larger particles are less radioactive per unit mass than the small ones.
Early fallout is associated with the large particles which have relatively lower
activities. The smaller, more radioactive particles remain aloft. Therefore,
the dose rate decrease with time in the early phases of the cloud is less,although the overall dust density behavior with time is identical. At later
times, the Uniform Fallout Model dose rates results tend to level out, while the
Improved Model results tend to decrease at a greater rate. This difference
again is attributable to the same model parameter differences. In the Improved
Fallout Model, the smaller, more radioactive particles are now falling out of
the cloud taking with them relatively greater amounts of the radioactive debris.
The cloud immersion doses for TI = 10 minutes as depicted in figure 2 also
reflect major diffeences, as would be expected since the dose is merely an
integral over time of the dose rate. The Improved Fallout Model dose results
are considerably larger in value, because the smaller, more radioactive particles
remain aloft and cause mcre dose to be accumulated for a given mass of dust.
28

AFWL-TR-73-82
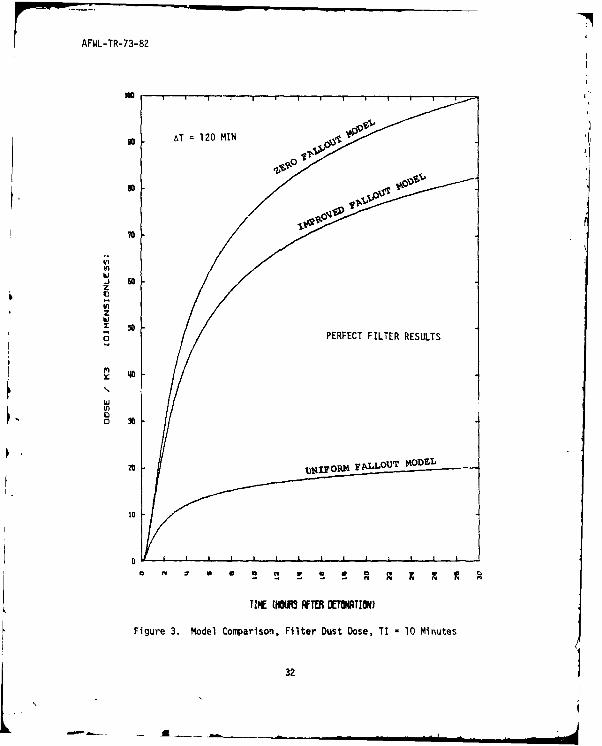
The dos.s, for TI = 10 minutes and AT = 120 minutes, due to the trapped
filter duse are depicted in figure 3. In this case also, the doses predicted
using the Improved Fallout Mode' are higher than those predicted by the Uniform
Fallout Model. This again is directly attributable to the presence of the
smaller particles which are trapped.
In summary, the total masses collected by a perfect filter are the same inhnth models. The cloud dust density as a function of time is also the same.
The Improved Fallout Model provides additional information about the size dis-
tribution of the trapped mass. The dose rates and the doses predicted by the
Improved Fallout Model are larger than those predicted by the Uniform Fallout
Model, but are still significantly lower than the limiting results from the
Zero Fallout Model.
3. SELECTION OF MODEL FOR ANALYSIS
The Improved Fallout Model is cbosen to support the aircraft penetration
analyses for the following reasons:
a. More detailed results may be obtained, i.e., trapped mass and filter
dose as functions of particle size.
b. The model more closely approximates the actual cloud behavior.
c. The dose results predicted by the use of the Uniform Fallout Model are
not conservative, and could result in underdesign of the filter, which could
compromise the aircraft mission.
In view of these considerations, all further analyses will be based on the
Improved Fallout Model of the radioactive dust clouds.
29
K : i
AFWL-TR-73-82
27
I
I
I
in 30
U -
AFWL-TR-73-82
6-
3
2 USy 'A4V;LLOOTI4 0DEL
z
z I0
w
3
1.5
TIME WflUS ORF DMTNRTIaN)
Figure 2. Model Comparison, Cloud Inmersion Dose
31
7"'AFWL-TR-73-82
700
-J 60z
zw
o PERFECT FILTER RESULTS
wi
N1IVp4F L.U 4D-
TIE(W O TTJN
Fiur 3. Moe oprsn itrDs oe I 1 iue
'32
AR

AFWL-TR-73-82
SECTION IV
FILTER DESIGN CONaIDERATIONS
The primary purpose of filters in the environmental control system (ECS) ofan aircraft during a general war mission is to minimize the ionizing doseaccumulated by the crew and 3lectronic equipment during radioactive cloud pene-trations. This section presents (1) the filter criteria required by a designerto design a filter and position it in the aircraft; (2) the procedures necessary
to arrive at this set of criteria by a planner; and (3) the procedure for adapt-ing the perfect filter model presented in appendix B to a real filter. In
general, the protection required by the crew differs from that required by theelectronic equipment. Therefure, the filter design criteria would differ.
1. DISCUSSION OF POINT DESIGN CRITERIA
The starting point of a filter design criteria selection process is anoperational analysis based on aircraft basing plans, mission routings, missionprofiles, time lines, threats, etc. The end result of this analysis would bethe determination of a Point Design Condition, which effectively means thefixing of the parameters TI, TF, Lf, and aircraft altitude. (For a given
analysis, the aircraft parameters of interest would also be known.) One majorconstraint is placed on this result. The cloud immersion ionizing dose accu-mulated for the Point Dpsign Condition must not exceed the susceptibilitythreshold levels of the crew and electronics. Filters cannot alleviate thesedoses, and if they are exceeded, the mission is it jeopardy. In fact, there
must be some margin between the cloud immersion dose and the susceptibilitythresholds to give some flexibility in the filter criteria choice. For example,if no margin is allowed, the filter effectiveness and the filter location
required to provide the necessary protection may be completely unrealistic and
unattainable.
If the Point Design Condition is not realistic in view of the above limita-tion, then an iteration is necessary, with constraints on sone of the operationalvariables, so that an acceptable Point Design Condition is obtained. This report
33
- |a . . -mf
AFWL-TR-73-82
will not dwell any further upon the selection of the Point Design Condition
because it is out of the scope of this work. From this point on, it is assumed
that the Point Design Condition is a known input. The remaining criteria selec-
tion process, however, will be examined in detail.
2. FILTER DESIGN CRITERIA
To design a filter and locate it in an aircraft, a designer must be provided
the following criteria:
a. Filter trapping efficiency.
b. Total mass of dust trapped by the filter.
c. Mass distribution of the trapped dust as a function of particle size.
d. Minimum separation distances from the filter to the crew and electronic
equipment.
The filter trapping efficiency is defined as
FE(r) = dust of radius r trapped in the filter (15)total dust of radius r entering the filter
All the dust which is not trapped by the filter could enter the cockpit or the
plenum chambers of the electronic equipment and become a source of radioactivity
which could adversely affect the mission completion capability of the aircraft.
The total mass of dust trapped is required for filter sizing, while the mass
distribution is required to support the possible necessity to stage the filter.
For example, the filter may be a two-stage design. The first stage may trap
large particles and the second stage may trap small ones. The minimum spacing
criteria would provide the designer with the input necessary to develop an
envelope of satisfactory filter locations. This envelope would be coordinated
with other designers to determine filter locations consistent with other
functional requirements.
Selection of the filter criteria is based exclusively upon the marginal
ionizing dose which may be accumulated by the crew and the electronic equipment
due to all sources except cloud immersion. The differences between the cloud
immersion dose (which in the proper units, i.e., rads(tissue) or rads(Si), is
34
• -' - -. ML .. .i , m I m i
AFWL-TR-73-82
equally applicable to both the crew and the electronics) and the susceptibility
thresholds of the crew and electronics are the basis for the filter design
criteria selection.
Based on available information, the effective dose for a 10-percent incidence
of vomiting (ED10) in man is about 70 rads(tissue) mid-epigastric dose (ref. 3).
This dose converts to about 100 rads(tissue) incident dose which iF appropriate
to the work at hand. Above this level, nausea, vomiting, and other performance
degrading responses appear in an increasing number of irradiated humans. The
electronic equipment susceptibility thresholds are equipment dependent. For
existing equipment, the values are the thresholds of dampge/upset of the equip-
ment to ionizing dose and are obtained through an assessment of the equipment.
Much equipment presently under development has a total ionizing dose requirement
laid upon it by the responsible Program Office. This requirement may be used as
the susceptibility threshold in this case. Otherwise, more detailed analysis of
the equipment must be accomplished.
At this point, it is assumed that the Point Design Condition, which yields
the cloud immersion dose, Dc, and the crew and equipment susceptibility threshold
doses (Dcs and Des) are known. The marginal crew dose, Dcm, and the marginal
equipment dose, Dcm, are
Dcm Dcs D c (16)
Dem D es D c (17)
These doses are the constraints placed on the crew and the electronic equip-
ment filter criteria selection process. In other words, the total dose due to
the trapped dust in the filters, the dust accumulated in the cockpit and avionics
equipment, and the dust on the aircraft exterior must not exceed the marginal
dose levels.
All crew doses from equipment not open-cycle, air-cooled, or equipment more
than several meters from the crew may be neglected in the crew filter criteria
selection. In general, for today's streamlined, high-speed aircraft, the amount
of dust accumulated on the aircraft exterior is minimal and may be neglected.
Because of the generally lower vulnerability of the equipment than the crew, the
35
AFWL-TR-73-82
only significart dose to consider in the equipment filter critcria selection is
that due to Oust 'rapped in its own interior. This dust wo!6 accumulate
primarily in the cooling plenum chamber, which may be only centimeters away from
the susceptible devices being cooled. Unless the equipment is located immediately
adjacent to a filter with a relatively large amount of trapped dust, the plenum
chamber dose will far exceed all other sources. For crew members, the only sig-
nificant dose contributions that will be considered here are the doses due to
cloud immersicn, the dust trapped in the filters, and dust deposited in the cock-
pit. For electronics, the only significant dose contributic'Is are due to dust
deposited in equipment which are cooled by an open-cycle cooling system and
possibly due to dust deposited in nearby filters.
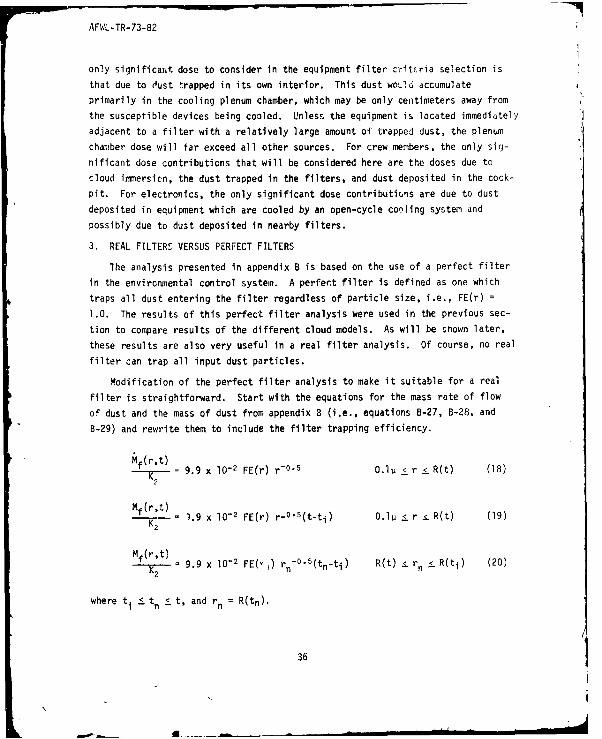
3. REAL FILTERS VERSUS PERFECT FILTERS
The analysis presented in appendix B is based on the use of a perfect filter
in the environmental control system. A perfect filter is defined as one which
traps all dust entering the filter regardless of particle size, i.e., FE(r) =
1.0. The results of this perfect filter analysis were used in the previous sec-
tion to compare results of the different cloud models. As will be shown later,
these results are also very useful in a real filter analysis. Of course, no real
filter can trap all input dust particles.
Modification of the perfect filter analysis to make it suitable for a real
filter is straightforward. Start with the equations for the mass rate of flow
of dust and the mass of dust from appendix B (i.e., equations B-27, B-28, and
B-29) and rewrite them to include the filter trapping efficiency.
Mf(r~t)
= 9.9 x 10⁻² FE(r) r-0 5 0. 1 r . R(t) (18)
K2
Mf(r,t) - .9 x 10-2 FE(r) r-0 5
(t-ti) .lu r _ R(t) (19)
K2
Mf(r,t) = x1-2FE )r0(n-(t) 2)K2 9. 0 F(, n 05tn-ti) R(t) -.rn < Ri (20
where ti i tn .t, and rn = R(tn).
36
aI
7 AFWL-TR-73-82
From this point, the technique used to determine expressions for the mass
and dose accumulated in the filter is identical to that used in appendix B
(where effectively the filter efficiency (FE) was 1) except that the factor
FE(r) must be included in all operations upon the equations. For any given
FE(r) the same technique, which consists of a mixture of analytical and numerical
integration, is used to obtain mass/dose results for the dust trapped in the
filter.
For simple filter efficiency functions, a simpler graphical technique to
obtai this result is appropriate. This technique involves using the perfect
filte results of appendix B. For example, if
FE(r) = 0 O.Ip z r lOj' (21)
FE(r) = 1.0 r 10V
use the perfect filter mass/dose distributions for r . lp, which shows the
mass/dose accumulated for a given TI, and AT, as a function of particle radius.
The total mass/dose is obtained from the cumulative results by subtracting the
value at l0p from the value at 104p. More detailed examples are presented in
reference 4.
37I
37
- - -

AFWL-TR-73-82
SECTION V
COCKPIT ANALYSIS
1. POTENTIAL CREW HAZARDS FROM COCKPIT DUST
In section IV, a general procedure which led to the determination of the
filter design criteria was described. One of the key elements in the selection
of the filter criteria was the dose due to the dust not trapped by the environ-
iental control system (ECS) filter. This dust enters the cockpit and is a
potential hazard to the crew. This section presents in detail the determination
of the ionizing crew dose resulting from the dust entering the cockpit. In
addition, the effects on the crew due to inhalation of the airborne particles
and to skin contact with these particles are investigated. For the purposes of
illustration, a Point Design Condition and a set of aircraft parameters will be
assumed and the appropriate filter criteria will be selected. The assumed
conditions were chosen deliberately not only to show how the criteria can be
obtained, but also to represent a realistic set of conditions for today's cargo
or bomber aircraft so that this example may be directly applicable to the
majority of filter criteria selections in the Air Force today.
There are essentially four concerns associated with the dust particles which
are passed by the filter. The first is the consequence of the airborne dust in
the cockpit. It is a source of ionizing dose. The second concern is the dust
which settles out in the cockpit. It is also a source of ionizing dose. The
third is the consequence of crew inhalation of the airborne dust particles. The
fourth concern is the direct contact of the radioactive dust particles with the
skin of the crew. To scope the problems associated with cockpit ingested dust,
zero filtration is assumed for the cockpit ECS.
2. DUST SUSPENDED IN COCKPIT AIR
The dust suspended in the air in the cockpit will be examined first. This
ionizing dose source is assumed to be pertinent only during the actual penetra-
tion. The air flow through the cockpit is assumed to be sufficient to ensure
that the dust density inside is the same as that outside, corrected by the cock-
pit pressurization factor, P acp/Pa. It is also assumed that the dust is
38

AFWL-TR-73-82
uniformly suspended and that the cockpit can be approximated by a sphere of 1
meter radius. The dose rate at the center of the sphere then due to the
suspended dust is
100cm pd(r,t) A(r,t) C11 - FE(r) aCe-l'b 4pbdbiD :f 4,b
2 (23)
0 1
or
C P pd(r,t) A(r,t) 1l - FE(r) I eU1'. (24)S O ( r , t ) -c p: -e 2 4
Pa 11'
Sinceij'is approximately 10-
cm"1
, the factor in the brackets is very
small and results in a very small dose rate. Iecause 1-MeV photons are assumed,
the constant C = 4.88 x 10⁻¹° rads(tis) The dose was calculated for the worstphoton/cm.
case, i.e., TI = 10 minutes, AT = 2 hours, and FE = U, and found to be on the
order of 1 rad(tissue). Therefore, this source of ionizing dose is negligible
in comparison to the other sources.
3. DUST ACCUMULATED IN COCKPIT
The second source of ionizing radiation is due to the dust particles which
settle out in the cockpit and remain in the cockpit throughout the mission. In
addition, those particles which settle on the crew members' clothing and nearby
surfaces, because of their nearness and the I/d2
nature of the phenomenon, can
contribute substantially to the total ionizing dose to the crew members. Thus,
it is important to determine th6 amount of dust settlcd out in the cockpit, to
determine its distribution relative to the crew member, and to dete %mine its
contribution to the total ionizing dose accumulated by the crew.
To obtain meaningful results, the actual cockpit, which is geometrically
very complex, must be approximated by a model which is more tractable to analysis.
The cockpit is modeled by a square box with inlet ducts on one side and outlet
ducts on the opposite side. The inlet and outlet velocities are assumed to be
uniform and on the order of the uniform velocity of air across the box. It is
also assumed that no settling occurs in the ducting between the filter and the
39
AFWL-TR-73-82
inlet duct to the cockpit. From a mass flow continuity equation and cockpit
dimension consideration, we can calculate a horizontal velocity of the air
flowing through the cockpit. Neglecting any slippage of the dust with respect
to the air, the horizontal velocity of the dust is identical to that of the
air mass. This horizontal velocity of the dust through the cockpit can be
written as
MarVH M 360 (25)H P acp A cp 30
where
Pacp = air density inside the cockpit
acpA cp = cross-sectional flow area of the cockpit
Superimposed on the dust particles is the previously introduced settling
velocity, VS (appendix B, equation (B-2)), which is a function of particle size.
The time required for a dust particle to cross the cockpit is
LT =, H(26)H
where L is the length of the cockpit in the direction of the flow. During this
same time a particle will fall a distance of
x = Vsz = V (27)H
If a particle has a settlimg velocity VS such that its vertical distance of
fall, x, is equal to or grEater than the cockpit height h, then it will be
collected in the cockpit. Defining a critical settling velocity, V , as
S= L H (28)
any particle with a se~tling velocity, VS , greater than or equal to Vs will be
collected.
40
AFWL-TR-73-82
Since it was assumed that the initial spatial distribution of particles is
uniform in the vertical direction, the probability of a particle with VS < 7S
settling in the cockpit will be a linear function of its settling velocity. For
example, if a particle has VS = 1/2 VS, it will only fall a distance x = h/2 in
the time it takes the particles to move through the cockpit. Thus, the particles
with this settling velocity which are initially in the lower half of the cockpit
will be collected and those in the upper half will not have sufficient residence
time to reach the cockpit floor.
Defining Ps(r) as the probability of a particle settling yields
Ps(r) = 1 for VS 2 VS (29)
VSPr) -- for Vs <V5S (30)Vs
This probability can be related to particle size r in microns, because VS is
related to particle size through Stokes Law.
Associated with the critical settling velocity, V is a critical particle
size, Rc, given. by
RcVS / h a 1/2(1
L A cp cp /
and the related probabilities of a particle settling in the cockpit can be
given by
Ps(r) =
1.0 for r z. c (32)
86.4Vc Pcpr2
PS(r) = V- for r < R (33)h maf
where the cockpit volume is given by Vcp = L A c. It is noted here that theactual cockpit volume should be used in this expression, if it is known. The
cockpit height can be chosen as the maximum height if more conservative results
are wanted, or the effective height, which is the actual volume divided by the
horizontal cross-section area of the cockpit.
41

F AFWL-TR-73-82
It is noted that Ps(r) is a "filter efficiency" of the cockpit. Therefore,
the equations for the mass rate and mass of the dust accumulating in the
cockpit can be expressed in the following manner:
Ms (rt)cp 9.9 x lO2[l-FE(r)] Ps(r)r 0 5 l z r <_R(t) (34)K
2
Mc (r,t)-cp--K2 9.9 x 10O2[-FE~r)] PS (r)r-0*5(t-ti) lp -. r ~.R(t) (35)
M (r,t)-p-K2- 9.9 x lO'2[-FE(rn)] Ps(rn)rn 0' 5(tn-ti) R(t) 5_ rn < R(ti) (36)
where Acp(r,t) is the rate at which the dust settles in the cockpit, M p(r,t) is
the mass of dust accumulated in the cockpit, and [1 - FE(r)] accounts for the
dust collected by the air conditioning in-line filter. A more expanded develop-
ment of the equations for mass deposition in the cockpit is found in appendix D.
Calculation of the dose rates and doses for this situation is not as
straightforward as the calculation associated with the dust trapped in thefilter. The dust settles out uniformly over the entire cockpit and is not
concentrated at a single point. Therefore, to obtain dose results, some sim-plifying assumptions are made. Any one crew member would be subject to varying
amounts of dose from each dust particle, depending upon its distance from the
crew member.
From a crew dose contribution viewpoint, the effectiveness of an element ofmass, mi, located some distance s, from the crew member is proportional to
mi/si 2. A relative dose effectiveness, ED, is defined for any mass distribution
as
_2miE (37)EDMt s2
U i
42

AFWL-TR-73-82
If the entire mass, Mt, were located at a distance of 1 meter from the crew;member, ED would be one. Thus, to apply the results (at 1 meter) to other
situations, multiply them by the relative dose effectiveness, E, determined for
the dust distributie, of interest.
In this work, the spatial dust distribution assumes that 98 percent of thedust is located at an effective distance of 1 meter (the approximate distancefrom the critical mid-epigastric region of the seated crew member to the cockpitfloor or to equipment consoles) and that 2 percent of the dust is located at an
effective distance of 10 centimeters (to account for the dust deposited on
clothing and nearby surfaces).* These percentages were estimated from horizontalsurface area considerations in a typical four-man cockpit and result in a rela-
tive dose effectiveness of about three. This value has been used in the cockpitdose calculations in this report. (The cockpit dose results for other dust
distribution models can be obtained by dividing the calculated dose (at 1 meter)by three, and multiplying by the relative dose effectiveness for the dust dis-tribution of interest.) A complete mathematical development of the cockpit doseis presented in appendix D. Note that the dose e,'jations are developed based onthe assumption that no filter at all is installeJ. Therefore, all the dustenters the cockpit and FE(r) = 0. This cer- -s called the imperfect filteranalysis and is a limit case, just as the perfect filter analysis of appendix
B was a limit case in the other extreme. It will be shown later in thissection that these two limit cases can be used to great advantage in the filter
criteria selection process and in an evaluation of existing filters.
For the purposes of illustration, it is assumed that the cockpit effectiveheight is 2 meters, the cockpit volLme is 1.83 x 10 cm3 , and the mass rate offlow of air to the cockpit is 1.24 x l06 grams per hour. These parameters should
be representative of the cockpit for a crew of four to six for most existing
bomber and cargo type aircraft. The values of these parameters must be known
-.This rather crude distribution was used because it is impossible a non withno knowledge of the specific cockpit geometry and equipment location to determinethe exact distribution. This distribution, however, should be a reasonablerepresentation (on the conservative side, deliberately). The equipment inmilitary aircraft is arranged on consoles within easy reach of the crew. Dustaccumulations on these surfaces are probably 1 meter or less from the crew
member.
43
AFWL-TR-73-82
or assumed in order to calculate the critical radius of the dust particles. For
these values Rc = 20u. The cockpit temperature is assumed to be 75'F, the cock-pit altitude to be 10,000 feet, and the aircraft altitude to be 30,000 feet.
The calculations of the dust mass distribution were made according to the
equations in appendix D, and the results are presented in figures D1 through D9.Each curve provides, for a particular cloud entry time, the dust mass distribu-
tion function as a function of particle size for various penetration durations,
i.e., 2, 5, 10, 15, 30, 60, and 120 minutes. The entry times presented range
from 10 minutes to 5 hours.
The results show that for r > Rc = 20j, all particles are collected and, in
this range of r, the results are identical to the perfect filter results. For
r < 20p, there is a marked difference, demonstrating the fact that small particles
tend to be carried through and out of the cockpit without settling out.
The next series of figures (appendix D, figures D10 through D18) displays thecumulative dust mass collected in the cockpit. The cumulative mass is defined as
the contribution to the cockpit mass attributable to all particles of size less
than or equal to r. These figures present this cumulative mass as a function ofparticle size for a particular cloud-entry time and with penetration duration as
a parameter. The same ranges of entry times and penetration durations are used.
Observe that since the small particles tend to be carried out of the cockpit
with the air, the cumulative mass is small for small particles. The effect of
fallout can also be observed, particularly at late times, because the lines of
constant penetration become horizontal in the larger particle size range,
indicating that no particles of these sizes are present.
The cumulative mass evaluated at r = 10,000 microns is equal to the total
mass deposited in the cockpit for any given TI and AT. Figure D19 depicts this
total mass accumulation as a function of time after cloud entry. A comparison
of figure DO and the perfect filter results for the same TI given by figure B33(adjusted by the same K2 , equation 59) shows that an appreciable number of small
particles are not retained in the cockpit. This difference is entirely due to
the fact that the smaller particles are ejected from the cockpit with the air.
Since the smaller particles have higher specific activities, and the cockpit
is less efficient in collecting these "hottest" particles, one might expect that
the cockpit dose for a given TI and AT would be less than the perfect filter
L44
AFWL-TR-73-82
dose (at I meter). However, the filter dust represents a localized source of
radioactivity, whereas the settled dust in the cockpit is distributed over
horizontal surfaces within the cockpit and on the crew members. Because of the
nearness of some of these particles to the crew member, the particles effective-
ness from a dose standpoint is greatly enhanced. Therefore, it is difficult tu
state a priori which dose would be greater.
The cockpit dose results, which are obtained from analytical/numerical
integration of the equations developed in appendix D, are presented in three
series of graphs. The cloud entry times and the penetration durations were
deliberately chosen to coincide with those values used in the perfect filter
analysis in appendix B. The first series of figures (figures D20 through 028'
presents the cockpit dust dose distribution as a function of particle size for
a particular cloud-entry time and with penetration duration as a parameter.
The second series (figures D29 through D37) presents the cumulative cockpit
dose, i.e., the cumulative dose due to all particles which have the size r or
less, as a function of r for a particular cloud entry time and with penetration
duration as a parameter. The third series (figures D38 through D46) presents
the total cockpit dose due to all the dust mass which has settled in the cockpit
as a function of penetration duration for a particular clouo entry time. The
pertinent results may be scaled to miscion lengths other than the one presented
by techniques identical to the ones discussed in appendix B.
It is apparent from these results that the ionizing dose from dust accumu-
lated in the cockpit for the no-filter case is significant and must be accounted
ior in any survivability or vulnerability study.
4. INHALATION OF AIRBORNE DUST IN COCKPIT
The above discussion investigated the ionizing dose which the crew member
would accumulate from the dust ingested into the cockpit. This dose is a result
of gamma radiation only. The next concern deals with the inhalation of the
airborne dust particles. Most modern aircraft have a requirement for a "shirt-
sleeve" cockpit environment. A shirt-sleeve environment means that the crew
member would be comfortable in the cockpit with normal flight clothing. Tempera-
ture and pressure are maintained such that no special equipment or clothing is
required for crew comfort. For the purposes of this work, it is assumed that
45
AFWL-TR-73-82
no gloves are worn and that the crew member is breathing cockpit air. Therefore,
during penetration of the cloud, the crew member will inhale the airborne duet
and retain some portion of it in his body. This retained dust is a source of
gamma and beta radiation.
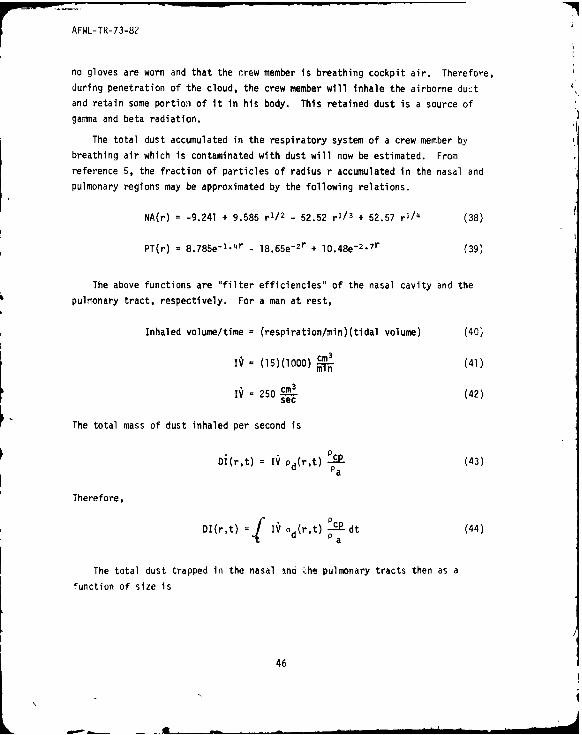
The total dust accumulated in the respiratory system of a crew member by
breathing air which is contaminated with dust will now be estimated. From
reference 5, the fraction of particles of radius r accumulated in the nasal and
pulmonary regions may be approximated by the following relations.
NA(r) = -9.241 + 9.585 r1/2 - 52.52 rl/3 + 52.57 r1/4 (38)
PT(r) = 8.785e-.- r - 18.65e
2r + I0.48e2-7r (39)
The above functions are "filter efficiencies" of the nasal cavity and the
pulmonary tract, respectively. For a man at rest,
Inhaled volume/time = (respiration/min)(tidal volume) (40
= (15)(1000) cm3 (41)
IV = 250 0-3 (42)sec
The total mass of dust inhaled per second is
Di(r,t) d I pd(r,t) Pcp (43)Pa
Therefore,
DI(r,t) = IV Pd(r,t) Sdt (44)
The total dust trapped in the nasal and "he pulmonary tracts then as a
function of size is
46
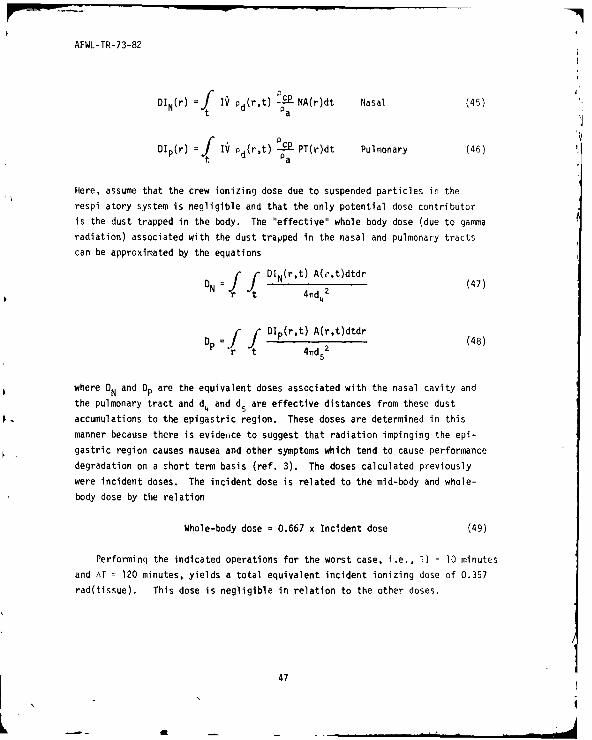
AFWL-TR-73-82
DIN(r) = f IV ,d(r,t) fcP NA(r)dt Nasal (45)t d a
DIp(r) = f " IV p(r,t) -a PT(r)dt Pulmonary (46)t d P
Here, assume that the crew ionizing dose due to suspended particles in the
respi atory system is negligible and that the only potential dose contributor
is the dust trapped in the body. The "effective" whole body dose (due to gamma
radiation) associated with the dust trapped in the nasal and pulmonary tracts
can be approximated by the equations
DN f DIN(rt) A(r',t)dtdr (47)N r t 41d4 2
P= f DIp(rt) A(r,t)dtdr4 d5
2 (48)
where DN and D are the equivalent doses associated with the nasal cavity and
the pulmonary tract and d4 and d5 are effective distances from these dust
accumulations to the epigastric region. These doses are determined in this
manner because there is evidence to suggest that radiation impinging the epi-
gastric region causes nausea and other symptoms which tend to cause performance
degradation on a short term basis (ref. 3). The doses calculated previously
were incident doses. The incident dose is related to the mid-body and whole-
body dose by the relation
Whole-body dose * 0.667 x Incident dose (49)
Performinq the indicated operations for the worst case, i.e., TI = 10 minutes
and AT = 120 minutes, yields a total equivalent incident ionizing dose of 0.357
rad(tissue). This dose is negligible in relation to the other doses.
47
-ii
AFWL-TR-73-82
The inhaled and retained dust also produces physiological damage to thetissue of the respiratory system. This damage is due to the beta particles
associated with the contaminated dust retained in the body. The alpha particleemission associated with the fission products rapidly decreases with time afterdetonation so that even at 10 minutes after detonation, the alpha particle
emission is negligible. For this first cut approximation, it is assumed that
the gamma ray is the result of a disintegration of a fission product. This
same disintegration produces a beta particle, which in the previous discussionswas neglected because it is so rapidly absorbed by the atmosphere. For this
analysis, however, the beta is quite important because the radioactive materialis in direct contact with tissue and can cause damage to the tissue. The
specific activity derived in appendix B and in section II then is appropriate
to this situation
AB(t) = (4.22 x 101 2)t-1" 2 (50)
where A$ is in beta particles per hour-gram(dust). In terms of particle size
A (r,t) = 11.83 A t-1 "2 0.1 .r .2011 (51)
236.55 A1 t-' 2
A (r't) = - 20 <r 0 PI (52)
where A, is defined in appendix A.
In discussing tissue damage due to beta radiation, different units are used,i.e., the microcurie. Since each beta particle is assumed to be the result of
a disintegration,
P c =(3.7 x 10¹⁰)(10-6)
with the unit equation
48'
-m
AFWL-TR-73-82
disintegrations hnurour-gram ust seconds
Ca (54)
C nt rations/second curiecui microcurie
where C has the units of microcuries per gram of dust, and 3.7 x lO0
disintegrations/second is the standard definition of a curie. Therefore,
C (r,t) = 3.75 x 10⁵ t-1-2
0.l i Lr L2011 (55)
C (r,t) 7.49 x 10⁶ t-1"2 20V r :L 1041, (56)
The total number of microcuries associated with the dust which is inhaled
and retained by a crew member can now be determined.
Although there is a relatively small amount of information available in the
literature about humans inhaling radioactive material either as a result of
exposure to fallout or as a result of incidents involving other radioactive
material, the conclusions whicn can be drawn from this information are limited.
The reason for this limitation is that little was known and/or recorded about
the precise amount inhaled, the activities of the inhaled material, etc..
Therefore, for the purposes of this analysis, the human data are of little
value as a standard for comparison.
Because of the impreciseness associated with human data, other areas were
explored and it was found that some excellent experimental work has been dnie
by the Lovelace Foundation, Albuquerque, New Mexico (ref. 5). Carefully con-
trolled experiments to determine the effects on dogs of inhalation of various
radioactive aerosals have been conducted. All of the experiments were tightly
controlled. The dogs were observed closeiy, and the physiological effects were
noted by professionals. Therefore, these experiments are valuable to the
present work. The dog used was the Beagle, which is smaller than a man and, of
course, is not identical. However, the results were presented in terms of
Initial Lung Burdens (ILB) of radioactive material, which has units of micro-
curie/kg (body weight). The body weight of a warm-blooded mammal is representa-
tive of its vital lung capacity because the lungs furnish oxygen to tissue, and
49
AFWL-TR-73-82
the more tissue to be supplied, the larger the lungs required. Therefore, it isassumed that the Initial Lung Burden which can be calculated for a crew member
is correlateable (at least approximately) to the Beagle results and some
conclusions can be drawn about the effect of the inhaled dust on the human.
The Beagle study of most significance here is the one (ref. 6) wherein aradioactive isotope in fused clay was inhaled. The isotope has a relatively
short half life, and is a beta emitter. These properties, as well as the factthat fused clay was used as a carrier, are similar to the properties of the
radioactive particles generated by surface detonations of nuclear weapons. TheInitial Lung Burdens of the dogs varied from 80 to 5200 VCi/kg and the associated
lung doses from 1200 to 55,000 rads. The clinical signs observed in the dogsthat died were those typical of severe pulmonary injury and included progressiveincreases in the respiratory rate, abnormal lung sounds, terminal cyanosis of
mucous membranes and increased density of the lungs on radiograph examination.
Although the nature of the clinical signs did not differ markedly, the timeof onset of the symptoms and the times of death varied considerably with the
Initial Lung Burden. The dogs with high ILBs can be classified into threegroups. The first group of four dogs had ILBs of 2600 to 5200 uCi/kg and lungdoses of 32,000 to 55,000 rads(tissue). Symptoms were first observed at 7 to10 days after exposure with deaths at 7.5 to 47 days after exposure. The second
group of 18 dogs had ILBs of 850 to 2400 pCi/kg and lung doses of 11,000 to29,000 rads(tissue). Symptoms were first observed at 3 to 4 weeks after
exposure with a median survival time of 85 days after exposure. The third groupof 17 dogs had ILBs of 590 to 760 pCi/kg and lung doses of 7300 to 9400 rads.
Initial symptoms were observed at 6 to 8 weeks with a median survival time of185 days after exposure. Dogs with ILBs of 80 to 460 uCi/kg and lung doses of
990 to 5700 rads(tissue) showed no detectable clinical symptoms up to 735 daysafter inhalation exposure. In this experimcnt, no potential performancedegradation was assessed. Only clinical observations were made.
In order to compare IL~s for the human case to the above experiment, onemust calculate the total microcuries trapped in the lungs of a crew member, anddivide by a body weight. The total amount of microcuries, Cp, associated withthe dust trapped in the pulmonary system is
50
,- .
AFWL-TR-73-82
C1, f f IVPd(r,t) P PT(r) C,(r,t)dtdr (57)
r tPa
Assume that an average crew member's body weight is 80 kg. Therefore, the
crew member's Initial Lung Burden, ILBcm, in iCi/kg, is
ILB (58)cm 8
Performing the calculation yields (for a TI of 10 minutes, a AT of 120
minutes, the same mission, and aircraft parameters used previously) an extremely
worst case ILB for the crew member of 325 VCi/kg. This level is relatively
benign when compared to the Beagle levels above. Therefore, because this level
is low, it can be predicted with reasonable confidence that a crew member wouldexperience little or no performance degradation over the duration of the mission
due to physiological damage caused by the inhaled dust. (Although long-term
effects may be significant, here only the time associated with "bombs on target"
is pertinent.)
As noted above, the actual physical damage should not cause performance
degradation on a short-term basis. However, the psychological effects could be
significant. An individual's performance could be degraded because of the
emotional reaction to the awareness of the potential haward of inhalation of
the particles. Therefore, it ii recommended that a warning system be incor-
porated in the aircraft to notify the crew that the aircraft is in a radioactive
cloud. (Note that a warning system, and not a dosimeter, is recommended. The
dosimeter readings themselves could cause psychological problems.) Upon
initiation of the warning, the crew would don oxygen masks with 100 percent
oxygen for the duration of the penetration. This simple precautionary action
would reduce the possibility of inhalation of the particles and alleviate the
uneasiness associated with the inhaling of the radioactive particles. This
precautionary measure is recommended even if a cockpit ECS filter is installed
because no filter can completely remove all the dust particles suspended in the
ingested air.
51
K

AFWL-TR-73-82
5. EXPOSURE OF BARE SKIN TO THE RADIOACTIVE DUST
Because of the large number of variables associated with this potential
hazard, precise calculations of the s'in dose are impossible. For example, the
crew member is constantly in motion, may wipe hands on clothing, and may or nay
not be perspiring. All these factors and more affect the results of a skin dose
calc lation. However, an upper bound for the dose may be estimated. This upper
bound consist- of estimating the skin dose by assuming all of the dust which
would settle on that piece of skin is retained on the skin for some period of
time. Bare skin is also assumed, i.e., no clothing covering the skin at the
point of exposure.
Probably the main region of concern in the skin would be the dermis, or
corium. (It is p,'otected by the outer layer of skin, the epidermis, which varies
from 0.07 to 0.12 mm over most of the body.) The corium is : to 4 mm thick and
contains numerous nerve endings (ref. 7). Beta-radiation penetrating the corium
could cause damage which would be sensed by the nerveL endings and could result in
severe pain to the crew member. Since the epidermis is about 0.1 mm thick, it
absorbs all beta particles with energies less than about 200 k:eV and, therefore,
provides some degree of protection to the sensitive corium. Beta particles
whose energies range between 200 keV and 700 keV are absorbed in the corium,
and beta particles with energies in excess of 700 keV pass through the corium.
(Assuming that the skin has the same properties as water, the graphs in refer-
ence 8 were used as the basis for these statements.) As a worst case, it is
assumed that all the beta particles emitted by the radioactive dust which settle
onto the skin possess energies in excess of 700 keV, Although this assumption
is somewhat conservative, study of the energi s of beta particles emitted by
typical deca, 'ng fission products indicate that the majority of the beta
particles are quite energetic. Therefore, this assumption is not totally
unrealistic.
From reference 7 it is nnted that the energy loss of a beta particle
impinging on any substance is appr'oximately 2 MeV/gm/cm2 . Therefore, the
conversion constant from beta particles per centimeter2 to rads (tissue),
CS , is
52
L

AFWL-TR-73-82
2 MeV *l.6 x 10-6 T-qT ers2 Me
CS 100 ergs / rads(tissue)gm
Cs = 3.2 x 10-d radsltissue) (59)B/Cm
2
If it is now assumed that each photon generated by a disintegration is
accompanied by a beta particle, then
A(r,t) = A (rt) (60)
iere A is the specific activity of the radioactive dust in B/gm(dust)-lour and
A(r,t) is defined in section II. It is now assumed that the dust settles out on
the exposed skin in a uniform manner and that half of the beta particles
released by the layer of disintegrating fission products penetrate the skin ill
a normal direction. The other half escapes in the opposite direction and is not
of concern. The approximate skin dose then is
D:(r,t) : f Ds(r,t) dt (61)
Ds t) C s Mp(r.,t) A (r,t)dt()
_________dt (62)
It is noted that this expression differs only by a constant from the dosefrom dust accumulated in the cockpit, i.e., equation (21). In other words
05(r,t) =Dcp(r,t)(63)
iK, K3
where
C AI r, aiK3 4d 2
53
AFWL-TR-73-82
I CA 1 mAl a13 a(2)(3) Acp i
where the factor of 2 in the denominator of K3 accounts for the assumption that
only half of the beta particles penetrate the skin, the factor of 3 is associated
with the assumed cockpit dust distribution and is not appropriate for the skin
dose calculation. The factor A is the area of the horizontal portion of thecp
cockpit, and ai and AI are constants.
Performing the indicated operations yields the relation
Ds(r,t) = 15.0 Dcp(r,t) (64)
Therefore, the skin dose results may be obtained from figures D-20 through D-47
simply by multiplying these results iy 15.0. Note that the skin dose results
are quite significant even for rather short penetration durations.
The severity, time of appearance, and duration of skin response as a function
of radiation depends on a complex interaction of many factors, e.g., dose rate,
anatomical egion exposed, area of skin irradiated, presence of other irritants
(e.g., clothing chafing the irradiated area), energy of impinging beta particles,
and depth of penetration into the skin (see reference 3 for a more detailed
discussion). However, for the case assumed above, i.e., beta particles with
energies in excess of 700 keV, the surface dose required to produce recognizable
transepidermal injury is about 2000 rads(tissue).* Therefore, unprotected skin
in acockpitwhichis supplied with unfiltered air during cloud penetrations of
relatively short durations could be a performance crippling factor. Some degree
of protection would be afforded the crew member by wearing gloves and a helmet
during the mission. However, reliance on protective clothing alone would violate
the cockpit "shirt-sleeve" environment requirement.
*This is the dose required for 50 percent of the himan population to experiencn
visible ski, damage. The human susceptibility threshold is probably lower,i.e., on the order of 800 to 1000 rads (tissue).
54
K,
AFWL-TR-73-82
6. EXAMPLE COCKPIT FILTER SELECTION
In the filter criteria selection process, the perfect filter results ofappendix B are used. To use these results, the nondimensionalizing constants,
K2 through K4 must be determined. The altitude, the aircraft characteristics,i.e., cockpit size, mass flow rates of air to the cockpit, etc., have been
assumed earlier in this section. Now assume that the threat corresponds to the
massive multiburst situation, so that Lf is fixed.
The pertinent constants (equations (A-44)) then are determined to be
K2 = 480.76 gm(dust) (65)
K3 = 7.878 radsltissue) (66)hr_
K = 12.724 radsCtissuel (67)4 hr_
In the following discussion, the values obtained for the perfect filter
cases are the values read off the ordinate of the particular graph multiplied
by the pertinent constant.
Now that a cockpit deposition model has been developed, and the primaryshort-term concern associated with the dust which enters the cockpit has been
determined to be the ionizing crew dose from the nearby dust accumulations,
filter design criteria can be chosen. This selection procedure is based solelyupon the necessity to protect the crew from excessive accumulation of ionizing
dose.
It is assumed for the purpose of this exercise that the Point Design Condi-tion has been fixed and leads to the case of TI = 30 minutes and 6T = 10 minutes.
From the cloud immersion dose results (figure B-61), the cloud immersion dose is
47 rads(tissue). Since it was stated earlier that the EDIo for vomiting was100 rads(tissue) incident, there is a margin of 53 rads. In other words, the
total crew dose from the cockpit dust and the filter dust must not exceed 53
rads. It is assumed that all other sources of ionizing dose due to cloud
penetration are vanishingly small.
55
AFWL-TR-73-82
To alleviate all potential hazards from the cockpit dust, 23 rads(tissue)
are chosen as the marginal cockpit dust dose, and 30 rads(tissue) as the mar-
ginal filter dose. Going to figure 031 and choosing AT = 10 minutes, it is
found that the 23 rads(tissue) limit corresponds to a particle size of 18microns. Therefore, the filter trapping efficiency must be
FE(r) = 1.0 r Z 1811 (68)
FE(r) = 0.0 r < 18p (69)
Now go to figure B35, which is the perfect filter dose (at 1 meter). The
dose for TI - 30 minutes and AT = 10 minutes is 71 rads(tissue). However, the
particles smaller than 18 microns are passed. The dose associated with particles
18 micron and smaller is 35 rads. Therefore, the total filter dose is 71 - 35 =
36 rads(tissue) at 1 meter. Therefore, to attenuate this dose to the marginal
30 rads(tissue), the filter must be located at a distance greater than 1 meter
from the crew member. The distance, d, corresponding to the 30 rads(tissue) is
36 = 30 (70)d2
d = 1.2 m (71)
Therefore, the filter must be located at least 1.2 meters away from the nearest
crew member.
The only remaining part of the design criteria needed is the total mass,
and its distribution with size, trapped by the filter. To obtain this informa-
tion go to figures B7 and B16. From figure B7 the mass distribution is obtained
by recalling that all particles less than 18 microns are passed. The remainder
of the particles are trapped. Therefore, the mass distribution is represented
by the AT = 10 minute curve with the distribution function below 18 microns set
identically to zero. The total mass trapped by the filter can be obtained from
figure B16. Read the mass collected for the AT = 10 minute curve corresponding
to r = lO,O000, which is 326 grams. Subtract from this value the mass corre-
sponding to r = 18p, which is 72 grams. The result, 254 gm, is the total mass
accumulated by the filter.
56

AFWL-TR-73-82
Therefore, it is apparent that given the Point Design Condition, which is
based on an operational analysis, it is quite straightforward to choose filter
design criteria which provides the crew necessary protection from the radio-
active dust. This design criteria may be specified to a designer, who can design
the filter and locate it in the aircraft without any knowledge of nuclear surviv-
ability/vulnerability (S/V) or nuclear environments.
This method may also be used to evaluate existing filters. The only differ-
ence would be that the trapping efficiency is now fixed and the associated
cockpit dose is not variable, but also fixed. The filter dose then fixes the
minimum distance to the crew. The filter mass as dictated by the filter
efficiency can be determined and compared to the capacity of the existing filter.
57
AFWL-TR-73-82
SECTION VI
ELECTRONIC EQUIPMENT FILTER ANALYSIS
1. GENERAL CONSIDERATION
In the previous section, a detailed analysis was presented which resultedin design criteria for the cockpit environmental control system filter. Earlier
it was stated that separate filters would probably be required for the cockpit
and the electronic equipment because of different filtration requirements.
Therefore, it is necessary now to investigate the electronic equipment protec-
tion requirements and to select an appropriate set of filter design criteria.
In one respect, the electronic equipment analysis is simpler than the cock-
pit analysis. There are no biological considerations other than ensuring that
the crew does not accumulate excessive dose from the dust trapped in each linereplaceable unit (LRU)(a self-contained "black box"). Generally, the amount of
dust trapped is relatively small and the LRUs are located in equipment bays
considerable distances away from the aircrew. Therefore, the effects on the
crew getierally are negligible. However, in another respect, the analysis ismore complex. Each LRU in the aircraft has a potentially different power
requirement and dissipation. Therefore, each could require a different amount
of cooling air and each could have a different plenum chamher geometry. There-
fore, the analysis must consider each LRU independently. The filter design
criteria then would be that necessary to provide the protection required by the
most susceptable LRU.
2. PRELIMINARY ANALYTICAL CONSIDERATIONS
Since the number of LRUs in a modern aircraft is quite large, some initial
considerations to reduce the number to be analyzed are in order. First, onlythose LRUs which are mission critical need be considered. Line replaceable
units are mission critical if their operations are necessary to the successful
completion of the mission. Second, only those LRUs which are air cooled by
open cycle flow techniques must be considered. Much of the equipment,* such as
*Only cloud immersion doses are pertinent to these 'RUs.
58
£.
AFWL-TR-73-82
controls and displays, and other low heat dissipation LRUs, do not requirespecial cooling. Other LRUs are cooled by a closed cycle, or a recgenerativecooling technique. This type of cooling technique reuses the same workingfluid, air, Freon, etc. This fluid is forced through the LRUs, through a heat
exchanger to remove excess heat, and then back through the LRUs. Therefore,little or no outside air is introduced into the LRUs. The open cycle coolingtechnique uses engine bleed air, cools it, forces it through the LRUs, and thenejects it overboard. Therefore, there is a continuous flow of outside air
through the LRUs which results in dust deposition in the plenum chamber. Third,only those LRUs using components which are susceptible to total ionizing dosesnp.d be considered. For example, those LRUs based on vacuum tube technology
will not be affected by total dose accumulations. Only the latest state-of-the-
art semiconductor components such as metal oxide semiconductors (MOS) devices
are susceptible.
3. LINE REPLACEABLE UNIT ANALYSIS
After the list of LRUs requiring analysis has been reduced to a minimum, theremaining LRUs must be analyzed. The first step in this analysis is the develop-ment of a dust deposition model for the LRU plenum chamber. The basic mechanism
of deposition is the same for the LRU as it was for the cockpit. Therefore, the
same model will be used. The critical particle size, Rc (defined in equation
(31)) isof particular importance. This parameter is a function of the plenumchamber geometry and the mass rate of flow of the cooling air. Both these
variables could vary from LRU to LRb and must be considered in each LRU analysis.
The approach taken at this point is to obtain general results which can beapplied to any specific LRU. Recall that in the cockpit analysis a representa-
tive example was presented as an illustration. The critical particle size was20 microns. The LRU critical particle size, however, may vary considerably from
LRU to LRU. Therefore, the LRU critical particle size is an important parameter
in the general results.
To be precise, the same type graphical results presented in the cockpitdeposition analysis should be presented here for each and every critical particle
size. However, presentation of these results would require thousands of graphs.Therefore, another approach will be investigated. In the cockpit analysis, the
margin between the crew susceptibility threshold and the immersion dose was tens
59

AFWL-TR-73-82
of rads(tissue). Here the margin between the LRU susceptibility and th iviirur-
sion dose is generally thousands of rads(Si). (It should be noted that rads(,i)
= 0.922 rad(tissue) for the assumed 1 meV photons.) In this analysis, extreme
precision and accuracy are not so critical. Therefore, a simplified approach
will be described which yields general, slightly conservative results, and which
can be simply applied to any LRU.
The equations which were developed in appendix D for the cockpit are appro-
priate to this analysis if the cockpit critical particle size of 20 microns is
replaced by the general parameter Rc and all of the constants are divided by 3
to account for the magnification factor, ED, used earlier in the cockpit analysis.
For any given Rc these equations were analytically/numerically integrated using
the Air Force Weapons Laboratory (AFWL) CDC 6600. The results of interest in
this simplified approach are the total mass of dust collected in the LRU and the
total dose, at I meter, associated with the total mass which accumulates over
the mission. In other words, in this analysis the distributions of the mass and
dose with respect to particle size are not of interest. The total mass collected
can be used to determine the volume taken up by the dust in the plenum chamber
to support plenum chamber clogging investigations. The total dose will be used
to establish the total dose incident on susceptible piece parts in the LRU.
It is apparent that the integration of the equations for each Rc yields a
single data point. Numerous values of Rc must be chosen so that the results are
comprehensive enough to support general LRU analysis. These operations have
been performed and the results are presented in figures 4 through 21. Each
figure represents a single different cloud entry time and each curve on each
figure represents a single different penetration duration. The ordinate is the
nondimensional mass or dose used in appendix B and the abscissa is the critical
particle size. The dose curves are 30-hours-after-detonation cases. The doses
for other times can be obtained by use of the time scaling factor discussed in
appendix B. It is noted that each point on these curves corresponds to the area
under mass and dose distributions similar to those presented in the cockpit
analysis section.
The doses, at-l-meter, are now available. However, these doses were deter-
mined based on an assumed point source of radioactivity. The dust which settles
out in a plenum chamber is not a point source. It is distributed as a planar
60
All-
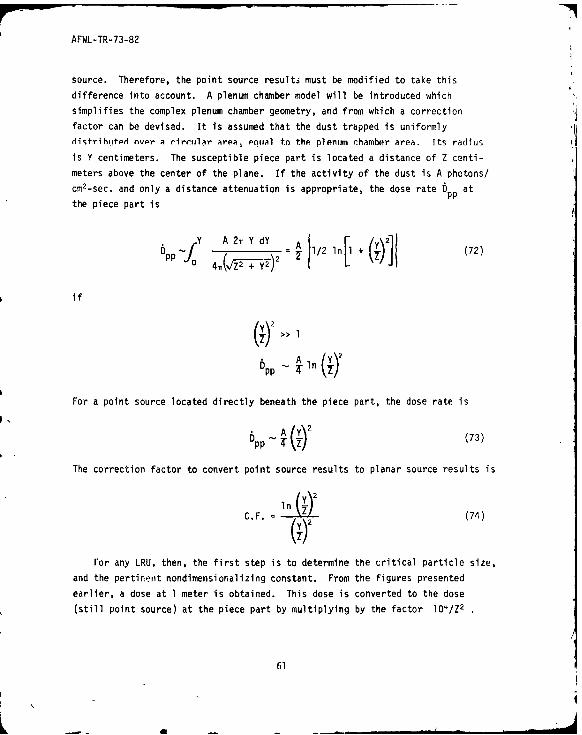
AFWL-TR-73-82
source. Therefore, the point source results must be modified to take this
difference into account. A plenum chamber model will be introduced which
simplifies the complex plenum chamber geometry, and from which a correction
factor can be devised. It is assumed that the dust trapped is uniformly
distrihijtmd nvpr a rirciljAr area: Pqual to the plenijm chamber area. Its radius
is Y centimeters. The susceptible piece part is located a distance of Z centi-
meters above the center of the plane. If the activity of the dust is A photons/
cm2-sec. and only a distance attenuation is appropriate, the dose rate Dpp at
the piece part is
Y A 2 T Y d Y = A 1 / 2 I n 7 2pp 4 mQZ2 )2 (72)
if
(-)2 >> 1
For a point source located directly beneath the piece part, the dose rate is
S A 32Dpp ~T Z) 73
The correction factor to convert point source results to planar source results is
C.F. = ! (74)
ror any LRU, then, the first step is to determine the critical particle size,
and the pertinent nondimensionalizing constant. From the figures presented
earlier, a dose at 1 meter is obtained. This dose is converted to the dose
(still point source) at the piece part by multiplying by the factor lO/Z2
61
AFWL-TR-73-82
This dose is then multiplied by the correction factor shown previously. This
dose, then, is the dose which is accumulated by the piece part of a particular
LRU for a given TI, AT, etc. This dose determination is done for all the
potentially susceptible piece parts of the LRU in question. This dose for each
mission-critical piece part is added to the iwmmr~ion dose. and iall other dnsp
(including any possible dose resulting from exposure to prompt radiation during
the mission). This total dose is compared to the total dose susceptibility
threshold of the piece part (which is assumed known). If the dose level is
below the susceptibility threshold for each mission-critical piece part, then
the LRU is not vulnerable and no filter is required to protect the LRU from
total dose effects from the accumulated dose. If this result exceeds the
threshold susceptibility for any one mission-critical piece part, the LRU is
vulnerable and protection is required in the form of a filter.
This analysis is repeated for each mission-critical LRU. The most vulnerable
of the LRUs will drive the filter selection. At this point, the difference or
margin between the susceptibility threshold level and the accumulated dose level
is known and is the key element in the filter criteria selection. This margin
is related to the amount of dust which must be trapped by a filter. Since in
this analysis mass and dust distributions are not available, the approach used
in the cockpit filter criteria selection is not appropriate. A different
procedure will be used.
If the curves depicting the mass and dose distribution with particle size
for the cockpit analysis are recalled, it is apparent that the LRU and cockpit
act as perfect filters for particles whose sizes are larger than the critical
particle size, Rc. Therefore, the perfect filter results of appendix B with
the appropriate constant (the constant in this case must be based on the mass
rate of flow of air to the LRU), can be used to determine the necessary filter
trapping efficiency. The procedure is to convert the dose margin to point
source (at-l-meter) results by going through the conversion procedure described
above in reverse. The result will be subtracted from the dose result on the
pertinent accumulated dose curve at the 10,000-micron point on the ordinate.
This result corresponds to some particle size. The filter must trap all particles
larger than this size to provide the required protection. This fixes the filter
efficiency.
62
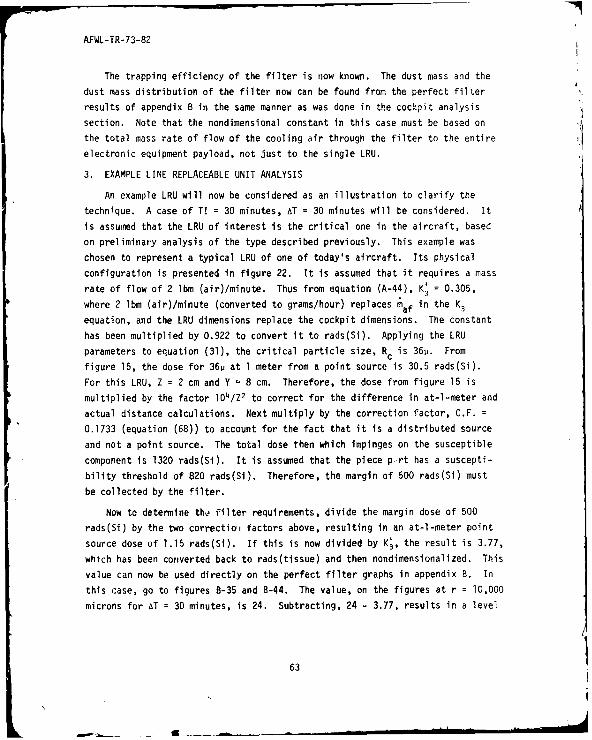
AFWL-TR-73-82
The trapping efficiency of the filter is now known. The dust mass and the
dust mass distribution of the filter now can be found from the perfect filter
results of appendix B in the same manner as was done in the cockpit analysis
section. Note that the nondimensional constant in this case must be based on
the total mass rate of flow of the cooling air through the filter to the entire
electronic equipment payload, not just to the single LRU.
3. EXAMPLE LINE REPLACEABLE UNIT ANALYSIS
An example LRU will now be considered as an illustration to clarify the
technique. A case of T! = 30 minutes, AT = 30 minutes will be considered. It
is assumed that the LRU of interest is the critical one in the aircraft, based
on preliminary analysis of the type described previously. This example was
chosen to represent a typical LRU of one of today's aircraft. Its physical
configuration is presented in figure 22. It is assumed that it requires a mass
rate of flow of 2 Ibm (air)/minute. Thus from equation (A-44), K; = 0.305,
where 2 lbm (air)/minute (converted to grams/hour) replaces maf in the K3equation, and the LRU dimensions replace the cockpit dimensions. The constant
has been multiplied by 0.922 to convert it to rads(Si). Applying the LRU
parameters to equation (31), the critical particle size, Rc is 36p. From
figure 15, the dose for 36u at 1 meter from a point source is 30.5 rads(Si).
For this LRU, Z = 2 cm and Y = 8 cm. Therefore, the dose from figure 15 is
multiplied by the factor 104/Z2 to correct for the difference in at-l-meter and
actual distance calculations. Next multiply by the correction factor, C.F. =
0.1733 (equation (68)) to account for the fact that it is a distributed source
and not a point source. The total dose then which impinges on the susceptible
component is 1320 rads(Si). It is assumed that the piece p. rt has a suscepti-
bility threshold of 820 rads(Si). Therefore, the margin of 500 rads(Si) must
be collected by the filter.
Now to determine tho filter requirements, divide the margin dose of 500
rads(Si) by the two correctioi factors above, resulting in an at-l-meter point
source dose of 1.15 rads(Si). If this is now divided by K;, the result is 3.77,
which has been converted back to rads(tissue) and then nondimensionalized. This
value can now be used directly on the perfect filter graphs in appendix B. In
this case, go to figures B-35 and B-44. The value, on the figures at r = 10,000
microns for AT = 30 minutes, is 24. Subtracting, 24 - 3.77, results in a level
63
AFWL-TR-73-82
of 20.23. On figure B-35 for AT = 30 minutes, this level occurs at a particle
size of 60 microns. Therefore, the filter efficiency must be 1 for particles
60 microns or larger, i.e., the filter must trap all particles larger than 60
microns. The filter dust distribution then can be obtained from figure B-7,
using a K2 based on the total mass rate of flow required for all electronics.
Only the portion of the distribution above 60 microns is pertinent. The remain-
der is passed by the filter. The total dust mass in the filter can be obtained
from figure B-16, the dose distribution from figure B-26 and the total dose
accumulated in the filter from figure B-35 in a similar manner.
4. FILTER LOCATION
There is one remaining aspect of the pr jlem which must be considered in
this section. How close to the filter (either the electronic equipment or the
cockpit filter) may susceptible electronic equipment be located? The answer to
this question would delineate a "forbidden region" in the volume adjacent to the
filter in which no susceptible electronics may be located. This volume would be
a strong function of the equipment susceptibility and how much dose it accumulates
from other sources.
Consider now a filter which has trapped a considerable amount of dust during
the cloud penetration. The filter dose at-l-meter assuming a point source of
radiation is known from previous considerations. However, for nearby electronic
equipment, the dust distribution does not "look like" a point source, but rather
a distributed source, because the filter element is assumed to be a plane per-
pendicular to the flow through the filter. Therefore, a correction factor
similar to the one developed previously for the LRU plenum chamber is needed.
(It is noted that the geometry chosen here is only applicable for a planar-element
filter. Some filters have other geometries, e.g., cylindrical filter elements,
and must be considered separately but in a similar manner.)
This geometry is indicated in figure 23 with the appropriate distances
shown. The piece part is located at the point PP. The filter element is
represented by the circle of radius d, which has a uniform dust distribution
and specific activity A in photons/cm2-sec. The differential area pdpdo is
located at point DA. The dose rate at the piece part is
64
A&!
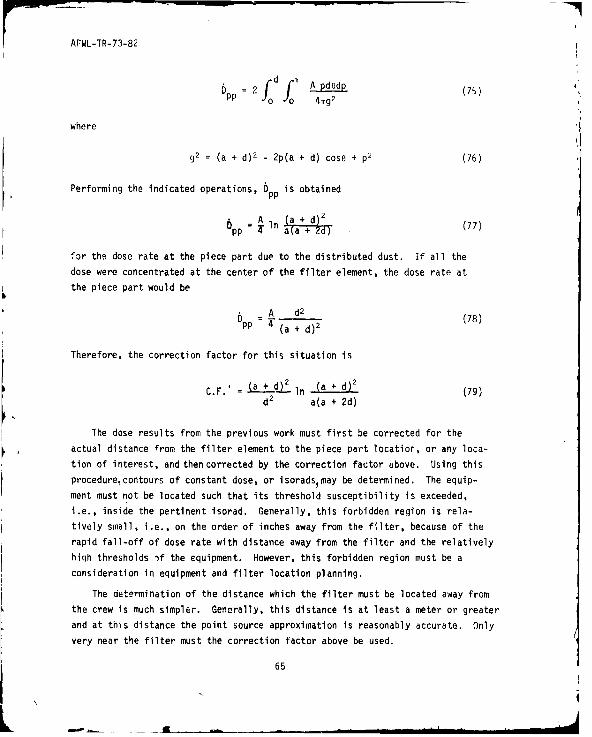
AFWL-TR-73-82
D = 2 j o d (75)41rg 2
where
g = (a + d)2 - 2p(a + d) cose + p
2 (76)
Performing the indicated operations, Dpp is obtained
D = In (a+d) (77)
pp T. 9(a + d)
'or thq dose rate at the piece part due to the distributed dust. If all the
dose were concentrated at the center of the filter element, the dose rate at
the piece part would be
• A d2Dpp4 a 2 (78)
pp T(a + d)2
Therefore, the correction factor for this situation is
C.F.' = (a + d)i2 n (a + d) (79)
d2
a(a + 2d)
The dose results from the previous work must first be corrected for the
actual distance from the filter element to the piece part location, or any loca-
tion of interest, and then corrected by the correction factor above. Using this
procedurecontours of constant dose, or isoradsmay be determined. The equip-
ment must not be located such that its threshold susceptibility is exceeded,
i.e., inside the pertinent isorad. Generally, this forbidden region is rela-
tively small, i.e., on the order of inches away from the filter, because of the
rapid fall-off of dose rate with distance away from the filter and the relatively
high thresholds if the equipment. However, this forbidden region must be a
consideration in equipment and filter location planning.
The determination of the distance which the filter must be located away from
the crew is much simpler. Generally, this distance is at least a meter or greater
and at this distance the point source approximation is reasonably accurate. Only
very near the filter must the correction factor above be used.
65
L M
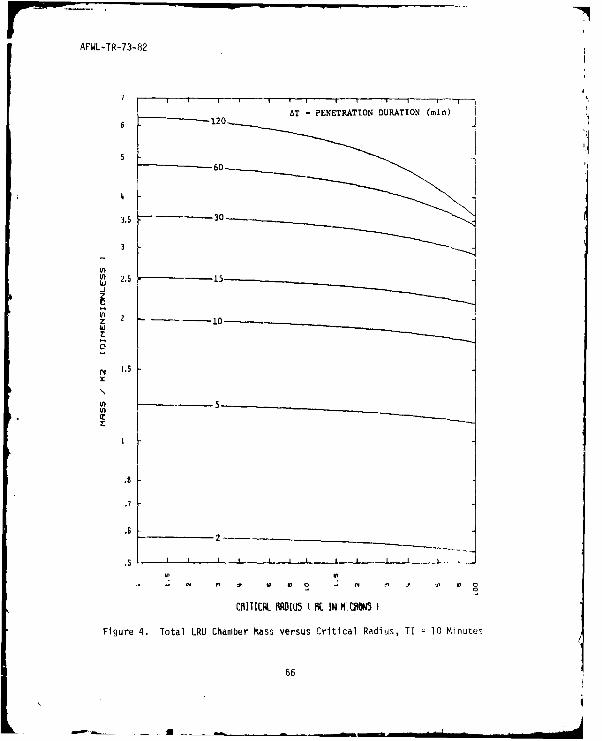
AFWL-TR-73-82
7{
AT - PENETRATION DURATION (min)
612
3.5 -- 30
U) 2.5 - 15w.J
Iz 2 --10
t 1.5
2-
.66
z2
C. I , . I _
)1j B IU { N IBN
F iue4* oa5R hme asvrusCiia ais I=l iue
.66
2,
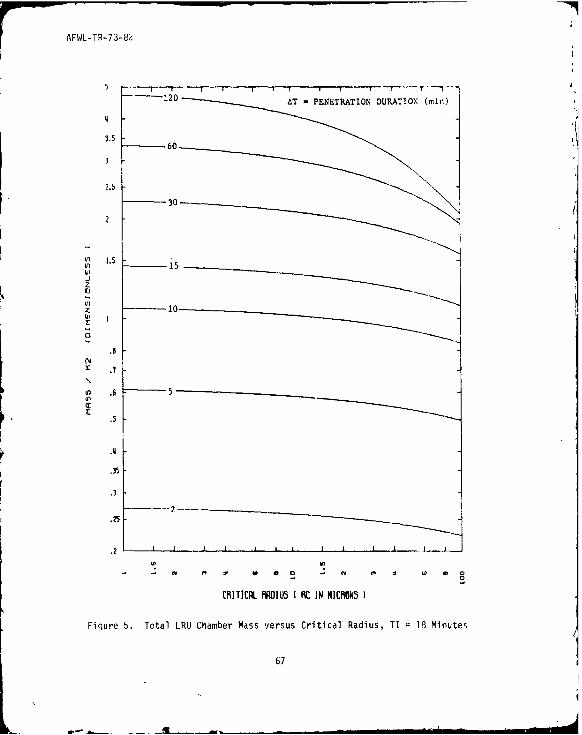
AFWL-TR--73-82
1.5
3.15
z 10
.5
.15
.7
-62-
.5
.25I I I
CRITIERL RfWI05 t RC IN NICHON3
Figure 5. Total LRU Chamber Mass versus Critical Radius, TI 18 Minutes
a6
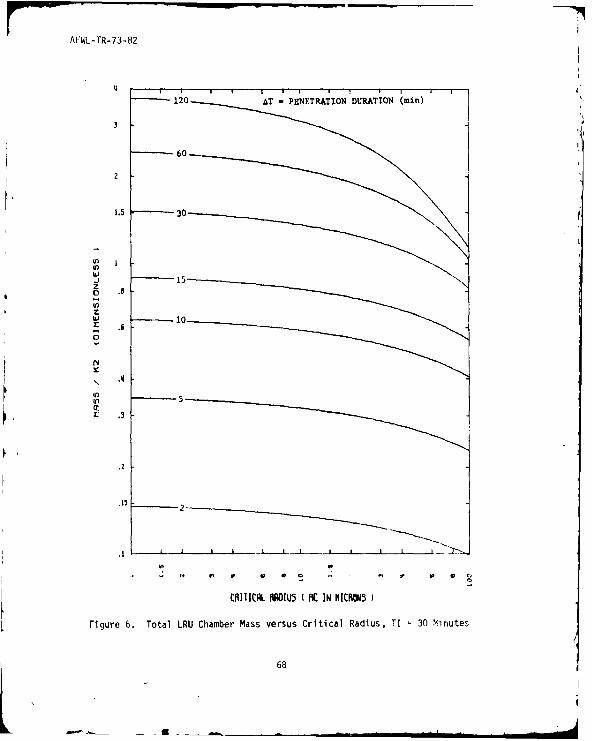
7'F a 4R738
120 AT PENETRATION DURATION (min)
2
'L'i
z
z01
p..6
.4
CIUMICL MONI5 K i IN HICRON5
Figure 6. Total LRU Chamber Mass versus Critical Radius, TI 30 Minautes
68
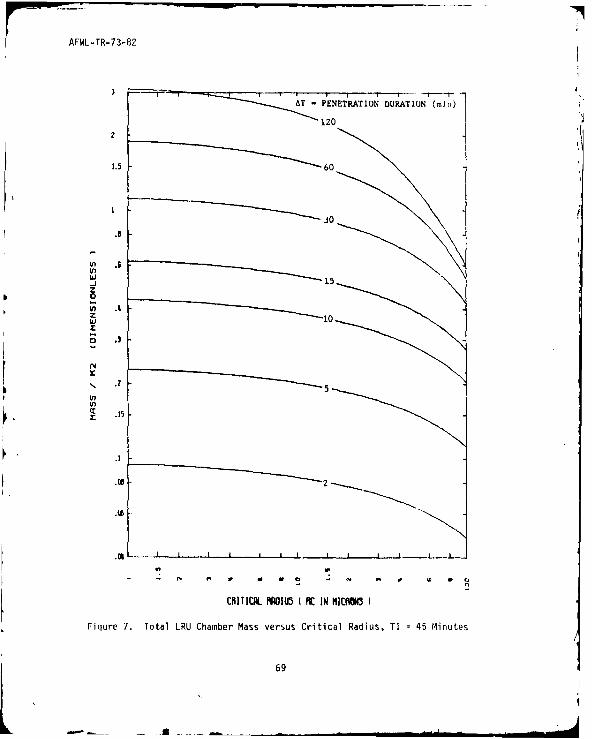
AFWL-TR-73-82
- PENETRATION DURATION (rlu)
120
2
1.3 60
um .6
"-1 15
Z 10
5
S .15
.32
.Oi1 -- p I I I I I l I
CRITICAL WIU5 K IN HOW i
Figure 7. Total LRU Chamber Mass versus Critical Radius, TI 45 Minutes
69
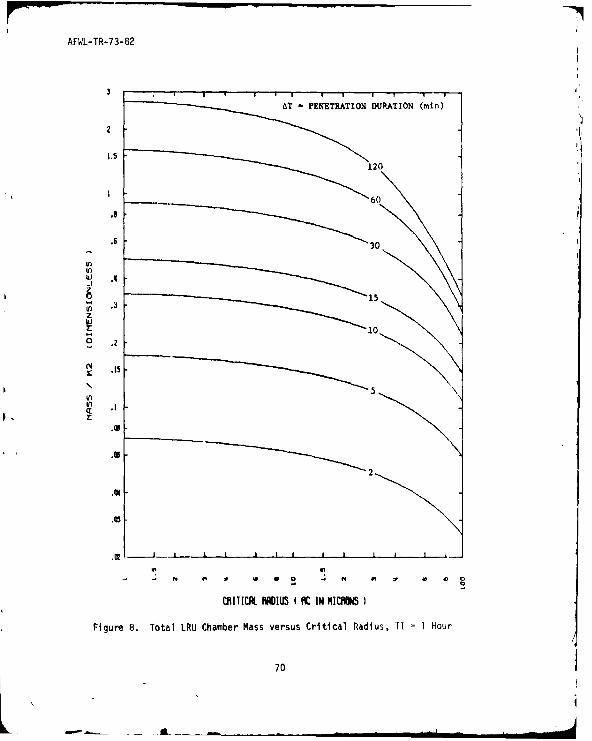
AFWL-TR-73-82
-PENETRATION DURTION (min)
.5
U12
In
z
£ .2
U)5
CRITICAL RADIUS PC~ IN NICBWN
Figure 8. Total LRU Chamber Mass versus Critical Radius, TI 1 Hour
70

AFWL-TR-73-82
3
AT PENETRATION DURATION (min)
2120
.60
61
W .2r 10
CRI1IC~L RRIUS(C IN HICRON
Figure 9. Total LRU Chamber Mass versus Critical Radius, TI 1.5 Hours
71I
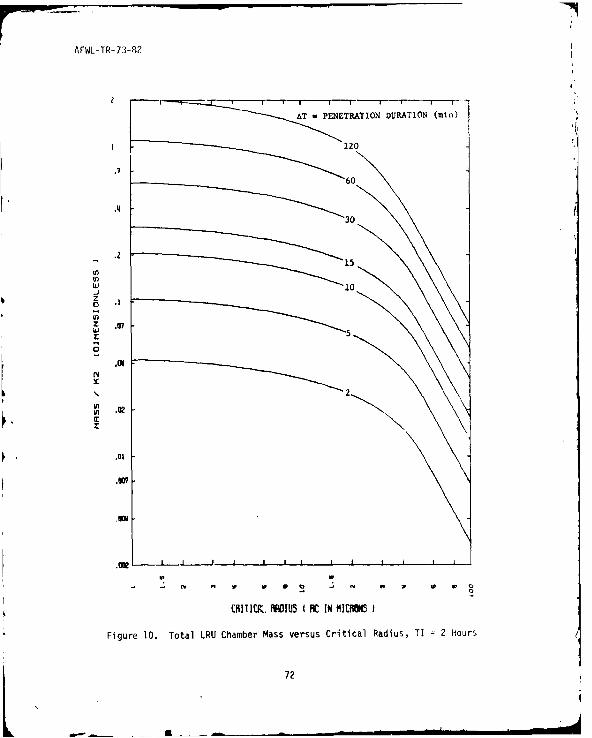
AFWL-TR-73-P2
T -PENETRATION DURATION (min)
.1115
.22
Z:
.01
W7
CRITICK. RISU I K IN MIEW~
Figure 10. Total LRU Chamber Mass versus Critical Radius, TI =2 Hours
72
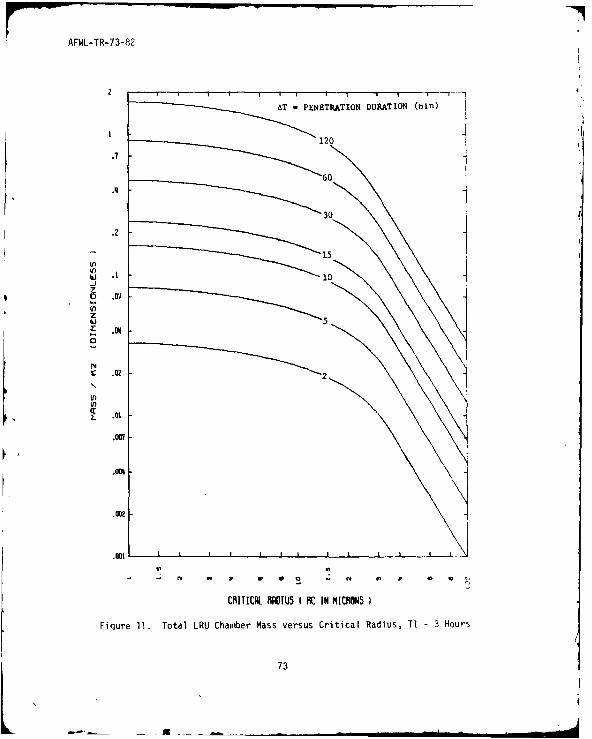
7 AFWLTR-3-82
AT-PENETRATION DURATION (min)
.7
.2
It)
z
42 .07
422
tn
(nt .02
S .01
CRITICP1 WOIL5 I FC IN MICMWS
Figure 11. Total LRU Chamber Mass versus Critical Radius, TI =3 Hours
73
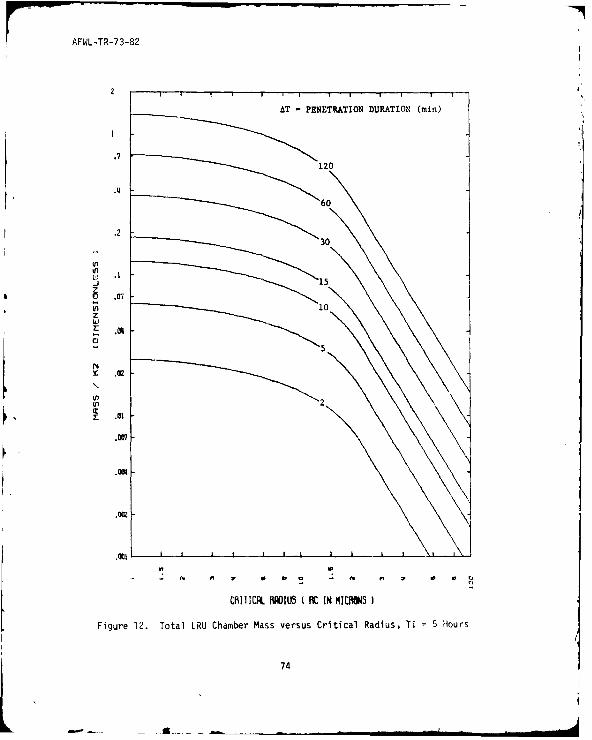
AT PENETRATION DURATION (i1n)
.2
-1 1z0
5 N
In 2cc- , I S S C -- C , ~ S S C
74
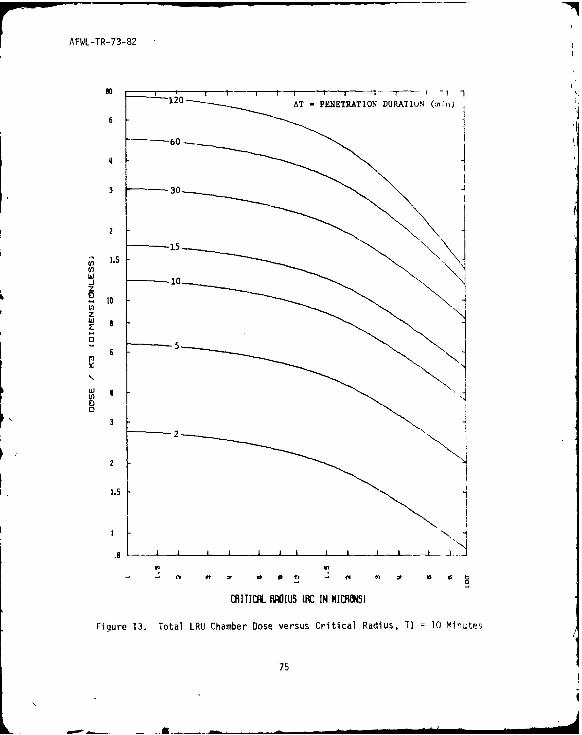
7 '~ AFWL-TR-73-82-9
so--r-*---~--lioAT -PENETRATION DURATION (min)
330
2
1 .5
z2 10z
in
2 2
1.5-
CRITICK lROIUS IIC IN MICRO~NS)
Figure 13. Total LRU Chamber Dose versus Critical Radius, TI =10 Minutes
75
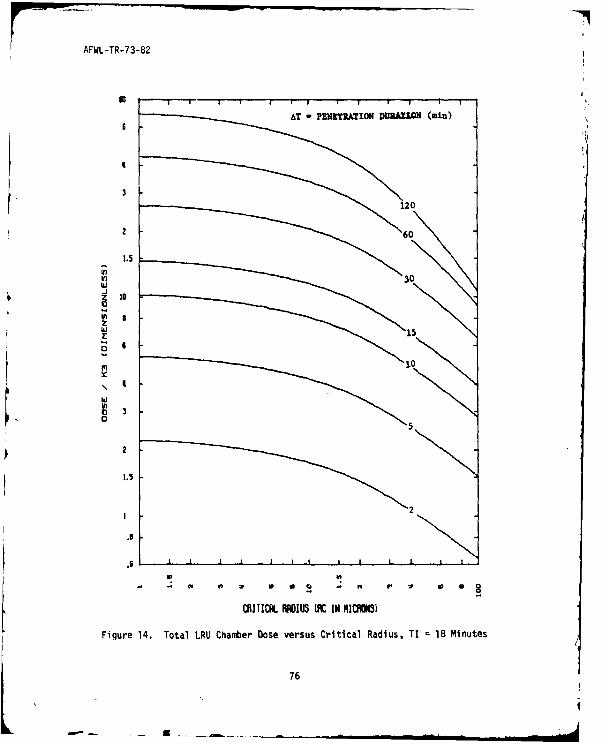
7i" AFWL-TR-73-82
AT -PEN~ETRATION DURAflD (min)
2 6
-j
3
z to
z
w,
22
.6
C4 V
CRITICAL AOIUS VIC IN HItMNI
Figure 14. Total LRU Chamber Dose versus Critical Radius, TI =18 Minutes
76
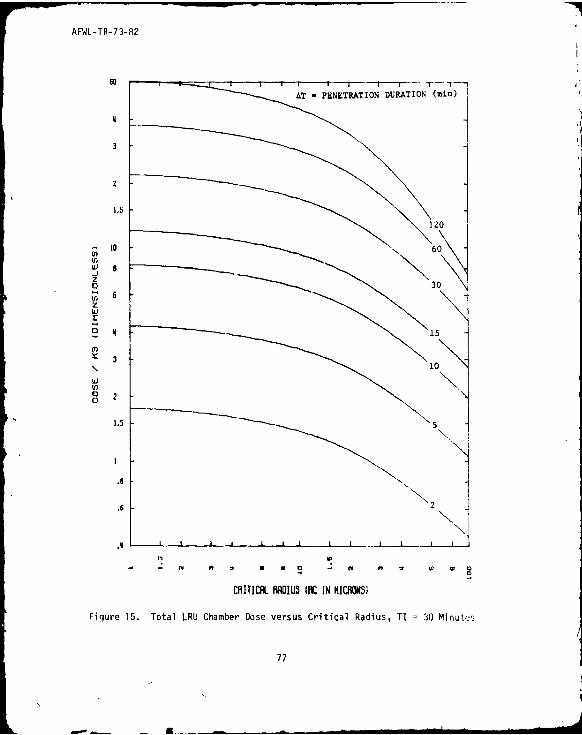
AFWL-TR-73-82
AT PENETRATION DURATION (min)
22
z
0 3
15
I"TCL OSK INMC 5
Fiur 153 oa hme oevrusCiia ais I 3 iue
710
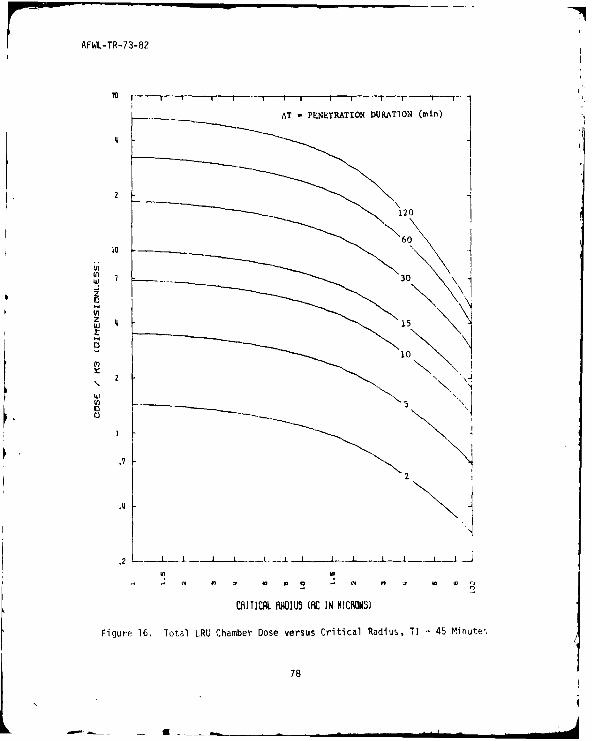
AFWL-TR-73-82
AT PENETRATION DURATION (min)
12060
-J 30
z
wZ 4 15
10
2 __ 2
I..
.22
CRITICAL IAGIUS Kf IN MICRONSI
Figure 16. Total LRU Chamber Dose versus Critical Radius, TI 45 Minute,,
78

7 '~AFW-TR-73 82
70
A~T *PENETRATION DURATION (mint)
2
115
In(n
-Jz
z
.11
CRIT1XRL IRDIUS (RC IN MICROfNS)
Figure 17. Total LR' Chamber Dose versus Critical Radius, TI 1 Hour
79
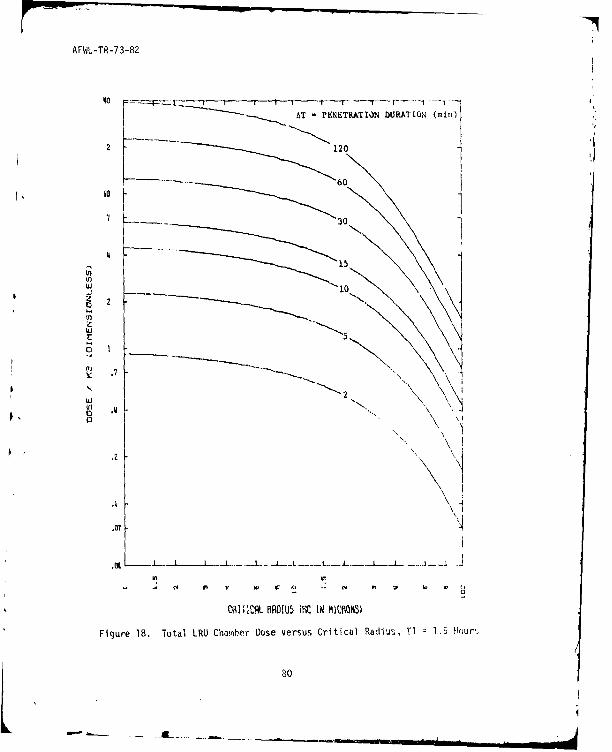
AFWL-TR-73-82
- -.. AT - PENETRATION DURATION (min)
2 120
K 10 60
_ 30
15
.0
U'N
.NNN!
22
k HD1 5 NM)O)
Figure 18. Total LRU Chasnber Dose versus Critical Radius, TI 1.5 Hour,
80
c. f W C -. Ct C 7 I 4. .. . .. .- " - -' - amxr ,I " '- a a i i IC
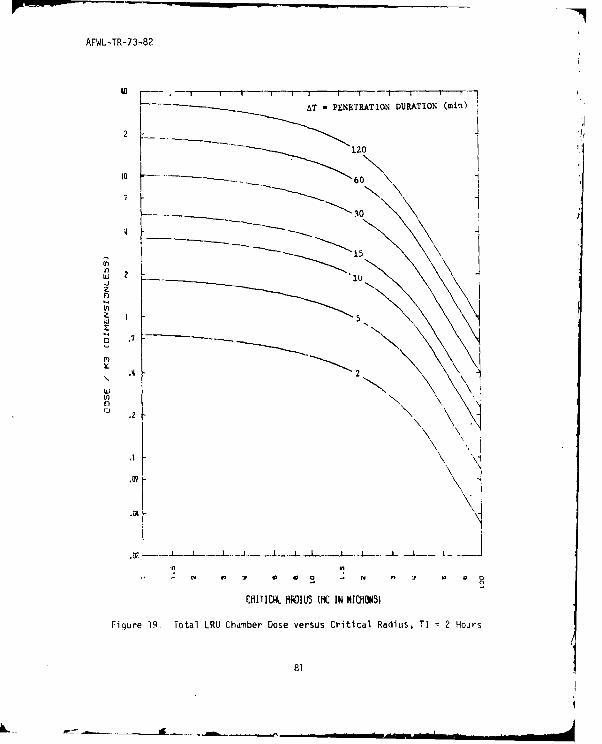
AFWL-TR-73-82
00 - ---
AT - PENETRATION DURATION (min)
120
10 ~ 60
30
15
zN
z 5,2
QV
0 'N1'
.07
CMRtICL fRRIU5 MC IN MICHONSI
Figure 19 Total LRU Chamber Dose versus Critical Radius, TI 2 Hours
81
LI

ANN I R- 73 8?
IT PENETRATION DURATION (min)
'0.........-
120
-- \ - " \- - 60\
2 30 \
10
U \"",\ \ .
S2 N
\ \ \I' .
AS '4
CHITICRL MOMI (fic IN HMOHNS1
Fiqure 20. Total LRU Chamber Dose versus Critical Radius, TI -. 3 Hour
82 2

AFWL-TR-73-82
AT PENETRATION DURATION (Nin)
7 ....
4N
N'x
'\ 120
" ' "- 60\
.J .7 \ 3\\
24 is
10 \
\
.01-p..'\.
.0071
M,
CHIIICHL HIOIUS (MC IN MICRO})
Fiqure ?1. Total LkU Chamber Dose versus Critical Radius, TI 5 Hours
83
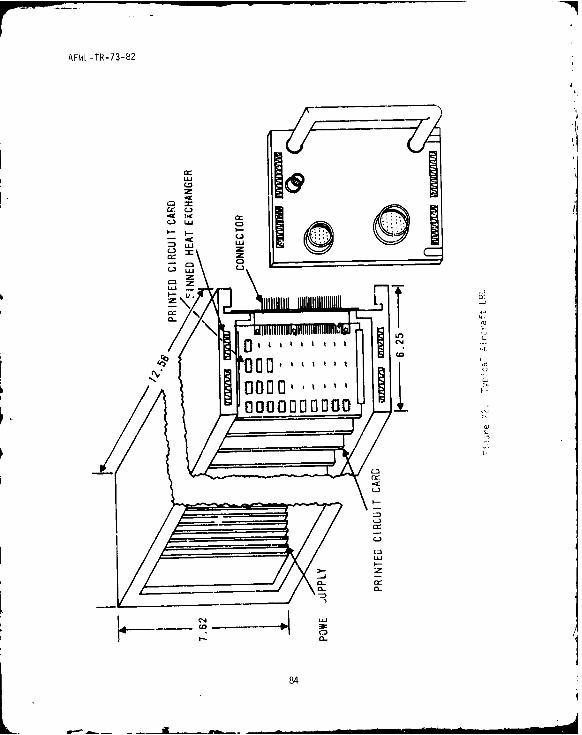
AFW[ -TR-73-82
L*1
zI
C.3.
L a -i C
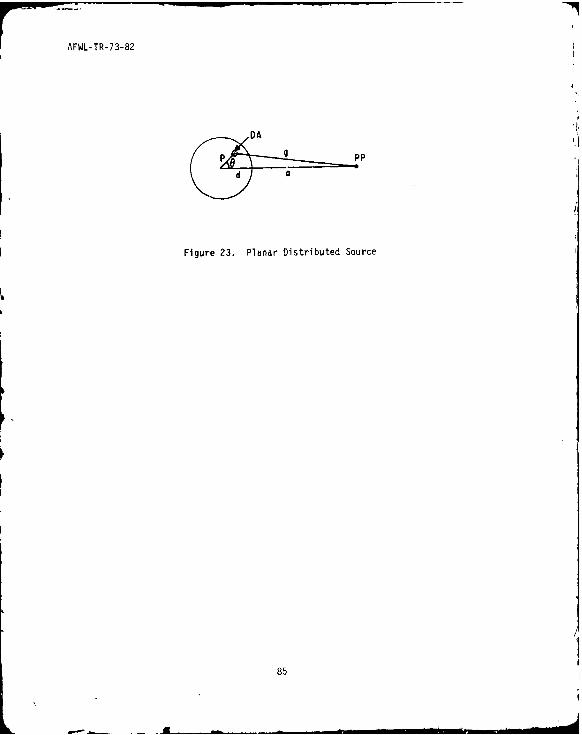
DA
d0
Figure 23. Planar Distributed Source
L7

AFWL-TR-73-82
SECTION VII
MISCELLANEOUS CONSIDERATIONS
The major thrust of this work is toward the protection required by the crew
and the electronic equipment from the contaminated dust ingested into the air-
craft via the environmental control system. These problems were addressed in
detail in the preceding sections. This section will briefly address the aircraft
engines and the dose due to dust accumulated on the aircraft exterior.
1. ENGINE INGESTION OF DUST
The air flow through the engines is much larger than the air flow to the
environmental control system. Therefore, much greater masses of dust will beingested. However, because the engine interior is streamlined to offer low
flow resistance, little of the ingested dust will be accumulated. There is no
problem of the engine being a source of radiation due to trapped dust. The
only significant potential problem is that the large amounts of dust ingested
could erode the compressor-and-turbine rotor and stator blades, and cause
unacceptable damage.
It is beyond the scope of this work to investigate any potential damage
caused by the dust. All that will be done is to present the technique of
determining the total mass and the mass distribution with particle size of the
dust inqested by the engines during the cloud penetrations. It is hoped that
this information could be used by enqine design and test engineers to ensure
that the mission completion capability of the engine is not compromised by
cloud penetrations.
Since the engine traps little or no dust, all of the dust which is inqested
flows through and out of the engine. Recall that the perfect filter analysis in
appendix 0 determined all of the dust which entered the filter and it was
assumed to trap it all. Therefore, the perfect filter results of appendix I1
are pertinent to the engine. However, in this case, the results merely show
what has passed through the engine during the penetration and not what was
trapped.
86
AFWL-TR-73-82
The total mass ingested by the engine during a penetration can be obtained
by figure B-23 of appendix B with the constant (K1) based on the total mass rate
of flow of air through the engine. The mass distribution of the dust as a func-
tion of particle size can be obtained from figures B-5 through B-22.
2. DUST ACCUMULATED ON THE AIRCRAFT EXTERIOR
The dose due to the mass of dust trapped on the aircraft exterior is
addressed briefly in appendix A. Generally, this dose is relatively small and
will not affect either the crew or the electronic equipment. The primary
interest to date in this dust is related to the recovery of the aircraft by
maintenance personnel after a mission involving a penetration of a rad~ractive
dust cloud. Washing the aircraft and other decontamination techniques should
minimize the hazard due to external dust accumulations. However, the main
problem in recovery will be changing the filters and LRUs with open-cycle
cooling. These problems should be addressed and recovery techniques
formulated to minimize the hazard to ground crews.
87
AFWL-TR-73-82
SECTION VIII
CONCLUSIONS
The purpose of this report was to investigate the penetratior of a racio-
active cloud by a manned aircraft. The concerns associated with such a penetra-
tion are three: the crew, the electronic equipment, and the engines. If any of
the thre, experience significant performance degradation, the strategic mission
of the aircraft could be in jeopardy. Because detailed quantitative results are
extremely system dependent, specific conclusions about the effects of cloud
penetration on crew members, electronics, and engines cannot be drawn. However,
some general observations can be made.
1. The cloud immersion dose is accumulated equally by the crew and the
electronic equipment during cloud penetration. The only feasible action to
reduce this dose is to avoid the cloud. Shielding to attenuate this cloud
immersion radiation is impractical because of the great weight of material
required to provide any appreciable attenuation.
2. In addition to the cloud immersion dose, the crew could be subjected to
potentially severe hazards associated with the dust ingested into the cockpit
by the environmental control system (ECS). Although these hazards, particularly
the ionizing dose accumulations from dust accumulated in the cockpit and skin
burns from the beta radiation associated with the radioactive dust, can be
reduced considerably by the installation of a suitable filter in the ECS.
3. Although precise filter criteria for the cockpit ECS filter are the end
product of a detailed analysis and are system and threat dependent, study of the
cockpit dose results in appendix D reve ls that filters which trap all particles
in excess of 6 to 8 microns in radius would provide good protection to the crew.
This capability is well within the present state of the art in filter des gn.
4. Although the ionizing dose accumulated by piece parts in electronic
equipment is system and threat dependent, it is observed that the critical
particle size, Rc , for typical plenum chamber geometrics and mass flow rates
of cooling air, is relatively large, i.e., 50 microns or larger. Because fall.-
out rapidly depletes the cloud of large particles and the plenum chambers of
88
AFWL-TR-73-82
representative line replaceable units trap relatively large particles, the
amount of dust accumulated in the plenum chambers is relatively small. There-
fore, the piece-part ionizing dose accumulation is probably relatively low.
Therefore, alleviation of this potential mission crippler should be relatively
straightforward.
This report has shown that cloud penetration by manned aircraft could result
in unacceptable performance degradation. Strategic aircraft should be subjected
to detailed analyses to determine potential vulnerabilities and the corrective
actions necessary to reduce these vulnerabilities.
89/90

AFWL-TR-73-82
APPENDIX A
UNIFORM FALLOUT MODEL
This appendix develops a preliminary model using the cloud dust density and
specific activity functions which were presented in section II. The relation-
sh,s from section I are independent of particle size. This model may be viewed
as a first order approximation. Because particle size is not a consideration,
the dust cloud effectively may be modeled by a cloud consisting of dust particles
which are uniform in size and activity. This model does take fallout into
account, but in a rather simplified fashion.
For the purposes of this development, the dust density and specific activity
functions are written in the form developed directly by curve fitting Whitaker's
data (section II).
Pd(t) % ai(t-m + bt-n) (A-l)
A(t) = Alt"Z (A-2)
where
ai = 3.46 x 10⁶ Lf gms(dust)/cm3
= 1.2
m = 1.6
n = 0.3
b = 1.313
A, = 4.22 x 10¹² photonsgm(ust)-hour
91
' - ~-- ° -

AFWL-TR-73-82
1. DUST INGESTION bY THE ENGINES
The mass rate of flow of air througi. the engines is given by mae grams (air)
per houir and is constant for a given engine and flight condition of the aircraft.
The air drawqn through the engines contains dust in the ratio Pd(t)/Pa grams
of dust per gram of air. The mass rate of flow of dust through the engines
e (t) in grams per hour is given by the relation
. Pd( t) _ mae a' (t-m + bt-n) ti t. tf (A-3)e ae Pa Pa
Me(t) = 0 all other t (A-4)
For some purposes, such as considerations of the effect of engine lifetime
after dust ingestion, one may be interested in the total mass of dust ingested
by the engines during a cloud penetration. This can be obtained by integration
of the above equation.
Me(t) = 0 t < ti (A-5)
M e 0 a tti - _. t ) -
Mt)= a m-.1 + b t l-ni t tf (A-7)
Pa
2. DUST ACCUMULATION IN AIR CONDITIONING FILTERS
Also of concern to this analysis is the mass of dust collected by a perfect
filter in the bleed air line from the engines which supplied air to the crew
compartmcnt/electronics. The accumulation of radioactive dust in the filter is
a source of radiation which contributes to the dose received by the aircrew
members and electronic equipment.
92
K

7 006 -'AFW-TR-73-8
If one assumes that the trapped dust is a point source of radioactivity andneglects any shielding, one can calculate the dose rate and dose at some distance,di centimeters, from the filter. This distance reprezents the distance to the
crewmember/electronic equipment from the filter.
The mass of dust (Mf(t)) trapped by the filter can be calculated, assuming100 percent filter trapping efficiency, in a manner similar to the one usedabove. This relation is given by the following:
Mf(t) = 0 t < tI (A-B)
maf a[ti-m - tf (tn - tn)]
Mf(t) = a L -a i + b \ - J t t S tf (A-9)
Mf(t) = af ai tll m f - t -l n ! if Pa - + b 1-nt t (A-10)
The product Mf(t) A(t) is the effective source strength of the filter trappeddust. The dose rate measured at a distance d centimeters away from the source is
f(t) = C Mf(t) A(t) (A-11)
4nd2
where C is a conversion factor with units of rads(tissue) centimeter2 /photon.The dost rate due to the dust trapped in the filter then is given by
Df(t) = 0 t I ti (A-12)
bf(t) C A iiaf a [ti-rm - tl-m (t'-n _ t 1 t. t t (A-13)4Trd2 P a L -1 1- \ ln /- ' i t f (-3
Cft Al ; :daf ai Ki-n _ ti-rn I i-n t1-nf
Df(t) = - ma U+ b-- b f,.n )t-" t tf (A-14)4nd
2 Pa9
93
AFWL-TR-73-82
The total do.. accumulated by time t due to the filter dust is obtained by
integration of the dose rate.
Df(t) = 0 t . ti (A-15)
[ tirn Kt i - i t- ) t 2-m- _ ti2- m'I
Df(t) K ( t i-) + (m-I)(m+Z-2)
b(t2- nR - ti2-n-) b ti
n (t
"Z+1- t i'Z+I)l
i n)(-n- +-rn-) 2-
t i <_. t _.tf (A-16)
it m tf - .ti2- -
Df(t) = K3[ '(ti3- (t1"
- tf ) + ( f-l(m+-Z )
+ b(tf 2-n-Z t. 2"n' ) b t I- (t-,-l - ti'')(I-n)(2-n-U - + (1-n)(2.-1)
[ t i r n - t f m) + b ( t f i l n t i 1 -n ) ] ( t , "z l - 2 + 1
t 2L t f (A-17)
where
C AI maf aiK3 = 1"2P (A-18)
3 47rd2 a
94

AFWL-TR-73-82
3. DOSE DUE TO CLOUD RADIOACTIVITY
Another primary source of dose to the crew results from the integrated
effect of the dose from the radioactive debris surrounding the aircraft as it
passes through the cloud. It is assumed that the cloud Is an infinite, home-
geneous mixture with a distributed source of radiation of strength given by the
product of the dust density, and the specific activity A(t). For simplicity,
consider the aircraft to be adequately represented by a sphere of radius R
centimeters and neglect any shielding effect of aircraft structure. For any
source point at a distance d > R from the center of the sphere, the rate at
which photons are emitted from a volume element dV is given by Pd A(t) dV.
Since the source is assumed Isotropic in nature Pd A(t) dV/4nd2 is the fluence
at the center of the sphere from the volume element. One must also account for
atmospheric attenuation of these photons which requires a factor of expV'/0 a)pad) where v'/pa is the mass attenuation coefficient for the photons
of interest. To convert from photons per centimeter2 to dose units use the
conversion constant C, which is a function of the energy level of the photons.
The total dose rate due to all volume elements Is given by
6 c~t) - C Pd(t) A(t) e-( )d 4 d 2 dd (A-19)Dc f) 4Trd2
or
C Pd(t) A(t) e-p R (A-20)
since
lO'S, R 102 cm, and e- ' 1l
therefore,
C Pd(t) A(t)Dc(t) , (A-21)
95
AFWL-TR-73-82
Subst"tutinq, the equation becomes
(t) = -A t-
a [t-m + bt-n ti t tf (A-22)
c (t) = 0 all other t (A-23)
The total dose accumulated at time, t, is given by
D C(t) =/ Dc(t) dt
t i
Performing the indicated integration
Dc(M = 0 t t i (A-24)
Dc (t) = -AI ai[m4l- (ti 1 " + t) - (m+
+ b (t1 1-(n+) _ t-n+t))] ti t . tf (A-25)
c A [ml (ti 1 -(+t) - tf )0c(t ) - t
+ b t i-(n+t) _ t- n) t Z tf (A-26)
4. DOSE DUE TO EXTERNAL ACCUMULATION OF DUST
If radioactive dust is accumulated on the skin of the aircraft or in
crevices and discontinuities caused by joints in the external structure, it
would also contribute to the radiation dose received by the crew/electronic
equipment.
Since the dose from this source would be inversely proportional to the square
of the distance from the source point to the crew member/electronic equipment, it
would appear reasonable to consider only the dust accumulated in the near vicin-
ity of the crew member/electronic equipment. For example, in determining the
dose to te pilot, one would restrict his attention to the accumulation of dust
in the cockpit/crew station area.
96
7 AFWL-TR-73-82
If one could reasonably estimate the amount of dust accumulated in thepilot's vicinity as G grams at an effective distance of d centimeters one could
estimate the dose due to the source.* To be conservative one might assume that
all of this dust was accumulated at the time of entry, ti, into the radiation
cloud and remained there during the remainder of the mission.
Then the dose rate at position R from this source would be given by
6ae(t) = GCAt) (A-27)
or
bae t) = --Ct " t ? ti (A-28)4 d2
The integrated dose then is
Dae (t) = 0 t ti (A-29)
GCA t +1 t + I
Dae(t)= t-Z.--; t i (A-30)
This area has been investigated experimentally and analytically by severalresearchers. No attempt will be made here to correlate the experimental find-
ings with this rather crude first cut analysis. Future effort in this area is
needed. However, in this work this dose is much less critical than the filterand cloud doses, and has been presented briefly only for the purposes of
completeness.
5. TOTAL DOSEThe total radiation dose due to penetration of the cloud then is the sum of
individual doses.
*As a "first cut" at the accumulation of dust on the aircraft exterior, onecould measure or estimate the volume of all the cracks, crevices, etc., and thevolume of surface accumulation, which would be a function of the boundary layerthickness. If then the dust density in the cracks, etc., is known or assumed,a total mass can be approximated.
97
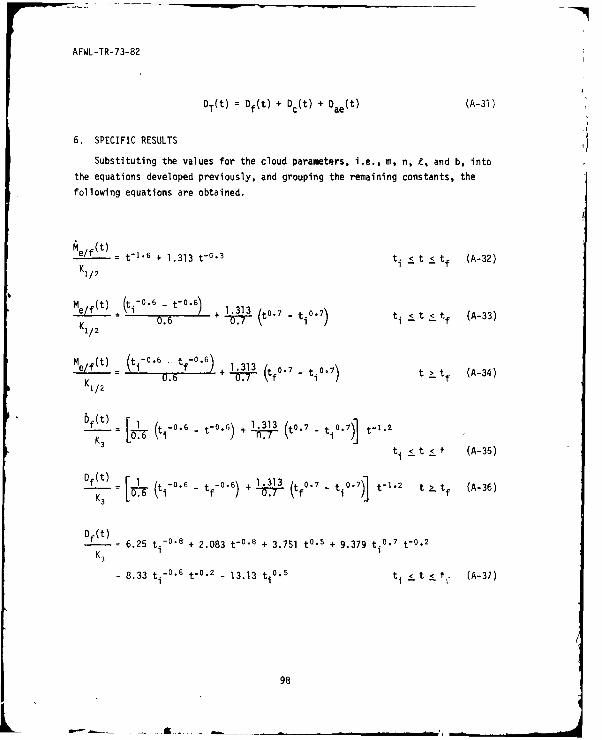
AFWL-TR-73-82
DT(t) = Df(t) + D (t) + Dae(t) (A-31)
6. SPECIFIC RESULTS
Substituting the values for the cloud parameters, i.e., m, n, e, and b, into
the equations developed previously, and grouping the remaining constants, the
following equations are obtained.
t -t1
+ 1.313 t"° '3
ti < t < tf (A-32)K1/2
Me/f t t-'6- t-.6 .1 .7-t07
e,/f2t 0. + -" (t° ' -
io ) t i <t <tf (A-33)
K1/20.
Dre/(t) :ol_ (t i ' t f '6) +1 !31 (t .7 t .7 )t-. tt, (A-34)
K12 0.6 + ffi- f _
Kp
Df(t) [ 0~~t~.6 - -0.6) + 1.313 (tO.7 - t 0.7)] t-1.2
bf(t) 1 ~t- .6 -tf) + -4313 (tf0.7 tiO.7)j t-. t tf (A-36)
K3Df -. (t)f 7
Df(t) 6.25 t- 8 + 2.083 t-0 8 + 3.751 t
0 + 9.379 ti. 7
t-0 .2
K3 1
8.33 ti-0.6 t-
°-2 - 13.13 ti0.5 t i . t < t. (A-37)
98
. .. £. .. l '
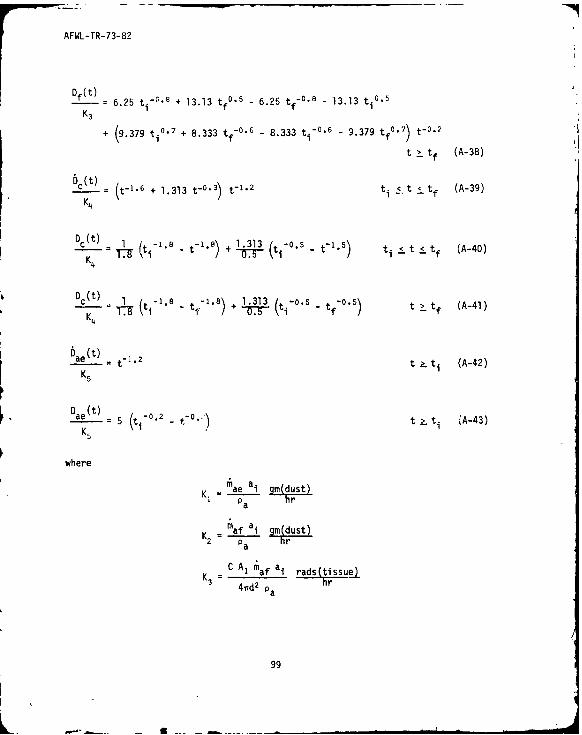
AFWL-TR-73-82
Df(t)K3 = 6.25 ti- -
8 + 13.13 tf°0.5- 6.25 tf - 13.13 ti°'
+ (9.379 t 1 -'7 + 8.333 tf - ° '6 - 8.333 ti- 0
'6 - 9.379 tf ° ) t-0. 2
t >_tf (A-38)
Sct)ct= (t-"" 6 + 1.313 t-0 ") t- 1 . 2 t i < t tf (A-39)
- ~) - 1.8) 1.313 1t-.5 -.Oc4t (ti- t-l + 77.st t i < t < tf (A-40)
Dct) -1.8 - .8) 1.313 (t0.5 -o.5K4 T7 \t t f +(
Dae ( t ) _t-1.2 t ?_ t i (A-42)
K5
Dae(t) 5 02 - A-43)K ~ -K = (ti 0. t t z. t1 A-3
where
K. mae ai
K. = -a i _Jut
Pa Er
K a
C Al maf ai rads(tissue_K3 = 4dphr
4d2 Pah
99
AFWL-TR-73-82
CAai rads(tissue)
K4 = ha
GCAK G5 = rads(tissue) (A-44)Ks-= 4d2 hrF
Note that the expression for the amount of dust ingested into the engine is
functionally identical to the expression for the amount of dust trapped by the
perfect filter. The only difierence is in the constant, i.e., Kt corresponds to
the dust ingested by the engines and K. to the dust trapped by the filter.
Therefore, these two equations were combined in equations A-32 through A-34.
7. GRAPHICAL RESULTS
These equations are all completely analytical and easy to solve for any
given set of input parameters. Representative results have been obtained and
are shown in figures Al through AlO. The ordinate in each case is the inde-
pendent variable of interest nondimensionalized by the pertinent constant, i.e.,
K1 , K2, K3, K4, or K.. These results then are general. For a specific aircraft,
threat, and ,. p i e, the conqtpntg can be determined and the specific
results can be determined.
Figure Al depicts the mass rate of flow of the dust to the engines or the
filter. Fallout of the dust in the cloud is reflected in this figure through
the decrease with time uf the mass rate of flow of the dust. For a no-fallout
situation, the mass rate of flow of dust would be constant. Therefore, fallout
is a significant factor in this development. Figure A2 depicts the total mass
ingested by the engines/trapped by the filter for two cloud entry times (TI),
10 minutes and 60 minutes after detonation. The total mass Ingested/trapped as
a result of a particular penetration duration (aT) is read from the ordinate at
an exit time of TF = TI + AT, for the curve corresponding )o the proper TI.
Figures A3 and A4 depict the dose rates (at 1 meter) due to the dust
trapped in the filter. Figure A3 corresponds to a TI of 10 minutes and figure
A4 a TI of 60 minutes. Each figure depicts a family of curves corresponding to
penetration durations of 2, 5, 10, 15, 30, 45, 60, 120, 300, and 600 minutes.
The rapid decrease in the dose rates with time is due to two factors, the fcilout
100
AFWL-TR-73-82
of the dust particles from the cloud, and the decrease in photon emission due to
the normal decay process. Note that the dose rate does not go to zero after
exit from the cloud because the dust trapped in the filter remains in the filter
after cloud exit and is a source of ionizing dose.
Figures A5 and A6 depict the ionizing dose (at 1 meter) due to the dusttrapped in the filter for cloud entry times of 10 and 60 minutes after detona-
tion, respectively. The curves in the figure correspond tc the same penetration
durations given previously. Note that the dose rate and "ose results arepresented for a distance from the filter of 1 meter. These results can be
related to other distances by multiplying the results by the factor (1 meter)2/
(distance in meters) 2 . Figure A7 depicts the dose rate due to the aircraft
being immersed in the cloud. (The crew and all aircraft components are exposed
equally to the photons emitted from the cloud, because the shielding provided
by the aircraft is negligible.)
Figure A8 depicts the dose accumulated by the crew due to cloud immersion
for TIs of 10 and 60 minutes after detonation. The dose accumulation is read
by choosing the curve corresponding to the TI of interest, determining the cloud
exit time, TF - TI + AT, and reading the dose from the ordinate. Figure A9
depicts the dose rate (at l meter) per gram of dust accumulated on the aircraft
exterior. Figure AlO depicts the dose (at 1 meter) per gram of dust accumulatedon the aircraft exterior for TIs of 10 and 60 minutes after detonation.
This model is simple, easy to use, and its associated equations are completely
analytical. For any given set of input parameters, i.e., Ks, TI, and AT, results
can be obtained with only a slide rule. However, this model does not realistic-
ally represent the actual radioactive dust environment and its behavior with the
time and may not yield realistic results.
101
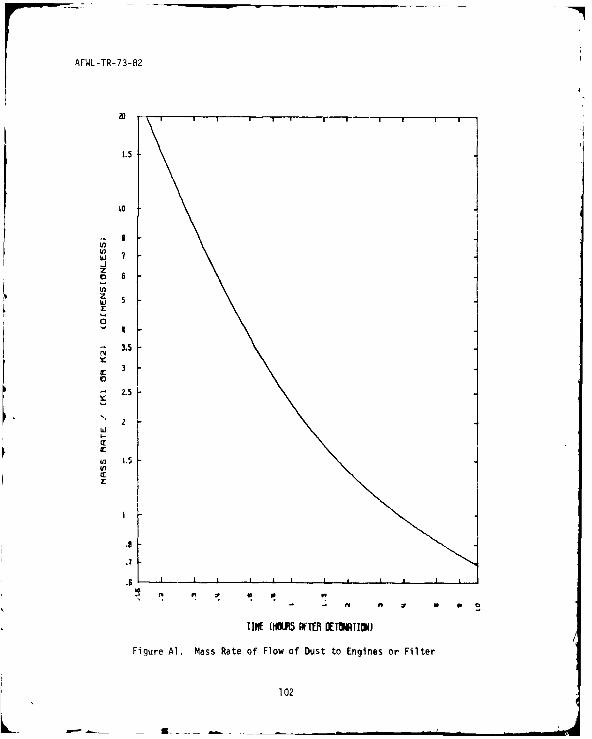
AFWL-TR-73-82
1.5ZO
10
z
(n
zW 0
3.5
3
2.5
I.J
U) 1.5Inr
.9
.7
.B I p , I . I i p
in 1.5op
TI E (HOUN i DTET TTION)
Figure Al. Mass Rate of Flow of Dust to Engines or Filter
102
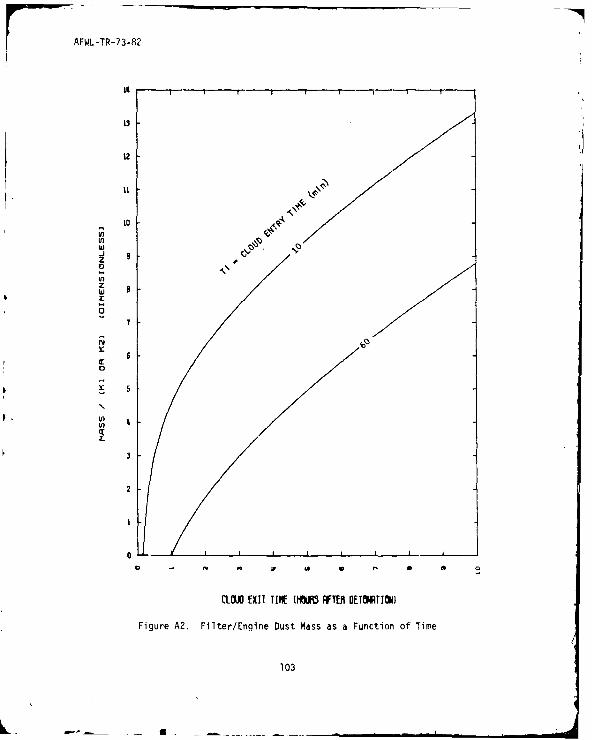
AFWL-TR-73-82
12
11
10Ininw
cJ 9z2
Inz
7
I
1
6
!
'I03
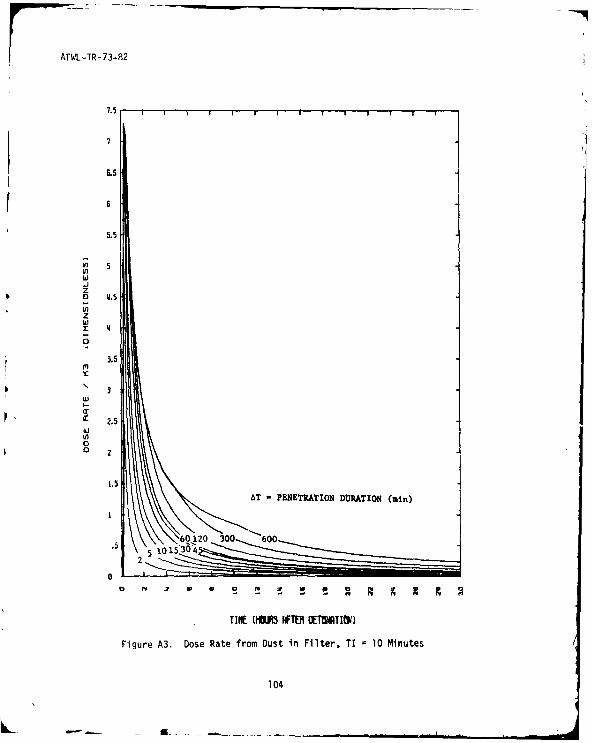
AFWL-TR-73-82
L5
5.5
V) 5hiJz0) 1.5
V I
0
3.5
3wiI.-
- 2.5hi
0o 2
1.5
A- PENETRATION DURATION (min)
60.12o 300 600.5 10 15304
2
TIME MMiR IETER OETWIWM)
Figure A3. Dose Rate from Dust in Filter, TI -10 Minutes
104
-IL . . .. .• . t 1
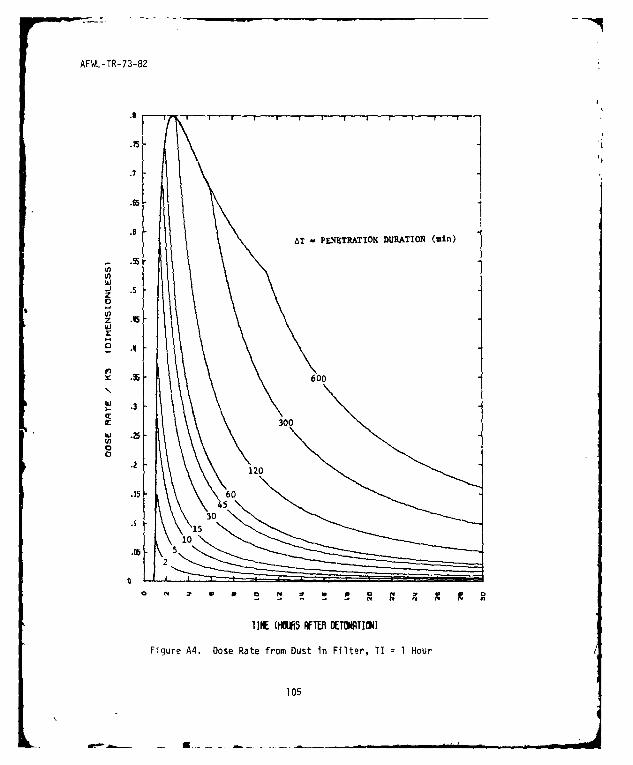
AFWL-TR-73-82
.7
.7
.6.T - PENETRATION DURATION (min)
-J1 .5zE
II
x: .35 600
.3
Ir 300
o A
w .25
2120
.15 60
a5
.2
1530
TIME (H'I Ff TE BETU~TION)
Figure A4. Dose Rate from Dust in Filter, TI 1 Hour
105

AFWL-R-73-.82
26 AT -PENETRATION DURATION (min)
600
24
300
202
in
zt~ 60
V)
z 4aj
12 30
II0
110
C5
22
Figure AS. Radiation Dose from Dust in Filter, TI 10 MinutesL 106
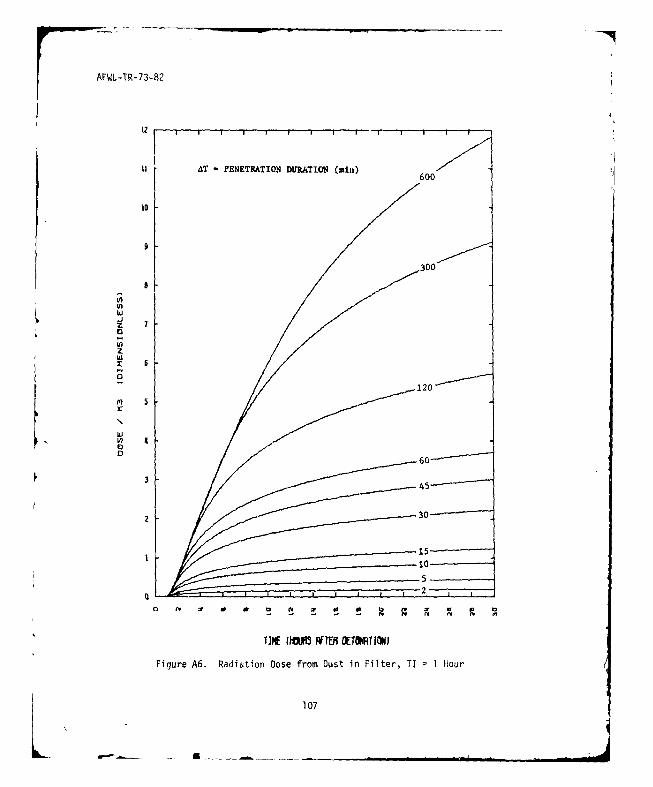
APWL-TR-73-82
121
11 -PENETRATIONI DURATION~ (oil)60
600
102
w
300--
-5J
2~ 6
TIECM AMOTRIN
Fiur A65aito oefo uti itr j IHu
10
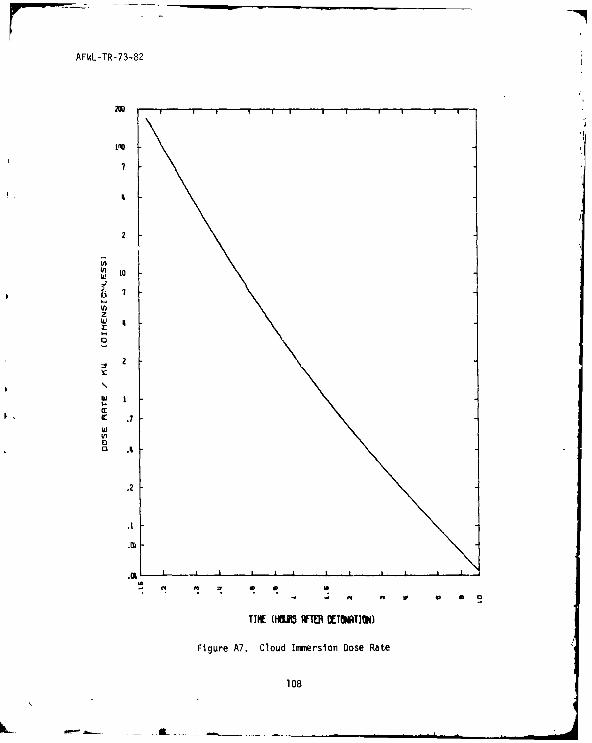
AFWL-TR-73-32
7
10-J2. 7
a:
0
0 .4
U-
.2
.1
Figure A7. Cloud Immnersion Dose Rate
108
C
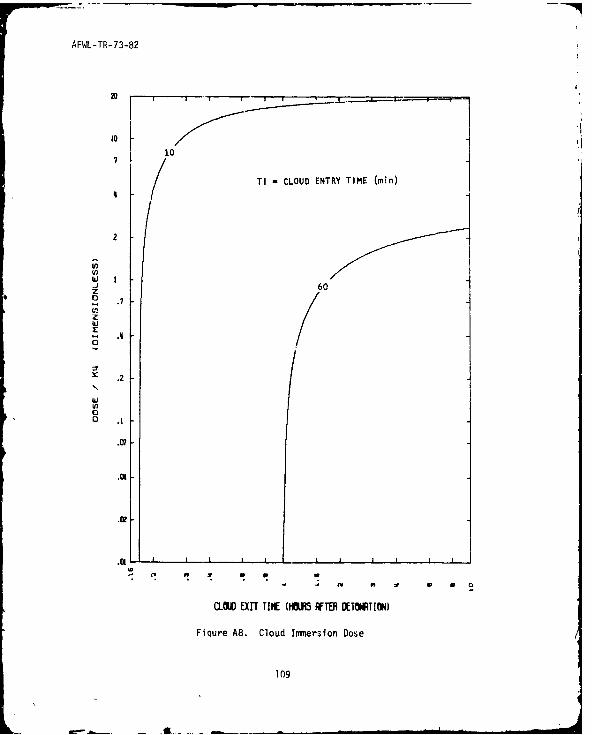
AFWL-TR-73-82
20
0 10
'1 TI - CLOUD ENTRY TIME (min)
2
V)
wI IJ1 60z
06
.7
z
w
• - . ,.o
A
x .2
(CLI EXIT TIME (MEU AFT"ERt ETINATION)
Fiqure A8. Cloud Immersion Dose
109
o .1

AFWL-TR-73-82
78-
J
z
gL
Ini
a
X .2
o win
Va C
TIME (HRiJ5 ATER MThTIMl
Figure A9. Dose Rate from Dust on Aircraft Exterior
K10

AFWL-TR-73-82
TI =CLOUD ENTRY TIME (min)
10
60In
z
.- .2
in
V) .07
OCiD EXIT TIME (ME WOE DETNTION)
Figure A10. Radiation Dose from Dust on Aircraft Exterior
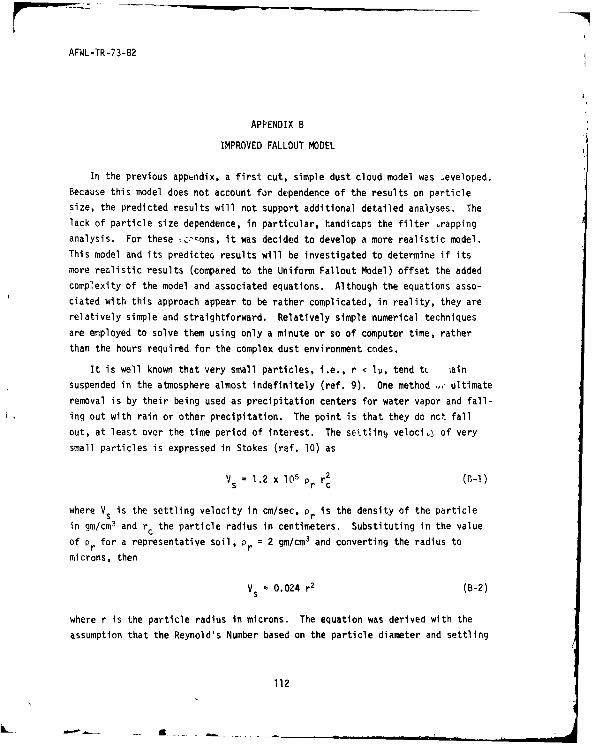
AFWL-TR-73-82
APPENDIX B
IMPROVED FALLOUT MODEL
In the previous appendix, a first cut, simple dust cloud model was Jeveloped.
Because this model does not account for dependence of the results on particlesize, the predicted results will not support additional detailed analyses. The
lack of particle size dependence, in particular, handicaps the filter rapping
analysis. For these --ons, it was decided to develop a more realistic model.
This model and its predictec, results will be investigated to determine if its
more realistic results (compared to the Uniform Fallout Model) offset the added
complexity of the model and associated equations. Although the equations asso-
ciated with this approach appear to be rather complicated, in reality, they are
relatively simple and straightforward. Relatively simple numerical techniques
are employed to solve them using only a minute or so of computer time, rather
than the hours required for the complex dust environment codes.
It is well known that very small particles, i.e., r < lu, tend tL iain
suspended in the atmosphere almost indefinitely (ref. 9). One method - ultimate
removal is by their being used as precipitation centers for water vapor and fall-
ing out with rain or other precipitation. The point is that they do nct fall
out, at least over the time period of interest. The seitlint veloci, of verysmall particles is expressed in Stokes (ref. 10) as
Vs = 1.2 x lO p r2 (B-1)
where Vs is the settling velocity in cm/sec. Pr is the density of the particle
in gm/cm 3 and rc the particle radius in centimeters. Substituting in the valueof Pr for a representative soil, = 2 gm/cm3 and converting the radius to
microns, then
Vs = 0.024 r2 (B-2)
where r is the particle radius in microns. The equation was derived with the
assumption that the Reynold's Number based on the particle diameter and settling
112
AFWL-TR-73-82
velocity was very small, i.e.,
2 x radius x V
Re= air << 1 (B-3)
where vair is the viscosity of air. The relation is very accurate for the range
of particle radius from 1 micron to 50 microns (ref. 9). Although Stoke's Law
was derived for Re << 1, it has been found experimentally that there is good
agreement between the theory and experiment up to RE - 1, where divergence
begins, but agreement is still adequate up to RE -10 (ref. 11). Therefore, the
settling velocity concept is reasonably accurate up to a particle radius of about
l03,j.* Based on review of available literature, the initial particle size
distribution was assumed to be
f ~r3.5 (B-4)
with cutoffs at r = O.lji at the lower end and r = lO,O00 at the upper end.
These cutoffs were based on intuition sharpened by study of available information.
The upper limit was suggested by Wlitaker's work (ref. 1) and the lower based on
consideration of possible condensatiun patterns after a detonation. The assump-
tion is made ttat
f(r) = N r"3.5 (B-5)
where f(r) is the total number of particles with radius r in a cubic centimeter,
and N is the constant of porportionality. Then the mass per cubic centimeter of
all the particles with radius r is
(r) r iTOr3
N r3.5
cm(r) = 4 Nnr'°0s (B-6)
*Although this concept breaks down for particle sizes greater than 1031, equation
(B-2) was used in the numerical integrations used to calculate the results inthis appendix. Therefore, the results associated with particle sizes in excessof 1000 are somewhat inaccurate.
113
AFWL-TR-73-82
where pr is the density of each solid particle (assumed to be 2 gm/cm 3) and Pd
is the standard dust density distribution (equation (3) in section II).
It has been shown that the larger particles tend to fall out faster than thesmall particles (ref. 9). It is assumed that all particles with the largestradius fall out before any of the next smaller radius. This is referred to asthe "nibbling mouse" assumption, because the only change to the number distribu-
tion or the density with time is the disappearing end point. The end point canbe envisioned to be in thc process of hsing eaten by a mouse nibbling the curve
at a "rate," R(t). Figures BI and B2 show the number distribution and thedensity with cutoffs noted. These curves were obtained by fixing the constants
involved in the following way. The following relation is forced to hold.
R(t)
Pd(t) =. Pd(r) dr (B-7)
where Pd is defined by equation (3) in section II. Note that the time dependenceof the density distribution with r enters only through the upper limit of the
integral. The value of R(t) at 10 minutes (or 0.167 hour) is defined to be 104
microns. The above relation evaluated at 10 minutes after detonation fixes thevalue of the constant N. Therefore,
f(r,t) = 1.2 x 10¹⁰ ai r-3 .5 0.1 .r SR(t) (B-8)
Pd(r,t) = 9.9 x l02 ai r"°.5 = 9.9 x 10
-2 K7 r.5
' 0.1 :r <R(t) (B-9)
where K7 = ai gm(dust)/cm 3, a nondimensionalizing constant. Recall that
R(t)
Pd~t) = 9.9 x l0-2 a, f r "° s dr
0.1
or
Pd(t) = 0.2 ai IR(t).5 - 0.316] (B-lO)
To determine R(t) note that equation (B-la) must hold for all t. Therefore,
114

AFWL-TR-73-82
a1 (t-' + 1.313 t0.3) = 0.2 a1 [R(t)'/2 - 0.316] (B-l1)
which results in
R(t) = [5.04 (t-'' + 1.313 t'°') + 0.316]' (B-12)
The density distribution function is completely defined as a function of
particle size and time; the specific activity must now be determined. It appears
reasonable to assume that the activity of the smaller particles is proportional
to the entire particle mass which is predominately condensed bomb debris, and
that of larger particles is proportional to the mass of the surface coating on
the particle which is condensed bomb debris. If this assumption is made then the
specific activity per particle is given by
Aparticle -r 3 0.1 < r < 6 (B-13)
Aparticle r2 6 < r < 10 (B-14)
where 6 is the somewhat Arbitrary boundary (assumed from hereon to be 20P)
separating the region where particles are assumed to be composed entirely of
condensed debris and the region where particles are assumed to be coated with
bomb debris.
Relating the activity to the mass of each particle, then
A(r,t) = fI t'12 0.1 < r _6 (B-15)
A(r,t) = f2 r'
t 2 6 < r < l04 (B-16)
Making use of the condition that at r = 6,
A(r,t) - A(r,t) + (B-17)r r
This results in the relation
f 2 =f 1 6 (B-18)
115
AFWL-TR-73-82
To evaluate the constant, one other condition is needed. The condition
chosen was based on the physical situation. It is assumed that the 10 minute
conditions in all the fallout models considered are identical. Therefore, the
total number of fission fragments, the photons per unit area of an intmersei
body, and the dose rates for both cases are equal at 10 minutes after detonation.
For the Uniform Fallout Model,
Dc(t= .Pd(t) A(t) (B-19)
For the Improved Fallout Model
c(t) = Pd(r) A(r,t) dr + f Pd(r) A(r,t) d (B-20)
SLo1 r
and it was assumed that
c (0.167) = c (0.167) (B-21)improved uniform
Performing the necessary operations end simplifying, the foll'jwing is obtained.
99.6841f,
= - 99.6 1 = 11.83 Al (B-22)2d
o-5 - 0.01 6 -0.316
f2 = 6 a = 236.55 A (3-23)
where Al is defined in appendix A and 6 = 20U. Therefore,
A(r,t) = 11.83 A1 t"1.2 0.1 < r < 20P (B-24)
236.55 Al t'.2
A(r,t) = r 20u £ r < 104 (B-25)
Note that the specific activity is applicable from r = 0.1 to r = l0 for all
t. The "nibbling mouse" is not applied to the activity because the activity is
per gm of dust.
116
AFWL-TR.-73-82
The cloud parameters are now defined and using the same assumptions mentioned
earlier, i.e., zero wind, etc., the mass rate, mass dose rate, and dose calcula-
tions performed earlier are repeated using the newly derived cloud characteris-
tics, which are now particle size dependent.
The mass trapped in the filter as a function of time and particle size is
determined assuming that all the dust is trapped by the filter.
Mf(r,t) = T Pd(rt) (B-26)
or
Mf(rt) 2 05_ _ = 9.946 x 10 r
- 0. 1 u : r . R(t) (B-27)
K2
where 2 is the same as defined in equation (A-44) in appendix A.
The total mass trapped is the integral over time of the above relation.
Mf(r~t) -"2 rO0K-----2
= 9.946 x 10 (t - ti ) O.lP L r z R(t) (B-28)
Mf(r~t)2 -0
K : 9.946 x 10⁻²
rn " ° '. (tn - ti ) R(t) irn .R(ti) (B-29)
where t i -. tn . t, and rn = R(tn). Equation (B-29) is handled with numerical
techniques for plotting purposes.
This combination of analytical and numerical techniques is necessary because
of the "nibbling mouse." Figure B3 is representative of the mass rate of flow
of dust into the filter, Mf(r,t). Note that it is a simple prism with thenibbling mouse" eating away at the edge. Figure B4 is a representation of the
mass of dust collected in the filter. This three-dimensional figure is consid-
erably more complex than the previuus figure. "Slices" of three-dimensional
figure B4 for varinus (ti. tf) sets are presented in figures B5 through B13.
This Mf(r,t) equation set Lan bc integrated over r and then evaluated at tf
to give an equation set, which represents the cumulative mass (CMf) as a
function of r, for some (ti , tf).
117
AFWL-TR-73-82
CMf(r)K2 0.1989 (r
° . - 0.3162)(tf-ti) 0.L r _<R(tf) (B-30)
f 0.1989 [R(tf) ° ' - 0.3162] (tf-ti)
R(ti)
+ 9.946 x 10- 2 i rn
0 5(tn-ti)A r R(tf) srn .R(ti) (B-31)
RIt)
Note that the second equation must be integrated numerically. These results are
presented in figures B14 through B22. Figure B23 presents the total mass
collected by the filter as a function of time after weapon detonation for the
TIs of interest. The total mass results in this figure are identical to the
results in figure A2 in appendix A.
These results may be used to directly determine the total mass (and its size
distribution) ingested by the engine in the same manner as discussed in the
Uniform Fallout 'odel Analysis.
Now conside, the dose rate and dose which are associated with the dust
trapped in the filter. This dust acts as a source of photons which could affect
the crew/electronic equipment. The dose rate can be written as
Df(rt) = C- Mf (r,t) A(r,t) (B-32)
4rd2
Substituting, the following set of equations is obtained.
ti < t tf
Df(r,t)-----K _-- 1 176 r " ' Ct - tj ) t "I 2 0 .1 i r :L 2 0 (B -3 3 )
--- t)=
23.52 r1 5
(t - ti ) t" 2
20 4.r :L R(t) (B-34)K3
Df (r ,t ) r 1 5.(-K = 23.52 r n (tn - ti) t" R(t) .rn . R(ti) (-35)
118
a -
AFWL-TR-73-82
t >tf
r f*rt)K3 = 1.176 r"0 .5 (tf - t) t"'"2 0.1 <r <20 (B-36)
O~f(r, t)
K----t . 23.52 r- 1
.5
(tf - ti ) t"1 "2
20 <r < R(tf) (B-37)
Df(r~t) - -,K--- -- = 23.5? rn 5
(tn - ti) tR(tf) :L rn _ R (ti (B-38)
From these, the dose distribution as a function of size r for a (ti, tf) set
can be obtained by integrating over t. The distribution can be determined at
any time after detonation. The time of most interest here is the time of mission
completion (Tmc). The complete set of equations for Tmc > tf and R(tf) > 20u is
0.1 :_ r <i 20
Df(r) = 5.88 r 0 " [.25 (tfo "B - tio.8 ) + Tmc-0 .2 (ti - tf)l (B-39)
20 <. r -. R(tf)
Df(r) 117.6 " [1.25 (tf+ '
ti" ' ) Tmc-0 .2 (ti tf)] (B-40)
T3 1
R(tf) <_ r < R(ti)
Df(r) =117.6 rn [1.25 (tn8 - ti0"8) + T' 0 2(t i tn)] (B-41)
where rn = R(tn) and ti <_tn <_tf.
119

AFWL-TR-73-82
If R(tf) < 20p, then the above set of equations becomes
0.1 <_ r <_. R(tf)
Kr 5.88 r " 0 " [1.25 (tf0 - ti 0 8 ) 1 Tmc0 2
(t i - tf)j (B-42)
R(tf) :L r <_. 20
Dr (r ) -0 *T .8 0 -0.2 ( - 3DK =)5.88 rn " '
[1.25 (tn°'
- ti°') + mc (ti- tn)] (B-43)
20 :_ r <__ R(t i )
of(r) = 17 6 rn I 25 (tn ° t 0' 8) + mc- ' 2
(ti tn- ] B-44)
These equations are plotted in figures B24 through B32.
Integrating this set over r gives a cumulative-dose-as-a-function-of-r set
of equations. Note that ag&in numerical integration must be used 'n parts of
the evaluation. For R(tf) >. 20p,
0.1 < r < 20
CD f(r) = 11.76 [1.25 (tf'o8 - t0.8) - .2 (ti-tf] (r 0 .5 0316) (B-45)
20 < r < R(tf)
COf 2(r) CDf (20)
= - +235 [.25 (tf - ti o-8
)
+ T Mc"0 2 (ti-t)][0.2236 - r-0] (B-46)
120
AFWL-TR-73-82
R(tf) . r n j R (ti
COf 3(r) CDf2(R(tf)) R i) 0)
K3 K + 117.6 1. 25 (t t3 3 R(tf) .8 -
+ Tmc 0.2 (ti-tn)] rn1. Ar (B-47)
where rn = R(tn) and ti tn <tf.
If R(tf) .20u, the preceding set of equations becomes
0.1 ! r s R(tf)
OfK(r) 11.76 [1.25 (tf 0 - ti°.8 ) + T 0 .2 (ti-tf) (r0 5-0.316) ( -48)
R(tf) r j 20
Cf 2(r) CDfl(R(tf)) 20
3K + 5.88 [1.25 (t,°. - i)Rtf
+ 1mc-0.2 (ti-tn)] rn"0.5
8r (B-49)
201 L r LR(ti)
COf 3(r) CDf 2(20) R(ti)
---7 -K 3 -+ 117. 6 2 [1.25 (t,08 - ti"')
+ T 0 2 (ti-tn)] rn- t1.r (B-50)
where rn = R(tn) and ti % tn tf. These equations are plotted in figures B33
through B41 in semilog scaling for better accuracy at the higher dose levels and
figures B42 through B50 in log-log scaling for better accuracy for the lower
dose levels.
121

AFWL-TR-73-82
Another useful set of equations can be determined by taking equations (B-33)
through (B-38) and integrating out the size dependence to obtain the dose as a
function of time. Again a numerical technique must be used, and rn = R(tn)
With t i <t n <_tf. For t <_t <.tf and if R(t) 20P
D (t)1l-
.5t08_12 0.8 + -0.K3 (101.46 - 235.27 R(t) 's)( t 1
R(ti)+ 117.' -0.2 - t0 .2 Rrn- 1' (tn-ti) Ar (B-51)
R(t)
if R(t) < 20v
f t) + ( .76 R(t)0° 5 3.7 85)(0.25 t "' - 1.25 tio + tit - )
+ .88ti-0.2 - t "0 . 2) . r -r (tn-ti) Ar(1: 1 L R(t) n
+ 117.6 r - .5 (tn-ti) L (B-52)20 nr
For times after tf, i.e., t > tf, the equations become, for R(tf) > 20p,
f) (tf- 0 1 (tf - t) (101.46 - 235.27 R tf))
R(ti) t)r] (tf)
+ 117.6 R~tf) rn 1 .5 (tn - t+ (B-53)
If R(tf) < 20p, this set of equations becomes
f(t) (tf - - [(tf 0t.)(0)1.76 R(tf)° s 3.7185)
S= 20 L
5.88 E rn C (tn - ti) ArR(tf)
+ 117.6 rni 's (tn - ti) A + 2 (B-54)
122
AFWL-TR-73-82
The filter dose as a function of time is plotted for several TI and TF
combinations in figures B51 through B59.
The dose rate in a cloud is
Dc(r,t) = -Pd(r,t) A(r,t) (B-55)c d
or
- Tc = 1.176 r 0 5 t "1.2 O.l < r < 20 (B-56)K4D (r,t)
1. 12
K4 23.527 r t 20 r <R(t) (B-b7)
Integrating over r
wc(t) = 47.054 t'"2 (0.4314 - R(t) - '5) (B-58)74
The dose then is
T =47.054 2.157 Et
" ' t 0 2
R(t) - ' t '
At (B-59)ti
The dose rate and the dose are presented in figures B60 and B61.
In all these relations the summation symbol indicates numerical integration,
and the integral symbol analytical integration. Extensive checks of the
numerical techniques used were made to ensure reasonable accuracy. Comparing
figures B33 and B51, it is seen that the two different approaches yield results
at t = 30 hours very close in value, i.e., to about 1 percent.
It is noted again that these results are applicable for the 100-percent
efficient filter.
123

AFWL-TR-73-82
GRAPHICAL RESULTS
The equations associated with this model are considerably more complex than
those associated with the simpler Uniform Fallout Model, and dictate the use of
numerical techniques to obtain numerical results. Therefore, extensive graphical
results are presented to support accurate interpolation. This model is more
realistic than the Uniform Fallout Model, but could be further refined by inclu-
sion of the dependence of the dust density on altitude as a function of time and
the use of a better, more mathematically precise number distribution, i.e.,
refine the "nibbling mouse" assumiption. The above refinements might provide
more accurate results, but the increase in accuracy would probably not be
significant.
The graphical results themselves will now be discussed to illustrate their
use. Recall that the filter used in this development was a perfect filter. It
collects all ingested dust particles for the penetration Al. When the aircraft
exits the cloud at TF = TI + AT, no more particles are collected. The trapped
mass distribution results are shown in figures B5 through B13. Each graph
presents Lhe dust mass collected by the filter as a function of particle size
for a particular TI and with penetration duration, AT, as a parameter. Each
graph considers ATs of 2, 5, 10, 15, 30, 60, 120, and 300 minutes. These fig-
ures are for cloud entry times ranging from 10 minutes to 5 hours after weapon
detonation, which should cover the range of interest for most analyses. Particle
size distributions range from 0.1 micron to 10,000 microns radius. A comparison
of figure B5 for a cloud entry time of 10 minutes with figure B13 for a cloud
entry time of 5 hours shows the appreciable effect of fallout on the results.
At TI = 10 minutes a sizable portion of the ..,ss consists of particles with
r > 10 microns; whereas, for TI = 5 hours all of these particles have fallen out
prior to aircraft entry, and thus no particles in this size range are collected
by the filter.
The second series of perfect filter graphs, figures B14 through B22, presents
the cumulative mass collected by the filter for a particular TI, as a func in
of particle size and in terms of the same range of parameters AT. Cumuletive
mass CMf(r), means the dust mass collected by the filter represented by dust
particles which have sizes less than or equal to r. If Mf(r) represents the dust
124
AFWL-TR-73-82
mass distribution function for the filter as a function of particle size r for
a TI, AT case, then
r
CM = o Mf(r) dr (B-60)
Figures B14 through B22 present these results for cloud entry times ranging
from 10 minutes to 5 hours. To further clarify the meaning of these figures,
consider for a moment figure B14. This figure gives the cumulative mass collected
by the filter as a function of particle size for a cloud entry time of TI = 10
minutes. For illustration purposes select a penetration duration of AT = 30
minutes, then focus on the question of how much dust will be collected which has
particle sizes ranging up to 50 microns. Entering the abscissa at 50 microns and
moving up to the curve corresponding to AT = 30 minutes, a result of 0.67 K2grams is obtained from the ordinate. Similarly 2.2 K2 grams of dust particles
with sizes up to 500 microns have been collected by the perfect filter for the
the same entry time of 10 minutes and penetration duration of 30 minutes.
The cumulative mass collected for particle sizes up to 10,000 microns repre-
sents the total mass collected by the filter since this represents the upper
limit of particle sizes considered in the analysis. Figure B23 presents the
total mass collected by the perfect filter as a function of time after weapon
detonation with cloud entry time as a parameter. Results for cloud entry times
of 10, 18, 30, 45, 60, 90, 120, 180, and 300 minutes are included in this figure.
As an example of the utility of this figure consider the following: How many
grams of dust would be collected by a perfect filter in the aircraft environmental
control system if it entered the cloud at TI = 30 minutes and exited the cloud
after a penetration duration AT = 30 minutes? In this example, note that the
aircraft exits the cloud at TF = TI + AT = 60 minutes = 1 hour after weapon
detonation. Enter the abscissa at TF = 1 hour and move up to the parametric
curve for TI = 30 minutes and read from the ordinate the fact that 1.6 K2 grams
of dust have been collected by the filter. The total mass of dust collected is
an extremely strong function of cloud entry time, which again ,ttests to the
fact that fallout effects are significant in the analysis.
Curves pertaining to the filter dust mass distribution function, cumulative
mass, and total mass collerted by the filter are in themselves useful from a
filter design standpoint. dowever, another major factor must be considered.
125
AFWL-TR-73-82
The dust particles collected by the filter are a source of radioactivity which
is carried with the aircraft and contributes dose to the crew/electronics in the
vicinity of the filter. Dose calculations from this source have been made and
are based upon several assumptions. The filter is assumed to be a point source
of radioactivity emitting gamma rays with an average energy of 1 MeV. The
resultant dose calculated corresponds toa dose "at-l-meter" so that a simple
correction factor of (1 meter/d meters)2 can be applied to the results to correct
for actual separation distance of crew/electronics from the filter.
The product of the mass distribution function and the specific activity
distribution function is involved in the filter dose calculations. In addition,
after the aircraft exits from the cloud, the dust previously collected continues
to contribute to the dose until the mission is completed. Thus, to present the
results, a particular time after weapon detonation must be selected as a base-
line, and in this work the dcse data are presented at a time of 30 hours after
weapon detonation. These results can be scaled to other times, as will be
demonstrated.
Figures B24 through B32 present the resultant perfect filter dose distribu-
tion function as a function of particle size and with penetration duration as a
parameter for a particular cloud entry time, TI. The penetration durations
presented on each figure are 2, 5, 10, 15, 30, 60, 120, and 300 minutes, and
each separate curve presents results for a particular cloud entry time in the
range from 10 minutes to 5 hours. Again the effects of fallout can be easily
observed by a comparison of early and late cloud entry data, for there is no
dose contribution from large particl sizes for late cloud entry time. Although
not as noticeable, it can be also observed that the exponential radioactive decay
law has been included in the analysis, figures B33 through B50.
The next series of figures presents data on the cumulative filter dose at 30
hours after weapon detonation as a function of particle size. Figures B33
through B41 use semi-log scaling and figures B42 through B50 use log-log scaling.
These sets of graphs depict the same data and both are presented to facilitate
the accurate interpretation of the numerical values. The term cumulative filter
dose is defined as that portion of the total dose attributable to all particles
collected which have sizes less than or equal to r. These figures present this
cumulative dose for cloud entry times from 10 minutes to 5 hours, and in each
126
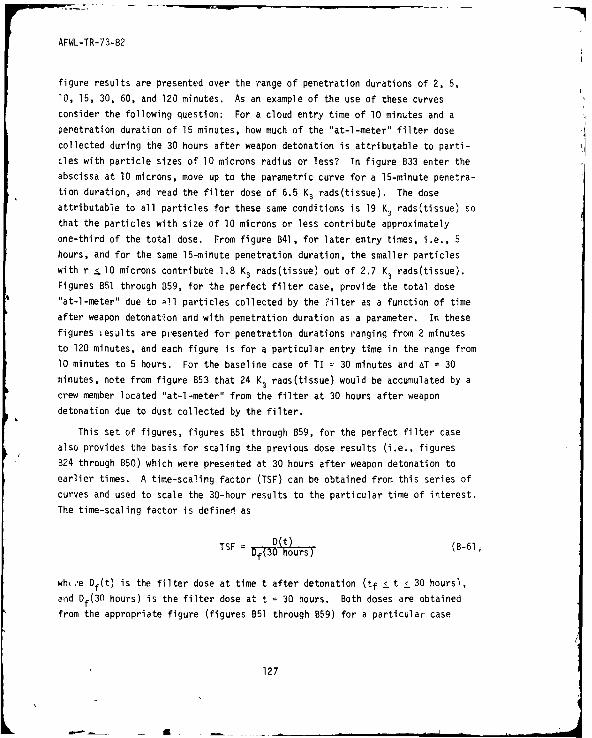
AFWL-TR-73-82
figure results are presented over the range of penetration durations of 2, 5,
10, 15, 30, 60, and 120 minutes. As an example of the use of these curves
consider the following question: For a cloud entry time of 10 minutes and a
penetration duration of 15 minutes, how much of the "at-l-meter" filter dose
collected during the 30 hours after weapon detonation is attributable to parti-
cles with particle sizes of 10 microns radius or less? In figure B33 enter the
abscissa at 10 microns, move up to the parametric curve for a 15-minute penetra-
tion duration, and read the filter dose of 6.5 K3 rads(tissue). The dose
attributable to all particles for these same conditions is 19 K3 rads(tissue) so
that the particles with size of 10 microns or less contribute approximately
one-third of the total dose. From figure B41, for later entry times, i.e., 5
hours, and for the same 15-minute penetration duration, the smaller particles
with r 10 microns contribute 1.8 K3 rads(tissue) out of 2.7 K3 rads(tissue).
Figures B51 through B59, for the perfect filter case, provide the total dose"at-l-meter" due to 0I1 particles collected by the iilter as a function of time
after weapon detonation and with penetration duration as a parameter. In these
figures iesults are presented for penetration durations ranging from 2 minutes
to 120 minutes, and each figure is for a particular entry time in the range from
10 minutes to 5 hours. For the baseline case of TI = 30 minutes and AT = 30
minutes, note from figure B53 that 24 K3 rads(tissue) would be accumulated by a
crew member located "at-l-meter" from the filter at 30 hours after weapon
detonation due to dust collected by the filter.
This set of figures, figures B51 through B59, for the perfect filter case
also provides the basis for scaling the previous dose results (i.e., figures
B24 through B50) which were presented at 30 hours after weapon detonation to
earlier times. A time-scaling factor (TSF) can be obtained from this series of
curves and used to scale the 30-hour results to the particular time of interest.
The time-scaling factor is defined as
TSF Dt (B-61;TF=Df'(30 hours)
wh,.'e Df(t) is the filter dose at time t after detonation (tf < t < 30 hoursl,
and Df(30 hours) is the filter dose at t = 30 hours. Both doses are obtained
from the appropriate figure (figures B51 through B59) for a particular case
127
a - -•
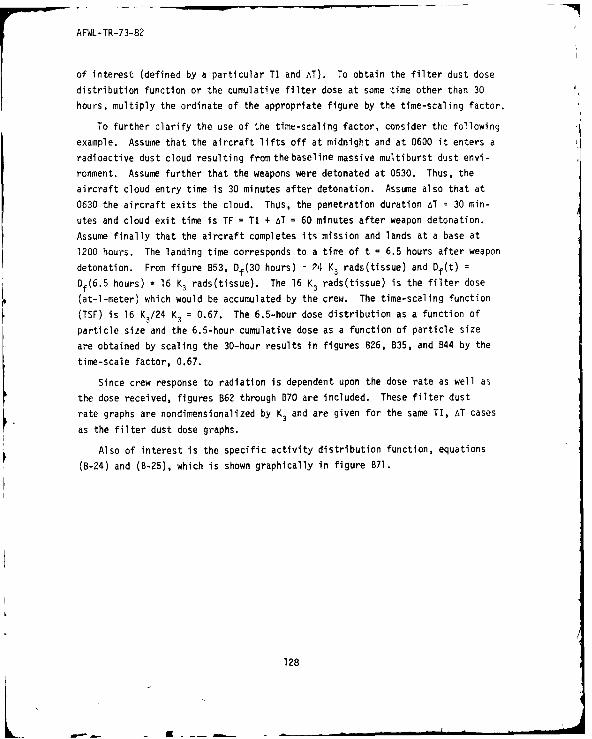
AFWL-TR-73-82
of interest (defined by a particular TI and AT). To obtain the filter dust dose
distribution function or the cumulative filter dose at some time other than 30
hours, multiply the ordinate of the appropriate figure by the time-scaling factor.
To further clarify the use of the time-scaling factor, consider the following
example. Assume that the aircraft lifts off at midnight and at 0600 it enters a
radioactive dust cloud resulting from the baseline massive multiburst dust envi-
ronment. Assume further that the weapons were detonated at 0530. Thus, the
aircraft cloud entry time is 30 minutes after detonation. Assume also that at
0630 the aircraft exits the cloud. Thus, the penetration duration AT = 30 min-
utes and cloud exit time is TF = TI + AT = 60 minutes after weapon detonation.
Assume finally that the aircraft completes its mission and lands at a base at
1200 hours. The landing time corresponds to a time of t = 6.5 hours after weapon
detonation. From figure B53, Df(30 hours) - 24 K3 rads(tissue) and Df(t) =
Df(6 .5 hours) = 16 K3 rads(tissue). The 16 K, rads(tissue) is the filter dose
(at-l-meter) which would be accumulated by the crew. The time-scaling function
(TSF) is 16 K3/24 K3 = 0.67. The 6.5-hour dose distribution as a function of
particle size and the 6.5-hour cumulative dose as a function of particle size
are obtained by scaling the 30-hour results in figures B26, B35, and B44 by the
time-scale factor, 0.67.
Since crew response to radiation is dependent upon the dose rate as well as
the dose received, figures B62 through B70 are included. These filter dust
rate graphs are nondimensionalized by K3 and are given for the same TI, AT cases
as the filter dust dose graphs.
Also of interest is the specific activity distribution function, equations
(B-24) and (B-25), which is shown graphically in figure 871.
128
7 AFWL-TR-73-82
Z I I+0
I.GE~m
0A0
U
JIO
1. 14b3
LL
UI.GE-01
. 0a:0a: C4Cp
JA-M \ E
PATCEIAIS (MCOS
Fiue8. Pril ie itiuinFnto
K a:LI129
AFWL-TR-73-82
"IJ ! I i I ' I j.- 1
n .07
LL
U.F I
z
.01
.00-
a 0 0 o 0 0a-a 0 4
.-. C. I n a r i n n in a . in
PAHTICLE RADIUS IMICHONS)
Figure B2. Particle Mass Distribution Function
130
AFWL-TR-73-82
I.'D.....
.... ..
*~ ~ .... ...-.. -awl
131-
AFWL-TR-73-82
0
C
0E
I-
0
0
U-
0
0
S
U
0- C-
132
a
AFWL-TR-73-82
I I I I | " I I I ""1i i 1
AT - PENETRATION DURATION (min)
I300 !
120
60
z
01
If)(r 5
.Nfl
Nm
•-({{X I I o 1 a 1 . uI t I Il
PRPTICLE FMDIUS tMICHNS)
Figure B5. Perfect Filter Mass Distribution Function, TI = 10 Minutes
133
AFWL-TR-73-82
i4 I i I I I ' -- -- -- 1
AT - PENETRATION DURATION (min)
300
.0
120
.4
Ln
Tt)
r .QO
E lu
V)
-J .Okl14
WU)
IJ
L0
U)T L0
z:
FRHTICLE BAOIUS (MICR.ONS)
Figure B6. Perfect Filter Mass Distribution Function, TI =18 Minutes
134
Ir.
.1441111
AFWL-TR-73-82
Srr T- -r
AT PENETRATION DURATION (Vmm)
300 .
120
UO3
00
013
I- a
ArWL-TR-73-82
AT PENETRATION DURATION (min)
300
120
S60
c30U
5)
5)5
V)
UJI
z
. 0 1
-0 0
SC!
• 00 O - I I i I I I I I . _ L I I I _
PFRTICLF RA IL5 IMICiONS)
Figure B8. Perfect Filter Mass Distribution Function, TI 45 Minutes
136
LI

AFWL-TR-73-82
i l I i I i i III I I I I
AT - PENETRATION DURATION (min)
300
120
60
T 3030
IfCl l~ M~f 5
I!)Cc
113
Uj - 2z
Li
z
1! Li
(137

AFWL-TR-73-82
AT- PENETRATION DURATION (min)
300
120
60zM . 30U
1.5
515
V)
S
-i .O 001
z
V)
OW
.OQIII
PRBTICLE 9RDIUS IMICRONS)
Fiqure B10. Perfect Filter Mass Distribution Function, TI 1.5 Hours
1 31
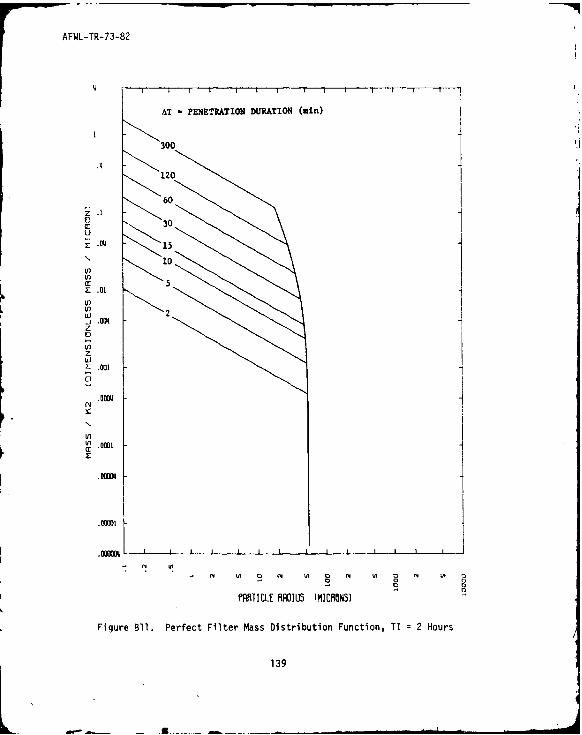
AFWL-TR-73-82
AT PENETRATION DURATION (sin)
300
.1120
60
cc 30
151
v11
a: 5
Ij 2-jI
zr~
vz.03a:
139

AFWL-TR-73-82
AT - PENETRATION DURATION (min)
.4.
.00610
120
~'60
~ L N30
°, V
15
10
5!
U.
If)
owlR
0MI
U.0M
Figure B12 Perec Fite Mas Distiuto Functio, TI 3 Hour
140
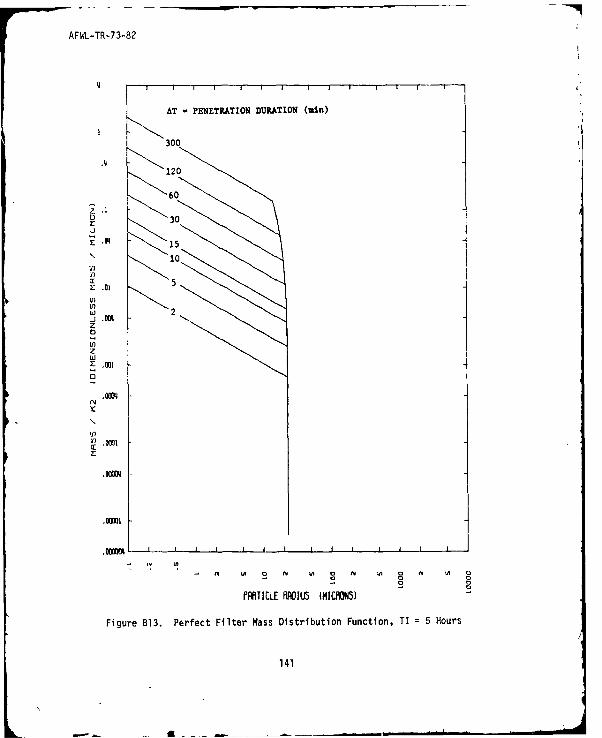
AFWL-TR-73-82
AT - PENETRATION DURATION (mn)
300
.1
120
60
" .11
o 30U
U15
10
LI)to 2
z1C,
.ail!
.n 0Ol
zU,
TN
x
w Ut 0 v w 0 N LO a N Ut L
PARTILE RWMU (MIC0OtJS
Figure B13. Perfect Filter Mass Distribution Function, TI = 5 Hours
141
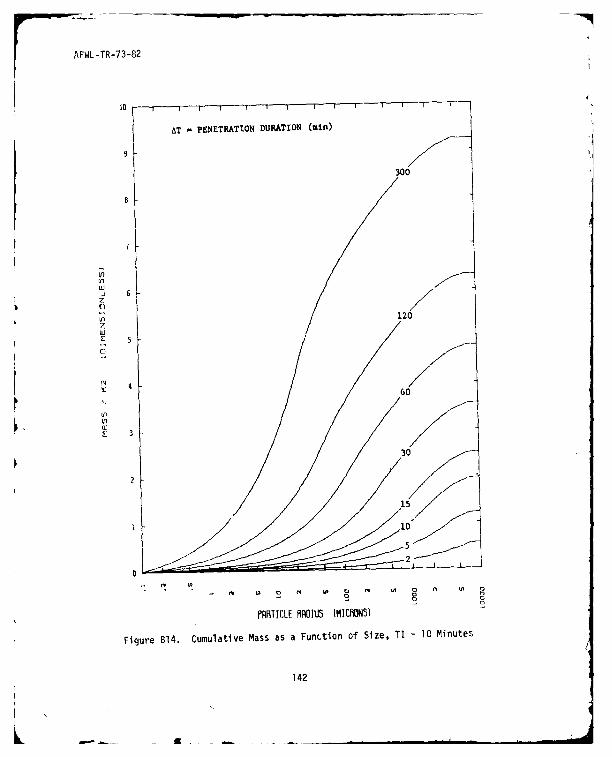
AFWL-TR-73-82
to
AT PENETRATION DURATION (min)
300
LoUn
J 5-i
03620
)L 30
V)5
10
15
01
LA 0
PRTiICLE RROJUS (MICRO~NS)
Figure B14. Cumulative Mass as a Function of Size, TI =10 Minutes
142

AFWL-TR-73-82
B - - I I ! I I I I i l
3007.5 AT - PENETRATION DURATION (min)
7
6.5
6I5.5
V)Un 5Ui-J 120z
LOZUJ
3.5
i I '
N 60
3
U,
MI 2.5
30-
2
1.5 15
143
5/
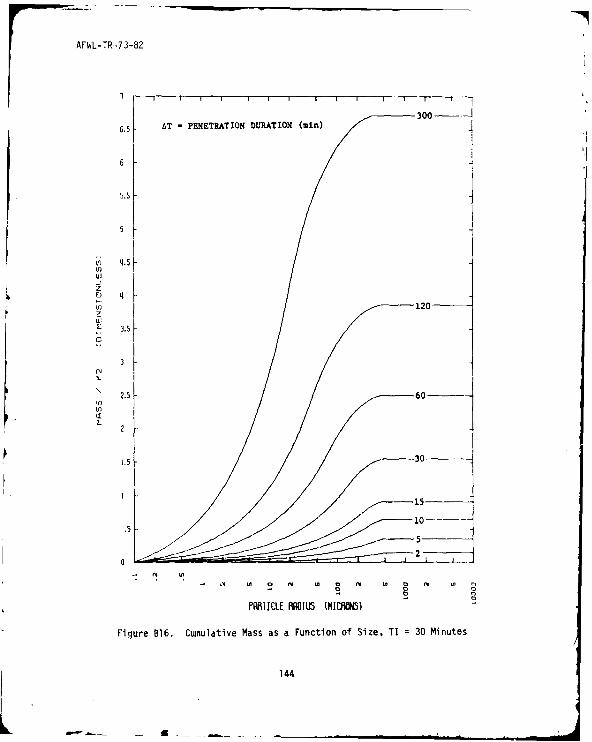
AFWL-TR-73-82
300 --
6.5 AT - PENETRATION DURATION (mi)
6
5.S
5.1.5
3
ry
2.5 6ID
LO L
Cl 2 [
15
10---
5-2
0 w 0 N
FRHlICLE IiOIUS IMIC.aS)
Figure B16. Cumulative Mass as a Function of Size, TI = 30 Minutes
144
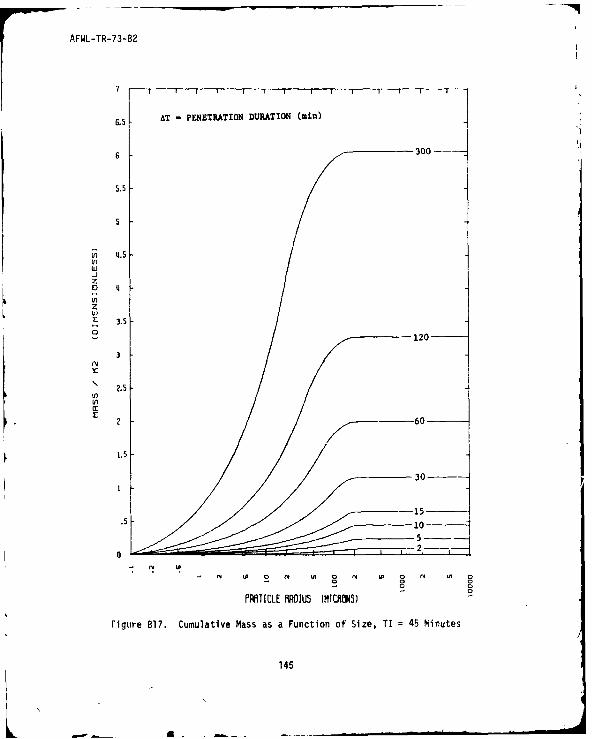
AFWL-TR-73-82
7 i'--i-----
65 AT -PENETRATION DURATION (mini)
6 300
5 .5
-JZ
3.S
2 620
33
2.5
10
N f p In N I4 a N a) C N L
PRRTICLE ROWIS (MICRO~NS)
FigUre B17. Cumulative Mass as a Function of Size, TI =45 Minutes
145
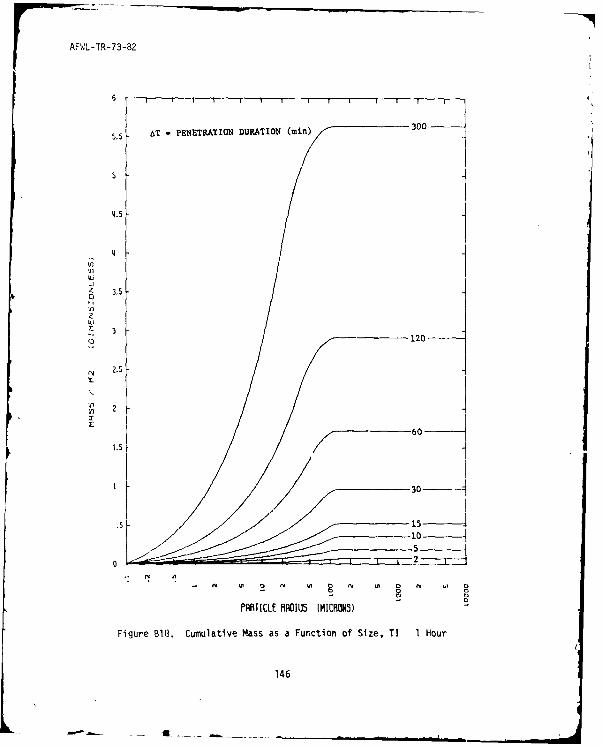
w AFWL-TR-73-82
5.5 AT PENETRATION DURATION (m )300-
5
LI 3.5L)
'i0 120
L 2
601.5
-30-
0 2
PRRTICLE RROILS (MICRONS)
Figure B18. Cumulative Mass as a Function of Size, TI 1 Hour
146
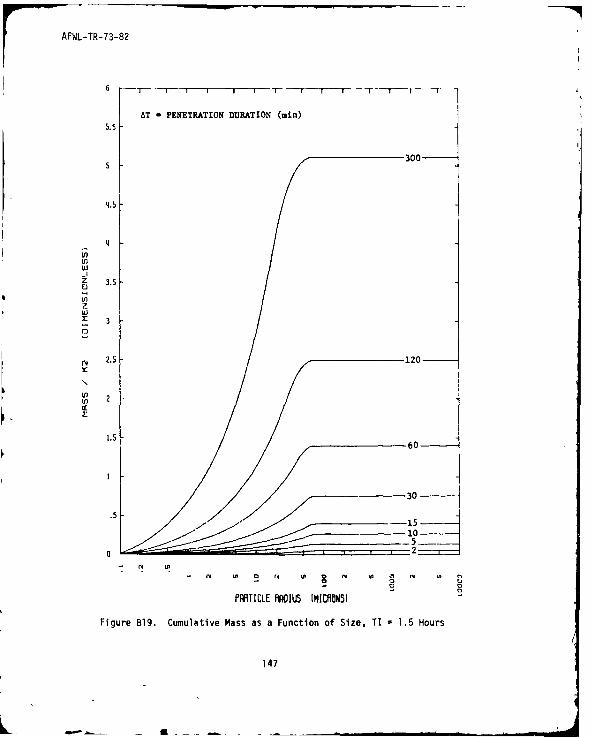
AFWL-TR-73-82
6 - T - -- II -Tr--
AT * PENETRATION DURATION (min)
5.5
300
4.5
Z 3.5
wZU,z
2.5 120
V) 261?V)
1.560
~ 30
5 o--15-105
a 2
PARTICLE FIiROI [MICRO~NS)
Figure B19. Cumulative Mass as a Function of Size, TI 1.5 Hours
147
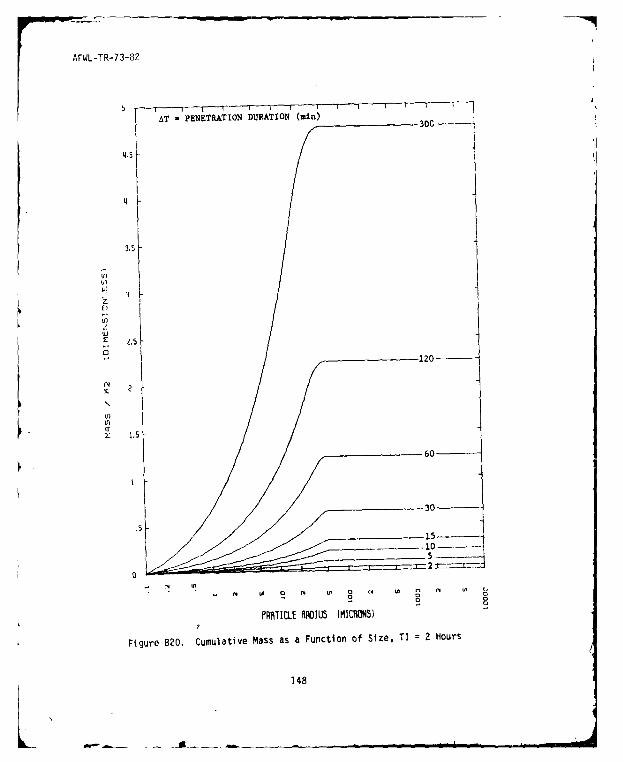
AFWL-TR-73-82
A PENETRATION DURATION (i)-
33
ZI
2- ,5
~120
't
60
3.4
" 15
-In
0
PRTICLE ROILS tMICRONS)
Figure B20. Cumulative Mass as a Function of Size, TI =2 Hours
148
AFWL-TR-73-82
AT = PENETRATION DURATION (min)
'1.5
300 --
U 3.s
in-J 3Z
D
UA
- 2.5
S 2x 120-
>- 1.5
- . .10
PPHTICLE RRD[US tMIRONS)
Figure B21. Cumulative Mass as a Function of Size, TI = 3 Hours
149
AFWL-TR-73-82
-- I - T- - r - - -T I I I 1 I r -- -
AT - PENETRATION DURATION (min)3/5 300--
3.5
3.25
2.5
Z
N'120-
C 1.25
0 60
P25 RRIU5 3MICI0NSJ
Figure B22. Cumulative Mass as a Function of Size, TI 5 Hours
150
AFWL-TR-73-82
T - ,I I
13
12 TI =CLOUD ENTRY TIME (min) 10
9 30(n
Z 45
6z 60Uj
90
120
00
CLOW~ EXIT TIME IHOURiS FTEfl DETONATIOlN
Figure B23. Filter Dust Mass as a Function of Time
151
AFWL-TR-73-82
l.CEE ------ ,-- 7--
AT - PENETRATIOW DURATION (min)
3001.,0 120
6030
}-2
S1.1[-01
ILU
-1z
2
U
UE0
C
~zI.O[- i
HIFu
15
].-. N W .. . l IA C I ! 0 I A
rRRTICLE RROIUS L[IL mS)5
Figure B24. Dose from Filter Dust at 30 Hours, TI = 10 Minutes
152
K" p

AFWL-TR-73-82
10 A PENETRATION DURATION (min)300
120-- 1-60
03
cis1.1
5
0
tn
Ili
IC)z
V')
I . !IE-O7
1.N A 0 f -.0t 0 ft IA C
mu
~PP0luCLE FNWUS (MICHMSJ
Figure B25. Dose from Filter Dust at 30 Hours, TI = 18 Minutes
153
K .O -_ _
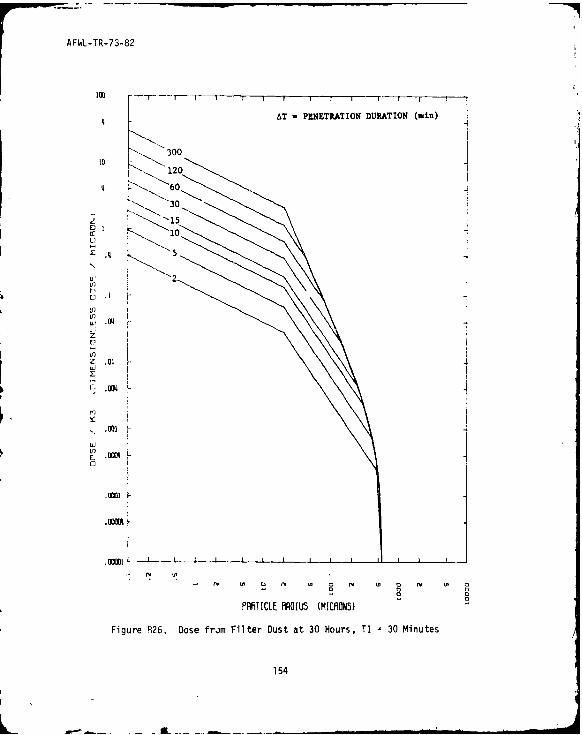
AFWL-TR-73-82
103 -'TrI---T---- -- I-T-
AT - PENETRATION DURATION (min)
300
120
4 60
z ~ 15T ~10,
U' 2
to Frj
Ci
Ln
z.0bA
001Uj
0 11
PARTICLE HRObI5 (MICRONS)
Figure R26. Dose from Filter Dust at 30 Hours, TI 30 Minutes
154
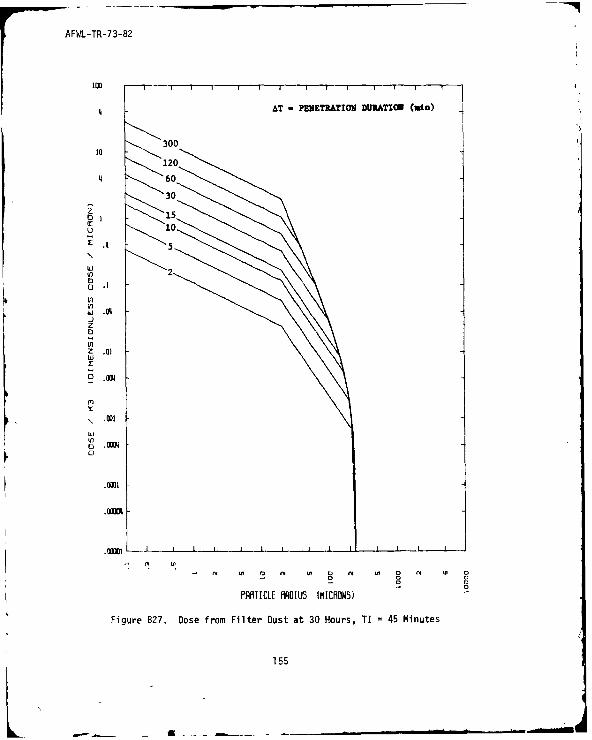
AFWL-TR-73-82
inn
4 AT - PENETRATION DURATIO (ain)
10 3001012
,l120
4 60
30
z
E) - 15
Ir
u 10
\ .4I5
w
V) x2
0
V) .
.nnl
Z 0U,
2 .001
\I U M IA
o 0 000
L PRTICLE RDUS WMCN W)
Figure B27. Dose from Filter Dust at 30 Hours, TI 45 Minutes
155
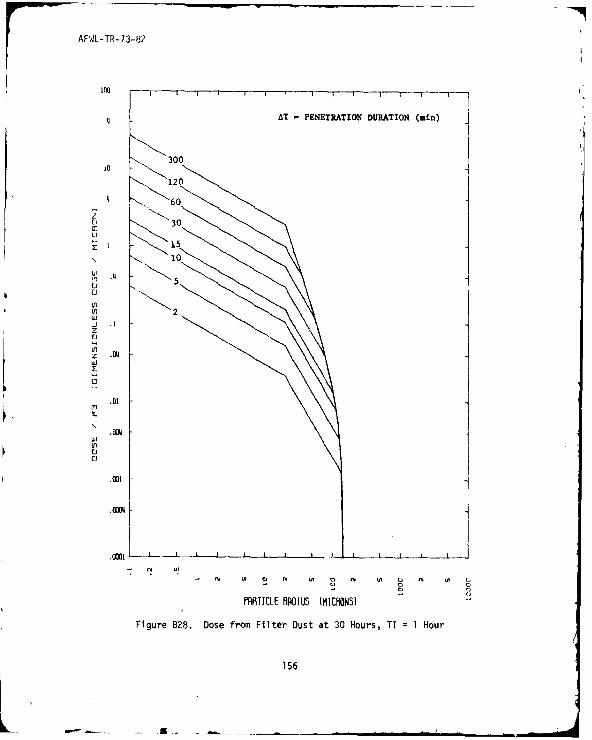
AFWL-TR-73-82
too - - ---
AT - PENETRATION DURATION (min)
300
120
60
30U
10
II 50
V) 2LLi
zii
If)E)
PP09TICLE N~OMU tMUCM)
Figure B28. Dose from Filter Dust at 30 Hours, TI I Hour
156
L.'
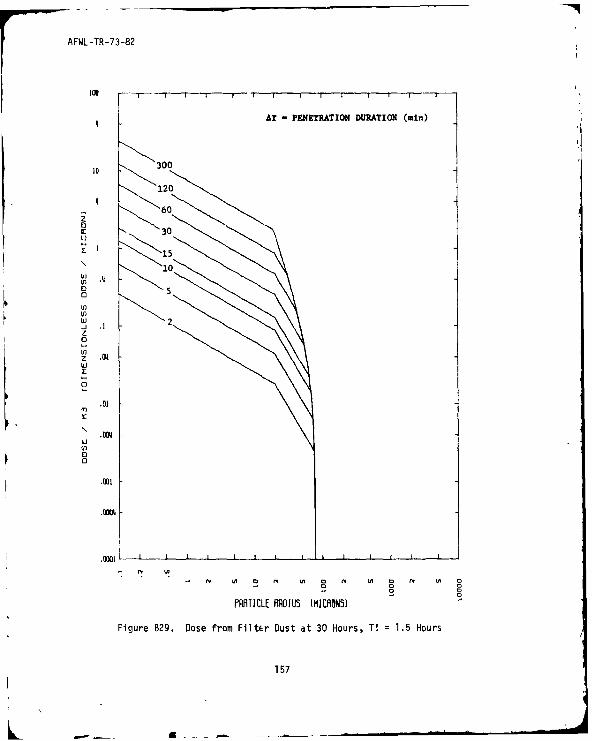
AFWL-TR-73-82
SAT- PE NETRATION DURATION (min)
300
120
60
cr 30U
1510
m~ .01
o
55Ci
LI)
Wt
.1 2
z
LI)
0
.0157
AFWL-TR-73-82
Io
5 AT - PENETRATION DURATION (min)
2II0 300
U 60E)
0 15
t .5 10
.12
1 ]
0
nLU
2
Figure B30. Dose from Filter Dust at 30 Hours, TI = 2 Hours
158
L02
|O. .. . .
AFWL-TR-73-82
lo, **-r-
5 AT -PENETRATION DURATION (min)
2 2
6202
U 3
06) 25
30
Uj 10
.2
z
IUj
2
.0J5
.02un
M
PAHTICLERO I L5 (MWRHONS)
Figure B31. Dose from Filter Dust at 30 Hours, TI =3 Hours
159
AFWL-TR-73-82
IO . I " I I I r
5 AT - PENETRATION DURATION (min)
300
120
. 2 ,. 60
30
In .5 15
-1 10z
.2
05z
122
III
0
.001I I I I I
FARTICLE MROIUS tMICRO)NS
Figure B32. Dose from Filter Dust at 30 Hours, TI = 5 Hours
160
AFWL-TR-73-82
- l i I T I ) " I l T - -'
AT - PIETRATION DURATION (aln)
120-
80
70
'U 00
- 60z
I2
400
-io
/ 2
fRHIICLE fROLUS (MICHONS)
Figure B33. Cumulative Filter Dose at 30 Hours, TI 10l Minutes
161
7 AFWL-TR-73-82
75 AT -PENETRATION DURATION (min)12
70
65
60
55
V)i 50-_j 60 -
'15
L1
35
330
o 25
20
1501
- PilICLE RDIUS (M1CRBNSJ
Figure B34. Cumulative Filter Dose at 30 Hours, TI =18 Minutes
L 162

AFWL-TR-73-82
70 I I I I I
65 AT PENETRATION DURATION (mn) 120
60
55
z 6045
U]
Jlii
D40Vn
S 35
- 30-25
cl20
15
15-
'a /Io- -
5/ -5
01
FRUTICLE RADIUS IMICRONS)
Figure B35. Cumulative Filter Dose at 30 Hours, TI = 30 Minutes
163
AFWL-TR-73-82
60 2AT - PENETRATION DURATION (min)
50
q0 LLn
Uj
.,z~ 25
LO 2 6- 0 -
06
100
': I i 7
PPSTICLE ROIU IMMOW iNN5)
Figure B36. Cumulative Filter Dose at 30 Hours, TI 45 Minutes
164
- , .. . . . .. .,-,

AFWL-TR- 73-82
m5m I i i I i i I I rL55
50
454
mI060-
fI
25
\ 20 ___
tn 30 ..W
IA
U
,o----Un 30~~
25
.. ... .. . .. .... . .... ...... 3 2 - -
10
PARTICLE RAOIU5S MIRONS)
Figure 837. Cumulative Filter Dose at 30 Hours, TI I Hour
L 165
AFWL-TR-73-82
AT - PENETRATION DURATION (min) 120k/35
Iil
n 60--
25
15
u 15 1o-----
Io l
05
20
2--I
PRTICLE HAD I US (MICRONS)
Figure B38. Cumulative Filter Dose at 30 Hours, TI =1.5 Hours
166
5- 10---_.

AFWL-TR-73-82
LAOi I I I I I I
AT- PENETRATION DURATION (min)3"7.5 120 - ,
Z51I
V.5
LoLo 25J
2 Z2.5V) z 60__U
LI)0 12.50 30
10/
7.5
15
i 10 -
2. 5 .5- "01
- I I I I i I
PARTICLE BROUS IMICHONS]
Figure B39. Cumulative Filter Dose at 30 Hours, TI = 2 Hours
167

AFWL-TR-73-82
31 I--Ir r---1- I I I I I I
AT PENETRATION DURATION (min) 120-
28
26
22
20
LJ-.J 18z
z 16 60
U
12
Uj
--10
S-30
6
15
-10
2 2
o
PPTICLE RADIU5 (MICRONS)
Figure B40. Cumulative Filter Dose at 30 Hours, TI 3 Hours
168
AFWL-TR-73-82
I I I I I ! I [ I
AT - PENETRATION DURATION (min)
18.75 120
17.5
15.Z
13.75 -to) 12.5LU
z0
11.25
z060--
8.75
7.5
LI)
30-5
3.75
255
10-
1.25" 2 -
ra o
PRTICLE RAOJI5 (MICRONS)
Figure B41. Cumulative Filter Dose at 30 Hours, TI = 5 Hours
169
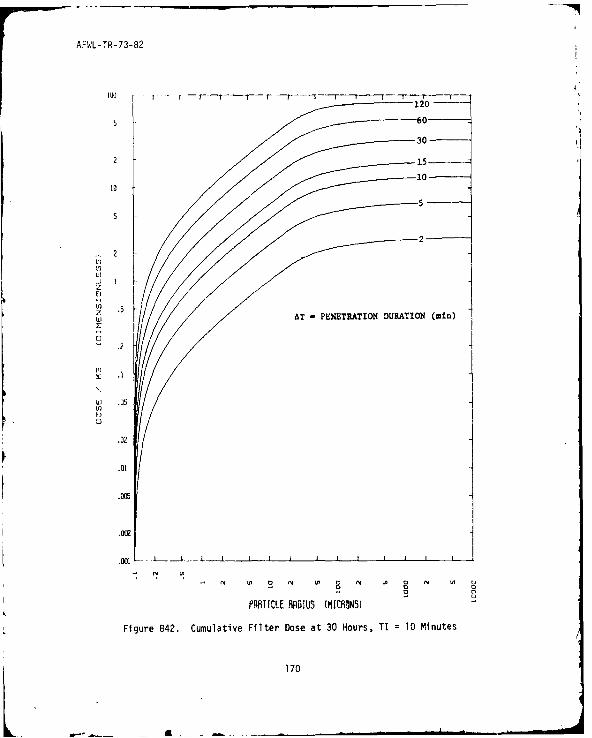
AFWL-TR-73-82
lull - r r- --r - r -- ---- r---r------- -r---T120 -
25 ---------30
S2 15
u10
SID
AT PENETRATION DURATION (min)
Uj .05
.02
~J .0m.01
p.~l
, .-:.l C C F) Cd.A 0 d ,wO 0 N
PRRITICLE RRDIUS (MICRONS)
Figure B42. Cumulative Filter Dose at 30 Hours, TI = 10 Minutes
170
'
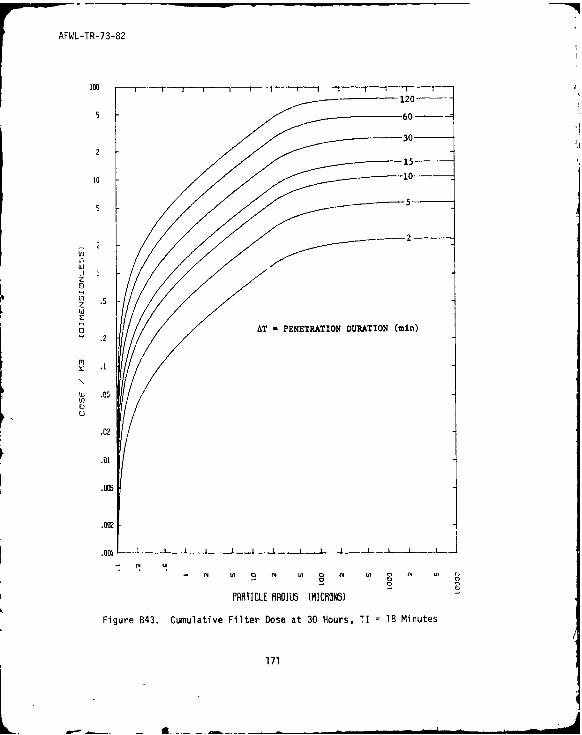
AFWL-TR-73-82
Ion
120
-J5
IdJ
0 AT =PENETRATION DURATION (=in)
wI .05
E)
.02
.01
-. 0
PARTICLE RAD IULS (MICRONS)
Figure B43. Cumulative Filter Dose at 30 Hours, TI =18 Minutes
171
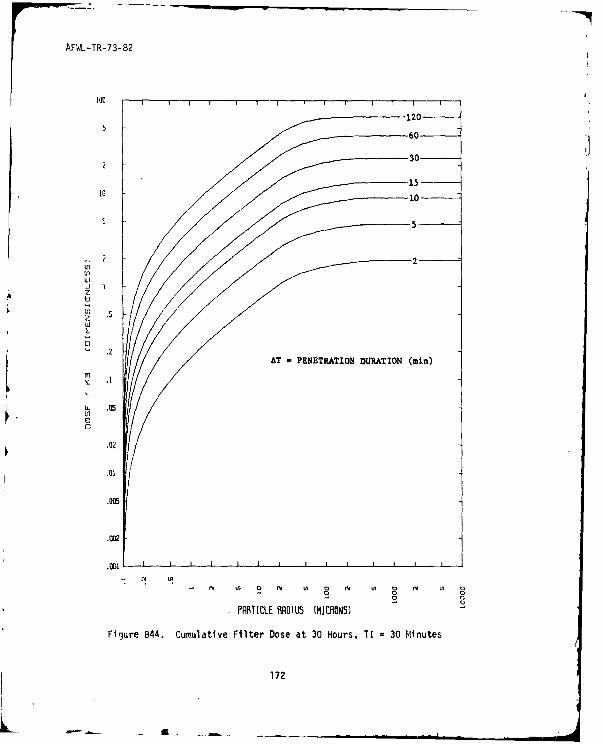
AFWL-TR-73-82
100 I I I I I I r I I
1120--s f 60 -
U30
.I |
-15-
z
I10
w5
In
AT , PENETRATION DURATION (min)
Uj .05W0
.02
.001
PARTICLE RR0IU (MICRONS)
Figure B44. Cumulative Filter Dose at 30 Hours, TI =30 Minutes
172-. . . . . . .... . . .0 IA • ,, tO
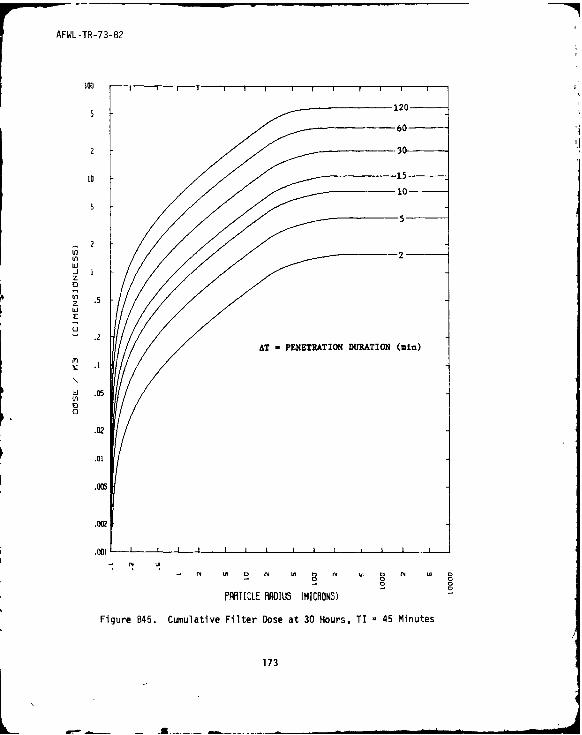
AFWL -TR-73-82
100 I
2 - 30____
10
V)vi
z
.2AT PENETRATION DURlATION (mini)
Uj .05
.02
.005
N wN t U, N W .C i C I
PARTICLE RAODIUS [MICROlNS)
Figure B45. Cumulative Filter Dose at 30 Hours, TI 45 Minutes
173

AFWL-TR-73-82
100 I i i
5- f 120 --
/ 60 -
2 30
10-
5
2
to
z
V)zUj
.AT - PENETRATION DURATION (min)
toE)
.02
.01
.005
Q[
.0o
• IN --- C IN In C IN I~ Cl I i n CJ
PAHTICLE FlDIUS (MICRONS)
Figure B46. Cumulative Filter !'se at 30 Hours, TI I Hour
174

AFWL-TR-73-82
-- 610--22
-- 60
10
15--2
zw
V)'- .&T = PENETRATION DURATION (mmn)
E)
S05
.02
.0!
.005
-. . ~ , 0~ ~t ~ U0ALt r ( 0 t 0
FRTICLE RROIUS (MICRONS)
Figure B47. Cumulative Filter Dose at 30 Hours, TT = 1.5 Hours
175
AFWL-TR-73-82
0 I30 -.
1005/
2 5
LIW/
Uj 2Liz
C .5z
.2
.05 AT ,'PENETRATION DURATION (rmin)
LO
0
.01
.00
Li
PARTICLE RADIUS LMICRONS)
Figure B48. Cumulative Filter Dose at 30 Hokirs, TI 2 Hours
176

AFWL-TR-73-82
512
2
I60
51
2
-5-
~j.5z
- .2
AT -PENETRATION DURATION (min)
" .02
.02
.00o
PRRTICLE RADIUS (MICRONS)
Figure B49. Cumuldtive Filter Dose at 30 Hours, TI 3 Hours
177
AFWL-TR-73-82
20 i --- -
1- 60 . .
rn h ----- 0--
3 0----
15
10"-
In
z .2t '
.a5 AT - PENETRATION DURATION (min)
CI .02
PAML H11IUS thIrMONS)
Figua e B50. Cumulative Filter Dje at 30 Hours, TI 5 Hours
178
AFWL-TR-73-82
AT P ENETMATION DURATION (=in)
70L-J 60
1C
Ln ~U
TIME (HOUBS AFTE9 DETONATION)
Figure '.51. Filter Dose as a Function of Time, TI 10 Minutes
179
AFWL-TR-73-82
7 AT PENETRAJION DURATION (min)
75J I / 2 -j" °
0 55-
so
z 6
0
in
I-3r 25L '_
20[
5s 15
TIME tHUS AFTE.R DfETON]N
Figure B52. Filter Dose as a Function of Time, TI =18 Minutes
L 180

AFWL-TR-73-82
65 - AT -PENETPAT70N? DU1PATION (min)12 4!
604
55
V) 144
In
W35
30
2$-
LO 3
20
15
101
--------------
TIM _____ - 'E___________
Figure B53. Filter Dose as a Function of Time, TI 30 Minutes
181
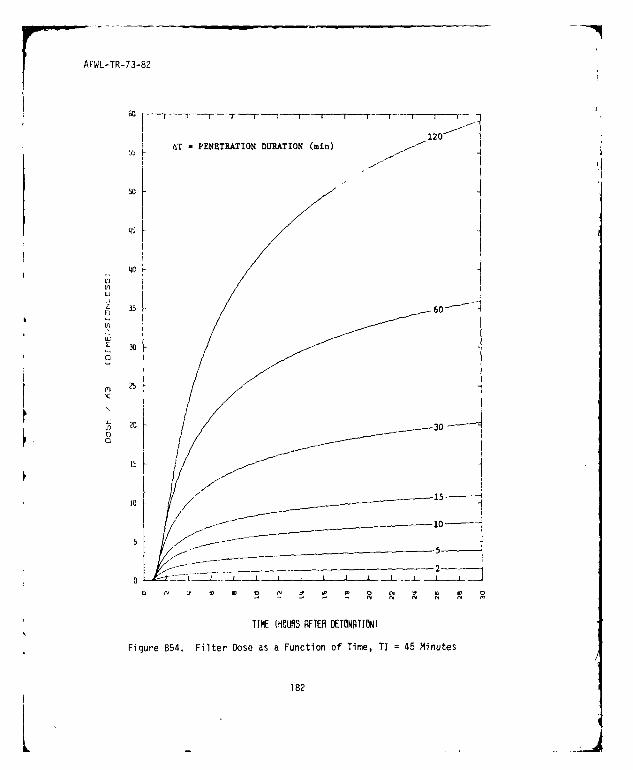
AFWL-TR-73-82
I -- r-T T-v r-r-
AT PENETRATION DURATION (min) 120
5
40
~5 5
~~225
1820

AFWL-TR-73-82
50 AT PENETRATION DUaATION (min) 120
'10
z
206
10-
155
1813
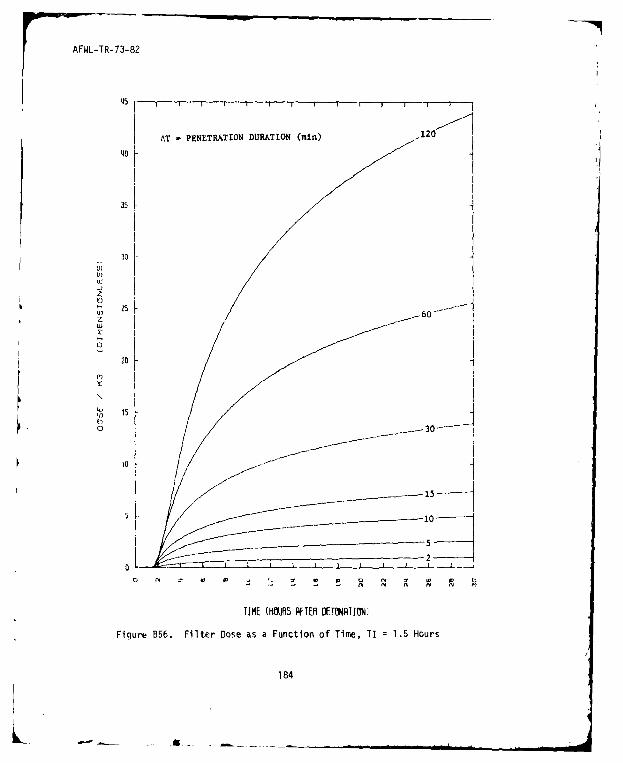
AFWL-TR-73-82
5 I - I " I' J J I i I I
AT * PENETRTION DUUlATION (min)120
40
V)
z 65
Ui
155
180
TIME U1- P ,FTER H T DNRTIONI
Figure B56. Filter Dose as a Function of Time, TI 1.5 Hours
184

AFWL-TR-73-82
40120
AT PENETRATION DURATION (min)12
32.5
25-
w 622.
0
17.5
a 12.500
7.50
10
18
L0-
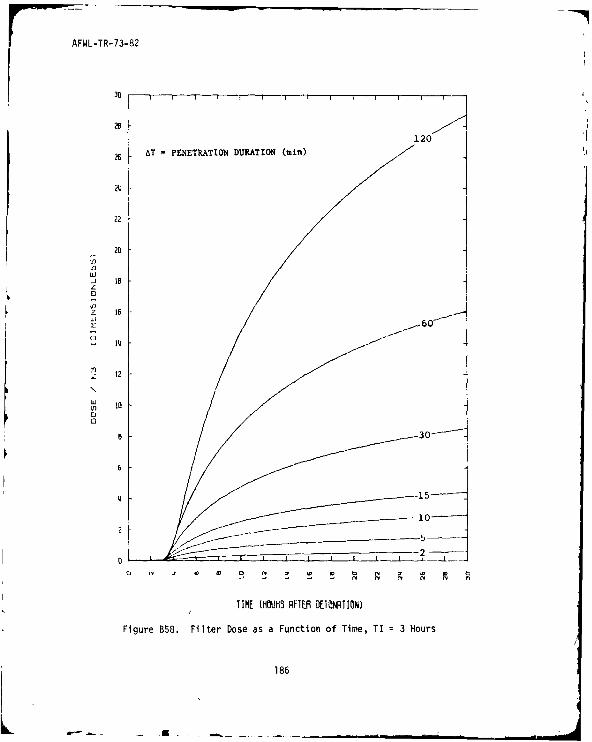
7 'p AL WL-T-73-82
26 ~T PENETATON DURATION(mn
22
20
LIIU]
z
LI
12
V) 10
6
TIME (HOUBS AFTER DETOlNATION)
Figure B58. Filter Dose as a Function of Time, TI =3 Hours
186
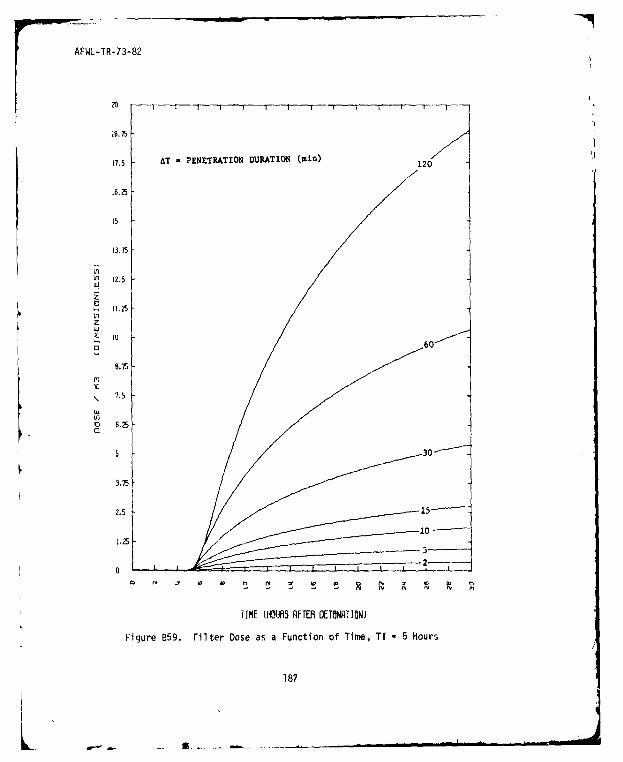
AFWL-TR-73-82
2B,5 "- l I ' f I " I ' a' i " 1 0 1 '
17,5 AT - PENETRATION DURATION (min) 2
16.25
U[ 2.51
z
1.25V)zLU
I6
22
11 7.5
'U
Cl 5.250
2.5
1.25 -10
0j
TIME (HOIJRS RFTEH OETONRIOUN)
Figure B59. Filter Dose as a Function of Time, TI = 5 Hours
187
Kt ..

AFWL-TR-73-82
7-
V -738
W
z!
U'
0
TIME (I1OUHS AFTER OETONRTION)
Figure B60. Cl-hud Immersion Dose Rate
188
L?
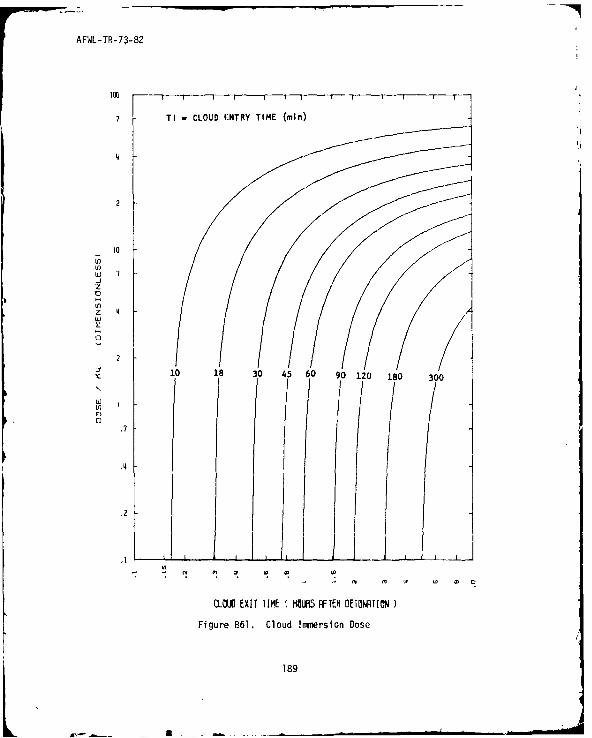
AFWL-TR-73-82
TI =CLOUD ENTRY TIME (min)
2
to
U)LOLUj 7
z
10 18 30 45 60 90 120 180 300
U]
118
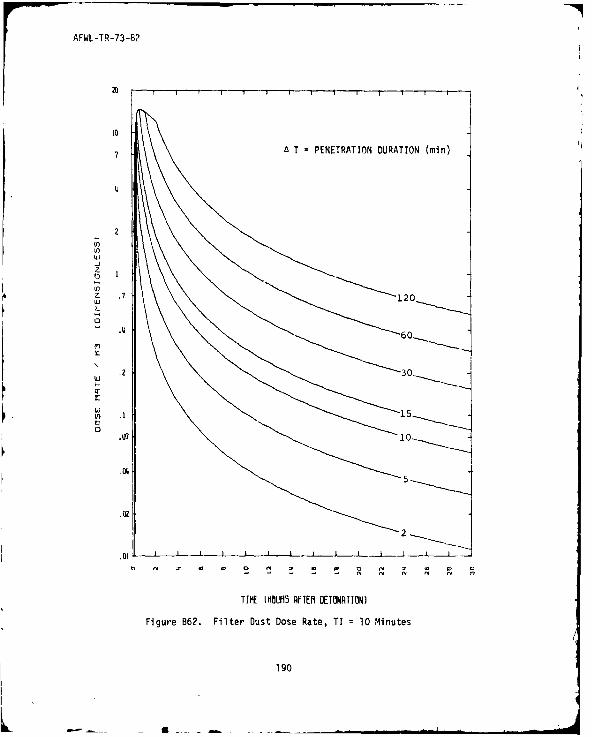
AFWL-TR-73-82
10
7 T PENETRATION DURATION (min)
2\
In
z
z .7 "1 20
60-_
.2 30-tj
cr
V) i
0
A 5
2
I IIt
TIME tHOL'M5 RETEM DETONATION)
Figure B62. Filter Dust Dose Rate, TI =10 Minutes
190
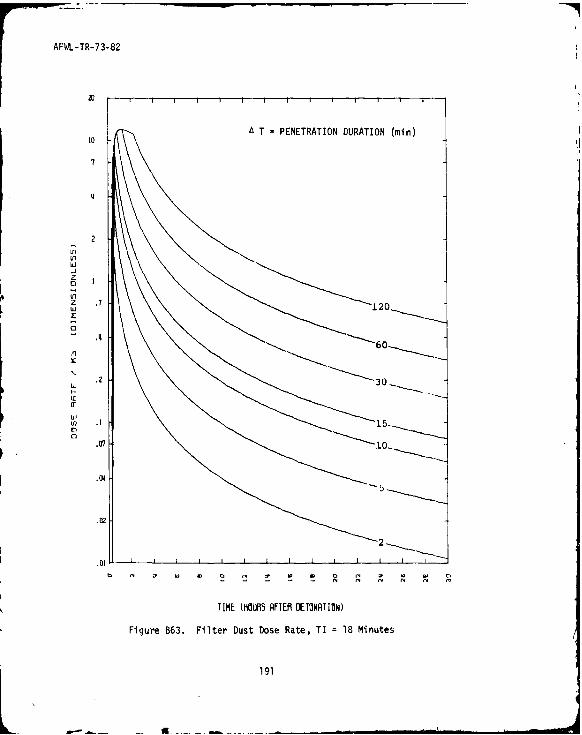
AFWL-TR-73-82
. T = PENETRATION DURATION (min)to
7
2
Liz
Z .7 120
0
L .2 30ir
( rr 1 15
TIME (iOURI3 AFTER DETONATION)
Figure B63. Filter Dust Dose Rate, TI =18 Minutes
191
0L
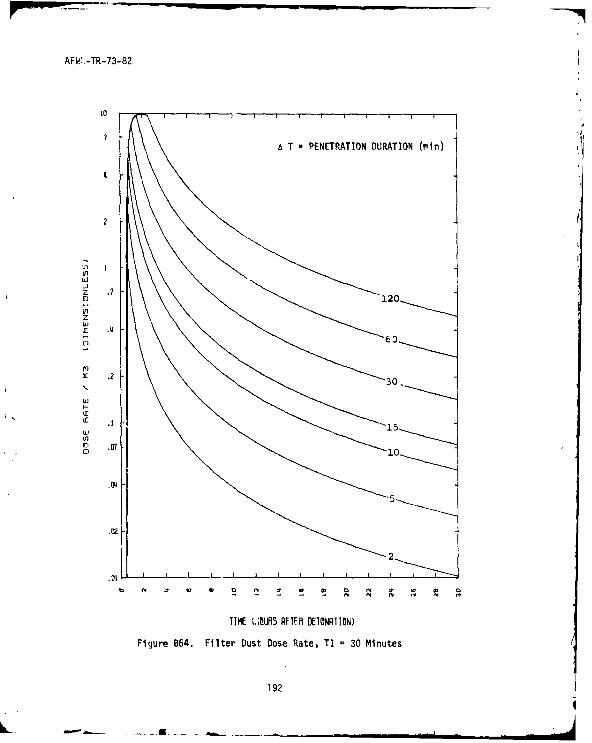
AFW:-TR-73-82
2 ~ T -PENETRATION DURATION (min)
2
F 120
.2 30,
w0 .9710
2
.01I L I
TIME %JOURS AFTER DETONATION)
Figure B64. Filter Dust Dose Rate, TI = 30 Minutes
192

AFWL-TR-73-82
e T - PENETRATION DURATION (min)
2\
-1z
z ~ 120
z
.230
I-
Uj 15.
0 An C ' S p 0 t
.02l -
TIME U1OUfR5 RFIER DETONRTON)
Figure 65. Filter Dust Dose Rate, TI = 45 Minutes
19~3
LgL -.a
AFWL-TR-73-82
7onl l ,
2 ~T *PENETRATION DURATION (min)
2
p .7
* zPhi
A
00
S .2
K I 30
- I p I
lIHE (119UR5 AFTEM DTONA1ICN)
Figure B66. Filter Dust Dose Rate, TI 1 Hour
194
AFWL-TR-73-82
ST P ~ENETRATION DURATION (min,)
U, 120U, .
-j
z .460
.2 30
15
U) 10
.02 2
TIME (IIUIS AFTER DTONAIO~N)
Figure B67. Filter Dust Dose Rate, TI = 1.5 Hours
195
AFWL-TR-73-82
A T - PENETRATION DURATION (min)
2
O .7 1201i
z
WzU) 60
.2 30
cl 5
Pa15
.02U
2
TIME MUlauS AFTER [ETONATION)
Figure B68. Filter Dust Dose Rate, TI m 2 Hours
-~ 196

AFWL-TR-73-82
A T PENETRATION DURATION (min)
2-
•7- 120
.to 60
zI
S .2 ~3
17 15
103
5
2
TIME (HOURS FfTFJ OElIUNAlION)
Figure B69. Filter Dust Dose Rate, TI = 3 Hours
197

AFWL-TR-73-82
A T = PENETRATION DURATION (min)
.6 F120.11
In
iu .2 --1 60z
.In
z
2
A
~ .15
.62
TIME {MOUR5 AFTER DETONATION)
Figure 870. Filter Dust Dose Rate, TI = 5 Hours
198
AFWL-TR-73-82
T TIME AFTER 'WEAPON DETONATION (min)
30--
560 z- *- -- 90-
. . 10 -
-300-
rU .13 ______-
u 2
r'- 2
5- -
ARBTICLE SIZE (MICRONS)
Figure B71. Specific Activity Distribution Function
199
ALi

AFWL-TR-73-82
APPENDIX C
ZERO FALLOUT MODEL
This appendix presents an investigation of the limiting case of a cloud
with no fallout. This case is useful because it yields results which are a
worst case and which act as a standard of comparison for other cloud models
which include fallout. It serves as a check on results of other models to
ensure that the general trends and qualitative results are reasonable and
realistic.
This limiting case is achieved by "freezing" the 10-minute dust density
distribution presented in appendix A, equation (A-l), for all time, i.e., no
later fallout is allowed.
Pd(t) = ai [t - 16 + 1.313 t " .3] (C-1)
= ai 1(0.167)' + 1.313 (o.167) " ' ] (C-2)
= 19.83 a, (C-3)
The same approach used in appendix A yields the relationships below. Note
that the only time dependence allowed is that associated with the radioactive
decay of the fission products.
de/f = 19.83 ti £ t S tf (C-4)
K1/2
e/f = 19.83 (t - ti) ti £t S.tf (C-5)K1 /2
200
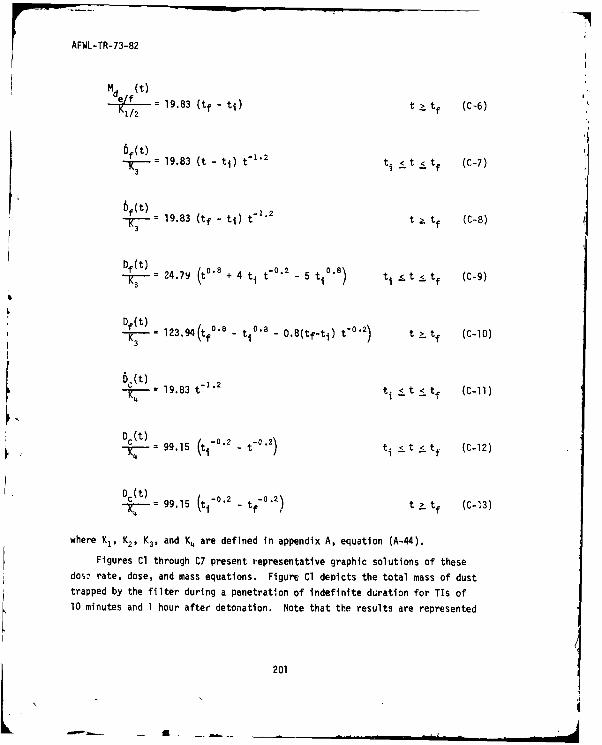
AFWL-TR-73-82
d 19.83 (tf - ti) t > tf (C-6)"1/2
Dr (t)= 19.83 (t - ti) t" 2
t i <t <tf (C-7)
Df~t) t z .= 19.83 (tf -t) t 2
t t f (C-8)
73Df~t) \I o B t -.
= 24.7 ( + 4 t0t)- 5 tl 0 ") t1 _ t _ tf (C-9)
DT- 123.94(tfO' - ti0 "a - 0.8(tf-ti ) t02) t __tf CC-iO)
De(t) t-3 .2-19.83t tj <<tf (C-li)
OCt)
4
-it) -- 99.1 t " " - t " 0 "2 ') t <_ t t (C-13)
74c 15 tt)
where K1, K2, K3, and K4 are defined in appendix A. equation (A-44).
Figures Cl through C7 present representative graphic solutions of these
dos" rate, dose, and mass equations. Figure Cl depicts the total mass of dust
trapped by the filter during a penetration of indefinite duration for TIs of10 minutes and 1 hour after detonation. Note that the results are represented
201
L. -I.. ....
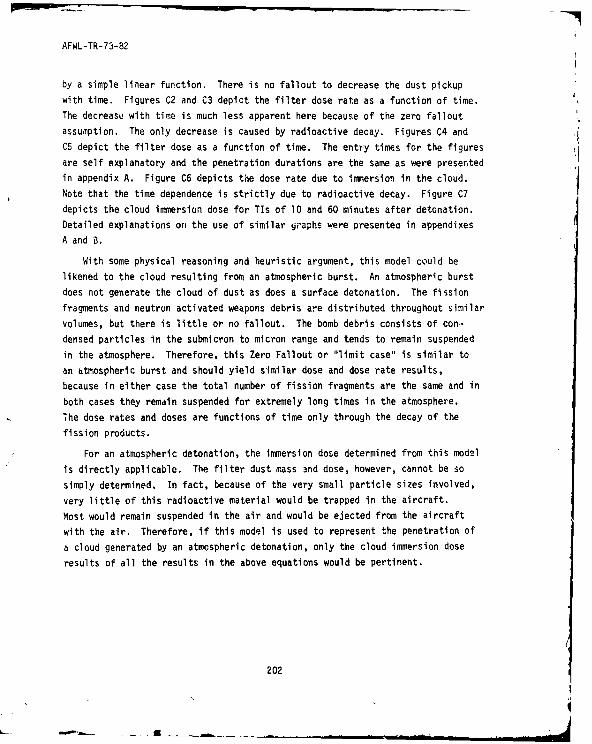
AFWL-TR-73-82
by a simple linear function. There is no fallout to decrease the dust pickup
with time. Figures C2 and C3 depict the filter dose rate as a function of time.
The decrease with time is much less apparent here because of the zero fallout
assumption. The only decrease is caused by radioactive decay. Figures C4 and
C5 depict the filter dose as a function of time. The entry times for the figures
are self explanatory and the penetration durations are the same as were presented
in appendix A. Figure C6 depicts the dose rate due to immersion in the cloud.
Note that the time dependence is strictly due to radioactive decay. Figure C7
depicts the cloud immersion dose for TIs of 10 and 60 minutes after detonation.
Detailed explanations on the use of similar graphs were presented in appendixes
A and B.
With some physical reasoning and heuristic argument, this model could be
likened to the cloud resulting from an atmospheric burst. An atmospheric burst
does not generate the cloud of dust as does a surface detonation. The fission
fragments and neutron activated weapons debris are distributed throughout similar
volumes, but there is little or no fallout. The bomb debris consists of con-
densed particles in the submicron to micron range and tends to remain suspended
in the atmosphere. Therefore, this Zero Fallout or "limit case" is similar to
an atmospheric burst and should yield similar dose and dose rate results,
because in either case the total number of fission fragments are the same and in
both cases they remain suspended for extremely long times in the atmosphere.
The dose rates and doses are functions of time only through the decay of the
fission products.
For an atmospheric detonation, the immersion dose determined from this model
is directly applicable. The filter dust mass and dose, however, cannot be so
simply determined. In fact, because of the very small particle sizes involved,
very little of this radioactive material would be trapped in the aircraft.
Most would remain suspended in the air and would be ejected from the aircraft
with the air. Therefore, if this model is used to represent the penetration of
a cloud generated by an atmospheric detonation, only the cloud immersion dose
results of all the results in the above equations would be pertinent.
202
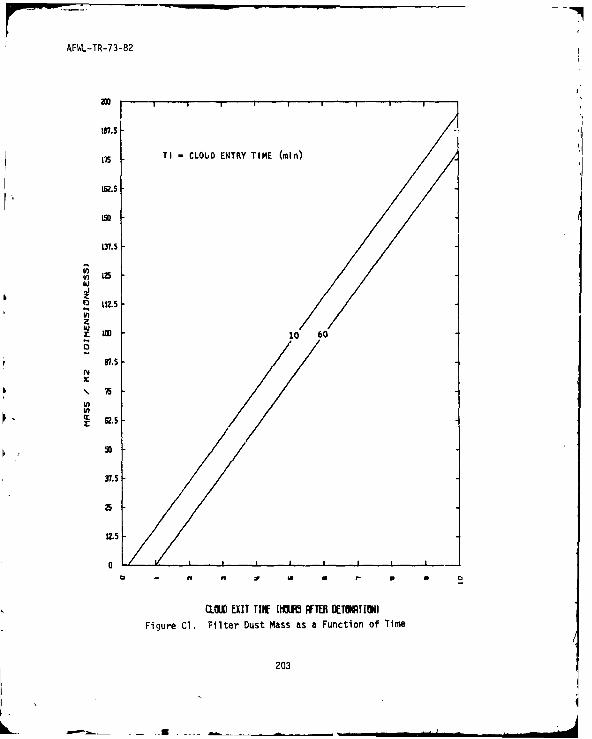
AFWL-TR-73-82
IV7.5
TI - CLOUD ENTRY TIME (min)
L 5
13.5
InO
Ul I
112.5inz
w 1jo 60
00
".5N
5*.
InW
I6.-
37.5
25
0 ~ ~4 v' I D
OCJO EXIT TIP IM FIFi TER BETUiTION)Figure Cl. Filter Dust Mass as a Function of Time
203
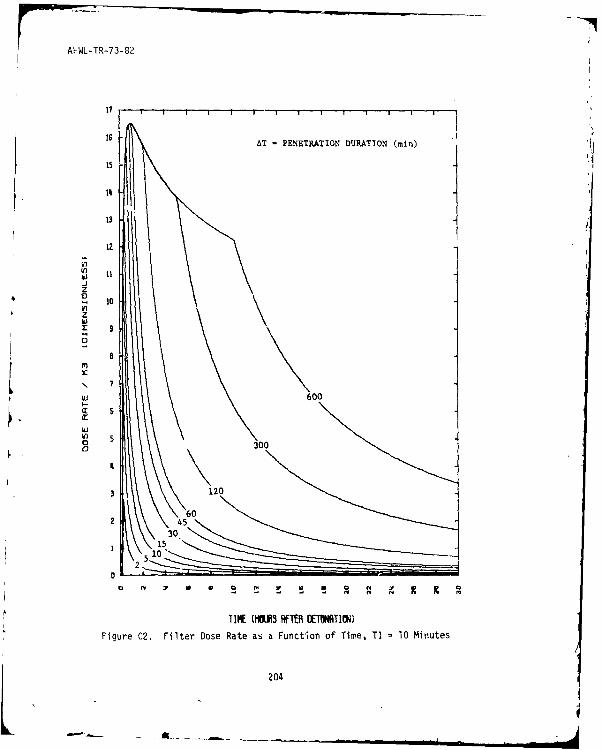
AWL-TR-73-82
17
ISAT =PENETRATION DURATION (min)
15
13
12
V)
z
2 600
Ln 5z
600
W 55
30.
1 15510
204
a * a I * U C f

AFWJL-TR-73-82
L2
11AT -PENETRATION DURATION (min)
10
9
-jz- 7
zbux
CE
4-5
03
2
TIME OW~i AFTER DETNITIM)
Figure C . Filter Dose Rate as a Function of Time, TI =1 Hour
205
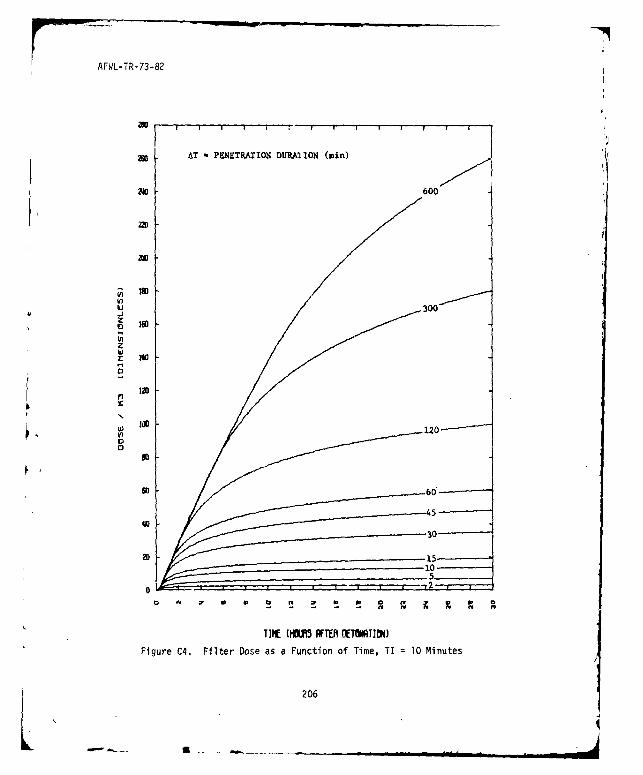
AFWL-TR-73-82
AT *PENETRATION DURATION (min)
600
I W
12
03
1110
202
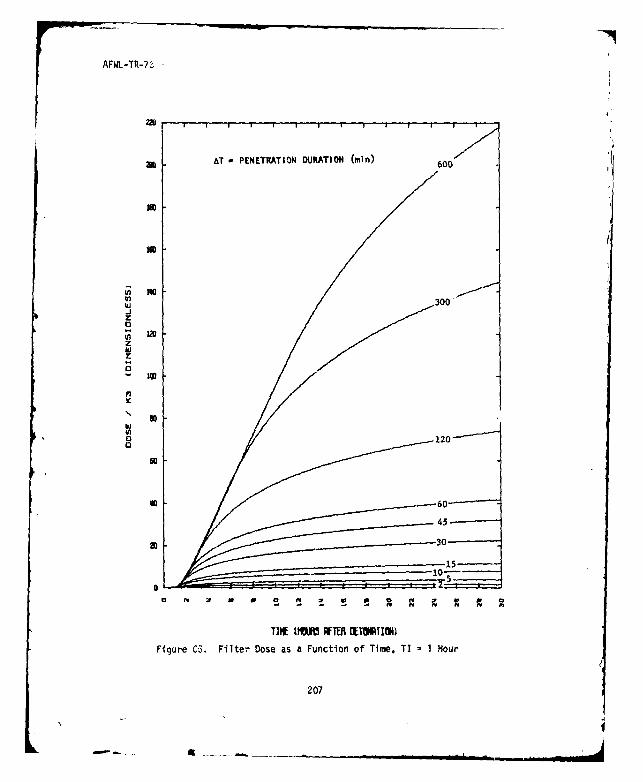
7AFWL-TR-'..
AT PENETRATION DURATION (min) 600
IOD
300Jz
z
w
IIm
S
w 4
20
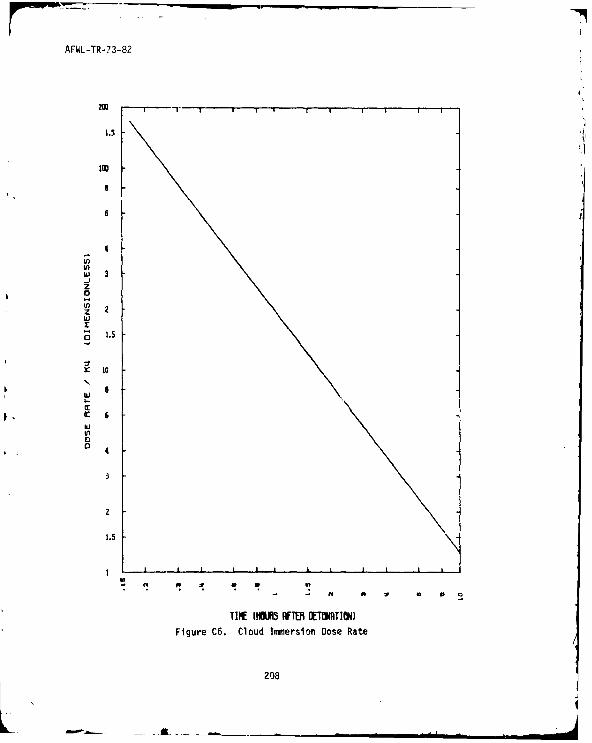
AFWL-TR-73-82
1.5
w 3,IJz
o
w 5
r 6
E)wI-
TIME (MOM~L AFTER DETONAIN)Figure C6. Cloud Immersion Dose Rate
208
2.5t, I I, Im

AFWL-TR-73-82
10D1 1 1 1 1
7 TI =CLOUD ENTRY TIME (min)
2
0) 7
z
z 10
2
.1
.7
00J3 EXIT TIK (RI~ AFTEJI DEU TIONIFigure C7. Cloud Imrsion Dose
209
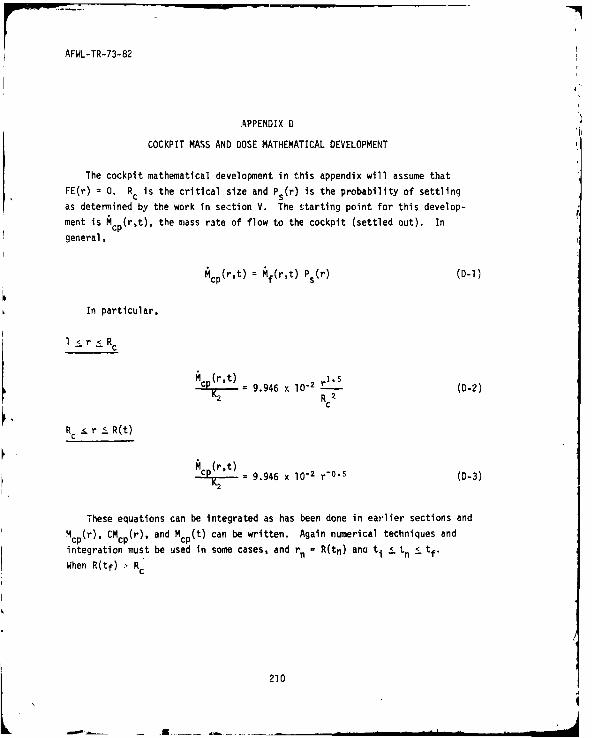
AFWL-TR-73-82
APPENDIX D
COCKPIT MASS AND DOSE MATHEMATICAL DEVELOPMENT
The cockpit mathematical development in this appendix will assume that
FE(r) = 0. Rc is the critical size and P s(r) is the probability of settling
as determined by the work in section V. The starting point for this develop-
ment is Mcp(r,t), the mass rate of flow to the cockpit (settled out). In
general,
Acp (rt) Mf(r,t) Ps(r) (D-l)
In particular,
l. r i Rc
M (r,t) r'.5- = 9.946 x 10⁻² r (D-2)
2 Rc2
R r i R(t)
-- 2 = 9.946 x lO2 r"0 -5 (D-3)
These equations can be integrated as has been done in earlier sections and
M cp(r), CMcp(r), and M cp(t) can be written. Again numerical techniques and
integration must be used in some cases, and rn = R(tn) anu ti < tn <tf
When R(tf) Rc
210
X.4 10 2 r' 5 (tf _ ti)1 r R
=9.946 X12 1 t 1 < r < R tf
M () 9.946 x 10² r- . ( - ti) 1 C r s R(tf)
M~()=9.946 x 10⁻² r -1- (tn -i ~f .-&~ D4
If flf <, R thten ths eqatos ecm
9.946 x -0 (tn - ti) 1c rn sR(tf) (05
M (r) 9 .97 x 10 2 1 1. (t- t - 1)t (:L6)
C
IR r < Retf
C 2(r = 0.1989 (tf - ti)(o. - RC + cM2(c (D-7)
K 211

AFWL-TR-73-82
R(tf) rn R(ti)
CMC- (r) CMcp(R(tf)) +rnK2 = M 2R t + 9.946 x i 0-2 -0 5 (t j A 0 8K2 E rn "(tn "ti) Ar (D-8)
R(tf)
For R(tf) <Rc, these become
1 . r . R(tf)
CM~ ~ -2(tf -ti)2
3.978 x 10 2 (r 2.5 (0-9)
2 Rc2
R(tf)
M
rn : Rc
CMcI 2(r) 9.946 x 10² n CMr A (RAtf))RK2 - r nf
"1 (t n - i)-O)
2 R(tf) - K2
R c r n :S R(ti)
rnC =t+ 9.946 xCM0"2(R-) rn'°' (tri - tir (D-11)
The time function relations also yield two sets of equations. For R(t) > Rc
(t) - tl)(0.1989 R(t) ' - 3.978 10-2 R 0.1591 0.5)
= (t - i R- x
+ 9.946 x 10"2 r 0" (t n - ti) Ar (D-12)R t) n
When R(t) < RC
212
AFWL-TR-73-82
M M(t) 3.97x RO 2 (t tj) (R(t 2"5- )
22
+ 9.946 x 10 [ROc- rn'5 (t, - t i ) ArLC (t)
R(ti) 1+ E rn-°0. (tn - ti) A (D-13)
The cockpit mass equations are plotted in figures Dl through D19.
The development of the dose equations follows a similar technique, except in
these equations there are two breakpoints, Rc and 20p, which R(t) must be allowed
to progress through. In addition, provision is made for Rc to be less than,
greater than, or equal to 20u. The basic development stems from the filter oase
rates of appendix B multiplied by the cockpit efficiency function of section V,
i.e.,
Dcp (r,t) = bf(r,t) Ps(r) (D-14)
The conditions noted above lead to the necessity of writing a set of equations
for each set of conditions in each of the Dcp (r), CDcp(r), and the Dcp(t)
functions. These will be stated below with little explanation other than the
conditions to which the equations apply. Again rn = R(tn), where t, j tn : tf,
as before.
The cockpit dose as a function of r will be stated first. For convenience,
ST(t)- (ti - t). When RcZ 20 ,
213
I { .. . ..
AFWL-TR-73-82
20 <_ R -R(tf)
17.645 r .5 T(tf) 1 < r < 20
352.9 rO.S T(tf) 20 S. r <_. R c
0 y (r) R2
K3 35'. -15T ) R c <_. r <i R(tf)K3 352.9 r
" " 5 T(tf)-
352.9 rn- 1.5 T(tn) R(tf) :_rn :--R(ti) (D-15)
20 P R(tf) :S. R c
17.645 r 1.5 T(tf) I :S. r < 20
352.59 r0.5 T(tf) 20 :_. r :_. R(tf)
Dc (r) c352.9 osT(t ) R(tf) < r, <R
352.9 rn " j " T(tn) Rc : rn - - R (ti) (D-16)
R(tf) <20v Rc
17 . 6 4 5 r1.5 T(tf) 1 £_ r <. R(tf)
Rc2
17.645 r1 .5 T(tn) R(tf) < rn < 20
D (r) R2
3 352.9 rn0.5 T(tn ) 20 <_ r n <_. RcR c2
352.9 rn"1.5 T(tn) Rc_ r < R(ti) (D-17)
214
AFWL-TR-73-82
If Rc< 201j, the following set is generated.
Rc<20 <R~tf)
17.645 r1 T~tf) I1 <R
D r 17.645 r0 5 T~tf) Rs r :S.20
A 3 352.9 r- 15 T(tf) 20 < r < R(tf)
352.9 rn' . T(tn) R~tf) , n R(tj) (0-18)
R< R(tf) < 20
[1.4 . T~tf) I1 r R
IR c2 -c
(r) 117.645 r0 T(tf) RcIr !. R(tf)
17.645 r n-0. T(tn) R(tf) :j r n :. 20
35,2.9 r n-. T(tn) 20 : rn :L R (ti (D-19)
R(tf) < Rc<20
R c2
1764 T(tn) R(tf) :s.rn 5. R
c(r) R2c
3 ~ -176 5rn05T(tn) R < rn .20
352.9 r n-15 T(tn) 20 <5 r n (s R(t) (D-20)
215

AFWL-TR-73-82
To completely define le cumulative dose function the foregoing equations
must be integrated over r resulting in several conditional sets of equationsas before. When Rc . 20,
20 i Rc s R(tf)
CD______ = 7-058 .T(tf) (r2 " - 1) 1 _L r <.20 (D-21)K3 Rc2
CD 2z(r) =CDc 1(20) 235 27 ~ 843 0< <R (-2
K3 3 Rc ~ , -r-
CDCp 3( r) =CDcn(R,) (Rc0.5 -0-5)\ c r Rt)(-3K3 + 705.8 T(tf) R C Rc r.r~ t)(-3
CD 4(r) CDc (Rt) + 352.9 n r15Tt)&T3 n~ R~f Trtn R t (-4
20 . R(tf) R c
CDC 1(r) = 058-~.-.-- ~~ T(,f) (r' -1 l < 20 (0-25)
3 Rc
CDp .(-r) CD 1~(20) +252
KD, 3 I T~tf) (r' 5 -89.443) 20 5 r < R(tl:) (D-26)
CD () CDcp 2(R(tf)) r
3K 3 Rc2 R~tf) R(tf) <. r n < RC (D-27)
CD (r) CD (RC) rn 1.C * = CJ3 + 352.9 Fr Ttn cr R- <n i R(ti)(D-28)
3 3 Rc n t)r r
216
AFWL-TR-73-82
R(tf) .20 Rc
CD 1(r) 7" 58 T(tf) (r2 "
- 1) 1 .r s. R(tf) (D-29)-- 3 =
R C
CDc 2(r)- CDcp (R(tf)) + , rn T(tn)A r
K3 K3 R 2 R tf) R(tf) < rn < 20 (D-30)
CD Ir) CD O(20) 352.9 0 rnO. T(tn)tr 20 : r) (K'3- K3 + R c2 20 n
c (-1
r
CDp(r) K cp + 352.9 C r n" T(t)Ar Rc rn <R(ti)(D-32)
m K3 = 3 Rc C
The last set of equations results when Rc < 20.
R <20 R(tf)
CD o(r) = 72 58 Ttf) (r2" - ) r Rc (D-33)
K3 Rc2
CDc-2 (r) CDCP(Rc) 0(.5_r-34)
K3 K P 35.29 T~f -r c Rr 52 (D-4C0c 3(r) C _3(20)
3 () + 705.8 T(tf) (0.2236 - r" ' ) 20 :sr 5.R(tf; (D-35)K3 K3
_____ cCcp 3 (R(tf)) r
K3 = K3 n + 352.9 -1.5 T(tn)ArR(tf) R(tf) 5. rn :. R(ti)(D-36)
217

AFWL-TR-73-82
Rc R(tf) <_.20
K3 R 2 T(tf) (r 2 5- 1) 1 .r * R (D-37)
C
CDc I(Rc)+ 35.29 T(t4) (rO .5 .Rco05) Rc IrL R(tf) (D-38)3 3
r
CD (r) CDc2 (R(tf)) n _ . tS a"3 = F- + 17.645 E .s-T~nA
7.6 r t R(tf) < rn < 20 (D-39)
COc_ (r) C0c^ 3 (20)---4 ,(r =
CD cy ( 0 352.9 r n- 1 .5 T(tn) r 20 i_ rn <_ R(ti)(D-40)
3 K3 20 t
R(tf) <R c <20
CDc z(r )
7.058 T(tf) (r2 ". 1) 1 < r < R(tf) (D-41)
RK2
K3 R_ ~f ~ ) rn Rc ( -2rnCDc 2(r) CDc 1 (R(tf)) + .5 T(tn)A r
= K3 ' R+ R(tf) r n
CK C0 (c 7.645 E ~ nA Rn c rn 2 -3R"'3 c
rn" ' CDc C 4(r ) C C 3 ( 2 ) n - 1 5
K C 320 352.9 E T(tn)Ar 20 <r n R ti)(D-44)
To complete the cockpit dose development, the dose as a function of time
must be determined. This development again results in sets of conditional
equations with some numerical integration. For convenience, let TT(t) =
0.25 to.8 - 1.25 ti
0 8 + ti t
"0.2 . For ti 5_t <_tf,
218
AFWL-TR-73-82
20 <. Rc < R(t)
DC )= (4201.535 R- 2 + 799.907 R - 705.8 R(t) - ' ) TT(t)K3 Rc c'°
R(ti)
+ 352.9 (ti 0.2 - t - ° '2) E t rn- 1 " (tn " ti)r (D-45)
R(t)
20 < R(t) i Rc
D 2(t) -2 (4201.535 + 94.107 R(t)') TT(t)SRC +
c )+ 352.9 (t70
2 - t- 2
j[R2 t) 0 n to
R(ti)
+ E r-1 .5 (tn - ti)A (D-46)
R(t) <j 20 <._Rc
Dc 3(t) "7.058 RC2 (R(t) . - ) TT(t)
3
+ (ti. 2 - t-o. 2 ) 7.645 R- 2 E r . (n- i, rR t)
Rc
+ 352.9 Rc 2C 2 rn" ' (tn - ti)Ar20
R(ti)
+ 352.9 E n 1.5 (tn ti)A (D-47)Rc r
For the region where t > tf,
219
AFWL-TR-73-82
20 < Rc <R(tf)
Dp(t) 0.2 t .2) 4 + 799.907 R .-- (t f" t 201.535 R c 2Rc-
K3
-705.8 R(tf)-" °' )
(tf - ti) + 352.9 Rk tf) r n '
5" (t n
- ti)Ar
+ D t f.) (D-48)
3
20 <R(tf) <R c
D3 . (t ° ' -0 t
2) (4201.535 + 94.107 R(tf) 1)(Rc-2) (tf t,)
/ Rc R(ti)+ 352.91R- r 0.5 (tn - ti)Ar + E rn' 51" (tn - ti)A
\c R(tf) R
+Dc2(tf) (D-49)K
3
R(tf) .20 jR
D p t 0.2
_ - 0.2) v7.058 R C-2 (R ttf2. _ 1) (tf _ t,)
20 Rc
+ 17.645 Rc )2 rn " (tn - ti)&r + 352.9 Rc 20 rn.5R(t ) rn 20tf
+ 352.9 E rn1 (tn - ti)A + K3 (D-50)Rc
Finally, when Rc < 20, and ti ! t :_tf.
220
AFWL-TR-7 -82
Rc < 20 < R(t)
D (t) -14-(t Rc ' " 705.8 R(t)-" ' ) TT(t)
= (315.634- 28.232 - 7.058 Rc - R_3
R(ti)
+ 352.9 (ti -0.2 - t02) FIj rn' '. (tn- ti)Ar (D-51)
1 R(t) ~R <R(t) ;j_20
=D5(t) (35.29 R(t)0'5 - 7.058 Rc
2 - 28.232 R 0'5) TT(t)
+ (ti"° 2
- t" 1 7.645 Etrn"O' (tn-- ti)Ar
IRRtt)R(ti )
+ 352.9 E rn-1. 5 (tn - ti)a (0-52)20
R(t) <R c :20
D (t) - (R(t)2 . 5 _ ) TT (t)
7.058 R c 2
3
+ (; 2-t-2) 17.65 R ,~ t
+ 17.645 rn 0 5 s tn .- iARcR(ti) 1+ 1759 n-tiA
+ 352.9 rn (tn - ti)Ar (D-53)
When t > tf,
221
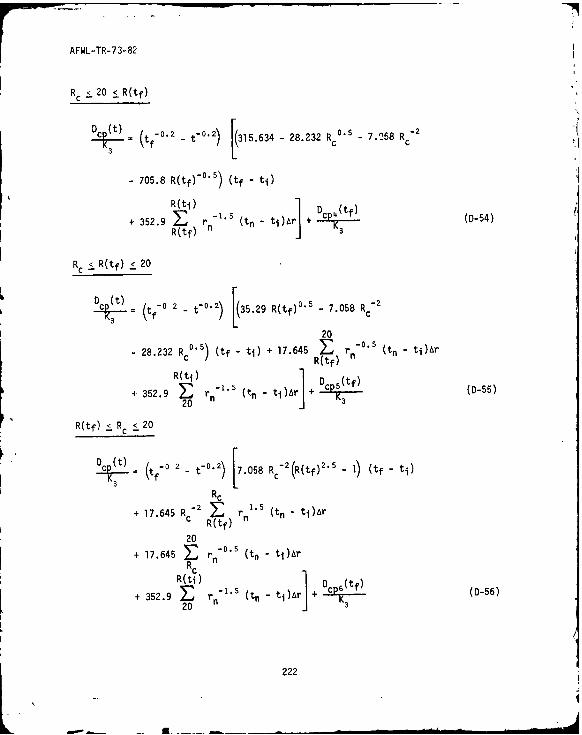
AFWL-TR-73-82
Rc <20 <R(tf)
oc (t) I * '8R
----- = (tf0.2 - t"0.2) [(315.634 -28.232 RcO's 7.058 R "2
- 705.8 R(tf)f" '
) (tf - ti)
+ 352.9 E rn 5 (t" t5 )l + Dc (D-54)
R(tf) n " t K3
Rc R(tf) _ 20
D(t) 2) 5-
= (tf 0 2 t 0.2) 35.29 R(tf) ' - 7.058 Rc
2028.232 Rc
0.5) (tf- ti ) + 17.645 E rn0 5 (t n -t)Ar
R(tf) n'R(tj) 1 c(tf)
4 352.9 E r n' (tn - ti)Ar + K (D-55)20J
R(tf) L < 20
c (t t 2_- 0
12)
[7.058 Rc2(R(tf)2. -l) (tf-t iK3 t .
Rc-2 R t)rl t ia
+ 17.645 Rc CtE) rn 1.5 (tn -
20
+ 17.645 F r n" 5 (tn -ti)Ar
R(ti) 1 D0cp(tf)
* 352.9 (t - )Ar + (D-56)
20
222
AFWL-TR-73-82
The dose equations are plotted in figures D20 through D46. The cockpit
dose rate equations are plotted in figures D47 through D55.
This completes the mathematical development of the mass and dose equation
sets for the cockpit model.
223
dw6-&-

AFWL-TR-73-82
IU r-- -- r - -r -
T = PENETRATION DURATION INmin
i2 /
10-
/30
15cr .I
\5rl
2
.U'
.005
PRUICLE fWIU5 IMICHi) 9
Figure Dl. Cockpit Dust Mass Distribution Function,TI = 10 Minutes
224

AFWL-TR-73-82
AT PENETRATION DURATION (min)
2
10
2 120
- 6o
//3
.2
0.1
.005
.%QZ
.M l -I I i , 3 I 0 . S
FRATICLE DIULJS LMIC ONS)
Figure D2. Cockpit Dust Mass Distribution Function,TI = 18 Minutes
225
L"

AFWL-TR-73-82
aT = PENETRATION DURATION (mi) j
120f
'iot
PH . - /E---/
.111TI I = 30 Miue226"
L - - 22
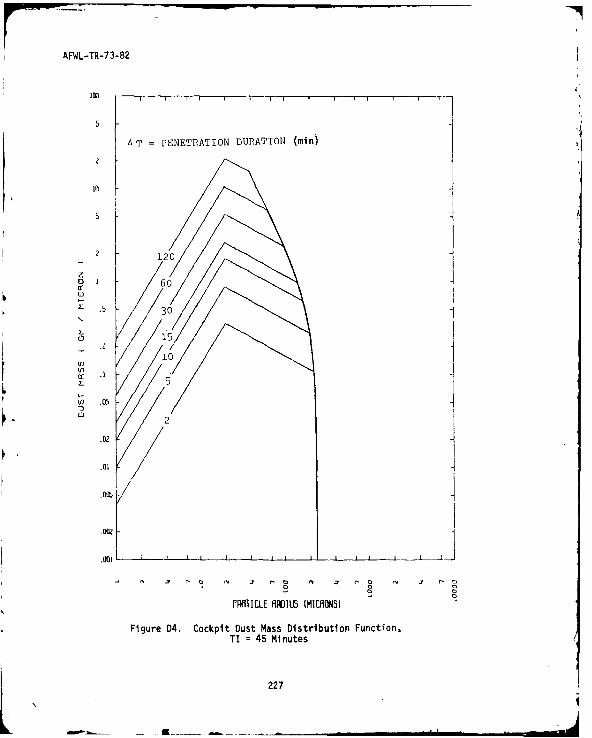
AFWL-TR-73-82
Ia) --....-..--.- T--.,. "-*--, I 1 I I ] I I T '
5 -
AT = PENETRATION DURATION (min)
_ 2 120 1zE) I
50
L 53
n 05
-o 21
.02
.01
.001
PPICLE HDIUS (MICHONS)
Figure D4. Cockpit Dust Mass Distribution Function,TI = 45 Minutes
227L _]
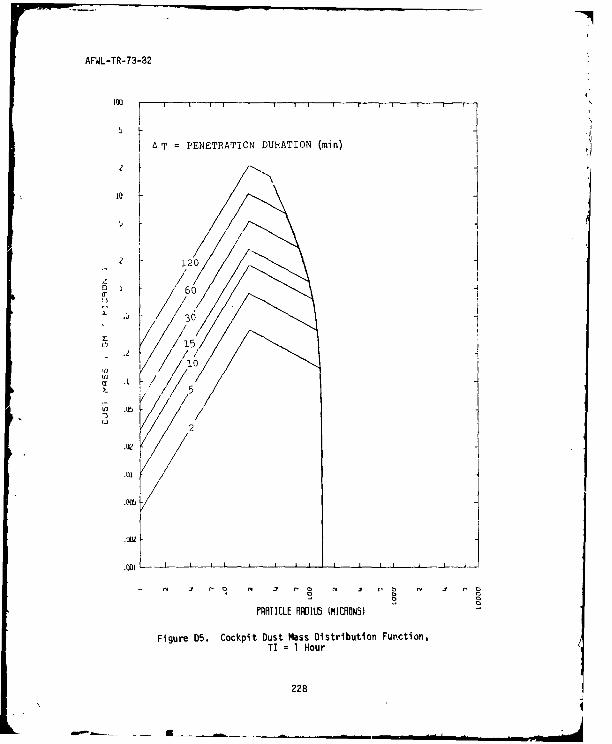
AFWL-TR-73-82
1001
h *1
A T = PENETRATION DURATION (min)
10
6/
30
/'2* //
.am
.W .u
PPHBTICLF HADIU5 (MICHOQNS)
Figure D5. Cockpit Dust Mass Distribution Fun~ction,TI 1 Hour
228
Al--
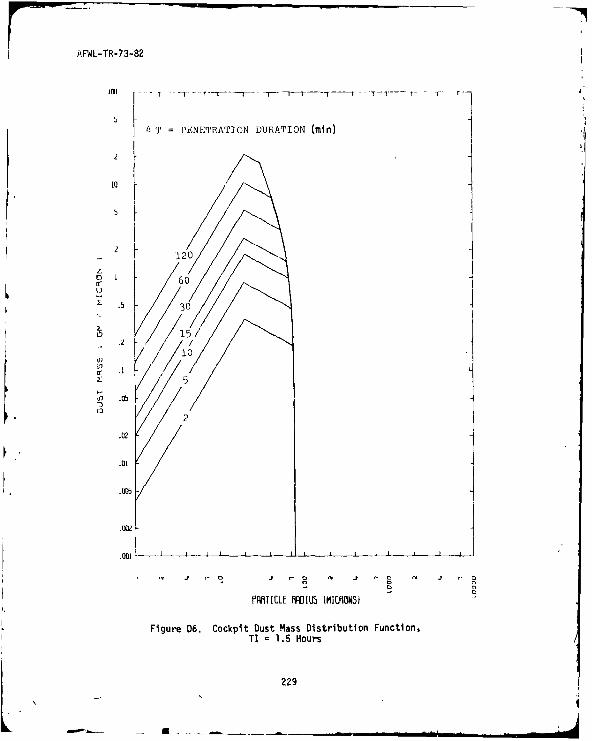
AFWL-TR-73-82
100 T - -r -r ~ -
=PENETRATION DURATION (min)
2-
120-
z/
2 121
E I
2 " I2b301
o
.2 /0'I
El .1 1d~ .05
22
.02 1
.01
.005
.002 -
Figure D6. Cockpit Dust Mass Distribution Function,
TI = 1.5 Hours
- -- ~ 229

AFWL-TR-73-82
IOU-
A 'P PENETRATION DURATION (min)
S120r ..
a II 30
0 1510
C]
2
.02
'i
PfTICLF RRIU5 MICFiON05)
Figure 07. Cockpit Dust Mass Distribution Function,TI K 2 Hours
230

AFWL-TR-73-82
AT PENETRATION DURATION (min)
10
2 120
30
515
.2 /z120
Lf
.1
5
Lf .05
2
.02 /
.01
.002
RFAHTICLE HADIU5 MICRONS)
Figure D8. Cockpit Dust Mass Distribution Function,TI = 3 Hours
231
L
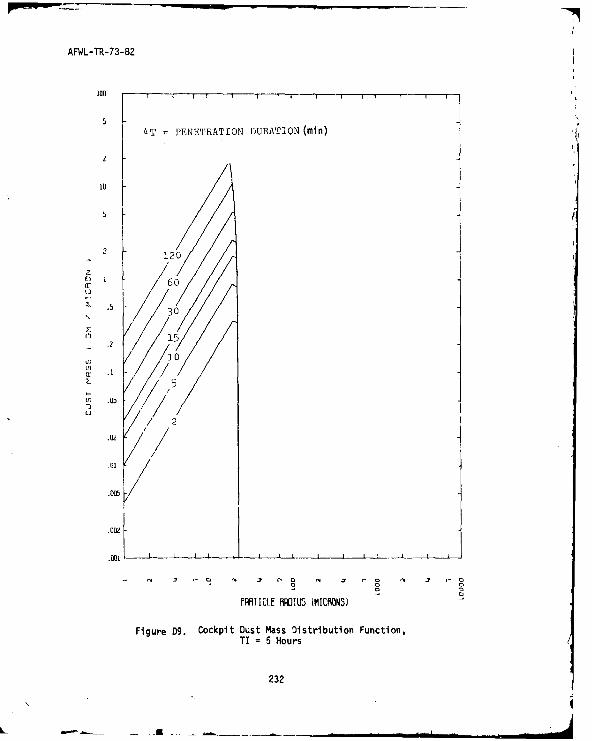
AFWL-TR-73-82
SI
A = PENETRATION DURATION (min)
10
- 5-120
z
21
E) .Qi
/ 2
//30I/
.11
Ln
fARTICLE HlOIU5 LMlCRON
Figure D9. Cockpit Dust Mass istribution Function,TI = 5 Hours
232
L
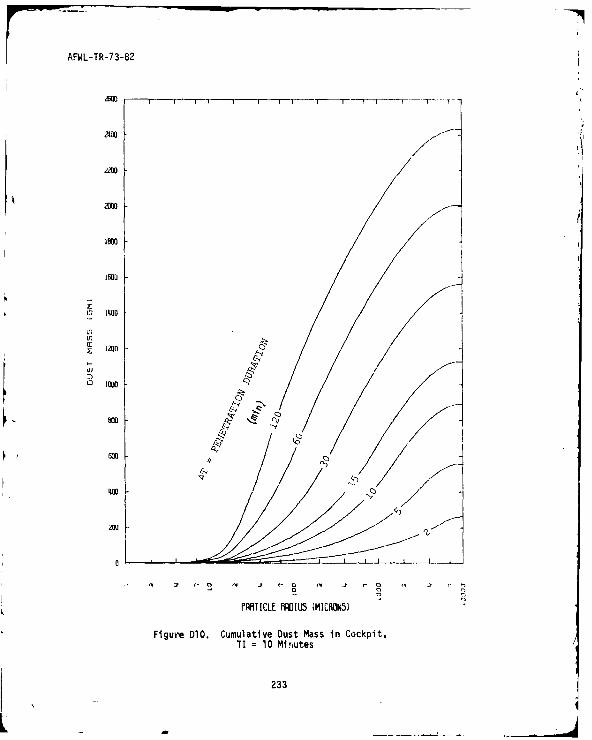
7AFNL-TR-73-82
LO)IIIccLz 1If
two
PRTICLE BROI15 (MIMION51
FiueDID. Cumulative Dust Mass in Cockpit,TI = 10 Mnutes
233
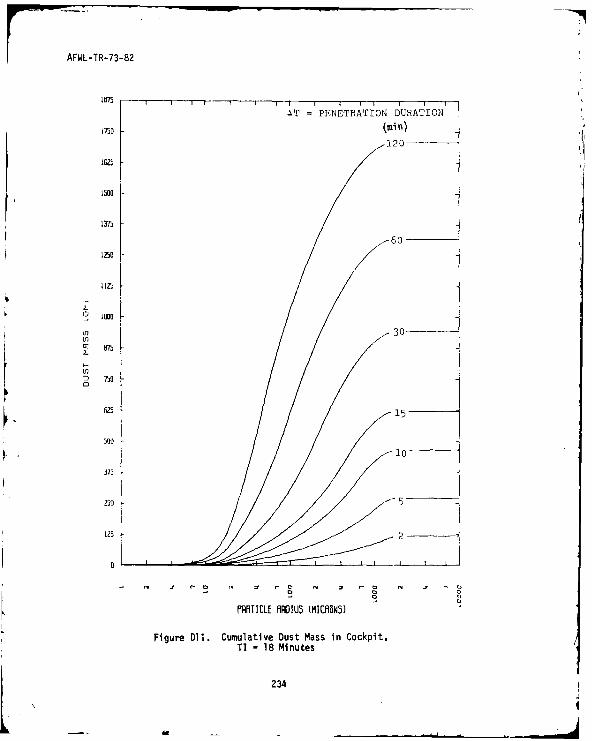
rAFWL-TR- 73-8 2
10,?5 - i I
AT = PENETRATION DURATION
050 (min)120-
100
1375
6o--
1250
1125
O3
0 75
I5 1
l I 7I5 I I
01
Z0 --
fWTIILE 5ADIU3 {MICHGO)
Figure Dl'.. Cumulative Dust Mass in Cockpit,TI = 18 Minutes /
234
ao!

AFWL-TR-73-82
1o3 M li I I I
AT : PENETRATION DURATION (min)
120
12M
1101]
f00
6M / 30
o O
510]
2M1
IOU
2-
PARTICLE f IU (MICRONS)
Figure D12. Cumulative Dust Mass in Cockpit,T1 = 30 Minutes
-235

AFWL-TR-73-82
!T = PENETRATION DURATION (min) "12 0° I
800 -°60
60
w
3W0
15-
--- 10--
-2
PRHTICIF fiIU5 IMICBONO J
Figure D13. Cumulative Dust Mass in Cockpit,TI = 45 Minutes
236
L " " _i
AFWL-TR-73-82
too750 -
Mo650
A PENETRATION DURATION
5s0 (min)o / 60
500 - 0
'150
2500
200
15 -
-21
PARTICLE RIVUUS IMICHON31
Figure D14. Cumulative Dust Mass in Cockpit,TI - I Hour
237
AFWL-TR-73-82
120
( AT = PENETRATION DURATION
£mln) 1i
-60
th
It
Ln0 2
2M 30_ --
15D
: 001505
2
rRMIICLE HADIU5 tMICRONS)
Figure D15. Cumulative Dust Mass in Cockpit,TI = 1.5 Hours
238

AFWL-TR-73-82
AT =PENETRATION DURATION (min)
-120
t~6o
2001560
1001
30- -
10
5-2
IRRTICLE HA2IUS (MIWRONS)
Figure D16. Cumulative Dust Mass in Cockpit,TI - 2 Hours
239
AFWL-TR-73-82
ll .. . ---- T -- T -- T- -r- r - --T 1- I ---
-T PENETRATION DURATION (min)
3120-
V5
Za
225
6 o
u) 175U)LII
T- 1502
125
100 30
5.5 .
1.0-
25
- 2--
PRIICLE RADUS LMIUSON)
Figure D17. Cumulative Dust Mass for Cockpit,TI = 3 Hours
240
S . . .. L '
AFWL-TR-73-82
1120
137.5F
112.5 %T = PENETRATION DUEATION
(min)
06
.5
100
37 9.5
/15
10
L TI =5 Hours
241
AFWL-TR-73-82
30M
Z15
2520
C30
10
242

7 AFWL-TR-73-82
10 120
4 6030
1 10
Ol
fI I IR I5 M[[O ]
-0
FRFITICLE RFDIW L ~15 IHO
Figure D20. Cockpit Dust Dose Distribution at 30 Hours,TI 10 Minutes
243

AFWL-TR-73-82
10
12
/30/
/ 5
z2
IT
Lr
tr
0.
Lo
.010! ,
,01011! __..._
PPATICLE FiDIU5 IM I LON5)
Figure D21. Cockpit Dust Dose Distribution at 30 Hours,TI = 18 Minutes
I244
As_

AFWL-TR-73-82
Ion
10
120
/6 0
E31 30
U
0
2
SA 0
o 0.M4
.[11 I
PRRTICLE fR0IU5 (MICRiONS)
Figure U22. Cockpit Dust Dose Distribution at 0 Hours,
TI , 30 Minutes
245
II

AFWL-TR-73-82
100 I I ,r--,----
4/
I- 12-4
15*6
5
2K .0 1 '
.111 I-
.001L [ --- ~- - - W L ., 1 , L
PfATICLE MAIU5 (MICRONS)
Figure D23. Cockpit Dust Dose Distribution at 30 Hours,TI = 45 Minutes
246

AFWL-TR-73-L2
10
Z 2 12?0
03
10
2
03
5
0
In
-0-
Av
.001 [ L
0 0
FRIRII LE RAIU tMICRONS)
Figure D24. Cockpit Dust Dose Distribution at 30 Hours,TI = I Hour
247

AFWL-TR-73-82
230
2
60
.05
.a 2
0
PR15CLE RDl5 (MICHONS)
Figure D25. CoCkpit Dust Dose Distribution at 30 Hours,
TI = 1.5 Hours
248
ip." _ __ . .. ,. , , i I km ... .. m o m
AFWL-TR-73-82
IO
I
120
60
1: i
Un 0(i /
.000
K
Figure D26. Cockpit Dust Dose Distr-ibution at 30 Hours,TI = 2 Hours
| 249
AFWL-TR-73-82
2 'I
5 -1
/ A
/
120 I
000
- .2 30
in 1
L 0 .1 L /
/55
.t " /
TI 'd 3 Hour Ns 0 f
250
AFWL-TR-73-82
Z120
0 60
L
C6030
-.2
17
ra-oCL *jm OOS
Fiue08 okitDs o-Dsrbuina 0Hus
TI=5 or
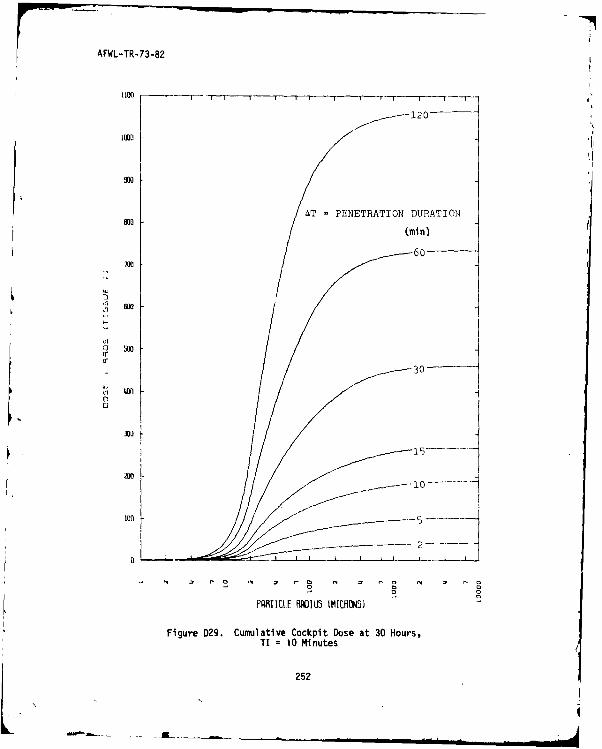
AFWL-TR-73-82
1100 T
120-
AT = PENETRATION DURATION
(min)
60700
0 500U.
io
PRTIICLE. FIUS MUON )
Figure D29. Cumulative Cockpit Dose at 30 Hours,TI = 10 Minutes
252
LK---
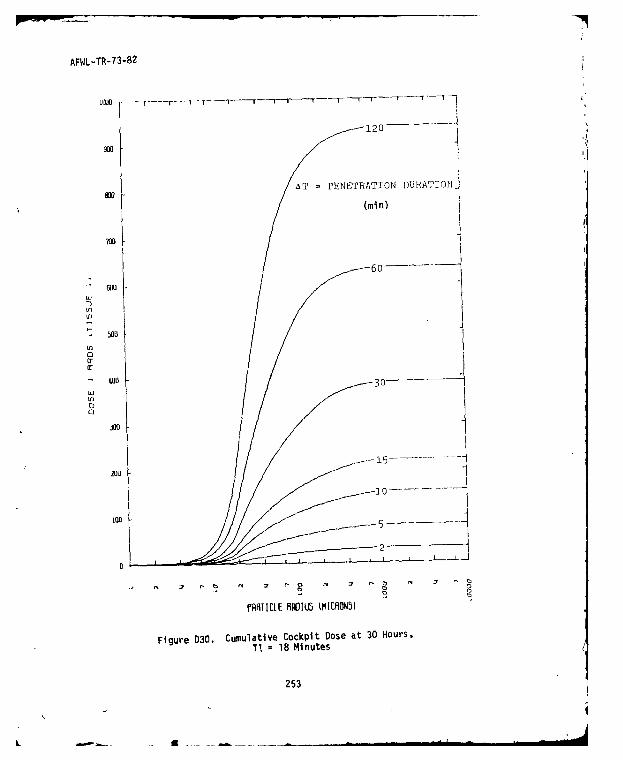
AFWL-TR-73-82
310 II
-AT PENETRATION DURATIOUi
(min)
70
'-I6
00
Ui
OO ----- ~
300
LO
U
Figure D30. Cumulative Cockpit Dose at 30 Hours,T! - 18 Minutes
253
L.

AFWL-TR-13-82
-T PENETRATION DURATION (min) 120
6o
II
25
.. 0 - 30 Min t
3254
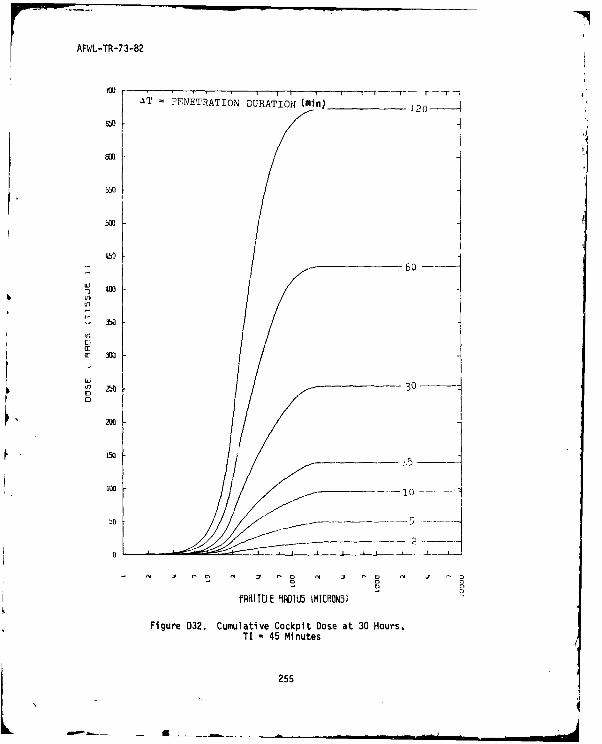
AFWL-TR-73-82
, I I "1 J ---T -AT PENETRATION DURATION (mln) 120
wo-o
5bU -
60-
Uj) 0
-003 0 -
to
__L __U __ 5Ion
PRTICLE MADI L5 iMICRON5)
Figure D32. Cumulative Cockpit Dose at 30 Hours,TI - 45 Minutes
255
L --
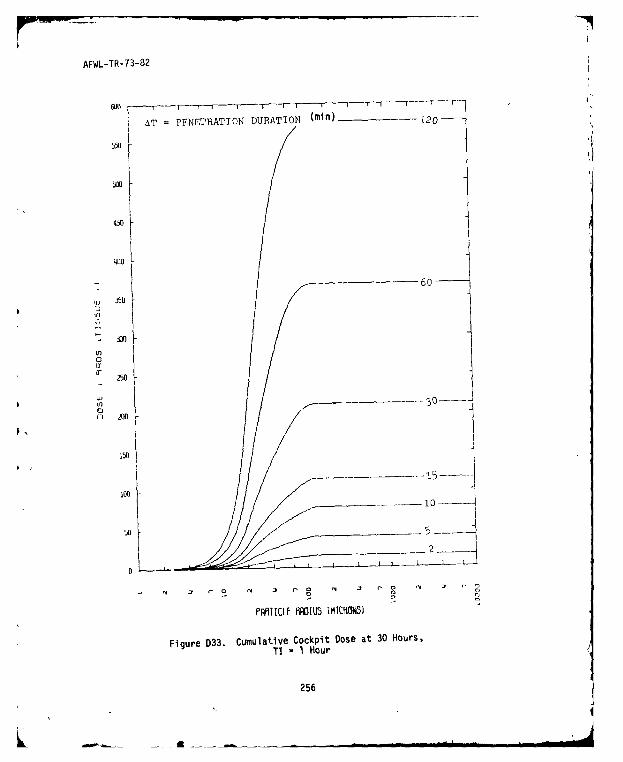
AFWL-TR-73-82
AT= PENETRATION DURATION (mn)
im6o
00
1D !
Figure D33. Cumulative Cockpit Dose at 30 Hours,TI - I Hour
256
k m, -. _ • ... .. .... . ... ... •- -

AFWL-TR-73-82
T= PENETRATION DURATION'(min) 120-
400
in
Ii
150 10
5--
02o ., I i s r N 3 i 04 i?
PFIICLE RDIUS (MICRONS)
Figure D34. Cumulative Cockpit Dose at 30 Hours,TI = 1.5 Hours
257
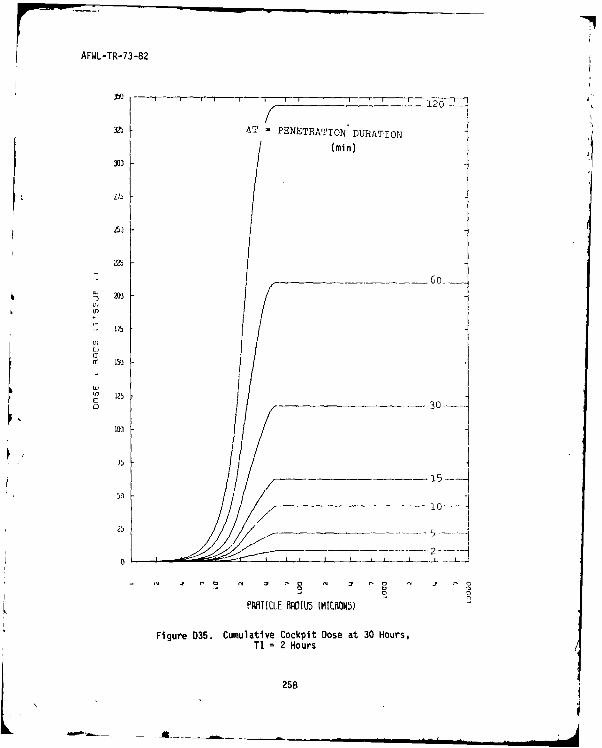
AFWL-TR-73-82
T= PENETRATIONDURATION 2
(min)
____0____I21
lTh
(r
onIS I~
01
0 0
25 __ _ _ _-- --
- _-__ - k x1 L U-.
FRRTILLE RIMU5 (MIMRONS) 2
Figure D35. Cumulative Cockpit Dose at 30 Hours,TI = 2 Hours
258
A&
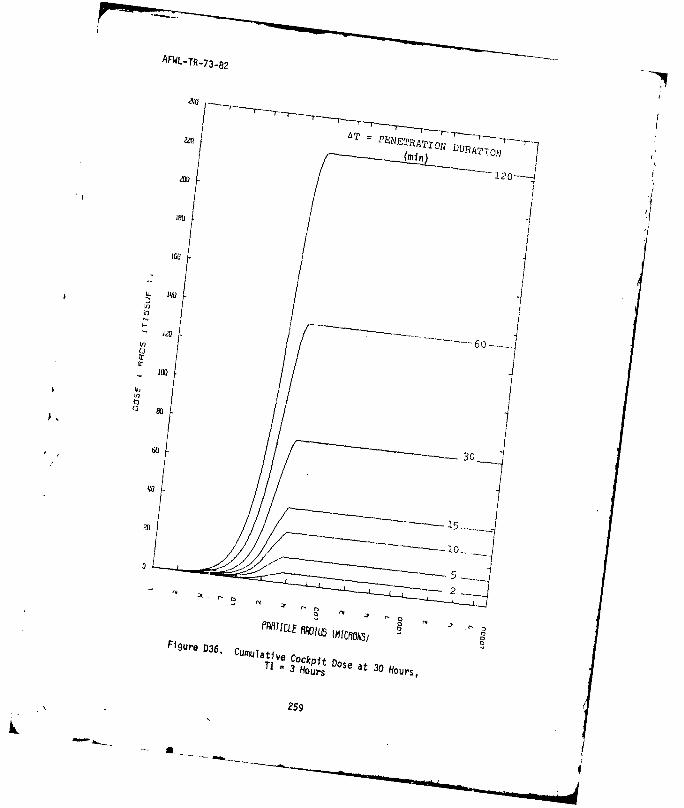
AFWLTR73 82
220PENETRATION 1
mln DtJRATTON 7
IOU
IrI100
- 8
ILI
2.
Figure D36. CumultiveTiv CockPit Dose ot 3
3 Hours 3 Hours,
259

AFWL-TR-73-82
AT =PENETRATION DURATION (Min)
9I
- 60
D Go.
/________- --- 6 .....
'5 10 .
2
FAR T ILE RAI Ud sMI U1 ,_
Figure D37. Cumulative Cockpit Dose at 30 Hours.TI = 5 Hours
260
L. .
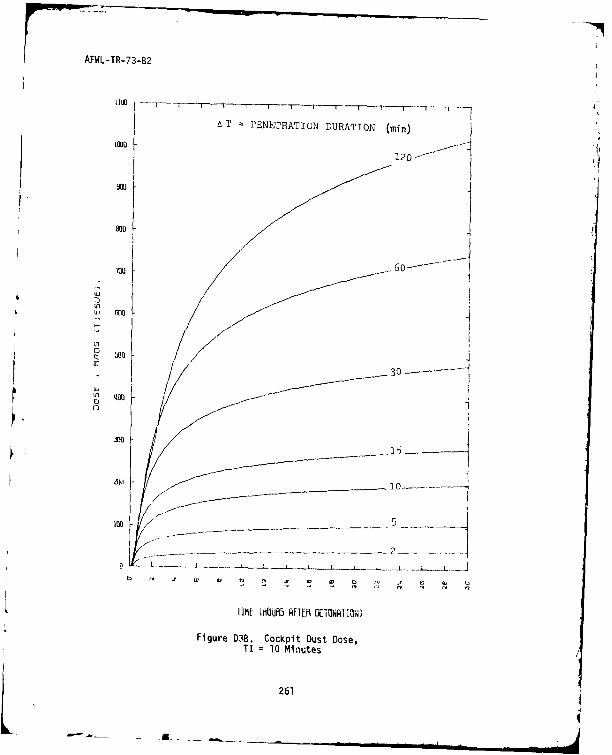
AFWL-TR-73-82
AT= PENETRATION DURATION (min)
120 --1
m~u .60- . .
r 3
15
I k L_____-___-____ J
Figure D38. Cockpit Dust Dose,TI = 10 Minutes
261
I !
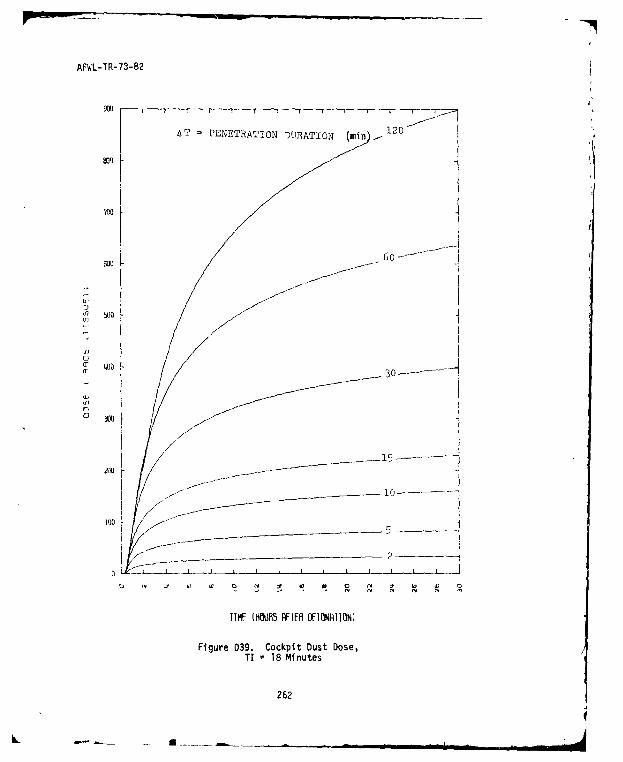
AFWL-TR-73-82
ATPENETRATION O)URATI0N4 (min12
6060
wu1
4U4
IOU
TI =18 Minutes
262
L
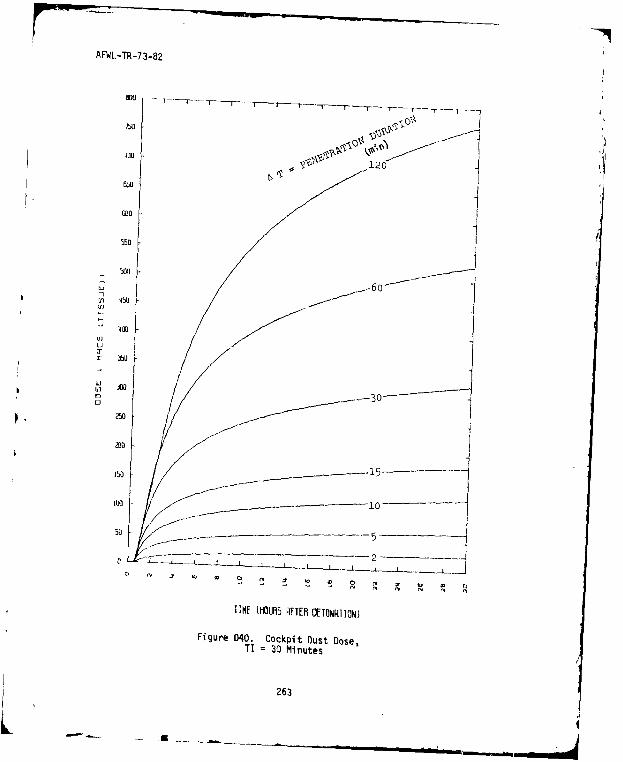
AFWL-TR-73-82
OO -
500
W= Mit$-26
"'"- -- I -_
'
r i
I
030
20
15-
-- 2I
lINE UNOUNS RFIEM DElONRI TONI
Figure D40. Cockpit Dust Dose,Ti = 30 Minutes
263

r " lAFWlL-TR-73-82
gs T =PENEZTRATION DURATION
50
Unj
00
TIME (HUIHl3 Rflbi DETONATION)
Figure D41. Cockpit Dust Dose,TI = 45 Minutes
?64
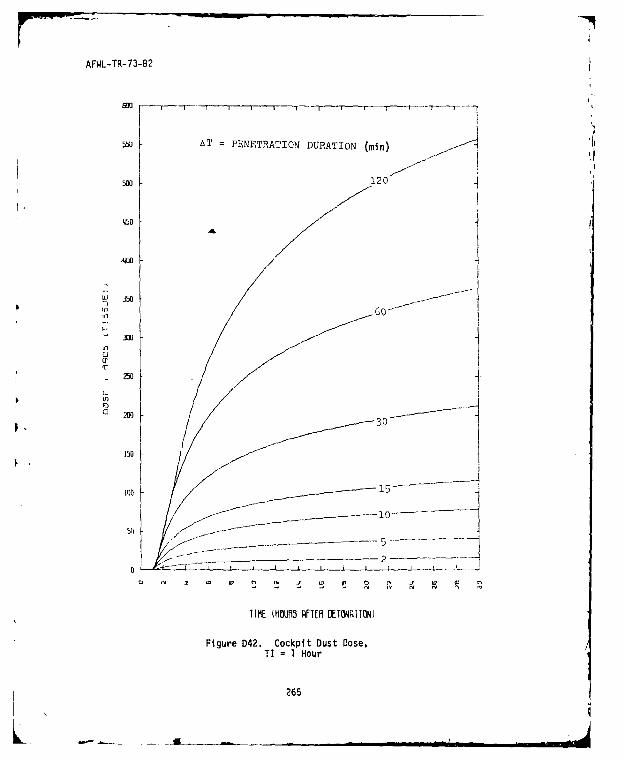
AFWJL-TR-73-82
55U AT PENETRATION DURATION (min)
500 120 -
b ~ f~o60-
U
03
250
~~15
L1

AFWL-TR-73-82
tl -- T--""
T-r- -F -- F-T 1 -' -T ------ - - - - " " .. -~ -
two 'T PENETRATION DURATION Imin) - ]
120 I
Ji 0 ,
30'
,115
TIMF MUMS RFIF OFTINRII
Figure D43. Cockpit Dust Dose,TI 1.5 Hours
266

AFWL-TR-73-82
AT PENETRATION DURATION (min)
2 I
120
4.ft5
211
io 30
/ -17-J -
150
I
25 -
l1ME UiUAi RFIF9 D!IONRTI]ON
Figure D44. Cockpit Dust Dose,TI 2 Hours
267
""L--- -
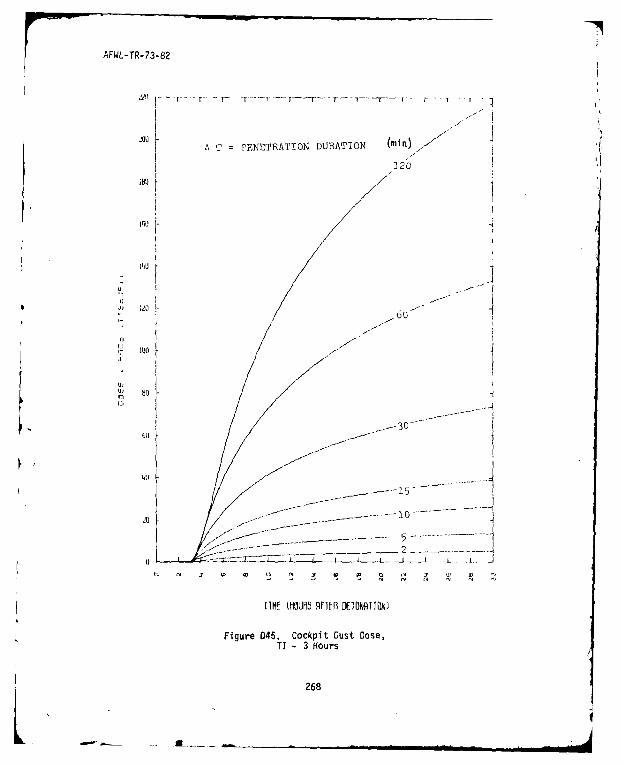
AFWL-TR-73-82
.i~u h A T =PENIOFRATTON OURATION Wmml-
120
U7'
I j ..
J(- , -
(I /
'rL 'Jo rx
U. I" f'
u, bi~l I- --
. ! f -- o ....
TIME LflOUBS RFI-I IOF1DNAION)
Figure 045. Cockpit Oust Dose,TI - 3 Hours
L -268L,,L

AFWL-TR-73-82
RI - ----- ' -- T '- T .. --- -
AT = PENETRATION DURATION (min)
/
/00 12o
10/
/
-II
2660
- I I -
/ -
-- 2----- - --- 4
IIe IIIOUMS RFIEH DFIINiN
Figure D46, Cockpit Dust Dose,TI = 5 Hours
269
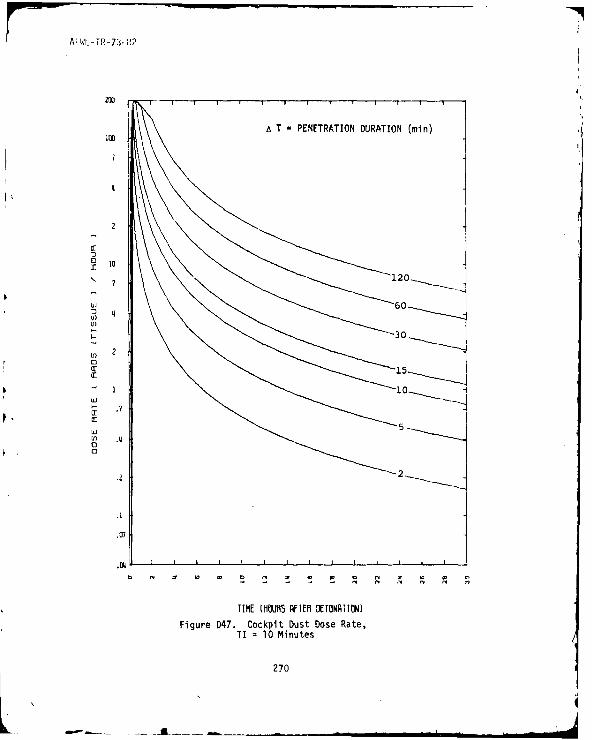
AlWL -T R -73- W?
211]
IOU T PENETRATION DURATION (min)
10
7
760
V)2
0
'- 2 -
.0
A
TIME (HUM AFIEM DETONATION)
Figure D47. Cockpit Dust Dose Rate,TI = 10 Minutes

AFWL-TR-73-82
A T PENETRATION DURATION (min)
7
r 10
7 120~.
S60
i,
In
t 3
Tin18Mnue
2115
- au
.- 7Cr(jU'
.27
'I4
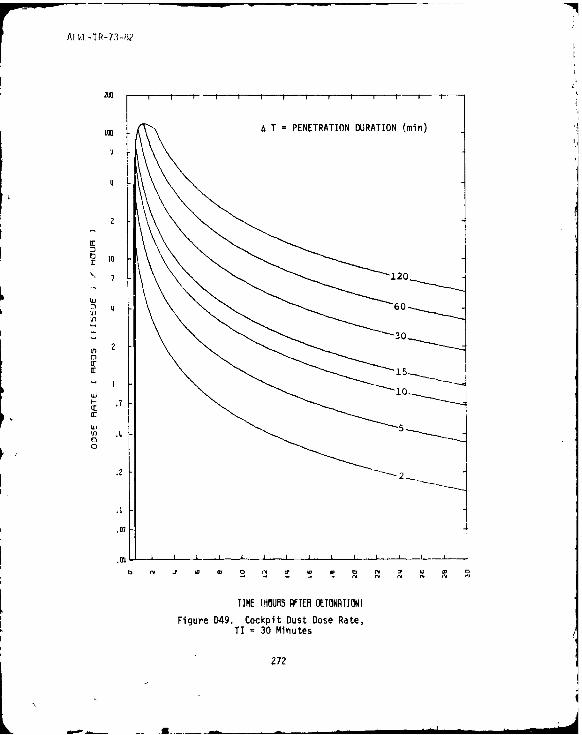
A T =PENETRATION DURATION (min)
2
. 7
2
KIE(flH AfFM DTONAIOlN)
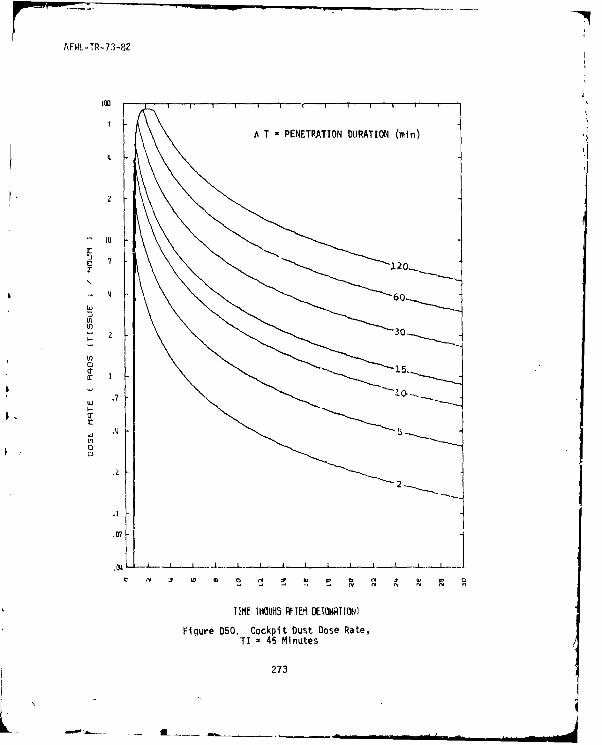
AFWL-TR-73-82
A T - PENETRATION DURATION (min)
10
it
7 120
4 60
in
Fir D
TJ - 5Miue
427
i9t

A T !TNETRATION DURATION (mm)
r ~120-
KL --~60v)
Tl 15 .
Figur D5. CO.i us oe ae'ri z i ilour-..- -*j. 5 -274
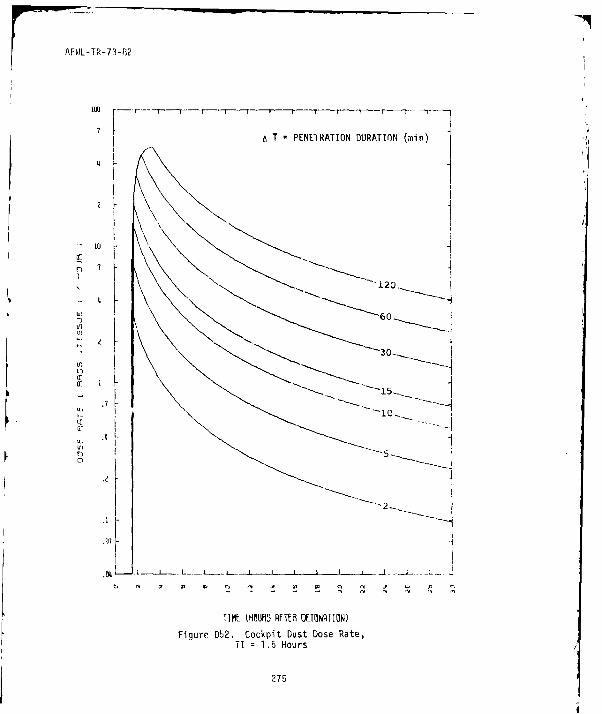
AFVWL-TR-7 3-P82
A T PENETRATION DURATION (min)
120
~ 60
30
.
.4
-
.'1
TIMt IHOUM 5 AFTflI LJI{NRIION)
Figure D52. Cockpit Dust Dose Rate,TI = 1.5 Hours
275
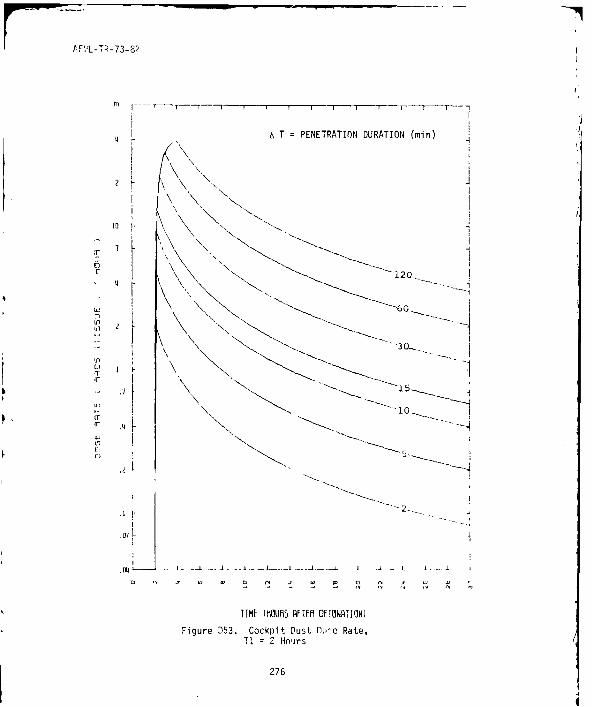
AF'/L- TR-73-82 - t~1~~~
... .-- "1 i I I i I I I I - -
A T = PENETRATION DURATION (min)
\,t \ \, ,
\ \
0~.-5 - ..
I 1\
TIM NUM AFTE OEUN I
T! = 25-.._ -
I27
TIME UiOUf15 R FTEM OIT1N TiUN)
Figure D53. Cockpit Dust PR~e Rate,T'.
= 2 Hoirs
276
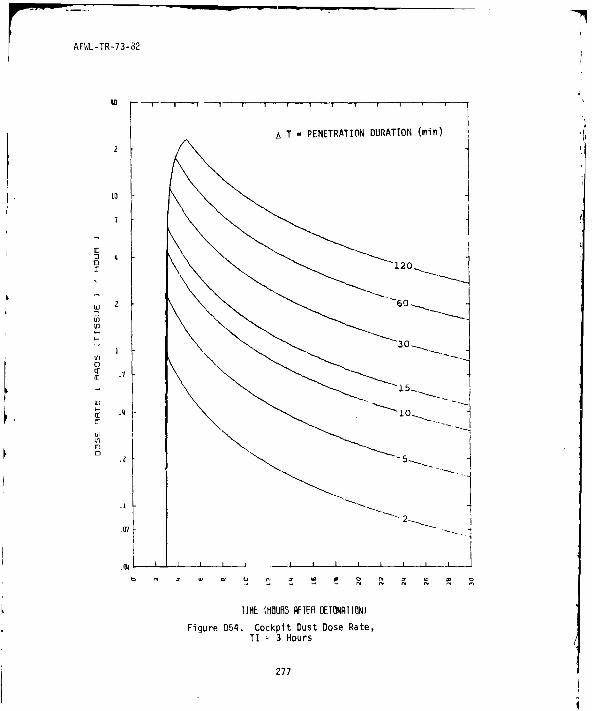
AFWL-TR-73-82
A T = PENETRATION DURATION (min)
r
If)iL 6' 0--_.
U)
!
.91
.0 )] I -- i I I ,I , I
TIME tHOUH RFIEI DETONARTION)
Figure 054. Cockpit Dust Dose Rate,TI = 3 Hours
277

AWL-TR-73-82
T P ~i,."(I ' 'ON (min)
[ 120
60
101
Figure D5S. Cockpit Dust Dose Rate,
TI = 5 Hours
278
AFWL-TR-73-82
REFERENCES
1. Whitaker, W., Personal Comunication.
2. Glasstone, Samuel, The Eftfcts of Nuclear Weapons, US Atomic EnergyCommission, February194.
3. Langham, W. H., ed., Radiobiological Factors in Manned Space Flight,Publication No. 1487, National Academy of Sciences, National ResearchCouncil, Washington, DC, pp. 8-84, 1967.
4. Patrick, R. P., Arnett, G. D., and Yingling, W. A., Cockpit Air Filtra-tion Re uirements of the B-l in a Nuclear Dust Envir'onet, AFWLTR73-83,
Forc W.-eaponsaboratory, Kirtland AFB, NM, July 1973.
5. Task Group on Lung Dynamics, "Deposition and Retention of the HumanRespiratory Tract," Health Physics, V. 12, pp. 173-207, 1966.
6. Hobbs, C. H. et al., "Toxicity of Inhaled 90y Fused Clay in Beagle Dogs,III," Contained in reference 7, pp. 145-150.
7. Staff of the Fission Product Inhalation Program, Fission Product Inhala-tion Program Annual Report, 1970-1971, US Atomic Energy Commission,Vi-TiiOn of Boogy and edicine, November 1971.
8. Radiologica! Health Handbook, PB 121784R, US Dept of Health, Education,and Welfare, Public Health Service, Bureau of State Services, Division ofRadiological Health, Washington, DC, September 1960.
9. Lamb, Horrace, Hydrodynamics, 6th Edition, Dover Publications, New York,
1932.
10. Handbook on Aerosols, US Atomic Energy Commission, 1963.
11. Schlichting, Hermann, Boundany Layer Theory, McGraw-Hill, 1960.
279/28U