Embed Size (px)
Citation preview
Michael Dourson
Toxicology Excellence for Risk Assessment Center University of Cincinnati
College of Medicine
Distinguishing between Mode and Mechanism of Action

Conflict of Interest Statement The research described in part was funded by different sponsors to the nonprofit organization Toxicology Excellence for Risk Assessment (TERA). Funding is ~2/3rd government and ~1/3rd industry. See http://www.tera.org/about/FundingSources.html. The mission of the TERA Center is to support the protection of public health by developing, reviewing and communicating risk assessment values and analyses; improving risk methods through research; and, educating risk assessors, managers, and the public on risk assessment issues.
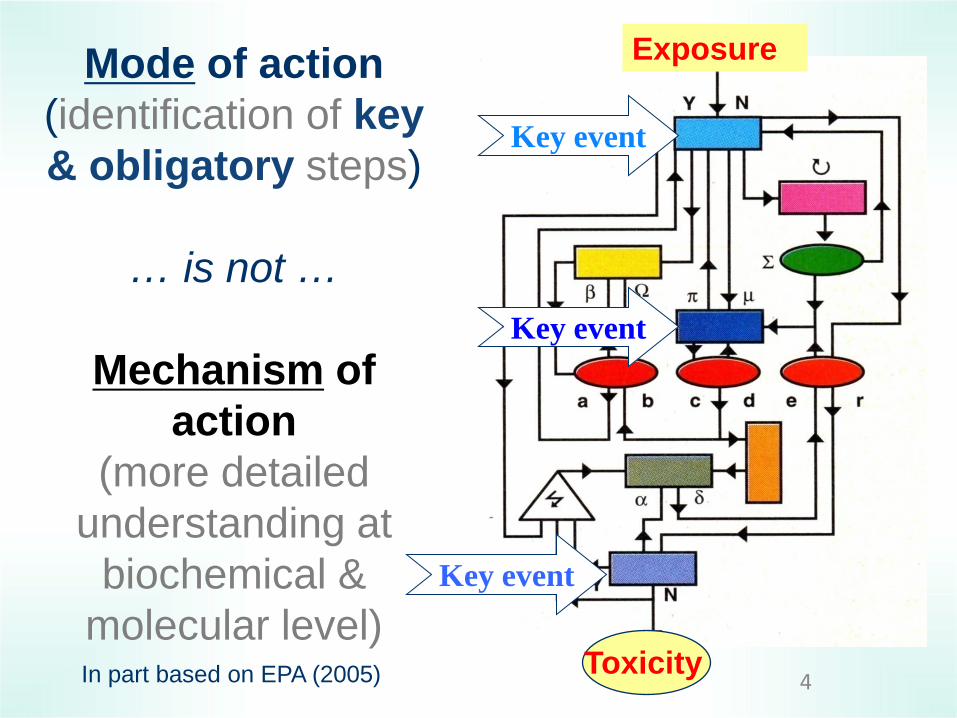
Mode of action (identification of key & obligatory steps)
… is not …
Mechanism of
action (more detailed
understanding at biochemical &
molecular level)
Exposure
Toxicity
Key event
Key event
Key event
4 In part based on EPA (2005)

Adapted from Schulte (1989); Farland et al. 2000
Exposure Internal Dose
Effective Dose
Early Biological
Effect
Altered Function: Critical Effect
Clinical Disease
Exposure Effect
Susceptibility
Water Perchlorate
Blood Perchlorate
Perchlorate uptake in thyroid
Altered T3, T4, TSH
Thyroid Histopathology
Tumors CNS
5
The Black Box of MOA Revealed

Biologic inputs
“Normal” Biological Function
Adverse Outcomes
(e.g., mortality, Reproductive Impairment)
Cell injury,
Inability to
regulate
Adaptive Responses
Early cellular changes
Exposure
Uptake-Delivery to Target Tissues
Perturbation
Cellular response pathway
Molecular initiating event
Perturbed cellular response pathway
Adverse outcome relevant to
risk assessment
Toxicity Pathway
Adverse Outcome Pathway
Tox 21: Outcome Pathways of NAS
NAS, 2007
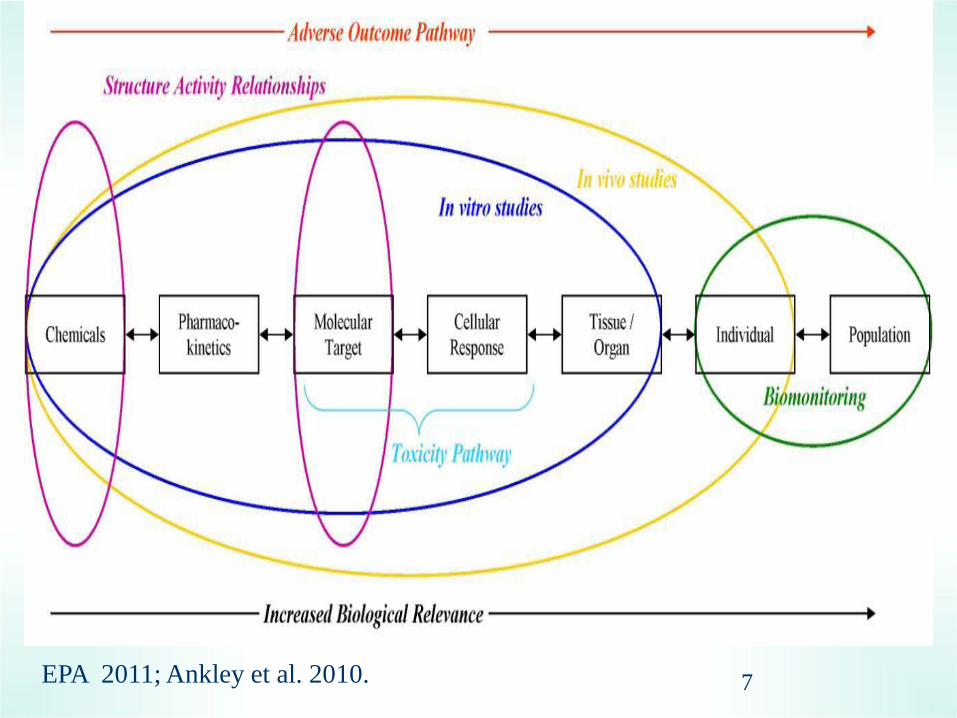
EPA 2011; Ankley et al. 2010. 7

MOA versus AOP
From a risk assessor’s perspective… – Adverse Outcome Pathway (AOP) reflects the
inherent structure of the body for dealing with internal and external impingements. AOP is chemical-agnostic.
– Mode of action reflects the key & obligatory steps through which a chemical interacts with the organism... And the organism’s response. MOA is chemical-specific
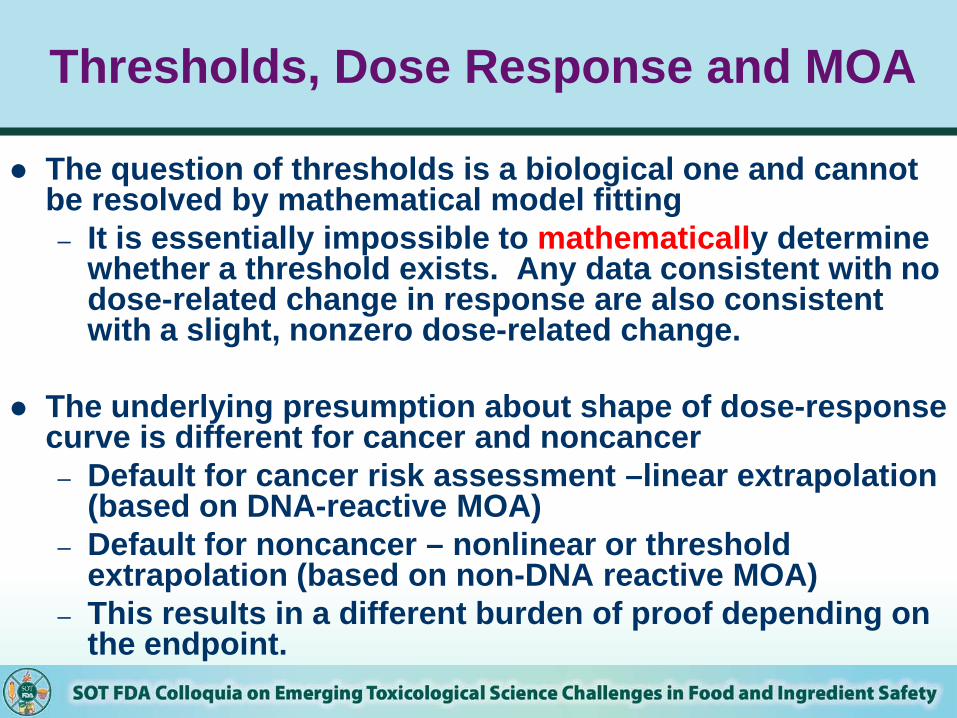
The question of thresholds is a biological one and cannot be resolved by mathematical model fitting – It is essentially impossible to mathematically determine
whether a threshold exists. Any data consistent with no dose-related change in response are also consistent with a slight, nonzero dose-related change.
The underlying presumption about shape of dose-response curve is different for cancer and noncancer – Default for cancer risk assessment –linear extrapolation
(based on DNA-reactive MOA) – Default for noncancer – nonlinear or threshold
extrapolation (based on non-DNA reactive MOA) – This results in a different burden of proof depending on
the endpoint.
Thresholds, Dose Response and MOA
Dose UF
Res
pons
e
5/10%
0%
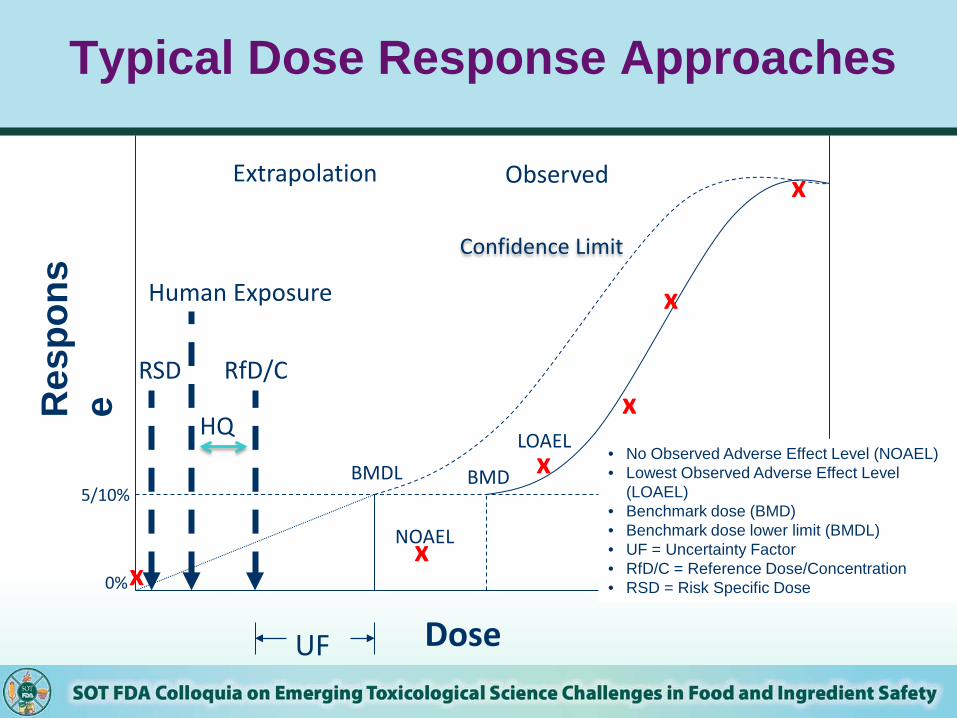
Extrapolation Observed
x
x
x
RfD/C
• No Observed Adverse Effect Level (NOAEL) • Lowest Observed Adverse Effect Level
(LOAEL) • Benchmark dose (BMD) • Benchmark dose lower limit (BMDL) • UF = Uncertainty Factor • RfD/C = Reference Dose/Concentration • RSD = Risk Specific Dose
Confidence Limit
BMDL
x
x
x NOAEL
LOAEL
BMD
Human Exposure
HQ
RSD
Typical Dose Response Approaches

11
Background Range
Increasing Dose
Beneficial Effect
But Then Again… A Variety of Possibilities Essentially (–), Hormesis (–), Toxicity (---)
Nonmontonic (–) Adverse
Effect
Wherein lies endocrine disruption?

ILSI-IPCS-EPA Mode of Action Framework Postulated Mode of Action
– Identify sequence of key events on path to critical effect
Experimental Support – Concordance of dose-response for key events for
critical effect – Temporal relationships for key events & critical effect
Biological Plausibility & Coherence Strength, Consistency & Specificity Other Modes of Action Identify Uncertainties Conclusion
Various publications over 15 years
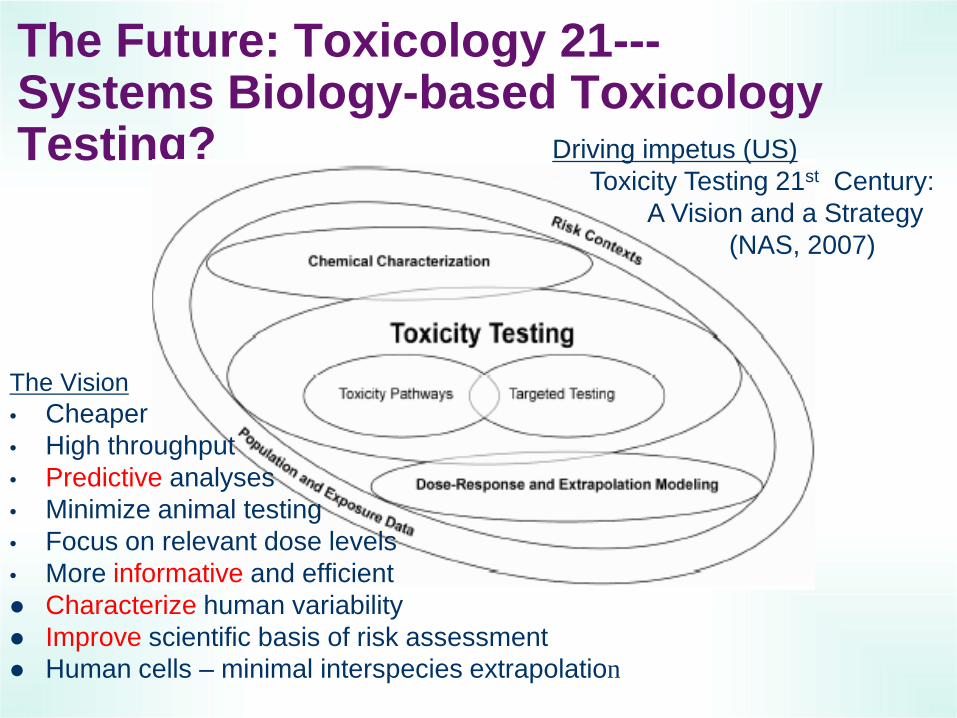
The Future: Toxicology 21---Systems Biology-based Toxicology Testing? Driving impetus (US)
- Toxicity Testing 21st Century: - A Vision and a Strategy - (NAS, 2007)
The Vision • Cheaper • High throughput • Predictive analyses • Minimize animal testing • Focus on relevant dose levels • More informative and efficient Characterize human variability Improve scientific basis of risk assessment Human cells – minimal interspecies extrapolation
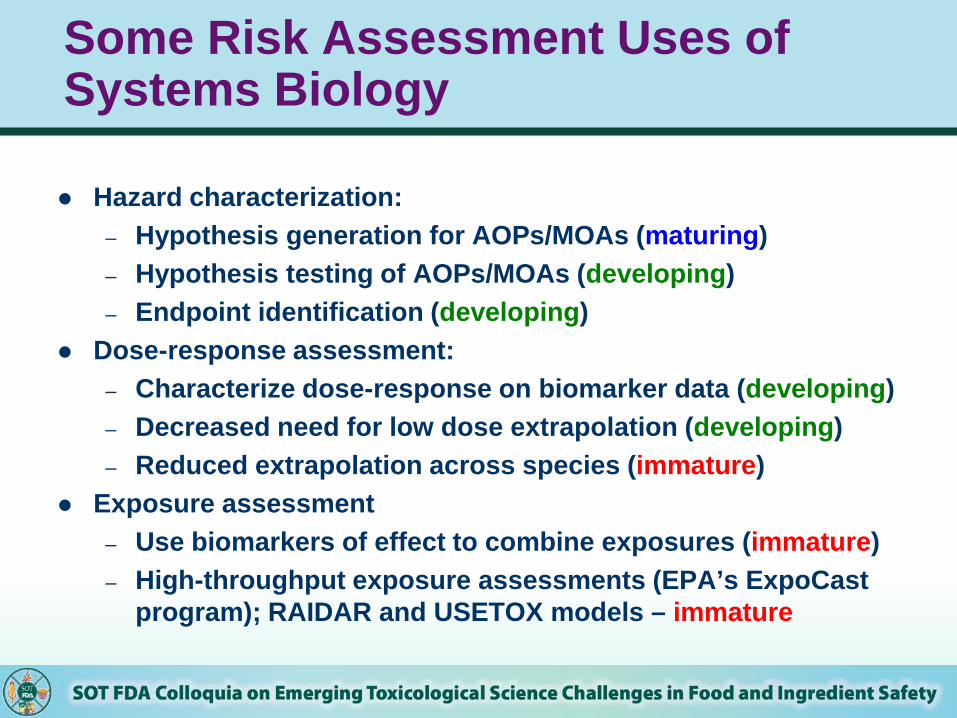
Some Risk Assessment Uses of Systems Biology
Hazard characterization: – Hypothesis generation for AOPs/MOAs (maturing) – Hypothesis testing of AOPs/MOAs (developing) – Endpoint identification (developing)
Dose-response assessment: – Characterize dose-response on biomarker data (developing) – Decreased need for low dose extrapolation (developing) – Reduced extrapolation across species (immature)
Exposure assessment – Use biomarkers of effect to combine exposures (immature) – High-throughput exposure assessments (EPA’s ExpoCast
program); RAIDAR and USETOX models – immature

Biomarker Applications
Biomarkers of exposure – Quantify/verify exposure – Medical monitoring (intervention) – Cross-species extrapolation (kinetics)
Biomarkers of effect – Medical monitoring (recovery and long-term effects) – Cross-species extrapolation of toxicodynamics – Evaluate mode of action hypotheses/help characterize AOP – Immediate precursors for dose-response – Low-dose response characterization – Mechanistic modeling
Biomarkers of Susceptibility – Identify susceptible subpopulations – Characterize human variability
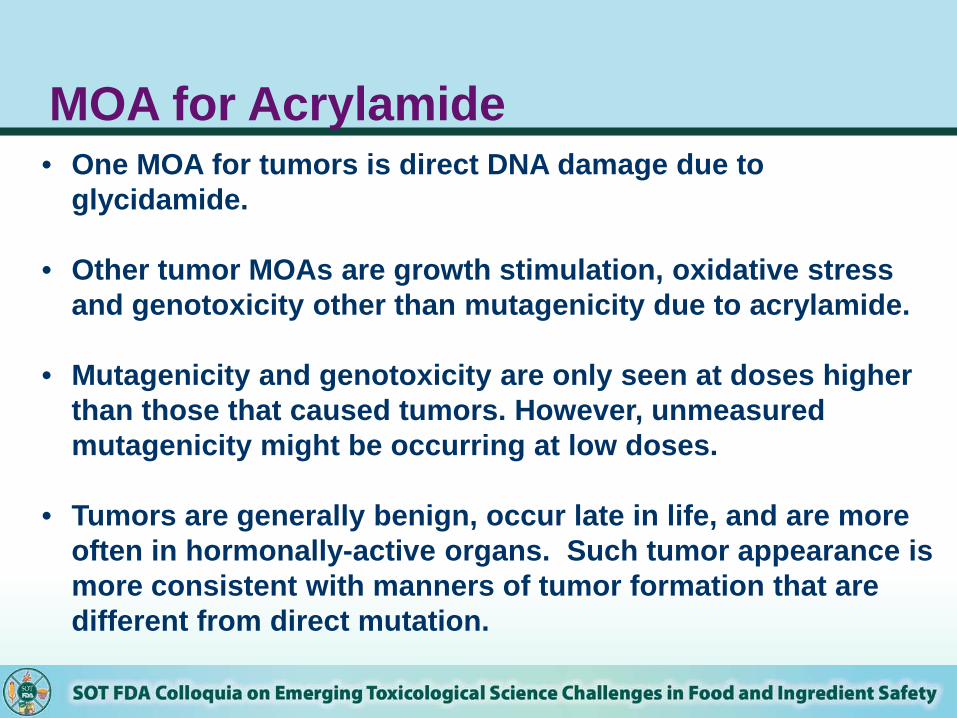
MOA for Acrylamide
• One MOA for tumors is direct DNA damage due to
glycidamide. • Other tumor MOAs are growth stimulation, oxidative stress
and genotoxicity other than mutagenicity due to acrylamide.
• Mutagenicity and genotoxicity are only seen at doses higher than those that caused tumors. However, unmeasured mutagenicity might be occurring at low doses.
• Tumors are generally benign, occur late in life, and are more often in hormonally-active organs. Such tumor appearance is more consistent with manners of tumor formation that are different from direct mutation.
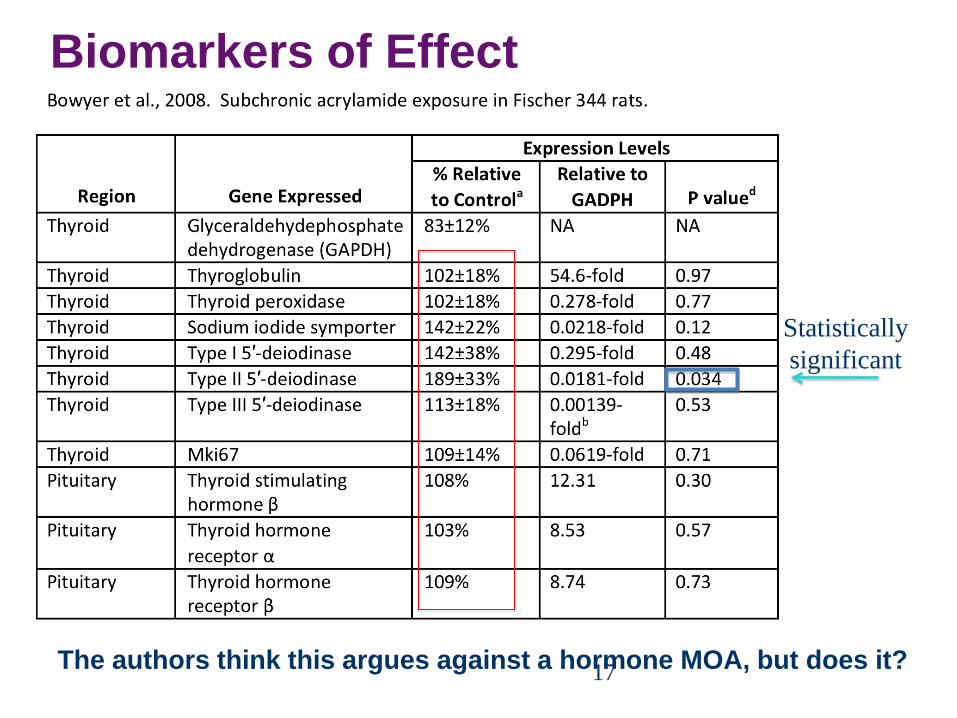
Statistically significant
Biomarkers of Effect
17 The authors think this argues against a hormone MOA, but does it?

Dual Mode of Action (MOA) Probit model fitted to pooled-all thyroid tumor data shows different slopes between
low & high doses.
Low dose: 14 data sets
High dose: 5 data sets
EPA, 2005, p. 3-22; Dourson et al., 2008
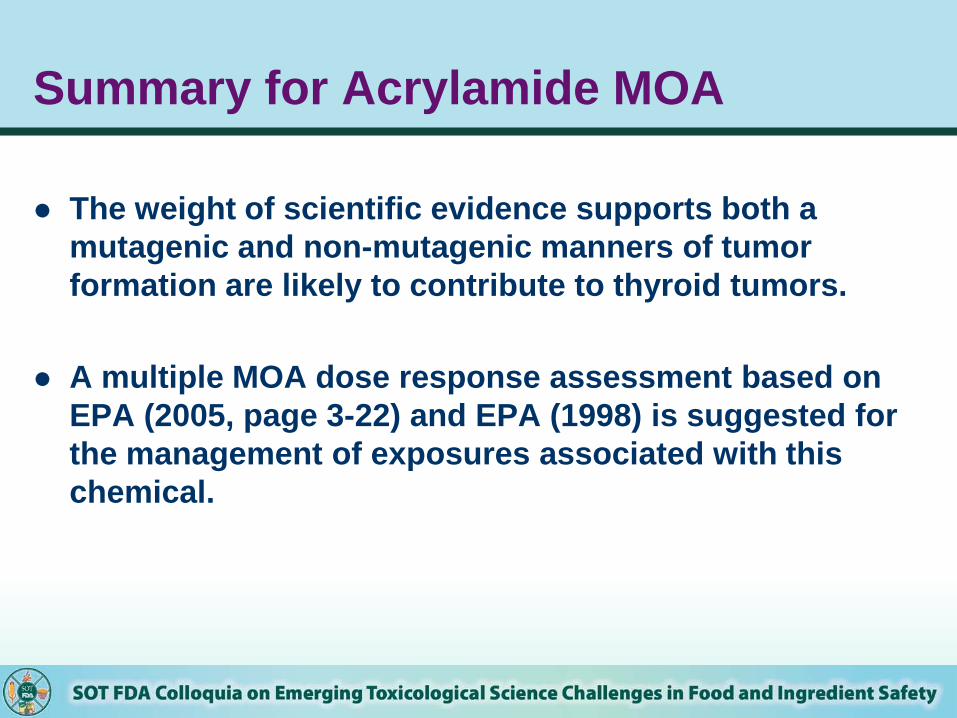
Summary for Acrylamide MOA
The weight of scientific evidence supports both a mutagenic and non-mutagenic manners of tumor formation are likely to contribute to thyroid tumors.
A multiple MOA dose response assessment based on
EPA (2005, page 3-22) and EPA (1998) is suggested for the management of exposures associated with this chemical.

MOA for 1,4-Dioxane Liver Tumors
Data from two mouse cancer bioassays, one 13-week mouse study, and seven rat cancer bioassays, show toxicity in the rodent liver.
Observed liver toxicity is related to metabolic saturation.
1,4-dioxane is negative for mutagenicity and DNA repair, but does show DNA synthesis.
Appearance of liver tumors occurs in species/strain with a high background incidence.

EPA, 2013 and adapted by Dourson et al., 2014

22
EPA (2013) Figure 3-2. Plasma 1,4-dioxane levels in rats following i.v. doses of 3-5,600 mg/kg

0
10
20
30
40
50
60
70
80
90
100
0 100 200 300 400 500 600
Percent Response
Dose (mg/Kg bw-day)
Figure 3. Pooled Incidence of 6 effects in F344 Male and Female Rats Given 1,4-Dioxane for either 13 Weeks or 2 Years. 13 Week doses have been adjusted to chronic equivalents (JBCR, 1990).
Centrilobular Swelling (13wk)
Single Cell Necrosis (13wk)
Hyperplasia (2yr)
Foci (2yr)
Adenoma (2yr)
Carcinoma (2yr)
Poly. (Hyperplasia (2yr))
Poly. (Foci (2yr))
Poly. (Adenoma (2yr))
Poly. (Carcinoma (2yr))
Alliance for Risk Assessment (ARA, 2015)
Summary for 1,4-Dioxane MOA
Mutations induced by 1,4-dioxane, if any, are not a key event in tumor formation.
The re-read of the mouse liver slides of the NTP (1978) clearly shows noncancer liver toxicity proceeding tumor formation.
Metabolism saturates at oral doses above 100 mg/kg-day.
1,4-Dioxane is the toxic moiety. 1,4-Dioxane causes a regenerative hyperplasia in rat
and mouse liver ahead of liver tumors in both dose rate and time.
MOA for Trans Fatty Acids
Bringing a risk assessment perspective to a macronutrient – More variables than epidemiology of industrial chemicals – Studies generally not designed to do risk assessment – With what is the TFA replaced? Most replacements (SAT, cis-MUFA,
PUFA) are not neutral – some are beneficial. – If rest of diet held constant, total energy is not constant. – Substantial variability across studies in fatty acid distribution
Focus is on LDL based on the FDA notice, recognizing that
coronary heart disease is much more complex.
What is the shape of the curve relating TFA exposure and LDL-cholesterol levels? Is there a threshold for adverse effect?

26
Brouwer et al. (2010): Change in TFA and LDL vs. cis-MUFAs diet; 39 studies

Biology of LDL Control
27
-0.20
-0.10
0.00
0.10
0.20
0.30
0.40
0.50
0 1 2 3 4 5 6 7 8 9 10 11 TFA-
Asso
ciat
ed L
DL
Cha
nge
(mm
ol/L
)
TFA Change(%en)
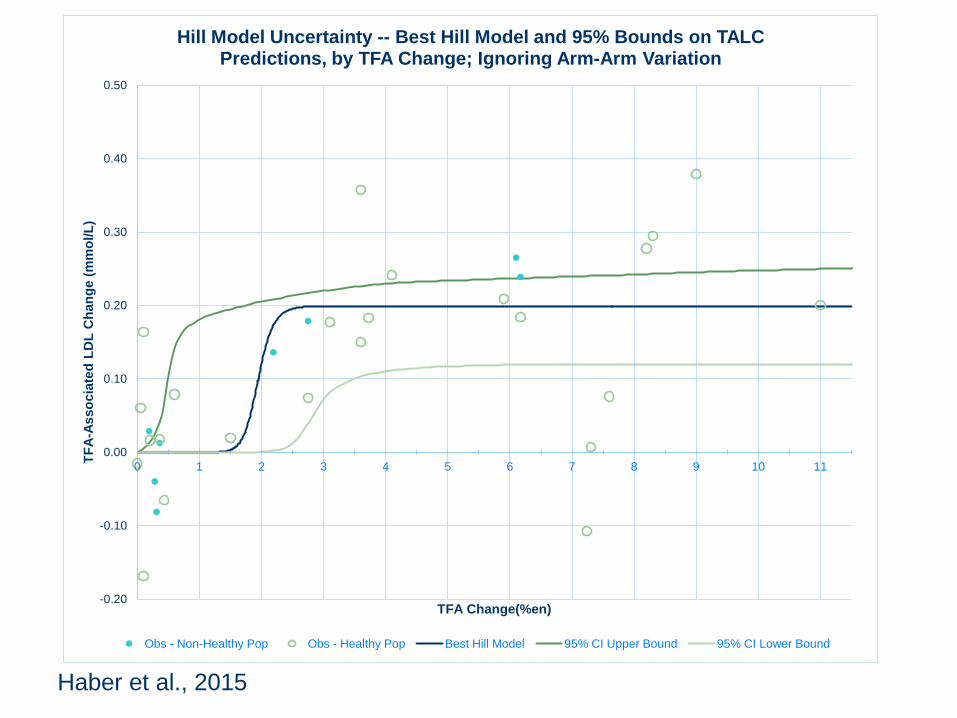
Hill Model Uncertainty -- Best Hill Model and 95% Bounds on TALC Predictions, by TFA Change; Ignoring Arm-Arm Variation
Obs - Non-Healthy Pop Obs - Healthy Pop Best Hill Model 95% CI Upper Bound 95% CI Lower Bound
Haber et al., 2015
-0.20
-0.10
0.00
0.10
0.20
0.30
0.40
0.50
0 0.5 1 1.5 2 2.5 TFA-
Asso
ciat
ed L
DL
Cha
nge
(mm
ol/L
)
TFA Change(%en)
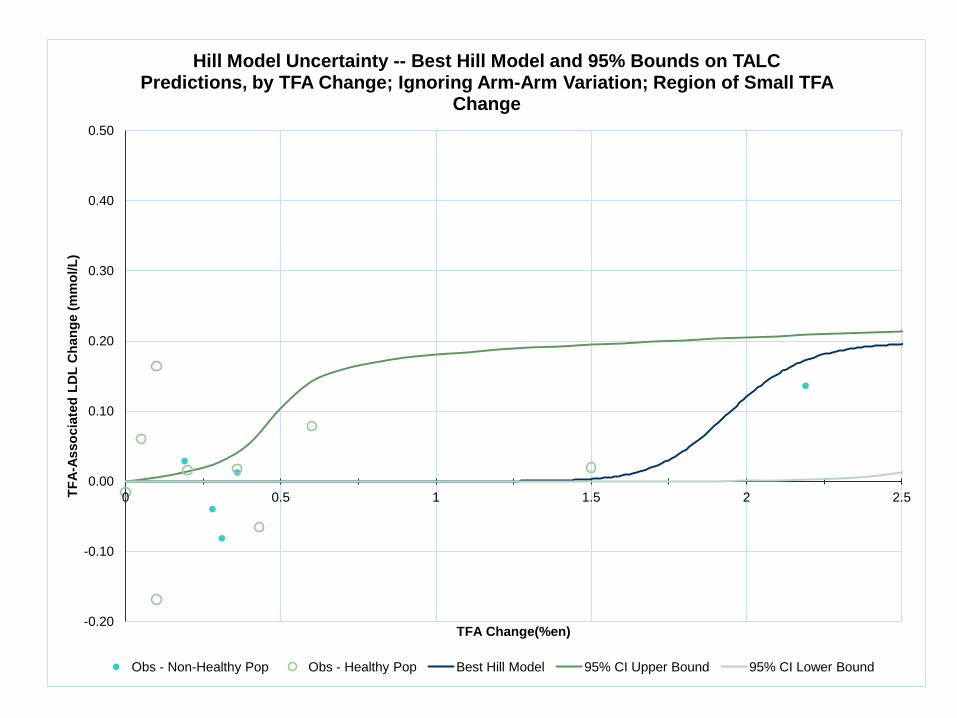
Hill Model Uncertainty -- Best Hill Model and 95% Bounds on TALC Predictions, by TFA Change; Ignoring Arm-Arm Variation; Region of Small TFA
Change
Obs - Non-Healthy Pop Obs - Healthy Pop Best Hill Model 95% CI Upper Bound 95% CI Lower Bound

Low-Dose Studies with Error-bars
30
5
4
6
6
1,3
7
7 8
9
9
10
2
2
2
-0.4
-0.2
0.0
0.2
0.4
0.6
0.0 0.2 0.4 0.6 0.8 1.0 1.2 1.4 1.6 1.8 2.0
LDL
Chan
ge (m
mol
/L)
TFA Change (%en)
Healthy Pop
Non-heathy Pop
Best Hill (p=18)
'Bounding' Alternative (p=5)
1. Lichtenstein et al., 1999 2. Lichtenstein et al., 2006 3. Matthan et al., 2000 4. Judd et al., 1994 5. Judd et al., 1998 6. Judd et al., 2002 7. Vega Lopez et al., 2006 8. Mensink et al., 1990 9. Zock et al., 1994 10. Zock & Katan 1992
Haber et al., 2015
Summary for TFAs
• Elevated LDL levels result from either: – Increased LDL production – Decreased LDL clearance
• A substantial database supports this MOA, although the key events are likely to be interdependent, rather than sequential.
• Both key events are functions of non-linear biological processes including rate-limited pharmacokinetic clearance, receptor mediated transcription and both positive and negative feedback loops

Summary • Mode of action (identification of key & obligatory
steps) is not …Mechanism of action (more detailed understanding at biochemical & molecular level), is also not …Adverse Outcome Pathway.
• Mode of Action is sufficient for risk assessment purposes.
• Defining sufficiency for Mode of Action is a judgment call by experts and incorporates data from multiple sources.
• Peer review is a necessary part of the overall determination of a chemical’s Mode of Action.


![Chemical Engineering Journal - jnu.edu.cn · 2019. 9. 29. · [2–4]. Some emerging AOPs, including electrochemical AOPs, plasma, cavitation based AOPs (ultrasonic), sulfate radical](https://img.pdfslide.us/doc/110x75/6116a51d4dad3b70820480da/chemical-engineering-journal-jnueducn-2019-9-29-2a4-some-emerging.jpg)