Embed Size (px)
Citation preview
Distinct Physicochemical Properties of the First Ceria Monolayeron Cu(111)Lucie Szabova,† Oleksandr Stetsovych,† Filip Dvorak,† Matteo Farnesi Camellone,‡,§,∥ Stefano Fabris,‡,§
Josef Myslivecek,*,‡ and Vladimír Matolín‡
†Faculty of Mathematics and Physics, Charles University, V Holesovickach 2, Praha 8, Czech Republic‡Theory@Elettra group, Istituto Officina dei Materiali, CNR-IOM DEMOCRITOS, s.s. 14 km 163,5 in AREA Science Park,I-34149 Trieste, Italy§SISSA, Scuola Internazionale Superiore di Studi Avanzati, via Bonomea 265, I-34136 Trieste, Italy
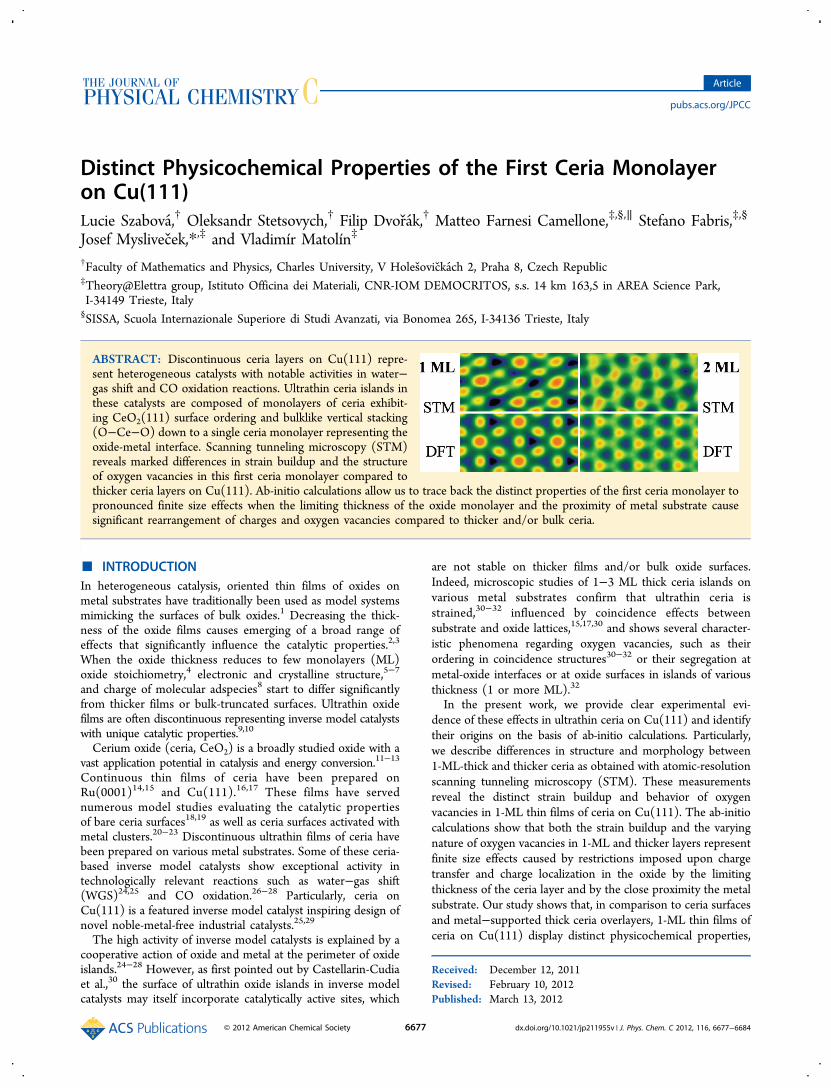
ABSTRACT: Discontinuous ceria layers on Cu(111) repre-sent heterogeneous catalysts with notable activities in water−gas shift and CO oxidation reactions. Ultrathin ceria islands inthese catalysts are composed of monolayers of ceria exhibit-ing CeO2(111) surface ordering and bulklike vertical stacking(O−Ce−O) down to a single ceria monolayer representing theoxide-metal interface. Scanning tunneling microscopy (STM)reveals marked differences in strain buildup and the structureof oxygen vacancies in this first ceria monolayer compared tothicker ceria layers on Cu(111). Ab-initio calculations allow us to trace back the distinct properties of the first ceria monolayer topronounced finite size effects when the limiting thickness of the oxide monolayer and the proximity of metal substrate causesignificant rearrangement of charges and oxygen vacancies compared to thicker and/or bulk ceria.
■ INTRODUCTIONIn heterogeneous catalysis, oriented thin films of oxides onmetal substrates have traditionally been used as model systemsmimicking the surfaces of bulk oxides.1 Decreasing the thick-ness of the oxide films causes emerging of a broad range ofeffects that significantly influence the catalytic properties.2,3
When the oxide thickness reduces to few monolayers (ML)oxide stoichiometry,4 electronic and crystalline structure,5−7
and charge of molecular adspecies8 start to differ significantlyfrom thicker films or bulk-truncated surfaces. Ultrathin oxidefilms are often discontinuous representing inverse model catalystswith unique catalytic properties.9,10
Cerium oxide (ceria, CeO2) is a broadly studied oxide with avast application potential in catalysis and energy conversion.11−13
Continuous thin films of ceria have been prepared onRu(0001)14,15 and Cu(111).16,17 These films have servednumerous model studies evaluating the catalytic propertiesof bare ceria surfaces18,19 as well as ceria surfaces activated withmetal clusters.20−23 Discontinuous ultrathin films of ceria havebeen prepared on various metal substrates. Some of these ceria-based inverse model catalysts show exceptional activity intechnologically relevant reactions such as water−gas shift(WGS)24,25 and CO oxidation.26−28 Particularly, ceria onCu(111) is a featured inverse model catalyst inspiring design ofnovel noble-metal-free industrial catalysts.25,29
The high activity of inverse model catalysts is explained by acooperative action of oxide and metal at the perimeter of oxideislands.24−28 However, as first pointed out by Castellarin-Cudiaet al.,30 the surface of ultrathin oxide islands in inverse modelcatalysts may itself incorporate catalytically active sites, which
are not stable on thicker films and/or bulk oxide surfaces.Indeed, microscopic studies of 1−3 ML thick ceria islands onvarious metal substrates confirm that ultrathin ceria isstrained,30−32 influenced by coincidence effects betweensubstrate and oxide lattices,15,17,30 and shows several character-istic phenomena regarding oxygen vacancies, such as theirordering in coincidence structures30−32 or their segregation atmetal-oxide interfaces or at oxide surfaces in islands of variousthickness (1 or more ML).32
In the present work, we provide clear experimental evi-dence of these effects in ultrathin ceria on Cu(111) and identifytheir origins on the basis of ab-initio calculations. Particularly,we describe differences in structure and morphology between1-ML-thick and thicker ceria as obtained with atomic-resolutionscanning tunneling microscopy (STM). These measurementsreveal the distinct strain buildup and behavior of oxygenvacancies in 1-ML thin films of ceria on Cu(111). The ab-initiocalculations show that both the strain buildup and the varyingnature of oxygen vacancies in 1-ML and thicker layers representfinite size effects caused by restrictions imposed upon chargetransfer and charge localization in the oxide by the limitingthickness of the ceria layer and by the close proximity the metalsubstrate. Our study shows that, in comparison to ceria surfacesand metal−supported thick ceria overlayers, 1-ML thin films ofceria on Cu(111) display distinct physicochemical properties,
Received: December 12, 2011Revised: February 10, 2012Published: March 13, 2012
Article
pubs.acs.org/JPCC
© 2012 American Chemical Society 6677 dx.doi.org/10.1021/jp211955v | J. Phys. Chem. C 2012, 116, 6677−6684
which likely contribute to the enhanced reactivity of ceria-basedinverse model catalysts.
■ METHODS
Experiment. The experiments were performed in an ultrahigh-vacuum system with a base pressure of 1 × 10⁻⁸ Pa.Cu(111) substrates were cleaned by cycles of Ar+ sputteringand annealing in vacuum. Discontinuous CeO2 layers onCu(111) were obtained by evaporation of Ce in a backgroundoxygen atmosphere of 5 × 10⁻⁵ Pa, and substrate temperatureof 400 °C. Ce was evaporated from a Ta crucible heated byelectron bombardment at a rate yielding ∼5 ML/h CeO2 onthe substrate. The amount of CeO2 on Cu(111) on the sampleswas up to 0.5 ML. Oxygen background was established ∼2 minbefore starting the Ce deposition. Immediately after deposition,sample heating was switched off for best preservation of growthshapes of the ceria islands. Oxygen atmosphere was pumpedout when the sample temperature dropped below 100 °C.Samples were investigated at room temperature in a
homemade STM using chemically etched tungsten tips. STMimages were obtained tunneling the electrons into unoccupiedstates of the sample. STM data were processed using open-source software Gwyddion.33
Some of the atomically resolved images in this study wereobtained on samples prepared alternatively by titrating anoxidized Cu(111) surface with minute amounts of Ce (less than0.1 ML) without oxygen background. Ce reduces the surfacecopper oxide, yielding sparse ceria islands and extended areas ofunoxidized Cu(111) favorable for the stabilization of the STMtip. Properties of ceria islands discussed in the present studyremain the same for both methods of sample preparation.Calculation. The spin-polarized calculations were based on
density functional theory (DFT and DFT+U)34 and employedthe Perdew−Burke−Ernzerhof exchange and correlation func-tional.35 They were performed in the plane-wave pseudopotentialmethod as implemented in the PWscf code of the QuantumESPRESSO distribution.36 Following our previous DFT+Uanalysis on ceria-based materials,37−44 we set the value of theparameter U acting on the Ce 4f states to 4.5 eV, which isconsistent with the literature for this system, reporting valuesbetween 4.5 and 5 eV.39,45−49 The plane-wave basis set and therepresentation of the electron density were limited by theenergy cutoffs of 30 and 300 Ry, respectively. The interactionof the valence electrons with the ionic cores was represented byVanderbilt ultrasoft pseudopotentials. Integrals in the Brillouinzone of the supercell slab described below were performed on aMonkhorst−Pack (4 × 4 × 1) k-point mesh and by using aMethfessel−Paxton smearing of 0.02 Ry. Convergency of theresults with respect to the computational parameters was deter-mined in a previous work.42,50
The CeO2(111)/Cu(111) interface was modeled by meansof hexagonal and ortorhombic supercells (for stoichiometricand defective films, respectively) comprising 1 or 2 MLs(O−Ce−O trilayer) (2 × 2) CeO2(111) film in contact with afour-layer (3 × 3) Cu(111) slab. The external surfaces wereseparated in the perpendicular direction by 11 Å of vacuum.Shifts of one slab with respect to the other as well as the Cu−Ointerfacial distances were established in a previous work.42 Theatomic positions of the metal/oxide interface and of the ceriathin film were optimized according to the Hellmann−Feynmanforces. During the relaxation, the two bottom Cu layers werekept fixed in their bulk-like position. The lattice parameter of
the free-standing ceria slabs was calculated by relaxing allinternal degrees of freedom for a set of lattice parameters a.
■ RESULTS AND DISCUSSION
STM of Ceria Islands on Cu(111). Orientation of Ceriaon Cu(111). Inverse model catalysts of ceria on Cu(111) areprepared by dosing Ce on Cu(111) substrate in a backgroundatmosphere of 5 × 10⁻⁵ Pa O2 and substrate temperatureabout 400 °C.25,28 The highest chemical activity of these modelcatalysts is observed when approximately 20% of the coppersubstrate is covered by ceria islands.24,25,28 At this coverage andsubstrate temperature, most of the ceria islands are formed byone complete ceria ML (i.e., a vertical stack of interfacial O, Ce,and surface O).17,25,28
For the purpose of the present study, we prepared samples withan increased amount of ceria of about 0.5 ML deposited at 400 °C.The islands are composed of ceria monolayers stacked one on topof each other [Figure 1a].17 The islands are locally 1, 2, and >2 MLthick and allow for a direct comparison of ceria layers with differentthickness in one experiment. Step heights of the islands are 3.1 Åfor 1 ML relative to unoxidized Cu substrate (determined in Cetitration experiment), 3.2 Å for 2 ML relative to 1 ML, and 2.9 Åfor 3 ML relative to 2 ML, corresponding to a stack of completeceria monolayers residing on unoxidized Cu substrate.
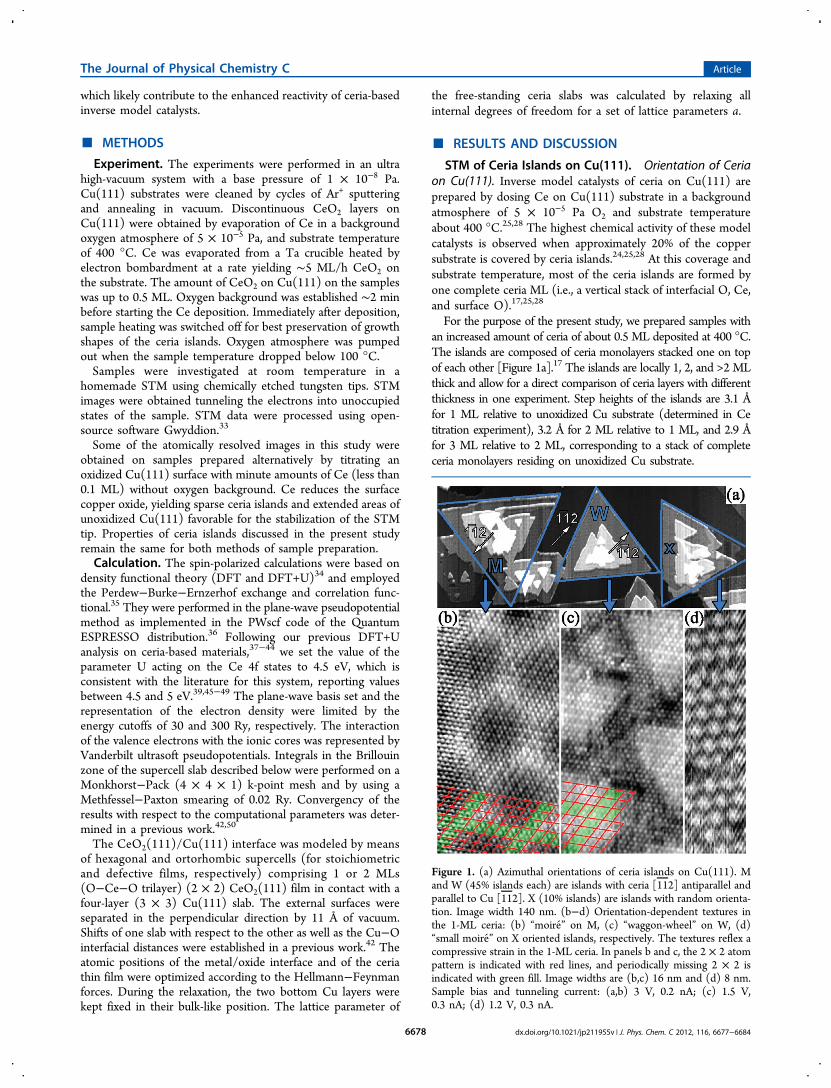
Figure 1. (a) Azimuthal orientations of ceria islands on Cu(111). Mand W (45% islands each) are islands with ceria [112] antiparallel andparallel to Cu [112]. X (10% islands) are islands with random orienta-tion. Image width 140 nm. (b−d) Orientation-dependent textures inthe 1-ML ceria: (b) “moire” on M, (c) “waggon-wheel” on W, (d)“small moire” on X oriented islands, respectively. The textures reflex acompressive strain in the 1-ML ceria. In panels b and c, the 2 × 2 atompattern is indicated with red lines, and periodically missing 2 × 2 isindicated with green fill. Image widths are (b,c) 16 nm and (d) 8 nm.Sample bias and tunneling current: (a,b) 3 V, 0.2 nA; (c) 1.5 V,0.3 nA; (d) 1.2 V, 0.3 nA.
The Journal of Physical Chemistry C Article
dx.doi.org/10.1021/jp211955v | J. Phys. Chem. C 2012, 116, 6677−66846678
The triangular shape of the islands (Figure 1a) differs fromthe hexagonal shape of islands and pits on the surfaces ofthermally equilibrated bulk CeO2(111).
51 Islands on equili-brated ceria surfaces are delimited by the equal proportion ofstraight monolayer-high steps in [112 ] and [112] directions,indicating that the free energy of the (112 ) and (112) steps onceria are very comparable.51 The triangular shape of islands inour experiment is rather a result of the different propagationspeeds of these two steps under kinetic conditions, delimited bya slow-propagating step.52,53
The triangular shape and orientation of the island is trans-ferred from the first monolayer to higher monolayers. Thisindicates that the islands are coherent single crystals of ceria.Ceria islands exhibit different azimuthal orientations withrespect to the copper surface. Two major populations of islands(45% islands each) are represented by islands that are mutuallyrotated by 180°. These islands are marked “M” and “W” inFigure 1 (a). Previous investigations of CeO2(111)/Cu(111)showed that the main crystallographic directions of ceria layercorrespond to that of the copper substrate.16 Thus, the ceria[112] direction must be parallel and antiparallel to the Cu[112] direction in M and W islands. A small number of ceriaislands (10%) show a random azimuthal orientation. Anexample of such island is marked “X” in Figure 1a.In a more detailed view, STM on the 1-ML ceria film reveals
two characteristic patterns: one extending, on the lateral scale,for several nanometers (cf. Figure 1b−d), and the other rangingin the order of angstroms (cf. Figure 2a,b). These patterns arelargely suppressed or absent on the 2-ML or thicker ceria films(cf. Figure 2c). These patterns allow us to draw conclusionsabout the metal−oxide interaction, the strain buildup, and the
localization of oxygen vacancies that are very specific for thefirst ceria monolayer on Cu(111).
1-ML Ceria: Strain. Morphological patterns on the lateralscale of nanometers can be traced back to the coincidenceeffects between ceria and the metal substrate.15,17,28,30,31 Weobserve that these patterns in CeO2/Cu(111) are stronglydependent on the azimuthal orientation of oxide islands.Typical morphologies observed by STM in the first monolayerceria in M-, W-, and X-oriented islands are shown in Figure 1b−d.The atomically resolved images were low pass-filtered toremove noise induced by frequent tip−sample interactions. Thechange of the morphological pattern between M and W islandsreveals the extent of the metal−oxide interaction in CeO2/Cu(111). For obtaining a change in the geometry of in CeO2/Cu(111) upon 180° rotation of the oxide, at least twomonolayers of Cu must interact with the oxide (cf. Figure 5).The STM pattern on the 1-ML ceria in M-oriented islands
(Figure 1b) corresponds to the moire-like coincidence of sub-strate and adsorbate (111) planes with dissimilar lattice con-stant observed in many substrate−adsorbate systems.54 In spiteof the fact that ceria is expected to grow on Cu(111) pseudo-morphically in an almost ideal 2:3 relation with a negligible0.2% expansion of ceria, electron diffraction experiments onceria on Pt(111)32 and on Cu(111)55 reveal contraction of theultrathin ceria films. On the basis of the periodicity of the moire pattern, we estimate the contraction of the 1-ML ceria onCu(111) to 3.2 ± 0.3%. Atomic resolution obtained within themoire pattern allows for determining minute deviations in theazimuthal orientations between the substrate and the oxide.56
Within the precision of our measurement, we make an upperestimate of the rotation between the lattices of Cu and ceriaof 0.5°.The morphology of the first ceria monolayer in W-oriented
islands (Figure 1c) corresponds to a “waggon-wheel” super-structure, which is a generalized moire superstructure.57 Theatomically resolved detail in Figure 1c shows a larger periodicitythan the moire structure on M islands (Figure 1b). However,on most W areas, the waggon-wheel superstructure features aperiodicity matching the moire pattern on M islands. Thus, wedo not detect major differences in the ceria contraction and/or rota-tion with respect to substrate in M and W islands, respectively.The differences between superstructures in M and W islands
can be discussed in terms of different relaxations of oxide andmetal atoms. Indeed, changes in the registry of substrate andoxide atoms by a fraction of the interatomic distance signifi-cantly influence the STM contrast in ultrathin oxide films onmetals.30,54 We propose that the relaxations of oxide atoms inM islands are minimal because the moire pattern is already ob-tained for isotropic (111) lattices. In W islands, the relaxationsof oxide atoms may be more pronounced to induce a departurefrom the moire pattern toward the waggon-wheel pattern.The morphology of the 1-ML ceria in X islands shows many
variations strongly depending on the actual azimuthalorientation of the islands. An example of a moire-like patternwith a periodicity of 1.2 nm is shown in Figure 1d. However, withcomparable probability, the first ceria monolayer in X islandsshows stripe patterns, random height modulation, or no heightmodulation, all on different islands within a single sample.
1-ML Ceria: Oxygen Vacancies. Apart from patterns on thenanometer scale, 1-ML ceria in M and W islands showsmodification to the 1 × 1 atom pattern of CeO2(111). We iden-tify areas of 2 × 2 reconstruction (Figure 1b,c, red lines) thatare locally, and in registry with the moire pattern, interleaved
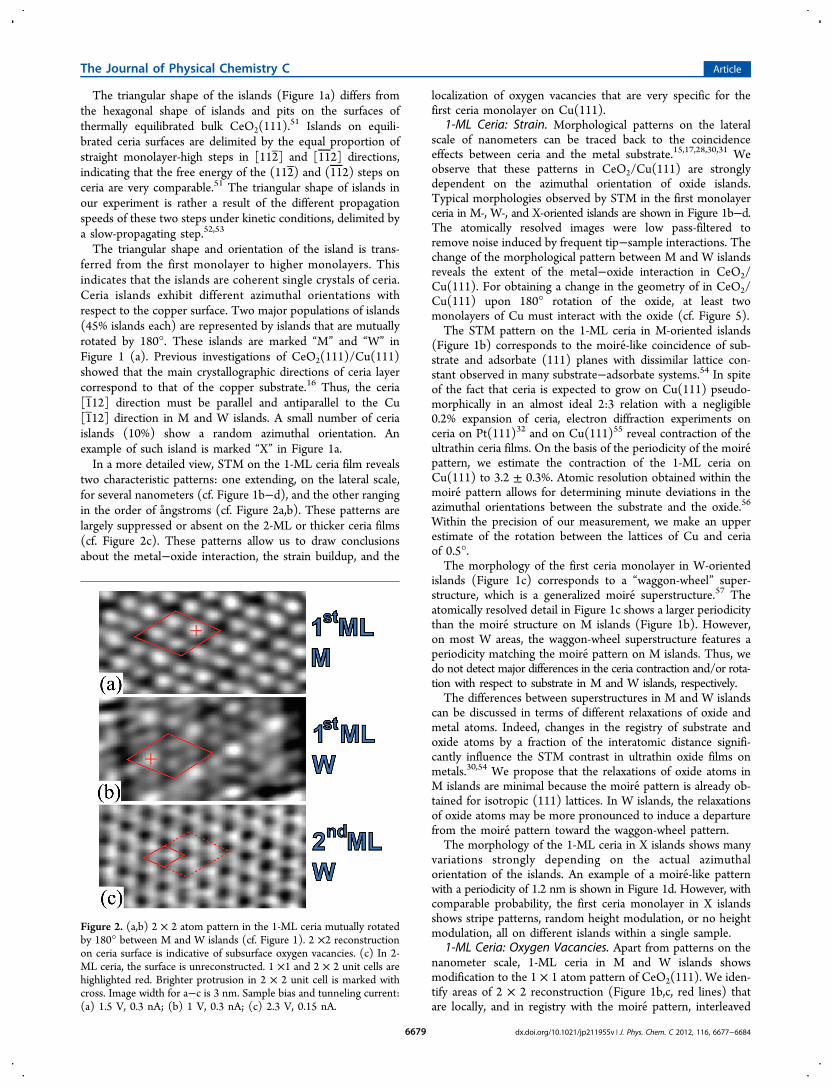
Figure 2. (a,b) 2 × 2 atom pattern in the 1-ML ceria mutually rotatedby 180° between M and W islands (cf. Figure 1). 2 ×2 reconstructionon ceria surface is indicative of subsurface oxygen vacancies. (c) In 2-ML ceria, the surface is unreconstructed. 1 ×1 and 2 × 2 unit cells arehighlighted red. Brighter protrusion in 2 × 2 unit cell is marked withcross. Image width for a−c is 3 nm. Sample bias and tunneling current:(a) 1.5 V, 0.3 nA; (b) 1 V, 0.3 nA; (c) 2.3 V, 0.15 nA.
The Journal of Physical Chemistry C Article
dx.doi.org/10.1021/jp211955v | J. Phys. Chem. C 2012, 116, 6677−66846679
with stripes showing rather 3 × 2 reconstruction (Figure 1b,c,green fill). On M islands, regular 2 × 2 or 3 × 2 patterns coverthe entire surface of the 1-ML ceria. On W islands, the 2 × 2 or3 × 2 is localized among less ordered areas.A detailed view of the 2 × 2 reconstruction in M and W
islands is shown in Figure 2a,b, respectively. The images wereband-pass-filtered to remove noise and the nanometer-scalemodulation. A unit cell of the 2 × 2 reconstruction is marked inboth images. The unit cell includes one bright and three darkerprotrusions as well as one darker and three brighter depres-sions. The unit cell is rotated by 180° between M and W islandsin accordance with the orientation of the ceria layer in theseislands. The 2 × 2 reconstructions on the surface of bulk ceria58
as well as on thin ceria films32 have been interpreted as a finger-print of subsurface oxygen vacancies. This allows us to proposethat the first ceria monolayer on Cu(111) includes oxygenvacancies at the ceria/Cu interface. Given the long-range peri-odicity of the 2 × 2 pattern, the vacancies form a regular arrayperturbed locally (in 3 × 2 areas) by coincidence effectsbetween substrate and oxide layer.2-ML Ceria. In 2 ML thick areas of both M and W islands,
the 2 × 2 surface reconstruction cannot be observed (cf. Figure 2cfor the W island). This indicates a different behavior of oxygenvacancies in 2-ML and thicker ceria similar to observations ofultrathin ceria on Pt.32 From the patterns on the nanometerscale observed in 1-ML ceria (Figure 1) only moire on Mislands becomes partly visible in 2-ML ceria. This indicates asignificantly reduced influence of the substrate. The moire in2-ML ceria reveals a reduced contraction of 2.4 ± 0.3%.DFT Simulations. Strain Analysis and Defects Energetics.
The experimentally observed moire pattern on the 1-ML ceriafilm points to a contraction of the ceria layer with respect to itsequilibrium bulk lattice parameter. Our DFT calculations showthat this is a size effect stemming from the confined dimensionsof the slab in the perpendicular direction. Indeed, the latticeparameter a of an unsupported 1-ML ceria slab turns out to besmaller than the bulk CeO2 value (a0) by 6.7% (Table 1). On
one hand, this contraction in the lattice parameter of thin ceriafilms quickly decreases as a function of the number of layers:the difference is reduced to 3.7% already for a 2 ML ceria slab.On the other hand, the strain is considerably reduced by thepresence of O defects and reduced Ce ions as shown by thesmaller contractions displayed by unsupported defective CeO(1.75)
(4.1%) and Ce2O3 (2.8%) monolayers. Our calculations thereforeprovide evidence of the lateral contraction of thin stoichiometricceria films with respect to bulk CeO2 and demonstrate that oxygenvacancies together with reduced Ce3+ ions in the slab allow forreducing the lattice mismatch between 1-ML ceria films and thecopper crystal. Thicker stoichiometric 2 ML CeO2 slabs display amuch smaller contraction than 1 ML CeO2. Ceria films thicker
than 1 ML can therefore yield small strain build-up at theinterfaces with Cu(111), even in the absence of crystal andelectron defects.The 1-ML ceria thin films present a completely different
behavior than thicker ceria films with respect to the location ofO vacancies. The calculated relative energetics of an O vacancyin the symmetry-inequivalent sites of 1- and 2-ML CeO2/Cusystems is reported in Table 2. The symmetry-inequivalent sites
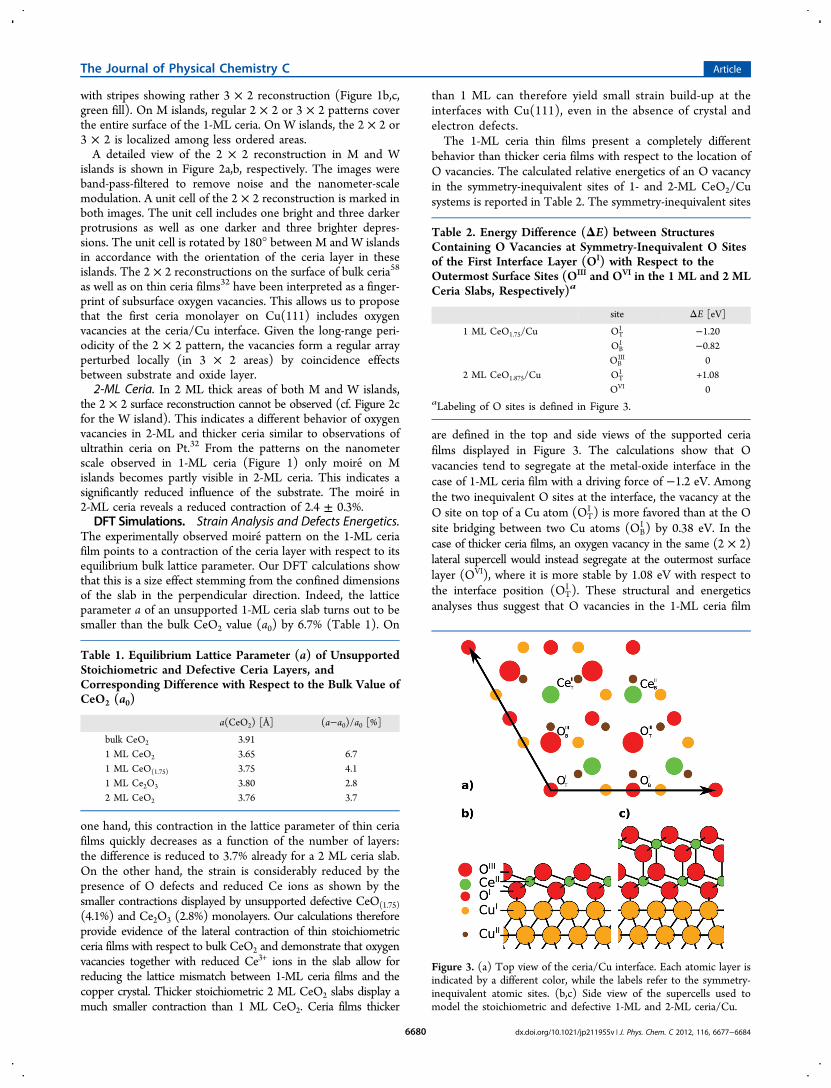
are defined in the top and side views of the supported ceriafilms displayed in Figure 3. The calculations show that Ovacancies tend to segregate at the metal-oxide interface in thecase of 1-ML ceria film with a driving force of −1.2 eV. Amongthe two inequivalent O sites at the interface, the vacancy at theO site on top of a Cu atom (OT
I ) is more favored than at the Osite bridging between two Cu atoms (OB
I ) by 0.38 eV. In thecase of thicker ceria films, an oxygen vacancy in the same (2 × 2)lateral supercell would instead segregate at the outermost surfacelayer (OVI), where it is more stable by 1.08 eV with respect tothe interface position (OT
I ). These structural and energeticsanalyses thus suggest that O vacancies in the 1-ML ceria film
Table 1. Equilibrium Lattice Parameter (a) of UnsupportedStoichiometric and Defective Ceria Layers, andCorresponding Difference with Respect to the Bulk Value ofCeO2 (a0)
a(CeO2) [Å] (a−a0)/a0 [%]
bulk CeO2 3.911 ML CeO2 3.65 6.71 ML CeO(1.75) 3.75 4.11 ML Ce2O3 3.80 2.82 ML CeO2 3.76 3.7
Table 2. Energy Difference (ΔE) between StructuresContaining O Vacancies at Symmetry-Inequivalent O Sitesof the First Interface Layer (OI) with Respect to theOutermost Surface Sites (OIII and OVI in the 1 ML and 2 MLCeria Slabs, Respectively)a
site ΔE [eV]
1 ML CeO1.75/Cu OTI −1.20
OBI −0.82
OBIII 0
2 ML CeO1.875/Cu OTI +1.08
OVI 0aLabeling of O sites is defined in Figure 3.
Figure 3. (a) Top view of the ceria/Cu interface. Each atomic layer isindicated by a different color, while the labels refer to the symmetry-inequivalent atomic sites. (b,c) Side view of the supercells used tomodel the stoichiometric and defective 1-ML and 2-ML ceria/Cu.
The Journal of Physical Chemistry C Article
dx.doi.org/10.1021/jp211955v | J. Phys. Chem. C 2012, 116, 6677−66846680
reduce the lateral strain and that they are located at the metal/oxide interface. As a consequence of the strong preferentialinterface segregation, O vacancies are predicted to be subsur-face in the 1-ML ceria films.Electronic and Atomistic Structures. The analysis of the
electronic structure allows one to explain the fundamentaldifference in the O-vacancy segregation at the interfacebetween 1- and 2-ML ceria films reported above. The interfacebetween the stoichiometric thin ceria film and a copper surfacedisplays a charge transfer from the metal to the oxide, yieldingelectron localization and reduction of all the interfacial Ce ionsto Ce3+. This interfacial effect, observed also in the case ofthicker ceria films,42 is clearly displayed by the spin polarizationof the cerium atoms (see spin density in Figure 4) and by thecharge population analysis of the Cu atoms reported in Table 3.The latter shows the difference of the Lowdin charge of the Cuatoms with respect to the bulk value. For the case of thestoichiometric 1-ML CeO2/Cu system, the data clearly supportthe charge depletion (oxidation) of the Cu atoms in the first
interfacial layer (CuI) with respect to the deeper and bulk-likemetal atoms (CuII and CuIII). The Cu atoms displaying the largestvariations are the closest to the interfacial O atoms, namely, theCu atom with an O atom on top labeled as CuI(OT
I ), and the sixconnected to a bridging O labeled as CuI(OB
I ). The Cu atomsfurther from and in hollow position with respect to the interfacialO atoms are also reduced but by a minor extent.
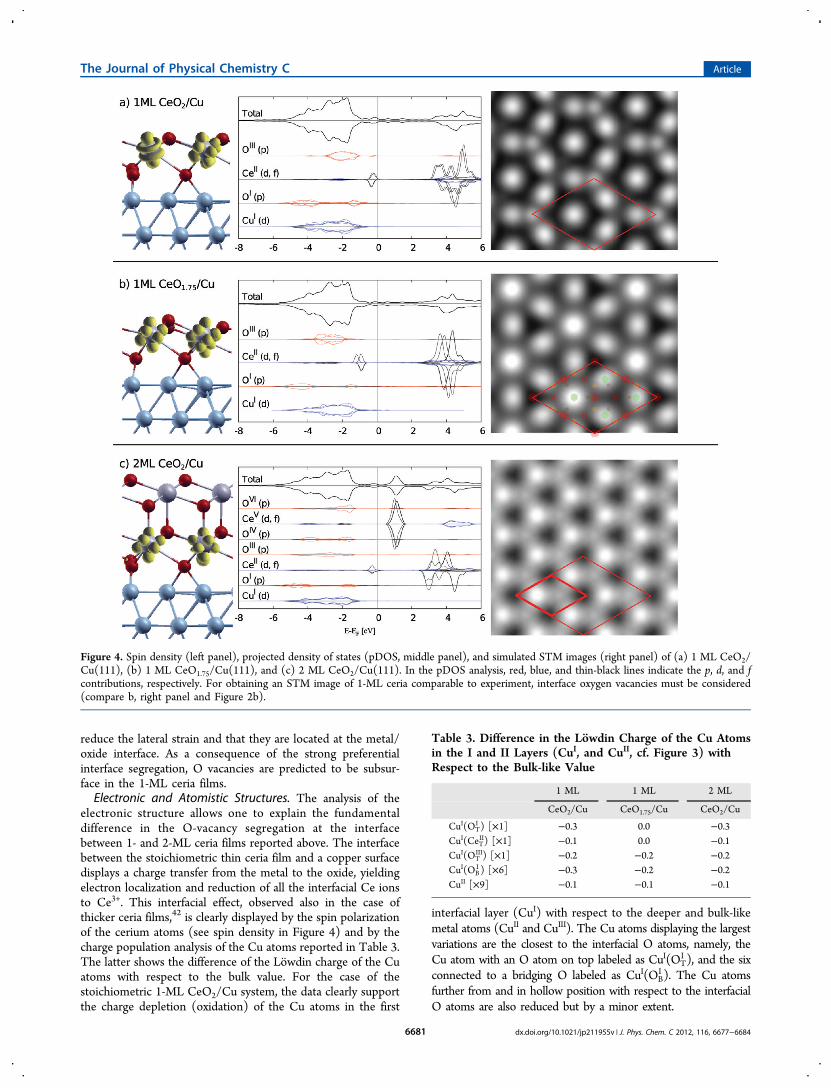
Figure 4. Spin density (left panel), projected density of states (pDOS, middle panel), and simulated STM images (right panel) of (a) 1 ML CeO2/Cu(111), (b) 1 ML CeO1.75/Cu(111), and (c) 2 ML CeO2/Cu(111). In the pDOS analysis, red, blue, and thin-black lines indicate the p, d, and fcontributions, respectively. For obtaining an STM image of 1-ML ceria comparable to experiment, interface oxygen vacancies must be considered(compare b, right panel and Figure 2b).
Table 3. Difference in the Lowdin Charge of the Cu Atomsin the I and II Layers (CuI, and CuII, cf. Figure 3) withRespect to the Bulk-like Value
1 ML 1 ML 2 ML
CeO2/Cu CeO1.75/Cu CeO2/Cu
CuI(OTI ) [×1] −0.3 0.0 −0.3
CuI(CeTII) [×1] −0.1 0.0 −0.1
CuI(OTIII) [×1] −0.2 −0.2 −0.2
CuI(OBI ) [×6] −0.3 −0.2 −0.2
CuII [×9] −0.1 −0.1 −0.1
The Journal of Physical Chemistry C Article
dx.doi.org/10.1021/jp211955v | J. Phys. Chem. C 2012, 116, 6677−66846681
Creating an oxygen vacancy in the bulk or at surfaces of ceriais usually accompanied by the localization of two excess elec-trons at two Ce4+ ions, leading to their reduction to Ce3+.39,49
This is not possible in the case of vacancy formation at the1 ML CeO2/Cu(111) interface, since all the cerium atoms inthe film are already in the 3+ state. The excess charge origi-nating from the presence of the O vacancy turns out to belocalized at the metallic Cu/oxide interface. This is supportedby the calculated charge analysis for the defective 1 ML CeO(1.75)film (Table 3), which indicates an excess of charge at the interfacialCu atoms with respect to the stoichiometric case. In particular, theCu atom displaying the largerst variation is the one directly belowthe O vacancy, CuI(OT
I ), while the charge on the other Cu atomsis only marginally affected by the presence of the vacancy. Afurther support of this effect is given by the calculated densityof electronic states of the 1 ML CeO2/Cu and CeO1.75/Cusystems (Figure 4), displaying the same degree of reduction ofthe four Ce ions, but a different position of the Fermi levelcrossing the Cu s-band.A thicker 2-ML ceria film displays behavior opposite to that
of the 1-ML case with respect to the position of O vacancies.Our calculations predict that this difference has an electronicorigin. The spin density (Figure 4c, left panel) shows that theeffect of the interface on the reduction of the cerium atomsextends up to the first monolayer, while the second monolayeris formed exclusively by Ce4+ atoms. Reduced thicker ceria filmscan therefore easily localize the excess electrons on the Ce4+
sites of its second monolayer.The difference between supported 1- and 2-ML ceria films is
also apparent in the local atomistic structures of the surfaceatoms, whose electronic states are probed by the STM tip. Thelocal structure of the stoichiometric 1-ML ceria film isschematically shown in Figure 3a. The OT
I site has a differentlocal environment than the other three interfacial OB
I atoms,which are at the bridge position between two copper atoms.The same applies also to the other atomic layers in ceria slabcausing one of the four atomic sites, CeT
II and OTIII, to be
symmetry inequivalent from the other three, CeBII and OB
III,respectively. The equilibrium bondlengths at the interface aresix 2.05 Å Cu−OB
I bonds and one 1.91 Å Cu−OTI bond. Due to
the presence and periodicity of the underlying copper atoms,the one symmetry-inequivalent O atom (OT
I ) relaxes away fromthe interface by 0.35 Å. This displaces outward the threeneighboring cerium atoms CeB
II by 0.11 Å with respect to theother cerium atom in the supercell (CeT
II). The coherent andstoichiometric 1 ML CeO2/Cu interface therefore inducesstructural changes that differentiate one of the four O and Ceatoms in each atomic layer up to the surface plane, thusresulting in an effective (2 × 2) periodicity at the surface of thethin film.The presence of the O vacancy at the OT
I interfacial site ofthe 1 ML CeO(1.75)/Cu(111) system has a qualitatively similarbut more pronounced effect on the outermost surface atoms.The lowest-energy site for vacancy formation is in fact the mostsymmetrical OT
I site. The O vacancy induces a shift of the threeneighboring cerium atoms away (both in the vertical (by 0.31 Å)and horizontal (by 0.12 Å) directions). The other CeT
II atom isnot only geometrically distinct from the other CeB
II three, but isthe only one that is 6-fold coordinated. At the interface, thisatom repulses the neighboring interface oxygen atoms by 0.23 Å,leading to an increase of the six interface Cu−OB
I bonds to 2.09 Å.At the surface, one OT
III atom protrudes by 0.43 Å with respectto the other three surface OB
III oxygen atoms. Therefore, also in
this case, the surface of the thin film has an effective (2 × 2)structural periodicity.However, for the case of thicker films, the structural effects of
the interface do not propagate up to the surface atoms. Thestoichiometric thicker (2-ML) ceria film displays the sameinterface structure of the 1-ML case, but the structuraldifferentiation of one atom in each atomic layer is negligiblefor the outermost O−Ce−O trilayer, and the surface of thesupported film has an effective (1 × 1) periodicity, both interms of local atomistic and electronic structures.
Simulated STM Images. This different periodicity of 1-MLand 2-ML supported ceria films is reflected in the simulatedSTM images reported in Figure 4. In order to allow for a directcomparison with the experiment (measured at positive bias),we report in the figure the STM images calculated for theunoccupied states. In these conditions, the bright spots areassociated with the Ce ions, as clearly shown by the pDOSreported in the middle panels of Figure 4 for the Ce and Oatoms. In the energy window relevant for the comparison withexperiment, the contribution of the oxygen states is negligible.A representative simulated STM image for the 1 ML CeO2/
Cu system is displayed in Figure 4a, and presents importantdifferences with the experimental micrograph of Figure 2a,b. Inparticular, the simulated STM image displays a large darker areaaround the symmetry-inequivalent CeT
II site, which is notobserved in the experimental data. A better agreement is notobtained by calculating the STM image at different biases or byplotting the integrated charge on planes at different distancesfrom the surface. On the other hand, for a wide range of biasesand sample-plane distances (0−3 eV and 0.35−2.0 Å, respectively),the simulated STM image of the defective 1 ML CeO1.75/Cusystem presents a much better agreement with the experiment(Figure 4b). The calculated pattern displays a (2 × 2) peri-odicity of four spots (one of which is brighter than the others)and of two darker areas (one of which is darker than the other).By superimposing the atomic positions on the simulated STMimage, it is possible to associate the brightest spot and darkestareas with the CeT
II and OT atoms, respectively. This similaritybetween the simulated STM image for the defective 1 MLCeO1.75/Cu system and experimental images further supportsthe presence of vacancies at the interface between the 1-MLceria film and copper.Quite differently, the simulated STM image of the 2 ML
CeO2/Cu system (Figure 4c) displays a 1 × 1 pattern ofbrighter and darker spots, which is in very good agreement withthe images of the 2-ML ceria observed in STM. This thereforeconfirms that the 2-ML ceria film is stoichiometric.
Paralell versus Antiparalell Orientation of the 1-ML Film.In the following, we investigate the possible origins of the twotypes of islands experimentally observed. We have so farcalculated and described the most stable structure of the 1 MLCeO1.75/Cu with the oxygen vacancy at the OI1 site where the[112] directions of ceria and copper are antiparallel (“A” inFigure 5). There is another configuration of this 1 ML CeO1.75/Cu interface, in which the two [112] directions are parallel (“P”in Figure 5). Differences between the two orientations arisewhen considering the subsurface copper atoms (brown circles).Calculated atomic relaxation in the P and A orientations aregraphically represented by colored arrows in Figure 5 withmagnitude in angstroms indicated in the insets. Interface Pinduces larger horizontal relaxations than interface A by 0.13 Åfor the interface oxygen atoms and by 0.02 Å for the ceriumatoms. This can be explained by the different interactions of
The Journal of Physical Chemistry C Article
dx.doi.org/10.1021/jp211955v | J. Phys. Chem. C 2012, 116, 6677−66846682
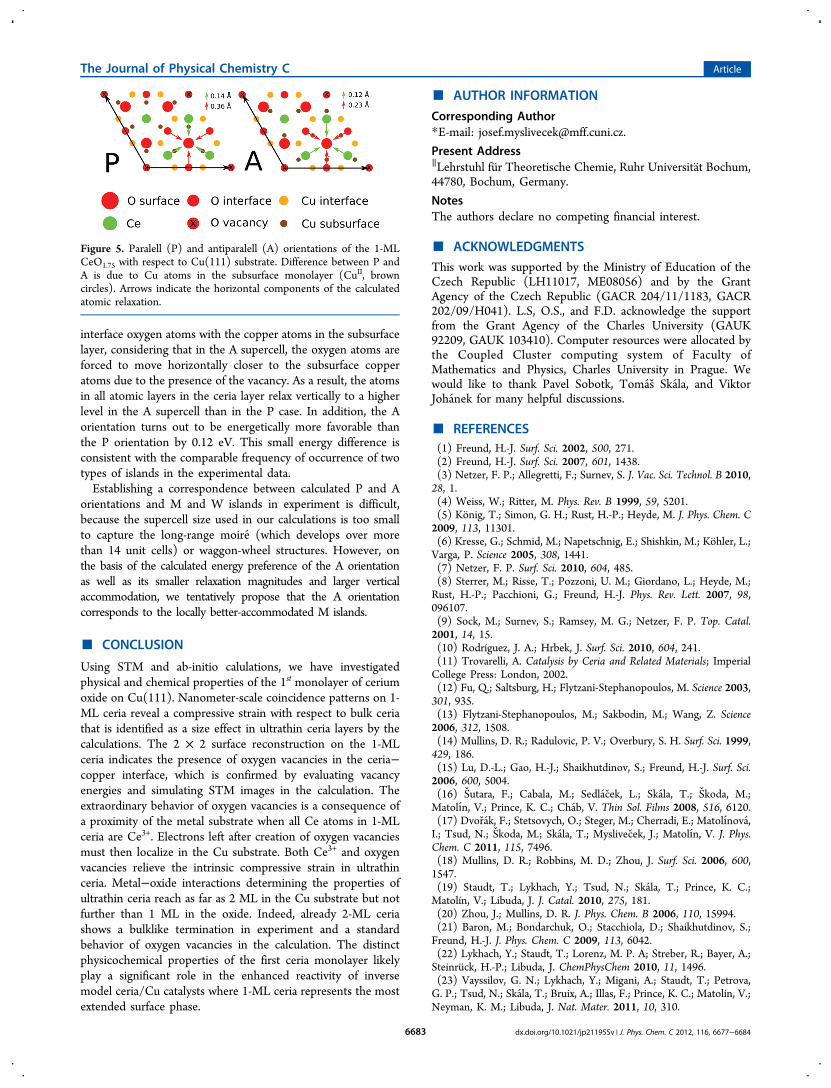
interface oxygen atoms with the copper atoms in the subsurfacelayer, considering that in the A supercell, the oxygen atoms areforced to move horizontally closer to the subsurface copperatoms due to the presence of the vacancy. As a result, the atomsin all atomic layers in the ceria layer relax vertically to a higherlevel in the A supercell than in the P case. In addition, the Aorientation turns out to be energetically more favorable thanthe P orientation by 0.12 eV. This small energy difference isconsistent with the comparable frequency of occurrence of twotypes of islands in the experimental data.Establishing a correspondence between calculated P and A
orientations and M and W islands in experiment is difficult,because the supercell size used in our calculations is too smallto capture the long-range moire (which develops over morethan 14 unit cells) or waggon-wheel structures. However, onthe basis of the calculated energy preference of the A orientationas well as its smaller relaxation magnitudes and larger verticalaccommodation, we tentatively propose that the A orientationcorresponds to the locally better-accommodated M islands.
■ CONCLUSION
Using STM and ab-initio calulations, we have investigatedphysical and chemical properties of the 1st monolayer of ceriumoxide on Cu(111). Nanometer-scale coincidence patterns on 1-ML ceria reveal a compressive strain with respect to bulk ceriathat is identified as a size effect in ultrathin ceria layers by thecalculations. The 2 × 2 surface reconstruction on the 1-MLceria indicates the presence of oxygen vacancies in the ceria−copper interface, which is confirmed by evaluating vacancyenergies and simulating STM images in the calculation. Theextraordinary behavior of oxygen vacancies is a consequence ofa proximity of the metal substrate when all Ce atoms in 1-MLceria are Ce3+. Electrons left after creation of oxygen vacanciesmust then localize in the Cu substrate. Both Ce3+ and oxygenvacancies relieve the intrinsic compressive strain in ultrathinceria. Metal−oxide interactions determining the properties ofultrathin ceria reach as far as 2 ML in the Cu substrate but notfurther than 1 ML in the oxide. Indeed, already 2-ML ceriashows a bulklike termination in experiment and a standardbehavior of oxygen vacancies in the calculation. The distinctphysicochemical properties of the first ceria monolayer likelyplay a significant role in the enhanced reactivity of inversemodel ceria/Cu catalysts where 1-ML ceria represents the mostextended surface phase.
■ AUTHOR INFORMATION
Corresponding Author*E-mail: [email protected].
Present Address∥Lehrstuhl fur Theoretische Chemie, Ruhr Universitat Bochum,44780, Bochum, Germany.
NotesThe authors declare no competing financial interest.
■ ACKNOWLEDGMENTSThis work was supported by the Ministry of Education of theCzech Republic (LH11017, ME08056) and by the GrantAgency of the Czech Republic (GACR 204/11/1183, GACR202/09/H041). L.S, O.S., and F.D. acknowledge the supportfrom the Grant Agency of the Charles University (GAUK92209, GAUK 103410). Computer resources were allocated bythe Coupled Cluster computing system of Faculty ofMathematics and Physics, Charles University in Prague. Wewould like to thank Pavel Sobotk, Tomas Skala, and ViktorJohanek for many helpful discussions.
■ REFERENCES(1) Freund, H.-J. Surf. Sci. 2002, 500, 271.(2) Freund, H.-J. Surf. Sci. 2007, 601, 1438.(3) Netzer, F. P.; Allegretti, F.; Surnev, S. J. Vac. Sci. Technol. B 2010,28, 1.(4) Weiss, W.; Ritter, M. Phys. Rev. B 1999, 59, 5201.(5) Konig, T.; Simon, G. H.; Rust, H.-P.; Heyde, M. J. Phys. Chem. C2009, 113, 11301.(6) Kresse, G.; Schmid, M.; Napetschnig, E.; Shishkin, M.; Kohler, L.;Varga, P. Science 2005, 308, 1441.(7) Netzer, F. P. Surf. Sci. 2010, 604, 485.(8) Sterrer, M.; Risse, T.; Pozzoni, U. M.; Giordano, L.; Heyde, M.;Rust, H.-P.; Pacchioni, G.; Freund, H.-J. Phys. Rev. Lett. 2007, 98,096107.(9) Sock, M.; Surnev, S.; Ramsey, M. G.; Netzer, F. P. Top. Catal.2001, 14, 15.(10) Rodríguez, J. A.; Hrbek, J. Surf. Sci. 2010, 604, 241.(11) Trovarelli, A. Catalysis by Ceria and Related Materials; ImperialCollege Press: London, 2002.(12) Fu, Q.; Saltsburg, H.; Flytzani-Stephanopoulos, M. Science 2003,301, 935.(13) Flytzani-Stephanopoulos, M.; Sakbodin, M.; Wang, Z. Science2006, 312, 1508.(14) Mullins, D. R.; Radulovic, P. V.; Overbury, S. H. Surf. Sci. 1999,429, 186.(15) Lu, D.-L.; Gao, H.-J.; Shaikhutdinov, S.; Freund, H.-J. Surf. Sci.2006, 600, 5004.(16) Sutara, F.; Cabala, M.; Sedlacek, L.; Skala, T.; Skoda, M.;Matolın, V.; Prince, K. C.; Chab, V. Thin Sol. Films 2008, 516, 6120.(17) Dvorak, F.; Stetsovych, O.; Steger, M.; Cherradi, E.; Matolınova,I.; Tsud, N.; Skoda, M.; Skala, T.; Myslivecek, J.; Matolın, V. J. Phys.Chem. C 2011, 115, 7496.(18) Mullins, D. R.; Robbins, M. D.; Zhou, J. Surf. Sci. 2006, 600,1547.(19) Staudt, T.; Lykhach, Y.; Tsud, N.; Skala, T.; Prince, K. C.;Matolín, V.; Libuda, J. J. Catal. 2010, 275, 181.(20) Zhou, J.; Mullins, D. R. J. Phys. Chem. B 2006, 110, 15994.(21) Baron, M.; Bondarchuk, O.; Stacchiola, D.; Shaikhutdinov, S.;Freund, H.-J. J. Phys. Chem. C 2009, 113, 6042.(22) Lykhach, Y.; Staudt, T.; Lorenz, M. P. A; Streber, R.; Bayer, A.;Steinruck, H.-P.; Libuda, J. ChemPhysChem 2010, 11, 1496.(23) Vayssilov, G. N.; Lykhach, Y.; Migani, A.; Staudt, T.; Petrova,G. P.; Tsud, N.; Skala, T.; Bruix, A.; Illas, F.; Prince, K. C.; Matolín, V.;Neyman, K. M.; Libuda, J. Nat. Mater. 2011, 10, 310.
Figure 5. Paralell (P) and antiparalell (A) orientations of the 1-MLCeO1.75 with respect to Cu(111) substrate. Difference between P andA is due to Cu atoms in the subsurface monolayer (CuII, browncircles). Arrows indicate the horizontal components of the calculatedatomic relaxation.
The Journal of Physical Chemistry C Article
dx.doi.org/10.1021/jp211955v | J. Phys. Chem. C 2012, 116, 6677−66846683
(24) Rodriguez, J. A.; Ma, S.; Liu, P.; Hrbek, J.; Evans, J.; Perez, M.Science 2007, 318, 1757.(25) Rodriguez, J. A.; Graciani, J.; Evans, J.; Park, J. B.; Yang, F.;Stacchiola, D.; Senanayake, S. D.; Ma, S.; Perez, M.; Liu, P.; Sanz, J. F.;Hrbek, J. Angew. Chem., Int. Ed. 2009, 48, 8047.(26) Eck, S.; Castellarin-Cudia, C.; Surnev, S.; Prince, K. C.; Ramsey,M. G.; Netzer, F. P. Surf. Sci. 2003, 536, 166.(27) Wrobel, R.; Suchorski, Y.; Becker, S.; Weiss, H. Surf. Sci. 2008,602, 436.(28) Yang, F.; Graciani, J.; Evans, J.; Liu, P.; Hrbek, J.; Sanz, J. F.;Rodriguez, J. A. J. Am. Chem. Soc. 2011, 133, 3444.(29) Hornes, A.; Hungría, A. B.; Bera, P.; Camara, A. L.; Fernandez-Garca, M.; Martínez-Arias, A.; Barrio, L.; Estrella, M.; Zhou, G.;Fonseca, J. J.; Hanson, J. C.; Rodriguez, J. A. J. Am. Chem. Soc. 2010,132, 34.(30) Castellarin-Cudia, C.; Surnev, S.; Schneider, G.; Podlucky, R.;Ramsey, M. G.; Netzer, F. P. Surf. Sci. 2004, 554, L120.(31) Eck, S.; Castellarin-Cudia, C.; Surnev, S.; Ramsey, M. G.;Netzer, F. P. Surf. Sci. 2002, 520, 173.(32) Grinter, D. C.; Ithnin, R.; Pang, C. L.; Thornton, G. J. Phys.Chem. C 2010, 114, 17036.(33) http://gwyddion.net/, accessed on Mar 1, 2012.(34) Cococcioni, M.; de Gironcoli, S. Phys. Rev. B 2005, 71, 035105.(35) Perdew, J. P.; Burke, K.; Ernzherof, M. Phys. Rev. Lett. 1996, 77,3865.(36) Giannozzi, P.; Baroni, S.; Bonini, N.; Calandra, M.; Car, R.;Cavazzoni, C.; Ceresoli, D.; Chiarotti, G. L.; Cococcioni, M.; Dabo, I.;et al. J. Phys.: Condens. Matter 2009, 21, 395502.(37) Fabris, S.; de Gironcoli, S.; Baroni, S.; Vicario, G.; Balducci, G.Phys. Rev. B 2005, 71, 041102.(38) Farnesi Camellone, M.; Fabris, S. J. Am. Chem. Soc. 2009, 131,10473.(39) Fabris, S.; Vicario, G.; Balducci, G.; de Gironcoli, S.; Baroni, S.J. Phys. Chem. B 2005, 109, 22860−22867.(40) Huang, M.; Fabris, S. Phys. Rev. B 2007, 75, 081404.(41) Huang, M.; Fabris, S. J. Phys. Chem. C 2008, 112, 8643−8648.(42) Szabova, L.; Farnesi Camellone, M.; Huang, M.; Matolín, V.;Fabris, S. J. Chem. Phys. 2010, 133, 234705.(43) Colussi, S.; Gayen, A.; Farnesi Camellone, M.; Boaro, M.;Llorca, J.; Fabris, S.; Trovarelli, A. Angew. Chem. 2009, 48, 8481−8484.(44) Wang, X.; Shen, M.; Wang, J.; Fabris, S. J. Phys. Chem. C 2010,114, 10221−10228.(45) Nolan, M.; Grigoleit, S.; Sayle, D. C.; Parker, S. C.; Watson,G. W. Surf. Sci. 2005, 576, 217−229.(46) Loschen, C.; Carrasco, J.; Neyman, K. M.; Illas, F. Phys. Rev. B2007, 75, 035115.(47) Nolan, M.; Watson, G. J. Phys. Chem. B 2006, 110, 16600.(48) Zhang, C.; Michaelides, A.; King, D.; Jenkins, S. J. J. Chem. Phys.2008, 129, 194708.(49) Ganduglia-Pirovano, M. V.; Da Silva, J. L. F.; Sauer, J. Phys. Rev.Lett. 2009, 102, 026101.(50) Szabova, L. M.Sc. Thesis, Faculty of Mathematics and Physics,Charles University, Prague, 2009(51) Torbrugge, S.; Cranney, M.; Reichling, M. Appl. Phys. Lett.2008, 93, 073112.(52) Michely, T.; Hohage, M.; Bott, M.; Comsa, G. Phys. Rev. Lett.1993, 70, 3943.(53) Voigtlander, B.; Kastner, M.; Smilauer, P. Phys. Rev. Lett. 1998,81, 858.(54) Galloway, H. C.; Sautet, P.; Salmeron, M. Phys. Rev. B 1996, 54,R11145.(55) Masek, K.; Beran, J.; Matolın, V. Submitted to Appl. Surf. Sci.(56) Galloway, H. C.; Benítez, J. J.; Salmeron, M. Surf. Sci. 1993, 298,127.(57) Sedona, F.; Agnoli, S.; Granozzi, G. J. Phys. Chem. B 2006, 110,15359.(58) Torbrugge, S.; Reichling, M.; Ishiyama, A.; Morita, S.; Custance,O. Phys. Rev. Lett. 2007, 99, 056101.
The Journal of Physical Chemistry C Article
dx.doi.org/10.1021/jp211955v | J. Phys. Chem. C 2012, 116, 6677−66846684