Embed Size (px)
Citation preview

2005-08 Final Report
Distillate Usage Patterns in Minnesota: Development of Data and Tools to Analyze
Policies Affecting Biodiesel Usage
Research

Technical Report Documentation Page 1. Report No. 2. 3. Recipients Accession No.
MN/RC – 2005-08 4. Title and Subtitle 5. Report Date
January 2005 6.
Distillate Usage Patterns in Minnesota: Development of Data and Tools to Analyze Policies Affecting Biodiesel Usage
7. Author(s) 8. Performing Organization Report No.
Doug Tiffany
9. Performing Organization Name and Address 10. Project/Task/Work Unit No.
11. Contract (C) or Grant (G) No.
University of Minnesota Department of Applied Economics 1994 Buford Avenue St. Paul, MN 55108-6040 (c) 81655 (wo) 55
12. Sponsoring Organization Name and Address 13. Type of Report and Period Covered
Final Report 14. Sponsoring Agency Code
Minnesota Department of Transportation Research Services Section 395 John Ireland Boulevard Mail Stop 330 St. Paul, Minnesota 55155
15. Supplementary Notes
http://www.lrrb.org/PDF/200508.pdf 16. Abstract (Limit: 200 words)
Biodiesel is a renewable fuel derived from vegetable oils or animal fats that can substitute for diesel fuel in engines or fuel oil in furnaces. Biodiesel is produced by the process of transesterification, a simple chemical process that breaks individual triglyceride molecules into three molecules of methyl esters consisting of long chain fatty acids, similar to diesel derived from petroleum. Biodiesel has proven lubricity benefits at low blends, which will be important when sulfur levels are reduced in the U.S. supply of diesel in 2006. In addition, blends of biodiesel and its usage in a pure form reduce particulate matter (PM), volatile organic compounds (VOC), as well as other toxic gases and Greenhouse Gases (GHG). Reduced emissions from biodiesel blends result from its zero sulfur content and higher oxygen content versus petro-diesel. Federal standards established by the U.S. Environmental Protection Agency (EPA) may force local authorities to implement a variety of policies to reduce VOC’s, one of the precursors of ground level ozone formation, and other toxic emissions. There is also substantial concern among public health professionals concerning the formation of particulate matter (PM) from diesel engines, especially when originating from school buses, transit buses, and diesel-powered electrical generators.
17. Document Analy sis/Descriptors 18.Availability Statement
Biodiesel Diesel fuel VOC
EPA Emissions Ozone
No restrictions. Document available from: National Technical Information Services, Springfield, Virginia 22161
19. Security Class (this report) 20. Security Class (this page) 21. No. of Pages 22. Price
Unclassified Unclassified 46

Distillate Usage Patterns in Minnesota: Development of Data and Tools to
Analyze Policies Affecting Biodiesel Usage
Final Report
Prepared by:
Douglas G. Tiffany Department of Applied Economics
University of Minnesota
January 2005
Published by: Minnesota Department of Transportation
Research Services Section 395 John Ireland Boulevard, MS 330
St. Paul, MN 55155
This research was conducted under a contract issued by Minnesota Department of Transportation and administered through that department and the Center for Transportation Studies at the University of Minnesota. This report represents the results of research conducted by the author and does not necessarily represent the view or policy of the Minnesota Department of Transportation and/or the Center for Transportation Studies. This report does not contain a standard or specified technique.

Acknowledgments
The following individuals provided valuable input and guidance in the course of Technical Advisory Panels convened to guide this research effort: Mr. Bob Gale, Technical Liaison, Mn/DOT Ms. Barb Loida, Administrative Liaison, Mn/DOT Dr. Jerry Fruin, P.I., Department of Applied Economics, University of Minnesota Mr. Dana Albers, Hennepin County - Fleet Operations Mr. Ken Bickel, Center for Diesel Research, University of Minnesota Mr. David Blatnik, Marathon-Ashland Refining Mr. Rodney Christianson, Minnesota Soybean Processors Mr. William Gardner, Mn/DOT Mr. Ralph Groschen, Minnesota Department of Agriculture Mr. John Howard, Mn/DOT Mr. Darin Hunhoff, CHS Inc., Mr. Dan Murray, American Transportation Research Institute Mr. Mike Youngerberg, Minnesota Soybean Processors The following individuals were very helpful in providing data and answering questions concerning distillate usage: Ms. Marge Noll, Minnesota Dept of Public Safety – IRP & IFTA Ms. Penny Blaeser, Minnesota Department of Public Safety Ms. Sheila Tatone, Minnesota Department of Public Safety Mr. Richard Lambert, Mn/DOT Ms. Brenda Lockman, Minnesota Department of Revenue Mr. Brian Timerson, Minnesota Pollution Control Agency Mr. Jeff McGrath, U.S. Army Corps of Engineers, St. Paul District Mr. David Grier, U.S. Army Corps of Engineers Mr. David Christenson, Metropolitan Transit Ms. Linda Schroeder, Minnesota Department of Education Ms. Susan Medhaug, Minnesota Department of Commerce

Table of Contents Chapter 1 Introduction………………………………………………………………………..1 Chapter 2 Project Objectives…………………………………………………………………4 Chapter 3 Research Approach and Methods………………………………………………....5 Chapter 4 Instructions for Using the Workbook…………………………………………….. 6 Chapter 5 Discussion of Data……………………………………………………………….17 Chapter 6 Key Classes of Distillate Users for Policy-Makers……………………………....24 Chapter 7 Using the Workbook to Analyze Key Policy Scenarios………………………… 25 Chapter8 Conclusions……………………………………………………………………….27 References………………………………………………………………………...29 Appendix Minnesota Statutes…….……………………………………………..A-1 Appendix Data Sheet Example………..…………………………………………B-1

List of Tables Table 4.1 Menu Page Example …………………………………………………..…….. 7 Table 4.2 Data Sheet Example …………………………………………………..……... 8 Table 4.3 Patterns of Distillate Usage…………………………………………………... 9 Table 4.4 Becker County Results Sheet………………………………………..…….... 14 Table 4.5 Minnesota Summation (MNSUM) Page…………………………..…....…... 15
List of Figures
Figure 4.1 Distillate Usage Patterns of Key Usage Groups in Minnesota……………....10 Figure 4.2 Diesel Fuel Taxes Per Month on Minnesota Highways 2002…………..…....11 Figure 4.3 Heating Degree Days by Month at Minnesota Locations…………………....12 Figure 4.4 Minnesota Distillate Usage by Activity……………………………………. .16 Figure 4.5 U.S. Fuel Usage and Percentage of Trucks by Gross Vehicle Weight.……... 19

Executive Summary Biodiesel is a renewable fuel derived from vegetable oils or animal fats that can substitute for diesel fuel in engines or fuel oil in furnaces. Biodiesel is produced by the process of transesterification, a simple chemical process that breaks individual triglyceride molecules into three molecules of methyl esters consisting of long chain fatty acids, similar to diesel derived from petroleum. Biodiesel has proven lubricity benefits at low blends, which will be important when sulfur leve ls are reduced in the U.S. supply of diesel in 2006. In addition, blends of biodiesel and its usage in a pure form reduce particulate matter (PM), volatile organic compounds (VOC), as well as other toxic gases and Greenhouse Gases (GHG). Reduced emissions from biodiesel blends result from its zero sulfur content and higher oxygen content versus petro-diesel. Federal standards established by the U.S. Environmental Protection Agency (EPA) may force local authorities to implement a variety of policies to reduce VOC’s, one of the precursors of ground level ozone formation, and other toxic emissions. There is also substantial concern among public health professionals concerning the formation of particulate matter (PM) from diesel engines, especially when originating from school buses, transit buses, and diesel-powered electrical generators. Minnesota statutes enacted during the 2002 Legislative Session mandate the inclusion of 2% biodiesel for use in a majority of diesel-powered vehicles in the state starting in 2005. The statute takes effect when 8 million gallons of annual biodiesel production capacity exist within the state and/or enactment of federal or state credits that reduce the cost of this fuel. In 2003 Governor Pawlenty appointed the Biodiesel Taskforce to study and suggest policies encouraging a smooth transition in production and use of this renewable fuel in Minnesota. The taskforce met eight times in 2003 and 2004. Biodiesel typically costs more than diesel derived from petroleum because of the higher costs of vegetable oils, which have a vast number of competing uses. However, passage of federal legislation in 2004 will serve to make usage of this renewable fuel much cheaper due to the creation of a credit of $.01 for each percent blended in the case of vegetable oils, and $.005 for each percent blended in the case of animal fats and waste greases. The net effect of the credit will be to make biodiesel blends up to 20% (B20) nearly equal to the price of petro-diesel. This study was undertaken to assist policy-makers who may suggest utilization of biodiesel blends as part of an overall strategy to reduce ground level ozone and also to reduce immediate harm from particulate matter due to diesel engine exhaust. Vehicles that may be prime targets for use of higher blends of biodiesel include school buses, transit buses, road equipment, diesel-powered electrical generators, and diesel “gensets” used for emergency and peak-shaving. In addition, the monthly patterns of fuel usage may be helpful to fuel distributors as they determine how to supply vehicles and machines that may utilize biodiesel of various blends across the state.

The number of diesel-powered vehicles is in constant flux and most are mobile, emitting in various localities of the state. This study attempts to establish diesel and fuel oil usage levels and patterns for 2002 in Minnesota. The patterns of diesel and distillate usage presented may suggest policy choices to environmental scientists who may be able to predict the amount of emissions originating from diesel and fuel oil usage. A workbook model has been developed, which contains fuel usage data by class of machine, county in the state, and month of usage. A menu page in the workbook has been established to offer policymakers the opportunity to determine the amounts of 100% biodiesel (B100) needed to satisfy various blends in the machines emitting the greatest amounts of pollutants in closest proximity to people. Using the workbook to pose policy questions produces the following annual biodiesel requirements in Minnesota:
Statewide Usage 17,058,105 gallons of B100 would be needed to satisfy the B2 mandate statewide with 78.1% of this amount used on-road. 3,178,934 gallons of B100 would be needed to fuel school buses with B20, statewide. 90,204 gallons of B100 would be needed statewide to fuel state tax-exempt vehicles with B5. 22,551 gallons of B100 would be needed to fuel state off-road equipment, statewide with B5. 270,613 gallons of B100 would be needed statewide to fuel county and city on-road vehicles statewide with B5. To provide the B5 blend for county and city off-road equipment would require 67,653 gallons of B100. 260,960 gallons of B100 would be needed to fuel both emergency and peak-shaving generators, statewide with B20, with 42.6 % used in the Metro area. 8,577,650 gallons of B100 would be needed to provide B5 blends for all fuel oil used statewide in the residential, commercial and industrial categories, of which 11.4% would arise from usage in the Metro area.

Metro Usage 11, 484 gallons of B100 would be needed to fuel state-owned tax-exempt vehicles based in Metro counties with B5. 2,871 gallons of B100 would be needed to provide B5 for the state-owned off- road equipment in the Metro area. 72,572 gallons of B100 would be needed to fuel county and city on-road vehicles in the Metropolitan area with B5 while 18,143 gallons of B100 would be needed to provide B5 blends for the off-road equipment in Metro counties. 2,264,000 gallons of B100 would be needed to fuel Metro-area transit buses with B20. 3,926,751 gallons of B100 would be needed to provide B20 blends for all fuel oil used in the Metro area with 55.8% used residentially, 20.7% used commercially, and 23.5% used industrially. Readers of this report are welcome to pose scenarios of blend percentages applied to various classes of machines, whether on-road or off-road, whether metro or outstate, and whether private or public fleets of vehicles. The policy analysis tool developed for this project is available at the following website for investigation by any interested parties: http://www.lrrb.org/pdf/MNBiodieselPolTool120904.xls

1
Chapter 1: Introduction Diesel fuel and fuel oil are together called distillate fuels. These fuels, which are often identical in chemical composition and properties, are utilized in numerous activities in Minnesota throughout a typical year. This study was undertaken to gain a better understanding of the usage patterns of these fuels by activity, by month of the year, and by location within the state. Diesel fuel is used in pressure- ignition internal combustion engines, while fuel oil is burned for home heating or in industrial boiler applications. Suppliers of these two distillate fuels may introduce certain additives to each in order to improve performance and storage characteristics. Diesel is often referred to as the “fuel of commerce” because so many heavy-duty machines use engines powered with this fuel, which typically consists of molecules fourteen carbon atoms long. Diesel engines are able to extract 40-50% more usable energy on a BTU basis for a given volume of fuel than gasoline engines (1). Diesel engines have a reputation for longer engine life and less required maintenance than gasoline engines as well. Diesel fuel has another advantage over gasoline in that less heat energy is expended in refining diesel fuel than gasoline because diesel fuel remains as longer chains of carbon atoms that don’t require as much cracking. The process of recovery, distillation, and transportation of diesel fuel yields .843 BTU of diesel for every BTU expended. For comparison, production of gasoline yields .805 BTU of fuel for each BTU of energy applied in the three steps (2). Until the last few years, efforts to improve air quality mandated by the Federal Clean Air Act of 1990 focused on industrial emissions, power plant emissions, and automobile emissions. Much progress has been reported in these areas due to the efforts of the U.S. Environmental Protection Agency (EPA) as well as actions of state and local authorities. In recent years the EPA has turned its attention to diesel engines in efforts to further improve urban air quality by establishing new requirements in characteristics of diesel fuel and the heavy-duty engines that use the fuel. Changes planned in diesel engine design and the requirements in fuel characteristics will combine to reduce emissions from diesel-powered machines and vehicles in the coming years. To reduce emissions of sulfur oxides and other emissions, the sulfur content of diesel fuel used in on-road use will be reduced from 500 ppm to 15 ppm by 2006. Reduction of sulfur to these levels will permit the introduction in 2007 of vastly cleaner burning diesel engines on trucks and cars equipped with catalytic converters and other after-treatment devices.

2
However, the sulfur currently contained in diesel fuel serves to lubricate the metal surfaces of moving engine parts. Government and industry research has proven that the proposed reduction in sulfur content in diesel fuel will result in greater engine wear, particularly in fuel injection pumps. The development and inclusion of additives to restore lubricity to diesel fuel containing drastically less sulfur has become important for engine manufacturers and fuel suppliers. Biodiesel is a fuel that can be derived from vegetable oils and animal fats and contains no sulfur. This alternative fuel has shown the ability to restore lubricity even when introduced at percentages as low as 1 to 2 percent when mixed in ultra- low sulfur diesel fuel (3). Biodiesel: Origins and Attributes Biodiesel can be made from vegetable oils, animal fats, and recycled cooking greases through the process of transesterification. This process uses alcohol and catalysts to break the branched molecular chains that characterize animal fats and vegetable oils. In Minnesota and other states, legislative efforts have been made to mandate the usage of biodiesel based on engine lubricity requirements, expected lower emissions, potential reduction in crude oil imports, and local economic development arguments.
Indeed, biodiesel offers certain advantages in terms of emissions. In particular, biodiesel results in reduced levels of particulate matter. Particulate matter (PM) has received increased attention as a human health issue due to the fact that these small particles are often drawn deep into one’s lungs. In such a case, the host of chemicals adhering to particulates (such as aldehydes), have proven to have carcinogenic effects (4). Research and testing has occurred, seeking remedies to reduce PM in working environments. Bickel, et al, compared the particulate emissions resulting from mining machines using disposable filters and those using biodiesel (5). In this study, nearly identical reductions in particulates resulted from fuel consisting of 100% biodiesel (B100) and the use of disposable filters in machines using regular diesel fuel. Other studies have examined the emissions of particulates from heavy-duty diesel trucks and in diesel “gensets” (6). Diesel Emissions Effects on Air Quality A key environmental issue facing the Twin Cities Metropolitan Area and other regions of the country is that of ground level ozone, which forms from smog. Smog forms when volatile organic compounds (VOC) from vehicles and power plants combine with nitrogen oxides or NOx compounds. Persistence of smog and the activity of sunlight create ground level ozone. Ozone alerts have occurred at different times due to regional atmospheric conditions as well as emissions from a variety of sources, both local and regional. When ground level ozone levels rise, asthmatic individuals and others with poor pulmonary health are frequently seen in emergency rooms or are hospitalized. Federal laws and regulations may force local authorities to develop ozone mitigation plans in the Twin Cities if ozone levels are exceeded in a certain number of cases per year. Several studies have been conducted to determine possible economic effects of various strategies to improve air quality (7). The Milwaukee region was forced to develop ozone mitigation plans several years ago. Because ozone results when volatile organic compounds and NOx compounds mix to form a haze above a city, efforts to control ozone may include reductions of power generation from coal- fired plants, restrictions on time of day for fueling automobiles, and automobile usage.

3
Unfortunately, high ozone conditions often occur during humid days of summer when winds are low and electrical demand to run air conditioning is high. In some instances the poor quality air and pollutants responsible for ground- level ozone formation may originate in other areas of the country. Biodiesel may have a role to play in helping to reduce the incidence of ozone alerts in the Twin Cities Metro Area if more of this fuel is used in diesel-powered vehicles, machines, and peaking generators. Particulate matter (PM) is a troublesome emission issue associated with diesel engines. Particulate matter consists of microscopic particles of soot and can be harmful when drawn deep into one’s lungs where adhering chemicals contribute to various types of lung disease and cancer. Children are more susceptible to this type of pollution because they breathe 50 percent more air per pound of body weight than adults. Major federal efforts have targeted particulate emissions from school buses because more than 24 million children are exposed to diesel exhaust every school day (8).

4
Chapter 2: Project Objectives
This study was conducted for several key reasons, including the following: 1) Biodiesel is scheduled to be included at a 2% blend in the diesel fuel of most diesel powered vehicles and machines in Minnesota in 2005 under current law (9). This statute is available in Appendix A. 2) Ground level ozone levels may trigger local responses in the Twin City Metropolitan Area due to federal air quality requirements. To prevent or reduce formation of ground-level ozone due to VOC’s, biodiesel blend levels greater than 2% may be useful in certain classes of machines. 3) State and local authorities may require certain users of diesel fuel to reduce particulate emissions due to the potential harm to people in close proximity to engine operation, such as the case of electrical generation units, school buses, transit buses, and government vehicles. In these instances, blend levels higher than 2% may help reduce emissions of particulates and other emissions. In the pages that follow, the process of building a workbook to aid analysis of strategies to utilize biodiesel for a variety of reasons will be described. The categories of machines that use distillate fuels will be described as well as a range of data sources utilized to allocate fuel usage to individual counties. The workbook will be demonstrated with some examples. Categories of machines that merit special consideration for biodiesel blends because of the locations of their operation are noted. Some possible scenarios will be identified, along with suggestions for further research, which may more directly determine the effect of fuel usage patterns on air quality.

5
Chapter 3: Research Approach and Methods By collecting and studying data from various sources, usage patterns of various machines and fuel oil burners were identified in Minnesota. Efforts were made to parse out the amounts of fuel used by different classes of machines in each county of the state in each month of the year. Consumption patterns were estimated for 2002 based on published and derived data from a number of years. An Excel workbook was developed containing usage figures for each county of the state on a separate worksheet. An identically formatted “page” or sheet was determined for the state as a whole. A “menu” page was created to facilitate consideration of policy alternatives. For example, if policy-makers wanted all school buses in the state to run on 20% biodiesel blend (B20) to reduce particulate levels near school children, the necessary requirement for B100 needed in each county can be determined. If other counties were to follow the example of Hennepin County and the City of Brooklyn Park and use B5 blends in their road equipment, then the required amount of biodiesel can be determined in those counties. If the Metropolitan Transit Commission were to propose the use of B20 blends in the buses in its own fleet and the regulated opt-out carriers under MTC control, the amount of B100 needed to blend in those counties can be readily determined, especially for the months of the year when ozone alerts are most likely. Assumptions and Conventions To conduct a study of this nature, certain underlying assumptions or conventions were needed. As mentioned previously, 2002 was chosen as the baseline year. Data from 2002 was available during the research phase of this project and makes the study fairly current. Truck size and fuel usage figures were based on 1997 data compiled by the U.S. Department of Transportation (USDOT). Later in 2005 more up-to-date data on the characteristics of the trucks in 2002 should be released by USDOT. An important convention chosen was that of trying to determine the location where the distillate was placed in the tank of the machine or boiler using the fuel. This is especially important in the case of over-the-road trucks, railroad locomotives, and barges, all having tanks of large capacity that provide a long range of travel per tank. In the case of other machines, the fueling location conforms quite closely with the location where used, such as the case of fuel oil for home heating, diesel fuel used in farm operations, or diesel fuel used in school bus operations. Development of the Workbook An Excel workbook was developed in order to portray the variety of distillate users in the state as well as the composition of the distillate users in each county and their respective monthly usage figures. In the workbook, individual results pages are determined for each of the state’s eighty-seven counties. A state summary page (MnSum) reports the statewide impacts based on biodiesel blend percentages posited on the Menu page. In the pages that follow, instructions will be given and examples portrayed using the workbook. As better data becomes available, the Data page can be updated. The established framework of the workbook will retain its usefulness in analyzing amounts of biodiesel required to blend diesel fuel and distillates used by particular classes of machines.

6
Chapter 4: Instructions for Using the Workbook
An electronic workbook is like an ordinary book, with numerous pages or worksheets containing data organized in columns and rows. In this case the workbook has been designed to organize the following components: Description Excel Tab Labels
conditions proposed for usage of biodiesel (Menu) usage data utilized (Data) monthly patterns of fuel usage (Patterns) individual county summaries (Aitkin-Yellow Medicine) statewide summary (MnSum)
Starting from the Menu page (Table 4.1) , one can propose biodiesel blends to be used in various classes of machines, or in the case of fuel oil, in combustion units. One can set any reasonable percent of biodiesel in Column B adjacent to the class of machine or combustion unit that uses it. Column C is a (1,0) variable which signifies whether the rate in column B is to be applied in “Outstate” counties, with 1 equal to “yes, apply this blend rate in outstate counties.” Column D is set up in a similar fashion with (1,0) variable with 1 meaning, “Yes, apply the stated biodiesel blend level for this class of machine in Metro Counties,” or 0 ---- meaning, “No, do not apply this policy for this class of machine in Metro Counties.” The Metro Counties characterized in the workbook and cited in this report are those currently in the Metropolitan Council, including Anoka, Carver, Dakota, Hennepin, Ramsey, Scott, and Washington. Column F on the Menu page is the abbreviation for the pattern that will be applied for that class of distillate using machine. The large worksheet in the workbook entitled Data, partially displayed in Table 4.2, contains numerous figures that represent county fuel usage for particular classes of machines. When the cells on this page are populated with data, the individual county pages are able to extract and use the correct figures for each individual county. Appendix B contains a subset of Data for all classes of distillate users for the Minnesota counties Aitkin - Clay. Counties from Clearwater through Yellow Medicine can be found on the Data sheet at the MnDOT website, which is the following: http://www.lrrb.org/pdf/MNBiodieselPolTool120904.xls Formulas on each county sheet called “VLookups” identify the correct cell from Data in order to calculate the diesel and fuel oil used in a particular county. Depending upon the conditions and blend levels proposed on the Menu sheet, various biodiesel blends are determined for particular classes of machines or vehicles in each county. The amount of B100 needed to achieve the proposed blend is calculated and recorded on each individual county sheet

7
A B C D E F
Table 4.1 Menu
Biodiesel Blend
ProposedOutstate Applic.
Metro Applic. Pattern
(Percent) (1,0) (1,0)ON-ROAD USAGEPro-Rate Trucks MN origin 2 1 1 TRDPro-Rate Trucks Non-MN 2 1 1 TRDNon-Pro-Rate Comm.Trucks 0-6K 2 1 1 TRD 6K-10K 2 1 1 TRD 10K-14K 2 1 1 TRD 14K-16K 2 1 1 TRD 16K-19.5K 2 1 1 TRD 19.5K-26K 2 1 1 TRD 26K-33K 2 1 1 TRD 33K-56K 2 1 1 TRD 56K-113K 2 1 1 TRDFarm Trucks 0-6K 2 1 1 TRD 6K-10K 2 1 1 TRD 10K-14K 2 1 1 TRD 14K-16K 2 1 1 TRD 16K-19.5K 2 1 1 TRD 19.5K-26K 2 1 1 TRD 26K-33K 2 1 1 TRD 33K-56K 2 1 1 TRD 56K-113K 2 1 1 TRDSchool Buses 20 1 1 SCHTransit Buses 20 1 1 EQLOther Buses 2 1 1 EQLTax-Exempt Vehicles State 5 1 1 EQL Non-State 5 1 1 EQLMilitary- On-Road 2 1 1 FRMAutomobiles 2 1 1 TRGPickups 2 1 1 TRGRecreational Vehicles 2 1 1 FRMOther On-Road 2 1 1 EQLTOTAL ON-ROAD USAGE
OFF ROAD USAGE---DIESEL Farm Off-Road 2 1 1 FRM Military--Off Road 2 1 1 FRM Utility Generation Equip. 2 0 1 EQL Gensets-Interrupt. Peaking 20 1 1 EPK Gensets-Emergency 20 1 1 EQL Railroads 0 0 0 EQL River Towboats 2 1 1 BRG Great Lakes Vessels 2 1 1 GLK Airlines 0 0 0 EQL State Highway Off-Road 5 0 1 EQL Local Highway Off-Road 5 0 1 EQL Other---Off Road 2 1 1 CONTOTAL OFF-ROAD DIESEL
FUEL OIL USAGEResidential Heating 5 1 1 HDDCommercial Heating 5 1 1 HDDIndust. Heat & Processing 5 1 1 EQLTOTAL FUEL OIL USAGE
TOTAL DISTILLATE USAGE

8
Table 4.2 Data Sheet (codat) 3 4 5 6 7
Cty #
ProRate Trucks--MN Origin
ProRate Trucks--Non MN
Non-ProRate Trucks; 0-6K
Non-ProRate Trucks; 6K-10K
Non-ProRate Trucks; 10K-14K
1 Aitkin 331,605 415,558 0 59,862 40,5202 Anoka 2,657,444 3,330,238 0 651,637 441,0873 Becker 1,740,925 2,181,681 0 67,171 45,4684 Beltrami 884,279 1,108,156 0 92,430 62,5655 Benton 736,899 923,463 0 130,735 88,4936 Big Stone 607,942 761,857 0 9,622 6,5137 Blue Earth 2,150,825 2,695,358 0 183,935 124,5048 Brown 3,228,541 4,045,922 0 83,178 56,3029 Carlton 792,167 992,723 0 83,918 56,803
10 Carver 704,660 883,062 0 184,120 124,62911 Cass 244,098 305,897 0 84,658 57,30412 Chippewa 1,128,377 1,414,053 0 38,489 26,05313 Chisago 580,308 727,227 0 159,232 107,78214 Clay 2,081,741 2,608,783 0 69,300 46,90815 Clearwater 759,928 952,321 0 31,458 21,29316 Cook 55,267 69,260 0 22,853 15,46917 Cottonwood 792,167 992,723 0 28,960 19,60218 Crow Wing 594,125 744,542 0 172,000 116,42519 Dakota 7,392,023 9,263,488 0 696,511 471,46120 Dodge 663,210 831,117 0 56,254 38,07821 Douglas 907,307 1,137,014 0 102,978 69,70522 Faribault 1,017,842 1,275,533 0 39,600 26,80523 Fillmore 792,167 992,723 0 54,403 36,82524 Freeborn 1,229,701 1,541,029 0 81,142 54,92425 Goodhue 2,381,106 2,983,940 0 120,187 81,35326 Grant 138,169 173,149 0 19,245 13,02727 Hennepin 19,256,105 24,131,243 0 2,037,443 1,379,12428 Houston 1,179,039 1,477,541 0 37,657 25,48929 Hubbar 271,732 340,527 0 46,539 31,50230 Isanti 303,971 380,928 0 115,561 78,22231 Itasca 815,195 1,021,581 0 122,778 83,10732 Jackson 750,716 940,778 0 24,148 16,34633 Kanabec 193,436 242,409 0 56,809 38,45334 Kandiyohi 1,773,164 2,222,083 0 133,140 90,12135 Kittson 193,436 242,409 0 13,046 8,83136 Koochiching 115,141 144,291 0 38,767 26,24137 Lac Qui Parle 488,196 611,794 0 19,800 13,40238 Lake 101,324 126,976 0 26,647 18,03739 Lake of the Woods 96,718 121,205 0 11,380 7,70340 Le Sueur 561,886 704,141 0 89,469 60,56141 Lincoln 432,928 542,535 0 16,839 11,39842 Lyon 2,219,910 2,781,932 0 83,178 56,30243 McLeod 838,223 1,050,439 0 103,810 70,26844 Mahnomen 188,830 236,637 0 8,327 5,63645 Marshall 230,281 288,582 0 29,607 20,04146 Martin 1,667,235 2,089,335 0 46,076 31,18947 Meeker 589,520 738,770 0 66,431 44,96748 Mille Lacs 428,323 536,763 0 88,637 59,99749 Morrison 589,520 738,770 0 114,913 77,78450 Mower 1,174,434 1,471,769 0 73,833 49,97751 Murray 801,378 1,004,266 0 28,775 19,477
9
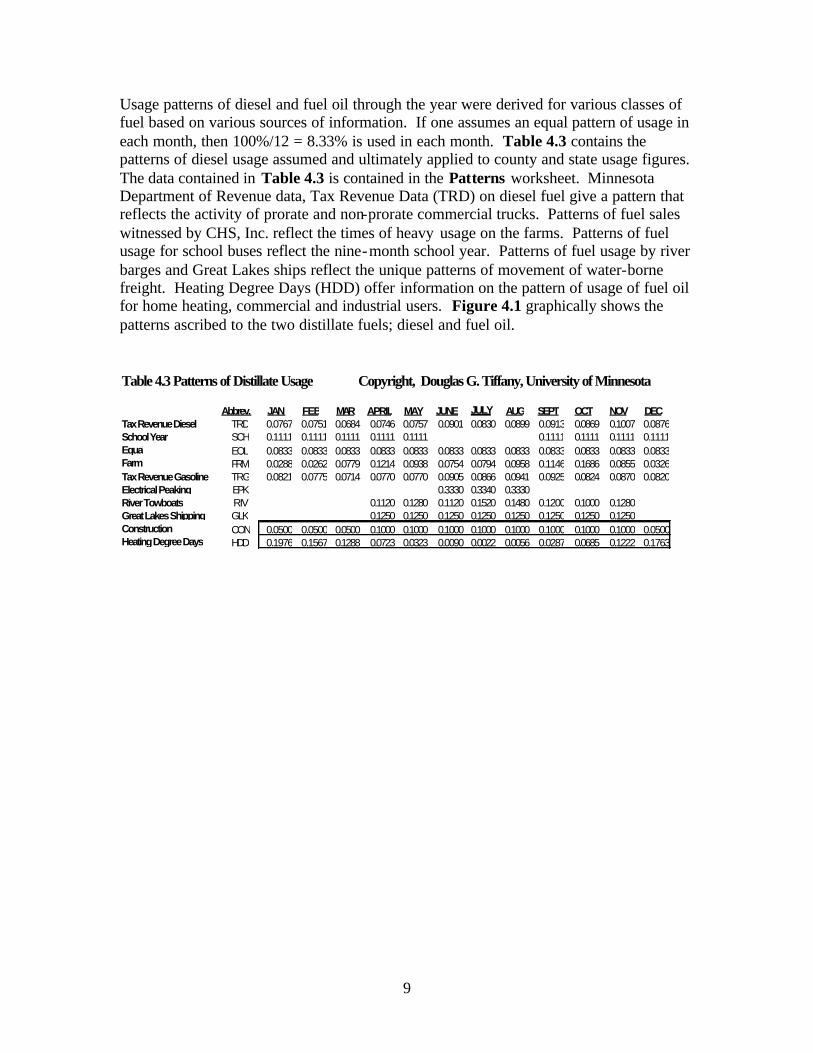
Usage patterns of diesel and fuel oil through the year were derived for various classes of fuel based on various sources of information. If one assumes an equal pattern of usage in each month, then 100%/12 = 8.33% is used in each month. Table 4.3 contains the patterns of diesel usage assumed and ultimately applied to county and state usage figures. The data contained in Table 4.3 is contained in the Patterns worksheet. Minnesota Department of Revenue data, Tax Revenue Data (TRD) on diesel fuel give a pattern that reflects the activity of prorate and non-prorate commercial trucks. Patterns of fuel sales witnessed by CHS, Inc. reflect the times of heavy usage on the farms. Patterns of fuel usage for school buses reflect the nine-month school year. Patterns of fuel usage by river barges and Great Lakes ships reflect the unique patterns of movement of water-borne freight. Heating Degree Days (HDD) offer information on the pattern of usage of fuel oil for home heating, commercial and industrial users. Figure 4.1 graphically shows the patterns ascribed to the two distillate fuels; diesel and fuel oil. Table 4.3 Patterns of Distillate Usage Copyright, Douglas G. Tiffany, University of Minnesota
Abbrev. JAN FEB MAR APRIL MAY JUNE JULY AUG SEPT OCT NOV DECTax Revenue Diesel TRD 0.0767 0.0751 0.0684 0.0746 0.0757 0.0901 0.0830 0.0899 0.0913 0.0869 0.1007 0.0876School Year SCH 0.1111 0.1111 0.1111 0.1111 0.1111 0.1111 0.1111 0.1111 0.1111Equal EQL 0.0833 0.0833 0.0833 0.0833 0.0833 0.0833 0.0833 0.0833 0.0833 0.0833 0.0833 0.0833Farm FRM 0.0288 0.0262 0.0779 0.1214 0.0938 0.0754 0.0794 0.0958 0.1146 0.1686 0.0855 0.0326Tax Revenue Gasoline TRG 0.0821 0.0775 0.0714 0.0770 0.0770 0.0905 0.0866 0.0941 0.0925 0.0824 0.0870 0.0820Electrical Peaking EPK 0.3330 0.3340 0.3330River Towboats RIV 0.1120 0.1280 0.1120 0.1520 0.1480 0.1200 0.1000 0.1280Great Lakes Shipping GLK 0.1250 0.1250 0.1250 0.1250 0.1250 0.1250 0.1250 0.1250Construction CON 0.0500 0.0500 0.0500 0.1000 0.1000 0.1000 0.1000 0.1000 0.1000 0.1000 0.1000 0.0500Heating Degree Days HDD 0.1976 0.1567 0.1288 0.0723 0.0323 0.0090 0.0022 0.0056 0.0287 0.0685 0.1222 0.1763

10
Figure 4.1 Distillate Usage Patterns of Key Usage Groups in Minnesota
0.0000
0.0500
0.1000
0.1500
0.2000
0.2500
0.3000
0.3500
0.4000
JAN
FEB
MARAPR
ILMAY
JUNE
JULY AU
GSE
PT OCT NOVDE
C
Fac
tor
of A
nn
ual
Usa
ge
per
Mo
nth
TRDSCHEQLFRMTRGEPKRIVGLKCONHDD

11
Figure 4.2 Gallons of Diesel Fuel Taxed Per Month on MN Highways 2002(Source: Minnesota Department of Revenue)
0
10,000,000
20,000,000
30,000,000
40,000,000
50,000,000
60,000,000
70,000,000
Jan-02 Feb-02 Mar-02 Apr-02 May-02 Jun-02 Jul-02 Aug-02 Sep-02 Oct-02 Nov-02 Dec-02

12
Figure 4.3 Heating Degree Days by Month at Minnesota Locations(Midwestern Regional Climate Center, Historical Climate Summaries 1971-2000)
0
200
400
600
800
1000
1200
1400
1600
1800
2000
Jan Feb Mar April May June July Aug Sept Oct Nov Dec
HD
D b
ase
65
AdaBemidjiDuluthFergus FallsAlexandriaMorrisSt. CloudWorthingtonRochesterWinona

13
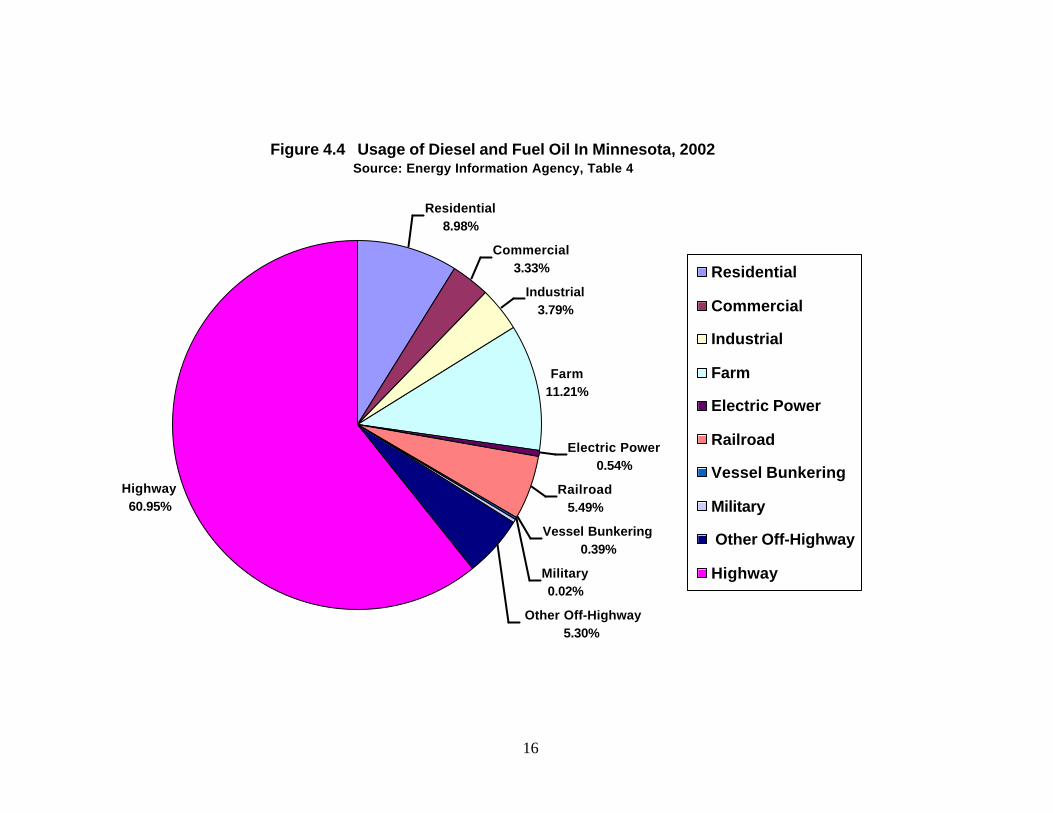
Individual pages for each Minnesota County are organized identically with the categories of machines placed on the corresponding lines in Column A as shown in Table 4.4 of Becker County. In Cell B2 of each county’s sheet is either 1 or 0, indicating 1= Metro County or 0 = Outstate County. Column C is purposely left blank. Column D contains the calculated annual county usage figures of diesel or fuel oil based upon the data pulled from the Data sheet. Column E contains the annual amount of B100 needed to supply the blends for each classification of machine. Column F contains a three letter abbreviation that reflects the monthly pattern of fuel usage by that class of machine. Columns G through Column R contain embedded formulas that apply factors to produce the monthly usage of B100, or pure biodiesel needed in each county for each class of machine. The next key page of the workbook to study is entitled MnSum, standing for Minnesota Summary, as shown in Table 4.5 The categories of machines to use diesel fuel and fuel oil are identical to those on the individual county pages and the menu page, with categories in the same rows. Column D on MnSum contains the estimate of statewide usage of diesel or fuel oil by each category of machine. The figures in Column D are calculated by formulas which add the corresponding figures for each individual County Sheet. The figures recorded in Column E represent the summation of B100, or pure biodiesel, needed to satisfy the requirements for B100 established in the Menu page for each of the categories of machines in all of the counties of the state. Finding and Developing Data Data for this study were collected from numerous sources. In many cases, statewide usage figures were available from the Energy Information Agency (EIA) of the U.S. Department of Energy. Then efforts were needed to allocate state usage numbers for a class of machines to each county of the state and to conform to monthly usage patterns throughout the year. The pie-chart that follows in Figure 4.4 shows the annual usage pattern of distillate fuel in Minnesota as compiled by EIA. The U.S. Census of 2000 was used to allocate fuel oil usage patterns because census questionnaires noted principal fuel used in residences. U.S. Census data in conjunction with Minnesota Department of Education figures of fuel usage by school districts were used to allocate by county the amount of diesel fuel used in the school buses throughout the state. Minnesota Department of Commerce data and Minnesota Pollution Control data were used to allocate the diesel used to produce power in baseload, interruptible, and emergency generators. With respect to vessel bunkering, industry sources strongly suggested that EIA figures were too low. By developing further detail in certain categories of distillate users, a greater number of total gallons of usage were identified than by EIA. However, in considering total distillate usage within Minnesota, this study identified only 2.6% more gallons than those estimated by EIA. This amount of difference is negligible in terms of the usage of a commodity that can vary greatly from year to year due to the severity of the winter or the size of the crops needing to be hauled.

14
A B C D E F G H I
Table 4.4 Becker
County Usage
Gallons
Annual B100
Gallons Needed
Pattern
JAN FEB MAR
Metro =1, Outstate =0 0On-Road UsagePro-Rate Trucks-- MN origin 1,740,925 34,819 TRD 2,670 2,614 2,381Pro-Rate Trucks Non-MN 2,181,681 43,634 TRD 3,345 3,276 2,984Non-Pro-Rate Comm. Trucks - 0 0 0 0-6K - - TRD 0 0 0 6K-10K 67,171 1,343 TRD 103 101 92 10K-14K 45,468 909 TRD 70 68 62 14K-16K 61,723 1,234 TRD 95 93 84 16K-19.5K 8,694 174 TRD 13 13 12 19.5K-26K 99,231 1,985 TRD 152 149 136 26K-33K 190,112 3,802 TRD 292 285 260 33K-56K 383,296 7,666 TRD 588 575 524 56K-113K 499,615 9,992 TRD 766 750 683Farm Trucks - 0 0 0 0-6K - - TRD 0 0 0 6K-10K 3,143 63 TRD 5 5 4 10K-14K 14,361 287 TRD 22 22 20 14K-16K 14,108 282 TRD 22 21 19 16K-19.5K 3,602 72 TRD 6 5 5 19.5K-26K 71,143 1,423 TRD 109 107 97 26K-33K 137,556 2,751 TRD 211 207 188 33K-56K 462,062 9,241 TRD 709 694 632 56K-113K 621,372 12,427 TRD 953 933 850School Buses 114,801 2,296 SCH 255 255 255Transit Buses - - E Q L 0 0 0Other Buses - - E Q L 0 0 0Tax-Exempt Vehicles - State 22,607 452 E Q L 38 38 38 Non-State 70,765 1,415 E Q L 118 118 118Military- On-Road 657 - FRM 0 0 0Automobiles 23,299 466 TRG 38 36 33Pickups 124,968 2,499 TRG 205 194 178Recreational Vehicles 12,293 246 FRM 7 6 19Other On-Road - - E Q L 0 0 0Total On-Road Usage 6,974,652 139,480 10,790 10,564 9,675
- OFF ROAD USAGE---DIESEL - Farm Off-Road 1,339,663 26,793 FRM 772 703 2,086 Military--Off Road - - FRM 0 0 0 Utility Generation Equip. 3,908 - E Q L 0 0 0 Gensets-Interrupt. Peaking 278 - EPK 0 0 0 Gensets--Emergency 3,397 - E Q L 0 0 0 Railroads - - E Q L 0 0 0 River Towboats - - B R G 0 0 0 Great Lakes Vessels - - GLK 0 0 0 Airlines - - E Q L 0 0 0 State Highway Off-Road 5,652 113 E Q L 9 9 9 Local Highway Off-Road 17,691 354 E Q L 29 29 29 Other---Off Road 344,658 6,893 CON 345 345 345TOTAL OFF-ROAD DIESEL 1,715,247 34,153
FUEL OIL USAGEResidential Heating 1,264,639 - HDD 0 0 0Commercial Heating 468,499 - HDD 0 0 0Indust. Heat & Processing 533,491 - EQL 0 0 0Total Fuel Oil Usage 2,266,629 -
TOTAL DISTILLATE USAGE 10,956,528 173,633 JAN FEB MAR

15
A B C D E F G H I
Table 4.5 MNSUM
# of MN Vehicles
Estimated Diesel Gal.
Annual B100
Needed Pattern JAN FEB MAR Copyright, Douglas G. Tiffany, University of Minnesota
On-Road UsagePro-Rate Trucks-- MN origin 32,833 123,099,058 2,461,981 TRD 188,766 184,821 168,349Pro-Rate Trucks Non-MN 154,264,496 3,085,290 TRD 236,556 231,613 210,971Non-Pro-Rate Comm. Trucks 129,647 0-6K 0 0 TRD 0 0 0 6K-10K 11,309,144 226,183 TRD 17,342 16,980 15,466 10K-14K 7,655,045 153,101 TRD 11,739 11,493 10,469 14K-16K 10,391,882 207,838 TRD 15,935 15,602 14,212 16K-19.5K 1,463,728 29,275 TRD 2,245 2,198 2,002 19.5K-26K 16,706,700 334,134 TRD 25,619 25,083 22,848 26K-33K 32,007,725 640,154 TRD 49,082 48,056 43,774 33K-56K 64,532,513 1,290,650 TRD 98,957 96,889 88,254 56K-113K 84,116,260 1,682,325 TRD 128,988 126,292 115,037Farm Trucks 32,066 0-6K 0 0 TRD 0 0 0 6K-10K 250,370 5,007 TRD 384 376 342 10K-14K 1,143,809 22,876 TRD 1,754 1,717 1,564 14K-16K 1,123,655 22,473 TRD 1,723 1,687 1,537 16K-19.5K 286,899 5,738 TRD 440 431 392 19.5K-26K 5,666,384 113,328 TRD 8,689 8,508 7,749 26K-33K 10,956,123 219,122 TRD 16,801 16,450 14,984 33K-56K 36,802,428 736,049 TRD 56,435 55,255 50,331 56K-113K 49,491,195 989,824 TRD 75,892 74,306 67,684School Buses 5938 15,894,668 317,893 SCH 35,318 35,318 35,318Transit Buses 4843 12,282,200 245,644 EQL 20,462 20,462 20,462Other Buses 0 0 0 EQL 0 0 0Tax-Exempt Vehicles State 12,603 1,804,086 36,082 EQL 3,006 3,006 3,006 Non-State 28,668 5,412,259 108,245 EQL 9,017 9,017 9,017Military- On-Road 107,692 0 FRM 0 0 0Automobiles 3,156,906 3,951,614 79,032 TRG 6,486 6,122 5,643Pickups 890,648 13,700,624 274,012 TRG 22,488 21,226 19,564Recreational Vehicles 39,584 1,502,291 30,046 FRM 866 789 2,339Other On-Road 0 EQL 0 0 0Total On-Road Usage 665,922,848 13,316,303 1,034,989 1,013,695 931,314
OFF ROAD USAGE---DIESEL Farm Off-Road 119,518,000 2,390,360 FRM 68,904 62,735 186,101 Military--Off Road 430,768 0 FRM 0 0 0 Utility Generation Equip. 9,159,813 0 EQL 0 0 0 Gensets--Interrupt. Peaking 652,401 0 EPK 0 0 0 Gensets--Emergency 652,401 0 EQL 0 0 0 Railroads 58,524,000 0 EQL 0 0 0 River Towboats 3,900,000 78,000 RIV 0 0 0 Great Lakes Vessels 5,350,000 107,000 GLK 0 0 0 Airlines 0 0 EQL 0 0 0 State Highway Off-Road 451,022 9,020 EQL Local Highway Off-Road 1,353,065 27,061 EQL Other---Off Road 56,518,000 1,130,360 CON 751 751 751TOTAL OFF-ROAD DIESEL 256,509,470 3,741,802 2,254 2,254 2,254
FUEL OIL USAGEResidential Heating 95,716,000 547,721 HDD 0 0 0Commercial Heating 35,459,000 202,909 HDD 0 0 0Indust. Heat & Processing 40,378,000 231,057 EQL 108,239 85,809 70,523Totals Assoc. w/ Fuel Oil 171,553,000 981,688 40,098 31,789 26,126
Total Distillate Usage 1,093,985,318 18,039,793 1,077,342 1,047,738 959,694JAN FEB MAR
16
Figure 4.4 Usage of Diesel and Fuel Oil In Minnesota, 2002 Source: Energy Information Agency, Table 4
Residential8.98%
Commercial3.33%
Industrial3.79%
Farm11.21%
Electric Power0.54%
Railroad5.49%
Vessel Bunkering0.39%
Military0.02%
Other Off-Highway5.30%
Highway 60.95%
Residential
Commercial
Industrial
Farm
Electric Power
Railroad
Vessel Bunkering
Military
Other Off-Highway
Highway

17
Chapter 5: Discussion of Data
The listing below identifies twenty-five classes of machines capable of using distillate fuels. The lists are divided between on-road and off-road users. Bunker oils used to propel large ships were not included in this analysis because little research has been completed on utilization of biodiesel blends in such heavy oil. Bunker oils are certainly burned in diesel engines of ships, but they require processing on board to heat, strain, and remove water before burning. On-Road Users of Diesel Fuel
1) Prorate Commercial Trucks (based in MN or other states & provinces) 2) Non-Prorate Commercial Trucks (sorted by Gross Vehicle Weight) 3) Farm Trucks (sorted by Gross Vehicle Weight) 4) School Buses 5) Transit Buses 6) Tax-Exempt State Vehicles 7) Tax-Exempt Non-State Vehicles 8) Military On-Road Vehicles 9) Automobiles 10) Pickups 11) Recreational Vehicles (Motor homes) 12) Other On-Road Vehicles
Off-Road Users of Diesel Fuel
13) Farm Off-Road Machinery 14) Military Off-Road Equipment 15) Utility Generation Equipment—Baseload or Intermediate 16) Utility Generation Equipment—Emergency and Peak-Shavers 17) Railroads 18) River Barges 19) Great Lakes Shipping and Recreation 20) State Highway Off-Road Equipment 21) Local Highway Off-Road Equipment 22) Other Off Road Usage
Fuel Oil Usage
23) Residential Fuel Oil Usage 24) Commercial Fuel Oil Usage 25) Industrial Fuel Oil Usage

18
Discussion of Categories A few comments are in order about the categories chosen, although some may seem self-explanatory.
Prorate Trucks are typically the large semi’s that haul cargo in interstate commerce. It is possible to distinguish between the amount of fuel used by Minnesota-based trucks and those from other states that pass through the state. The data on fuel usage by the prorate trucks are collected by a consortium that allocates among the states the amount of state fuel tax collected by diesel purchases in accordance with the number of miles driven in a particular state. This system ensures that irrespective of the state where diesel fuel is purchased, pro-rate truckers pay the appropriate rate for the gallons considered used in each particular state. In order to ensure compliance, pro-rate truckers are responsible for maintaining log-books that contain figures verifying the miles recorded on wheel-mounted odometers. Prorate truckers must also submit monthly reports indicating the number of highway miles driven in each state. Minnesota Department of Revenue data of fuel tax collections by month were used to determine usage patterns throughout the year as shown previously in Figure 4.2. Non- Prorate Trucks are the Commercial Class Trucks (“Y” class) that are registered in Minnesota and classified by their home county by the Minnesota Department of Public Safety. These trucks make all kinds of deliveries, but conduct almost all of their travel within the state borders (intrastate commerce). Gross vehicle weights were used to stratify the Non-Prorate Trucks because a smaller proportion of the small trucks are likely to use diesel fuel. National data were applied to determine the percentage of fuel used by each of the size categories as shown in Figure 4.5 (10). Minnesota Department of Revenue data of fuel tax collections by month for 2002 were used to determine usage patterns throughout the year as shown previously in Figure 4.2 . Farm Trucks are licensed to haul agricultural commodities and are assumed to generally confine their travel within the state’s borders. They are classified according to the gross vehicle weights and assigned to their home counties based on Minnesota Department of Public Safety records. The fleet of farm trucks tends to be older than the commercial trucks, and higher proportions are thought to be gasoline-powered. Many are used only seasonally with relatively low mileage and fuel usage figures. Federal fuel usage patterns were applied based on the gross vehicle weight of the trucks as shown in Figure 4.5 .

19
Figure 4.5 U.S. Fuel Usage, Percent of Trucks for Various Vehicle Gross WeightsSource: U.S. Dept. of Commerce, 1997 Vehicle Inventory and Use Survey
0.00
10.00
20.00
30.00
40.00
50.00
60.00
70.00
80.00
90.00
100.00
6,000 lb.and less
6,001-10,000 lb.
10,001-14,000 lb.
14,001-16,000 lb.
16,001-19,500 lb.
19,501-26,000 lb.
26,001-33,000 lb.
33,001 lb.and up
Vehicle Gross Weight Intervals
Per
cen
t
% of Truck Fuel Usage
% of Truck Numbers

20
School Buses are noted in the Minnesota Department of Public Safety records. The most complete and recent data of diesel usage by school buses in Minnesota was compiled by the Minnesota Department of Education in 1996-1997. At that time there was reporting of fuel used in buses owned by school districts and also buses contracted by school districts to verify state transportation aid to school districts. U.S. Census data on the school age population was used to derive gallons of diesel per pupil in the counties based on the various levels of student density. (L. Schroeder, Minnesota Department of Education, 2004, print-out of electronic data) Transit Buses are a separate class of buses, primarily used by the Metropolitan Transit Commission and their opt-out carriers. MTC staff estimated fuel usage in each county in their service area based on passenger-mile data collected. (D.Christianson, Metropolitan Transmit Commission, 2004, personal communication) Tax-Exempt Vehicles; State Owned Minnesota Department of Public Safety data was used to allocate the number of state-owned tax-exempt vehicles in each county of the state. Most of the diesel-using vehicles were assumed to be Minnesota Department of Transportation vehicles. Tax-Exempt Vehicles; Non-State Owned Minnesota Department of Public Safety data was used to allocate the number of vehicles in this classification in each county of the state. Most of the diesel- consuming vehicles were assumed to be in the street and highway departments of counties and cities. Military Vehicles—On-Road These are vehicles used by the Minnesota National Guard. The fuels manager for the Minnesota National Guard indicated that 20% of the usage of diesel occurs on-road in the home counties of the various formations, while 80% of the fuel used for ground vehicles and equipment occurs at Camp Ripley in Morrison County. (D.Gafke, Minnesota National Guard, 2004, personal communication) Automobiles that use diesel fuel are not very common in Minnesota. There are a few older Mercedes Benz models (the company hasn’t sold any diesels in the U.S. for several years) and Volkswagens that have the TDI engine in either Jettas, Golfs, or Beetles. Volkswagen was unable to precisely tell how many diesels are on the road in Minnesota, but anecdotal evidence from one metropolitan dealership indicated that a third of the three models mentioned are sold with diesel engines. National data on car sales were examined and used to allocate diesel cars in proportion to state share of the national car fleet and each county’s share of the state’s car fleet (11). Pickups have increased in popularity in recent years overall, with more and more of the heavy ones powered by diesel engines. In particular, owners of pickups doing significant towing are attracted to diesels due to higher torque, better fuel economy, and longer engine life than similar trucks with equivalent gasoline engines. Ford, General Motors, and Dodge market diesel- powered trucks in their 3/4 Ton and 1.0 Ton sizes. It is typical for diesel-powered pickups to initially cost $4500 more than a comparably equipped gasoline model.

21
Recreational Vehicles are an interesting class of vehicle. Based on a survey of recreational vehicle (RV) owners, it was assumed that 100% of the models 36 feet or longer in length are powered with diesel engines (12) Minnesota Department of Public Safety records were sorted to find the larger vehicles, which were allocated according to the proportion recreational vehicles found in each county. Diesel usage per RV was based on 10,000 miles of annual driving averaging 7.5 miles per gallon (12) (13). Farm Off-Road diesel usage is represented by tractors and combines that perform cropping operations as well as livestock activities (14). The seasonal usage pattern for farm machines was provided by CHS Inc. (D. Hunhoff, CHS, Inc. Spreadsheet of Petroleum Sales by Month, 2004). Individual county allocations of diesel usage were made on their proportion of state farm sales (15). Military Off-Road diesel usage represents the equipment used in training in the state. The federal government is using biodiesel at some of the U.S. Army’s training facilities in the case of equipment that is determined to be non-deployable. The fuels manager for the Minnesota National Guard indicated that 80% of the total diesel fuel use by state units occurs at Camp Ripley in Morrison County during field exercises. (D.Gafke, Minnesota National Guard. August, 2004, personal communication) Utility Generation Equipment (baseload and intermediate) Data on diesel usage in this category were available from reports filed by the Minnesota Department of Commerce, which listed the amount of fuel used by each facility in 2000. These were sorted by county and summarized. In some cases electric generation occurs with combustion turbines fueled with diesel fuel and in other instances, large internal combustion engines are used to generate baseload power (16). “Gensets” for Emergency and Peak-Shaving are smaller diesel-powered generators that serve offices, hospitals, laboratories, and other facilities that cannot afford power interruptions. Power from emergency generators is typically not fed into the grid. Peak-shavers are privately-owned generators with which the power companies have contracted for on-call generation capacity at times when power loads are high. Peak-shavers may feed power into the grid for 70 hours in a typical year, based on Minnesota Pollution Control Agency studies. MPCA staff estimated that interruptible and emergency generators each used 652,401 gallons of diesel fuel in 2002 and contributed 1.6% of statewide diesel emissions; however that figure can be much higher on peak load days of summer. Other electric generating plants in the state used 9,159,813 gallons of diesel fuel in 2002. (B. Timerson, Minnesota Pollution Control Agency, Fact Sheet “Diesel Generator Emissions,” 2004)

22
Railroads consume a great deal of diesel fuel in the state because they have substantial freight to haul throughout the year. EIA reported that railroads in Minnesota used 58,524,000 gallons in 2002. Grain movements tend to be heaviest during the autumn harvest and at other times when the Mississippi River and the Great Lakes are open for navigation. Minnesota legislation that mandated the inclusion of biodiesel in the state’s diesel fuel supply specifically excluded this requirement for railroads, copper and iron mining operations, and nuclear powered electricity generation plants. However, federal regulations released by the Environmental Protection Agency in May 2004 will require the use of ultra low sulfur diesel (ULSD) fuel in nonroad diesel engines. Smaller off-road new engines will be required to use low-sulfur diesel fuel starting in 2008. By 2015 diesel engines larger than 750 horsepower such as locomotives will be required to use low sulfur fuel (17). In order to restore lubricity in ultra low sulfur diesel, some of the railroads may be attracted to use of biodiesel due to its lubricity enhancing qualities even at low blends of 1-2%. One railroad in the state, the Prairie Line, is currently using 2% biodiesel with consideration of using 5% blends in the future (18). River Towboats are responsible for moving considerable volumes of grain from Minnesota to other markets. Their operating season is typically April through early December. There is typically a slack time of barge movement in July and August each year. Because river barges have large tanks and because Minnesota ports are at the terminus, fueling activities are inordinately high for Ramsey County. The next port downstream with significant fuelling activity for barges is St. Louis, Missouri. (R. Lambert, Minnesota Department of Transportation, personal communication, June 2004) The Tennessee Valley Authority prepares a detailed study of diesel fuel usage by towboats based on freight movement patterns on the nation’s waterways in order to allocate tax revenues to sections of the system in for lock maintenance. The pattern of towboat usage of fuel was derived from the monthly pattern of grain movements through Lock 27 at Granite City, Illinois, with reallocation for the months of December, January, February and March when the Mississippi River is not open for barges in Minnesota (19). Great Lakes Vessels coming in to the ports of Duluth, Two Harbors, and Silver Bay utilize #2 diesel for their on-board generators, which power many ship functions except propulsion. For propulsion, large freighters generally use the heavier bunker grades of fuel. Bunker fuel requires additional processing on-board before it can be used. It is typically heated, centrifuged, strained, and has water removed before it can be burned. ( J. Cuzio, Murphy Oil Company, June 2004, personal communication) EIA data on diesel used as ships and barges was considered to be underreported based on interviews with diesel fuel merchants, so the author revised published data upward (14). Airlines are listed as a category, but were not analyzed. State Highway Off-Road Equipment is a category that includes payloaders, road graders, tractors and mowers that support roadway services, primarily.

23
Local Highway Off-Road Equipment includes payloaders, road graders, tractors and mowers that support roadways in counties and cities for the most part. Certain addition equipment may be used to support other public utilities, especially in cities. Fuel Oil--Residential Heating The EIA of the U.S. Department of Energy publishes data by state for this category of fuel oil use (14). U.S Census Data from 2000 estimates that 6.4% of Minnesota homes use either fuel oil or kerosene. This body of data was extracted and analyzed to determine the number of homes in each Minnesota County that heat with fuel oil (20). Because the prevalence of house heating with kerosene is so low, all respondents were assumed to be using fuel oil. Published data of heating degree days (HDD) were examined for various state locations to determine the pattern of annual usage in homes as portrayed in Figure 4.3 (21). The pattern of HDD for St. Cloud was considered representative of statewide patterns. St. Louis County leads the state in the number of homes using fuel oil for home heating. Fuel Oil—Commercial Heating The EIA publishes an overall figure for this category of fuel oil usage. Usage of fuel oil in commercial facilities is more common in older buildings and in areas of the state without access to natural gas. Therefore, the pattern of usage was assumed to conform to the same proportions as the residential heating oil usage pattern (14). Fuel Oil—Industrial Heat & Processing The EIA publishes an overall figure for this category of fuel oil usage. Industrial users have shown movement away from fuel oil to natural gas in the last three decades due to generally cheap natural gas and broader availability. Usage of fuel oil in industrial facilities is more common in older plants and in areas of the state without access to natural gas. Because this fuel is used in industrial processing, the pattern of usage was applied equally in each month (14).
24
Chapter 6: Key Classes of Distillate Users for Policy-Makers After considering the categories of diesel and fuel oil users and the opportunities to reduce harmful emissions such as particulates and poly-aromatic hydrocarbons, certain situations seem likely to receive high consideration for higher blends of biodiesel. The following categories seem to be likely candidates for utilization of higher biodiesel blends:
School buses Transit Buses Diesel Gensets (Emergency & Peak-Shaving) Diesel Generators (Base Load) State Tax Exempt Vehicles State Off-Road Equipment Non-State Tax Exempt Vehicles Non-State Off-Road Equipment Fuel Oil in Residential, Commercial, and Industrial Uses
School buses are likely candidates for using blends of biodiesel because of published studies that identify air quality on and around diesel school buses as the worst air encountered by young children during a school day (22). School buses are centrally fueled, so higher blends of biodiesel could more easily be used in these vehicles than those of the general public. Transit buses are likely candidates because they operate in congested urban settings that could benefit from reduced emissions. Transit buses are also fueled at central locations. Because diesel “gensets” for emergency and peak-shaving operate near ground level and in many cases by hospitals, factories, schools, and critical installations, they are prime candidates. The larger generators that serve as intermediate and baseload capacity may be candidates as well, especially when located in close proximity to substantial populations. The tax exempt vehicles owned by state government, as well as those owned by counties and cities, are often centrally fueled and include snowplows and other street maintenance equipment. Many of these vehicles operate in urban settings with air quality issues. The tax exempt fleets also include a substantial amount of diesel equipment that can operate off-road. Fuel oil usage in residential, commercial, and industrial settings represents an additional opportunity for usage of biodiesel, particularly in urban settings with air quality issues.

25
Chapter 7: Using the Workbook to Analyze Key Policy Scenarios The following scenarios were established and solved using the “Biodiesel Policy Analysis Workbook”: Statewide Scenario-----B2 Biodiesel Mandate in Engines except excluded classes Statewide Scenario---- B20 in School Buses Statewide Scenario---- B20 in Gensets (Peak-Shavers and Emergency) Statewide Scenario---- B5 in State Tax-Exempt Vehicles and Equipment Statewide Scenario---- B5 in County and City Tax-Exempt Vehicles Statewide Scenario---- B5 in Fuel Oil in Residential, Commercial, and Industrial classes Metro Scenario---------B5 in State Tax-Exempt Vehicles and Equipment Metro Scenario---------B5 in County and City Tax-Exempt Vehicles and Equipment Metro Scenario---------B20 Transit Buses Metro Scenario---------B20 Fuel Oil in Residential, Commercial, and Industrial classes Metro Scenario---------B5 in Fuel Oil in Residential, Commercial, and Industrial classes B2 Biodiesel Mandate in Engines Except Excluded Classes, Statewide. In this instance the total amount of B100 necessary to achieve 2% blends (B2) in the state of Minnesota for the diesel utilized in engines with the exception of electrical generation, railroads, and military vehicles and equipment. The calculated figure is 17,058,105 gallons of B100, which consists of 13,316,303 gallons on-road and 3,741,802 gallons off-road. B20 in School Buses, Statewide. The scenario using B20 in all state school buses would require 3,178,934 gallons of B100, statewide, with 1,538,289 needed in the Metro Counties. B20 in Gensets (Peak-Shavers and Emergency), Statewide. This statewide scenario would require 260,960 gallons of B100, with much of this usage occurring during the summer months when weather conditions may favor the use of biodiesel to reduce the formation of ground- level ozone and particulates. B5 in State Tax-Exempt Vehicles and Equipment, Statewide. In this scenario it is estimated that 90,204 gallons of B100 would be necessary to achieve B5 in the current fleet of MnDOT vehicles on the road. An additional 22,551 gallons of B100 would be needed for the off-road MnDOT machines, statewide. B5 in County and City Tax-Exempt Vehicles and Equipment, Statewide. In this scenario it is estimated that 270,613 gallons of B100 would be necessary to achieve B5 in the fleet of county and city vehicles on the road. An additional 67,653 gallons B100 would be needed for off-road equipment, statewide.

26
B5 in all Fuel Oil, Statewide. In this scenario it is estimated that 8,577,650 gallons of B100 would be needed, statewide, with 55.8% used residentially, 20.7% used commercially, and 23.5% used industrially. In the Twin Cities Metropolitan area, the following scenarios are presented: B5 in State Tax-Exempt Vehicles and Equipment in the Metro-area. This scenario would require 11,484 gallons of B100 in vehicles and 2,871 gallons needed for off-road equipment in the metropolitan area. B5 in County and City Vehicles and Equipme nt in the Metro-area. Counties would require 72,572 gallons of B100 for on-road vehicles and an estimated 18,143 gallons for the off-road, unlicensed machines of the counties and cities of this area with key air quality issues. B20 Transit Buses in the Metro-area. If the transit buses of the Twin Cities Metropolitan area were to use B20 in a move to reduce emissions affecting denser populations, 2,264,000 gallons of B100 would be needed with only 192,440 more gallons needed in outstate transit buses. B20 Fuel Oil in Residential, Commercial, and Industrial Classes in the Metro-area. In the event that efforts were made to try to reduce emissions from fuel oil usage in the Metro area, a total of 3,926,751 gallons of B100 would be required. The largest class of fuel oil users would be residential users requiring 2,190,885 gallons per year. B5 Fuel Oil in Residential, Commercial, and Industrial Classes in the Metro-area. Using a less aggressive approach of B5 in fuel oil would require 981,688 gallons of B100. Residential, commercial and industrial classes would require 55.8%, 20.7%, and 23.5%, respectively in the three classes.

27
Chapter 8: Conclusions
Diesel fuel and fuel oil usage patterns in Minnesota reflect the fact that diesel fuel is the “fuel of commerce.” The usage patterns for diesel fuel and fuel oil provide an interesting frame of reference to observe all sorts of economic activity in the state. In order to comply with more stringent air quality standards and respond to air quality issues emerging due to greater congestion in the Minneapolis-St. Paul Metropolitan area, the usage patterns of diesel and fuel oil may suggest target categories of machines for various blends of biodiesel. Research with biodiesel reveals that in addition to restoring lubricity in ultra- low sulfur diesel fuel, emissions of particulates, poly-aromatic hydrocarbons, and VOC’s will be reduced by usage of higher blends of biodiesel. The accompanying workbook was constructed in order to support analysis of policy choices that establish biodiesel blends for various categories of machines. The workbook can help policymakers focus on the categories of machines using distillate fuels and determine how much biodiesel would be required to provide blends for particular categories. As time goes by, the data populating the Data worksheet will become out of date. When this occurs it will be possible to update the figures and use the workbook framework to estimate costs and the potential for emissions reductions possible by use of this renewable fuel. Readers of this report are welcome to pose various scenarios of blend rates applied to various classes of machines whether on-road or off-road, whether metro or outstate, whether private or part of publicly owned fleets of vehicles. The policy analysis tool represented by this workbook is available at the following website for investigation by any interested parties: http://www.lrrb.org/pdf/MNBiodieselPolTool120904.xls Recommendations for Implementation After consultation with contracting authorities in the Research Services Division of the Minnesota Department of Transportation and the Center for Transportation Studies (CTS) at the University of Minnesota, the following dissemination opportunities were pursued:
1) Presentation of research at the CTS Environmental Seminar, February 24, 2004. 2) Presentation of research findings at the CTS Annual Research Conference, May 4, 2004. 3) Demonstration of workbook and presentation of research findings at Minnesota
Pollution Control Agency (MPCA) with MPCA and MnDOT staff, August 12, 2004. 4) Poster presentation planned for National Biodiesel Conference & Expo at Fort
Lauderdale, FL on January 30- February 2, 2005. 5) Posting of this research report and the policy tool on MnDOT website by January 31, 2005.

28
Further Research Suggestions Data on fuel usage patterns by certain categories of machines were difficult to obtain. More information could be gathered on the inventory and size of diesel-powered machines owned by minor civil divisions (MCD’s), counties and units of state government. A better understanding of the diesel usage by state tax-exempt and non-state tax-exempt fleets would permit more accurate estimates in this category of users. Fuel oil usage in Minnesota has declined drastically from the 1960’s and 1970’s as natural gas has increased in availability, even in rural areas. Usage of fuel oil is certainly more dominant in the New England states where substantial research has been conducted using biodiesel blends. Fuel oil suppliers in Massachusetts, Pennsylvania, New York, and Maine are marketing biodiesel blended with low-sulfur No. 2 fuel oil as “bioheat” to customers. Research conducted by the Massachusetts Oilheat Council (MOC) and the National Oilheat Research Alliance found that B20 reduced sulfur oxide emissions by 80 percent or more and nitrogen oxide emissions by 20 percent (23). The staff of the Minnesota Pollution Control Agency may have the capability to utilize air quality models to determine if biodiesel blended with fuel oil would provide substantial improvements to emissions, especially in the Twin Cities Metropolitan area. Among the classes of diesel powered on-the-road vehicles, pick-up trucks and sports utility vehicles seem to show the most promise of growth in the next decade due to attractive towing, torque, fuel economy, and engine life available from these more expensive engines. Efforts should be made to quantify geographically the growing proportion of pick-ups using diesel fuel. Because U.S. consumers have demonstrated much more reluctant to seek diesel-powered automobiles than European consumers, diesel will remain the “fuel of commerce.” Continuing efforts of the Minnesota Pollution Control and the Environmental Protection Agency can be expected to further document the emissions risks posed by diesel fuel and fuel oil. Work by these agencies may further refine the selection of distillate users possessing the greatest need for reductions in targeted emissions.

29
REFERENCES
(1) M. Brain (Internet), How Diesel Engines Work (cited December 2004), http://auto.howstuffworks.com/diesel3.htm.
(2) Minnesota Department of Agriculture (Internet), Energy Balance/Life Cycle
Inventory for Ethanol, Biodiesel and Petroleum Fuels (cited December 2004), http://www.mda.state.mn.us/ethanol/balance.html.
(3) National Biodiesel Board (Internet), Lubricity Benefits (cited December 2004),
http://www.biodiesel.org/pdf_files/Performance.PDF.
(4) Environmental Protection Agency (Internet), Fine Particle (PM 2.5) Designations (cited December 2004), http://www.epa.gov/pmdesignations/faq.htm#0.
(5) K.L. Bickel, J. McDonald, J. Fruin and D. Tiffany, Economic Comparison of
Biodiesel Blends to Commercially Available Exhaust Emission Reduction Technologies in Underground Mines: Final Report to the National Biodiesel Board (St. Paul, MN: University of Minnesota Center for Diesel Research and Department of Applied Economics, January 1997).
(6) Center for Diesel Research, University of Minnesota(Internet), Improving Air
Quality by Using Biodiesel in Generators (cited December 2004), http://www.me.umn.edu/centers/cdr/zooschool/ .
(7) T.R. Aulich and K. Neusen, Estimated Economic Impact of Twin Cities Ozone
Nonattainment (Grand Forks, ND: Energy and Environment Research Center, February 1999).
(8) Environmental Protection Agency (Internet), Diesel Exhaust and School Bus
Idling, EPA420-F-03-005, April 2003
(9) Minnesota Statutes 239.77 (Internet), (cited December 2004), http://ww2.revisor.leg.state.mn.us:8181/SEARCH/BASIS/mnstat/public/www/DDW?W%3DTEXT+PH+IS+%27biodiesel%27+ORDER+BY+SORT_KEY/Ascend%26M%3D2%26K%3D239.77%26R%3DY%26U%3D1.
(10) U.S. Department of Commerce, Bureau of the Census (Internet), 1997 Vehicle
Inventory and Use Survey, Microdata File on CD, 2000 (cited March 2004), http://www.census.gov/svsd/www.tiusview.html.
(11) Ward’s Automotive Yearbook 2003, U.S. Diesel New-Car Market Share, Southfield, Michigan: Ward’s Communications, p. 47. (12) Family Motor Coach Association, “FMCA Readership Survey,” Cincinnati,
Ohio, 2004.

30
(13) Texas Trader (Internet), “RV Weight and Fuel Economy,” (cited January
2004),http://www.ttrv.org/Articles/Recreational_Vehicles/Buying_an_RV/RV_ Weight_and_Fuel.
(14) Energy Information Agency, U.S. Department of Energy, Fuel Oil and
Kerosene Sales 2002, Table 4: “Sales of Distillate Fuel Oil by Energy Use, 2001 and 2002,” p. 4-7. (15) Minnesota Department of Agriculture, Minnesota Agricultural Statistics 2003, County Highlights, p. 97-118. (16) Minnesota Department of Commerce, The Minnesota Utility Data Book, 2000, Table 10: “Net Generation and Fuel Consumption for Electric Generating Plants Producing Power for Minnesota during 2000.”
(17) U.S. Environmental Protection Agency (Internet), New Clean Diesel Rule Major Step in a Decade of Progress (cited December 2004), http://yosemite.epa.gov/opa/admpress.nsf/b1ab9f485b098972852562e7004dc686/f20d2478833ea3bd85256e91004d8f90?OpenDocument.
(18) American Lung Association of Minnesota (Internet), Clean Air Choice (cited
December 2004), http://www.alamn.org/outdoor/PrairieLine.asp.
(19) U.S. Department of Agriculture, Agricultural Marketing Service, Transportation & Marketing Division, Grain Transportation Report, December 4, 2003, p. 7.
(20) U.S. Census Data 2000 (Internet), “Type of House Heating Fuel Used” (cited
December 2003), http://www.lmic.state.mn.us/datanetweb/php/census2000/HouSF3SReport.php?&subtop=/
(21) Midwestern Regional Climate Center (Internet), Historical Climate
Summaries 1971-2000 for selected Minnesota cities (cited January 2004), http://mcc.sws.uiuc.edu/html/MWclimate_data_summaries.htm#.
(22) P. Monahan, “Pollution Report Card, Grading America’s School Bus Fleets,” Union of Concerned Scientists (February 2002),1-2.
(23) National Biodiesel Board (Internet), “Bioheat Offers Cost-Competitive,
Environmentally Friendly Alternative to Regular Home Heating Oil,” (cited December 2004), http://www.biodiesel.org/resources/pressreleases/hom/20041123_bioheat.pdf

Appendix A

A-1
239.77 Biodiesel content mandate. Subdivision 1. Biodiesel fuel. "Biodiesel fuel" means a renewable, biodegradable, mono alkyl ester combustible liquid fuel derived from agricultural plant oils or animal fats and that meets American Society for Testing and Materials Specification D6751-02 for Biodiesel Fuel (B100) Blend Stock for Distillate Fuels. Subd. 2. Minimum content; effective date. (a) Except as otherwise provided in this section, all diesel fuel sold or offered for sale in Minnesota for use in internal combustion engines must contain at least 2.0 percent biodiesel fuel oil by volume. (b) The mandate in paragraph (a) is effective on and after the date that the conditions in clauses (1) and (2), or in clauses (1) and (3), have been met: (1) thirty or more days have passed since the commissioner of agriculture publishes notice in the State Register that annual capacity in Minnesota for the production of biodiesel fuel oil exceeds 8,000,000 gallons; (2) eighteen months have passed since the commissioner of agriculture publishes notice in the State Register that a federal action on taxes imposed, tax credits, or otherwise, creates a reduction in the price of two cents or more per gallon on taxable fuel that contains at least two percent biodiesel fuel oil and is sold in this state; (3) the date June 30, 2005, has passed. Subd. 3. Exceptions. (a) The minimum content requirement of subdivision 2 does not apply to fuel used in the following equipment: (1) motors located at an electric generating plant regulated by the Nuclear Regulatory Commission; (2) railroad locomotives; and (3) off-road taconite and copper mining equipment and machinery. (b) The exemption in paragraph (a), clause (1), expires 30 days after the Nuclear Regulatory Commission has approved the use of biodiesel fuel in motors at electric generating plants under its regulation. HIST: 2002 c 244 s 1

Appendix B

B-1
Data Sheet (1/19/05) Copyright, Douglas G. Tiffany, University of Minnesota(codat) 3 4 5 6 7 8 9 10 11 12 13
ProRate Trucks MN Origin
ProRate Trucks Non-MN
Non-ProRate Trucks; 0-6K
Non-ProRate Trucks; 6K-10K
Non-ProRate Trucks; 10K-14K
Non-ProRate Trucks; 14K-16K
Non-ProRate Trucks; 16K-19.5K
Non-ProRate Trucks; 19.5K-26K
Non- ProRate Trucks; 26K-33K
Non-ProRate Trucks; 33K-56K
Non-ProRate Trucks; 56K-113K
Aitkin 331,605 415,558 0 59,862 40,520 55,007 7,748 88,433 169,425 341,587 445,249Anoka 2,657,444 3,330,238 0 651,637 441,087 598,784 84,341 962,647 1,844,298 3,718,390 4,846,813Becker 1,740,925 2,181,681 0 67,171 45,468 61,723 8,694 99,231 190,112 383,296 499,615Beltrami 884,279 1,108,156 0 92,430 62,565 84,933 11,963 136,545 261,601 527,427 687,486Benton 736,899 923,463 0 130,735 88,493 120,131 16,921 193,131 370,012 746,001 972,391Big Stone 607,942 761,857 0 9,622 6,513 8,842 1,245 14,215 27,234 54,907 71,570Blue Earth 2,150,825 2,695,358 0 183,935 124,504 169,017 23,806 271,723 520,583 1,049,575 1,368,091Brown 3,228,541 4,045,922 0 83,178 56,302 76,432 10,766 122,877 235,414 474,632 618,669Carlton 792,167 992,723 0 83,918 56,803 77,112 10,861 123,970 237,509 478,856 624,174Carver 704,660 883,062 0 184,120 124,629 169,187 23,830 271,996 521,107 1,050,631 1,369,467Cass 244,098 305,897 0 84,658 57,304 77,792 10,957 125,063 239,604 483,079 629,680Chippewa 1,128,377 1,414,053 0 38,489 26,053 35,368 4,982 56,859 108,935 219,629 286,281Chisago 580,308 727,227 0 159,232 107,782 146,317 20,609 235,229 450,665 908,611 1,184,348Clay 2,081,741 2,608,783 0 69,300 46,908 63,679 8,969 102,374 196,135 395,439 515,443

B-2
X14 15 16 17 18 19 20 21 22 23 24 25
Cty #
Farm Trucks; 0-6K
Farm Trucks; 6K-10K
Farm Trucks; 10K-14K
Farm Trucks; 14K-16K
Farm Trucks; 16K-19.5K
Farm Trucks; 19.5K-26K
Farm Trucks; 26K-33K
Farm Trucks; 33K-56K
Farm Trucks; 56K-113K
School Buses
Transit Buses
Other Buses
1 Aitkin 0 1,588 7,253 7,125 1,819 35,929 69,469 233,353 313,809 57,6692 Anoka 0 2,006 9,165 9,003 2,299 45,403 87,787 294,884 396,554 691,789 566,0003 Becker 0 3,143 14,361 14,108 3,602 71,143 137,556 462,062 621,372 114,8014 Beltrami 0 2,559 11,691 11,485 2,932 57,915 111,981 376,151 505,841 249,6115 Benton 0 1,208 5,521 5,423 1,385 27,349 52,880 177,627 238,869 127,7856 Big Stone 0 2,788 12,737 12,513 3,195 63,099 122,004 409,819 551,116 26,7817 Blue Earth 0 6,042 27,603 27,117 6,924 136,744 264,399 888,134 1,194,346 127,0158 Brown 0 3,815 17,428 17,121 4,371 86,336 166,934 560,744 754,077 137,3289 Carlton 0 1,666 7,613 7,479 1,910 37,716 72,926 244,963 329,421 95,17810 Carver 0 2,188 9,995 9,819 2,507 49,514 95,736 321,586 432,462 265,217 113,20011 Cass 0 1,722 7,866 7,727 1,973 38,968 75,345 253,089 340,350 129,21512 Chippewa 0 3,136 14,325 14,072 3,593 70,964 137,211 460,901 619,811 48,06213 Chisago 0 1,358 6,206 6,097 1,557 30,745 59,446 199,685 268,533 171,49314 Clay 0 4,834 22,082 21,693 5,539 109,395 211,519 710,507 955,477 138,734 56,600

B-3
X X26 27 28 29 30 31 32 33 34 35 36 37
Cty #
State Tax Exempt
Non-State Tax Exempt
Military On-Road Autos Pickups
Rec. Vehicles
Other On-Road
Farm Off-Road
Military Off-Road
Utility Generation Equip.
Gensets---Interruptible, Peaking
Gensets--- Emergency
1 Aitkin 32,751 24,670 335 12,503 81,600 10,466 170,170 3,356 239 1,8092 Anoka 24,148 200,875 6,525 241,527 812,487 101,921 307,854 0 0 24,3183 Becker 22,607 70,765 657 23,299 124,968 12,293 1,339,663 3,908 278 3,3974 Beltrami 31,520 61,460 868 25,155 141,765 12,902 273,595 0 0 5,1985 Benton 14,035 54,163 749 25,347 118,060 14,729 1,136,083 0 0 8,4376 Big Stone 13,780 21,881 127 4,312 27,023 2,550 836,760 0 0 6697 Blue Earth 25,118 71,798 1,225 41,237 167,934 19,676 3,081,313 12,489 890 7,8998 Brown 13,041 43,088 589 22,143 107,318 9,172 2,821,218 91,274 6,501 3,2389 Carlton 22,265 48,353 693 24,629 128,028 20,780 122,984 802 57 5,44810 Carver 14,060 51,392 1,537 55,622 176,051 14,957 964,465 498,078 35,475 7,86511 Cass 33,571 52,515 594 19,542 120,427 15,985 267,163 0 0 4,51412 Chippewa 16,789 28,781 287 10,193 54,126 3,349 1,468,504 192 14 1,45713 Chisago 14,874 40,401 900 38,813 176,711 24,738 408,932 17,973 1,280 3,45614 Clay 29,475 53,002 1,121 36,981 143,617 12,331 2,081,527 4,576 326 5,689
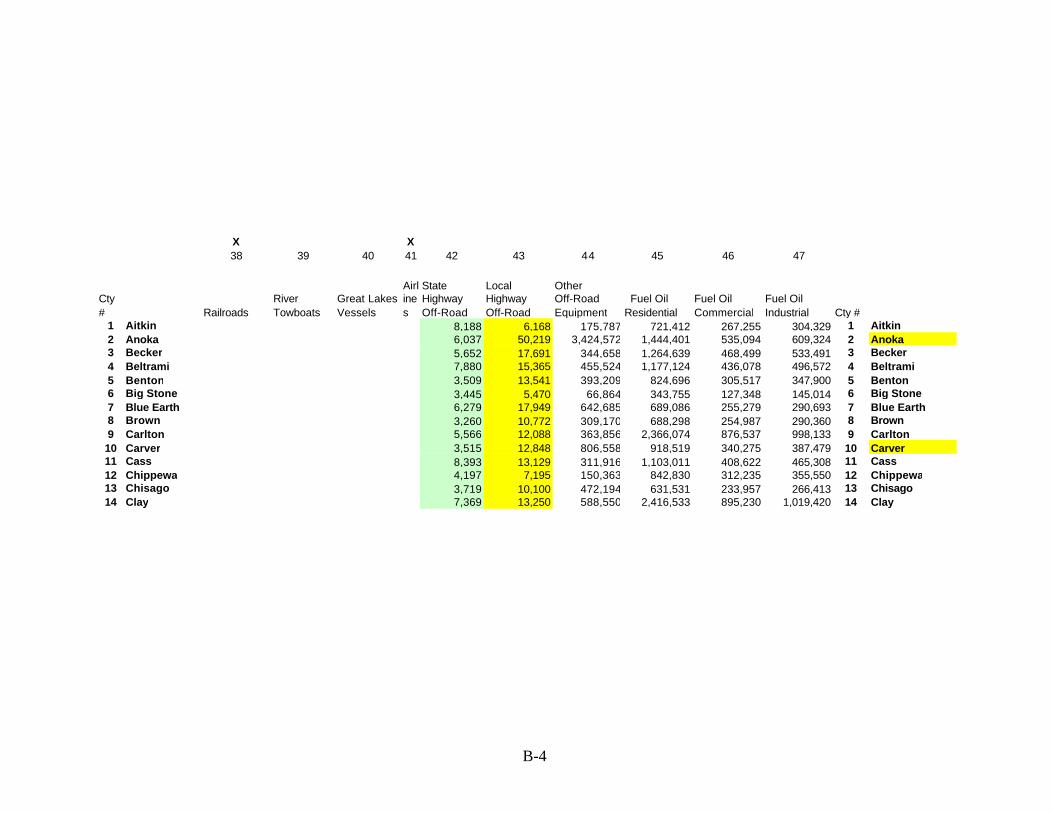
B-4
X X38 39 40 41 42 43 44 45 46 47
Cty # Railroads
River Towboats
Great Lakes Vessels
Airlines
State Highway Off-Road
Local Highway Off-Road
Other Off-Road Equipment
Fuel Oil Residential
Fuel Oil Commercial
Fuel Oil Industrial Cty #
1 Aitkin 8,188 6,168 175,787 721,412 267,255 304,329 1 Aitkin2 Anoka 6,037 50,219 3,424,572 1,444,401 535,094 609,324 2 Anoka3 Becker 5,652 17,691 344,658 1,264,639 468,499 533,491 3 Becker4 Beltrami 7,880 15,365 455,524 1,177,124 436,078 496,572 4 Beltrami 5 Benton 3,509 13,541 393,209 824,696 305,517 347,900 5 Benton6 Big Stone 3,445 5,470 66,864 343,755 127,348 145,014 6 Big Stone7 Blue Earth 6,279 17,949 642,685 689,086 255,279 290,693 7 Blue Earth8 Brown 3,260 10,772 309,170 688,298 254,987 290,360 8 Brown9 Carlton 5,566 12,088 363,856 2,366,074 876,537 998,133 9 Carlton10 Carver 3,515 12,848 806,558 918,519 340,275 387,479 10 Carver11 Cass 8,393 13,129 311,916 1,103,011 408,622 465,308 11 Cass12 Chippewa 4,197 7,195 150,363 842,830 312,235 355,550 12 Chippewa13 Chisago 3,719 10,100 472,194 631,531 233,957 266,413 13 Chisago14 Clay 7,369 13,250 588,550 2,416,533 895,230 1,019,420 14 Clay