Embed Size (px)
Citation preview

DISCUSSION PAPER SERIES
IZA DP No. 11861
Maria De PaolaFrancesca GioiaVincenzo Scoppa
Teamwork, Leadership and Gender
SEPTEMBER 2018

Any opinions expressed in this paper are those of the author(s) and not those of IZA. Research published in this series may include views on policy, but IZA takes no institutional policy positions. The IZA research network is committed to the IZA Guiding Principles of Research Integrity.The IZA Institute of Labor Economics is an independent economic research institute that conducts research in labor economics and offers evidence-based policy advice on labor market issues. Supported by the Deutsche Post Foundation, IZA runs the world’s largest network of economists, whose research aims to provide answers to the global labor market challenges of our time. Our key objective is to build bridges between academic research, policymakers and society.IZA Discussion Papers often represent preliminary work and are circulated to encourage discussion. Citation of such a paper should account for its provisional character. A revised version may be available directly from the author.
Schaumburg-Lippe-Straße 5–953113 Bonn, Germany
Phone: +49-228-3894-0Email: [email protected] www.iza.org
IZA – Institute of Labor Economics
DISCUSSION PAPER SERIES
IZA DP No. 11861
Teamwork, Leadership and Gender
SEPTEMBER 2018
Maria De PaolaUniversity of Calabria and IZA
Francesca GioiaUniversity of Milan
Vincenzo ScoppaUniversity of Calabria and IZA

ABSTRACT
IZA DP No. 11861 SEPTEMBER 2018
Teamwork, Leadership and Gender*
We ran a field experiment to investigate whether individual performance in teams depends
on the gender of the leader. About 430 students from an Italian University took an
intermediate exam that was partly evaluated on the basis of teamwork. Students were
randomly matched in teams of three and in each team we randomly chose a leader with
the task of coordinating the work of the team. We find a positive and significant effect of
female leadership on team performance. This effect is driven by the higher performance
of team members in female led teams rather than due to an improvement in the leader’s
performance. We also find that, in spite of the higher performance of female led teams,
male members tend to evaluate female leaders as less effective, whereas female members
are more sympathetic towards them.
JEL Classification: J16, M12, M54, C93
Keywords: team, leadership, gender, stereotypes, randomized experiment
Corresponding author:Vincenzo ScoppaDepartment of Economics, Statistics and FinanceUniversity of CalabriaVia Ponte Bucci87036 Arcavacata di Rende (CS)Italy
E-mail: [email protected]
* We are grateful to the Dean of the Department of Business and Economics at the University of Calabria for
allowing us to run the experiment. We would like to thank Guido De Blasio, Gabriella Conti, Marco Francesconi,
Victor Lavy, Roberto Nisticò, Marco Savioli, and participants to the 2017 AIEL Conference for useful comments and
suggestions.

2
1. Introduction Women have made progress in many social and economic dimensions, but they are still heavily
underrepresented in apical roles. In 2017 women hold around 20-30% of the seats in the U.S. Congress and
in the national Parliaments of many European countries (USA 20%, France 25%, UK 30%, Italy 31%,
Germany 37%)1. Moreover, in the US women represent only 4% of CEOs and hold only 19% of board seats.
Likewise, only 21% of board members of the largest publicly listed companies in the EU are women
(European Commission, 2016). The under-representation of women in top positions translates into a larger
gender gap at the top quantiles of the earnings distribution.
The so-called glass ceiling, preventing women from obtaining career and wage advancements, has
long attracted the attention of economists, sociologists and experts of organizations and management. The
literature has offered a number of explanations based on differences in productivity, discrimination and
differences in psychological attitudes (such as risk aversion and competitiveness). A related psychological
explanation focuses on gender differences in leadership ability: individuals holding top positions are often
involved in teamwork and have to deal with problems such as free riding and coordination failure for which
leadership can represent a viable solution. A leader is a person typically appointed in an organization to
enhance collective work. The activity of the leader is multidimensional and includes many functions such as
goal-setting, motivating, creating alignment on objectives and strategies, building commitment, optimism,
mutual trust and cooperation, organizing and coordinating activities, strengthening collective identity,
serving as a symbol and promoting social justice and morality (Yukl, 2013; Gardner, 1993). The gender gap
might depend on the fact that men are more effective leaders than women. It could be, for instance, that
women have weaker communication skills or are less able to motivate and head up people. In this paper we investigate if men and women differ in their leadership skills. In our analysis we
mainly focus on the activity of organizing, motivating and coordinating the work of the team. By means of a
field experiment, we study the causal effect of leader’s gender on team performance in a real life
environment represented by the preparation of a university exam. We also investigate whether male and
female leaders are evaluated differently by their team members and the dimensions along which their team’s
activity differs.
Our experiment has involved students enrolled at four different economics courses in an Italian
University. They were offered the possibility to sit the exam according to an alternative examination scheme
introducing teamwork. A total of 538 (out of 743) students joined the experiment. They were randomly
assigned to teams composed by three members and, within each team, a randomly selected member was
appointed to the role of leader. The leader had the task of contacting team members (by e-mail or phone
calls) in order to define team meetings and to organize team studying activities. These activities consisted in
solving one set of exercises assigned during teaching classes (the leader was responsible to deliver the solved
exercises to the course’s instructor) and preparing together the part of the exam evaluated on the basis of
team performance. As a compensation for this additional task, the leaders would receive a fixed reward of 2 1 “Women in National Parliaments”, see: http://www.ipu.org/wmn-e/classif.htm.

3
points to add to the final exam grade if the total grade of their team was at least equal to 18 (i.e. an average
of 6). After taking the test, students were asked to fill out a final questionnaire containing questions on the
activity of the team and individual evaluation of team effectiveness and leadership activity.
The results of our experiment show that teams with a randomly selected female leader significantly
outperform teams coordinated by a male leader: the performance of students in female led teams is about 0.7
points higher than that of students in male led teams. This effect corresponds to about 0.2 SD of the
dependent variable and is robust to the inclusion of several control variables. When digging deeper into this
effect we find that female members seem to react more to a female leader and women appointed as leaders
altruistically devote energies to improve the performance of the whole team (even if this slightly weakens
their own performance). This interpretation is consistent with the answers given by leaders to the post-
experiment survey showing that women have found the role of leader more demanding in terms of effort
compared to their male counterparts. In addition, the effort demanded by the role is increasing in the number
of men in the team.
Using data from the assigned homework and the post-experiment survey, we analyze also if several
dimensions of team activity and team members’ evaluation of leader’s effectiveness vary with the leader’s
gender. We find that female led teams are significantly more likely to submit their homework despite
spending on average the same amount of time working together. This suggests that female leaders were more
effective than men in organizing team members’ work. However, in spite of a better performance of female
led teams, female leaders do not obtain better evaluations from male members of their team. On the other
hand, female members tend to be more sympathetic toward their female leaders. Female leaders themselves
do not seem to be aware of their good results as they are as satisfied as male leaders with the work done by
their team. On the other hand, we find that female leaders are more severe in the judgment they give of the
effort provided by team members.
Our research contributes to the existing literature in different ways. The economic literature
investigating leadership mainly relies on laboratory experiments using minimum effort coordination games
in which the lowest performing player determines group performance. These studies show that, in the
absence of communication, coordination failure can be very common2 and leaders can work as a
“coordination device” and improve organization using one-way communication to convince other team
members that everyone will exert high effort (Sahin et al., 2015; Kriss and Eil, 2012; Brandts and Cooper,
2007; Weber et al., 2001). We add to these works analyzing leadership effectiveness in a real life
environment in which individuals have strong incentives to perform well, leadership is not a one-day role but
a long-term task and leaders can adopt their own leadership style instead of choosing whether to implement
or not pre-determined tasks. Also, instead of considering leadership in a minimum effort coordination game,
2 Costless, non-binding pre-play communication between players can improve coordination and efficiency (Blume and Ortmann, 2007; Devetag and Ortmann, 2007; Van Huyck et al., 1990).

4
we focus on the role of leaders (exogenously defined3) in organizing the work of the team when the total
outcome is equally shared between team members. Secondly, we contribute to the understanding of gender
difference in leadership efficacy. Only few papers consider this type of gender difference finding ambiguous
results. Grossman et al. (2016) run a laboratory experiment with randomly selected leaders who have to
provide guidance on how to play the game to maximize group earnings and show that male leaders have a
greater impact on followers’ decisions compared to female leaders. Moreover, followers are less likely to
both attribute success to female leaders and reward them generously. Reuben and Timko (2017) extend the
work of Grossman et al. (2016) by considering gender differences between elected and randomly-selected
leaders and by analyzing gender differences in re-election. They find evidence of gender difference in the
effectiveness of leaders only for elected leaders, while no difference emerges for randomly-selected ones.
They also find that unsuccessful female leaders are re-elected at considerable lower rates than unsuccessful
male leaders. No gender difference in performance with randomly selected leaders is also highlighted by
Timko (2017a, 2017b), while weak differences are reported by Dufwenberg and Gneezy (2005) who, using a
minimum effort coordination game, investigate the effect of team composition on team performance
(differences in the fraction of men and women in a team only slightly affect coordination effectiveness).4
Eagly (2007) and Eagly and Carli (2003) review the evidence and the reasons of women’s disadvantage in
accessing and occupying leadership positions despite their high effectiveness.
We investigate whether women and men differ in their leadership skills focusing on their ability to
coordinate and organize teamwork. Our results show a positive and significant effect of female leadership on
team performance suggesting that gender differences in leadership effectiveness might depend on the precise
task performed by the leader: while women might lack some of the qualities that define a good leader they
might be endowed with others. This implies that when analyzing gender differences in leadership it is
important to answer the question of what behaviors characterize effective leaders, that is, what makes a good
leader. In our analysis we have stressed the ability to support and motivate team members to engage in
collaborative efforts. However, also more masculine qualities, such as the execution of authority, self-
confidence, power, might be relevant. As argued by situational theories of leadership (see for instance,
Ayman, 2004; Chemers, 1997), the appropriateness of particular types of leader behaviors depends on the
context and, as shown by our findings, female can be particularly effective in those circumstances where
cooperation is important. Consistently with previous research (see for instance, Eagly and Carli, 2003), we
also find that women still face some difficulties in having recognized their merits especially in male
dominated teams.
3 A number of papers investigate how leader’s effectiveness can be enhanced through mechanisms that strengthen legitimacy such as democratic election (Brandts et al., 2015) and through different communication modes (Kriss and Eil, 2012). 4 Chakraborty and Serra (2017) show in a lab experiment that women tend to self-select less in leadership positions. Men and women seem to display distinct leadership styles and women seem to be more affected by distributional concerns and/or feedback.

5
The paper is organized as follows. Section 2 describes the experiment, presents the data and reports
some balance checks. In Section 3 we carry out our main empirical analysis. In Section 4 we study team
members’ evaluations and team activity. Section 5 concludes.
2. Experimental Design and Data
2.1. Design and Procedure
We run a field experiment involving students enrolled in the academic year 2015-2016 at the courses of
Microeconomics, Macroeconomics, Econometrics and Personnel Economics offered by the First and Second
Level Degree Course in Business and Administration at the University of Calabria.5 Courses are worth 10
credits each, corresponding to 60 hours of teaching and to a nominal 250 hours of study, and are held during
the second semester (from February to June).
At the beginning of the courses, we informed students that they could choose whether to sit the
standard final exam at the end of the course or join an alternative examination scheme. As required by the
university administration, for ethical reasons, students were free to join the experiment and free to leave it at
any point and sit the standard exam.
The alternative exam scheme was composed of two tests, each covering half of the program, to be
taken right after the first half of the course (intermediate test) and at the end of it (final test), respectively.
The intermediate test was composed by two parts, one evaluated on the basis of individual performance (“the
individual part”) and the other evaluated on the basis of team performance (“the team part”). The individual
part counted for 2/3 of the total mark (students could score a maximum of 20 points). In the team part,
instead, students could gain a maximum of 10 points (1/3 of the total mark) and the score assigned to each
student was given by the average score obtained by the members of the team.
Teams were composed by three members, one of whom was randomly chosen and appointed as the
leader. The leader had the tasks of coordinating the team, calling team members’ meetings, organizing team
studying activities, guaranteeing the solving of a set of exercises assigned during the classes and submitting
them to the course’s professor.6 As a compensation for such additional activities, the leader would receive a
fixed reward of 2 points to add to the final exam grade if the total grade of his/her team was at least equal to
18 (i.e. an average of 6). The final test, to be taken at the end of the course to complete the exam in the
alternative scheme, was evaluated exclusively on the basis of individual performance with scores ranging
5 The University of Calabria is a middle-sized public university located in the South of Italy. It has currently about 30,000 students enrolled in different Degree Courses and at different levels of the Italian University system. Since the 2001 reform, the Italian University system is organized around three main levels: First Level Degrees (3 years of legal duration), Second Level Degrees (2 years more) and Ph.D. Degrees. In order to gain a First Level Degree, students have to acquire a total of 180 credits. Students who have acquired a First Level Degree can undertake a Second Level Degree (acquiring 120 more credits). After having accomplished their Second Level Degree, students can enroll in a Ph.D. degree. 6 Solving the exercises was not mandatory for passing the exam. We analyse the probability of solving and submitting the homework in Section 3.

6
from 0 to 30 (as in the standard exam). The final exam grade under the alternative examination scheme was
given by the average of the grades obtained at the intermediate and final test.
We explained to students that the aim of the experiment was to study the performance under teamwork
but we never mentioned the issue of gender and leadership to avoid to influence their behavior.
Students were given one week to choose whether to join the alternative exam scheme or to sit the
standard exam.
Students enrolled in the experiment by filling out an online survey asking questions on family
background, risk preferences, social attitudes and expectations on performance. Once obtained the list of
participating students, within each course, we randomly assigned them to teams of three members and,
within each team, we randomly selected one member to act as the leader. We then defined two treatments on
the basis of the gender of the leader: Female Led Team for teams with a female leader and Male Led Team
for teams with a male student as the leader.
Students were promptly informed of the team composition, the name of the leader and the parts of the
course program assigned to teamwork and to individual work. Within each course, all students attended the
lectures in the same room, at the same time and with the same instructor and teaching material. After the first
half of the teaching classes, students undertook the intermediate test. Within each course, all students took
the test with the same questions and at the same time.
After the intermediate test, students were asked to fill in an online survey available on the course
webpages. Answering the final survey was strongly encouraged but not mandatory. Students could answer
until the exam grades were published. The aim of such final questionnaire was to collect information on team
activity and individual evaluations of team effectiveness and leadership activity. All questions were identical
for leaders and members, except one which was phrased slightly differently to elicit respectively teammates’
evaluation of the effort and effectiveness of the leader and leaders’ evaluation of how much demanding they
found their role.
2.2. Descriptive Statistics and Balance Checks
The design of the experiment produced three subsamples of students: those who enrolled in the courses
(743), those who joined the experiment (538) and those who actually showed up at the intermediate test
(433).
In Table 1 we provide descriptive statistics separately for the three subsamples of students. About 50%
of students attending the courses and taking the test are women. Students in all subsamples are on average 22
years old. Students enrolled in the courses and joining the experiment have an average High School Grade of
82.5 (High School Grade ranges between 60 and 100), while High School Grade is slightly higher among
students taking the test (83.2), suggesting a selection of better students in the test. About 51% of students
enrolled in the courses have studied in a Lyceum. This percentage becomes higher in the other two
subsamples (about 53% and 54% for students joining the experiment and sitting the exam, respectively).

7
As expected, one third of students has been assigned the role of leader and 52% of the teams are led by
a woman. 14% of teams who take the intermediate test are composed by three women, about 33% by two
women and one man, about 40% by only one female and two men and in about 13% of teams all the
members are men.
From the online survey we observe that students expect to obtain a grade of at least 25 in both
subsamples. Students’ answers to the on-line survey filled-in when joining the experiment allow us to build
self-reported measures of risk attitudes and trust. The question we used to elicit risk attitudes is formulated as
follows: “A lottery A allows you to obtain 100 euros with probability 50% or 0 euro with probability 50%
(that is, when tossing a coin, head means winning 100 euros while tail means winning zero). Please, choose
your favourite option between the lottery and a certain amount of 10 euros”. For students choosing the
certain amount there were no further questions. For the other students, we asked subsequent questions
increasing the certain amount in steps of 10 euros up to 90 euros if the chosen option was the lottery. The
questions ended when the chosen option was the certain amount. We built the variable Risk Aversion taking
values from 0 (for students preferring the lottery to a certain amount of 90 euros) to 9 (for students preferring
10 euros with certainty to the lottery). Risk Aversion is on average 4.8 in both subsamples.
The question we used to elicit trust is formulated as follows: “Consider the following situation: two
subjects A and B (who do not know each other and who cannot communicate) have got 120 euro each.
Subject A can transfer to subject B one of the following amounts {0, 20, 40, 60, 80, 100, 120}. The amount
decided by subject A is tripled by a benefactor before being transferred to subject B (for example, if A
decides to transfer 80 euro, B will receive 240 euro). B can then choose to transfer the amount that s/he
prefers (also zero) to subject A. The final amount earned by each subject will be the initial endowment minus
the amount transferred plus the amount received. If you were subject A, how much would you transfer to
subject B?”. The variable Trust simply reflects the values chosen by students and has an average of about 56
in both subsamples.
On average 2.6 team members show up at the intermediate test;7 in 68.6% of teams all members take
the intermediate test, in 26.8% of teams two members show up and in only 4.6% of teams only one member
takes the test.
In the final sample, about 40% of students are enrolled in the course of Microeconomics, 23% in
Macroeconomics, 25% in Personnel Economics and 12% in Econometrics.
Students taking the test obtain an average grade of 6 at the team part and of 11.8 at the individual part.
7 We informed students that if one or two team members did not show up at the intermediate exam, in order to compute the score obtained in the team part of the test, we would replace the score of the absent student/s with one (two) randomly selected student/s sitting the test.

8
Table 1. Descriptive Statistics. Mean and Standard Deviation Enrolled at the
courses Joining the Experiment
Taking the Intermediate test
Female 0.499 0.496 0.487 (0.500) (0.500) (0.500) Age 22.266 22.068 21.902 (2.370) (2.363) (2.300) High School Grade 82.495 82.530 83.236 (10.716) (10.736) (10.805) Lyceum 0.506 0.526 0.540 (0.500) (0.500) (0.499) Leader 0.335 0.346 (0.472) (0.476) Female Led Team 0.522 0.517 (0.500) (0.500) Perc. Women 0.494 0.497 (0.291) (0.296) Expected Grade 24.926 25.141 (2.493) (2.303) Risk Aversion 4.866 4.838 (2.187) (2.152) Trust 56.468 55.612 (34.847) (34.830) Macroeconomics 0.234 0.231 (0.424) (0.422) Microeconomics 0.387 0.395 (0.487) (0.489) Personnel Economics 0.273 0.254 (0.446) (0.436) Econometrics 0.106 0.120 (0.308) (0.325) # members present 2.640 (0.569) Grade Team Part 6.036 (3.487) Grade Individual Part 11.797 (6.212) Observations 743 538 433
Notes: Standard Deviations are reported in parentheses.
To investigate whether the gender of the leader matters for team performance we need comparable
individuals in teams led by men and by women. In Table 2, we carry out the corresponding balance checks
by studying the impact of individual characteristics on the probability of being assigned to a female led team,
both in the sample of students joining the experiment and in the sample of students showing up at the
intermediate test, conditional on being a woman. Obviously, being a woman increases the probability of
having a female as a leader in both samples. The other characteristics are equally balanced in the two
treatments except for Trust that is positively associated with the probability of being assigned to a female led
team. Therefore, a student with a better High School Grade, for example, is not more likely to be associated
with a female leader.

9
Table 2. Balance Checks. The Probability of Being Assigned to a Female Led Team as a Function of Individual Characteristics. Dependent Variable: Female Led Team Joining the Experiment Taking the Intermediate test (1) (2) Female 0.335*** 0.359*** (0.043) (0.047) Age -0.012 -0.012 (0.011) (0.013) High School Grade 0.001 -0.001 (0.002) (0.002) Lyceum -0.004 -0.008 (0.041) (0.046) Expected Grade -0.004 0.000 (0.008) (0.009) Trust 0.001* 0.001* (0.001) (0.001) Risk Aversion 0.014 0.016 (0.009) (0.010) Macro -0.048 -0.095 (0.055) (0.061) Personnel Ec. 0.048 0.038 (0.056) (0.064) Econometrics 0.119 0.115 (0.092) (0.100) Observations 538 433 Adjusted R-squared 0.115 0.132 Notes: OLS estimates (Linear Probability Model). Standard errors (corrected for heteroskedasticity) are reported in parentheses. The symbols ***, **, * indicate that the coefficients are statistically significant at the 1, 5 and 10 percent level, respectively.
In Table 3 we show some statistics on individual pre-determined characteristics for male led teams
and for female led teams. We focus only on team members disregarding leaders and we consider students
present at the test. We find that all the characteristics are well balanced across the two groups. We find
similar results if we consider the students joining the experiment.
Table 3. Students’ Characteristics across Treatment and Control Group. Only Team Members Male Led Team Female Led Team
Mean Std. Dev. Mean Std. Dev. Diff. S.E. Female 0.467 0.501 0.486 0.501 0.019 0.060 Age 21.909 2.397 21.774 2.070 -0.134 0.267 High School Grade 83.852 10.055 83.000 11.014 -0.852 1.252 Lyceum 0.519 0.502 0.554 0.499 0.036 0.059 Expected Grade 25.185 1.944 25.108 2.507 -0.077 0.265 Trust 52.593 34.446 59.595 34.084 7.002 4.08 Risk Aversion 4.800 2.311 4.959 2.023 0.159 0.259 Obs. 135 148

10
2.3. Working in Team
Preliminarily, we try to verify if students assigned to the same team have effectively worked together.
Despite asking them to work in team and to solve a number of exercises together, we are not able to directly
check if this actually happened or instead students worked separately, disregarding the assigned teammates.
In order to gather some information on the amount of time team members have worked together, we
have included the following question in the post-experiment survey: “How many hours on average have you
worked with your team members each week?”. Students answering to the survey report a weekly average
number of 3.87 hours spent working with the team, which increases to 4 for students who show up at the
intermediate test. Leaders also report an average number of 3.96 hours of teamwork per week. These answers
suggest that team members have effectively worked together.8
An alternative way to understand whether team members have cooperated in studying activities is to
analyze the correlation of students’ performance within each team. Since teams are randomly built, in
absence of cooperation we should observe no correlation among teammates’ performance.
In the first three columns of Table 4 we regress the performance in the team part of student i on the
average performance on the team part of his/her teammates (Team Grade Teammates (avg)). We control for
course dummies, Female, High School Grade, Age, and other individual’s and group’s characteristics. We
find a very strong effect of the performance of teammates on a student’s own performance: an increase of 1
point in the average performance of teammates increases student’s performance by about 0.28-0.39 points
with a t-stat well above 4. This evidence strongly supports the idea that team members have worked together
and are affected by common factors.
We find a similar effect, although smaller in magnitude, for the performance in the individual part of
the exam. In columns (4)-(6) we regress student i’s individual grade on the average grade of his/her
teammates on the individual part. An increase of one point in the (average) performance of teammates in the
individual part significantly increases by about 0.18-0.28 points the performance of student i.
While the effect on the team part corresponds to about 0.08 SD, the effect on the individual part is
equal to 0.03 SD. These findings suggest that students have worked together in the team part but there have
been spillovers also on the individual part of the exam.
On the other hand, as expected, we do not find any correlation among students’ predetermined
measures of abilities, such as High School Grades (ρ=-0.068, p-value=0.16), Expected Grade (ρ=-0.021, p-
value=0.66), and so on.
8 About 12% of students report to have studied together with the members of their team also for the individual part of the exam.

11
Table 4. Correlations of Performance among Teammates Grade Team Part Grade Individual Part (1) (2) (3) (4) (5) (6) Team Grade Teammates (avg) 0.393*** 0.387*** 0.277*** (0.055) (0.055) (0.063) Individual Grade Teammates (avg) 0.275*** 0.270*** 0.182*** (0.055) (0.055) (0.059) Female -0.414 -0.465 -0.484 -0.306 -0.335 -0.281 (0.358) (0.363) (0.361) (0.662) (0.667) (0.676) Age -0.107* -0.115* -0.061 -0.078 -0.096 -0.258* (0.057) (0.059) (0.092) (0.095) (0.096) (0.143) High School Grade 0.123*** 0.118*** 0.124*** 0.253*** 0.242*** 0.233*** (0.014) (0.014) (0.015) (0.024) (0.024) (0.025) Lyceum 0.680** 0.705** 0.745*** 0.583 0.583 0.559 (0.294) (0.294) (0.284) (0.521) (0.522) (0.513) # members present -0.072 -0.036 0.025 -0.476 -0.450 -0.472 (0.234) (0.239) (0.245) (0.453) (0.456) (0.469) Perc. Women 0.245 0.284 0.151 0.624 0.635 0.301 (0.619) (0.622) (0.618) (1.121) (1.131) (1.135) Expected Grade 0.109 0.076 0.252** 0.228** (0.071) (0.069) (0.112) (0.109) Trust -0.006 -0.006 -0.001 -0.000 (0.004) (0.004) (0.007) (0.007) Risk Aversion -0.034 -0.033 -0.001 -0.008 (0.070) (0.069) (0.117) (0.115) Macro -1.393*** 0.022 (0.440) (0.734) Personnel Ec. 0.783** 3.041*** (0.385) (0.777) Econometrics -0.861 1.327 (0.678) (1.185) Constant -4.349** -6.053** -6.106** -10.029*** -15.015*** -9.779** (1.840) (2.568) (3.005) (3.268) (4.224) (4.965) Observations 433 433 433 433 433 433 Adjusted R-squared 0.241 0.244 0.283 0.242 0.245 0.274 Notes: OLS Estimates. The dependent variable is performance in the team part in columns (1)-(3) and performance in the individual part in columns (4)-(6). Standard errors (corrected for heteroskedasticity and allowing for clustering at the team level) are reported in parentheses. The symbols ***, **, * indicate that the coefficients are statistically significant at the 1, 5 and 10 percent level, respectively.
3. The Impact of Female Leadership on Team Performance
In this section, we investigate our main research question, that is if the gender of the leader influences the
performance obtained by the team.
We use data at the student level for the sample of students effectively taking the exam (433) and
estimate several specifications of the following OLS model:
[1] ijiiiii WXFemaleeamFemaleLedTartGradeTeamP εµβββββ ++++++= 43210
where the dependent variable, iartGradeTeamP is the score that student i obtains in the team part of the test
and ieamFemaleLedT is a dummy variable for the treatment status that takes value 1 for students assigned to
12
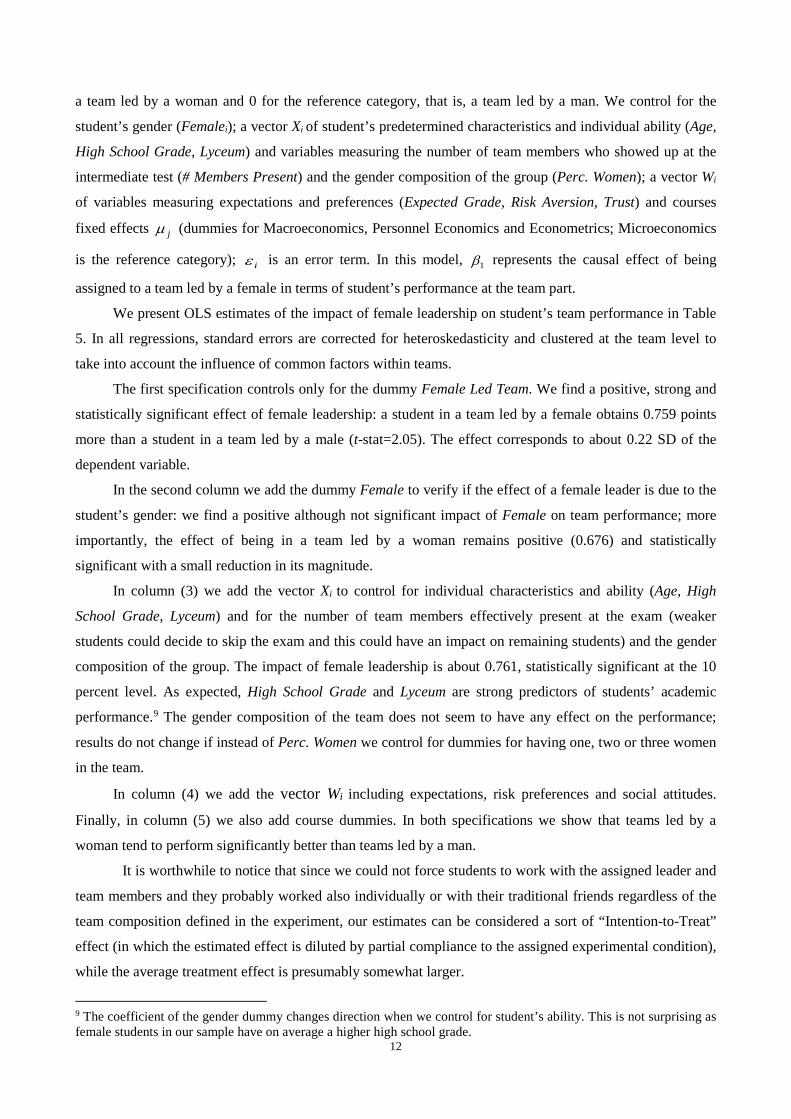
a team led by a woman and 0 for the reference category, that is, a team led by a man. We control for the
student’s gender (Femalei); a vector Xi of student’s predetermined characteristics and individual ability (Age,
High School Grade, Lyceum) and variables measuring the number of team members who showed up at the
intermediate test (# Members Present) and the gender composition of the group (Perc. Women); a vector Wi
of variables measuring expectations and preferences (Expected Grade, Risk Aversion, Trust) and courses
fixed effects jµ (dummies for Macroeconomics, Personnel Economics and Econometrics; Microeconomics
is the reference category); iε is an error term. In this model, 1β represents the causal effect of being
assigned to a team led by a female in terms of student’s performance at the team part.
We present OLS estimates of the impact of female leadership on student’s team performance in Table
5. In all regressions, standard errors are corrected for heteroskedasticity and clustered at the team level to
take into account the influence of common factors within teams.
The first specification controls only for the dummy Female Led Team. We find a positive, strong and
statistically significant effect of female leadership: a student in a team led by a female obtains 0.759 points
more than a student in a team led by a male (t-stat=2.05). The effect corresponds to about 0.22 SD of the
dependent variable.
In the second column we add the dummy Female to verify if the effect of a female leader is due to the
student’s gender: we find a positive although not significant impact of Female on team performance; more
importantly, the effect of being in a team led by a woman remains positive (0.676) and statistically
significant with a small reduction in its magnitude.
In column (3) we add the vector Xi to control for individual characteristics and ability (Age, High
School Grade, Lyceum) and for the number of team members effectively present at the exam (weaker
students could decide to skip the exam and this could have an impact on remaining students) and the gender
composition of the group. The impact of female leadership is about 0.761, statistically significant at the 10
percent level. As expected, High School Grade and Lyceum are strong predictors of students’ academic
performance.9 The gender composition of the team does not seem to have any effect on the performance;
results do not change if instead of Perc. Women we control for dummies for having one, two or three women
in the team.
In column (4) we add the vector Wi including expectations, risk preferences and social attitudes.
Finally, in column (5) we also add course dummies. In both specifications we show that teams led by a
woman tend to perform significantly better than teams led by a man.
It is worthwhile to notice that since we could not force students to work with the assigned leader and
team members and they probably worked also individually or with their traditional friends regardless of the
team composition defined in the experiment, our estimates can be considered a sort of “Intention-to-Treat”
effect (in which the estimated effect is diluted by partial compliance to the assigned experimental condition),
while the average treatment effect is presumably somewhat larger.
9 The coefficient of the gender dummy changes direction when we control for student’s ability. This is not surprising as female students in our sample have on average a higher high school grade.

13
Table 5. The Impact of Female Leadership on Team Performance. Dependent Variable: Grade Team Part. OLS Estimates (1) (2) (3) (4) (5) Female Led Team 0.759** 0.676* 0.769* 0.821* 0.667* (0.370) (0.398) (0.436) (0.424) (0.360) Female 0.231 -0.400 -0.464 -0.485 (0.377) (0.359) (0.367) (0.370) Age -0.103 -0.113 -0.064 (0.067) (0.070) (0.095) High School Grade 0.126*** 0.120*** 0.126*** (0.015) (0.014) (0.015) Lyceum 0.651** 0.682** 0.731** (0.298) (0.298) (0.290) # members present -0.253 -0.205 -0.067 (0.302) (0.308) (0.272) Perc. Women -0.253 -0.258 -0.410 (0.807) (0.804) (0.726) Expected Grade 0.119* 0.070 (0.068) (0.070) Trust -0.008* -0.007* (0.005) (0.004) Risk Aversion -0.052 -0.046 (0.076) (0.074) Macro -1.788*** (0.419) Personnel Ec. 1.210*** (0.395) Econometrics -0.924 (0.691) Constant 5.643*** 5.573*** -1.963 -3.728 -4.084 (0.277) (0.288) (2.120) (2.893) (3.105) Observations 433 433 433 433 433 Adjusted R-squared 0.010 0.008 0.152 0.159 0.248 Notes: Standard errors (corrected for heteroskedasticity and allowing for clustering at the team level) are reported in parentheses. The symbols ***, **, * indicate that the coefficients are statistically significant at the 1, 5 and 10 percent level, respectively.
An interesting question is related to what drives the effect of better performance of female led teams.
Is the whole team performing better? Are female leaders improving their performance? Or, does the effect
derive from an increase in members’ performance? Also, are these effects different according to student’s
gender?
We answer these questions in estimates reported in Table 6. First, in column (1) we try to understand
how team members react to female leadership. At this aim we exclude leaders from the sample and estimate
specification (5) of Table 5, including the full set of controls. We find that female leaders increase the
performance of their team members: team members’ performance increases by 1.153 if the team is led by a
female.
In column (2) we try to understand whether female and male team members react differently to female
leaders. At this aim, we include among regressors an interaction term between Female and Female Led
Team. We find that the increase in performance related to being part of a Female Led Team is lower for male
(+0.856; p-value=0.16) than for female team members (1.56=0.856+0.704, p-value=0.02), although the
difference (0.704) is far from being statistically significant (p-value=0.34). Estimating separately for male

14
and female team members, we find that in female led teams the performance of men increases by 1.20 while
the performance of women increases by 1.43 (estimates not reported).
In column (3) we turn our attention to leaders and try to understand whether being the leader has a
different effect on student’s own performance according to gender. Comparing the performance of a female
leader with that of a male leader we find a small and not significant difference against women (-0.557, p-
value=0.39).
Table 6. The Impact of Female Leadership on Team Performance. Dependent Variable: Grade Team Part. OLS Estimates.
(1) (2) (3) (4) Team members Leaders Whole sample Female Led Team 1.153** 0.856 0.843 (0.522) (0.606) (0.582) Female 0.063 -0.266 -0.557 -0.364 (0.524) (0.649) (0.642) (0.574) Female*Female Led Team 0.704 0.716 (0.738) (0.701) Leader 0.625 (0.546) Leader*Female -1.468* (0.748) Age -0.170 -0.177 0.089 -0.054 (0.128) (0.128) (0.145) (0.095) High School Grade 0.113*** 0.112*** 0.151*** 0.127*** (0.020) (0.020) (0.026) (0.015) Lyceum 0.544 0.531 0.922* 0.688** (0.359) (0.358) (0.524) (0.279) # members present -0.335 -0.348 0.366 -0.073 (0.358) (0.359) (0.415) (0.283) Perc. Women -0.895 -1.009 -0.931 -0.961 (1.069) (1.077) (1.273) (0.819) Expected Grade 0.019 0.030 0.148 0.081 (0.088) (0.088) (0.118) (0.064) Trust -0.008 -0.008 -0.008 -0.008* (0.005) (0.005) (0.008) (0.004) Risk Aversion -0.075 -0.069 0.000 -0.036 (0.093) (0.094) (0.121) (0.073) Courses dummies YES YES YES YES Observations 283 283 150 433 Adjusted R-squared 0.218 0.217 0.284 0.251 Notes: Standard errors (corrected for heteroskedasticity and allowing for clustering at the team level) are reported in parentheses. The symbols ***, **, * indicate that the coefficients are statistically significant at the 1, 5 and 10 percent level, respectively.
In column (4) we run our estimate on the whole sample including among regressors the interaction
term between the dummy Female and the dummy Leader and the interaction term between Female and
Female Led Team. We find results that are consistent with those found restricting the sample to team
members and leaders respectively. The performance of a male member (not leader) increases by 0.843 if a
female leads the team. The positive effect of a female leader is 0.716 points higher (that is,

15
1.559=0.843+0.716) if the member is a woman but the difference is not statistically significant. Female and
male leaders do not significantly differ when we consider their own performance (-0.273=0.843-
0.364+0.716-1.468, p-value=0.607). In addition, we find that female leaders tend to perform slightly worse
than other women who are members of a female led team (-0.844=0.625-1.468, p-value=0.067).
All in all, members of a team led by a female tend to perform better (especially female members),
while the leader’s own performance is slightly worse for women. As discussed in Section 4 the latter result
might depend on the fact that female leaders devote a greater amount of effort in coordinating and organizing
team activities and this might come at the cost of a worse individual performance.
We have also tried to understand whether the female leadership produces positive effects also on the
individual part of the test. At this aim, we have considered as dependent variable Grade Individual Part. In
order to compare the magnitude of the effects of the individual and team parts, we have divided by two the
score obtained at the individual part of the test as this part was worth twice the team part. Estimates are
reported in Table 7 (same specifications reported in Table 5). We find that female led teams tend to perform
better also in the individual part of the exam – suggesting that small spillovers occur from one part of the
exam to the other – but the effect is very imprecisely estimated.
Table 7. The Impact of Female Leadership on Student Performance at the Individual Part. Dependent Variable: Grade Individual Part. OLS Estimates. (1) (2) (3) (4) (5) Female Led Team 0.596* 0.368 0.316 0.317 0.310 (0.313) (0.342) (0.355) (0.345) (0.315) Female 0.636* -0.212 -0.226 -0.168 (0.343) (0.324) (0.328) (0.329) Age -0.008 -0.018 -0.140* (0.048) (0.048) (0.072) High School Grade 0.129*** 0.123*** 0.116*** (0.012) (0.012) (0.013) Lyceum 0.244 0.244 0.242 (0.263) (0.265) (0.256) # members present -0.401 -0.380 -0.338 (0.257) (0.257) (0.246) Perc. Women 0.369 0.367 0.018 (0.671) (0.675) (0.629) Expected Grade 0.137** 0.118** (0.060) (0.057) Trust -0.001 -0.000 (0.004) (0.004) Risk Aversion -0.009 -0.013 (0.063) (0.060) Courses dummies NO NO NO NO YES Observations 433 433 433 433 433 Adjusted R-squared 0.007 0.014 0.200 0.205 0.259 Notes: Standard errors (corrected for heteroskedasticity and allowing for clustering at the team level) are reported in parentheses. The symbols ***, **, * indicate that the coefficients are statistically significant at the 1, 5 and 10 percent level, respectively.
As explained above, after taking the intermediate exam students were asked to answer an online
survey aimed at evaluating team effectiveness and leader’s activity. All students joining the experiment,

16
including those who did not show up at the intermediate test, were invited to fill out the survey. About 85%
of them completed the questionnaire.
The questions asked in the survey allow us to understand whether the time spent together by team
members has been affected by the leader’s gender. As mentioned in Section 2, students report a weekly
average number of team working hours (Hours Together) of 3.87, which increases to 4 for students who
show up at the intermediate test. In Table 8 we investigate whether the leader’s gender influences the time
spent with team members. We report OLS estimates considering as dependent variable Hours Together and
focusing on the whole sample of students joining the experiment (with the exclusion of leaders)10, but similar
results emerge when restricting the sample to students who have undertaken the intermediate test. As shown
in column (1), the gender of the leader does not affect the time spent working together. In addition, we do not
find differentiated effects according to the gender of team members (column 2).
Even if the amount of time is the same, the effectiveness of the work may be different depending on
the leader’s gender. To investigate this aspect we look at the probability that the team leader has submitted
the homework assigned during teaching classes to the course’s instructor and estimate a Linear Probability
model considering as dependent variable the dummy Done Homework, which takes the value of one for
teams who have submitted their homework to the course’s instructor and zero otherwise. Although students
were strongly encouraged to work in team and to solve the exercises assigned as homework, no specific
incentive (or penalty) was announced for teams doing (not doing) the task. The percentage of students who
have done their homework is 81.4% and 84.1% for students joining the experiment and students showing up
at the intermediate test, respectively.
In our estimates we keep one observation for each team and use team characteristics as control
variables (average age of team members, average high school grade etc.). In column (3) we consider the
whole sample of students joining the experiment, while in column (4) we focus on students taking the test.
We find that teams led by a female have a much higher probability of doing their homework (+19 percentage
points when we consider only students sitting the intermediate test).
10 When we consider the answers provided by leaders again we do not find any gender difference as regards the time they state to have worked with teammates.

17
Table 8. Time Spent Together with Teammates and Probability of Doing Homework. OLS Estimates Hours Together Done Homework (1) (2) (3) (4) Female Led Team 0.701 0.627 0.156*** 0.190*** (0.645) (0.660) (0.069) (0.071) Female -0.083 -0.163 (0.366) (0.489) Female*Female Led Team 0.165 (0.688) CONTROLS (FULL SET) YES YES YES YES Observations 305 305 180 150 Adjusted R-squared 0.038 0.035 0.226 0.263 Notes: OLS Estimates. Columns (3) and (4) report LPM estimates. Standard errors (corrected for heteroskedasticity and allowing for clustering at the team level) are reported in parentheses. The symbols ***, **, * indicate that the coefficients are statistically significant at the 1, 5 and 10 percent level, respectively.
Using the questions asked in the final survey, we also investigate whether teammates have spent time
together to prepare the individual part of the exam and for leisure activities. We asked students the following
two questions: a) “Have you met the members of your team also for leisure?” (Students could choose Yes or
No); b) “Have you studied alone or with the members of your team to prepare the individual part of the
exam?” (Possible answers were: mainly alone; partly alone and partly with my teammates; mainly with my
teammates). The large majority of students (83%) report that they did not spend leisure time with team
members and that they have studied mainly alone to prepare for the individual part of the exam (88%).11 We
find that the leader’s gender does not significantly affect the probability of spending leisure time with
teammates and the probability of studying together with team members for the individual part of the exam.
The effect is similar for male and female team members (estimates not reported and available upon request).
All in all, our results suggest that, despite spending on average the same amount of time working
with the team, students in teams led by women were more effective in finalizing teamwork.
4. Are Male and Female Leaders Evaluated Differently?
In this Section, we use data from the online survey proposed to students after they took the intermediate
exam to analyze how they evaluate leader’s activity and team effectiveness. With the aim of investigating
how the leader was evaluated by team members we asked the following two questions: a) “Using a scale
going from 0 (very bad) to 10 (excellent), how do you rate the effectiveness of your leader?”; b) “Using a
scale going from 0 (very bad) to 10 (excellent), how do you rate the effort provided in team coordination by
your leader?”.12
The average grades for Leader Effectiveness and Leader Effort were respectively of 6.3 and 6.24 when
considering the whole sample of students joining the experiment (with the exclusion of leaders). These rates 11 We have grouped the answers to this question into two categories because students reporting to have studied mainly with teammates are only 2%. 12 To investigate whether students are providing faithful answers to questions of our surveys we have regressed the Expected Grade on the effective Grade students obtained. We find a positive and high coefficient on Grade (0.74), with a p-value of 0.00, suggesting that students are taking our survey seriously and giving reliable answers.

18
slightly increase (to 6.39 and 6.32, respectively) when we focus only on students who took the intermediate
test.
In Table 9 we report results considering the whole sample of students joining the experiment who
answer to the survey (with the exclusion of leaders). In all specifications we include the full set of controls.
In columns (1) and (2) the outcome variable is Leader Effectiveness, while in columns (3) and (4) we
consider Leader Effort as dependent variable.13 We find that, on average, in spite of the better performance
of female led teams, female leaders do not obtain better evaluations from team members (columns 1 and 3).
We also find that female and male team members show different attitudes. In fact, when we include
among our regressors the interaction term between Female Led Team and Female we find that this
interaction is positive and statistically significant: while the evaluation of leader effectiveness made by male
team members tends to be worse when the leader is a woman (about -0.825, rather imprecisely estimated),
female members tend to evaluate more positively female leaders (+0.577=+1.402-0.825). This holds true
both when we restrict the sample to students who undertook the intermediate test and when we do not control
for students’ characteristics and course dummies (results not reported).14
As shown in column (4) similar results are found when Leader Effort is considered as an outcome
variable. Again we find that female students tend to evaluate more generously (1.744-0.699) the effort
provided by female leaders compared to their male peers (-0.699).
Table 9. Team Members’ Evaluations of their Leader. OLS Estimates Leader Effectiveness Leader Effort (1) (2) (3) (4) Female Led Team -0.194 -0.825 0.086 -0.699 (0.691) (0.770) (0.686) (0.759) Female -0.041 -0.639 0.208 -0.638 (0.413) (0.550) (0.435) (0.577) Female Led Team*Female 1.402* 1.744** (0.777) (0.791) CONTROLS (FULL SET) YES YES YES YES Observations 305 305 305 305 Adjusted R-squared 0.046 0.053 0.040 0.052 Notes: Standard errors (corrected for heteroskedasticity and allowing for clustering at the team level) are reported in parentheses. The symbols ***, **, * indicate that the coefficients are statistically significant at the 1, 5 and 10 percent level, respectively.
These results might be driven by male stereotypes against female leadership. To get some additional
evidence on this point we have considered the answers given by leaders to the post experiment survey and
tried to understand whether female leaders working in team composed mainly by men tend to assess
differently their team. We firstly look at a question asking them to evaluate the working of their team:
“Using a scale going from 0 (very bad) to 10 (excellent), how do you rate the functioning of your team?”.
13 These two measures of leader’s performance are strongly correlated (0.86, p-value=0.00). 14 We obtain the same result also when we consider students’ answers to a question asking a general evaluation of team effectiveness (“How do you rate the effectiveness of your team? - Good, Neither Good Nor Bad; Bad)”. 63.4% of students answered that they were satisfied with the work of their team, 21.4% expressed a negative evaluation and 15.2% were in the middle.

19
We focus on the sample of leaders who took the intermediate test (we lose some observations because of
missing answers).
As shown in Table 10, we do not find any gender difference in this response suggesting that female
leaders are not aware of their effectiveness in coordinating and finalizing the work of their team. In addition,
team composition does not affect the answers given by leaders.15 On the other hand, we find that female
leaders are aware of the effort they have provided in accomplishing their role. In column (3), using as
outcome variable an indicator of Required Effort, based on the answers given by leaders to a question asking
them to rate on a scale going from 0 to 10 how demanding was their activity,16 we find that on average
female leaders rate their own effort higher compared to male leaders (statistically significant at 13 percent
level). As shown in column (4), this is especially true for women leading teams composed mainly by men
(the interaction term Female*Perc. Women is negative even if imprecisely estimated, p-value=0.12).17
In columns (5) and (6) we analyze how leaders evaluate the effort provided by team members in team
activities (we have information for each of the two members18 and consider the average value). We find that
female leaders tend to evaluate as less intense the effort provided by team members compared to male
leaders (-1.15 points) but the judgment does not significantly change with the gender composition of the
team.
These results, together with findings discussed above (female leaders are especially capable in
enhancing the performance of female members; male members are less likely to evaluate positively female
leaders), confirm that women might experience prejudiced evaluations especially in masculine organizational
contexts (Eagly and Carli, 2003).
Table 10. Leaders’ Evaluations of their Team. OLS Estimates. Team Effectiveness Required effort Effort provided by team
members (1) (2) (3) (4) (5) (6) Female -0.003 0.092 0.709 1.906** -1.152* -1.044 (0.093) (0.195) (0.473) (0.809) (0.589) (1.166) Female* Perc: Women -0.199 -2.512 -0.226 (0.323) (1.608) (1.921) CONTROLS YES YES YES YES YES YES Observations 140 140 140 140 140 140 Adjusted R-squared 0.079 0.074 -0.014 -0.000 0.039 0.031 Notes: Standard errors (corrected for heteroskedasticity and allowing for clustering at the team level) are reported in parentheses. The symbols ***, **, * indicate that the coefficients are statistically significant at the 1, 5 and 10 percent level, respectively.
15 Here we consider the subsample of leaders taking the test. Similar results are obtained when considering the sample of leaders joining the experiment. 16 “Using a scale going from 0 (very bad) to 10 (excellent), how do you rate the effort you have provided in team coordination?”. 17 Instead when we consider the whole sample of students joining the experiment (including also those who have not sit the intermediate exam) we do not find any gender difference in the way leaders perceive the effort demanded by their role. 18 “Using a scale going from 0 (very bad) to 10 (excellent), how do you rate the effort provided by team member name?”.
20
5. Concluding Remarks
Female leadership in economic and social contexts is a rather rare phenomenon. Could the cause be that
women have lower abilities or attitudes to lead a team, an organization, a firm? Or, despite the considerable
changes in women’s roles, women are still vulnerable to becoming targets of prejudice?
To answer this question, we have run a field experiment with about 430 students from an Italian
University who took one part of their exam working in team. At the beginning of the courses, we have
randomly assigned students to teams of three members and, within each team, we have randomly selected a
leader to organize team activities. Thus, we have built a setting in which teams are led by a woman or by a
man and have different gender composition.
We evaluate if the gender of the leader affects team academic performance controlling for a number
of individual characteristics and we find that female led teams perform significantly better than male led
teams (an effect of about 0.2 SD of the dependent variable). Considering that students have probably studied
also with other colleagues that were not members of the same team, we are estimating a sort of Intention to
Treat Effect, in which the impact of the female leadership is diluted.
When digging deeper in order to understand who drives this effect – the leader, the other members or
both – we find that the positive effect of a female led team is mainly driven by the better performance of
team members, with female members who react more to female leadership, while the performance of female
leaders is slightly worse. While there is not significant difference in the performance of a male and a female
leader, female leaders tend to perform significantly worse than other women who are members of a female
led team. This suggests that female leaders devote altruistically more energies to organize team activities,
rather than improving their own performance. We also find evidence of a weak positive effect of female led
teams on the students’ performance in the individual part, implying that there were some spillovers from
studying activities for the team part to the individual part.
Stereotypically feminine qualities like cooperation, mentoring, and collaboration seem thus
important to leadership, certainly in context like this and perhaps increasingly in contemporary
organizations. Most leadership roles allow considerable discretion in certain aspects. Women’s advantage
may come from differences along the discretionary dimensions of leadership behavior, for example paying
more attention to subordinates, helping others with their work or volunteering for tasks that go beyond their
role.
In order to have a more complete picture of the activity of the team and to study both leaders and
teammates’ evaluation of the team we use answers from a post-experiment survey together with the
submission of team homework. We find that, despite teams led by men and women spend on average the
same amount of time together, the effectiveness of the work is higher in female led teams that are more
likely to submit the homework to the course instructor.
When investigating teammates’ evaluation of their own leader, we find suggestive evidence
(although the effects are imprecisely estimated) that men tend to evaluate worse female leaders while women

21
are more sympathetic towards leaders of their gender. This is probably the result of male stereotypes against
female leadership, especially considering the better performance of female led teams.
Finally, when analyzing leaders’ evaluation of their role and of the team we find that female leaders
are not aware of their effectiveness in coordinating and finalizing the work of their team, but are aware of the
effort they have provided in accomplishing their role and evaluate as less intense the effort provided by team
members compared to male leaders.
Our findings suggest that the appropriateness of a particular type of leader depends on the context.
Thus, despite leadership has historically been depicted as a masculine task, women have a leadership
advantage in some contexts and then should be encouraged to take on leadership roles because they tend to
work harder and their team might benefit more from their guidance.
However, women still suffer from prejudice and resistance when they occupy these roles; in fact,
consistently with previous research (Eagly, 2007; Eagly and Carli, 2003), we find that women still face some
difficulties in having recognized their merits especially in male dominated teams. This suggests that much
work still needs to be done to eradicate gender stereotypes in leadership, especially in settings where female
leaders are non-traditional, in such a way to increase both women’ confidence in their capabilities as leaders
and teammates recognition of female leaders’ work. Given the deep changes taking place in women’s roles,
more recognition of authority and effectiveness as leader will be an important achievement.
It is worthwhile to notice that our results pertain to a specific domain of leader activity. Investigating
whether gender differences exist also along other dimensions would represent a fruitful avenue for future
research. Understanding what happens when considering, for example, leader’s ability to serve as a symbol,
motivate or renew, would give a more complete picture of gender differences in leadership effectiveness and
recognition.

22
References Avolio, B. J. (1999). Full leadership development: Building the vital forces in organizations. Thousand
Oaks, C A: Sage. Ayman, R. (2004). Situational and contingency approaches to leadership. In J. Antonakis, A. T. Cianciolo,
and R. J. Sternberg (Eds.), The nature of leadership (pp. 148–170). Thousand Oaks, CA: Sage. Blume, A., and Ortmann, A. (2007). The effects of costless pre-play communication: Experimental evidence
from games with Pareto-ranked equilibria. Journal of Economic theory, 132(1), 274-290. Brandts, J., and Cooper, D. J. (2007). It's what you say, not what you pay: an experimental study of manager‐
employee relationships in overcoming coordination failure. Journal of the European Economic Association, 5(6), 1223-1268.
Brandts, J., Cooper D.J., Weber, R.A. (2015). Legitimacy, Communication, and Leadership in the Turnaround Game. Management Science 61(11): 2627‐2645.
Chakraborty, P. and Serra, D. (2017), “Gender Differences in Leadership: An Experiment”, mimeo. Chemers, M. M. (1997). An integrative theory of leadership. Mahwah, NJ: Erlbaum. Devetag, G., and Ortmann, A. (2007). When and why? A critical survey on coordination failure in the
laboratory. Experimental economics, 10(3), 331-344. Dufwenberg, M., and Gneezy, U. (2005). Gender and coordination. In Experimental business research (pp.
253-262). Springer US. Eagly, A. (2007), Female Leadership advantage and disadvantage; resolving the contradictions, Psychology
of Women Quarterly, 31, pp. 1–12. Eagly, A. H., and Carli, L. L. (2003). The female leadership advantage: An evaluation of the evidence.
Leadership Quarterly, 14, 807–834. European Commission (2016), “Gender balance on corporate boards”, Fact sheet | July 2016
http://ec.europa.eu/justice/genderequality/files/womenonboards/factsheet_women_on_boards_web_2015-10_en.pdf
Gardner, J. (1993). On leadership. Simon and Schuster. Grossman, P. J., Eckel, C., Komai, M., and Zhan, W. (2016). It Pays to Be a Man: Rewards for Leaders in a
Coordination Game (No. 38-16). Monash University, Department of Economics. Kriss, P. H., and Eil, D. (2012). Managers as coordination devices: Keep your door open, but your skin
thick. Essays on the Impact of Costly Communication on Coordination, Dissertation by Peter Kriss, Carnegie Mellon University, Pittsburgh, 106-140.
Reuben, E., and Timko, K. (2017). On the Effectiveness of Elected Male and Female Leaders and Team Coordination (No. 10497). IZA Discussion Papers.
Sahin, S. G., Eckel, C., and Komai, M. (2015). An experimental study of leadership institutions in collective action games. Journal of the Economic Science Association, 1(1), 100-113.
Timko, K. (2017a). Gender, communication styles and leader effectiveness. MPRA Paper 77021, University Library of Munich, Germany.
Timko, K. (2017b). Men and Women Are Equally Effective Leaders. MRPA Paper 77022, University Library of Munich, Germany.
Van Huyck, J. B., Battalio, R. C., and Beil, R. O. (1990). Tacit coordination games, strategic uncertainty, and coordination failure. The American Economic Review, 80(1), 234-248.
Weber, R., Camerer, C., Rottenstreich, Y., and Knez, M. (2001). The illusion of leadership: Misattribution of cause in coordination games. Organization science, 12(5), 582-598.
Yukl, G. A. (2013). Leadership in organizations. Pearson Education India.