Embed Size (px)
Citation preview
Dissociation of eye and head components of gaze shifts by stimulation of the omnipause neuron region
Neeraj J. Gandhi 1, 2 David L. Sparks 2
1 Departments of Otolaryngology, Neuroscience and Bioengineering Center for the Neural Basis of Cognition
University of Pittsburgh, PA 15213
2 Department of Neuroscience Baylor College of Medicine
Houston, TX 77030
Address correspondences to:Neeraj J. Gandhi, Ph.D. 203 Lothrop Street Eye and Ear Institute, Room 108 University of Pittsburgh Pittsburgh, PA 15213 Email: [email protected] Voice: (412) 647-3076 Fax: (412) 647-0108
Page 1 of 62 Articles in PresS. J Neurophysiol (May 9, 2007). doi:10.1152/jn.00252.2007
Copyright © 2007 by the American Physiological Society.
ABSTRACT
Natural movements often include actions integrated across multiple effectors.
Coordinated eye-head movements are driven by a command to shift the line of sight by a
desired displacement vector. Yet, because extraocular and neck motoneurons are
separate entities, the gaze shift command must be separated into independent signals for
eye and head movement control. We report that this separation occurs, at least partially,
at or before the level of pontine omnipause neurons (OPNs). Stimulation of the OPNs
prior to and during gaze shifts temporally decoupled the eye and head components by
inhibiting gaze and eye saccades. In contrast, head movements were consistently
initiated before gaze onset, and ongoing head movements continued along their
trajectories, albeit with some characteristic modulations. After stimulation offset, a gaze
shift composed of an eye saccade and a reaccelerated head movement was produced to
preserve gaze accuracy. We conclude that signals subject to OPN inhibition produce the
eye movement component of a coordinated eye-head gaze shift and are not the only
signals involved in the generation of the head component of the gaze shift.
Page 2 of 62
INTRODUCTION
We interact with our environment by generating actions coordinated across multiple
effector systems. Integrated movements of the eyes, head, torso and/or limbs are used to
perform activities such as driving a car (Land 1992), hitting a ball (Land and McLeod
2000), or even generating defensive postures (Graziano et al. 1997). Studies probing the
neural bases of integrated motor control have typically considered the coordination of
oculomotor subsystems (Fukushima et al. 2002; Gardner and Lisberger 2001; Keller et al.
1996; Walton and Mays 2003) or of eye movements with skeletal effectors like the head
(Crawford et al. 2003; Guitton et al. 2003; Pélisson et al. 2003) and the hand (Cohen and
Andersen 2002; Courjon et al. 2004; Crawford et al. 2004; Stuphorn et al. 2000).
Reorienting the line of sight is often accomplished by coordinated eye-head
movements (Bizzi et al. 1971). In general, the saccadic eye and head components are
temporally coupled (Freedman and Sparks 1997b; Phillips et al. 1995; Zangemeister and
Stark 1982a); the saccadic eye component initiates the gaze shift and the onset of the
head movement lags behind, at least in part, because of its heavier inertial load. When
the initial eye-in-head position is deviated in the direction of the gaze shift (Becker and
Jürgens 1992; Freedman and Sparks 1997b; Fuller 1996) or when the location and timing
of the stimulus are predictable (Bizzi et al. 1972; Moschner and Zangemeister 1993;
Zangemeister and Stark 1982a; b), however, the lag in the head component can be
reduced or it can even lead gaze onset. Furthermore, long duration, sub-threshold
microstimulation of the superior colliculus, a structure believed to issue a desired gaze
displacement command (Freedman and Sparks 1997a; Freedman et al. 1996; Klier et al.
2001), can evoke a head-only movement – the eyes counter-rotate in the orbits – or a
Page 3 of 62
head-only movement that precedes the onset of the gaze shift (Corneil et al. 2002;
Pélisson et al. 2001). Thus, the timing of head initiation relative to gaze onset need not
be rigidly constrained.
Independent control of the eyes and head occurs naturally at the level of the
extraocular and neck motoneurons, although some form of separate processing has also
been proposed to occur in cortical (Chen 2006; Chen and Walton 2005; Constantin et al.
2004; Constantin et al. 2006), subcortical (Gandhi and Walton 2006; Pathmanathan et al.
2005a; Pathmanathan et al. 2005b; Walton and Gandhi 2006), and cerebellar (Quinet and
Goffart 2005) structures. It has been hypothesized that head movements associated with
gaze shifts are driven by at least two parallel pathways: one is gated by the pontine
omnipause neurons (OPNs) and issues movement commands to the eyes and head, and
the other bypasses the OPN gate and does not encode a saccadic eye movement command
(Corneil et al. 2002; Galiana and Guitton 1992; Goossens and Van Opstal 1997; Guitton
et al. 1990). The objective of the present study was to test the functional contribution of
head pathway(s) external to the OPN inhibition. Microstimulation was delivered to the
OPN region either prior to or at the onset of horizontal head-unrestrained gaze shifts
directed to the location of a briefly flashed target. Given that the OPNs inhibit excitatory
burst neurons (Curthoys et al. 1984) that project to the abducens motoneurons, it was
expected that the microstimulation would prevent generation of the saccadic eye
component of gaze shifts. The key additional predictions were: (1) initiation of a head
movement would consistently precede the gaze shift when microstimulation was
delivered before gaze onset; and (2) an ongoing head movement would continue along its
trajectory when stimulation was triggered after gaze onset.
Page 4 of 62

Preliminary versions of this data have been published previously (Gandhi and
Sparks 2001a, 2000; Sparks et al. 2001; Sparks and Gandhi 2003).
METHODS
General procedures
Two juvenile rhesus monkeys (Macaca mulatta) weighing 5-8 kg served as subjects. All
experimental protocols were approved by the Institute Animal Care and Use Committee
at the Baylor College of Medicine and complied with the guidelines of the Public Health
Service policy on Humane Care and Use of Laboratory Animals. All surgical procedures
were performed in a sterile environment and under isofluorane anesthesia. Using
Vetbond tissue adhesive, a search coil was attached to the sclera of one eye of each
monkey. Another coil, a head-restraint post, and a stainless steel chamber were secured to
the skull. The cylinder was slanted laterally in the frontal plane at an angle of 26° so that
a microelectrode penetration through its center would reach the midline in the inter-aural
plane 1-mm below inter-aural zero.
Post recovery, the animal was trained to sit in a customized chair fitted with neck,
waist and chest plates that minimized (approximately ±10°) but did not prevent trunk and
body movements. On each experimental day, the chair with the animal inside it was
carted to the laboratory. A micro-miniature laser (Edmund Optics, Inc.; Barrington, NJ)
was attached to the animal’s head implant. In addition, a hydraulic microdrive was
secured to the chamber and a parylene coated tungsten microelectrode (Micro Probe, Inc;
Gaithersburg, MD) was inserted into the brain. The animal with its chair were then
placed in a magnetic field frame (CNC Engineering; Seattle, WA). Electromagnetic
Page 5 of 62

induction technique was used to measure eye-in-space (gaze) and head-in-space positions
from the coils around the eye and in the head implant, respectively. Eye-in-head position
was computed as the difference of gaze and head positions. See Gandhi and Sparks
(2001b) for more details.
Experimental setup and behavioral tasks
When seating in the magnetic field frame, the animal faced a flat visual display
consisting of 41 rows and 49 columns of tri-state light emitting diodes (LEDs) that could
light up red, green or yellow. It was placed 72 cm from the center of the field coil, which
corresponds to inter-LED spacing of 2° on a tangential plane. Maximum target
eccentricity, with respect to straight ahead, was ±48° horizontally and ±40° vertically.
All target eccentricities reported in this manuscript are in tangential coordinates and can
be transformed into rotational coordinates, as described previously (Gandhi and Sparks
2001b; Huebner et al. 1995).
While the electrode was being lowered into the PPRF region, the animal
performed two randomly interleaved behavioral tasks. At the onset of each trial, a red
LED and the micro-miniature laser were illuminated. When turned on, the laser module
emitted a red beam of light onto the visual display panel. The animal was granted 2000
ms to both fixate the red target and align the laser beam (i.e., the head) inside an
imaginary, computer-controlled window (radius: 4°-6°) around the LED location, and
then maintain these requirements for 700-1000 ms. At the end of this step, the eyes are
approximately centered in the orbits, and gaze and head positions are nearly equivalent.
The remainder of the steps was dependent on the ensuing behavioral task.
Page 6 of 62

In the memory-guided gaze shift task, a gaze target (yellow LED) was flashed for
500-1300 ms, while the head target (red LED) and miniature laser remained on. Another
500-900 ms after the offset of gaze target, the laser and red LED were extinguished,
which cued the monkey to initiate a gaze shift. If gaze position reached within an
imaginary, computer-controlled window (radius: 6°-10°) around the flashed target
location in ≤500 ms, the LED was re-illuminated, and a final fixation of 1500-2000 ms
triggered delivery of a liquid reward. A relatively large window size was necessary to
account for the variability of endpoints for movements made in the dark (Goffart et al.
2006; White et al. 1994) and for greater hypometria associated with large movements
(Becker 1991).
In the gap gaze shift task, the LED and the laser were extinguished after
alignment of the head and gaze with the red target. Following a gap of 200-500 ms,
during which neither fixation condition could be violated, a gaze (yellow) target was
illuminated at an eccentricity of 40°-60° and remained on until the end of the trial. The
monkeys were allowed 800 ms to direct gaze into a computer-controlled window (radius:
6°-10°) around the yellow target location. To allow completion of the head movement, a
final fixation of 1500-2000 ms was required before a liquid reward was delivered. A
window constraint was not placed on the head position signal during acquisition of the
gaze target.
Stimulation trials were introduced once the electrode penetration entered the
PPRF region of the brain stem and OPNs were identified based on their discharge
characteristics (cf. (Gandhi and Keller 1999)). The initial objective was to optimize the
microelectrode location within the OPN region. On a subset of the gap trials (25-50%),
Page 7 of 62
microstimulation (10-30 µA, 200-300 Hz, 100-300 ms, 0.25 ms duration cathode pulses)
was applied to the OPN region 100-200 ms after the offset of the red LED and laser. The
gaze target was illuminated after the offset of the stimulation, and the animals were
rewarded for acquiring the gaze target. If the tip of the stimulation electrode was located
on the fringe of the OPN area where stimulation produces a constant velocity gaze
movement (Cohen and Komatsuzaki 1972), the electrode was moved to eliminate this
effect. This positioning effort also served to minimize stimulation-induced activation
effects of nearby pathways (e.g., reticulospinal, tectospinal, and interstitiospinal) on head
movement generation.
Upon satisfactory positioning of the electrode, trials with stimulation triggered
during the gap period were reduced to ~5% of all trials, but other stimulation tasks were
introduced. On a subset of the trials, microstimulation (10-30 µA, 200-300 Hz, 100-300
ms, 0.25 ms duration cathode pulses) was triggered on gaze onset, which actually was
detected online as deviation of either gaze or head position outside of its respective
computer-controlled window constraint. On another fraction of interleaved trials, the
microstimulation was delivered 100-200 ms after the cue to initiate the gaze shift (target
onset in the gap task and fixation point offset in the memory-guided gaze shift task).
This trial type was designed to test whether and how the latencies of gaze and head
movements are compromised by OPN stimulation prior to gaze onset. In this latter
condition, if stimulation onset followed gaze onset, the trial was relocated to the
“stimulation triggered on gaze onset” database. For both stimulation trials, the gaze
target was extinguished with the onset of the stimulation. If gaze position reached within
an imaginary, computer-controlled window (radius: 6°-10°) around the gaze target
Page 8 of 62

location in ≤500 ms after stimulation offset, the LED was re-illuminated, and a final
fixation of 1500-2000 ms triggered a liquid reward.
In general, stimulation within the context of gap trials was more common at the
beginning of each experimental day, as the electrode position within the OPN region was
being fine tuned. Upon satisfactory placement of the electrode, the memory-guided gaze
shift task, with and without stimulation, constituted approximately 75-80% of all trials.
The rest of the trials were composed of the gap task with and without stimulation.
Collectively, stimulation was delivered in 25-40% of all trials. Stimulation parameters
were kept constant within a block of trials, irrespective of whether the current was
injected before or after gaze onset. We typically only modified the stimulation duration
in between blocks, when we felt it was necessary to prolong the stimulation-induced
interruption to better visualize the effect of stimulation on the head component of the
gaze shift. For the analyses, however, we did not parse the data according to stimulation
duration as we did not consistently have enough trials for a specific stimulation duration
and the same target configuration (as described below).
A qualitative assessment indicated that stimulation produced similar effects on
both gap and memory-guided gaze shift trials and hence the data were pooled. Control
data for the two trials types were also combined, as our gap trials did not produce an
appreciable number of express latency gaze shifts. This is most likely due to factors such
as small percentage of gap trials, variable gap durations and numerous target locations.
All target configurations required horizontal gaze shifts. The vertical eccentricity
of all targets was 0° and, based on visual inspection, at eye level. Typically, the initial
red LED was presented at 0°, +20° (right visual field) or –20° (left visual field), and the
Page 9 of 62
yellow, gaze target appeared at ±40° or ±60° with respect to the initial target. If the gaze
target location was beyond the visual display boundary, the most distal target (±48°) was
illuminated to prevent any bias the animal might develop to evoke centripetal gaze shifts
when the initial head and gaze positions were directed away from the midline. Gaze
shifts directed to targets illuminated at 40° and 48° in the same hemifield were combined.
Trials in which both initial and gaze targets were presented in the same hemifield (e.g.,
from 20° right to 40° right) were excluded from analysis.
Data acquisition and analyses
Data were sampled at 500 Hz using in-house software. Data were analyzed off-
line using in-house software and Matlab (The Mathworks, Inc., Natick, MA). Typically,
velocity criteria were used to detect the onset and offset of gaze, eye and head
movements. For gaze and eye movements, the onset and offset velocity thresholds were
80°/sec and 60°/sec, respectively. For head movements, the onset and offset velocity
thresholds were 8°/sec and 5°/sec, respectively.
The majority of the analyses presented in the manuscript required computing
static parameters (latency, amplitude, magnitude and time of peak head velocity and
acceleration) and comparing them between control and stimulation conditions. In
general, the Wilcoxon rank sum test – equivalently, the Mann-Whitney U test – that
compares the medians of the distributions of control and stimulation conditions was used
to test for statistical significance. When appropriate (and as indicated in the Results), a
pair-wise comparison was performed with the Wilcoxon sign rank test of equality of
medians across matched samples of control and stimulation trials. For comparison,
Page 10 of 62
analogous t-tests were also performed and comparable results were obtained.
Additionally, a two-way ANOVA test was performed to determine whether any changes
observed in the static parameters listed above could be statistically related to initial head
position (center or contralateral) or trial condition (stimulation or control).
A dynamics analysis was used to test the null hypothesis that stimulation did not
significantly attenuate the head movement. For these analyses, all acceleration and
velocity traces were aligned on head onset. A one-tailed t-test, modified to account for
unequal variances in the control and stimulation trials (Milton and Arnold 1995), was
applied to compute a P-value for each 2-msec increment. The goal was to determine
whether and when (relative to head onset) the head velocity in the stimulation trials was
significantly attenuated. A significant attenuation in the head velocity and acceleration
for at least 25 ms consecutively was required to count as a valid stimulation effect. The
criterion of P<0.05 was used for statistical significance across all tests.
RESULTS
Microstimulation was delivered to 23 sites within the OPN region of two monkeys (n=13,
monkey CH; n=10, monkey BE) performing head-unrestrained gaze shifts. The
stimulation was either delivered prior to movement initiation or triggered on the onset of
the gaze shift. Data were sorted into six target configurations: rightward 40° and 60°
gaze shifts initiated from the left hemifield (-20°), leftward 40° and 60° shifts from the
right hemifield (20°), leftward gaze shifts (pooled 40° and 48°) from straight-ahead (0°),
and rightward gaze shifts (pooled 40°and 48°) from straight-ahead (0°). The six target
configurations and two stimulation modes (before and after gaze onset) produced a
Page 11 of 62
maximum of 12 different datasets to be analyzed for each stimulation site. After
imposing the constraint that at least 6 trials must exist in each condition, 115 datasets
were available for analysis: 48 for stimulation before gaze onset and 67 for stimulation
after gaze onset. The eyes were approximately centered in the orbits prior to the onset of
gaze shifts for control (mean±sd:0.21±1.92°) and both stimulation (0.25±1.82°)
conditions. The distributions were not statistically significantly different (rank sum test,
P<0.05).
The format of the data presentation order is as follows: a qualitative assessment of
the effects of stimulation of the OPN region based on temporal profiles of gaze, head, and
eye-in-head signals; an examination of whether and how stimulation modified the
latencies of the head and gaze components; an investigation of stimulation-induced
alterations in the kinematics and dynamics, with particular emphasis on the head
component; an indirect evaluation of the gain of the vestibulo-ocular reflex (VOR) during
the stimulation-induced perturbation; and, finally, a brief, statistical consideration of
effects of biomechanical factors in addition to that of the stimulation.
Effects of OPN stimulation
Figure 1 illustrates the effects of stimulation of the OPN region on generation of
leftward, 40° gaze shifts; the displayed trials are a subset of one dataset. Horizontal
amplitude (left column) and velocity (right column) of gaze, head and eye-in-head
components are plotted as a function of time for individual control (cyan) and stimulation
trials (red). To visualize the effects of stimulation delivered prior to gaze onset (Fig. 1-
A1), the movements are aligned on the cue to initiate the gaze shift. For control trials, the
Page 12 of 62
average gaze latency was ~250 ms. For the five stimulation trials shown in the figure,
stimulation onset was initiated 150 ms after the cue and lasted for 300 ms. The onset of
the gaze shift was delayed until after the end of the stimulation train. A head movement,
however, was initiated during the stimulation (Fig. 1-A2) but at a longer latency
compared to control trials, as judged by a visual comparison of the velocity traces. Gaze
remained stable during this period, implying that the eyes counter-rotated in the orbits by
the amount of the head movement (Fig 1-A3) and that the vestibulo-ocular reflex (VOR)
gain was near unity. After stimulation offset, a gaze shift composed of an eye saccade
and a reaccelerated head movement occurred. Gaze accuracy was maintained as the
difference in the total gaze amplitude between control and stimulation conditions was
small (stimulation-control, median: -1.08°; mean±sd: -1.19±1.96°) across the 48 datasets.
In contrast, the total head movement was greater in the stimulation condition
(stimulation-control, median: 1.06°; mean±sd: 1.56±3.05°; P<0.01, signrank test), and the
reacceleration likely contributed to the hypermetria.
Figure 1 near here
Example movements for which stimulation was triggered on the onset of gaze
shifts are shown in Figure 1B. These traces, obtained from the same animal and
stimulation site illustrated in Fig. 1A, are aligned on gaze onset. Microstimulation
produced an interruption of the gaze shift (Coble et al. 1994; Paré and Guitton 1998;
Sparks et al. 2002) that resembled an interrupted saccade observed when the head is
restrained (Keller 1977; King and Fuchs 1977). Shortly after stimulation onset, the
ongoing gaze shift stopped in mid-flight (Fig. 1-B1) and gaze position remained constant
throughout the stimulation period. Since gaze is the sum of eye-in-head and head-on-
Page 13 of 62
trunk positions when trunk position is fixed, the interruption of the gaze shift must be
mediated via one or both of these signals. The head continued to move throughout the
stimulation period (Fig. 1-B2), but stimulation stopped the ocular saccade in mid-flight
(Fig. 1-B3) and the eyes counter-rotated in the orbits. The constant gaze position during
the interruption suggests that the VOR gain was near unity during the interruption, nearly
perfectly compensating for the sustained head movement. Following stimulation offset, a
resumed gaze shift, composed of a coordinated eye-saccade and a reaccelerated head
movement, was observed. Gaze accuracy was maintained since the difference in the total
gaze amplitude between control and stimulation conditions was small (control-
stimulation, median: -0.51°; mean±sd: -0.61±2.78°) across the 67 datasets. In contrast,
the total head movement was greater in the stimulation condition (stimulation-control,
median: 3.19°; mean±sd: 3.55±2.90°; P<0.001, signrank test), and the reacceleration
likely contributed to the hypermetria.
Latency distributions
Figure 2 quantifies the changes in latencies of gaze, head and head relative to
gaze when stimulation was delivered prior to a movement. Gaze onset was significantly
delayed compared to control trials both within and across all datasets (Fig. 2A; rank sum
test, P<0.05). The distributions of gaze latency across the 48 datasets between control
(mean±sd: 266±30 ms) and stimulation (416±89 ms) were statistically different (rank
sum test, P<0.0001). Like gaze reaction time, head latency was also delayed by the
stimulation, and significantly so in 35/48 datasets (Fig 2B; rank sum test, P<0.05). The
distributions of head latency across all datasets were statistically different for control
Page 14 of 62

(268±43 ms) and stimulation (359±104 ms) trials (rank sum test, P<0.0001). Figure 2C
shows the timing of eye-head coordination (head-gaze latencies) was significantly altered
by the stimulation in 43/48 datasets. Across all 48 datasets, head onset followed gaze
onset by 2±27 ms in the control condition but preceded gaze by 57±40 ms during
stimulation trials (rank sum test, P<0.0001).
Figure 2 near here
When stimulation was triggered after gaze onset (data not shown), in contrast, the
onset times of gaze and head were comparable in the control and stimulation conditions.
Across the 67 datasets, the distributions of gaze latency for control (263±30 ms) and
stimulation (257±33 ms) conditions were not significantly different. Neither were the
distributions of head latency (control: 274±44 ms; stimulation: 268±39 ms) or head-gaze
latency (control: 11±27 ms; stimulation: 11±24 ms) (P>0.2 for all three rank sum tests).
Displacement measurements
The effect of OPN stimulation on the eye and head components of a gaze shift
was first evaluated by performing a displacement analysis. Figure 3A illustrates the
method used to compute the stimulation-induced displacements when stimulation was
delivered prior to gaze onset. The three panels display schematics of gaze, head and eye-
in-head movements as a function of time from one dataset (i.e., they have the same target
configuration). All traces are aligned on head onset (leftmost first vertical dashed line at
time 0). Each panel shows an averaged control movement (thick cyan traces) and two
individual stimulation trials (thin waveforms). The initial component of the stimulation
traces are shown in dark blue, but they are switched to red and marked with vertical
Page 15 of 62
dashed lines at the onset of the gaze shift that follows the stimulation. First consider the
stimulation trial labeled 1 . The duration from head onset to gaze onset is identified as
the span between the leftmost and the middle vertical dashed lines, and the change is
position during this interval is computed for both the averaged control movement (cyan)
and the individual stimulation trial (blue and red). This measurement is performed on
gaze, head and eye-in-head channels, as illustrated in the three panels in Fig 3A. This
same procedure was then repeated for every stimulation trial. The schematic of the trial
labeled 2 reveals that the duration from head onset to gaze onset varies between trials
and hence so do the displacement measures for both control and stimulation conditions.
Thus for each dataset, this procedure yields two distributions (control and stimulation
conditions) for gaze displacement, two for head displacement, and two for eye-in-head
displacement. Furthermore, the number of elements in each distribution equals the
number of stimulation trials in the dataset. The procedure was repeated for each of the 48
datasets.
Figure 3 near here
To generate the summary exhibited in Figure 3B, first consider the control and
stimulation distributions for the gaze channel. For each dataset, the mean gaze
displacement from the control distribution was plotted as a function of the mean gaze
displacement from the stimulation condition (top panel). Thus the summary shows data
from 48 datasets for which stimulation was delivered before gaze onset. A sign rank test
was also applied to each dataset to determine whether the medians of the matched control
and stimulations distributions were significantly different. Datasets showing statistically
significant difference are shown as circles and crosses otherwise. The average change in
Page 16 of 62
gaze position across all datasets for control (17.8±10.6°) and stimulation (0.8±0.7°)
conditions was significantly different (rank sum test, P<0.0001).
The same procedure was then applied to the control and stimulation distributions
for head and eye-in-head displacements. The summary data are plotted in the middle and
bottom panels of Fig. 3B. The eye-in-head displacement was significantly different
between control and stimulation conditions in 47 of 48 datasets. The average change in
eye position across all datasets for control (12.5±7.7°) and stimulation (–2.2±1.9°)
conditions was significantly different also (rank sum test, P<0.0001). In contrast, the
change in head position between control and stimulation conditions was significant for
only 21 datasets. The distributions of head displacements across all datasets for control
(4.7±4.1°) and stimulation (3.1±1.9°) conditions tended toward a statistical significance
difference (rank sum test, P=0.054). For the 21 datasets that were significantly different,
the mean change in head position was 6.7±4.5° for control movements and 3.7±1.5° for
stimulation trials, which represents a 38% decrement in the head displacement during the
interval of analysis.
A similar approach was taken for the displacement analysis when stimulation was
triggered on the onset of gaze shifts. The three panels in Fig. 4A are schematized
waveforms of gaze, head and eye positions as a function of time for an average control
movement (thick, cyan waveforms) and for two, individual stimulation trials (thin traces)
aligned on gaze onset (leftmost first vertical dashed line at time 0). The initial
component of the stimulation traces are shown in dark blue, but they are switched to red
and marked with vertical dashed lines at the onset of the resumed gaze shift that follows
the stimulation-induced interruption in gaze. The change in gaze position across this
Page 17 of 62
epoch was computed for each stimulation trial and the average control movement. Since
this duration is different across stimulation trials (see trials labeled 1 and 2 ), the
displacements for the control distribution are non-identical values. For each dataset, this
procedure produces two distributions that were compared with a sign rank test, as
described above. The same analysis was also performed for head and eye displacements.
For the eye component, however, if the mean control gaze shift was completed before the
end of the interval over which the displacements were measured, then the maximum eye-
in-head displacement spanning the gaze shift was used (Fig. 4A, ◊ in bottom panel).
Note that the analysis on the eye-in-head component does not compare the ocular saccade
amplitudes, but rather the change in eye position during the same intervals over which the
head displacements were evaluated (except if the control movement had completed, in
which case, we considered the saccade amplitude for the eye-in-head displacement
measurement).
Figure 4 near here
Figure 4B compares the mean changes in gaze, head and eye positions in control
and stimulation conditions across all datasets. The change in gaze (top panel) was
significantly different between control and stimulation trials in 66/67 datasets. The
average change in gaze position across all datasets for control (36.2±5.8°) and stimulation
(19.7±6.3°) conditions was significantly different (rank sum test, P<0.0001). Similarly,
the eye position displacement (bottom panel) was significantly different between control
and stimulation conditions in 66 datasets. The average change in eye position across all
datasets for control (20.4±5.6°) and stimulation (5.2±6.8°) conditions was significantly
different also (rank sum test, P<0.0001). In contrast, the change in head position between
Page 18 of 62

control and stimulation conditions was significant for only 29 datasets. Unlike the
consistent stimulation-induced decrease in gaze and eye displacement, however, the head
displacement could either increase (9/29) or decrease (20/29). The distributions of head
displacements across all datasets for control (15.6±5.7°) and stimulation (14.6±5.4°)
conditions were not statistically different (rank sum test, P=0.26).
Velocity and acceleration measurements
While the displacement analysis showed a profound effect on gaze and eye
displacements, it did not yield as convincing a result for the head component when
stimulation was triggered prior to gaze shifts (Fig. 3). When stimulation was triggered on
gaze onset, the displacement analysis failed to find any significant effect on the head
component (Fig. 4). It is possible that an effect might have been obscured because of the
larger inertia of the head relative to the eyeball (Zangemeister et al. 1981) and because of
an ongoing and perhaps attenuated neuromuscular drive to the head during the OPN
stimulation. Hence, we further considered the effect of stimulation on the head
movement by analyzing velocity and acceleration profiles for control and stimulation
trials. Gaze and eye-in-head waveforms were not considered for this analysis.
Figure 5 plots head velocity, aligned on its onset, as a function of time for
individual control (cyan) and stimulation trials (blue/red). Each panel represents trials
from one dataset. If the stimulation was delivered prior to gaze onset (Fig. 5A, B), the
portion of the head movement that occurred before gaze onset is shown in blue; the
remainder of the trial is plotted in red. Note that the duration of the blue trace is
equivalent to the interval spanned by the vertical dashed lines in Fig. 3A. When
Page 19 of 62

stimulation was triggered on the onset of gaze shifts (Fig. 5C, D), the head movement
component that spans from initial gaze onset to resumption of gaze shift following the
interruption is shown in blue, and the rest in red. This duration is equivalent to the period
spanned by the vertical dashed lines in Fig. 4A. Figure 6 shows the acceleration profiles
of the same trials and in same format as Fig. 5.
Figures 5 & 6 near here
The data illustrated in the top row in Figure 5 & 6 were chosen to provide
examples of significant attenuation on the head movement for each stimulation condition,
whereas the traces shown in the bottom panel demonstrate cases of no obvious
modification from the stimulation. In fact, on some stimulation trials, the head velocity
and acceleration was higher compared to control trials. This effect was not consistent
across all trials within a given dataset, suggesting that the effect was not specific to a
stimulation site or to a target configuration. The effect of stimulation on head
movements was quantified by examining the dynamics and kinematics of both velocity
and acceleration. For each 2-ms increment throughout the duration of the blue traces in
Figure 5 (50 ms before head onset to gaze onset), the instantaneous velocity for control
and stimulation movements were compared with a one-tailed t-test that was modified to
account for potentially unequal variances in the two distributions (Milton and Arnold
1995)(see METHODS). Stimulation delivered prior to gaze onset (48 datasets)
significantly lowered head velocity and acceleration in 37 and 32 datasets, respectively.
The mean±sd (median) attenuation in head velocity and acceleration occurred 34±35 ms
(18 ms) and 32±50 ms (19 ms), respectively, after the onset of the head movement.
Stimulation triggered on gaze onset (67 datasets) significantly lowered head velocity and
Page 20 of 62
acceleration in 35 and 23 datasets, respectively. The mean±sd (median) attenuation in
head velocity and acceleration occurred 77±54 ms (78 ms) and 75±38 ms (74 ms),
respectively, after the onset of the head movement. In general, attenuation in head
movements occurred later and was less frequent when stimulation was triggered after
gaze onset.
The kinematics analyses on the magnitude and time of peak head velocity was
performed in the same way as the displacement analysis. For each stimulation trial, the
magnitude and time of peak head velocity was computed over the trace spanned from
head onset to gaze onset (dark blue traces in Fig. 5). These values were paired with the
measurements obtained over the same interval of the average control movement, and a
sign-rank test was applied to compare the medians across paired samples of control and
stimulation distributions for each dataset. The identical procedure was then performed on
head acceleration traces.
The magnitude of peak head velocity was significantly different between control
and stimulation conditions for 34/48 datasets when stimulation delayed gaze onset (Fig.
7A). Across all datasets, the distributions of peak head velocity for control (83.4±46.7
°/s) and stimulation (54.1±30.6 °/s) were significantly different (rank sum test, P<0.001),
corresponding to ~30% decrement in the peak value under stimulation conditions. The
magnitude of peak acceleration was significantly different for 23/48 datasets (Fig. 7B).
And, like peak head velocity, the distributions of peak head acceleration for control
(1702.3±1021.6 °/s2) and stimulation (1172.1.1±713.0 °/s2) were also significantly
different (rank sum test, P=0.002), reflecting a ~25% attenuation due to the stimulation.
Figure 7 near here
Page 21 of 62
When stimulation was triggered on gaze onset, 30 of 67 datasets showed a
significant modulation in the peak head velocity measure (Fig. 7C). In a few cases, the
stimulation significantly increased peak head velocity. Across all datasets, however, the
change was quite small, less than 4% attenuation, and the distributions in control
(121.0±58.4 °/s) and stimulation (110.1±52.7 °/s) conditions were not significantly
different (rank sum test, P>0.2). For peak head acceleration (Fig. 7D), only 15 datasets
showed a significant change. Like peak velocity, the stimulation barely reduced peak
acceleration, by less than 2%, and there was no statistical difference between the control
(2173.7.1.1±1898.8 °/s2) and stimulation (2019.8±1816.2 °/s2) distributions (rank sum
test, P>0.4).
Caution is required when comparing the times of peak velocity and acceleration
between control and stimulation conditions. An examination of the temporal profiles in
Figs. 5 & 6 reveals why this is the case. When stimulation delayed gaze onset (Fig. 5A,
6A), the head movement was accelerating when the gaze shift was initiated. In other
words, the time of peak head velocity (and acceleration) is approximately equal to the
duration of the head-only movement (each blue trace). Now note that the cyan, control
waveforms across the same interval are also increasing, which implies that the peak times
will be very similar for the matched pairs between control and stimulation trials. To
circumvent this confound, we appended to each stimulation trial, the 100 ms of data
following gaze onset, i.e., 100 ms after each blue trace ends, and computed the peak time
measure. We also performed this operation on the datasets collected when stimulation
was triggered on gaze onset, although this problem was not common for the long duration
stimulation-induced interruptions.
Page 22 of 62

The time of peak head velocity was significantly different for 27/48 datasets when
stimulation was delivered before gaze onset (Fig. 8A). Across the datasets, the
distributions of control (132±20 ms) and stimulation (159±34 ms) conditions were
significantly different (rank sum test, P<0.0001). The mean±sd stimulation-induced shift
in time to peak velocity was 27±33 ms across the datasets. There was a significant effect
in the peak acceleration time for 26 datasets (Fig. 8B). Across all datasets, the
distributions of control (80±30 ms) and stimulation (112±36 ms) conditions were
significantly different (rank sum test, P<0.0001). The mean±sd shift in time was 33±36
ms across the datasets.
Figure 8 near here
Stimulation triggered on the onset of gaze shifts delayed the time of peak head
velocity in 36 datasets (Fig. 8C). Across the 67 datasets, the distributions of control
(140±27 ms) and stimulation (189±87 ms) conditions were significantly different (rank
sum test, P<0.001), and the mean±sd stimulation-induced shift in time was 48±77 ms.
There was a similar, significant effect in the peak acceleration time for 25 datasets (Fig.
8D). Across all datasets, the distributions of control (85±37 ms) and stimulation (124±81
ms) conditions were significantly different (rank sum test, P<0.01). Stimulation delayed
the peak time by 39±80 ms across the datasets.
Counter-rotation gain during the interruption
The examples and analyses of Figs. 1, 3A, and 4A demonstrate qualitatively that gaze
position remains nearly constant during all stimulation-induced interruptions. Since the
head continues to move during this period, the eyes must counter-rotate in the orbits by
Page 23 of 62

the amount of the head movement. We quantified this observation by plotting for each
dataset the average change in eye position as a function of the mean head displacement
over a period from head onset to gaze onset when stimulation was delivered prior to gaze
onset (Fig. 9A). This interval is marked by the vertical dashed lines in Fig. 3A. When
stimulation was triggered on gaze onset, the mean changes in eye and head positions
during the interval between initial gaze shift offset and resumed gaze shift onset were
compared (Fig. 9B). Note that this interval is not identical to the duration marked by the
vertical lines in Fig. 4A. For both stimulation conditions, the points fall along the
negative unity slope (dashed) line.
Figure 9 near here
We quantified this observation with a counter-rotation gain parameter that was
computed as the negative of ratio of the eye and head displacements plotted in Fig. 9.
This approach of computing the counter-rotation gain is an indirect way to evaluate the
VOR gain, which is typically computed as the negative of the ratio of eye and head
velocities (Leigh and Zee 1999). A gain close to one would imply that the VOR is fully
active. When stimulation was delivered before gaze onset, the mean±sd (median) gain
was 0.70±0.27 (0.75). Similarly, when stimulation was triggered after gaze onset, the
mean±sd (median) gain was 0.85±0.21 (0.91). Next, we subtracted the magnitudes of eye
and head displacements during the counter-rotation phase for each dataset and used a sign
rank test to determine whether the median difference across all datasets was significantly
different from zero (P>0.1, stimulation before gaze onset; P>0.8, stimulation after gaze
onset). Thus, these results indicate the eye-in-head and head displacements during the
counter-rotation were roughly equal in magnitude and opposite in direction, and imply
Page 24 of 62
that the VOR gain is close to unity during the interruption produced by stimulation of the
OPN region.
Effects of biomechanical factors
Both the length of a muscle and its velocity of contraction constrain the force
generated by a skeletal muscle. Since our experiments required different initial head
positions (either roughly centered on the body or deviated approximately 20° to the right
or left) and different head dynamics (40° or 60° gaze shifts), we sought to determine
whether these parameters could account for the effects observed during OPN stimulation.
Unfortunately, head velocity profiles associated with the same initial head position and
same desired gaze shift did not display enough variability to test for a combined effect of
muscle length and velocity of contraction. Hence, we tested for effects of these
parameters separately.
To investigate for a potential effect of head position on the kinematics, we
performed a two-way ANOVA with factors initial head position (centered or deviated)
and trial type (control or stimulation). Table 1 lists the P-values for the parameters
reported in the preceding sections. Consistent with the previous study (Corneil et al.
2001), initial head position influenced most parameters associated with head movements
during both stimulation conditions. Note, however, that the effects of the two factors
were mostly independent. There were no statistically significant interaction effects when
stimulation was delivered prior to gaze onset. When the stimulation was triggered on
gaze onset, significant interactions were noted only on the times of peak head velocity
and acceleration (Fig. 8) and on the amplitudes of gaze and eye displacements (Fig. 4B).
Page 25 of 62

Tables 1 & 2 near here
To test for an effect of head velocity, we sought to study gaze shifts of very
different amplitudes generated from the same initial head position. Our reasoning was
that head movements, and therefore head velocities, associated with these gaze shifts are
different enough to be considered for statistical (ANOVA) testing. Thus, we only
considered trials with desired gaze shifts of 40° and 60° and initial head position at 20°
contraversive to the direction of the movement. We performed a two-way ANOVA with
factors desired gaze shift (40° and 60°) and trial type (control or stimulation). Table 2
lists the P-values for the parameters reported in the preceding sections. Consistent with
the initial head position effect, the desired gaze amplitude – and by extension, head
velocity – and the trial type significantly influenced head movement parameters such as
displacement, and magnitude and time of peak velocity and acceleration, but there were
no interaction effects on the head component.
DISCUSSION
Converging lines of evidence indicate that at least two partially independent pathways are
involved in the neural control of coordinated eye and head movements, and that different
modes of active eye-head coordination exist. A series of early influential studies (Bizzi
et al. 1972; Bizzi et al. 1971) demonstrated that the relative timing of the eye and head
components and the patterns of neck muscle activity observed when directing gaze to an
unexpected stimulus (triggered mode) is quite different from that observed when animals
look to anticipated targets (predictive mode). In general, the onset of the eye and head
components are more tightly coupled in the triggered mode, but the head can often lead
Page 26 of 62

for large gaze shifts in the predictive mode (Bizzi et al. 1972; Moschner and
Zangemeister 1993; Zangemeister and Stark 1982a). Behavioral paradigms designed to
specify separate gaze and head movement goals (Goossens and Van Opstal 1997) and
tasks using auditory stimuli (Populin 2006; Tollin et al. 2005) have also demonstrated
that the eye and head components of the coordinated movement can achieve a degree of
independence.
The results of our OPN stimulation experiments support the partially independent
pathways hypothesis, as they demonstrate a dissociation of the eye and head components
of gaze shifts, even those produced in the triggered mode. We found that stimulation of
the OPN region before gaze onset typically delays the saccadic eye movement until
stimulation offset, on the order of several hundred milliseconds, without preventing the
head movement (Fig. 2A-C). Triggering the stimulation on the onset of the gaze shift
arrests the ongoing saccadic eye movement without stopping the head movement.
Furthermore, the duration of the head movement is quite different from the durations of
the saccadic eye component and the gaze shift (data not shown, but qualitatively
obvious). With early stimulation, for example, the head begins before gaze (and eye
saccade) onset and continues after the gaze shift (and eye saccade) terminated.
The partial aspect of the partially independent pathways must be emphasized,
however, as evidence for interactions between the two pathways are also present in our
data. For example, although head movements are not prevented during stimulation
delivered before gaze onset, they are significantly delayed (35/48 datasets). There is also
a small effect on head amplitude when stimulation is delivered prior to gaze onset
(significant for 21/48 datasets) and even when stimulation is triggered on gaze onset
Page 27 of 62
(significant for 29/67 datasets). Moreover, stimulation modified both the initial and peak
velocity and acceleration of the head movements in a majority of the datasets. But note
that for some datasets, the head kinematics and/or dynamics are greater in the stimulation
condition compared to control trials. This effect is not likely specific to a stimulation site
or to the target configuration because the enhancement was observed on only some trials
within individual datasets (see Fig. 5B, for example). Finally, the ongoing head
movement reaccelerates in association with the gaze shift and eye saccade that follows
stimulation offset (Fig. 1; also see (Corneil et al. 2002)). Evidence for interactions
between the two pathways comes for other studies as well. For instance, natural or
stimulation-induced variability in an ongoing head movement dynamics alters the
dynamics of the saccadic eye movement (Freedman and Quessy 2004; Freedman and
Sparks 2000).
Biomechanical factors (see Tables 1 & 2), such initial head position, velocity of
ongoing head movements and inertia could also have contributed to the variability
observed in the head dynamics. Despite the variability in the head movement dynamics
after OPN stimulation, there was no obvious sign of a sharp deceleration of the head
movement. If the OPN stimulation had activated fibers projecting to the antagonistic
neck muscles, which are lengthening during an ongoing head movement, then the force
produced by the recruitment of lengthening muscle fibers would have been magnified.
This would have produced a sharp and observable deceleration, and perhaps even halted
the head movement. In our datasets, the deceleration was modest at best, suggesting that
stimulation of the OPNs did not result in active breaking of the head movement.
Page 28 of 62
Based on these results, we conclude that stimulation of the OPN region gates the
neural pathway required to produce the saccadic eye component of the gaze shift and that
this pathway is not the only one involved in generating the head component of the gaze
shift. This interpretation is in agreement with existing hypotheses of neural control of
gaze shifts (Corneil et al. 2002; Freedman 2001; Goossens and Van Opstal 1997; Grantyn
and Berthoz 1987; Guitton et al. 1990; Phillips et al. 1995). Figure 10 illustrates a
schematic of the pathways and neural commands hypothesized to produce coordinated
eye-head movements. It emphasizes that the pathway generating the eye component
relies on a desired gaze displacement command (∆Gd) and is gated by the OPNs. The
drive to the neck muscles, in contrast, is a combination of a pure head movement
command (Hc; pathway 1) and some formulation of ∆Gd. Evidence supporting the notion
of a head movement command, not necessarily associated with a gaze shift, comes from
neural recordings in the superior colliculus (Gandhi and Walton 2006), central
mesencephalic reticular formation (Pathmanathan et al. 2006a,b), microstimulation of the
frontal and supplementary eye fields (Chen 2006; Chen and Walton 2005), and
adaptation of eye-head coordination in the context of a limited visual field (Constantin et
al. 2004). Neural signals encoding a desired gaze displacement command have been
proposed to exist at the level of the superior colliculus (Freedman and Sparks 1997a;
Freedman et al. 1996; Klier et al. 2001; Munoz et al. 1991), frontal eye field (Guitton and
Mandl 1978; Knight and Fuchs 2007; Tu and Keating 2000)(but see (Chen 2006) for an
alternative hypothesis), and supplementary eye field (Chen and Walton 2005; Martinez-
Trujillo et al. 2003). The ∆Gd command, perhaps after some processing that incorporates
the effect of the eye position in the orbits and the location of the stimulus (Freedman
Page 29 of 62
2001), adds to the neck muscle drive at the level of the pontine burst generator (BG).
Some studies have suggested that the gaze command drive is parsed into individual, but
not necessarily independent, anatomical pathways encoding eye and head movements
before BG (pathway 2, Fig. 10; (Freedman 2001; Freedman and Quessy 2004; Phillips et
al. 1995)), whereas others have suggested that the separation occurs after BG (pathway
3)(Corneil et al. 2002; Galiana and Guitton 1992; Goossens and Van Opstal 1997;
Grantyn et al. 1987; Guitton et al. 1990). These latter two options need not be mutually
exclusive. While anatomical support for tectospinal and tectoreticulospinal projections
have been reported in cats (Grantyn and Berthoz 1988; Grantyn et al. 1992; Grantyn et al.
1987; Isa and Naito 1995) and monkeys (Cowie et al. 1994; May and Porter 1992;
Scudder et al. 1996a; b), it is not known whether they are subject to OPN inhibition.
Figure 10 near here
The interpretations of our OPN stimulation results on the neck muscle drive
pathways are limited because of at least two unknown factors: the functional importance
of the Hc pathway during gaze shifts, and the effects of OPN stimulation on the Hc and
∆Gd signals. The contribution of the head movement command pathway and how it is
affected by OPN stimulation are not known and require further investigation. If the Hc
contribution is significant, then our results cannot distinguish between pathways 2 & 3.
The occasional observation that head velocity is higher during the stimulation-induced
interruption (Fig. 7) implicates a functionally significant role for the Hc command. On
the other hand, if the Hc contribution is small or negligible, then our results – in
particular, the observation that OPN stimulation does not prevent head movements –
provide strong support for a drive to the neck muscles that is not gated by the OPNs
Page 30 of 62
(pathway 2). Pathway 3 also remains viable because numerous head movement
characteristics of some datasets were altered, although this effect could also be explained
by the effects of OPN stimulation on the ∆Gd command. When head-restrained saccades
are interrupted in mid-flight by stimulation of the OPN region, the high-frequency
activity in colliculus neurons, presumably those encoding ∆Gd, is suppressed
immediately (Keller and Edelman 1994; Keller et al. 2000). The stereotypical saccade-
related burst neuron remains quiescent during most of the interruption period and,
depending on the interruption duration, the same or another at a more rostral site
discharges a high-frequency burst just before the resumed saccade. In another subset of
neurons, presumably the buildup type, the low-frequency activity resumes after the initial
suppression and maintains a low discharge rate during the interrupted period. Given the
colliculus’ role in gaze control, it seems safe to assume that these neurons behave
similarly for OPNs stimulation during head-unrestrained gaze shifts and head-restrained
saccades. Accordingly, we speculate that for stimulation of the OPN region before gaze
(or saccade) onset, a subset of collicular neurons will exhibit a low firing rate, but that the
level of activity may be attenuated and its onset may be delayed. If this activity
represents an attenuated and delayed neuromuscular drive to the neck muscles, the
resulting head movement is likely to exhibit a longer onset time and slower dynamics
(Fig. 2B). Similarly, when OPN stimulation interrupts ongoing gaze shifts, the
immediate suppression followed by low-frequency activity is interpreted as a weaker
drive to the neck muscles, resulting in a slower but still continuing head movement.
Following stimulation offset, superior colliculus neurons produce a high frequency burst
Page 31 of 62
to generate a gaze shift. This activity also contributes to the neck muscle drive via either
pathway (2 or 3) and re-accelerates the ongoing head movement.
Feedback mechanisms
In most models of the saccadic system, feedback control of head-restrained
saccades is maintained by subtracting an internal feedback signal representing current eye
displacement from a motor command of desired eye displacement (Becker et al. 1981;
Robinson 1975). The resulting motor error signal drives the burst generator until
feedback reduces it to zero. When the head is unrestrained, appropriate feedback
analyses need to consider three signals – gaze, head and eye-in-head. One class of
models proposes that the feedback mechanisms preserve gaze accuracy (see review by
(Guitton et al. 2003)). This is accomplished by computing a gaze motor error signal as
the difference between desired gaze displacement and feedback signals of instantaneous
eye-in-head and head displacements (Galiana and Guitton 1992; Guitton et al. 1990).
Note that the exact eye and head contributions to the gaze shift are not controlled in this
schema. Another family of models suggests that the desired gaze displacement is
decomposed into appropriate desired head amplitude and desired eye saccade amplitude,
and the feedback mechanism serves the eye pathway only (Freedman 2001; Freedman
and Quessy 2004). Gaze and head amplitudes are not controlled in this framework.
These competing hypotheses have been tested by observing behavioral and
electrophysiological compensation to passive head perturbations (Choi and Guitton 2006;
Coimbra et al. 2000; Matsuo et al. 2004; Sylvestre and Cullen 2006), microstimulation of
numerous brain structures (Freedman and Quessy 2004; Pélisson et al. 1995), and
Page 32 of 62
naturally prolonged movements (Bergeron and Guitton 2000; 2002). The majority of
studies have demonstrated gaze accuracy (see (Freedman and Quessy 2004) for
exception). We induced perturbations by stimulation of the OPN region and also found
that the mean difference in total gaze amplitude between the control and stimulation
conditions was on the order of 1°. Thus, our data are not inconsistent with the gaze
comparator class of models.
To evaluate the eye comparator class of models, we would need to compare the
total amplitude of the saccadic eye components in the control and stimulation conditions.
This comparison would be justified if we can verify that the desired saccadic eye
component is not recomputed during the interruption, and extrapolation of existing
electrophysiological experiments on the head-restrained system suggests that this
condition may be violated. Referring to the effects of interrupted saccades on SC activity
discussed above (Keller and Edelman 1994; Keller et al. 2000), the locus of activity on
the SC shifts to a rostral site encoding the smaller resumed saccade when interruption
durations are long (>70 ms; Keller, personal communications), which was typical of our
data. Assuming that this observation also holds for the head-unrestrained condition, the
locus of activity would also shift to a more rostral site for the resumed gaze shift. A new
desired gaze displacement command could result in recalculating the desired saccadic
component, thereby confounding interpretations of a comparison of the total saccade
amplitude in the control and stimulation conditions. Hence this analysis is not reported,
and we are unable to test the eye comparator class of models in a straight-forward
manner.
Page 33 of 62
Summary
We found that stimulation of the OPN region induces dissociation between the
eye and head components of gaze shifts. The ocular saccade is completely inhibited by
the stimulation. A head movement can be initiated during the stimulation, and an
ongoing head movement continues along its trajectory. Post stimulation offset, the gaze
shift resumes as a coordinated eye-head movement and preserves gaze accuracy. A
reacceleration of the head movement is typically observed in association with the
resumed gaze shift.
Compared to the control condition, head movement dynamics are altered during
the stimulation – typically they are attenuated but sometimes enhanced. These results
indicate that the signals producing the saccadic eye movement component of a
coordinated eye-head gaze shift are not the only commands involved in the generation of
the head component of the gaze shift. Additional drives to the neck muscles can stem for
the desired gaze displacement command and head movement commands not necessarily
associated with gaze shifts. This latter signal could be relayed through other volitionally-
recruited pathways projecting to the spinal cord and could account for an increase in head
dynamics during the stimulation.
Page 34 of 62

ACKNOWLEDGEMENTS
We thank Dennis Murray for animal care and expert assistance during surgical
procedures, Kathy Pearson for software assistance, and Sam Houston for machine shop
services. The study was funded by NIH grants EY07009, EY015485, and EY01189.
Page 35 of 62

FIGURE LEGENDS
Figure 1 – Temporal representation of effects of stimulation of the OPN region on head-
unrestrained gaze shifts. Horizontal amplitude (left column) and velocity (right column)
are plotted as a function of time for rightward gaze shifts directed to a target that was
briefly flashed at a 60° eccentricity in tangential coordinates. Several, individual control
trials are shown in cyan and stimulation trials are shown in red. (A1-A3) Effect of
stimulation delivered prior to the onset of gaze shifts. The three panels plot the gaze,
head, and eye-in-head components of coordinated eye-head movements. The trials are
aligned on target onset. For the 5 stimulation trials shown here, stimulation onset
occurred 150 ms after target onset and lasted for 300 ms. (B1-B3) Effect of stimulation
triggered on the onset of gaze shifts. The three panels plot the gaze, head and eye-in-
head components, each aligned on gaze onset, as a function of time. Stimulation was
triggered as either gaze or head position left its computer controlled window around the
fixation point. Stimulation duration for the illustrated red trials was 200 ms. The two
datasets shown in panels (A, B) have the same target configuration and were collected
from the same stimulation site in one animal. The arrows indicate the reacceleration of
head movements that accompany gaze shifts after stimulation offset. Also note that the
gaze and eye velocity traces illustrated in this figure do not show the dual-peak
modulation reported previously (Freedman and Sparks 2000). We speculate that this
effect is most robust during visually-guided movements. The movements illustrated here
were performed in the memory-guided task, and the absence of visual information is
shown to reduce peak velocity, at least of head-restrained saccades (Edelman and
Page 36 of 62
Goldberg 2003). A preliminary examination of the appropriate data collected in the gap
task was comparable to the modulation in movement kinematics (data not shown).
Figure 2 – The effect of stimulation of the OPN region on latency. (A) Gaze latency, (B)
head latency, and (C) head-gaze onset times are compared for stimulation vs. control
conditions when stimulation was triggered before gaze onset. A negative value of head-
gaze latency indicates that the head movement preceded gaze onset. Each point
represents a dataset (n=48). Statistically significant datasets (o), based on a rank-sum test
(P<0.05) are differentiated from non-significant datasets (x). The diagonal dashed lines
indicate unity slope.
Figure 3 – Analysis of the change in position observed when stimulation was delivered
before gaze onset. (A) Schematics of gaze (top), head (middle) and eye-in-head (bottom)
for an averaged control gaze shift (thick, cyan traces) and two, individual stimulation
trials (thin traces shown in blue and red) from the same dataset. The traces are aligned on
head onset (leftmost vertical dashed line). For each of the two illustrations of stimulation
trials, the initial component is shown in blue, but is changed to red and also marked by a
vertical line at the time of gaze onset (post stimulation offset). The change in gaze, head
and eye-in-head positions traversed by the control and each stimulation trial for its
designated interval was determined. This method produced two distributions (control and
stimulation conditions) of displacements each for gaze, head, and eye-in-head
components. Note that the amplitude scale is intentionally omitted because the traces are
meant to represent schematics. (B) The paired displacement measures for the control and
stimulation subsets were averaged for each dataset and compared for gaze (top), head
(middle) and eye-in-head (bottom) components. Each point corresponds to one dataset.
Page 37 of 62
Statistically significant datasets (o), based on a sign-rank test (P<0.05) are differentiated
from non-significant datasets (x). The diagonal dashed lines indicate unity slope.
Figure 4 – Analysis of the change in position observed when stimulation was triggered
on gaze onset. (A) Schematics of gaze (top), head (middle) and eye-in-head (bottom) for
an averaged control gaze shift (thick, cyan traces) and two, individual stimulation trials
(thin traces shown in blue and red) from the same dataset. The traces are aligned on gaze
onset (leftmost vertical dashed line). For each of the two illustrations of stimulation
trials, the initial component is shown in blue, but is changed to red and also marked by a
vertical line at the time of resumed gaze shift (post stimulation offset). The change in
gaze, head and eye-in-head positions traversed by the control and each stimulation trial
for its designated interval was determined. This method yielded two distributions
(control and stimulation conditions) of displacements each for gaze, head, and eye-in-
head components. (B) The paired displacement measures for the control and stimulation
subsets were averaged for each dataset and compared for gaze (top), head (middle) and
eye-in-head (bottom) components. Each point corresponds to one dataset. Statistically
significant datasets (o), based on a sign-rank test (P<0.05) are differentiated from non-
significant datasets (x). The diagonal dashed lines indicate unity slope.
Figure 5 – Temporal evolution of horizontal head velocity. Each panel shows control
(cyan) and stimulation (red, blue) trials aligned on head onset, marked by the vertical
dashed lines. (A, B) Data from two datasets for which stimulation was delivered before
gaze onset. The component of head movement that preceded gaze onset in each
stimulation trace is shown in blue; this epoch corresponds to the interval marked by the
vertical dashed lines in Fig. 3A. The remainder of the trial is shown in red. (C, D) Data
Page 38 of 62
from two datasets for which stimulation was triggered on gaze onset. For each
stimulation trial, the interval from initial gaze onset to resumed gaze onset is overlaid in
blue; the rest of each trial is shown in red. These datasets were chosen to illustrate cases
where stimulation did (top panels) and did not (bottom panels) attenuate the head
movement.
Figure 6 – Temporal evolution of horizontal head acceleration during control and
stimulation conditions. The datasets and figure format are the same as in Figure 5.
Figure 7 – A comparison of peak head velocity (A, C) and peak head acceleration (B, D)
in the control and stimulation conditions. The peak value was computed across the ‘blue’
component of each stimulation trace (Figs. 5 & 6) and the same interval of an averaged
control movement. The control and stimulation values for each dataset were averaged
and compared across all datasets. Thus, each point corresponds to one dataset.
Statistically significant datasets (o), based on a sign-rank test (P<0.05) are differentiated
from non-significant datasets (x). The diagonal dashed lines indicate unity slope. Data in
left and rights columns represent the conditions when stimulation was delivered before
and after gaze onset, respectively.
Figure 8 – A comparison of the times of peak head velocity (A, C) and peak head
acceleration (B, D). The figure has the same format as Figure 7, but with one major
exception. The times of the peak magnitudes were determined over the duration of the
blue trials (Figs. 5 & 6) plus another 100 ms (see text for details).
Figure 9 – An indirect evaluation of the counter-rotation gain, which presumably reflects
the VOR gain, was assessed by comparing the change in eye position as a function of the
head displacement traversed during the stimulation-induced interruption in gaze. (A)
Page 39 of 62
When stimulation was delivered before gaze onset, the changes in eye-in-head and head-
in-space positions were measured over the interval from head onset to gaze onset (the
region marked by the vertical dashed lines in Fig. 3A). (B) When stimulation was
triggered on gaze onset, the measurements were made across the interval starting at the
end of the initial gaze shift and ending at the onset of the resumed gaze shift. Each point
represents the average changes in eye and head positions for each dataset.
Figure 10 – Simplified schematic of the flow of neural signals involved in generating
coordinated eye-head movements. Two partially independent pathways provide input
signals. A head movement command (Hc) provides one drive to the neck muscles
(pathway 1), but the functional importance of this pathway during gaze shifts has yet to
be determined. A desired gaze displacement command (∆Gd) contributes to producing
the saccadic eye and head components of the gaze shift. One possibility (pathway 2) is
that ∆Gd is dissociated into separate eye and head commands before the burst generator
(BG), which in turn provides a drive to only the extraocular motoneurons (MNe). Thus,
no subset of the ∆Gd drive to the neck muscles is gated by the omnipause neurons (OPN).
Another scenario (pathway 3) is that the separation of ∆Gd into separate eye and head
pathways occurs after the burst generator elements. Note that pathways 2 & 3 need not
be mutually exclusive. Abbreviations: BG, burst generator; MNe, extraocular
motoneurons; MNn, neck motoneurons; OPN, omnipause neurons; ∆Gd, desired gaze
displacement command; Hc, head movement command.
Page 40 of 62

REFERENCES
Becker W. Saccades. In: Eye Movements, edited by Carpenter RHS. London: The Macmillan Press Ltd, 1991, p. 95-137. Becker W, and Jürgens R. Gaze saccades to visual targets: does head movement change the metrics. In: The Head-Neck Sensory Motor System, edited by Berthoz A, Graf W, and Vidal PP. New York: Oxford Univ. Press, 1992, p. 427-433. Becker W, King WM, Fuchs AF, Jürgens R, Johanson G, and Kornhuber HH.Accuracy of goal-directed saccades and mechanisms of error correction. In: Progress in Oculomotor Research, edited by Fuchs AF, and Becker W. New York: Elsevier, 1981, p. 29-37. Bergeron A, and Guitton D. Fixation neurons in the superior colliculus encode distance between current and desired gaze positions. Nat Neurosci 3: 932-939, 2000. Bergeron A, and Guitton D. In multiple-step gaze shifts: omnipause (OPNs) and collicular fixation neurons encode gaze position error; OPNs gate saccades. JNeurophysiol 88: 1726-1742, 2002. Bizzi E, Kalil RE, and Morasso P. Two modes of active eye-head coordination in monkeys. Brain Res 40: 45-48, 1972. Bizzi E, Kalil RE, and Tagliasco V. Eye-head coordination in monkeys: Evidence for centrally patterned organization. Science 173: 452-454, 1971. Chen LL. Head movements evoked by electrical stimulation in the frontal eye field of the monkey: evidence for independent eye and head control. J Neurophysiol 95: 3528-3542, 2006. Chen LL, and Walton MM. Head movement evoked by electrical stimulation in the supplementary eye field of the rhesus monkey. J Neurophysiol 94: 4502-4519, 2005. Choi WY, and Guitton D. Responses of collicular fixation neurons to gaze shift perturbations in head-unrestrained monkey reveal gaze feedback control. Neuron 50:491-505, 2006. Coble ET, Ling L, Phillips JO, and Fuchs AF. The role of omnipause neurons during gaze shifts. In: Visual and Oculomotor Functions: Advances in Eye Movement Research,edited by d'Ydewalle G, and Van Resnbergen J. Amsterdam: Elsevier, 1994, p. 285-293. Cohen B, and Komatsuzaki A. Eye movements induced by stimulation of the pontine reticular formation: evidence for integration in oculomotor pathways. Exp Neurol 36:101-117, 1972. Cohen YE, and Andersen RA. A common reference frame for movement plans in the posterior parietal cortex. Nat Rev Neurosci 3: 553-562, 2002. Coimbra AJ, Lefèvre P, Missal M, and Olivier E. Difference between visually and electrically evoked gaze saccades disclosed by altering the head moment of inertia. JNeurophysiol 83: 1103-1107, 2000. Constantin AG, Wang H, and Crawford JD. Role of superior colliculus in adaptive eye-head coordination during gaze shifts. J Neurophysiol 92: 2168-2184, 2004. Constantin AG, Wang H, Martinez Trujillo JC, and Crawford DJ. A quantitative comparison of head-free gaze shifts evoked through electrical stimulation of the lateral intraparietal area (LIP) and the superior colliculus (SC) in the macaque. Soc Neurosci Abstr Program No. 139.5: 2006.
Page 41 of 62
Corneil BD, Olivier E, and Munoz DP. Neck muscle activity evoked by stimulation of the monkey superior colliculus. II. Relationships with gaze shift initiation and comparison to volitional head movements. J Neurophysiol 88: 2000-2018, 2002. Corneil BD, Olivier E, Richmond FJ, Loeb GE, and Munoz DP. Neck muscles in the rhesus monkey. II. Electromyographic patterns of activation underlying postures and movements. J Neurophysiol 86: 1729-1749, 2001. Courjon JH, Olivier E, and Pelisson D. Direct evidence for the contribution of the superior colliculus in the control of visually guided reaching movements in the cat. JPhysiol 556: 675-681, 2004. Cowie RJ, Smith MK, and Robinson DL. Subcortical contributions to head movements in macaques. II. Connections of a medial pontomedullary head-movement region. JNeurophysiol 72: 2665-2682, 1994. Crawford JD, Martinez-Trujillo JC, and Klier EM. Neural control of three-dimensional eye and head movements. Curr Opin Neurobiol 13: 655-662, 2003. Crawford JD, Medendorp WP, and Marotta JJ. Spatial transformations for eye-hand coordination. J Neurophysiol 92: 10-19, 2004. Curthoys IS, Markham CH, and Furuya N. Direct projection of pause neurons to nystagmus-related excitatory burst neurons in the cat pontine reticular formation. Exp Neurol 83: 414-422, 1984. Edelman JA, and Goldberg ME. Saccade-related activity in the primate superior colliculus depends on the presence of local landmarks at the saccade endpoint. JNeurophysiol 90: 1728-1736, 2003. Freedman EG. Interactions between eye and head control signals can account for movement kinematics. Biol Cybern 84: 453-462, 2001. Freedman EG, and Quessy S. Electrical stimulation of rhesus monkey nucleus reticularis gigantocellularis. II. Effects on metrics and kinematics of ongoing gaze shifts to visual targets. Exp Brain Res 156: 357-376, 2004. Freedman EG, and Sparks DL. Activity of cells in the deeper layers of the superior colliculus of the rhesus monkey: evidence for a gaze displacement command. JNeurophysiol 78: 1669-1690, 1997a. Freedman EG, and Sparks DL. Coordination of the eyes and head: movement kinematics. Exp Brain Res 131: 22-32, 2000. Freedman EG, and Sparks DL. Eye-head coordination during head-unrestrained gaze shifts in rhesus monkeys. J Neurophysiol 77: 2328-2348, 1997b. Freedman EG, Stanford TR, and Sparks DL. Combined eye-head gaze shifts produced by electrical stimulation of the superior colliculus in rhesus monkeys. J Neurophysiol 76:927-952, 1996. Fukushima K, Yamanobe T, Shinmei Y, Fukushima J, Kurkin S, and Peterson BW.Coding of smooth eye movements in three-dimensional space by frontal cortex. Nature 419: 157-162., 2002. Fuller JH. Eye position and target amplitude effects on human visual saccadic latencies. Exp Brain Res 109: 457-466, 1996. Galiana HL, and Guitton D. Central organization and modeling of eye-head coordination during orienting gaze shifts. Ann N Y Acad Sci 656: 452-471, 1992.
Page 42 of 62

Gandhi NJ, and Keller EL. Activity of the brain stem omnipause neurons during saccades perturbed by stimulation of the primate superior colliculus. J Neurophysiol 82:3254-3267, 1999. Gandhi NJ, and Sparks DL. Accuracy of head-unrestrained gaze shifts interrupted by stimulation of the omnipause neurons in monkey. Soc Neurosci Abstr 784.783, 2001a. Gandhi NJ, and Sparks DL. Experimental control of eye and head positions prior to head-unrestrained gaze shifts in monkey. Vision Res 41: 3243-3254, 2001b. Gandhi NJ, and Sparks DL. Microstimulation of the pontine reticular formation in monkey: effects on coordinated eye-head movements. Soc Neurosci Abstr 109.108, 2000.Gandhi NJ, and Walton MM. Superior colliculus activity associated with head movements. Soc Neurosci Abstr Program No. 211.2: 2006. Gardner JL, and Lisberger SG. Linked target selection for saccadic and smooth pursuit eye movements. J Neurosci 21: 2075-2084, 2001. Goffart L, Quinet J, Chavane F, and Masson GS. Influence of background illumination on fixation and visually guided saccades in the rhesus monkey. Vision Res 46: 149-162, 2006. Goossens HH, and Van Opstal AJ. Human eye-head coordination in two dimensions under different sensorimotor conditions. Exp Brain Res 114: 542-560, 1997. Grantyn A, and Berthoz A. Reticulo-spinal neurons participating in the control of synergic eye and head movements during orienting in the cat. I. Behavioral properties. Exp Brain Res 66: 339-354, 1987. Grantyn A, and Berthoz A. The role of the tectoreticulospinal system in the control of head movement. In: Control of Head Movement, edited by Peterson BW, and Richmond FJ. New York: Oxford University Press, 1988, p. 224-244. Grantyn A, Berthoz A, Hardy O, and Gourdon A. Contribution of reticulospinal neurons to the dynamic control of head movements: presumed neck bursters. In: The Head-Neck Sensory-Motor System, edited by Berthoz A, Vidal PP, and Graf W. New York: Oxford, 1992, p. 318-329. Grantyn A, Ong-Meang Jacques V, and Berthoz A. Reticulo-spinal neurons participating in the control of synergic eye and head movements during orienting in the cat. II. Morphological properties as revealed by intra-axonal injections of horseradish peroxidase. Exp Brain Res 66: 355-377, 1987. Graziano MS, Hu XT, and Gross CG. Coding the locations of objects in the dark [see comments]. Science 277: 239-241, 1997. Guitton D, Bergeron A, Choi WY, and Matsuo S. On the feedback control of orienting gaze shifts made with eye and head movements. Prog Brain Res 142: 55-68, 2003. Guitton D, and Mandl G. Frontal 'oculomotor' area in alert cat. II. Unit discharges associated with eye movements and neck muscle activity. Brain Res 149: 313-327, 1978. Guitton D, Munoz DP, and Galiana HL. Gaze control in the cat: studies and modeling of the coupling between orienting eye and head movements in different behavioral tasks. J Neurophysiol 64: 509-531, 1990. Huebner WP, Paloski WH, Reschke MF, and Bloomberg JJ. Geometric adjustments to account for eye eccentricity in processing horizontal and vertical eye and head movement data. J Vestib Res 5: 299-322, 1995.
Page 43 of 62

Isa T, and Naito K. Activity of neurons in the medial pontomedullary reticular formation during orienting movements in alert head-free cats. J Neurophysiol 74: 73-95, 1995. Keller EL. Control of saccadic eye movements by midline brain stem neurons. In: Control of Gaze by Brain Stem Neurons, edited by Baker R, and Berthoz A. Amsterdam: Elsevier, 1977, p. 327-336. Keller EL, and Edelman JA. Use of interrupted saccade paradigm to study spatial and temporal dynamics of saccadic burst cells in superior colliculus in monkey. JNeurophysiol 72: 2754-2770, 1994. Keller EL, Gandhi NJ, and Vijay Sekaran S. Activity in deep intermediate layer collicular neurons during interrupted saccades. Exp Brain Res 130: 227-237, 2000. Keller EL, Gandhi NJ, and Weir PT. Discharge of superior collicular neurons during saccades made to moving targets. J Neurophysiol 76: 3573-3577, 1996. King WM, and Fuchs AF. Neuronal activity in the mesencephalon related to vertical eye movements. In: Control of Gaze by Brain Stem Neurons, edited by Baker R, and Berthoz A. Amsterdam: Elsevier, 1977, p. 319-326. Klier EM, Wang H, and Crawford JD. The superior colliculus encodes gaze commands in retinal coordinates. Nat Neurosci 4: 627-632, 2001. Knight TA, and Fuchs AF. Contribution of the frontal eye field to gaze shifts in the head-unrestrained monkey: effects of microstimulation. J Neurophysiol 97: 618-634, 2007. Land MF. Predictable eye-head coordination during driving. Nature 359: 318-320, 1992. Land MF, and McLeod P. From eye movements to actions: how batsmen hit the ball. Nat Neurosci 3: 1340-1345, 2000. Leigh RJ, and Zee DS. The Neurology of Eye Movements. New York: Oxford University Press, 1999, p. 643. Martinez-Trujillo JC, Wang H, and Crawford DJ. Electrical stimulation of the supplementary eye fields in the head-free macaque evokes kinematically normal gaze shifts. J Neurophysiol 89: 2961-2974, 2003. Matsuo S, Bergeron A, and Guitton D. Evidence for gaze feedback to the cat superior colliculus: discharges reflect gaze trajectory perturbations. J Neurosci 24: 2760-2773, 2004. May PJ, and Porter JD. The laminar distribution of macaque tectobulbar and tectospinal neurons. Vis Neurosci 8: 257-276, 1992. Milton JS, and Arnold JC. Introduction to probability and statistics: principles and applications for engineering and the computing sciences. New York: McGraw-Hill, Inc., 1995, p. 811. Moschner C, and Zangemeister WH. Preview control of gaze saccades: efficacy of prediction modulates eye-head interaction during human gaze saccades. Neurol Res 15:417-432, 1993. Munoz DP, Guitton D, and Pélisson D. Control of orienting gaze shifts by the tectoreticulospinal system in the head-free cat. III. Spatiotemporal characteristics of phasic motor discharges. J Neurophysiol 66: 1642-1666, 1991. Paré M, and Guitton D. Brain stem omnipause neurons and the control of combined eye-head gaze saccades in the alert cat. J Neurophysiol 79: 3060-3076, 1998.
Page 44 of 62
Pathmanathan J, Cromer J, Cullen K, and Waitzman D. Temporal characteristics of neurons in the central mesencephalic reticular formation of head unrestrained monkeys. Exp Brain Res 1, 2005a. Pathmanathan J, Presnell R, Cromer J, Cullen K, and Waitzman D. Spatial characteristics of neurons in the central mesencephalic reticular formation (cMRF) of head-unrestrained monkeys. Exp Brain Res 1, 2005b. Pélisson D, Goffart L, and Guillaume A. Control of saccadic eye movements and combined eye/head gaze shifts by the medio-posterior cerebellum. Prog Brain Res 142:69-89, 2003. Pélisson D, Goffart L, Guillaume A, Catz N, and Raboyeau G. Early head movements elicited by visual stimuli or collicular electrical stimulation in the cat. Vision Res 41:3283-3294, 2001. Pélisson D, Guitton D, and Goffart L. On-line compensation of gaze shifts perturbed by micro-stimulation of the superior colliculus in the cat with unrestrained head. Exp Brain Res 106: 196-204, 1995. Phillips JO, Ling L, Fuchs AF, Siebold C, and Plorde JJ. Rapid horizontal gaze movement in the monkey. J Neurophysiol 73: 1632-1652, 1995. Populin LC. Monkey sound localization: head-restrained versus head-unrestrained orienting. J Neurosci 26: 9820-9832, 2006. Quinet J, and Goffart L. Saccade dysmetria in head-unrestrained gaze shifts after muscimol inactivation of the caudal fastigial nucleus in the monkey. J Neurophysiol 93:2343-2349, 2005. Robinson DA. Oculomotor control signals. In: Basic Mechanisms of Ocular Motility and Their Clinical Implications, edited by Bach-y-Rita P, and Lennerstrand G. Oxford: Pergamon, 1975, p. 337-374. Scudder CA, Moschovakis AK, Karabelas AB, and Highstein SM. Anatomy and physiology of saccadic long-lead burst neurons recorded in the alert squirrel monkey. I. Descending projections from the mesencephalon. J Neurophysiol 76: 332-352, 1996a. Scudder CA, Moschovakis AK, Karabelas AB, and Highstein SM. Anatomy and physiology of saccadic long-lead burst neurons recorded in the alert squirrel monkey. II. Pontine neurons. J Neurophysiol 76: 353-370, 1996b. Sparks DL, Barton EJ, Gandhi NJ, and Nelson J. Studies of the role of the paramedian pontine reticular formation in the control of head-restrained and head-unrestrained gaze shifts. Ann NY Acad Sci 956: 85-98, 2002. Sparks DL, Freedman EG, Chen LL, and Gandhi NJ. Cortical and subcortical contributions to coordinated eye and head movements. Vision Res 41: 3295-3305, 2001. Sparks DL, and Gandhi NJ. Single cell signals: an oculomotor perspective. Prog Brain Res 142: 35-53, 2003. Stuphorn V, Bauswein E, and Hoffmann KP. Neurons in the primate superior colliculus coding for arm movements in gaze-related coordinates. J Neurophysiol 83:1283-1299, 2000. Sylvestre PA, and Cullen KE. Premotor correlates of integrated feedback control for eye-head gaze shifts. J Neurosci 26: 4922-4929, 2006. Tollin DJ, Populin LC, Moore JM, Ruhland JL, and Yin TC. Sound-localization performance in the cat: the effect of restraining the head. J Neurophysiol 93: 1223-1234, 2005.
Page 45 of 62

Tu TA, and Keating EG. Electrical stimulation of the frontal eye field in a monkey produces combined eye and head movements. J Neurophysiol 84: 1103-1106, 2000. Walton MM, and Gandhi NJ. The role of superior colliculus in the control of head movements: effects of reversible inactivation. Soc Neurosci Abstr Program No. 211.3: 2006. Walton MMG, and Mays LE. Discharge of saccade-related superior colliculus neurons during saccades accompanied by vergence. J Neurophysiol 90: 1124-1139, 2003. White JM, Sparks DL, and Stanford TR. Saccades to remembered target locations: an analysis of systematic and variable errors. Vision Res 34: 79-92, 1994. Zangemeister WH, Lehman S, and Stark L. Simulation of head movement trajectories: model and fit to main sequence. Biol Cybern 41: 19-32, 1981. Zangemeister WH, and Stark L. Gaze latency: variable interactions of head and eye latency. Exp Neurol 75: 389-406, 1982a. Zangemeister WH, and Stark L. Types of gaze movement: variable interactions of eye and head movements. Exp Neurol 77: 563-577, 1982b.
Page 46 of 62

Figure 1 - Temporal representation of effects of stimulation of the OPN region on head-unrestrained gaze shifts. Horizontal amplitude (left column) and velocity (right column) are plotted as a function of time for rightward gaze shifts directed to a target that was
briefly flashed at a 60° eccentricity in tangential coordinates. Several, individual control trials are shown in cyan and stimulation trials are shown in red. (A1-A3) Effect of
stimulation delivered prior to the onset of gaze shifts. The three panels plot the gaze, head, and eye-in-head components of coordinated eye-head movements. The trials are
aligned on target onset. For the 5 stimulation trials shown here, stimulation onset occurred 150 ms after target onset and lasted for 300 ms. (B1-B3) Effect of stimulation triggered on the onset of gaze shifts. The three panels plot the gaze, head and eye-in-head components, each aligned on gaze onset, as a function of time. Stimulation was
triggered as either gaze or head position left its computer controlled window around the fixation point. Stimulation duration for the illustrated red trials was 200 ms. The two
Page 47 of 62
datasets shown in panels (A, B) have the same target configuration and were collected from the same stimulation site in one animal. The arrows indicate the reacceleration of head movements that accompany gaze shifts after stimulation offset. Also note that the
gaze and eye velocity traces illustrated in this figure do not show the dual-peak modulation reported previously (Freedman and Sparks 2000). We speculate that this
effect is most robust during visually-guided movements. The movements illustrated here were performed in the memory-guided task, and the absence of visual information is
shown to reduce peak velocity, at least of head-restrained saccades (Edelman and Goldberg 2003). A preliminary examination of the appropriate data collected in the gap
task was comparable to the modulation in movement kinematics (data not shown).
Page 48 of 62

Figure 2 - The effect of stimulation of the OPN region on latency. (A) Gaze latency, (B) head latency, and (C) head-gaze onset times are compared for stimulation vs. control
conditions when stimulation was triggered before gaze onset. A negative value of head-gaze latency indicates that the head movement preceded gaze onset. Each point
represents a dataset (n=48). Statistically significant datasets (o), based on a rank-sum test (P<0.05) are differentiated from non-significant datasets (x). The diagonal dashed
lines indicate unity slope.
Page 49 of 62

Figure 3 - Analysis of the change in position observed when stimulation was delivered before gaze onset. (A) Schematics of gaze (top), head (middle) and eye-in-head (bottom)
for an averaged control gaze shift (thick, cyan traces) and two, individual stimulation trials (thin traces shown in blue and red) from the same dataset. The traces are aligned
on head onset (leftmost vertical dashed line). For each of the two illustrations of stimulation trials, the initial component is shown in blue, but is changed to red and also marked by a vertical line at the time of gaze onset (post stimulation offset). The change in gaze, head and eye-in-head positions traversed by the control and each stimulation
trial for its designated interval was determined. This method produced two distributions (control and stimulation conditions) of displacements each for gaze, head, and eye-in-head components. Note that the amplitude scale is intentionally omitted because the
traces are meant to represent schematics. (B) The paired displacement measures for the
Page 50 of 62

control and stimulation subsets were averaged for each dataset and compared for gaze (top), head (middle) and eye-in-head (bottom) components. Each point corresponds to
one dataset. Statistically significant datasets (o), based on a sign-rank test (P<0.05) are differentiated from non-significant datasets (x). The diagonal dashed lines indicate unity
slope.
Page 51 of 62
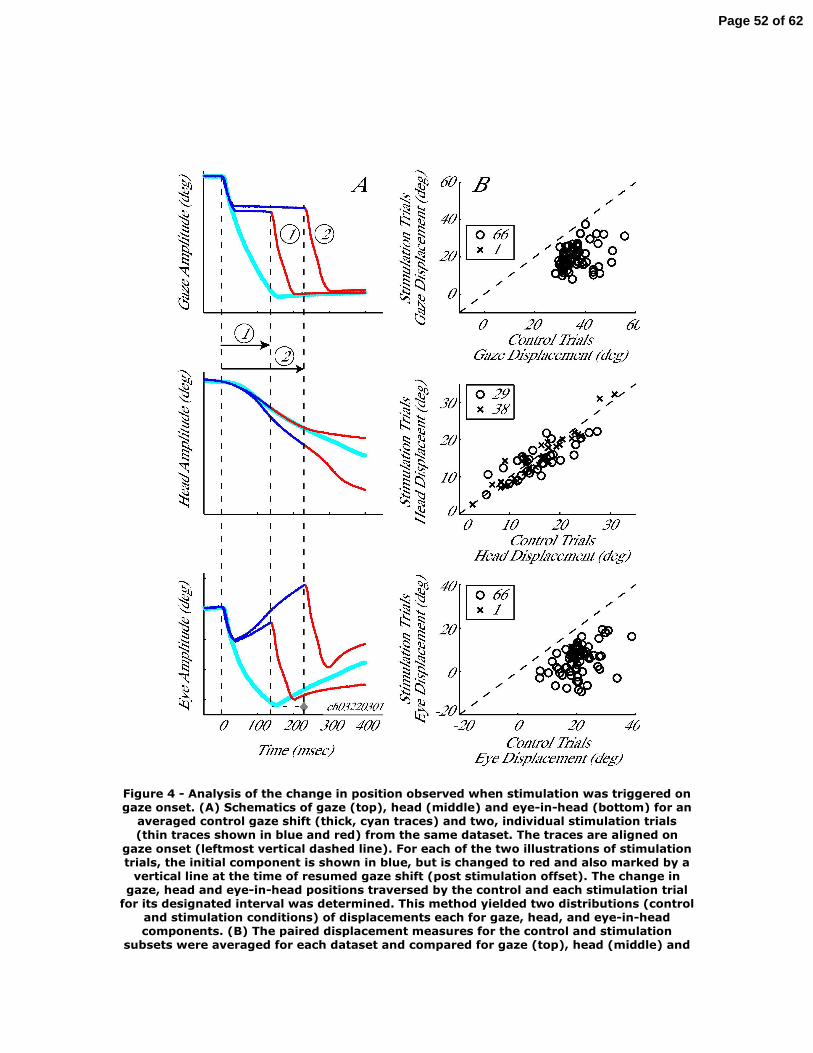
Figure 4 - Analysis of the change in position observed when stimulation was triggered on gaze onset. (A) Schematics of gaze (top), head (middle) and eye-in-head (bottom) for an
averaged control gaze shift (thick, cyan traces) and two, individual stimulation trials (thin traces shown in blue and red) from the same dataset. The traces are aligned on
gaze onset (leftmost vertical dashed line). For each of the two illustrations of stimulation trials, the initial component is shown in blue, but is changed to red and also marked by a
vertical line at the time of resumed gaze shift (post stimulation offset). The change in gaze, head and eye-in-head positions traversed by the control and each stimulation trial
for its designated interval was determined. This method yielded two distributions (control and stimulation conditions) of displacements each for gaze, head, and eye-in-head components. (B) The paired displacement measures for the control and stimulation
subsets were averaged for each dataset and compared for gaze (top), head (middle) and
Page 52 of 62

eye-in-head (bottom) components. Each point corresponds to one dataset. Statistically significant datasets (o), based on a sign-rank test (P<0.05) are differentiated from non-
significant datasets (x). The diagonal dashed lines indicate unity slope.
Page 53 of 62
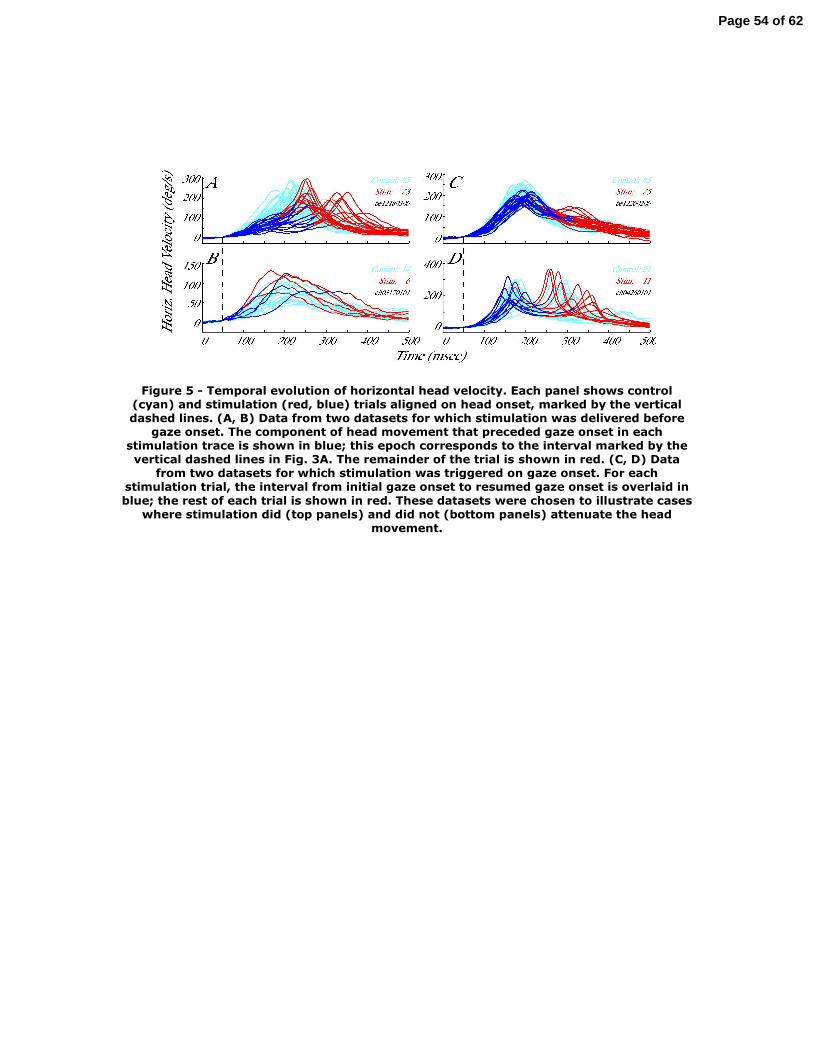
Figure 5 - Temporal evolution of horizontal head velocity. Each panel shows control (cyan) and stimulation (red, blue) trials aligned on head onset, marked by the vertical dashed lines. (A, B) Data from two datasets for which stimulation was delivered before
gaze onset. The component of head movement that preceded gaze onset in each stimulation trace is shown in blue; this epoch corresponds to the interval marked by the vertical dashed lines in Fig. 3A. The remainder of the trial is shown in red. (C, D) Data
from two datasets for which stimulation was triggered on gaze onset. For each stimulation trial, the interval from initial gaze onset to resumed gaze onset is overlaid in blue; the rest of each trial is shown in red. These datasets were chosen to illustrate cases
where stimulation did (top panels) and did not (bottom panels) attenuate the head movement.
Page 54 of 62

Figure 6 - Temporal evolution of horizontal head acceleration during control and stimulation conditions. The datasets and figure format are the same as in Figure 5.
Page 55 of 62
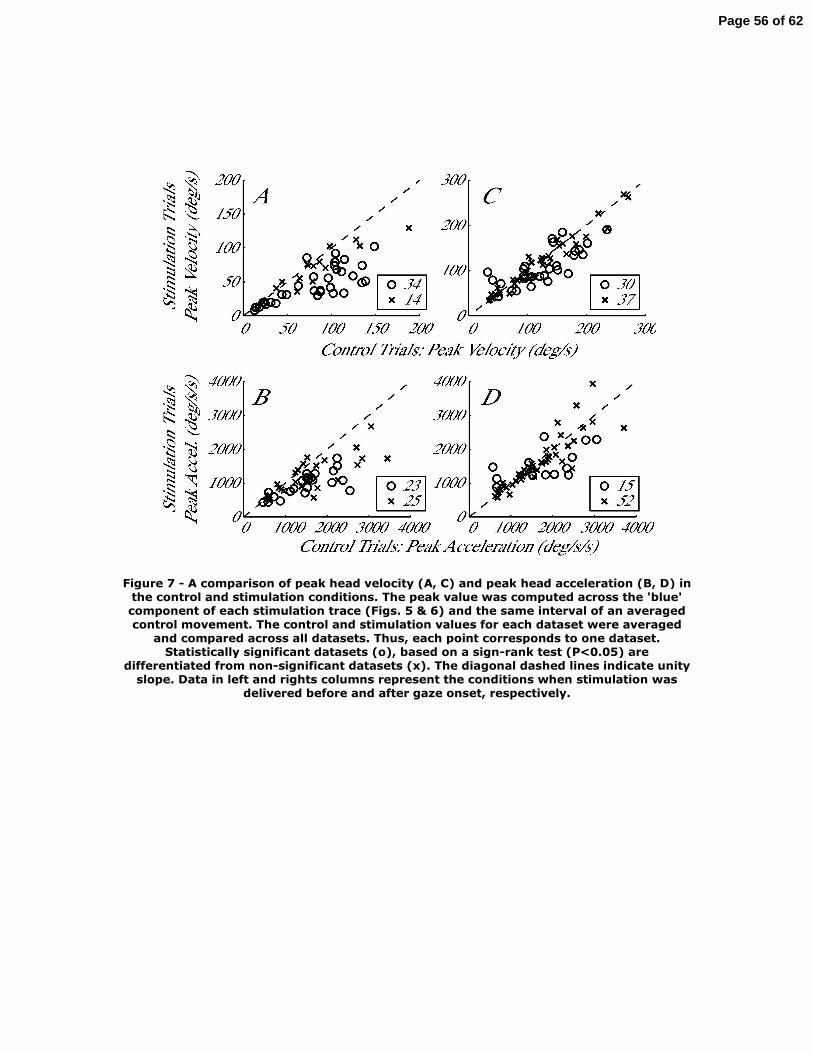
Figure 7 - A comparison of peak head velocity (A, C) and peak head acceleration (B, D) in the control and stimulation conditions. The peak value was computed across the 'blue' component of each stimulation trace (Figs. 5 & 6) and the same interval of an averaged control movement. The control and stimulation values for each dataset were averaged
and compared across all datasets. Thus, each point corresponds to one dataset. Statistically significant datasets (o), based on a sign-rank test (P<0.05) are
differentiated from non-significant datasets (x). The diagonal dashed lines indicate unity slope. Data in left and rights columns represent the conditions when stimulation was
delivered before and after gaze onset, respectively.
Page 56 of 62
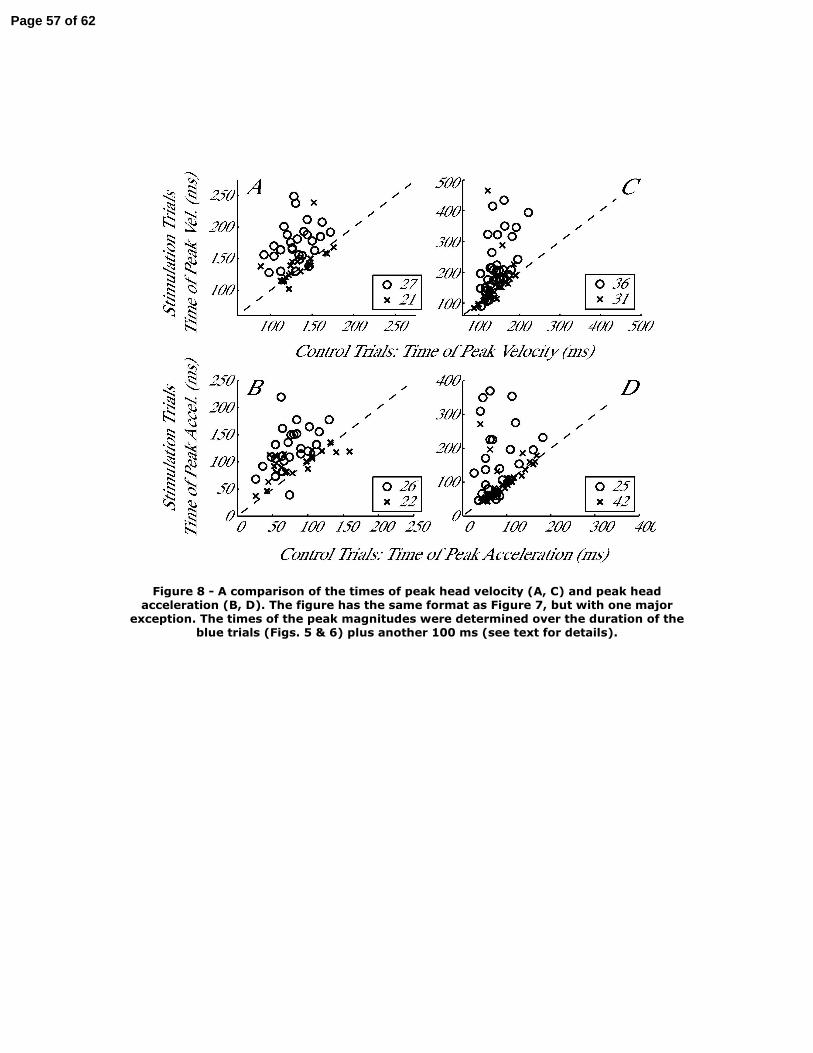
Figure 8 - A comparison of the times of peak head velocity (A, C) and peak head acceleration (B, D). The figure has the same format as Figure 7, but with one major
exception. The times of the peak magnitudes were determined over the duration of the blue trials (Figs. 5 & 6) plus another 100 ms (see text for details).
Page 57 of 62

Figure 9 - An indirect evaluation of the counter-rotation gain, which presumably reflects the VOR gain, was assessed by comparing the change in eye position as a function of the
head displacement traversed during the stimulation-induced interruption in gaze. (A) When stimulation was delivered before gaze onset, the changes in eye-in-head and head-in-space positions were measured over the interval from head onset to gaze onset (the
region marked by the vertical dashed lines in Fig. 3A). (B) When stimulation was triggered on gaze onset, the measurements were made across the interval starting at the end of the initial gaze shift and ending at the onset of the resumed gaze shift. Each point
represents the average changes in eye and head positions for each dataset.
Page 58 of 62
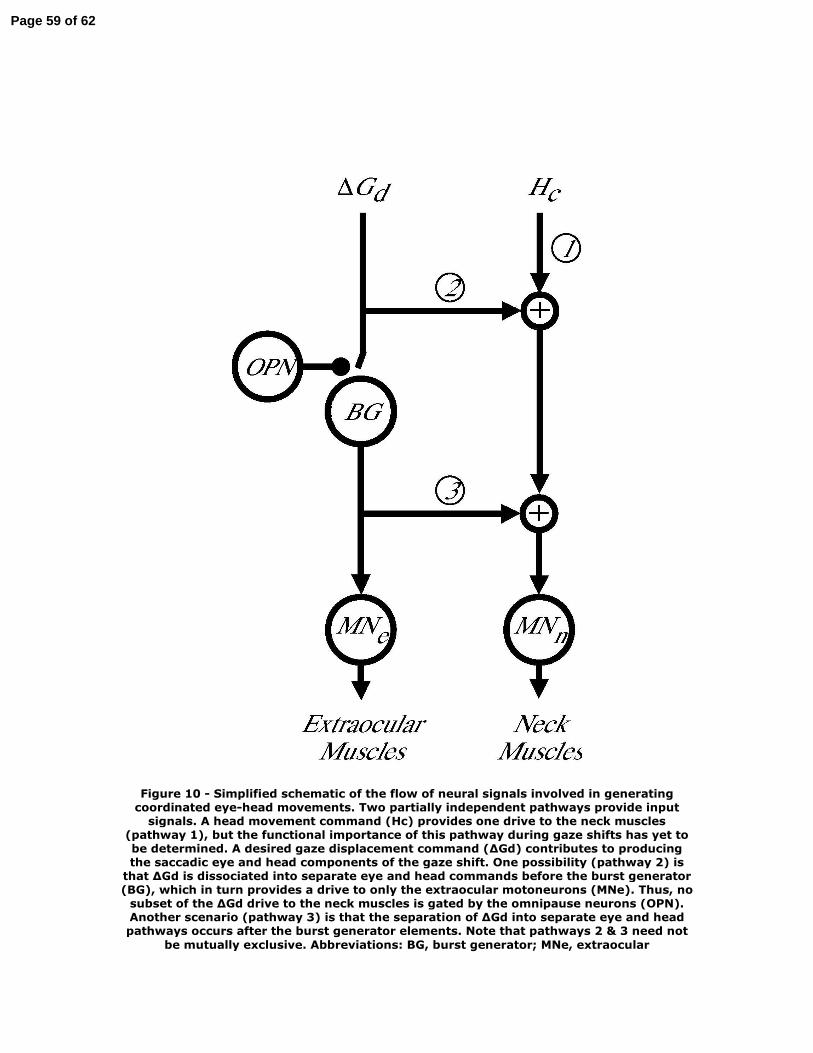
Figure 10 - Simplified schematic of the flow of neural signals involved in generating coordinated eye-head movements. Two partially independent pathways provide input
signals. A head movement command (Hc) provides one drive to the neck muscles (pathway 1), but the functional importance of this pathway during gaze shifts has yet to be determined. A desired gaze displacement command (∆Gd) contributes to producing the saccadic eye and head components of the gaze shift. One possibility (pathway 2) is
that ∆Gd is dissociated into separate eye and head commands before the burst generator (BG), which in turn provides a drive to only the extraocular motoneurons (MNe). Thus, no
subset of the ∆Gd drive to the neck muscles is gated by the omnipause neurons (OPN). Another scenario (pathway 3) is that the separation of ∆Gd into separate eye and head pathways occurs after the burst generator elements. Note that pathways 2 & 3 need not
be mutually exclusive. Abbreviations: BG, burst generator; MNe, extraocular
Page 59 of 62

motoneurons; MNn, neck motoneurons; OPN, omnipause neurons; ∆Gd, desired gaze displacement command; Hc, head movement command.
Page 60 of 62
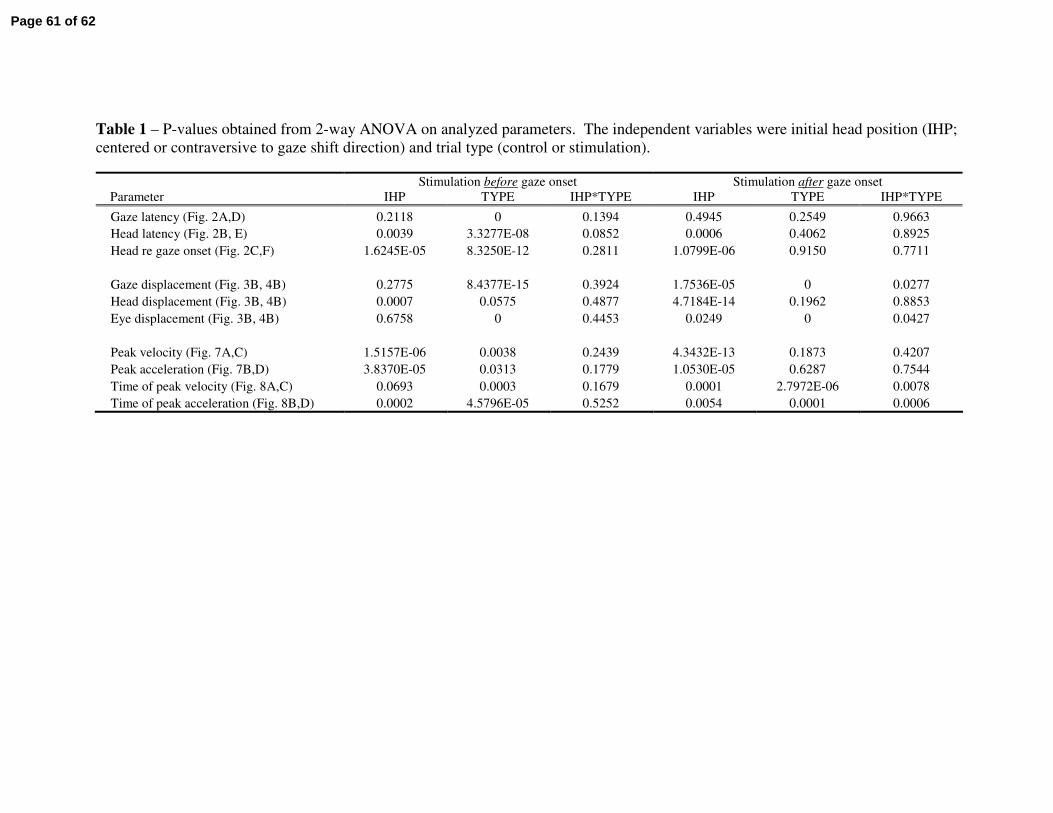
Table 1 – P-values obtained from 2-way ANOVA on analyzed parameters. The independent variables were initial head position (IHP; centered or contraversive to gaze shift direction) and trial type (control or stimulation).
Stimulation before gaze onset Stimulation after gaze onsetParameter IHP TYPE IHP*TYPE IHP TYPE IHP*TYPE
Gaze latency (Fig. 2A,D)Head latency (Fig. 2B, E)Head re gaze onset (Fig. 2C,F)
Gaze displacement (Fig. 3B, 4B)Head displacement (Fig. 3B, 4B)Eye displacement (Fig. 3B, 4B)
Peak velocity (Fig. 7A,C)Peak acceleration (Fig. 7B,D)Time of peak velocity (Fig. 8A,C)Time of peak acceleration (Fig. 8B,D)
0.21180.0039
1.6245E-05
0.27750.00070.6758
1.5157E-063.8370E-05
0.06930.0002
03.3277E-088.3250E-12
8.4377E-150.0575
0
0.00380.03130.0003
4.5796E-05
0.13940.08520.2811
0.39240.48770.4453
0.24390.17790.16790.5252
0.49450.0006
1.0799E-06
1.7536E-054.7184E-14
0.0249
4.3432E-131.0530E-05
0.00010.0054
0.25490.40620.9150
00.1962
0
0.18730.6287
2.7972E-060.0001
0.96630.89250.7711
0.02770.88530.0427
0.42070.75440.00780.0006
Page 61 of 62
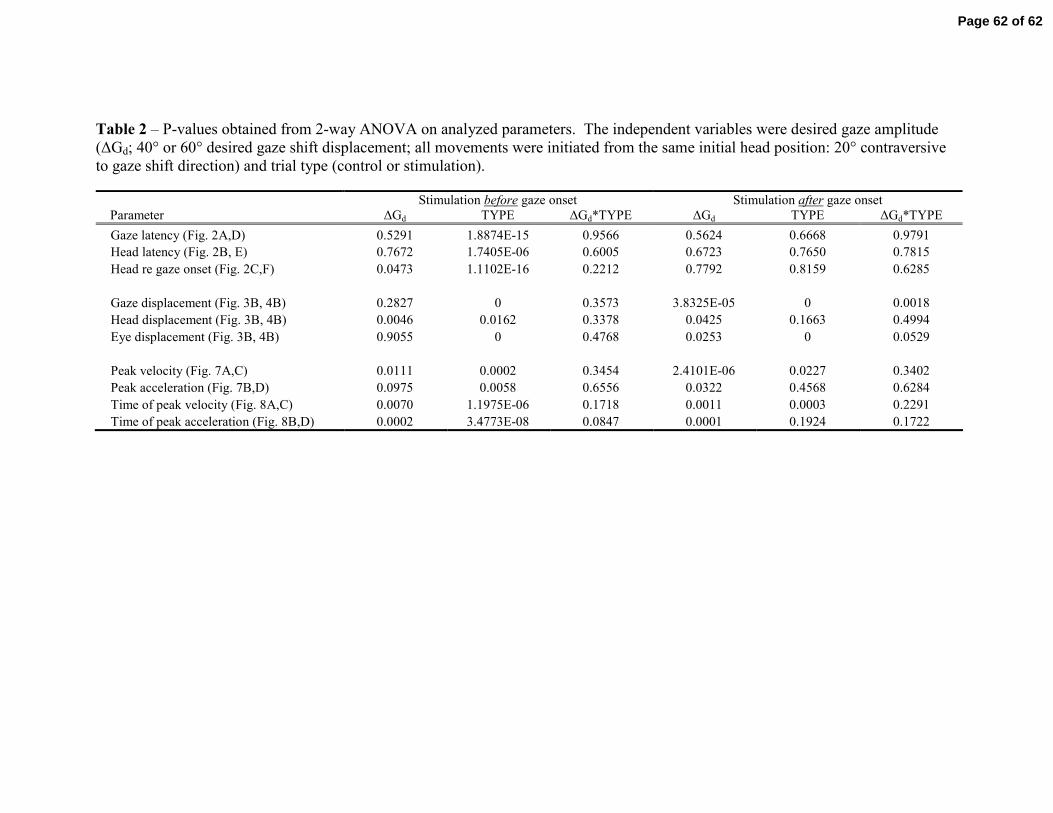
Table 2 – P-values obtained from 2-way ANOVA on analyzed parameters. The independent variables were desired gaze amplitude(∆Gd; 40° or 60° desired gaze shift displacement; all movements were initiated from the same initial head position: 20° contraversiveto gaze shift direction) and trial type (control or stimulation).
Stimulation before gaze onset Stimulation after gaze onsetParameter ∆Gd TYPE ∆Gd*TYPE ∆Gd TYPE ∆Gd*TYPEGaze latency (Fig. 2A,D)Head latency (Fig. 2B, E)Head re gaze onset (Fig. 2C,F)
Gaze displacement (Fig. 3B, 4B)Head displacement (Fig. 3B, 4B)Eye displacement (Fig. 3B, 4B)
Peak velocity (Fig. 7A,C)Peak acceleration (Fig. 7B,D)Time of peak velocity (Fig. 8A,C)Time of peak acceleration (Fig. 8B,D)
0.52910.76720.0473
0.28270.00460.9055
0.01110.09750.00700.0002
1.8874E-151.7405E-061.1102E-16
00.0162
0
0.00020.0058
1.1975E-063.4773E-08
0.95660.60050.2212
0.35730.33780.4768
0.34540.65560.17180.0847
0.56240.67230.7792
3.8325E-050.04250.0253
2.4101E-060.03220.00110.0001
0.66680.76500.8159
00.1663
0
0.02270.45680.00030.1924
0.97910.78150.6285
0.00180.49940.0529
0.34020.62840.22910.1722
Page 62 of 62


![Gaze+Gesture: Expressive, Precise and Targeted Free …chrisharrison.net/projects/gazegesture/GazePlusGesture.pdf · Gaze-Touch [28] combines gaze interaction with touch screen input,](https://img.pdfslide.us/doc/110x75/5b85389c7f8b9a4a488dd19a/gazegesture-expressive-precise-and-targeted-free-gaze-touch-28-combines.jpg)