Embed Size (px)
Citation preview

I
An Empirical Study on Employee Perceptions on
Lean Six Sigma Programmes in the Services
Organisations in Ireland
Nagaraja Ramapatna N
Masters in Business Administration 2015
School of Business
Submitted to the National College of Ireland
September 2015

II
ABSTRACT
Lean Six Sigma (LSS) is a business process improvement methodology that aims
to increase operational efficiency by improving quality, speed, customer
satisfaction and costs (Antony and Laureani, 2012). The main objective of this
research was to explore the employee perceptions on LSS initiatives in the
services organisations in Ireland. This research gathered information from
published literature on LSS to design a survey questionnaire with a scope to
investigate employee perceptions on LSS: performance; benefits; factors that
affect success and sustainability; and top 10 CSFs. The web based self-report
survey questionnaire was sent to 113 employees from two companies in the
services sector, who were or have been using LSS, and the response rate was
73%.
Descriptive and statistical testing was conducted in IBM SPSS to analyse the
survey data and to compare the employee perceptions between the two
companies. Results indicate significant differences between the two companies
in the areas of LSS performance and LSS success and sustainability factors.
Employees of company1 viewed LSS initiatives as generally successful and
sustainable whereas, employees of company2 viewed them as generally
unsuccessful and unsustainable. Views of both company employees on LSS
benefits were more or less aligned except realisation of cost reduction. A number
of key enabling factors for LSS success were found to be lacking in company2
which explained why LSS initiatives were deemed unsuccessful and not
sustained. Both company employees ranked: senior management commitment,
involvement & support; clear vision & long term strategy; organisation culture;
and LSS awareness & training as the top 4 CSFs.
The findings from this research are relevant to the sample population and cannot
be generalised to the entire company or the services sector. This study is the first
empirical study attempting to assess employee perceptions on LSS initiatives in
services organisations and contributes to the existing literature on LSS.
III
Submission of Thesis and Dissertation
National College of Ireland
Research Students Declaration Form
(Thesis/Author Declaration Form)
Name: Nagaraja Ramapatna N
Student Number: 13108905
Degree for which thesis is submitted: Masters in Business Administration
Material submitted for award
(a) I declare that the work has been composed by myself.
(b) I declare that all verbatim extracts contained in the thesis have been
distinguished by quotation marks and the sources of information specifically
acknowledged.
(c) My thesis will be included in electronic format in the College
Institutional Repository TRAP (thesis reports and projects)
(d) Either *I declare that no material contained in the thesis has been used in
any other submission for an academic award.
Or *I declare that the following material contained in the thesis formed part of
a submission for the award of
Masters in Business Administration, NCI/QQI
(State the award and the awarding body and list the material below)
Signature of research
student:
Date: 01st September 2015
IV
Acknowledgements
I wish to sincerely thank my supervisor Prof. Jimmy Hill for his co-operation,
guidance and support throughout the research.
A special acknowledgement and thanks to Mr. Jonathan Lambert for providing
excellent guidance and support with the IBM SPSS tool, survey setup and
analysis.
My sincere thanks to my wife Priya Krishnan, my son Rohit Nagaraja and
daughter Tanisha Nagaraja for their strong support throughout the MBA
programme.
I would like to thank employees from the two companies for completing the
survey questionnaires and participating in the study.
Finally, to my class who made the MBA as enjoyable as it was.

V
Table of contents
ABSTRACT ..................................................................................................... II
Declaration ...................................................................................................... III
Acknowledgements ......................................................................................... IV
Table of contents ............................................................................................... V
List of Figures .............................................................................................. VIII
List of Tables ................................................................................................... IX
List of Abbreviations ...................................................................................... XI
1. Introduction ............................................................................................... 1
1.1 Research aim .................................................................................................. 3
1.2 Significance of research ................................................................................. 3
1.3 Research questions ......................................................................................... 4
1.4 Thesis Structure / Chapter overview .............................................................. 5
2. Literature Review ..................................................................................... 6
2.1 Overview of Lean Six Sigma ......................................................................... 6
2.2 Lean Six Sigma in Services ........................................................................... 8
2.3 LSS Benefits .................................................................................................. 9
2.4 Factors affecting success and sustainability of LSS .................................... 10
2.4.1 Senior Management commitment ........................................................................ 10
2.4.2 Organisation culture ............................................................................................. 11
2.4.3 Long term plan and linking to business strategy .................................................. 11
2.4.4 Communication.................................................................................................... 12
2.4.5 Training ............................................................................................................... 12
2.4.6 Narrow view of LSS ............................................................................................ 12
2.4.7 Sustainability factors ........................................................................................... 13
2.5 Critical Success Factors (CSFs) for LSS Programmes ................................ 14
2.6 Conclusion ................................................................................................... 17
3. Research Questions ................................................................................. 19
3.1 Research Questions ...................................................................................... 20
4. Research Methodology ........................................................................... 21
4.1 Research philosophy .................................................................................... 21
4.2 Research approach ....................................................................................... 22
4.3 Sampling ...................................................................................................... 24
VI
4.4 Participants................................................................................................... 25
4.5 Research strategies ....................................................................................... 27
4.6 Strengths and weaknesses of questionnaires ................................................ 28
4.7 Pilot study .................................................................................................... 30
4.8 The Survey questionnaire ............................................................................ 31
4.8.1 Survey Questionnaire Development .................................................................... 31
4.8.2 General questionnaire .......................................................................................... 32
4.8.3 LSS Initiatives Summary ..................................................................................... 33
4.8.4 LSS Benefits ........................................................................................................ 33
4.8.5 LSS Success & sustainability factors ................................................................... 34
4.8.6 LSS Critical Success Factors (CSFs) Ranking .................................................... 35
4.9 Ethical considerations .................................................................................. 35
4.10 Distribution methods .................................................................................... 36
4.11 Error and bias ............................................................................................... 37
4.12 Method of quantitative data analysis ........................................................... 38
4.13 Limitations ................................................................................................... 39
4.14 Summary of methodology............................................................................ 39
5. Findings .................................................................................................... 40
5.1 Introduction .................................................................................................. 40
5.2 Descriptive Statistics .................................................................................... 40
5.3 Characteristics of the sample population ..................................................... 41
5.4 LSS Initiatives Summary – Employee perceptions...................................... 41
5.4.1 LSS Initiatives Summary Scale Reliability Results ............................................. 43
5.4.2 LSS Initiatives Employee Perceptions Differences ............................................. 44
5.4.3 LSS Initiatives Summary Differences by Items ................................................... 46
5.5 LSS Benefits – Employee Perceptions ........................................................ 49
5.5.1 LSS Benefits Employee Perceptions Scale Reliability Results ........................... 49
5.5.2 LSS Benefits Employee Perceptions Differences ................................................ 50
5.5.3 LSS Benefits Differences by Items ...................................................................... 52
5.6 LSS Success and Sustainability Factors ...................................................... 55
5.6.1 LSS Success and Sustainability Factors Scale Reliability Results ...................... 55
5.6.2 LSS Success and Sustainability Factors Differences ........................................... 56
5.6.3 LSS Success and Sustainability Factors Differences by Items ............................ 58
5.7 LSS Critical Success Factors (CSFs) ........................................................... 64
5.7.1 LSS Critical Success Factors (CSFs) Ranking .................................................... 64

VII
6. Discussion ................................................................................................. 68
6.1 Introduction .................................................................................................. 68
6.2 LSS initiatives summary .............................................................................. 68
6.3 LSS benefits ................................................................................................. 70
6.4 LSS factors affecting success and sustainability .......................................... 72
6.5 LSS top 10 critical success factors (CSFs) .................................................. 74
6.6 Practical Implications .................................................................................. 76
6.7 Limitations of the research........................................................................... 78
7. Conclusion ................................................................................................ 80
8. Recommendations for further research ................................................ 84
9. References ................................................................................................ 87
APPENDIX I – Survey Questionnaire.......................................................... 92
Employee Perceptions on Lean Six Sigma (LSS) Initiatives in Services
Organisations ......................................................................................................... 92
APPENDIX II – Data Analysis SPSS Results ............................................ 102

VIII
List of Figures
Figure 1: Participants by Gender/Company ................................................................ 27
Figure 2: Participants by LSS Involvement Type/Company ......................................... 27
Figure 3: Any other process improvement methodologies used in the organisation? 42
Figure 4: Is LSS the preferred process improvement methodology? .......................... 43
Figure 7: LSS Initiatives Summary – Mean Ranks comparison for Scale Items ............ 48
Figure 10: LSS Benefits– Mean Ranks comparison of Scale Items ............................... 54
Figure 13: LSS Success and Sustainability Factors – Mean Ranks plot of Scale Items . 61
Figure 5: LSS Initiatives Summary Normality Test Company1 ................................... 103
Figure 6: LSS Initiatives Summary Normality Test Company2 ................................... 103
Figure 8: LSS Benefits Normality Test Company1 ...................................................... 105
Figure 9: LSS Benefits Normality Test Company2 ...................................................... 105
Figure 11: LSS Success and Sustainability Factors Normality Test Company1 .......... 107
Figure 12: LSS Success and Sustainability Factors Normality Test Company2 .......... 107

IX
List of Tables
Table 1: Cronbach’s alpha for survey questionnaire scales ......................................... 41
Table 2: LSS Initiatives Summary Scale Case Summary ............................................... 44
Table 3: LSS Initiatives Scale Reliability ........................................................................ 44
Table 6: LSS Initiatives Summary Normality Results .................................................... 45
Table 7: Mann-Whitney Test Mean Ranks ................................................................... 46
Table 8: Mann-Whitney Test Statistics ........................................................................ 46
Table 10: Mann-Whitney Test Statistics for scale items .............................................. 46
Table 11: Summary of Mann-Whitney Test Results .................................................... 47
Table 12: LSS Benefits Scale Case Summary ................................................................ 50
Table 13: LSS Benefits Scale Reliability ........................................................................ 50
Table 16: LSS Benefits employee perceptions Normality Results ............................... 51
Table 17: Mann-Whitney Test Mean Ranks ................................................................. 52
Table 18: Mann-Whitney Test Statistics ...................................................................... 52
Table 20: LSS Benefits Scale Items Mann-Whitney Test Statistics .............................. 52
Table 21: Summary of Mann-Whitney Test Results .................................................... 53
Table 22: LSS Success and Sustain Factors Scale Case Summary ................................. 56
Table 23: LSS Success and Sustain Factors Scale Reliability ......................................... 56
Table 26: LSS Success and Sustainability Factors Normality Results ........................... 57
Table 27: Mann-Whitney Test Mean Ranks ................................................................. 57
Table 28: Mann-Whitney Test Statistics ...................................................................... 57
Table 31: Summary of Mann-Whitney Test Results .................................................... 59
Table 32: LSS Critical Success Factors (CSFs) – Company1 .......................................... 65
Table 33: LSS Critical Success Factors (CSFs) – Company2 .......................................... 65
X
Table 34: LSS Critical Success Factors (CSFs) – Combined Summary ........................... 66
Table 4: LSS Initiatives Summary Scale by Company Case Summary ........................ 102
Table 5: LSS Initiatives Summary Scale by Company Descriptive Statistics ............... 103
Table 9: Mann-Whitney Test Mean Ranks for LSS Initiatives Summary Scale Items . 104
Table 14: LSS Benefits Scale by Company Normality Test Case Summary ................ 104
Table 15: LSS Benefits Scale by Company Descriptive Statistics................................ 106
Table 19: Mann-Whitney Test Mean Ranks for LSS Benefits Scale Items ................. 106
Table 24: LSS Success and Sustainability Factors Scale by Company Case Summary 107
Table 25: LSS Success and Sustainability Factors Scale by Company Descriptive
Statistics ..................................................................................................................... 108
Table 29: Mann-Whitney Test Mean Ranks for LSS Success & Sustain Factors Scale
Items .......................................................................................................................... 109
Table 30: LSS Success and Sustain Factors Scale Items Mann-Whitney Test Statistics
................................................................................................................................... 110

XI
List of Abbreviations
Abbreviation Description
BB Black Belt
CI Continuous Improvement
CSF Critical Success Factors
HR Human Resources
LSS Lean Six Sigma
MBB Master Black Belt
TPS Toyota Production System
DMAIC Define, Measure, Analyse, Implement,
Control
JIT Just in time
TQM Total Quality Management
NCI National College of Ireland

1
1. Introduction
The purpose of this research is to investigate the employee perceptions on Lean
Six Sigma (LSS) initiatives in organisations in the services sector in Ireland.
Due to the ever changing market conditions and economic climate companies
globally are under continued pressure to reduce costs and become more efficient
(Radnor, 2012). So, companies are increasingly focussing more on their internal
operations and processes to achieve efficiencies. Lean Six Sigma (LSS) is a
methodology that can help organisations to improve their operational efficiency
and effectiveness (Snee, 2010; George, 2003), customer satisfaction and bottom
line results (Snee, 2010) by combining the strengths of lean thinking and Six
Sigma. In the last 10 to 15 years, LSS has increasingly been adopted by
businesses across a wide range of sectors for their business and process
improvement efforts.
Previous studies have looked at: the uptake and success factors of LSS in
financial services in certain countries like Great Britain, Germany, Switzerland
& Austria (Heckl et al, 2010); success factors of LSS implementations in
manufacturing and services in UK (Laureani et al., 2012), across different
industries in India (Desai et al., 2012), Malaysian automotive industry (Habidin
at al., 2013). Several exploratory studies have analysed LSS implementations at
specific firms in specific sectors and countries (Delgado et al., 2010; Psychogios
et al., 2012; Chakraborty et al., 2012). However, the author did not find evidence

2
of any published studies that have been conducted in the LSS area at a firm,
sector or across multiple sectors level in Ireland to date. Hence, there is scope
for such a study and this research aims to fill this through an empirical study on
employee perceptions on LSS programmes in the services organisations in
Ireland.
Majority of the studies including the ones outlined above which analysed the
critical success factors (CSFs) for the LSS implementations only took the
viewpoint of either the managers in the firms or LSS certified professionals or
employees. So, the findings on CSFs from these studies don’t collectively
represent the viewpoint of all groups involved in LSS implementations. This
research aims to investigate the employee perceptions on the performance,
benefits, success and sustainability factors and CSFs of LSS initiatives from the
perspectives of all groups involved in LSS programmes (employees, managers
and LSS experts) in the organisations.
While there are some conceptual studies offering general guidance on why
change efforts fail or LSS efforts and achieved improvements are not sustained
(Snee, 2010; Buchanan et al., 2005; Fine et al., 2009); and some studies using
qualitative and case study methods to look at the challenges, benefits and
experiences from the LSS implementations at individual firms; most empirical
studies only focus on identifying what specific or different groups believe as the
most important CSFs. So, the literature on LSS lacks empirical studies looking
at the perceptions or experiences of employees or various groups on LSS
programmes in their organisations. This research attempts to address this gap by

3
conducting an empirical study on the employee perceptions on the performance,
benefits, success and sustainability factors and CSFs of LSS initiatives in
services organisations in Ireland to get a more rounded view on all aspects of
LSS implementations in organisations from employees’ perspective.
This area of research is being undertaken by the researcher as he has a particular
interest in LSS and the Business Process Improvement areas. He is employed by
a multinational organisation that uses LSS methodology across its multiple
business units.
1.1 Research aim
The aim of this research is to carry out an exploratory study on the employee
perceptions on LSS initiatives in organisations in the services sector in Ireland.
The study attempts to empirically understand the views of the employees with
respect to the: performance; benefits; factors that affect success and
sustainability; and critical success factors of LSS initiatives specific to their
organisation; and also validate these against the published literature. The study
aims to gather views of all groups that are involved with LSS initiatives in
organisation to obtain the collective views of employees on LSS initiatives in
their organisations.
1.2 Significance of research
This study is the first to attempt to empirically investigate the perceptions of
various groups collectively who are involved with the LSS initiatives in

4
organisations on various aspects of the LSS initiatives specific to their
organisation. The study will help understand how employees view the LSS
initiatives and also help identify the main issue areas acting as barriers to the
success and sustainability of LSS initiatives in their organisations. So, the
findings from the study could act as a reality check for the senior management
in terms of understanding how LSS initiatives are viewed, what areas are
performing well and what areas need further improvement in order for the
initiatives to be successful and sustainable in the organisation. The study and
findings will add to the existing literature and will be of interest to senior
management of the companies involved in the study and also other firms in
Ireland or elsewhere who are using LSS or looking to implement LSS
programmes.
1.3 Research questions
Below four research questions were drafted in order to answer the overall
research question and to identify how well the perceptions of employees on LSS
initiatives reflect the reality and relate to the literature.
Q1: “How does the perceptions of employees on the performance of LSS
initiatives in their organisations compare between company1 and company2?”
Q2: “How does the perceptions of employees on the benefits of LSS initiatives
in their organisations compare between company1 and company2?”
Q3: “How does the perceptions of employees on the factors affecting the success
and sustainability of LSS initiatives in their organisations compare between
company1 and company2?”

5
Q4: “How does the ranking of Top 10 Critical Success Factors (CSFs) that affect
the success of LSS initiatives compare between company1 and company2?
1.4 Thesis Structure / Chapter overview
The paper first discusses the research available on the topic of LSS pertaining to
the research topic within the literature review in chapter 2. From there the main
research questions for this research will be outlined in chapter 3, followed by the
methodology used to address the objectives of the research and research
questions in chapter 4. Analysis results from the research conducted specific to
the research questions outlined will be discussed in chapter 5. The following
chapter 6 will then discuss the key findings related to the research questions and
the main areas of learnings from the research. The paper will then finish with
conclusions in chapter 7 followed by outlining recommendations for future
research in chapter 8.
The following section provides a review of the literature on LSS, its
implementations in various sectors, benefits, success factors, sustainability,
CSFs and a conclusion on the literature review.

6
2. Literature Review
The literature review gives an insight into the work and findings already
available within the research area (Saunders et al., 2012). The focus and aim of
the literature review is to understand the research that has been conducted in the
area of Lean Six Sigma (LSS), what the main trends within the literature are and
to identify gaps where further research is needed.
While research interest in the LSS area has grown in the last decade or so, the
literature is light in terms of variety and depth. The literature features material;
proposing conceptual frameworks for LSS implementations, study of LSS
implementations at specific firms, critical success factors and challenges faced
during LSS implementations, uptake of LSS in different sectors in different
countries and others. However, the literature is very light on understanding how
firms sustain or can sustain the LSS programmes over a longer period and the
future direction of LSS programmes in the services sector.
The following section presents an overview of Lean, Six Sigma (SS) and LSS
methodologies, LSS in services, critical factors for the success of LSS
implementations, challenges faced during LSS implementations and finally
sustainability of LSS programmes.
2.1 Overview of Lean Six Sigma
Lean Six Sigma (LSS) is a business improvement methodology that aims to
maximize operational efficiency and effectiveness in by improving speed,

7
quality, customer satisfaction, and reducing costs. LSS achieves this by merging
principles and tools from both Lean and Six Sigma. LSS which was originally
devised to reduce waste and improve manufacturing quality is increasingly being
adopted by services and other industries due its success in companies like GE,
Motorola, Xerox, J&J (Guarraia et al., 2008).
The terms Lean and Six Sigma were first defined and hard coded during 1980s
and have followed independent paths since. Lean is a process improvement
methodology used to reduce waste and deliver products and services faster,
better and at a lower cost. The first applications of lean were recorded in the
manufacturing plants of Ford during 1913. Womack and Jones (1996) defined
lean as:
"a way to specify value, line up value-creating actions in the best
sequence, conduct those activities without interruption whenever
someone requests them, and perform them more and more effectively. In
short, lean thinking is lean because it provides a way to do more and
more with less and less – less human effort, less human equipment, less
time, and less space – while coming closer and closer to providing
customers with exactly what they want."
Six Sigma (SS) is a data driven process improvement methodology used to
reduce defects and process variation to achieve stable and predictable process
results. Snee (1999) defined SS as:
8
"a business strategy that seeks to identify and eliminate causes of errors
or defects or failures in business processes by focusing on outputs that
are critical to customers."
Though both Lean and Six Sigma were being used for many years, they were not
integrated to become LSS or Lean Sigma until the late 1990s and early 2000s
(George, 2003). However Naslund (2008) argues that, lean and six sigma are not
new methods but are just repackaged versions of previously popular methods;
just-in-time (JIT) and total quality management (TQM). Lean Six Sigma uses
principles and tools from both to get the best from both methodologies,
increasing speed while also increasing accuracy. Today LSS is recognized as: “a
business strategy and methodology that increases process performance resulting
in enhanced customer satisfaction and improved bottom line results” (Snee,
2010).
2.2 Lean Six Sigma in Services
According to Vargo and Lusch (2004), a framework aimed at improving the
efficiency of service organizations must consider the five key characteristics of
services: intangibility; inseparability; variability; perishability and lack of
ownership. It is incorrect to assume that a model developed for the
manufacturing sector can be applied and works in services and unlike in
manufacturing, one of the main issues that arise in services is when trying to
apply lean principles to intangible products (Arfmann et al., 2014). There is lack
9
of evidence about the positive effects of lean transformation on service
organizations (Burgess, 2013).
Unlike manufacturing, services are different by nature and very often bound by
time in terms of the processes that lead to an outcome that benefits a customer.
In services organizations, lean comes in as a methodology to reduce waste in
terms of time (cycle time, waiting times), resources to allow the process to
become more efficient. It requires the examination of the process from the
customers' perspective, in order to eliminate the waste and inefficiency. Six
Sigma, however, focuses on refining the process to reduce variability, errors
(defects) and improve reliability.
A framework for the integration of lean and Six Sigma, consisting of a project
organization structure based on Six Sigma black belts (BB), green belts (GB),
and champions, extensive training programs and a define, measure, analyse,
improve and control (DMAIC) approach, with lean analysis tools and
improvement models embedded and concepts/classifications of both lean and
Six Sigma combined was proposed by De Koning et al. (2008). This integrated
LSS structure has been widely adapted both in manufacturing and services
industries.
2.3 LSS Benefits
As LSS combines the power of both lean and six-sigma, it can provide more
benefits than using a stand-alone methodology. While different authors have
provided different definitions for LSS outlining different benefits, there is wider

10
acceptance that LSS is a business process improvement methodology capable of
providing a range of benefits outlined below.
Improve operational efficiency and effectiveness (De Koning et al.,
2008).
Increase process efficiency by reducing waste and increase quality by
defect reduction (Salah, Rahim and Carretero, 2010).
Increases process performance resulting in increased customer
satisfaction and improved bottom line results (Snee, 2010).
Improves process efficiency and organisation to be more customer
centric (De Koning et al., 2008).
2.4 Factors affecting success and sustainability of LSS
Lean Six Sigma maybe a statistical and managerial implementation to assess and
improve the process; however, the success or failure of such implementation
depends on the availability and presence of several factors.
2.4.1 Senior Management commitment
Strong Management commitment, involvement and participation is the most
important ingredient to the success of LSS (Antony and Banuelas, 2002).
Emiliani (1998) suggested that managers might not show the same level of
commitment as they demand from workers. It is imperative to have good support
from top management to achieve the cultural change required and motivate the
employees towards LSS strategy to the business. On the other hand, lack of top
11
management commitment and involvement is the key contributor to failures
(Womack and Jones, 2010). The importance of senior management commitment
and participation to the success of LSS has been outlined in many studies (eg.
Laureani et al., 2012; Henderson et al., 2000). Furthermore, Pande et al (2000)
argued that, without the continuous commitment and support from senior
management, the true importance of any change initiative will be in doubt and it
will gradually fade away.
2.4.2 Organisation culture
LSS sees every problem, defect or error as an improvement opportunity
(Coronado & Antony, 2002). The success of LSS requires a change in the
mindset of employees and adjustment of organisation culture to support the
change. Culture change is an important pre-requisite for Lean Six Sigma
introduction and its success. The company culture must be receptive to change
and accept change as a positive. Chakrabarty and Tan (2007) suggested that the
company must accept that LSS is a change agent and the company values and
culture must adjust accordingly and embrace the change for the change efforts
to succeed.
2.4.3 Long term plan and linking to business strategy
Organisations and senior management should consider LSS as a long-term
investment. Pande et al (2000) claims that, some quality initiatives also fade out
because of company leaders loosing focus. To overcome this, leaders and top
12
management should ensure that the LSS initiative is and remains a momentum
for process improvement and must be sustained over the long term.
2.4.4 Communication
According to Antony et al (2002), initiatives like LSS require the people within
the organisation at all levels to have the right attitude and mindset. Employees
within the organisation must be made aware of the need for change. They
continue to claim that, organisations that have been successful at managing
change have recognised that increased and sustained communication, education
and motivation the best way to tackle resistance to change. To overcome the fear
of change, it is critical to establish a clear communication plan and channels to
educate employees as to the need for LSS and how it will benefit the organisation
and motivate employees to overcome resistance (Antony et al., 2002).
2.4.5 Training
Training plays a crucial role in the success of LSS. According to Antony et al
(2002), it is important to communicate the ‘why’ and ‘how’ of LSS and train
employees on LSS methodology and tools. However, they suggest that the
training should be structured in such way that it is relevant to employees’
everyday jobs. Psychogios et al (2012) argued that, LSS training requires a
significant investment and could potentially become a barrier for sustaining LSS
efforts.
2.4.6 Narrow view of LSS
13
Many people and organisations view LSS is a mere set of tools and techniques
to solve problems. This very narrow view of LSS could be the single biggest
contributing factor for LSS failures in organisations (Flinchbaugh and Carlino,
2006).
2.4.7 Sustainability factors
Many institutions have had success using LSS programs to deliver short-term
improvements, but sustaining the change over a longer term is often more
difficult. According to a survey by Industry Week only two percent of companies
with lean programs reached their anticipated targets while 74 percent were not
making good progress (Pay, 2008). Naslund (2008) suggests that companies
abandon the change efforts if the method does not seem to provide clear evidence
of expected results in terms of performance. Taking a holistic improvement
approach and moving from a sole focus of improving project by project to a
continuous improvement (CI) culture will take organisations a long way in
sustaining the improvement efforts and culture over a long term (Snee, 2010).
Alken et al., (2011) suggest that employing a well-informed approach to engage
employees in the process of change can become an enabler for long term success
and sustainable competitive advantage. Snee (2010) claims that many
organisations only start to focus on sustaining the improvements only after
improvements have been achieved and suggest that organizations must focus on
sustainability at a strategic level before starting the implementation. While many
authors offer guidance on how organisations can sustain change or improvement
efforts, there is a lack of evidence based studies exploring if and how

14
organisations are actually sustaining the improvements or understand why, if
they are not.
2.5 Critical Success Factors (CSFs) for LSS Programmes
The concept of identifying CSFs as a basis for determining the information needs
of managers was illustrated by Rockart (1979). According to Rungasamy et al.
(2002), critical success factors are those factors essential to the success of any
technique or program, in the sense that, if objectives associated with the factors
are not achieved, the application of the program will perhaps fail
catastrophically.
The key factors for the effective implementation of Six Sigma programs in UK
companies was analysed by Antony and Banuelas (2002), which were further
refined in a study by Coronado and Antony (2002) as: management commitment
and involvement; linking Six Sigma to business strategy; understanding of SS
methodology, tools, and techniques; project selection, reviews and tracking;
cultural change; organizational infrastructure; linking Six Sigma to customers;
project management skills; training. Pande et al. (2000) added leadership
commitment as one of the important CSFs, while the importance of
organizational culture and infrastructure was highlighted by Zu et al. (2010).
Kwak et al., (2006) summarised the CSFs in four main areas: management
involvement and organizational commitment; continuous education and
training; encouraging and accepting cultural change; project selection,
management control & skills. Whereas Achanga et al. (2006) identified

15
leadership and management, organizational culture, finance, skills and expertise
as CSFs for SS implementations, the importance of linking LSS to the overall
business strategy was highlighted by Dale (2000). While Ingle and Roe (2001)
identified the prioritization of projects as a CSF, the need for tracking and review
of improvement projects was highlighted from Martens (2001). Other CSFs such
as: understanding of the tools, identifying selection of team members, linking
Six Sigma to customers and accountability were added to the literature by
Antony (2006). Henderson and Evans (2000) added linking Six Sigma to human
resources based actions like rewards, promotions etc., to the list of CSFs. The
CSFs identified above and published in many papers are for Lean Six Sigma and
LSS implementations though there is a dearth of literature on CSFs for LSS
implementations (Laureani et al, 2012).
The study conducted by Laureani et al., (2012) with manufacturing and service
companies in UK identified management commitment, cultural change, linking
Lean Six Sigma to business strategy and leadership styles as the most important
and linking Six Sigma to HR rewards and extending Lean Six Sigma to supply
chain as the least important CSFs for LSS implementations. They suggest that
identification of leadership styles as one of the most important CSFs and its
relatively smaller coverage in LSS literature could be a potential area for further
research.
Psychogios et al., (2012) used a multi-factor application approach to conduct an
exploratory study of LSS implementation in two telecommunications firms and
conclude that: top management involvement & support; quality-driven
16
organizational culture; top down & bottom up project selection; quality-driven
training; customer satisfaction, prior implementation of other quality
improvement programs and supportive performance management & IT systems
as the most important CSFs and lack of awareness of LSS, lack of strategic
orientation as inhibiting factors. They suggest that further research is required to
confirm on the multi-factor application approach used in their study and future
research could explore the perspectives of front line employees as well and not
just the managers. This research aims to address this by taking perspectives of
employees, managers and LSS experts.
Manville (2012) studied the CSFs of SS implementation in a single firm from
the middle management perspective and concluded that: senior management
commitment, support and enthusiasm; linking LSS to business strategy; and
linking LSS to customer were deemed most important. They also suggest that
future of LSS within the firm studied depend on the extent to which middle
managers are given responsibility for solution creation and strategy formulation
by senior management and propose future research could explore the impact of
organisational culture and structure on strategy development.
A survey of 3264 employees from different hierarchical levels across financial
services companies in Germany conducted by Leyer and Moormann (2014) to
study “how lean are financial services companies in Germany” found that, there
is only a moderate lean thinking in financial services companies. They observed
a “lean fata morgana” whereby employees in general think they are leaner than
their actual behaviour discloses. They also noted scope for future research on

17
differences of perceptions between managers and team members or employees
and conducting similar studies in different service sectors.
There have been similar studies to analyse the CSFs and LSS implementations
in different sectors and countries: financial services in Great Britain, Germany,
Switzerland & Austria (Heckl et al, 2010); manufacturing and services in UK
(Laureani et al., 2012); different industries in India (Desai et al., 2012);
automotive industry in Malaysia (Habidin at al., 2013); financial services in
Portugal (Delgado et al., 2010); services sector in Singapore (Chakraborty et al.,
2012); telecommunications sector (Psychogios et al., 2012). However, no studies
have been conducted in any sector in Ireland to explore and understand the LSS
implementations. This research aims to fill this gap by studying the LSS
implementation at two firms in the services sector in Ireland.
So, the literature offers fairly similar and general CSFs for lean, six sigma and
LSS methods and implementations (Naslund, 2008). Undoubtedly certain factors
from the CSFs identified from the literature above will contribute more to an
effective and successful LSS implementation. This research will seek to test the
validity of these assertions by determining which of the identified CSFs are
considered to be of greatest importance by employees, management and LSS
experts within the two companies identified for the study.
2.6 Conclusion
In summary it is evident from the literature that there are various factors that
affect the success and sustainability of LSS programmes. Generalisation of

18
which CSFs will have more impact on the success of LSS implementations
across different sectors is not made because of the scope and limitations of the
studies carried out so far. Based on the previous studies, some factors like senior
management commitment, involvement and support; organisation culture;
effective communication; and awareness & training were found to play a more
important role in the success of LSS. The literature also suggests that
organisations should consider LSS as a long term strategy rather than embarking
on LSS efforts to achieve short term goals. The literature also emphasises the
need for organisations to integrate their LSS efforts in the continuous
improvement culture in order to sustain the LSS efforts and improvements. No
studies have analysed CSFs from the perspectives of all key stakeholders
(Management, LSS experts and employees) involved with LSS programs. Most
of the empirical studies have only looked at assessing the CSFs to establish
which CSFs are considered most important. The author did not find evidence of
any studies carried out in the LSS area in Ireland. So, there is scope for such a
study and this research attempts to address this through an exploratory study of
LSS implementation at two firms in services sector in Ireland. The following
section discusses the research objective and the main research questions.
19
3. Research Questions
The overall objective of this research is to investigate the perceptions of
employees from the two organisations in the services sector in Ireland on the
performance, benefits, success and sustainability factors and CSFs of LSS
initiatives in their organisations. The study attempts to achieve this through an
empirical study to fill the gap identified in the literature review.

20
The study focusses on two multinational companies in the services in Ireland
that have been or were using the LSS initiatives. Off the two, company1 has been
using LSS for around 10 years, whereas company2 was using LSS initiatives for
around 4 years. This research attempts to investigate the employee perceptions
from these two companies on various aspects of LSS initiatives in their
organisation to understand if the perceptions differ between the two, if so in what
areas and why? To help achieve this objective, this paper focuses on the
following research questions.
3.1 Research Questions
Research Question 1
Q1: “How does the perceptions of employees on the performance of LSS
initiatives in their organisations compare between company1 and company2?”
Research Question 2
Q2: “How does the perceptions of employees on the benefits of LSS initiatives
in their organisations compare between company1 and company2?”
Research Question 3
Q3: “How does the perceptions of employees on the factors affecting the success
and sustainability of LSS initiatives in their organisations compare between
company1 and company2?”
Research Question 4
Q4: “How does the ranking of Top 10 Critical Success Factors (CSFs) that affect
the success of LSS initiatives compare between company1 and company2?

21
4. Research Methodology
4.1 Research philosophy
According to Blumberg, Cooper & Schindler (2008), a research philosophy is a
belief about how research should be conducted and how research reasoning
(theory) and observations (data or information) are related to each other.
Positivism and interpretivism are the two most distinguished research
philosophies; and ontology (concerned with nature of reality) and epistemology
22
(concerned with acceptable knowledge) are the two main ways of thinking about
research philosophy (Blumberg et al., 2008).
Being objective and external to resources is the only one reality according to the
ontological perspective positivists. But on the contrary, since every individual
has their own sense of reality, interpretivists claim that reality is socially
constructed and is subjective (Collis & Hussey, 2009).
Positivists claim from a epistemological perspective that only phenomena that
can be observed and measured can be considered as knowledge, and a researcher
remains distant and objective. (Blumberg et al., 2008; Collis et al., 2009).
4.2 Research approach
In this section, the approach used to conduct the research is discussed (Quinlan,
2011). Details are provided on the approach that was taken in the research to
gather valuable data from employees, managers and LSS experts on LSS
initiatives in their organisations. After reviewing the literature on LSS, the
researcher found that the positivism paradigm using a quantitative method seemed
to be the most appropriate approach for collecting data to meet the objectives of the
research. This approach is consistent with previous empirical research conducted by
majority of researchers (e.g. Antony and Laureani, 2012; Sharma and Chetiya, 2012;
Habidin and Yusof, 2013; Antony, Antony and Kumar, 2007; Heckl, Moormann
and Rosemann, 2010) in the area of LSS. Based on these findings and together with
author’s own preference towards the positivism approach, quantitative methods
were used for this research and data collection.

23
Quantitative research aims to gather data into numerical values to undertake
statistical analysis of the problem, whereas qualitative research aims to gather data
in more abstract and in a non-numerical form. Positivists believe in the notion of
absolute truth and that knowledge is derived from experiences and facts obtained
through observation and objective systems of measurement (Chalmers, 2013).
According to Benz and Newman (2008), quantitative approach is usually used when
one begins with a theory or hypotheses and test for confirmation or disconfirmation
of that theory or hypotheses. However, qualitative approach can be used when
observing or interpreting reality with the aim of developing an explanation or theory
of what was experienced. According to QRAC (Qualitative Research Consultants
Association, 2014) the process of qualitative research is exploratory by
definition, and can be used when the answers are not exactly known. In addition,
it allows the researcher to investigate particular areas of interest as the data
collection occurs, and some semi-structured freedom to change direction over
the course of an interview; to ask further questions that would not normally be
possible through a survey. So, both qualitative and quantitative research methods
clearly differ how data is collected, analysed and interpreted.
Quantitative research is associated with positivism using structured data
collection methods, and deductive research approaches focusing on using data
to test theory (Saunders et al., 2012). The objective of the literature review was
to identify theory, which was then treated by the researcher as a set of variables
that could be measured and observed (Collis et al., 2009). Data related to the
variables were collected by the author in order to provide empirical evidence.

24
Theoretical framework acted as a base for formulating the research questions
which were assessed against the collected empirical evidence (Fisher, 2007).
4.3 Sampling
The main objective of sampling is to choose a subset of individuals from a
population in order to estimate the characteristics of the whole population
(Fisher, 2007). Saunders et al (2012) suggest that, using sampling generates
findings that are representative of the whole population when choosing a
quantitative research method such as questionnaires. In non-probability
sampling techniques, a sample size will depend on the study objectives and
research questions as the generalisation is made about the theory and not about
the population (Saunders et al., 2012). Different types of non-probability
sampling techniques such as: snowball sampling; quota sampling; and purposive
or convenience sampling can be used (Fisher, 2007).
For this research a convenient sampling method was used meaning, individuals
who were easiest to include were selected to participate in the research (Saunders
et al., 2012). In this case, two multinational companies in the services sector in
Ireland that are or were using LSS initiatives and known to the researcher were
selected and employees form these two companies who have participated or
involved in the LSS initiatives were selected and invited to participate in the
study. While Bryman and Bell (2007) argue that, though convenience sampling
is the cheapest and easiest to conduct and can provide interesting data, it is the
least reliable design due to limitations in generalisability and lack of ability to

25
ensure precision; it can still be a useful technique as it is used to test ideas about
a subject of interest (Blumberg et al., 2008). It is important to note that findings
from this study are relevant to the sample population, and may not be relevant to
the total population of employees in the two organisations selected for the study
or employees of other organisations in the services sector either in Ireland or
elsewhere.
4.4 Participants
Employees from two multinational companies in the services sector in Ireland
who have participated or involved in the LSS initiatives in their organisation
were selected as the participants for the study. The researcher used his contacts
at both firms to send the survey questionnaire to only those who meet these
criteria. Those partaking included employees who have: participated in LSS
training only; participated in LSS projects; lead/managed LSS projects; coached
and trained employees in LSS (LSS experts who are BB/MBB); and LSS
champion/project sponsors. The rationale behind this selection was to obtain a
collective view from all different groups who are normally involved with LSS
initiatives in organisations.
The sample of 83 participants was comprised of 38 from company1 (46%) of
which 20 were female (53%) and 18 were male (47%) and 45 from company2
(54%) of which 25 were female (56%) and 20 were male (44%). The
participant’s age ranged from 18 to 55 years. Number of years participants have
been working in the organisation ranged from 2 to 10+ years for company1 and

26
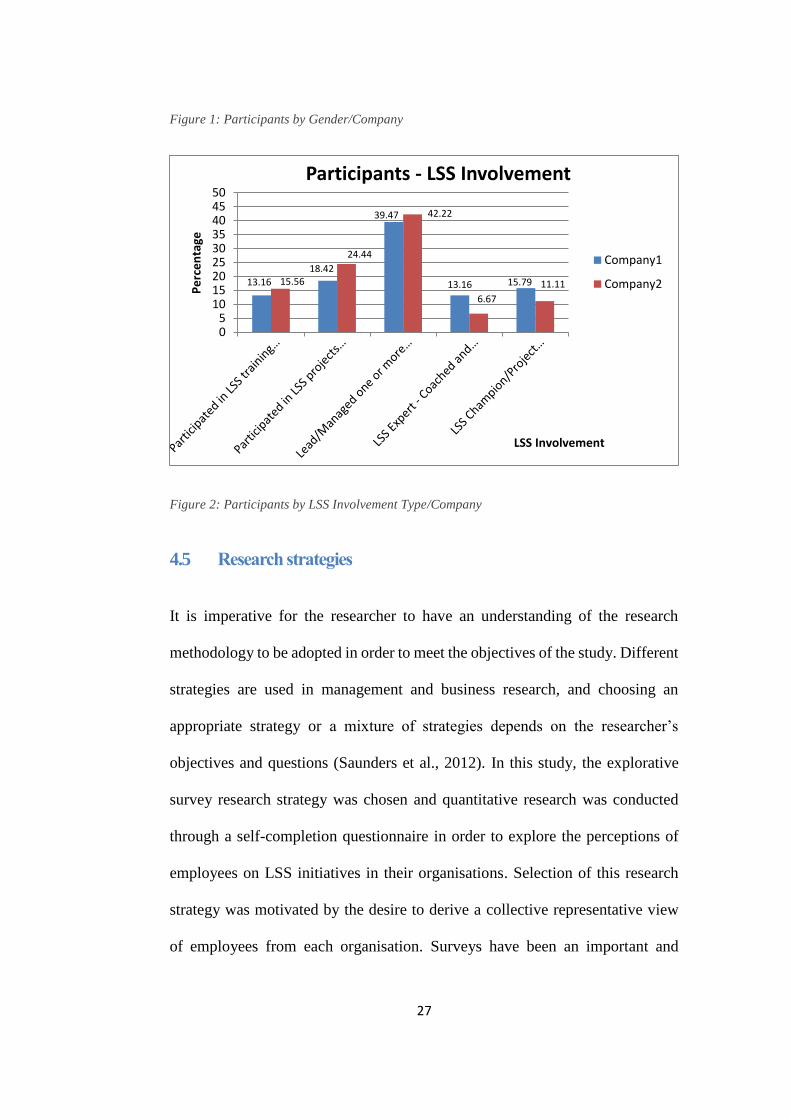
4 to 10+ years for company2. Of 38 participants from company1, 5 stated that
they participated in LSS training only (13%), 7 stated that they participated in
LSS projects (18%), 15 stated that they lead/managed one or more LSS projects
(40%), 5 stated that they coached and trained employees in LSS (13%, LSS
Experts BB/MBB), and 6 stated that they sponsored LSS projects (16%, LSS
Champions). Of 45 participants from company2, 7 stated that they participated
in LSS training only (16%), 11 stated that they participated in LSS projects
(24%), 19 stated that they lead/managed one or more LSS projects (42%), 3
stated that they coached and trained employees in LSS (7%, LSS Experts
BB/MBB), and 5 stated that they sponsored LSS projects (11%, LSS
Champions).
Figure 1 below shows the breakdown of participants by gender and by company
and Figure 2 shows the breakdown of participants by their type of involvement
in LSS initiatives and by company.
0
10
20
30
40
50
60
Company1 Company2
Pe
rce
nta
ge
Company
Participants - by Gender
Female (F)
Male (M)
27
Figure 1: Participants by Gender/Company
Figure 2: Participants by LSS Involvement Type/Company
4.5 Research strategies
It is imperative for the researcher to have an understanding of the research
methodology to be adopted in order to meet the objectives of the study. Different
strategies are used in management and business research, and choosing an
appropriate strategy or a mixture of strategies depends on the researcher’s
objectives and questions (Saunders et al., 2012). In this study, the explorative
survey research strategy was chosen and quantitative research was conducted
through a self-completion questionnaire in order to explore the perceptions of
employees on LSS initiatives in their organisations. Selection of this research
strategy was motivated by the desire to derive a collective representative view
of employees from each organisation. Surveys have been an important and
13.16
18.42
39.47
13.16 15.7915.56
24.44
42.22
6.67
11.11
05
101520253035404550
Pe
rce
nta
ge
LSS Involvement
Participants - LSS Involvement
Company1
Company2

28
popular data collection method in lean six sigma and management research fields
to statistically validate research hypotheses or research questions (Antony et al.,
2007). The method was chosen due to the advantage that the designed
questionnaire can be sent to a large number of participants in a limited time.
The importance of reliability and internal validity of a questionnaire was stressed
by Saunders et al (2012), as a valid questionnaire enables collecting data that
measures the investigated concepts, whereas a reliable questionnaire allows data
to be collected consistently. Cronbach’s alpha is one of the popular and widely
accepted method for measuring the internal consistency of responses to a set of
questions (Mitchell, 1996) and a minimum internal consistency threshold of
Cronbach’s alpha 0.7 is required for reliable responses in research (Hair et al.,
2010). However, validity is equally important as it states whether the evidence
presented justifies the claims of the study (Fisher, 2007). Saunders et al (2012)
argue that, without an internal validity, even when a questionnaire is reliable, it
will not be able to answer the research question. All questionnaire scales used in
this study were tested for reliability and were found reliable with Cronbach’s
alpha values above 0.8.
4.6 Strengths and weaknesses of questionnaires
According to Fowler (2002), a questionnaire is a highly structured data
collection method that can be used to obtain information about a person’s
perceptions, feelings, motivations, beliefs, anticipation, or future plans. This

29
method offers the advantage that the respondents are asked the same set of
questions in a predetermined order, thus enabling analysis of the results by
statistical methods (Antony et al., 2007). Saunders et al. (2012) argue that
questionnaires are the most widely used technique within the survey research
strategy and the most popular method of data collection in quantitative research,
as they enable the collection of responses from a large sample in a fast, efficient
way at a relatively low cost. The study used an on-line questionnaire that was
completed by participants without the presence of the researcher. The on-line
questionnaire used in the study allowed anonymity, which according to Rubin
and Bobbie (2010) encourages genuine and honest responses.
According to Bell (2010), producing a good questionnaire is a difficult process,
as it would need to facilitate the collection of accurate data that answers the
research questions and enable the researchers to achieve the study objectives.
Saunders et al (2012) believe that, the difficulty and the time needed to design,
along with ensuring its validity and reliability are the main weaknesses of a
questionnaire. Also, high reliability and validity are required to minimise
research errors associated with questionnaire. All questionnaire scales used in
this study were tested for reliability and were found reliable with Cronbach’s
alpha values above 0.8. Saunders et al (2012) argued that a pilot testing should
be conducted in order to: ensure that data collected answers the research
question; and assess the validity and reliability of a questionnaire. The
questionnaire used in this study was pilot tested by the author before
commencing the main study as suggested by Saunders et all (2012).
30
4.7 Pilot study
A pilot study was conducted prior to distributing the online questionnaire to the
targeted research sample. The aim of the pilot study was to refine the
questionnaire to avoid problems in answering the questions by participants, and
to avoid problems in recording data (Saunders et al., 2012). The survey
questionnaire for this study was pilot tested with 5 of author’s colleagues to help
establish partakers’ understanding of the questions, any problems in answering,
attractiveness of the layout, clarity of the instructions, and approximate time
needed to complete the questionnaire (Fink, 2009). Participants of pilot study
were requested to share their views on the content and design of the
questionnaire and also to provide any suggestions. All the feedback and
suggestions provided was considered and minor amendments were made to
remove certain repetitions and to the layout of the survey. The Likert scale was
increased from 5 to 7 point scale to allow for partial agreement or disagreement
on the questions. Also, the below two close ended questions were added based
on the suggestions received from participants of the pilot study.
1. Do you currently use/intend to use LSS methodology or tools for process
improvement efforts irrespective of LSS being successful or sustained at
organisation level?
2. The organisation will benefit more by continuing and sustaining LSS
initiatives.
31
4.8 The Survey questionnaire
This research was based on the data collected from a web based self-report
survey questionnaire made up of multiple sections and questions. The survey
was designed to obtain answers to the specific research questions outlined in
chapter 3. A major design consideration while designing a questionnaire is the
response format as this will alter the type and wording of the questions and also
the type of analysis that the researcher wants to perform (Fowler, 2002). Close-
ended question format was chosen for this study as this would enable the data to
be in a format quantifiable form ensuring that statistical analysis can be
conducted. Moreover, it is: easy to complete; fast; enables automated data entry;
facilitates data analysis; and summary of data (Saunders et al., 2012; Fowler,
2002). The Likert scale and ranking were used within this format to obtain
answers from participants. Neuman (2003) claims that, the Likert scale would
provide a more precise measure than true/false or yes/no items and is fast and
easy to complete.
4.8.1 Survey Questionnaire Development
Secondary data from extensive literature review was used to develop the survey
questionnaire to gather data as required for the study. The questionnaire
developed was reviewed by two LSS experts (MBB holders) to ensure the
appropriateness of the design, format and flow of questions in the survey to the
objective of the study. Minor amendments were made as per the feedback and
suggestions received from the LSS experts to finalise the questionnaire.

32
The LimeSurvey web based application hosted at NCI was used to create and
conduct the on-line survey. The web based survey questionnaire used for this
research contained an introduction outlining the reason for this research,
emphasising anonymity and confidentiality of the participants, and the voluntary
nature of participation. Participants were advised on the number of sections and
total number of questions in the survey, and completion of the survey should
take no longer than 10 to 15 minutes. This was confirmed during the pilot study.
The survey questionnaire is attached in Appendix I.
The questionnaire consists of five sections: 1) General questionnaire; 2) LSS
initiatives summary 3) LSS benefits; 4) LSS success and sustainability factors
and 5) LSS critical success factors (CSFs) ranking.
4.8.2 General questionnaire
This section of the survey contained close-ended demographic questions to
obtain specific information about the respondents and the organisation.
Participants were asked questions including their gender, age group, number of
years working for the organisation, and their type of involvement with LSS
initiatives in their organisation. Questions specific to the organisation were also
asked including number of years organisation has been/was using LSS
methodology, if LSS expertise is based in-house or provided by a third party
vendor, and number of dedicated full time LSS expert resources in the
organisation. These demographic questions were asked to understand the
characteristics of the sample and obtain information about the participants.

33
4.8.3 LSS Initiatives Summary
This section of the survey contains specific questions targeted to obtain
employee perceptions regarding the performance of LSS initiatives in their
organisation. Questions were in the form of clear and concise statements and
related to: process improvement is given high importance; LSS initiatives
are/were successful; LSS initiatives have been/will be sustained; LSS initiatives
have provided expected level of benefits; You use LSS methodology and/or tools
irrespective of its’ success and sustainability at organisation level; and
Organisation would have/will benefit more by continuing and sustaining LSS
initiatives. Participants were asked to specify the degree to which they agree with
these six items using a 7-point Likert scale that ranged from 1 = strongly disagree
to 7 = strongly agree. High scores were indicative of performance of LSS
initiatives in the organisation being positive and viewed favourably by
employees.
4.8.4 LSS Benefits
This section of the survey contains specific questions targeted to obtain
employee perceptions regarding the benefits of LSS initiatives in their
organisation. Questions were in the form of clear and concise statements relating
to LSS initiatives resulting in: increased process efficiency; effective in reducing
waste; considerable reduction in process lead/cycle times; considerable cost
reduction; increased customer focus; efficient utilization of resources; increased
quality; increased employee productivity; increased customer satisfaction; and

34
considerable operational and financial gains. Participants were asked to specify
the degree to which they agree with these ten items using a 7-point Likert scale
that ranged from 1 = strongly disagree to 7 = strongly agree. High scores were
indicative of benefits of LSS initiatives in the organisation being positive and
viewed favourably by employees.
4.8.5 LSS Success & sustainability factors
This section of the survey contains specific questions targeted to obtain
employee perceptions regarding the factors that affect the success and
sustainability of LSS initiatives in their organisation. Questions were in the form
of clear and concise statements and related to: senior management commitment
& involvement; clear vision & long term strategy for LSS initiatives; need for
introducing LSS clearly established from start; adequate LSS training; LSS
project selection and prioritisation; strong link between LSS initiatives and
strategic objectives of company; provision of adequate resources; organisation
culture embraces and supports change; effective communication;
encouragement and support for employees; realistic goals and timelines;
pressure to deliver results; high level of employee engagement; methodology too
extensive and time consuming; view LSS as mere set of tools and techniques to
solve problems; high level of LSS awareness and its benefits; process for
tracking and measuring performance of LSS initiatives; selection process of
candidates for LSS training fair and effective; availability of LSS expert help
and coaching; HR rewards and recognition system linking to LSS initiatives;
open culture and team autonomy; high implementation and training costs

35
affecting success and sustainability; established continuous improvement
culture; and LSS initiatives well integrated into CI culture. Participants were
asked to specify the degree to which they agree with these ten items using a 7-
point Likert scale that ranged from 1 = strongly disagree to 7 = strongly agree.
4.8.6 LSS Critical Success Factors (CSFs) Ranking
This section of the survey was aimed at gauging employee views on what they
believe to be the top 10 critical success factors in terms of their importance to
the success and sustainability of LSS initiatives. The section contains one
question with 10 CSFs listed, that are drawn from the literature review.
Participants were asked to rank the 10 CSFs in the decreasing order of
importance (i.e. most important CSF at the top – Rank 1 to least important at the
bottom – Rank 10).
4.9 Ethical considerations
Senior management of both companies selected for the research were assured
that the company names will remain confidential and will not be made public.
All participants were advised that their participation in the survey was voluntary.
Participants were also assured that their own identity together with the name of
the organisations they work for will remain confidential. Names of the
organisations that the author approached and selected for this study may only be
revealed during the presentation of the thesis to the examiners, if required; other
than this, information will not be stated in this paper, it will not be revealed to
36
anyone else and will not be made available to the public. All partakers were also
advised that a copy of the collected results can be provided on request.
4.10 Distribution methods
There are a number of different distribution methods each associated with
different strengths, weaknesses and costs such as distribution: on-line; by post;
by face-to-face; by email; and individual or group distribution (Fisher, 2007). In
this study selected individuals were introduced and invited to participate in the
survey by email, outlining the rationale behind the study. The link to the online
survey questionnaire was also included in the email. Two separate survey links
were setup with the same questionnaire content and each separate link was sent
to employees of company1 and company2 in order to identify the separate data
sets for later analysis. The researcher used his contact at both organisations
selected for the study to identify and distribute the email to the target
participants. The online survey was activated to receive responses in July 2015.
A follow up procedure was followed and reminder emails were sent after 5 days,
and then 10 days to increase the response rate (Saunders et al, 2012). 54
employees from company1 and 59 employees from company2 were invited to
participate in the online survey of which 38 (70%) employees from company1
and 45 (76%) employees completed the survey, resulting in an overall response
rate of 73%.

37
4.11 Error and bias
Firstly, there is a risk of bias in this research as the interviewer works in one of
the firms selected for this study. There are two main types of errors that can
occur in survey based methods: non-sampling error such as low response rates;
and sampling error related to the sample size (McNabb, 2013). Both these errors
may have occurred in this study, and should be considered during the data
analysis. 54 employees from company1 and 59 employees from company2 were
invited to participate in the online survey of which 38 (70%) employees from
company1 and 45 (76%) employees completed the survey. This gave an overall
response rate of 73%. So, a non-sampling error may have occurred due to the
low response rate. According to McNabb (2013), sampling error also referred to
as random error decreases when the sample size increases. The size of the sample
in this study was 83 participants, so sampling errors should be considered.
As characteristics of the individuals who volunteered to participate in the study
could differ from the individuals who did not wish to participate in the study,
response bias should be considered (Groves & Peytcheva, 2008). Others factors
such as different interpretation of questions, distraction of participants while
completing the survey or questionnaire, fatigue and existence some extraneous
factors may have impacted the results, so these also should be considered during
data analyses (Bryman et al., 2007).

38
4.12 Method of quantitative data analysis
Data collected through the online survey responses was quantitatively analysed
using IBM Statistical Package for Social Sciences (SPSS) version 21. Both
descriptive and inferential statistical analyses were conducted using SPSS. Once
the survey data collection was complete, all the survey data was exported from
the online survey tool in to an Excel format file. The data obtained from the
questionnaire was then transformed into a format that is compatible with IBM
SPSS. This involved allocating a numerical code to each response in the excel
file before transferring the data to IBM SPSS. An error check was conducted
after importing the transformed data into SPSS to indicate any missing values.
Coded responses were reverse-coded. Composite total scale scores were
computed to obtain LSS Initiatives Summary, LSS Benefits and LSS Success
and Sustain Factors scale variables. Reliability analysis was performed on items
in each scale to determine the Cronbach’s alpha values for each scale.
Descriptive and normality test was then conducted on each scale to ascertain if
the distributions were normal or non-normal. Non-parametric, 2 independent
samples test was then performed on each scale to determine existence of any
significant differences between the two groups (companies). The Non-
parametric, 2 independent samples test was also performed on each item in the
scale to determine existence of any significant differences with respect to
individual items between the two groups (companies).
39
4.13 Limitations
The methodology used for this research has a number of limitations. The study
used only quantitative methods through a self-report survey questionnaire and
hence is open for single source bias (Eisenhardt, 1989). Only employees who
have participated in LSS initiatives from the two companies were selected to
participate in the on-line survey. Hence, the findings from this study are relevant
only to the sample population and do not represent the collective viewpoint of
all the employees from the two companies. Also, the survey results were open to
the interpretation and bias of the researcher. The research was based on two
companies in the services sector and hence the generalisation of results may be
questionable or may not be possible.
4.14 Summary of methodology
To answer the research question of investigating the employee perceptions on
LSS initiatives in services organisations, the quantitative research methods were
chosen in line with previous empirical research conducted in this field (e.g.
Antony and Laureani, 2012; Sharma and Chetiya, 2012; Habidin and Yusof, 2013;
Antony, Antony and Kumar, 2007; Heckl, Moormann and Rosemann, 2010). A
self-administered survey questionnaire was designed based on the literature
review and a web based survey was conducted with the sampled employees from
the two companies in the services sector identified for the study. Data collected
from the on-line survey was analysed by conducting descriptive and inferential
statistical tests in IBM SPSS software. No ethical issues or considerations
40
needed to be accounted for as the on-line survey conducted provided anonymity
for participants and names of the companies involved in the study are to remain
confidential.
5. Findings
5.1 Introduction
The survey (Appendix I) responses from employees of both company1 and
company2 were gathered and analysed to attempt to answer the research
questions set out in chapter 3.
The survey was sent to 54 employees in company1 and 59 employees in
company2. 38 employees (70%) from company1 and 45 employees (76%) from
company2 responded to the survey. This section analyses the findings from the
responses received in this survey.
5.2 Descriptive Statistics
Prior to conducting any testing, preliminary analyses were carried out to measure
reliability of each variable, and to obtain the basic summary calculations for the
sample. Also, checking for any violations of the assumptions underlying each
test were completed by conducting descriptive statistics (Pallant, 2013). The

41
reason for conducting the reliability analysis for each scale was to assess the
internal reliability of each scale for the study sample. According to Hair et al
(2010), Cronbach’s alpha value above 0.7 is considered acceptable, and a value
above 0.8 is a preferable measure of internal consistency. In this study,
Cronbach’s alpha coefficients for each scale were above 0.8. A listing of the
questionnaire scales used in the study and their Cronbach’s alpha results for
company1 and company2 is provided in Table 2 below.
Table 1: Cronbach’s alpha for survey questionnaire scales
5.3 Characteristics of the sample population
Descriptive statistics were carried out to obtain the characteristics of the sample
population (Pallant, 2013). The characteristics of the sample population have
been provided in section 4.4 of chapter 4.
5.4 LSS Initiatives Summary – Employee perceptions
This section attempts to answer the below research question by analysing and
presenting the results of the General Questionnaire responses from the survey.

42
Q1: How does the perceptions of employees on the performance of LSS
initiatives in their organisations compare between company1 and
company2?
In relation to if any other process improvement methodologies are used in the
organisation, 29% of participants from company1 stated that their organisation
does use other process improvement methodologies, 63% stated that their
organisation does not any other process improvement methodologies and 8%
stated that they didn’t know if their organisation uses any other process
improvement technologies. Whereas from company2, 71% stated that their
organisation does use other process improvement methodologies, 5% stated that
their organisation does not any other process improvement methodologies and
24% stated that they didn’t know if their organisation uses any other process
improvement technologies. Figure 2 below graphically depicts the results.
Figure 3: Any other process improvement methodologies used in the organisation?
28.95
63.16
7.89
71.11
4.44
24.44
0
10
20
30
40
50
60
70
80
Yes (A1) No (A2) Don't Know (A3)
Pe
rce
nta
ge
Response
Use Other Process Improvement Methodologies?
Company1
Company2

43
In relation to if LSS was the preferred methodology for process improvements
in the organisation, 100% of participants from company1 stated that LSS is the
preferred process improvement methodology in their organisation. Whereas
from company2, 42% of participants stated that LSS is the preferred process
improvement methodology, 53% stated that LSS is not the preferred process
improvement methodology and 5% didn’t know if LSS is the preferred process
improvement methodology. Figure 3 below graphically depicts the results.
Figure 4: Is LSS the preferred process improvement methodology?
5.4.1 LSS Initiatives Summary Scale Reliability Results
This section presents the results of a reliability analysis conducted on the LSS
Initiatives Summary Scale variable for company1 and company2. The results are
presented in tables below with Table 3 presenting the case summary and Table
4 presenting the Reliability results. 38 valid cases were considered and a
Cronbach’s Alpha value of 0.830 was identified for company1 and 45 valid cases
100
42.22
53.33
4.44
0
20
40
60
80
100
120
Yes (A1) No (A2) Don't Know (A3)
Pe
rce
nta
ge
Response
LSS Preferred Methodology?
Company1
Company2

44
were considered and a Cronbach’s Alpha value of 0.808 was identified for
company2 for the LSS Initiatives Summary Scale that consisted of 6 items.
Table 2: LSS Initiatives Summary Scale Case
Summary
Table 3: LSS Initiatives Scale Reliability
5.4.2 LSS Initiatives Employee Perceptions Differences
The study involved a total of 83 employees of which 38 were from company1
and 45 were from company2. A case summary is presented in Table 4 and
Histograms of the distributions of LSS initiatives employee perceptions scale
responses for both company1 and company2 are shown in Figure 5 and Figure
6 respectively in Appendix II. All associated descriptive statistics for both
company1 and company2 are shown in Table 5 in Appendix II.
The results of Tests of Normality are presented in Table 6 below. As the sample
sizes for both company1 and company2 are less than 2000, we rely on the results
of the Shapiro-Wilk’s test of normality for inferring the presence or absence of
normality in both the company1 and company2 sample distributions. With the
Shapiro-Wilk’s test of normality, the null hypothesis associated assumes
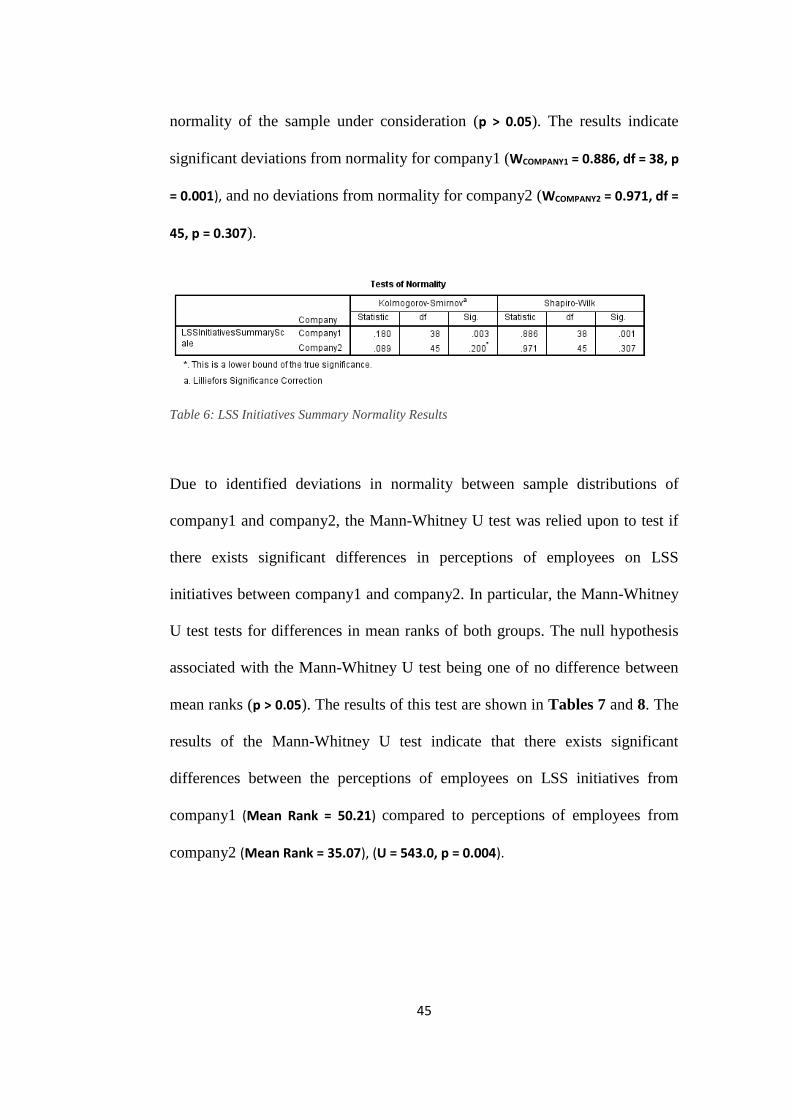
45
normality of the sample under consideration (p > 0.05). The results indicate
significant deviations from normality for company1 (WCOMPANY1 = 0.886, df = 38, p
= 0.001), and no deviations from normality for company2 (WCOMPANY2 = 0.971, df =
45, p = 0.307).
Table 6: LSS Initiatives Summary Normality Results
Due to identified deviations in normality between sample distributions of
company1 and company2, the Mann-Whitney U test was relied upon to test if
there exists significant differences in perceptions of employees on LSS
initiatives between company1 and company2. In particular, the Mann-Whitney
U test tests for differences in mean ranks of both groups. The null hypothesis
associated with the Mann-Whitney U test being one of no difference between
mean ranks (p > 0.05). The results of this test are shown in Tables 7 and 8. The
results of the Mann-Whitney U test indicate that there exists significant
differences between the perceptions of employees on LSS initiatives from
company1 (Mean Rank = 50.21) compared to perceptions of employees from
company2 (Mean Rank = 35.07), (U = 543.0, p = 0.004).

46
Table 7: Mann-Whitney Test Mean Ranks
Table 8: Mann-Whitney Test
Statistics
5.4.3 LSS Initiatives Summary Differences by Items
In order to further explore the perceptions of employees with respect to each
individual question in the LSS initiatives Summary scale and to ascertain where
the perceptions significantly differed between company1 and company2, the
Mann-Whitney U test was performed on all the 6 items in the scale by having
company as the grouping variable. The ranks results of this test are shown in
Table 9 in Appendix II and the test statistics are shown below in Table 10.
Table 10: Mann-Whitney Test Statistics for scale items
The results of the Mann-Whitney U test for each item in the scale indicate that
there exist significant differences between perceptions of employees of
company1 and company2 in the two areas outlined below.
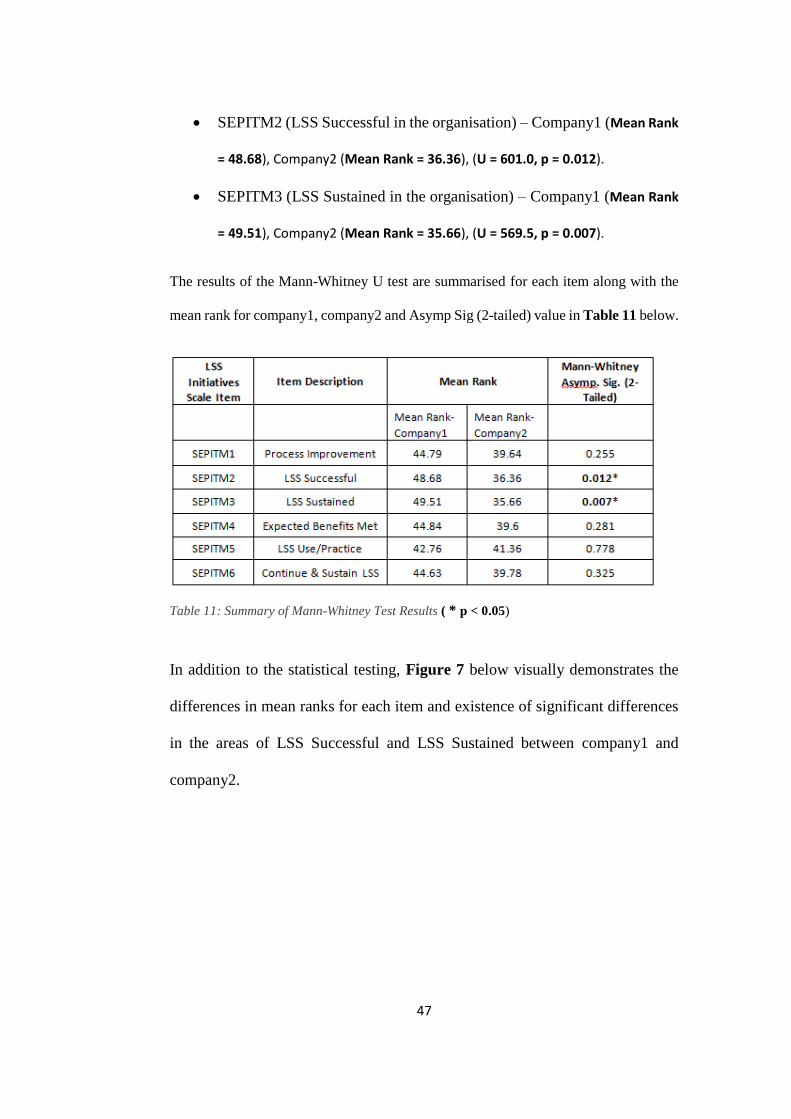
47
SEPITM2 (LSS Successful in the organisation) – Company1 (Mean Rank
= 48.68), Company2 (Mean Rank = 36.36), (U = 601.0, p = 0.012).
SEPITM3 (LSS Sustained in the organisation) – Company1 (Mean Rank
= 49.51), Company2 (Mean Rank = 35.66), (U = 569.5, p = 0.007).
The results of the Mann-Whitney U test are summarised for each item along with the
mean rank for company1, company2 and Asymp Sig (2-tailed) value in Table 11 below.
Table 11: Summary of Mann-Whitney Test Results ( * p < 0.05)
In addition to the statistical testing, Figure 7 below visually demonstrates the
differences in mean ranks for each item and existence of significant differences
in the areas of LSS Successful and LSS Sustained between company1 and
company2.

48
Figure 7: LSS Initiatives Summary – Mean Ranks comparison for Scale Items
The results suggest that, the views of employees from company1 were more
positive across all areas for the performance of LSS initiatives in their
organisation compared to employees from company2. Below interpretations can
be made from the results.
Employees of company1 were more or less in agreement with: process
improvement is given high importance; LSS initiatives have been
successful; LSS initiatives have been and will be sustained; expected
benefits were met from the LSS initiatives; currently use and intend to
continue to use LSS methodology and tools in process improvements;
and organisation will benefit more by continuing and sustaining LSS
initiatives.
44.7948.68 49.51
44.8442.76 44.63
39.6436.36 35.66
39.6 41.36 39.78
0
10
20
30
40
50
60
70
Me
an R
ank
Item
LSS Initiatives Summary - Employee Perceptions
Mean Rank-Company1
Mean Rank-Company2

49
Whereas employees of company2 were more or less in disagreement
with: LSS initiatives have been successful; LSS initiatives have been and
will be sustained; and less in agreement with: process improvement is
given high importance; expected benefits were met from the LSS
initiatives; and organisation will benefit more by continuing and
sustaining LSS initiatives.
It is important to note that, employees of both company1 and company2
were more or less in agreement with: they currently use and intend to
continue to use LSS methodology and tools in process improvements
irrespective of whether the LSS initiatives are successful or sustained at
an organisational level.
5.5 LSS Benefits – Employee Perceptions
This section attempts to answer the below research question by analysing and
presenting the results of the LSS benefits section responses from the survey.
Q2: How does the perceptions of employees on the benefits of LSS initiatives in
their organisations compare between company1 and company2?
5.5.1 LSS Benefits Employee Perceptions Scale Reliability Results
This section presents the results of a reliability analysis conducted on the LSS
Benefits Employee Perceptions Scale variable for company1 and company2. The
results are presented in tables below with Table 12 presenting the case summary

50
and Table 13 presenting the Reliability results. 38 valid cases were considered
and a Cronbach’s Alpha value of 0.937 was identified for company1 and 45 valid
cases were considered and a Cronbach’s Alpha value of 0.928 was identified for
company2 for the LSS Benefits employee perceptions Scale that consisted of 10
items.
Table 12: LSS Benefits Scale Case Summary
Table 13: LSS Benefits Scale Reliability
5.5.2 LSS Benefits Employee Perceptions Differences
The study involved a total of 83 employees of which 38 were from company1
and 45 were from company2. A case summary is presented in Table 14 and
Histograms of the distributions of LSS Benefits employee perceptions scale
responses for both company1 and company2 are shown in Figure 8 and Figure
9 respectively in Appendix II. All associated descriptive statistics for both
company1 and company2 are shown in Table 15 in Appendix II.
The results of Tests of Normality are presented in Table 16 below. As the sample
sizes for both company1 and company2 are less than 2000, we rely on the results
of the Shapiro-Wilk’s test of normality for inferring the presence or absence of

51
normality in both the company1 and company2 sample distributions. With the
Shapiro-Wilk’s test of normality, the null hypothesis associated assumes
normality of the sample under consideration (p > 0.05). The results indicate
significant deviations from normality for both company1 (WCOMPANY1 = 0.775, df =
38, p = 0.000), and for company2 (WCOMPANY2 = 0.917, df = 45, p = 0.003).
Table 16: LSS Benefits employee perceptions Normality Results
Due to identified deviations in normality between sample distributions of
company1 and company2, the Mann-Whitney U test was relied upon to test if
there exists significant differences in perceptions of employees on LSS Benefits
between company1 and company2. In particular, the Mann-Whitney U test tests
for differences in mean ranks of both groups. The null hypothesis associated with
the Mann-Whitney U test being one of no difference between mean ranks (p >
0.05). The results of this test are shown in Tables 17 and 18. The results of the
Mann-Whitney U test indicate that no significant differences exists between the
perceptions of employees on LSS benefits from company1 (Mean Rank = 38.47)
compared to perceptions of employees from company2 (Mean Rank = 44.98), (U =
721.0, p = 0.219).
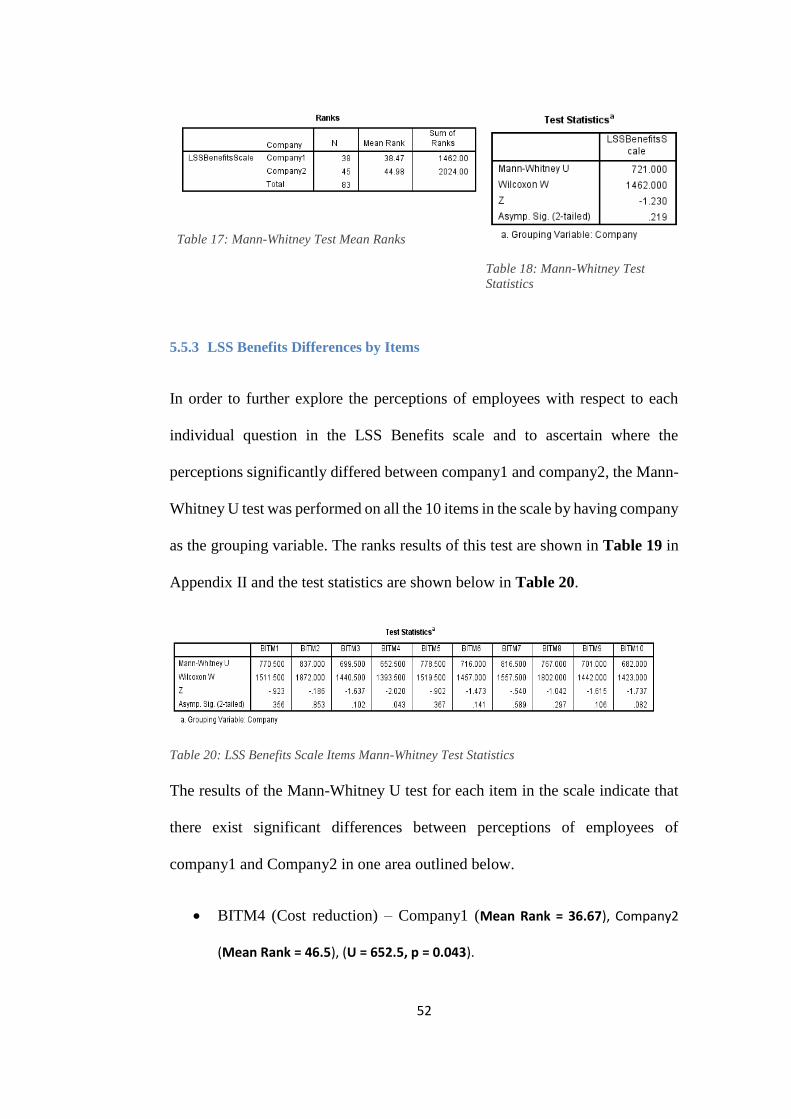
52
Table 17: Mann-Whitney Test Mean Ranks
Table 18: Mann-Whitney Test
Statistics
5.5.3 LSS Benefits Differences by Items
In order to further explore the perceptions of employees with respect to each
individual question in the LSS Benefits scale and to ascertain where the
perceptions significantly differed between company1 and company2, the Mann-
Whitney U test was performed on all the 10 items in the scale by having company
as the grouping variable. The ranks results of this test are shown in Table 19 in
Appendix II and the test statistics are shown below in Table 20.
Table 20: LSS Benefits Scale Items Mann-Whitney Test Statistics
The results of the Mann-Whitney U test for each item in the scale indicate that
there exist significant differences between perceptions of employees of
company1 and Company2 in one area outlined below.
BITM4 (Cost reduction) – Company1 (Mean Rank = 36.67), Company2
(Mean Rank = 46.5), (U = 652.5, p = 0.043).

53
The results of the Mann-Whitney U test are summarised for each item along with the
mean rank for company1, company2 and Asymp Sig (2-tailed) value in Table 22 below.
LSS Benefits
Scale Item Item Description
Mean Rank
Mann-Whitney Asymp. Sig. (2-
Tailed)
Company1 Company2
BITM1 Increased Process efficiency
39.78 43.88 0.356
BITM2 Effective in reducing waste
42.47 41.6 0.853
BITM3 Reducing process Lead/Cycle Times
37.91 45.46 0.102
BITM4 Considerable cost reduction
36.67 46.5 0.043*
BITM5 Increased Customer focus
39.99 43.7 0.367
BITM6 Efficient resource utilization
38.34 45.09 0.141
BITM7 Increased quality 40.99 42.86 0.589
BITM8 Increased employee productivity
44.32 40.04 0.297
BITM9 Increased customer satisfaction
37.95 45.42 0.106
BITM10 Considerable Operational & financial gains
37.45 45.84 0.082
Table 21: Summary of Mann-Whitney Test Results ( * p < 0.05)
In addition to the statistical testing, Figure 10 below visually demonstrates the
comparison of employee perceptions based on mean ranks for each item and
existence of significant differences in the areas of Cost reduction between
company1 and company2.

54
Figure 10: LSS Benefits– Mean Ranks comparison of Scale Items
The results suggest that, the views of employees from company2 were a little
more upbeat across most areas of LSS benefits to the organisation compared to
the views of employees from company2. Below points can be noted from the
results.
Employees of both company1 and company2 are more or less on
agreement that LSS initiatives have resulted in: increased process
efficiency; waste reduction; increased customer focus; increased quality;
and increased employee productivity.
There is more belief by employees of company2 than employees of
company1 that LSS initiatives have resulted in: considerable reduction
in process lead/cycle times; considerable cost reduction; resulting in
39.78
42.47
37.91 36.6739.99 38.34
40.99
44.32
37.95 37.45
43.88
41.6
45.46 46.543.7 45.09
42.86
40.04
45.42 45.84
0
10
20
30
40
50
60
70
Me
an R
ank
Item
LSS Benefits - Employee Perceptions
Mean Rank-Company1
Mean Rank-Company2
55
efficient utilization of resources; customer satisfaction; and results in
considerable operational & financial gains.
Employees of company1 were less in agreement with LSS initiatives
resulting in significant cost reductions compared to company2 whose
views were slightly more positive.
5.6 LSS Success and Sustainability Factors
This section attempts to answer the below research question by analysing and
presenting the results of the LSS Success and Sustainability factors section
responses from the survey.
Q3: How does the perceptions of employees on the factors affecting the success
and sustainability of LSS initiatives in their organisations compare between
company1 and company2?
5.6.1 LSS Success and Sustainability Factors Scale Reliability Results
This section presents the results of a reliability analysis conducted on the LSS
Success and Sustainability Employee Perceptions Scale variable for company1
and company2. The results are presented in tables below with Table 22
presenting the case summary and Table 23 presenting the Reliability results. 38
valid cases were considered and a Cronbach’s Alpha value of 0.928 was
identified for company1 and 45 valid cases were considered and a Cronbach’s
Alpha value of 0.935 was identified for company2 for the LSS Success and
Sustainability Employee Perceptions Scale that consisted of 25 items.

56
Table 22: LSS Success and Sustain Factors Scale
Case Summary
Table 23: LSS Success and Sustain
Factors Scale Reliability
5.6.2 LSS Success and Sustainability Factors Differences
The study involved a total of 83 employees of which 38 were from company1
and 45 were from company2. A case summary is presented in Table 24 and
Histograms of the distributions of LSS Success and Sustainability factors scale
responses for both company1 and company2 are shown in Figure 11 and Figure
12 respectively in Appendix II. All associated descriptive statistics for both
company1 and company2 are shown in Table 25 in Appendix II.
The results of Tests of Normality are presented in Table 26 below. As the sample
sizes for both company1 and company2 are less than 2000, we rely on the results
of the Shapiro-Wilk’s test of normality for inferring the presence or absence of
normality in both the company1 and company2 sample distributions. With the
Shapiro-Wilk’s test of normality, the null hypothesis associated assumes
normality of the sample under consideration (p > 0.05). The results indicate
significant deviations from normality for company1 (WCOMPANY1 = 0.727, df = 38, p
= 0.000), and no deviations from normality for company2 (WCOMPANY2 = 0.972, df =
45, p = 0.355).

57
Table 26: LSS Success and Sustainability Factors Normality Results
Due to identified deviations in normality between sample distributions of
company1 and company2, the Mann-Whitney U test was relied upon to test if
there exists significant differences in perceptions of employees on LSS Success
and Sustainability factors between company1 and company2. In particular, the
Mann-Whitney U test tests for differences in mean ranks of both groups. The
null hypothesis associated with the Mann-Whitney U test being one of no
difference between mean ranks (p > 0.05). The results of this test are shown in
Tables 27 and 28. The results of the Mann-Whitney U test indicate that there
exists significant differences between the perceptions of employees on LSS
success and sustainability factors from company1 (Mean Rank = 52.64) compared
to perceptions of employees from company2 (Mean Rank = 33.01), (U = 450.500, p
= 0.000).
Table 27: Mann-Whitney Test Mean Ranks
Table 28: Mann-Whitney Test
Statistics

58
5.6.3 LSS Success and Sustainability Factors Differences by Items
In order to further explore the perceptions of employees with respect to each
individual question in the LSS Success and Sustain Factors scale and to ascertain
where the perceptions significantly differed between company1 and company2,
the Mann-Whitney U test was performed on all the 25 items in the scale by
having company as the grouping variable. The ranks results of this test are shown
in Table 29 and test statistics are shown in Table 30 in Appendix II.
The results of the Mann-Whitney U test are summarised for each item along with the
mean rank for company1, company2 and Asymp Sig (2-tailed) value in Table 31 below.
The results indicate that there exist significant differences between perceptions
of employees of company1 and Company2 in the areas highlighted in Table 31
where the Mann-Whitney Asymp Sig value is less than 0.05 (p< 0.05).

59
Table 31: Summary of Mann-Whitney Test Results ( * p < 0.05)

60
In addition to the statistical testing, Figure 12 below visually demonstrates the
comparison of employee perceptions based on mean ranks for each item and
existence of significant differences in the areas outlined above between
company1 and company2.

61
Figure 13: LSS Success and Sustainability Factors – Mean Ranks plot of Scale Items
55.58
51.75
54.82
48.3445.7
48.11
45.1742.24
51.43
55.29
42.55
50.42
45.7447.53
37.09
54.38
48.67
44.8443 42.29
39.13
50.93
34.82
42.97
50.08
30.53
33.7731.18
36.6438.88
36.8439.32
41.8
34.03
30.78
41.53
34.89
38.8437.33
46.14
31.54
36.37
39.641.16 41.76
44.42
34.46
48.07
41.18
35.18
0
10
20
30
40
50
60
70
Me
an R
ank
Item
LSS Success & Sustainability Factors - Employee Perceptions
Company1
Company2

62
The results suggest that there is a broad level of agreement from employees of
company1 across all factors that affect the success and sustainability of LSS
initiatives with the exception of the two factors: Employees view LSS as mere
set of tools, techniques to solve problems; and High implementation & training
costs affecting success & sustainability, where the scores were lower. Lower
scores for these factors meant that these factors were acting as enablers. Whereas
the employees from company2 were less in agreement with most of the factors
with the exception of the factors: Employees view LSS as mere set of tools,
techniques to solve problems; and High implementation & training costs
affecting success & sustainability, where higher scores meant these factors acted
like the barriers.
In addition, it is important to note the below from the results.
The scores from company2 were below par on factors: senior
management commitment & involvement; clear vision & long term
strategy; need for introducing established from start; management
support & encouragement for employees to participate in LSS initiatives;
and creation of high level of awareness & its’ benefits to the organisation,
which suggested that there was a lack in these key enabling factors that
contribute to the success and sustainability of LSS initiatives. Whereas,
much higher scores from company1 on the same factors indicate that,
these key enabling factors were either met or present.
63
The views of employees from both company1 and company2 were more
or less in agreement with factors: organisation culture supports change;
goals and timelines set for LSS projects were realistic; selection process
for candidates to participate in LSS training was fair; availability of
adequate LSS expert help & coaching; established continuous
improvement culture in the organisation.
There is more belief by employees of company1 compared to employees
of company2 with regards to: adequate LSS training; LSS project
selection based on suitability and prioritisation; strong link between LSS
initiatives & strategic objectives of the company; provision for adequate
resources; effective communication by top management on LSS
initiatives; high level of employee engagement & participation; well-
defined process for tracking and measuring LSS projects performance;
creation of open culture for LSS initiatives and providing team autonomy
by top management; LSS initiatives well integrated in the continuous
improvement culture.
Employees of both company1 and company2 were less in agreement with
existence of a well-defined HR rewards and recognition system linking
to LSS initiatives.
Employees of company1 believed more that they are under pressure to
deliver results for LSS initiatives, and LSS methodology is too extensive
and time consuming compared to employees of company2.

64
5.7 LSS Critical Success Factors (CSFs)
This section attempts to answer the below research question by analysing and
presenting the results of the LSS critical success factors ranking section
responses from the survey.
Q4: How does the ranking of Top 10 Critical Success Factors (CSFs) that affect
the success of LSS initiatives compare between company1 and company2?
5.7.1 LSS Critical Success Factors (CSFs) Ranking
This section presents the results from the ranking of top 10 LSS critical success
factors (CSFs) for Company1 and Company2. To ascertain how employees
ranked the top 10 CSFs, number of responses rating each CSF at each Rank level
was calculated and multiplied with a weighted number corresponding to each
rank level to compute a weighted score. Number of Rank1 responses for a CSF
was multiplied by a weighted number 1, rank2 responses by 2, rank3 responses
by 3 so on up to rank10. The weighted scores for all 10 rank levels were then
added for each CSF to arrive at a Total weighted score. The CSF with the lowest
total weighted score would be the one that is regarded by employees as the most
important CSF; second lowest will be the second most important CSF and so on
that affect the success of LSS initiatives. The results of this analysis for
Company1 and Company2 are presented below in Table 32 and Table 33
respectively.
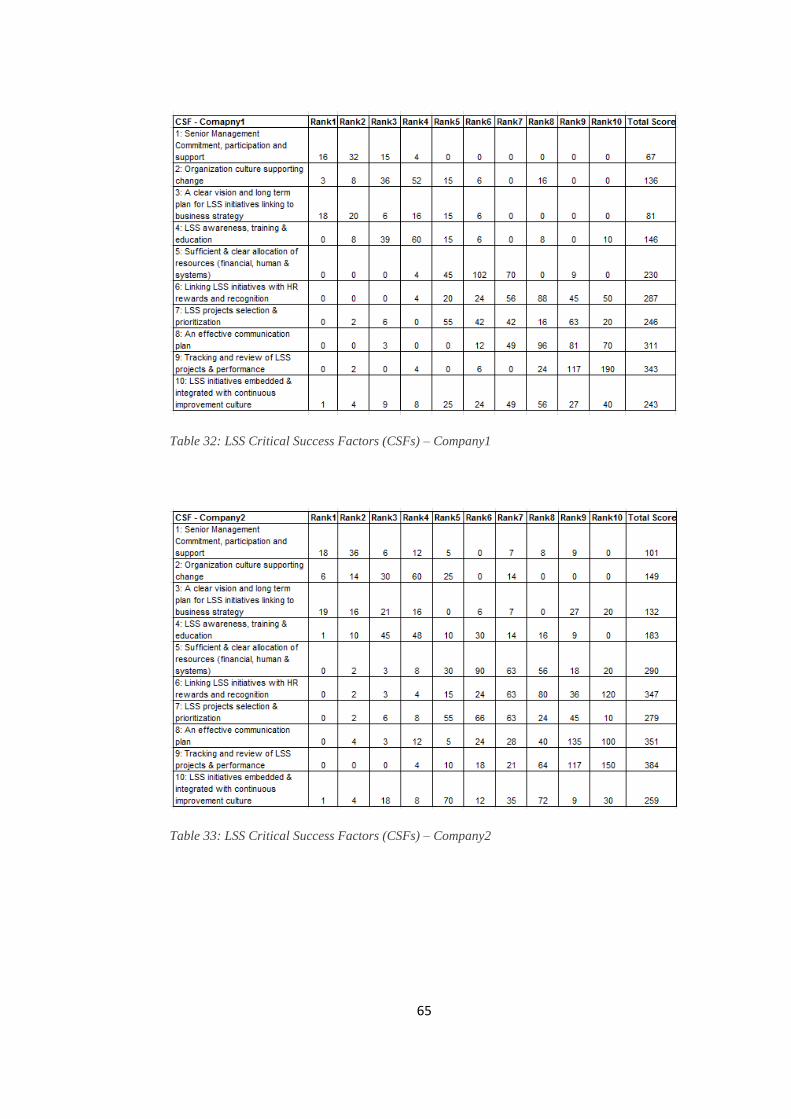
65
Table 32: LSS Critical Success Factors (CSFs) – Company1
Table 33: LSS Critical Success Factors (CSFs) – Company2
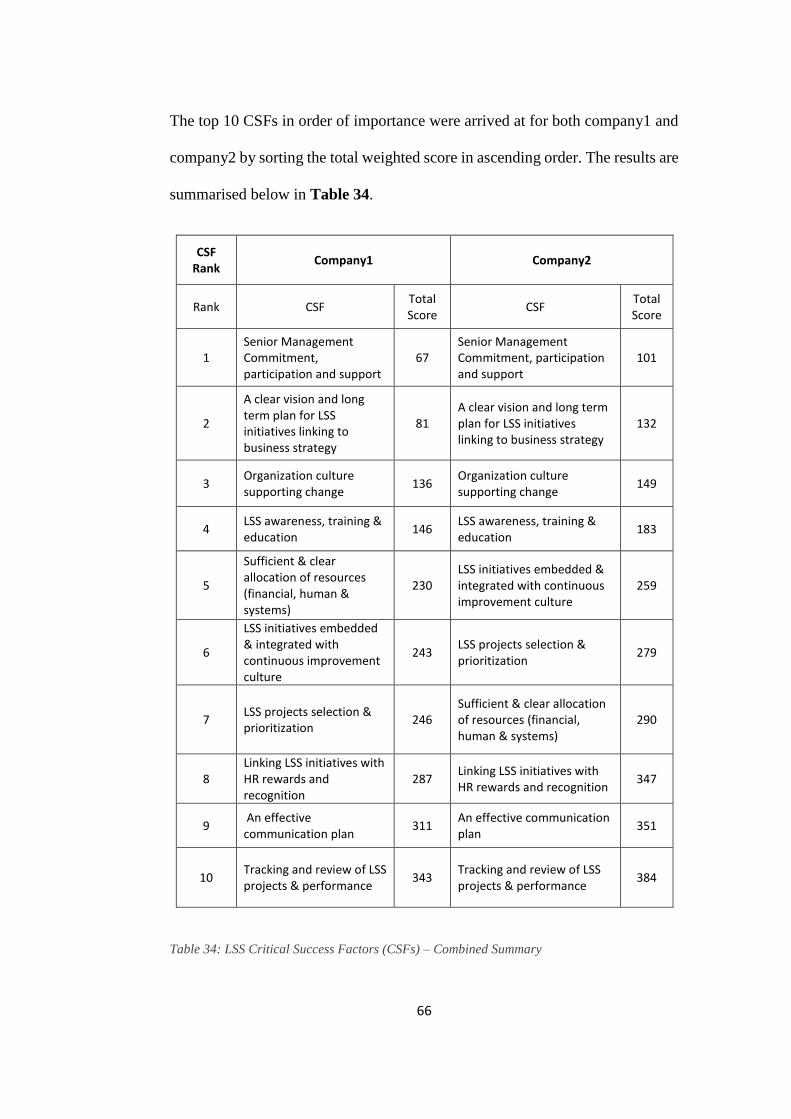
66
The top 10 CSFs in order of importance were arrived at for both company1 and
company2 by sorting the total weighted score in ascending order. The results are
summarised below in Table 34.
CSF Rank
Company1
Company2
Rank CSF Total Score
CSF Total Score
1 Senior Management Commitment, participation and support
67 Senior Management Commitment, participation and support
101
2
A clear vision and long term plan for LSS initiatives linking to business strategy
81 A clear vision and long term plan for LSS initiatives linking to business strategy
132
3 Organization culture supporting change
136 Organization culture supporting change
149
4 LSS awareness, training & education
146 LSS awareness, training & education
183
5
Sufficient & clear allocation of resources (financial, human & systems)
230 LSS initiatives embedded & integrated with continuous improvement culture
259
6
LSS initiatives embedded & integrated with continuous improvement culture
243 LSS projects selection & prioritization
279
7 LSS projects selection & prioritization
246 Sufficient & clear allocation of resources (financial, human & systems)
290
8 Linking LSS initiatives with HR rewards and recognition
287 Linking LSS initiatives with HR rewards and recognition
347
9 An effective communication plan
311 An effective communication plan
351
10 Tracking and review of LSS projects & performance
343 Tracking and review of LSS projects & performance
384
Table 34: LSS Critical Success Factors (CSFs) – Combined Summary

67
The results indicate that, the views of employees from both company1 and
company2 are well aligned with respect to the top 4 and bottom 3 CSFs in terms
of their importance and criticality to the success of LSS initiatives. The 5th, 6th
and 7th most important CSFs slightly differ between company1 and company2.
The below four CSFs were rated as the first, second, third and fourth most
important CSFs by employees of both company1 and company2.
1. Senior Management Commitment, participation and support
2. A clear vision and long term plan for LSS initiatives linking to business
strategy
3. Organization culture supporting change
4. LSS awareness, training & education
68
6. Discussion
6.1 Introduction
This chapter focusses on analysing the results from the survey with respect to
the four research questions identified for this study and outlined in chapter 3.
The academic literature was also used to answer the research questions along
with the survey results.
6.2 LSS initiatives summary
This section attempts to answer the below research question by analysing the
survey results presented in the previous chapter.
Q1: How does the perceptions of employees on the performance of LSS
initiatives in their organisations compare between company1 and company2?
There is strong evidence from the results that employees of company2 did not
believe that the LSS initiatives were successful or have been sustained. In
contrary, employees of company1 believe the LSS initiatives have been more or
less successful and have been sustained. Survey results indicate that these are the
two areas that the views of employees significantly differed between company1
and company2. Furthermore, employees of company1 believed more that:
process improvement is given high importance in the organisation; expected
level of benefits have been met from the LSS initiatives; and the organisation

69
will benefit more by continuing and sustaining the LSS initiatives; when
compared to employees of company2.
It is imperative that, for any process improvement methodologies like LSS to be
embraced and successful, process improvement is made a high priority and given
high importance in the organisation. The literature clearly outlines the
significance of making process improvement a high priority in organisations in
order for LSS change efforts to succeed and sustain. Academic literature
suggested that companies abandon the change efforts if the method does not
seem to provide clear evidence of expected results in terms of performance
Naslund (2008). It is evident from the survey results that, these two key factors
seem to be lacking in company2 but present in company1, which would explain
why the LSS initiatives were not successful and have not been sustained in
company2 whereas LSS initiatives were successful and have been sustained in
company1.
Also, there is strong evidence from the survey results that, no other process
improvement methodologies were being used at company1 and LSS was the
preferred process improvement methodology. This suggests that, there appears
to be a strong commitment and focus on LSS at the organisational level and to
use LSS for all process improvement efforts and projects. On contrary, there was
strong evidence to support that other process improvement methodologies were
being used at company2 and LSS was not the preferred methodology for process
improvements. This suggests either a lack of serious commitment to LSS at the
organisation level or the organisation shifting its focus from sticking exclusively
70
to one methodology to adopting multiple methodologies and choosing one that
best fits based on the situation and requirements.
One interesting point to note from the results is, there was a broad level of
agreement between the views of employees from both company1 and company2
that, they currently use and intend to use LSS methodology and/or tools for
process improvement efforts irrespective of whether LSS initiatives are
successful or sustained at organisation level. While this is implied for company1
as no other methodologies are being used and LSS is the preferred methodology;
for company2 this indicates that there’s still a preference for LSS at the employee
level even though it is not successful and sustained at the organisation level.
6.3 LSS benefits
This section attempts to answer the below research question by analysing the
survey results presented in the previous chapter.
Q2: How does the perceptions of employees on the benefits of LSS initiatives in
their organisations compare between company1 and company2?
The results indicate that the views of employees from both company1 and
company2 were broadly aligned and did not differ significantly with respect to
the overall benefits of LSS initiatives in the organisations. The literature clearly
outlines that LSS provides better quality in the services industry by increasing
quality and reducing cost of service delivery simultaneously thus leading to
increased efficiency. Increased efficiency will eventually cost less by making the

71
best use of the resources available in the company (Psychogios et al. 2012, De
Koning et al., 2008).
However, there seems to be more belief from employees of company2 with
respect to the realisation of benefits from LSS initiatives such as: increased
process efficiency; reduction in process lead/cycle times; cost reduction;
increased customer focus; efficient resource utilization; increased quality;
increased customer satisfaction; and operational & financial gains, whereas
employees from company1 did not show the same level of belief.
Furthermore, the views differed significantly on cost reduction and slightly less
significantly on operational & financial gains, whereby employees of company2
believed cost reduction and operational & financial gains are more realised than
employees of company1. The literature supports that LSS will reduce cost,
increase profit and add value to an organisation in the long run. As company1
has been using LSS for a longer period than company2, employee beliefs on LSS
benefits should have been more favourable.
The views were broadly aligned with respect to the realisation of waste
reduction, increased customer focus and employee productivity.
It is interesting to note that employees of company1 largely believed that the
LSS initiatives were successful and have been sustained, but believe less with
respect to the realisation of benefits from the LSS initiatives. Whereas,
employees of company2 largely believed that LSS initiatives were not successful
72
and have not been sustained, but believe more with regards to the realisation of
LSS benefits.
6.4 LSS factors affecting success and sustainability
The literature outlines various factors that affect the success and sustainability
of LSS initiatives. These factors could act as enablers or barriers to the success
and sustainability of LSS depending on whether they are met or not met in the
organisation. This section attempts to answer the below research question by
analysing the survey results presented in the previous chapter.
Q3: How does the perceptions of employees on the factors affecting the success
and sustainability of LSS initiatives in their organisations compare between
company1 and company2?
The results of the survey indicated that there were significant differences in the
perceptions of employees on some of the factors that affect the success and
sustainability of LSS between company1 and company2. The results indicate
that, there is a broad consensus among views of employees from company1 that
most of the factors that affect the success and sustainability of LSS are either
met or present in their organisation. Also, employees of company1 believed
more that these factors were met in their organisation than employees of
company2.
The factors or the areas where the views significantly differed between the two
companies were the ones where employees of company2 did not believe that
these factors were met or present in the organisation. Of these, there is strong
73
evidence to suggest that employees of company2 believed there was a clear lack
in the below factors:
Senior management commitment & involvement -
Clear vision & long term strategy;
Need for introducing LSS established from start
LSS awareness and benefits
Furthermore, the results also indicate that the below factors were also lacking in
company2 but to a lesser degree compared to the four factors outlined above.
Strong link between LSS initiatives & strategic objectives of company
Effective communication
Support & encouragement from top management
Process to track & measure LSS projects performance
Open culture & team autonomy
LSS initiatives well integrated into the continuous improvement culture
Though employees of company2 believed more with the below factors compared
to company1, presence of these factors meant that these were inhibitors or
barriers to the success and sustainability of LSS.
Pressure to deliver results quickly
LSS methodology too extensive & time consuming
High implementation & training costs affecting success & sustainability
Employees view LSS as mere set of tools, techniques to solve problems
Also, employees from company2 believed less with the below factors suggesting
these were lacking but to a lesser degree, whereas employees of company1
believed they were present or met.

74
Adequate LSS training
LSS project selection & prioritisation
Allocation of adequate resources
High level of employee engagement and participation
Effective execution & project management
Employees of both companies believed that there was a lack in the HR rewards
and recognition system linking to LSS initiatives, which again is a barrier for
LSS success.
There is strong evidence from the results to suggest that all or majority of the
above outlined factors were met or present in company1, which are the enablers
for LSS success and sustainability. So, from the evidence it is clear that there
was a lack in most of the key factors that enable the success and sustainability
of LSS in company2, whereas these enabling factors were met or present in
company1. This would indicate why employees of company2 did not believe the
LSS initiatives were successful or sustained in their organisation and the
opposite for company1.
6.5 LSS top 10 critical success factors (CSFs)
This section attempts to answer the below research question by analysing the
survey results presented in the previous chapter.
Q4: How does the ranking of Top 10 Critical Success Factors (CSFs) that affect
the success of LSS initiatives compare between company1 and company2?

75
The results of the ranking of top 10 CSFs indicate that, there is broad consensus
between the views of employees of company1 and company2 with respect to the
top 4 and bottom 3 CSFs. However, the views differed slightly with respect to
the ranking of CSF5, 6 and 7.
Senior management commitment, involvement and support was ranked as the
most important CSF at the top by employees of both companies. Published
literature has highlighted the criticality of management commitment,
involvement and support to the introduction, success and sustainability of LSS
in organisations and the results of the ranking confirm this. This is consistent
with the findings from many other empirical studies on LSS CSFs, published in
the literature (eg. Laureani et al., 2012; Manville et al., 2012; Antony et al., 2002;
Coronado et al., 2002; Psychogios et al., 2012).
It is interesting to note that clear vision and long term plan for LSS linking
business strategy was ranked as the second most important CSF by employees
of both companies. The literature outlines the importance of establishing a clear
vision and long term plan linking to business strategy for the success and
sustainability of LSS (Dale, 2000), this finding contests the findings from
previous empirical study by Laureani et al (2012) which found organisation
culture as the second most important CSF. However, the finding from this study
is consistent with the findings from the study by Manville et al (2012).
From the results, organisation culture supporting change, and LSS awareness
and training were ranked as the third and fourth most important CSFs by

76
employees of both companies. These findings are in contrast with the findings
from previous empirical study by Laureani et al (2012) which found organisation
culture as the second most important CSF and LSS awareness and training was
not in the top 5 CSFs.
Another interesting finding from the study is that, employees of both companies
seem to place some weight on the importance of linking LSS initiatives with HR
reward and recognition system by ranking this as the 8th most important CSF.
While Henderson and Evans (2000) outlined the importance of this to the LSS
success and added this to the list of CSFs in their study, previous empirical
studies have found this to be one of the most least important CSFs.
6.6 Practical Implications
The results of this study have several practical implications that should be
beneficial to senior management, business owners, organisations and academics
in terms of getting a deeper understanding of the perceptions of employees on
LSS initiatives in services organisations.
In terms of academic contributions, this study adds to the existing literature on
LSS by way of confirmation of already published work regarding benefits of
LSS initiatives, factors that affect the success and sustainability of LSS
initiatives and critical success factors (CSFs) in both company1 and company2.
The key contribution this study makes to the literature is by way of providing a
framework for empirically testing the perceptions of employees and different

77
groups involved in the LSS initiatives on the different aspects of LSS initiatives
in their organisations. This study attempted to understand and assess the
perception of employees on various aspects of LSS initiatives in organisations
by gathering the collective views of all groups involved in the LSS initiatives
through empirical means. While this study only included two organisations in
the services sector, there is scope for other academics to adapt this framework to
expand the study to include more organisations in the services sector to achieve
generalizability. Also, even though this study was conducted on companies in
the services sector, other academics may explore to adapt this framework to
conduct similar studies in other sectors or across multiple sectors.
Furthermore, this study empirically tested the factors that affect the success and
sustainability of LSS initiatives and re-affirmed the critical role certain factors
such as: senior management commitment, involvement and support; Clear vision
and long term strategy; organisation culture etc., play in this regard.
In terms of managerial contributions, this study confirmed and stressed the
importance of senior management role in various facets of LSS implementation,
its success and sustainability. The study also highlighted the importance of
organisations and senior management establishing a clear vision and long term
strategy for LSS initiatives. This including other key findings from this research
may be of interest to senior management and organisations already practicing
LSS initiatives and others who are looking at introducing in their organisations.
Furthermore, the model used in the study could be useful for senior management
and organisations in terms of understanding how employees perceive or view the
78
performance and various aspects of LSS initiatives, which could help identify
the issue areas or areas that require further improvement, so senior management
can implement necessary interventions to correct or improve the problem areas.
The model used in this study can also enable organisations and senior
management to conduct a reality check to understand how well the LSS
initiatives are being viewed by various groups in the organisation.
6.7 Limitations of the research
This study has several limitations. The first limitation was the sample size. Two
multinational companies in the services sector in Ireland that are or were using
LSS initiatives and known to the researcher were selected and employees from
these two companies who have participated or involved in the LSS initiatives
were selected and invited to participate in the study. 54 employees from
company1 and 59 employees from company2 were invited to participate in the
online survey of which 38 (70%) employees from company1 and 45 (76%)
employees completed the survey, resulting in an overall response rate of 73%.
Considering the study only included a subset of employees who have
participated in LSS initiatives from two companies in the services sector in
Ireland, it should be noted that the findings from this study are only relevant to
the sample population and companies, and may not be relevant to other groups
of employees in the two companies, or other companies in the services sector
who were not included in the study. Hence, the findings from this study may not
be generalisable to the entire employment in services sector in Ireland. Also, the
79
sample size of the population (83 respondents) could also influence the statistical
strength of this research. Therefore, in order to increase the significance of the
findings, future research on a larger sample population is recommended
(Saunders et al., 2012).
Another limitation was the sampling method used for the study. For this research
a convenient sampling method was used meaning, companies and individuals
who were known to the author and easiest to include were selected to participate
in the research. Bryman and Bell (2007) argue that, though convenience
sampling is the cheapest and easiest to conduct and can provide interesting data,
it is the least reliable design due to limitations in generalisability and lack of
ability to ensure precision. As the study used a non-probability sampling method,
there was no system to ensure that everyone in the population had an equal
chance to be selected (McNabb, 2013). Therefore, characteristics of individuals
who were not chosen for the sample remain unknown. Also, it should be noted
that, characteristics of participants who took part in the study could differ from
the characteristics of individuals who did not wish to take part in the study
(Groves et al., 2008). It is recommended for future research to use probability
sampling in order to increase the significance of the findings that are
representative of the whole population and to increase generalisability.
This study used only quantitative methods through a self-report survey
questionnaire and hence is open for single source bias (Eisenhardt, 1989). The
quantitative method used was based on data collected from a self-administered
questionnaire developed by the researcher. The results from the data gathered

80
may have been limited due to responses bias (Groves et al., 2008). Participants
who volunteered to take part in the study may have a stronger interest in the LSS
topic than those who did not take part in the study. Also, the circumstances of
the participant while answering the survey questionnaire could have influenced
the results. While completing the survey questionnaire at work, answers may
have been influenced by the presence of partakers’ managers and colleagues
which could have prevented participants from answering questions honestly.
Also, the survey results were open to the interpretation and bias of the researcher.
The research was based on two companies in the services sector and hence the
generalisation of results may be questionable or may not be possible.
7. Conclusion
The main purpose of this chapter is to examine the research questions and
determine the conclusions reached as part of this research. The overall objective
of this research is to investigate the perceptions of employees from the two
organisations in the services sector in Ireland on the performance, benefits,
success and sustainability factors and CSFs of LSS initiatives in their
organisations. In order to answer the main research question, four research
questions were set out for this study as outlined in chapter 3.

81
The study used quantitative methods to gather employee perceptions on the
above outlined aspects of LSS from employees who have participated or
involved with LSS initiatives from two organisations in the services sector in
Ireland. The study compared the views of employees between the two companies
and found significant differences in the areas of: performance of LSS initiatives;
and factors that affect success and sustainability of LSS. The study also
identified the specific areas where the views differed significantly between the
two companies.
There is a strong evidence to suggest that LSS initiatives were largely viewed as
unsuccessful and not sustained by employees of company2, while it’s largely
viewed successful and sustained by employees of company1. Furthermore, there
was evidence to suggest that employees of company2 believe process
improvement is not given high importance and expected level of benefits were
not realised from LSS initiatives. Whereas, the views of employees of company1
were opposite to that of company2. While it is imperative that process
improvement efforts are given high importance in order for business and process
improvement concepts like LSS to succeed, not realising expected benefits from
change efforts like LSS may result in organisations abandoning the change
efforts (Naslund, 2008).
Interestingly, both company employees showed a preference to continue using
LSS methods and tools in their process improvement efforts, irrespective of if

82
LSS is successful or sustained in the organisation. This indicates that a subset of
employees in company2 view LSS favourably even though the general
consensus from company2 being LSS largely unsuccessful. Furthermore,
company1 did not seem to use any other process improvement methods and used
LSS as the preferred method for process improvements. Whereas, company2 did
seem to use other methodologies and LSS was not the preferred methodology.
The views of both company employees were more or less aligned with respect
to the benefits of LSS initiatives with the exception of realisation of cost
reduction, wherein company2 employees believed cost reduction was realised
more than company1. However, the level of agreement to the benefits of LSS
from both companies was relatively low.
The views on the factors that affect success and sustainability of LSS largely
differed between the two companies with significant differences in some key
areas. There is strong evidence to suggest that there was a clear lack of some of
the key enablers for LSS success in company2 such as: senior management
commitment & involvement; clear vision & long term strategy; need for
introducing LSS established from start; LSS awareness and benefits. Whereas,
these key enablers were present in company1. Absence or lack of these key
enabling factors in company2, suggest that the LSS initiatives may have failed
or have not been sustained which justifies the view from employees of company2
that the LSS initiatives were not successful and not sustained. On contrary, all

83
the key enabling factors were present or met in company1 which justifies their
view that LSS initiatives are successful and have been sustained.
With respect to ranking of the top 10 CSFs, the views from both company
employees were well aligned for the top 4 CSFs: Senior Management
Commitment, participation and support; a clear vision and long term plan for
LSS initiatives linking to business strategy; Organization culture supporting
change; and LSS awareness, training & education. One interesting finding is,
ranking of a clear vision and long term plan for LSS initiatives linking to
business strategy as the 2nd most important CSF as none of the previous studies
on CSFs ranked this factor within the top 5 CSFs.
So, from employees’ perspective the above top 4 CSFs were the most important
factors for the success & sustainability of LSS initiatives. But, in reality most of
these key factors were either absent or lacking in company2 but present in
company1. As outlined in the literature, LSS efforts would fail if one or more of
the CSFs are not met or lacking. The perceptions of employees from company1
and company2 affirm the theory outlined in the literature.
In summary, this research attempted to empirically investigate the employee
perceptions on LSS initiatives and validate these against the literature. This
objective was met and the perceptions of employees from both companies tie in
with the published literature in terms of validating the theory against reality.

84
8. Recommendations for further research
As stated earlier, most of the empirical studies to date on LSS have focussed on
identifying the CSFs in organisations across different sectors. Majority of these
studies identified the CSFs based on what factors were considered as the most
important for the success of LSS initiatives, either by a particular group or across
specific groups of employees in organisations. While there are many qualitative
studies using a case study method that have looked at the implementation of LSS,
barriers during implementation, success factors and experiences at a single
company across different sectors, there have been no empirical studies
conducted to understand the views of employees or various groups that are
normally involved with LSS initiatives on various aspects of LSS in

85
organisations. This study made an attempt to empirically test the perceptions of
employees on the performance, benefits, factors that affect success and
sustainability and top 10 CSFs in two services organisations in Ireland.
The study used quantitative methods to gather employee perceptions on the
above outlined aspects of LSS from employees who have participated or
involved with LSS initiatives from two organisations in the services sector in
Ireland. The study compared the views of employees between the two companies
and found significant differences in the areas of: performance of LSS initiatives;
and factors that affect success and sustainability of LSS. The study also
identified the specific areas where the views differed significantly between the
two companies. The study did not look at the views of senior management or
SLT from the two companies; hence the findings represent only one side of the
coin (employees’ views). So, future research can look at gathering views of
senior management as well using qualitative methods such as semi-structured
interviews to get a deeper insight (Yin, 1994; Saunders et al., 2012) or mixed
method approach in order to avoid single source bias and improve validity
(Eisenhardt, 1989) to get a more rounded view on LSS initiatives in
organisations.
While the collected data for this study had scope for further analysis such as
comparing the views by gender, age, LSS involvement type etc., within the
company and as well as between the companies, this analysis was not performed
as this was deemed not necessary for this study. However, future research can
leverage the data and expand the study to include further analysis by different
86
groups or factors to get an insight into if the views on LSS initiatives differ
between these groups and attempt to establish why.
Furthermore, the questionnaire developed for this study has the provision for
collection of other important data such as: high level of importance for process
improvement; LSS expert team (BB/MBB) based in-house or external; number
of dedicated LSS experts, which may influence the outcome of LSS initiatives
in organisations. Future research may attempt to establish if and how these
factors influence the outcome of LSS initiatives in organisations.
Finally, this study was conducted on employees from two companies in the
services sector in Ireland, findings may not be generalised for the entire services
sector. So, future research can attempt to expand the study to include a larger
sample of companies in the services sector in order to generalise the findings
across the sector. Other potential future research option is to replicate this study
or adapt the questionnaire used in this study to assess employee perceptions in
organisations in other sectors or across multiple different sectors.

87
9. References
Achanga, P.,Shehab, S., Roy, R. andNelder, G. (2006) ‘Critical success factors for lean
implementation within SMEs’. Journal of Manufacturing Technology Management,
17 (4): 460-71.
Alken, C., Galper, D. & Keller, S. (2011) 'Winning hearts and minds: The secrets of
sustaining change'. Mckinsey Quarterly, 1: 47-54.
Antony, J. and Banuelas, R. (2002) ‘Key ingredients for the effective implementation
of Six Sigma program’. Measuring Business Excellence, 6(4): 20-7.
Antony, J. (2006) ‘Six Sigma for service processes’. Business Process Management
Journal, 12 (2): 234-48.
Antony, J., Antony, F. J. and Kumar, M. (2007) ‘Six sigma in service organisations’.
International Journal of Quality & Reliability Management, 24 (3): 294-311.
Arfmann, D., Federico and Barbe, G. T. (2014) ‘The Value of Lean in the Service
Sector: A Critique of Theory & Practice’. International Journal of Business and Social
Science, 5 (2): 18-24.
Bell, J. (2010) Doing Your Research Project (5th ed). Maidenhead: Open University
Press.
Benz, C. R. and Newman, I. (2008) Mixed methods research: exploring the interactive
continuum, SIU Press.
Blumberg, B., Cooper, D.R. & Schindler, P.S. (2008) Business Research Methods (2nd
ed). Maindendead: McGraw-Hill Education.

88
Bryman, A. & Bell, E. (2007) Business Research Methods (2nd ed). New York: Oxford
University Press.
Buchanan, D., Fitzgerald, L., Ketley, D., Gollop, R., Jones, J., Lamont, S., Neath, A., &
Whitby, E. (2005) 'No going back: A review of the literature on sustaining
organizational change'. International Journal Of Management Reviews, 7 (3): 189-
205.
Burgess, N. and Radnor, Z. (2013) ‘Evaluating Lean in healthcare’. International
Journal of Health Care Quality Assurance, 26 (3): 220-235.
Chakrabarty, A. and Tan, K. C. (2007) ‘The Current State of Six Sigma Application in
Services’. Managing Service Quality, 17 (2), 194-208.
Chakraborty, A. & Tan, K. C. (2012) ‘Case study analysis of Six Sigma implementation
in service organisations’. Business Process Management Journal, 18 (6): 992-101.
Chalmers, A. F. (2013) What is this thing called science?, Hackett Publishing.
Coronado, R.B. and Antony, J. (2002) ‘Critical success factors for the successful
implementation of Six Sigma projects in organizations’. The TQM Magazine, 14 (2):
92-9.
Dale, B. (2000) ‘Marginalisation of quality: is there a case to answer’. The TQM
Magazine, 12 (4): 266-74.
Delgado, C., Ferreira, M. & Branco, M. (2010) ‘The implementation of lean Six Sigma
in financial services organizations’. Journal of Manufacturing Technology
Management, 21 (4): 512–523
Desai, D. A., Antony, J. & Patel, M. B. (2012) ‘An assessment of the critical success
factors for Six Sigma implementation in Indian industries’. International Journal of
Productivity and Performance Management, 61 (4): 26-444.
Eisenhardt, K. M. & Martin, J. A. (2000) ‘Dynamic capabilities: what are they?’.
Strategic Management Journal, 21: 1105-1121.
Emiliani, M. L. (1998) ‘Lean behaviours’. Management Decision, 36 (9): 615-631.
Fine, D., Hansen, M. & Roggenhofer, S. (2009) 'From lean to lasting: Making
operational improvements stick'. Mckinsey Quarterly, 1: 109-117.
Fink, A. (2009) How to Conduct Surveys (4th ed). Thousand Oaks, CA: Sage.
Fisher, C. (2007) Researching and Writing a Dissertation: A Guidebook for
Business Students (2nd ed). England: Pearson Education Ltd.
89
Flinchbaugh, J. and Carlino, A (2006) ‘The hitchhiker’s guide to lean: lessons from
the road’. SME.
Fowler, F. J. (2002) Survey Research Methods (3rd ed). London: Sage Publications.
George, M. L. (2003) Lean Six Sigma for Service – How to Use Lean Speed and Six
Sigma Quality to Improve Services and Transactions. New York: McGraw-Hill.
Groves, R. M. and Peytcheva, E. (2008) ‘The impact of nonresponse rates on nonresponse bias’. Public Opinion Quarterly, 72 (2): 167-189. Guarraia, P., Carey, G., Corbett, A. & Neuhaus. K. (2008) ‘How to get the most from Lean Six Sigma’. Available from: http://www.bain.com/Images/BB_Lean%20Six%20Sigma%20in%20Services_ALL%20pages.pdf [Accessed 04 February 2015].
Habidin, N. F. & Yusof, S. M. (2013) ‘Critical success factors of Lean Six Sigma for
the Malaysian automotive industry’. International Journal of Lean Six Sigma, 4 (1):
60-82.
Hair, J. F., Black, W. C., Babin, B. J. & Anderson, R. E. (2010) Multivariate analyses
(7th ed). Upper Saddle River NJ: Prentice Hall.
Heckl, D., Moormann, J. & Rosemann, M. (2010) ‘Uptake and success factors of
Six Sigma in the financial services industry’. Business Process Management
Journal, 16 (3): 436–472.
Henderson, K. and Evans, J. (2000) ‘Successful implementation of Six Sigma:
benchmarking General Electric Company’. Benchmarking and International
Journal, 7 (4): 260-81.
Ingle, S. and Roe, W. (2001) ‘Six Sigma, black belt implementation’. The TQM
Magazine, 13 (4): 273-80.
De Koning, H., Does, R. and Bisgaard, S. (2008) ‘Lean Six Sigma in financial services’.
International Journal of Six Sigma and Competitive Advantage, 4 (1): 1-17.
Kwak, Y. H. and Anbari, F. T. (2006) ‘Benefits, obstacles, and future of Six Sigma
approach’. Technovation, 26 (5/6): 708-15.
Laureani, A. & Antony, J. (2012) ‘Critical success factors for the effective
implementation of Lean Sigma: Results from an empirical study and agenda for
future research’. International Journal of Lean Six Sigma, 3 (4): 274–283.
90
Leyer, M. and Moormann, J. (2014) 'How lean are financial service companies
really? Empirical evidence from a large scale study in Germany'. International
Journal of Operations & Production Management, 34 (11): 1366–1388.
Manville, G., Greatbanks, R., Krishnasamy, R. & Parker, D. W. (2012) ‘Critical
success factors for Lean Six Sigma programmes: a view from middle
management’. International Journal of Quality & Reliability Management, 29 (1):
7–20.
Martens, S. L. (2001) ‘Operationally deploying Six Sigma’. Annual Quality
Congress, 55: 751-5.
McNabb, D. E. (2013) Research Methods in Public Administration and Non-profit
Management: Quantitative and Qualitative Approaches (3rd ed). New York: M. E.
Sharpe Inc.
Mitchell, V. (1996) ‘Assessing the reliability and validity of questionnaires: An
empirical example’. Journal of Applied Management Studies, 5 (2): 199-207.
Naslund, D. (2008) ‘Lean, six sigma and lean sigma: fads or real process improvement
methods?’. Business Process Management Journal, 14 (3): 269–287.
Neuman, W. L. (2003) Social Research Methods: Qualitative and Quantitative
Approaches (5th ed). Harlow: Pearson Education.
Pallant, J (2013) SPSS: Survival Manual (5th ed). Berkshire: McGraw Hill.
Pande, P.S., Neuman, R. and Cavanagh, R. (2000) The Six Sigma Way: How GE,
Motorola and Other Top Companies Are Honing Their Performance. New York, NY:
McGraw-Hill Professional.
Pay, R. (2008) ‘Everybody’s jumping on the lean bandwagon, but many are being taken for a ride – lean might not always produce the expected benefits and here’s why’. Available from: http://www.industryweek.com/companies-amp-executives/everybodys-jumping-lean-bandwagon-many-are-being-taken-ride [Accessed 04 February 2015].
Psychogios, A. G., Atanasovski, J. & Tsironis, L. K. (2012) ‘Lean Six Sigma in a service
context: A multi‐factor application approach in the telecommunications
industry’. International Journal of Quality & Reliability Management, 29 (1): 122–139.
Quinlan, C. (2011) Business Research Methods. Hampshire: South Western Cengage
Learning.
91
Qualitative Research Consultants Association (2014) ‘When to Use Qualitative
Research’. Available from: http://www.qrca.org/?page=whentouseqr [Accessed 04
February 2015].
Radnor, Z. (2012) ‘Why Lean Matters’. Available from: http://www.aimresearch.org/uploads/file/Publications/Executive%20Briefings%202/AIM_Lean_EB_FINAL.pdf [Accessed 07 February 2015]. Rockart, J. F. (1979) ‘Chief executives define their own data needs’. Harvard Business Review, 57 (2): 238-41. Rungasamy, S., Antony, J. & Ghosh, S. (2002) ‘Critical success factors for SPC implementation’. The TQM Magazine, 14 (4): 217-24. Salah, S., Rahim, A. and Carretero, J. A. (2010) ‘The integration of Six Sigma and lean management’. International Journal of Lean Six Sigma, 1 (3): 249–274. Saunders, M., Lewis, P. & Thornhill, A. (2012) Research Methods for Business Students (6th ed). Essex: Pearson. Sharma, S & Chetiya A. R. (2012) ‘An analysis of critical success factors for Six Sigma
implementation’. Asian Journal on Quality, 13 (3): 294-308. Snee, R.D. (1999) ‘Why should statisticians pay attention to Six Sigma?’. Quality Progress, 32(9): 100-3. Snee, R. D. (2010) ‘Lean Six Sigma – getting better all the time’. International Journal of Lean Six Sigma, 1(1): 9-29. Vargo, S. L. and Lusch, R. F. (2004) ‘The four service marketing myths remnants of a goods-based, manufacturing model’. Journal of Service Research, 6 (4): 324-335. Womack, J.P. & Jones, D.T. (1996) Lean Thinking. New York, NY: Simon & Schuster Yin, R. K. (1994) Case Study Research: Design and Methods (2nd ed). Thousand Oaks,
CA: Sage.
Yin, R. K. (2003) Applications of Case Study Research (2nd ed). Thousand Oaks, CA: Sage.
Zu, X., Robbins, T.L. & Fredendall, L.D. (2010). ‘Mapping the critical links between organizational culture and TQM/Six Sigma practices’. International Journal of Production Economics, 123 (1): 86-106.
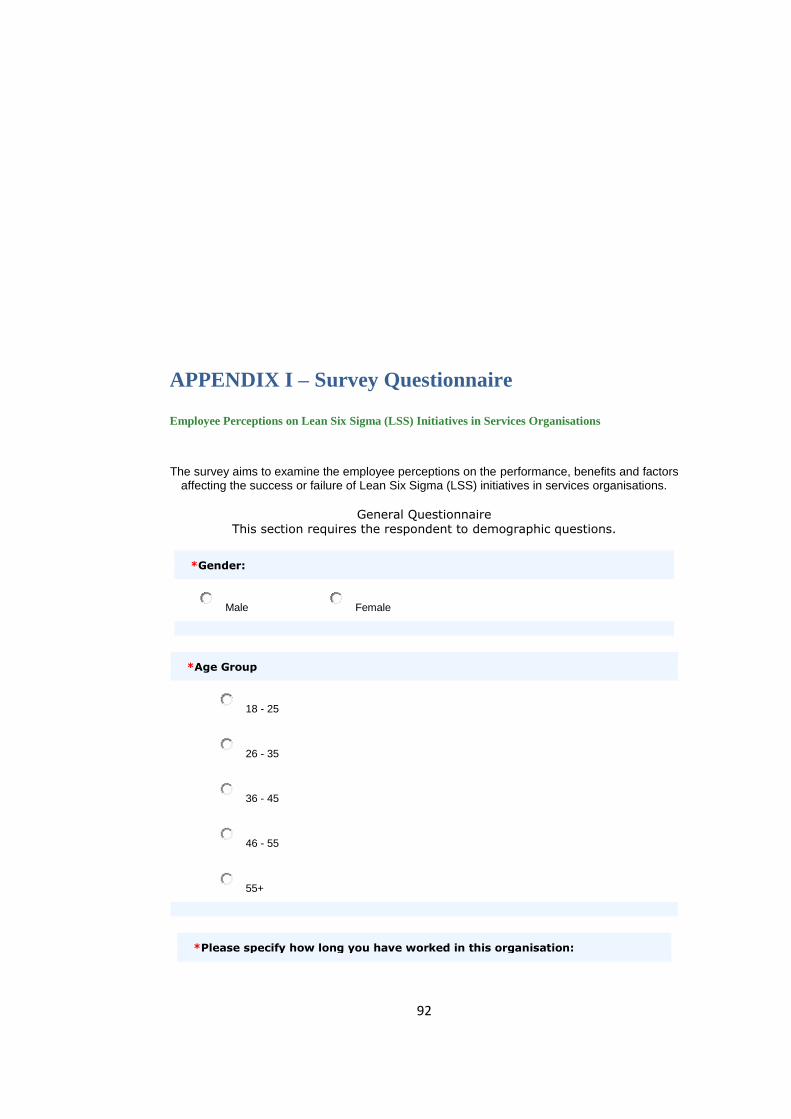
92
APPENDIX I – Survey Questionnaire
Employee Perceptions on Lean Six Sigma (LSS) Initiatives in Services Organisations
The survey aims to examine the employee perceptions on the performance, benefits and factors
affecting the success or failure of Lean Six Sigma (LSS) initiatives in services organisations.
General Questionnaire
This section requires the respondent to demographic questions.
*Gender:
Male Female
*Age Group
18 - 25
26 - 35
36 - 45
46 - 55
55+
*Please specify how long you have worked in this organisation:

93
0 - 1 year
2 - 3 years
4 - 6 years
7 - 9 years
10+ years
*Number of years your organisation was/has been using LSS methodology?
0 - 1 year
2 - 4 years
5 - 7 years
8 - 10 years
10+ years
*Does your organisation use any other process improvement methodology?
Yes
No
Don't Know
*Is LSS the preferred methodology for process improvements in your organisation?
Yes

94
No
Don't Know
*Is/was LSS expertise (core LSS excellence team) based in-house or provided by a third party vendor?
In-House
Third party vendor (contracted)
*Number of dedicated full time LSS expert (Black Belt/Master Black Belt) resources at your organisation:
1 - 2
3 - 4
5 - 6
6+
None
*Your involvement with LSS initiatives in your organisation
Participated in LSS training only
Participated in LSS projects
Lead/Managed one or more LSS Projects
LSS Expert - Coached and Trained employees in LSS (BB/MBB)
LSS Champion/Project Sponsor

95
LSS (Lean Six Sigma) Initiatives Summary
Employee beliefs on performance of LSS Initiatives in the organisation
*Please indicate the extent to which you agree/disagree with the following (on a scale of Strongly Disagree - Strongly Agree): Do you believe:
Strongly
Disagree Disagree
Partly
Disagree
Neither
Agree/Nor
Disagree
Partly
Agree Agree
Strongly
Agree
Process improvement is
given high importance in the
organisation?
LSS initiatives were/are
successful in your organisation?
LSS initiatives
have been and will be sustained
in your organisation?
LSS initiatives have provided the expected level of
benefits to the organisation?
You use and intend to use the LSS methodology
or tools in process
improvements, irrespective of
LSS is successful or sustained at
the organisational level?
The organisation would have/will benefit more by
continuing & sustaining the
LSS initiatives?

96
LSS (Lean Six Sigma) Benefits
Employee beliefs on LSS benefits to the organisation
*Please indicate your level of agreement with the following statements with respect to the LSS initiatives in your organisation (On a scale of Strongly Disagree - Strongly Agree): Do you believe:
Strongly
Disagree Disagree
Partly
Disagree
Neither
Agree/Nor
Disagree
Partly
Agree Agree
Strongly
Agree
LSS has/had increased the
efficiency of internal
processes in the
organisation?
LSS has/had been very
effective in reducing waste
in the processes?
LSS has/had considerably
reduced process lead
times & cycle times?
The organisation
is/was able to reduce costs considerably as a result of
LSS improvements?
LSS has/had helped the
organisation to be more
customer focussed?
LSS improvements
have/had resulted in
efficient
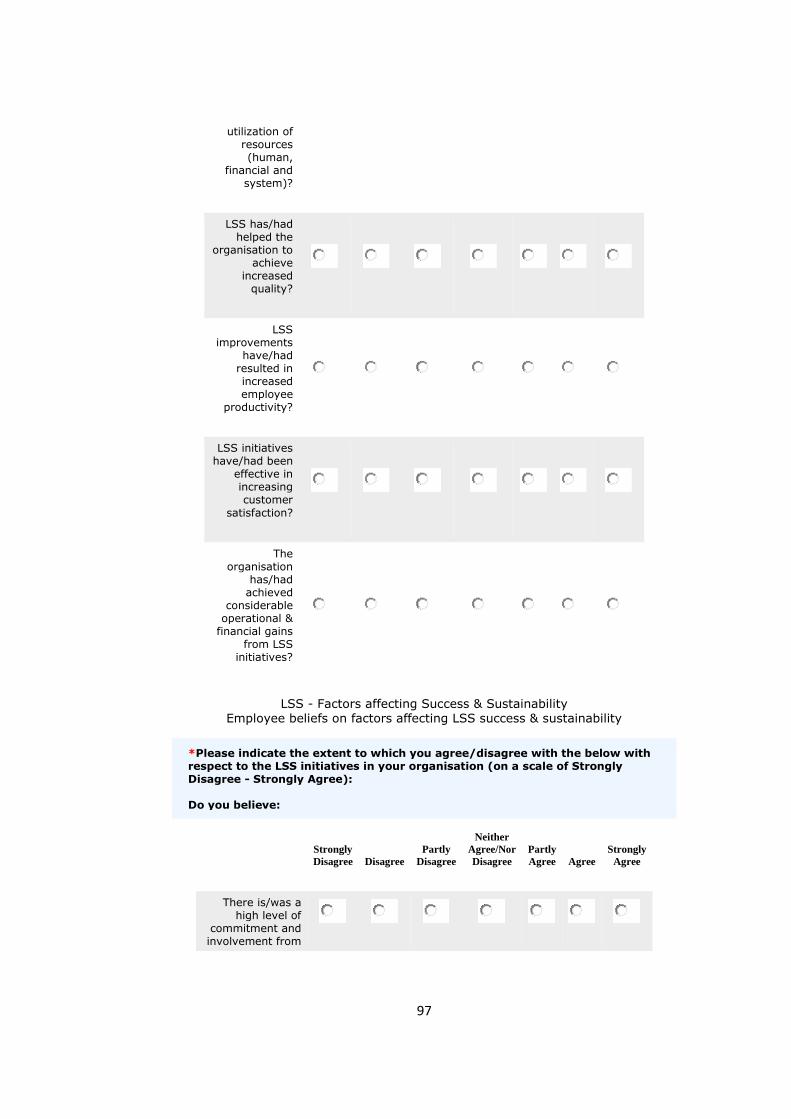
97
utilization of resources (human,
financial and system)?
LSS has/had helped the
organisation to achieve
increased quality?
LSS improvements
have/had resulted in increased employee
productivity?
LSS initiatives have/had been
effective in increasing customer
satisfaction?
The organisation
has/had achieved
considerable operational &
financial gains from LSS
initiatives?
LSS - Factors affecting Success & Sustainability Employee beliefs on factors affecting LSS success & sustainability
*Please indicate the extent to which you agree/disagree with the below with respect to the LSS initiatives in your organisation (on a scale of Strongly Disagree - Strongly Agree): Do you believe:
Strongly
Disagree Disagree
Partly
Disagree
Neither
Agree/Nor
Disagree
Partly
Agree Agree
Strongly
Agree
There is/was a high level of
commitment and involvement from

98
top management in the LSS initiatives?
There is/was a clear vision and
long term strategy for
introducing LSS established by top
management?
The need for introducing LSS
clearly established and
communicated from start?
There is/was adequate LSS
training provided to employees?
The projects are/were selected
based on
suitability to LSS and prioritised
properly?
There is/was a strong link
between LSS initiatives/projects
and strategic objectives of the
company?
Adequate resources (financial,
technical & human) are/were
provided for the LSS initiatives and
projects?
The organisation culture embraces
and supports change?

99
There is/was effective
communication by management on
the LSS initiatives?
The senior management
do/did actively encourage and
support employees to
participate in LSS initiatives?
The goals and timelines set for
LSS projects are/were realistic?
You are under pressure to
deliver results quickly for LSS
projects?
There is/was a high level of
employee engagement and participation on LSS initiatives?
The LSS methodology is
too extensive and time consuming?
The employees do/did view LSS as a mere set of
tools, techniques and practices to solve problems?
The management do/did create a
high level of awareness of LSS and the benefits it
can bring to organisation?

100
There is/was a well-defined process for
tracking and measuring the
performance of LSS projects?
There is/was effective
execution and project
management of LSS projects?
The selection process of
candidates to participate in LSS
training and projects is/was
fair and effective?
The LSS expert help & coaching
is/was sufficiently
and readily available for LSS
projects?
There is/was a well-defined HR
rewards and recognition
system linking to LSS initiatives?
The management have/had created a open culture for LSS initiatives and
provided team autonomy?
High implementation
and LSS training costs may have
caused LSS initiatives to fail
or difficult to sustain in your organisation?

101
There is/was a well-established
continuous improvement culture in the organisation?
The LSS initiatives are/were well
integrated into the continuous
improvement culture of the organisation?
LSS Critical Success Factors - Ranking
Rank the Top 10 critical success factors (CSFs) for LSS Initiatives in Organisations.
*Please rank the below 10 Critical Success Factors (CSFs) that contribute to the success and sustainability of LSS Initiatives in the decreasing order of importance (Most Important at the top - Least important at the bottom): Click on an item in the list on the left, starting with your highest ranking item, moving through to your lowest ranking item.
Your choices:
Senior Management Commitment, participation and support
Organization culture supporting change
A clear vision and long term plan for LSS initiatives linking to business strategy
LSS aw areness, training & education
Sufficient & clear allocation of resources (f inancial, human & systems)
Linking LSS initiatives w ith HR rew ards and recognition
LSS projects selection & prioritization
An effective communication plan
Tracking and review of LSS projects & performance
LSS initiatives embedded & integrated w ith continuous improvement culture
Your ranking:
1:
2:
3:
4:
5:
6:
7:
8:
9:
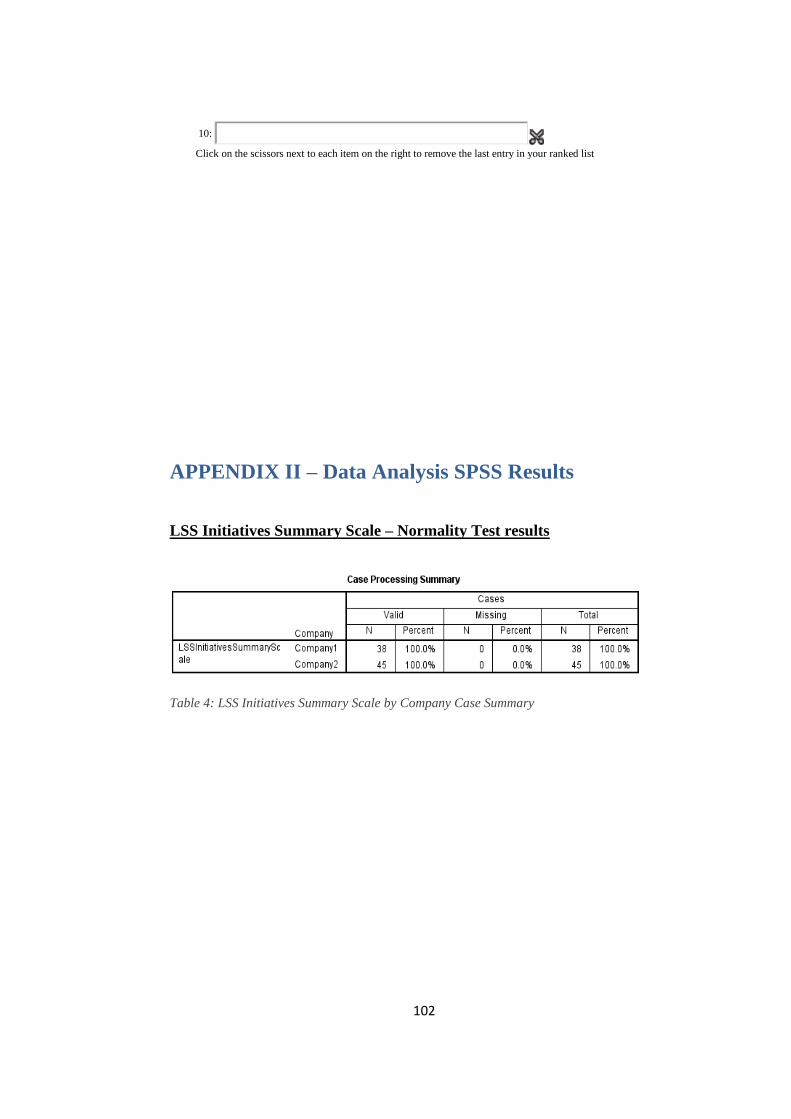
102
10:
Click on the scissors next to each item on the right to remove the last entry in your ranked list
APPENDIX II – Data Analysis SPSS Results
LSS Initiatives Summary Scale – Normality Test results
Table 4: LSS Initiatives Summary Scale by Company Case Summary

103
Figure 5: LSS Initiatives Summary Normality
Test Company1
Figure 6: LSS Initiatives Summary
Normality Test Company2
Table 5: LSS Initiatives Summary Scale by Company Descriptive Statistics

104
LSS Initiatives Summary Scale – Differences by items
Table 9: Mann-Whitney Test Mean Ranks for LSS Initiatives Summary Scale Items
LSS Benefits Scale – Normality Test Results
Table 14: LSS Benefits Scale by Company Normality Test Case Summary

105
Figure 8: LSS Benefits Normality Test
Company1
Figure 9: LSS Benefits Normality Test
Company2

106
Table 15: LSS Benefits Scale by Company Descriptive Statistics
LSS Benefits Scale – Differences by items
Table 19: Mann-Whitney Test Mean Ranks for LSS Benefits Scale Items
LSS Success and Sustain Factors Scale – Normality Test Results
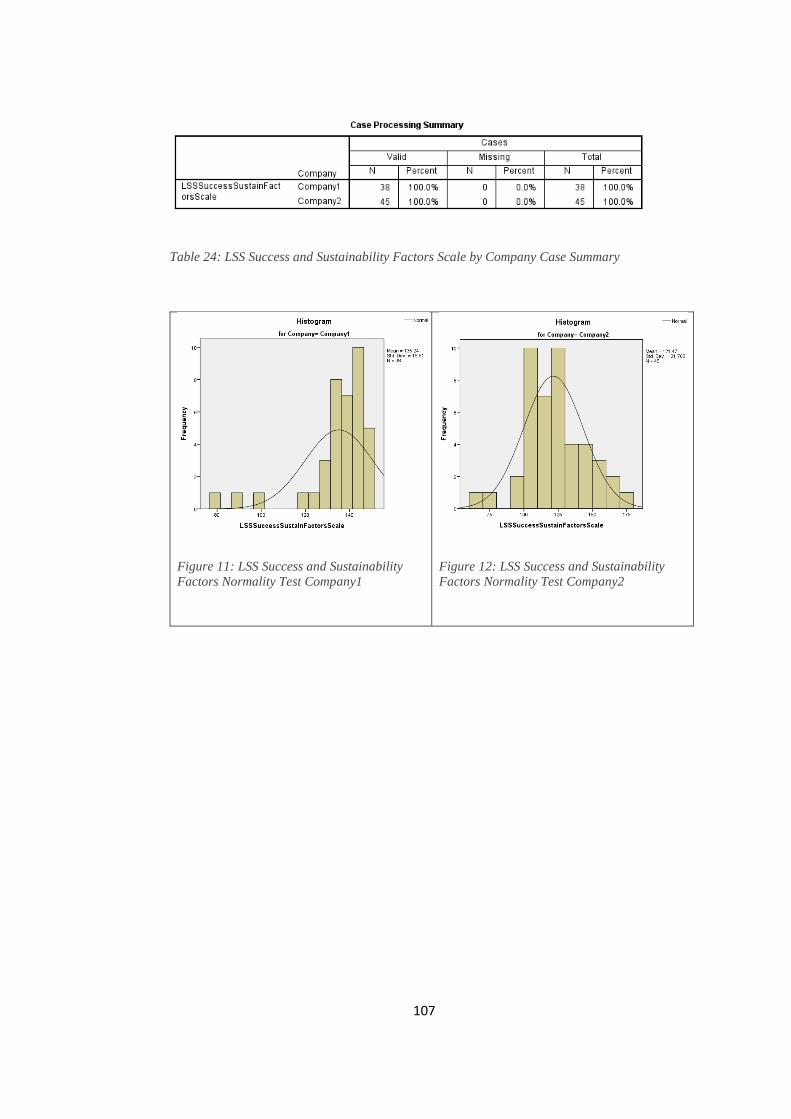
107
Table 24: LSS Success and Sustainability Factors Scale by Company Case Summary
Figure 11: LSS Success and Sustainability
Factors Normality Test Company1
Figure 12: LSS Success and Sustainability
Factors Normality Test Company2
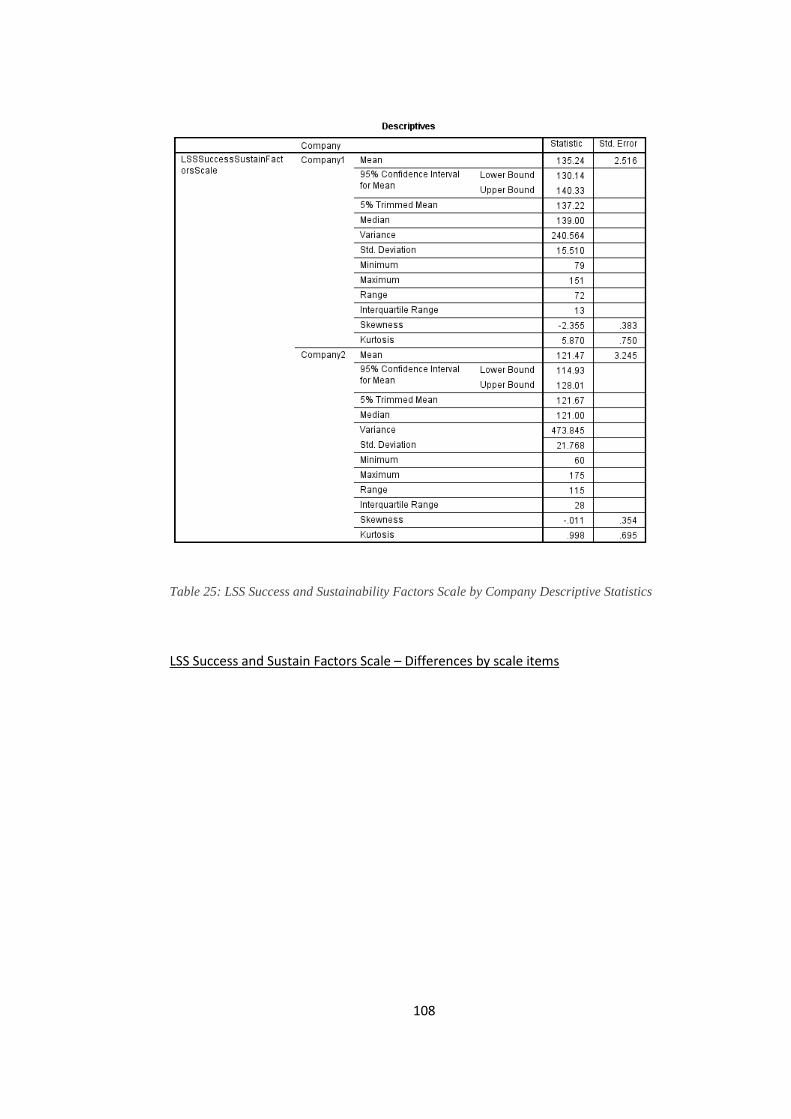
108
Table 25: LSS Success and Sustainability Factors Scale by Company Descriptive Statistics
LSS Success and Sustain Factors Scale – Differences by scale items
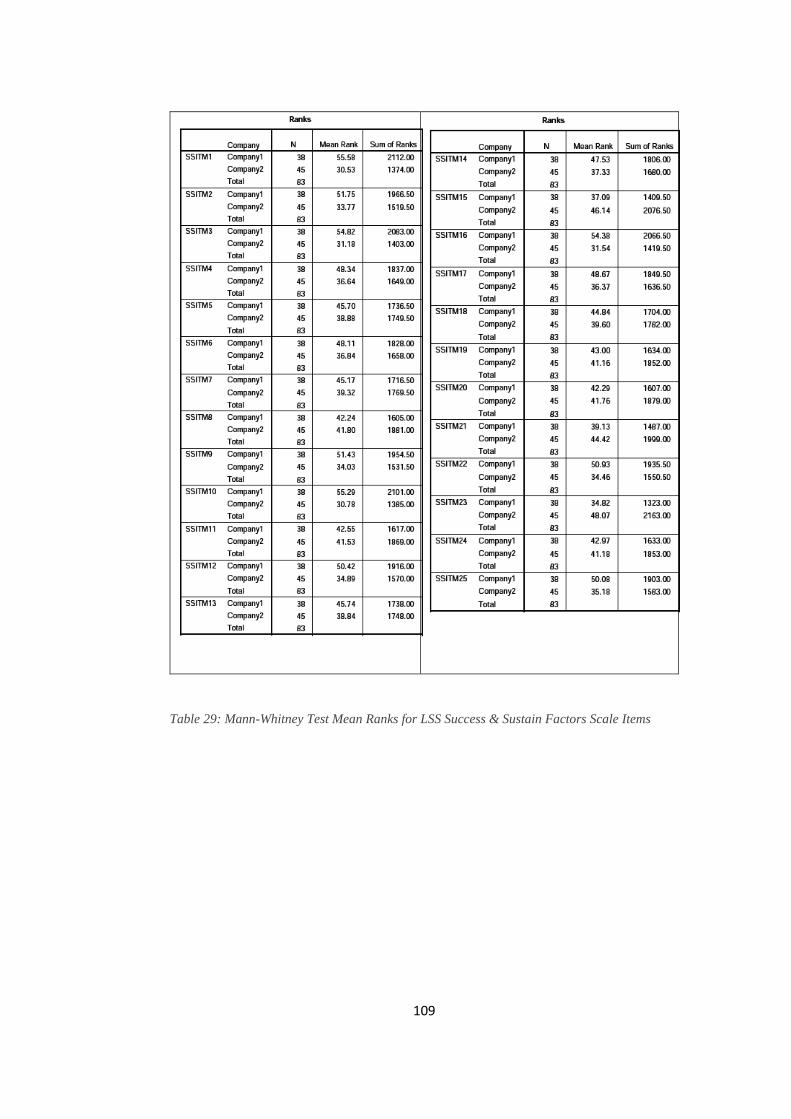
109
Table 29: Mann-Whitney Test Mean Ranks for LSS Success & Sustain Factors Scale Items

110
Table 30: LSS Success and Sustain Factors Scale Items Mann-Whitney Test Statistics