Embed Size (px)
Citation preview

DISSECTING THE EFFECTS OF
SWEET TASTANTS IN THE HUMAN
GUT-BRAIN AXIS
A thesis submitted to the University of Manchester for the
degree of Doctor of Philosophy in the Faculty of Medical
and Human Sciences
2013
Charlotte Elizabeth Bryant
School of Medicine
2
TABLE OF CONTENTS
TABLE OF CONTENTS .................................................................................................. 2
LIST OF FIGURES .......................................................................................................... 8
LIST OF TABLES .......................................................................................................... 11
ABBREVIATIONS ........................................................................................................ 12
ABSTRACT .................................................................................................................... 14
DECLARATION ............................................................................................................ 15
COPYRIGHT STATEMENT ......................................................................................... 15
ACKNOWLEDGMENTS .............................................................................................. 16
PREFACE ....................................................................................................................... 17
CHAPTER 1
Literature Review
1.1 Introduction ........................................................................................................ 18
1.2 Feeding behaviour.............................................................................................. 19
1.2.1 Appetite ....................................................................................................... 20
1.2.2 Satiation and satiety .................................................................................... 21
1.3 Factors influencing appetite and energy intake ................................................. 22
1.3.1 Oral factors .................................................................................................. 22
1.3.1.1 Sugars, non-nutritive sweeteners and sweet taste receptors..................... 23
1.3.2 Gastric factors ............................................................................................. 26
1.3.3 Intestinal factors, absorption and post-absorptive mechanisms .................. 28
1.3.4 Signals arising from the gastrointestinal tract ............................................. 29
1.3.4.1 GLP-1 ....................................................................................................... 30
1.3.4.2 PYY .......................................................................................................... 32
1.3.4.3 Other gut hormones .................................................................................. 32
1.4 Does the gut ‘taste’ sweetness? ......................................................................... 34
3
1.4.1 Sweet taste receptors in the intestine: cell and animal models ................... 35
1.4.2 Effects of sugars and non-nutritive sweeteners on the secretion of
gastrointestinal hormones and appetite: evidence in humans .............................. 37
1.4.2.1 Potential significance of non-nutritive sweeteners to diet and health: a
conflicting and confused landscape ..................................................................... 40
1.5 Gut-brain communication and the pathways relating to appetite and food intake
................................................................................................................................. 43
1.5.1 Innervation of the gastrointestinal tract and interaction with enteroendocrine
cells ...................................................................................................................... 45
1.5.2 Areas of the brain involved in appetite and energy intake control ............. 47
1.5.2.1 Hypothalamus .......................................................................................... 47
1.5.2.2 Brainstem ................................................................................................. 47
1.5.3 Signalling and central control of food intake .............................................. 48
1.5.3.1 Hedonic mechanisms affecting appetite and energy intake ..................... 50
1.6 Methodologies used to study feeding behaviour ............................................... 50
1.6.1 Functional brain imaging ............................................................................ 51
1.7 Summary and aims............................................................................................. 54
CHAPTER 2
General Methods
2.1 Ethical Approval ................................................................................................ 57
2.2 Participants......................................................................................................... 57
2.2.1 General inclusion criteria ............................................................................ 57
2.2.2 Screening ..................................................................................................... 58
2.2.2.1 Anthropometry ......................................................................................... 58
2.2.2.2 Three factor eating questionnaire ............................................................. 59
2.3 Experimental protocols ...................................................................................... 60
2.3.1 Pre-study standardisation and fasting.......................................................... 60
2.3.1.2 Female participants .................................................................................. 61
2.3.2 Subjective appetite and taste ratings ........................................................... 61
2.3.3 Gastric emptying - 13
C breath test ............................................................... 62
2.3.4 Blood sampling: collection and processing................................................. 64
4
2.3.4.1 Blood glucose ........................................................................................... 65
2.4 Statistical analysis .............................................................................................. 65
CHAPTER 3
The role of the gut sweet taste receptor in mediating the responses to glucose: an
exploration using lactisole
3.1 Introduction ........................................................................................................ 67
3.2 Method ............................................................................................................... 69
3.2.1 Design ......................................................................................................... 69
3.2.2 Participants .................................................................................................. 69
3.2.3 Experimental protocol ................................................................................. 69
3.2.4 Blood glucose .............................................................................................. 73
3.2.5 Assessment of energy intake ....................................................................... 73
3.2.5.1 Ad-libitum test meal composition............................................................. 73
3.2.5.2 Test meal preparation and energy intake calculation ............................... 74
3.2.6 Materials and test foods .............................................................................. 75
3.2.7 Statistical analysis ....................................................................................... 75
3.3 Results -Part I .................................................................................................... 76
3.3.1 Participants .................................................................................................. 76
3.3.2 Visual analogue scales - taste ...................................................................... 76
3.4 Results -Part II................................................................................................... 78
3.4.1 Participants .................................................................................................. 78
3.4.2 Gastric emptying ......................................................................................... 78
3.4.3 Blood glucose .............................................................................................. 80
3.4.4 Appetite perceptions.................................................................................... 81
3.4.5 Test meal intake .......................................................................................... 83
3.5 Discussion Part I and II ..................................................................................... 84
3.6 Experimental protocol - Part III ........................................................................ 89
3.6.1 Gut hormone concentrations ....................................................................... 89
3.6.2 Statistical Analysis ...................................................................................... 90
3.7 Results- Part III ................................................................................................. 92
5
3.7.1 Participants .................................................................................................. 92
3.7.2 Gastric emptying ......................................................................................... 93
3.7.3 Blood glucose .............................................................................................. 95
3.7.4 Gut hormone concentrations ....................................................................... 96
3.7.5 Appetite perceptions.................................................................................. 102
3.7.6 Test meal intake ........................................................................................ 104
3.8 Discussion ........................................................................................................ 105
CHAPTER 4
Non-nutritive sweeteners do not enhance the glycaemic or appetitive responses to
ingested glucose
4.1 Introduction ...................................................................................................... 109
4.2 Method ............................................................................................................. 110
4.2.1 Design ....................................................................................................... 110
4.2.2 Participants ................................................................................................ 111
4.2.3 Experimental protocol ............................................................................... 111
4.2.4 Materials and test foods ............................................................................ 112
4.2.5 Statistical analysis ..................................................................................... 114
4.3 Results .............................................................................................................. 114
4.3.1 Participants ................................................................................................ 114
4.3.2 Visual analogue scales – taste ................................................................... 115
4.3.3 Blood glucose ............................................................................................ 116
4.3.4 Appetite perceptions.................................................................................. 118
4.4 Discussion ........................................................................................................ 120
CHAPTER 5
Gastric emptying and CNS responses to orally and intragastrically administered
sweet tastants
Study I: Effect of oral sweet taste on the gastric emptying of sweet solutions
5.1 Introduction ...................................................................................................... 125
5.2 Method ............................................................................................................. 126

6
5.2.1 Design ....................................................................................................... 126
5.2.2 Participants ................................................................................................ 126
5.2.3 Experimental protocol (study I) ................................................................ 126
5.2.4 Materials and test foods ............................................................................ 127
5.2.5 Statistical analysis ..................................................................................... 129
5.3 Results .............................................................................................................. 129
5.3.1 Participants ................................................................................................ 129
5.3.2 Gastric emptying ....................................................................................... 130
5.3.3 Appetite perceptions.................................................................................. 136
5.4 Discussion ........................................................................................................ 140
Study II: Effect of sequential oral and gastrointestinal stimulation on brain
BOLD responses to glucose
5.5 Introduction ...................................................................................................... 142
5.6 Method ............................................................................................................. 143
5.6.1 Design ....................................................................................................... 143
5.6.2 Participants ................................................................................................ 144
5.6.3 Experimental protocol (study II) ............................................................... 144
5.6.4 Materials and test foods ............................................................................ 148
5.6.5 MRI analysis ............................................................................................. 148
5.6.5.1 Data acquisition ...................................................................................... 148
5.6.5.2 Data analysis .......................................................................................... 149
5.6.5.3 Pre-processing ........................................................................................ 149
5.6.5.4 First level analysis .................................................................................. 150
5.6.5.5 Second level analysis ............................................................................. 152
5.6.5.6 Regions of interest ................................................................................. 152
5.7 Results .............................................................................................................. 153
5.7.1 Participants ................................................................................................ 153
5.7.2 Part 1 Oral pre-taste .................................................................................. 153
5.7.3 Part 2 Responses following intragastric infusions .................................... 162
5.7.3.1 Brainstem and hypothalamus ................................................................. 165
7
5.7.3.2 Non-homeostatic regions ....................................................................... 168
5.7.3.3 Comparison to intragastric glucose infusion without oral taste stimulation
............................................................................................................................ 174
5.8 Discussion .................................................................................................... 174
CHAPTER 6
General Discussion
6.1 Glucose, non-nutritive sweeteners and the gut sweet taste receptor ................ 181
6.2 Sweet tastants in the gut-brain axis: brain integration of oral and gastric sensing
............................................................................................................................... 183
6.3 Limitations and future directions ..................................................................... 185
6.4 Summary .......................................................................................................... 186
REFERENCES .............................................................................................................. 187
Appendix I ..................................................................................................................... 201
Appendix II ................................................................................................................... 202
Appendix III .................................................................................................................. 206
Appendix IV .................................................................................................................. 210
Appendix V ................................................................................................................... 211
Appendix VI .................................................................................................................. 212
Word count: 47,710
8
LIST OF FIGURES
Figure 1.1 The Satiety Cascade ....................................................................................... 21
Figure 1.2 Schematic representation of an oral taste receptor cell ................................. 25
Figure 1.3 Gastric emptying curves for a solid and liquid food test meal ...................... 27
Figure 1.4 Possible pathways involved in nutrient sensing by enteroendocrine cells .... 35
Figure 1.5 Schematic representation of intestinal sweet taste receptor mechanisms ...... 38
Figure 1.6 Brain structures involved in appetite and food intake ................................... 44
Figure 1.7 Arrangement of vagal, spinal and intrinsic primary afferents ....................... 46
Figure 1.8 Gut-brain pathways involved in the control of appetite and food intake ...... 49
Figure 2.1 IRIS machine ................................................................................................. 63
Figure 2.2 Blood sample collection via a three way tap ................................................. 65
Figure 3.1 Participant in the laboratory following cannulation and nasogastric tube
placement ........................................................................................................................ 70
Figure 3.2 Schematic representation of study protocol (part II) ..................................... 72
Figure 3.3 Ad-libitum test meal ....................................................................................... 74
Figure 3.4 Sweetness and bitterness ratings .................................................................... 77
Figure 3.5 Gastric emptying rate ..................................................................................... 79
Figure 3.6 Blood glucose ................................................................................................ 80
Figure 3.7 Subjective appetite ratings ............................................................................. 82
Figure 3.8 Food intake .................................................................................................... 83
Figure 3.9 Schematic representation of study protocol (part III) ................................... 91
Figure 3.10 Gastric emptying rate ................................................................................... 94
Figure 3.11 Blood glucose .............................................................................................. 95
Figure 3.12 Insulin concentrations .................................................................................. 96
Figure 3.13 GLP-1 concentrations .................................................................................. 97
Figure 3.14 GIP concentrations ...................................................................................... 99
Figure 3.15 PYY concentrations ................................................................................... 100
Figure 3.16 PP concentrations....................................................................................... 101
Figure 3.17 Subjective appetite ratings ......................................................................... 103

9
Figure 3.18 Food intake ................................................................................................ 104
Figure 4.1 Schematic representation of study protocol ................................................. 113
Figure 4.2 Sweetness ratings ......................................................................................... 115
Figure 4.3 Blood glucose .............................................................................................. 117
Figure 4.4 Subjective appetite ratings ........................................................................... 119
Figure 5.1 Schematic representation of study protocol ................................................. 128
Figure 5.2 Gastric emptying rate ................................................................................... 131
Figure 5.3 Gastric emptying rate of glucose ................................................................. 133
Figure 5.4 Gastric emptying rate of saccharin .............................................................. 134
Figure 5.5 Gastric emptying rate of water .................................................................... 135
Figure 5.6 Subjective appetite ratings following glucose test meals ............................ 137
Figure 5.7 Subjective appetite ratings following saccharin test meals ......................... 138
Figure 5.8 Subjective appetite ratings following water test meals................................ 139
Figure 5.9 Tubing for delivery of test solutions ............................................................ 145
Figure 5.10 A participant in the scanner ....................................................................... 146
Figure 5.11 Schematic representation of study protocol ............................................... 147
Figure 5.12 Schematic representation of data analysis ................................................. 151
Figure 5.13 Change in blood oxygen level dependent signal over time in the brainstem
in response to glucose taste ........................................................................................... 155
Figure 5.14a Change in blood oxygen level dependent signal over time in the cingulate
cortex in response to glucose taste ................................................................................ 156
Figure 5.14b Change in blood oxygen level dependent signal over time in the anterior
cingulate cortex in response to glucose taste ................................................................ 157
Figure 5.15a Change in blood oxygen level dependent signal over time in the frontal
cortex in response to glucose taste ................................................................................ 159
Figure 5.15b Change in blood oxygen level dependent signal over time in the superior
frontal cortex in response to glucose taste .................................................................... 160
Figure 5.15c Change in blood oxygen level dependent signal over time in the inferior
frontal cortex in response to glucose taste .................................................................... 161
Figure 5.16 Brain images showing areas exhibiting a significant interaction between
intragastric glucose infusion and glucose taste ............................................................. 163

10
Figure 5.17 Change in blood oxygen level dependent signal over time in the medulla 165
Figure 5.18 Change in blood oxygen level dependent signal over time in the pons and
midbrain ........................................................................................................................ 166
Figure 5.19 Change in blood oxygen level dependent signal over time in the
hypothalamus ................................................................................................................ 167
Figure 5.20 Change in blood oxygen level dependent signal over time in the
hippocampus and parahippocampal gyrus .................................................................... 169
Figure 5.21 Change in blood oxygen level dependent signal over time in the thalamus
....................................................................................................................................... 170
Figure 5.22 Change in blood oxygen level dependent signal over time in the putamen
and caudate .................................................................................................................... 171
Figure 5.23 Change in blood oxygen level dependent signal over time in the anterior
cingulate cortex and insula ............................................................................................ 172
Figure 5.24 Change in blood oxygen level dependent signal over time in the medial
frontal cortex ................................................................................................................. 173
Figure 6.1 Summary schematic depicting findings from chapters three and four ....... 182

11
LIST OF TABLES
Table 1.1 Overview of gastrointestinal hormones involved in appetite and food intake
control ............................................................................................................................. 33
Table 1.2 Summary table showing effects of non-nutritive sweeteners on gut hormone
secretion and glucose absorption .................................................................................... 42
Table 3.1 Nutrient composition of test meal ................................................................... 73
Table 3.2 Participant characteristics ............................................................................... 76
Table 3.3 Participant characteristics ............................................................................... 78
Table 3.4 Participant characteristics ............................................................................... 92
Table 4.1 Participant characteristics ............................................................................. 114
Table 5.1 Participant characteristics ............................................................................. 129
Table 5.2 Trial conditions ............................................................................................. 145
Table 5.3 Participant characteristics ............................................................................. 153
Table 5.4 Significant clusters exhibiting an effect of glucose taste .............................. 154
Table 5.5 Significant clusters exhibiting an interaction of intragastric glucose infusion
by glucose taste ............................................................................................................. 164
Table 6.1 Summary of study protocols presented in this thesis .................................... 180

12
ABBREVIATIONS
Ace-k Acesulfame-k
AgRP Agouti-related peptide
αMSH α- melanocyte-stimulating hormone
ANOVA Analysis of variance
AP Area postrema
ARC Arcuate nucleus
AS Artificial saliva
AUC Area under the curve
BBB Blood brain barrier
BMI Body mass index
BOLD Blood oxygen level dependent
CART Cocaine and amphetamine related transcript
CCK Cholecystokinin
CNS Central nervous system
CoM Centre of mass
DMN Dorsal motor nucleus
DPP4 Dipeptidyl peptidase IV
DVC Dorsal vagal complex
EDTA Ethylenediaminetetraacetic acid
EEC Enteroendocrine cells
ELISA Enzyme-linked immunosorbent assay
ENS Enteric nervous system
Exendin-4 Exenatide
FWEc Family wise error corrected
fMRI Functional magnetic resonance imaging
GIP Glucose-dependent insulinotropic peptide
GLP-1 Glucagon-like peptide-1
GLUT2 Glucose transporter 2
GPCR G-protein coupled receptor
IPANs Intrinsic primary afferent neurons
13
IRIS Infra-red isotope spectrophotometer
kcal Kilocalorie
LHA Lateral hypothalamic area
MCR3/4 Melanocortin receptor 3/4
ME Median eminence
MNI Montreal Neurological Institute
MRI Magnetic resonance imaging
Nac Nucleus accumbens
NG Nasogastric
NNS Non-nutritive sweetener
NPY Neuropeptide Y
NTS Nucleus of the solitary tract
OFC Orbitofrontal cortex
OXM Oxyntomodulin
PET Positron emission tomography
PFC Prefrontal cortex
physMRI Physiological magnetic resonance imaging
POMC Pro-opiomelanocortin
PP Pancreatic polypeptide
PVN Paraventricular nucleus
PYY Peptide YY
RPM Revolutions per minute
SD Standard deviation
SEM Standard error of the mean
SGLT1 Sodium-glucose transporter 1
SPM Statistical parametric mapping
SPSS Statistical Package for the Social Sciences
TCA Time clustering analysis
TFEQ Three factor eating questionnaire
VAS Visual analogue scale
VMH Ventromedial hypothalamus
14
ABSTRACT
The importance of nutrient induced gut-brain signalling in the regulation of human food
intake has become increasingly apparent as the obesity epidemic progresses. Much of
the caloric excess consumed comes from dietary sugars, but our knowledge about the
mechanisms mediating the physiological and appetitive effects of sweet tastants in the
gut-brain axis is far from complete. The comparative effects of natural sugars vs.
artificial non-nutritive sweeteners are also poorly understood. Research in animal and
cellular models has suggested a key role in the gut for the sweet taste receptors
previously well described in the mechanisms of oral taste. The work presented in this
thesis sought to answer key questions initially based on the hypothesis that gut sweet
taste receptors also play a key role in the human gut-brain axis.
The key aims were to elucidate i) whether sweet taste receptors in the gut contribute to
the effects of sweet tastants in the human gut-brain axis, and ii) whether oral sweet taste
modulates gut physiology and/or gut-brain signalling.
Fifty-eight (36 males and 22 females) young (23.3 + 3.4 years) participants were
recruited into four studies. All were healthy and generally lean (BMI 22.3 + 1.9). Key
methodologies used included gastric emptying, appetite and satiety scores, food intake,
blood hormone and glycaemic responses, and functional brain imaging.
In chapter 3, a sweet taste receptor antagonist, lactisole, was used as a tool to investigate
the role of gut sweet taste receptors in mediating the responses to glucose. However,
lactisole had no impact on gastric emptying (a proxy measure of gut-brain signalling),
blood glucose, gut hormones, appetite ratings or food intake. The data outlined in
chapter four revealed that ingesting non-nutritive sweeteners, (aspartame, saccharin, and
acesulfame-k) in combination with glucose did not enhance glycaemic responses or
affect appetite ratings. However, the studies presented in chapter five demonstrated that
the pattern and rate of gastric emptying of glucose very clearly differed depending on
whether it was given orally or administered intragastrically. The interaction between
oral and gastrointestinal sweet stimuli on brain activation was therefore investigated
using functional brain imaging, and demonstrated that an oral pre-taste of glucose had a
marked impact on subsequent brain responses to an intragastric glucose load. Effects
were observed in homeostatic and non-homeostatic regions.
These data offer little evidence that gut sweet taste receptors are important in humans: a
non-taste pathway appears more likely to mediate the effects of glucose. However gut-
brain signalling is markedly affected by oral sweet taste receptors. This has direct
relevance for a better understanding of healthy human nutrition. Future studies need to
investigate these interactions in more detail, using a wider panel of nutrients and tastants
in health and disease.
15
DECLARATION
No portion of the work referred to in the thesis has been submitted in support of an
application for another degree or qualification of this or any other university or other
institute of learning.
COPYRIGHT STATEMENT
i. The author of this thesis (including any appendices and/or schedules to this thesis)
owns certain copyright or related rights in it (the “Copyright”) and s/he has given The
University of Manchester certain rights to use such Copyright, including for
administrative purposes.
ii. Copies of this thesis, either in full or in extracts and whether in hard or electronic
copy, may be made only in accordance with the Copyright, Designs and Patents Act
1988 (as amended) and regulations issued under it or, where appropriate, in accordance
with licensing agreements which the University has from time to time. This page must
form part of any such copies made.
iii. The ownership of certain Copyright, patents, designs, trademarks and other
intellectual property (the “Intellectual Property”) and any reproductions of copyright
works in the thesis, for example graphs and tables (“Reproductions”), which may be
described in this thesis, may not be owned by the author and may be owned by third
parties. Such Intellectual Property and Reproductions cannot and must not be made
available for use without the prior written permission of the owner(s) of the relevant
Intellectual Property and/or Reproductions.
iv. Further information on the conditions under which disclosure, publication and
commercialisation of this thesis, the Copyright and any Intellectual Property and/or
Reproductions described in it may take place is available in the University IP Policy (see
http://www.campus.manchester.ac.uk/medialibrary/policies/intellectual-property.pdf), in
any relevant Thesis restriction declarations deposited in the University Library, The
University Library’s regulations (see
http://www.manchester.ac.uk/library/aboutus/regulations) and in The University’s
policy on presentation of Theses.
16
ACKNOWLEDGMENTS
I recognise this research would not have been possible without the financial support
from the Biotechnology and Biological Sciences Research Council.
I thank both my supervisors, Professor John McLaughlin and Dr Shane McKie, for
giving me the opportunity to undertake this PhD. I am very grateful to Professor
McLaughlin for his time, guidance and advice during my research training and Dr
McKie who has given a lot of time to mentor me through complicated imaging analysis.
Before I thank individuals I would like to acknowledge each one of the participants who
took part and gave up their time to enable this research. There are many people who
have assisted me in the research described herein. Firstly, I must say a big thank you to
the research nurses Melanie Taylor and Ann Keene who were always on hand to assist
with tricky cannulations or nasogastric tubes! I would also like to thank the Wellcome
Trust Research Facility and in particular Lisa Westwood who helped to get the study set
up and running there. In addition I would like to thank Barry Withnall and the
radiography team at the Translational Imaging Unit for their assistance with my imaging
study.
My PhD experience would have been very different and definitely not as enjoyable had I
not worked alongside Dr Nerys Astbury in my first year and Dr Lucy Wasse for the
remainder of my PhD. Nerys helped me at the start of my PhD and gave me the
confidence to start my own research studies. Lucy has helped in the lab with studies and
more than anything has been a great friend and support. I have enjoyed sharing an
office, drinking endless cups of coffee and will miss working alongside her.
Finally, I can’t thank my parents enough for their love and support and for always being
there for me. It has been a tough four years for them and I am incredibly lucky to have
an amazing family. I know this means as much to them as it does to me.

17
PREFACE
I graduated from Durham University in 2007 with a BSc in Health and Human Sciences
and went on to complete a Masters in Human Nutrition at Sheffield University in 2008.
I was appointed as a public health nutrition Research Associate by the Technical
University of Denmark in 2008 until starting my PhD in 2009.
The findings within this thesis have been peer reviewed as follows:
Chapter 4
Bryant C, Wasse L, Astbury N, McLaughlin J, 2013, Non-nutritive sweeteners: no class
effect on the glycemic or appetite responses to ingested glucose, European Journal of
Clinical Nutrition.
Two further manuscripts are in preparation based on the work in chapters 3 and 5.
CONFERENCE PRESENTATIONS
Chapter 3
The role of sweet taste receptors in the gut and the effect on appetite and energy intake in
humans, The Rank Prize Funds Symposium on Nutrient Sensing and Signalling,
Windermere 2010.
Does the gut taste sweet? Biosciences KTN Food Sector Event, London 2013
Chapter 5
Nutrient induced gut-to-brain signalling in humans, Appetite Volume 57, The Society
for the Study of Ingestive Behavior, Florida 2011.
Effect of sequential oral and gastrointestinal stimulation on brain BOLD responses to
glucose, The 37th
Congress of the International Union of Physiological Sciences,
Birmingham 2013.
18
CHAPTER 1
Literature Review
1.1 Introduction
Obesity is a global health problem and its prevalence continues to rise, with the
World Health Organisation estimating that 2.3 billion people worldwide will be
overweight (body mass index (BMI) > 25kg/m2) and 700 million obese (BMI > 30
kg/m2) by the year 2015 (Source: World Health Organisation). Recognised as one of
the most significant contributors to ill health, obesity, and its associated chronic
diseases and economic burden, highlight the need for cost-effective strategies and
therapies for prevention and to enable safe and sustainable weight loss (Trueman et
al., 2010). At present, efforts to tackle the ever increasing obesity epidemic,
currently restricted to only one licensed drug and gastric banding or bypass surgery,
are limited by cost and risk presenting as impractical solutions for a global problem
(Hussain and Bloom, 2011, Hussain and Bloom, 2013).
Studying the genetics of obesity has identified individuals’ predisposition to gain
weight but does not account for the exponential increase in the Westernised world
(Saris and Foster, 2006) suggesting that lifestyle and environment play a huge part in
driving the epidemic. If food is not scarce, eating is entirely behavioural (Blundell,
2006). In the current obesogenic environment (Lake and Townshend, 2006) it is
important to piece together the physiological mechanisms and environmental
pressures that ultimately translate into patterns of eating. The body’s ability to
modulate energy intake and match energy requirements from meal to meal is under
strict control (Frayn, 2003) particularly as, in most human bodies, weight remains
relatively constant despite constant variations in food intake, meal frequency, meal
volume, energy density and expenditure (de Graaf et al., 2004). That said, an excess
in energy intake relative to energy expenditure results in an increase in the amount of
energy stored.
19
The brain is the key regulator in appetite control but its interaction with the
gastrointestinal tract, and the signals emanating from it, forces us not to study either
in isolation. The gut–brain axis and its regulation of food intake is a complex system
that enables the cross-talk between peripheral and central mechanisms that influence
hunger and food intake in response to environmental and behavioural stimuli.
Dietary influences are a contributing factor to the obesity epidemic. The increasing
consumption of sugar and non-nutritive sweeteners (NNS) and the effect on food
intake and body weight have been under debate (Mattes and Popkin, 2009). One key
area warranting further investigation is the mechanisms by which sugars and NNS,
present in the everyday diet, influence gastrointestinal signalling to the brain and
therefore appetite and food intake.
Despite significant advances in our understanding of these mechanisms controlling
food intake, our knowledge is far from complete. The precise mechanisms by which
sugars and NNS are sensed within the gut, and the exact signals to the central
nervous system (CNS) to modulate appetite and energy intake are poorly defined and
thus form the basis of this thesis. This review focuses on what is known about the
mechanisms mediating the effects of carbohydrate, in particular sugar and NNS, on
appetite and food intake.
The review will start by describing appetite and feeding behaviour and the oral,
gastric and intestinal factors that influence them. Thereafter, the way signals outlined
in the previous sections are integrated in key neurological pathways to influence
appetite and food intake are discussed. Finally, the study of feeding behaviour is
reviewed. Where possible, priority is given to human studies with results from
animal work referred to in the absence of human data or where major differences
occur.
1.2 Feeding behaviour
Feeding behaviour can be involuntary as well as conditioned and may be triggered
by both external and internal stimuli (de Graaf et al., 2004). Social, environmental
and emotional state can effect intake, visual and olfactory cues that generate the
20
positive hedonic feeling, and reward associated with the initiation and continuation
of eating (Berthoud and Morrison, 2008). The internal driving force for the search,
choice and ingestion of food is appetite (de Graaf et al., 2004) and the response
leading up to, during and following an eating episode is feeding behaviour. Eating
episodes are defined by the amount of food and drink consumed. This is also known
as energy or food intake which will be used interchangeably throughout this thesis.
1.2.1 Appetite
Although most people would believe they understand the concept of appetite, it is
difficult to define scientifically and may not always be physiologically accurate.
However, appetite provides a conceptual framework, for research purposes, to
examine the impact of foods or nutrients on feeding behaviour. There are two main
definitions of appetite in science proposed by Blundell and colleagues. The first
encompasses all aspects of food intake, including selection, motivation and
preference, while the second relates specifically to the response to environmental
stimuli in contrast to eating in response to physiological stimuli (Blundell et al.,
2010). Although appetite is likely to change the occurrence of eating episodes it does
not necessarily calculate or infer the amount eaten. For this reason, appetite is
difficult to quantify and measure and thus subjective sensations (i.e. fullness and
hunger) are used to interpret the motivational state prior to, during and after an
eating episode. Fullness and hunger are terms often used within appetite research and
can be defined as a fullness sensation in the stomach (Sorensen et al., 2003) and a
conscious sensation, often physical, reflecting a mental urge to eat (de Graaf et al.,
2004). Hunger can also be defined as the want of food which in a broad sense
reflects the feeling of desire to eat, another term often used in appetite research.
Arguably the latter can be experienced in the absence of energy deficit and
influenced by psychological and environmental stimuli.
21
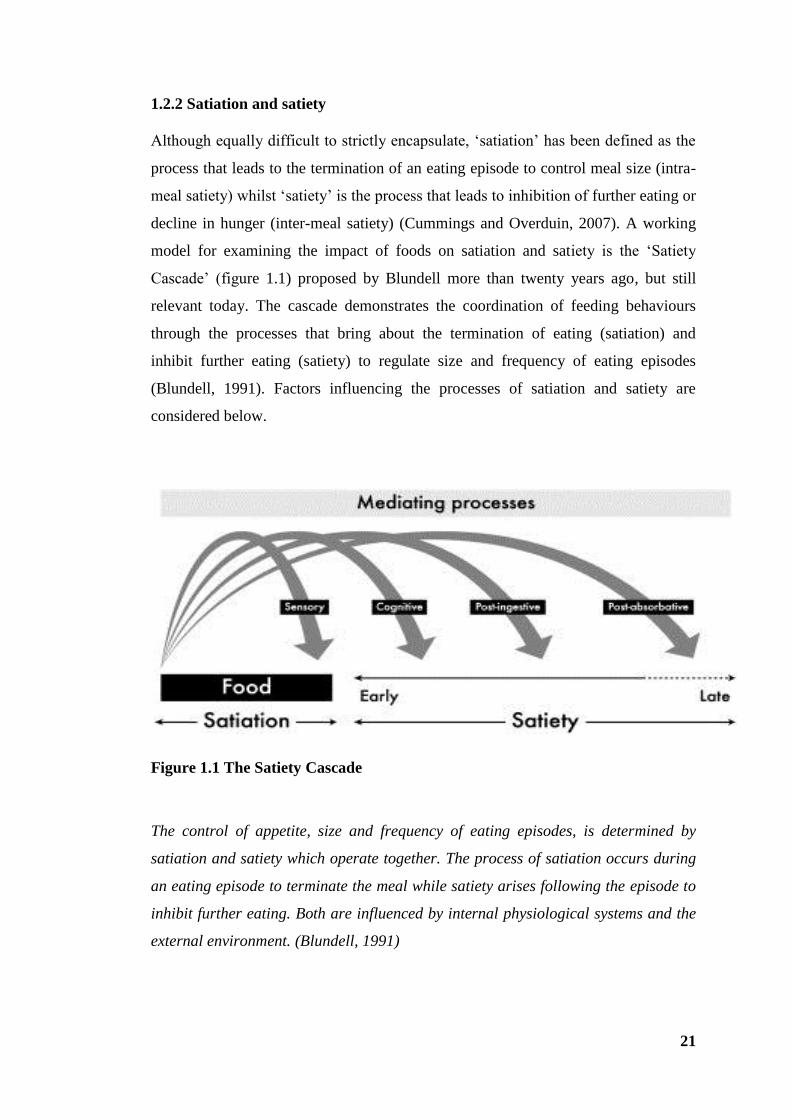
1.2.2 Satiation and satiety
Although equally difficult to strictly encapsulate, ‘satiation’ has been defined as the
process that leads to the termination of an eating episode to control meal size (intra-
meal satiety) whilst ‘satiety’ is the process that leads to inhibition of further eating or
decline in hunger (inter-meal satiety) (Cummings and Overduin, 2007). A working
model for examining the impact of foods on satiation and satiety is the ‘Satiety
Cascade’ (figure 1.1) proposed by Blundell more than twenty years ago, but still
relevant today. The cascade demonstrates the coordination of feeding behaviours
through the processes that bring about the termination of eating (satiation) and
inhibit further eating (satiety) to regulate size and frequency of eating episodes
(Blundell, 1991). Factors influencing the processes of satiation and satiety are
considered below.
Figure 1.1 The Satiety Cascade
The control of appetite, size and frequency of eating episodes, is determined by
satiation and satiety which operate together. The process of satiation occurs during
an eating episode to terminate the meal while satiety arises following the episode to
inhibit further eating. Both are influenced by internal physiological systems and the
external environment. (Blundell, 1991)
22
1.3 Factors influencing appetite and energy intake
Food is sensed and processed to generate signals that are utilised for the control of
appetite by way of processes including sensory, cognitive, post-ingestive and post-
absorptive (figure 1.1) (Blundell et al., 1994). These processes represent a well-
controlled but complex system that monitors and responds to acute changes in
energy balance, and signals to reflect the body’s energy status. Signals reflecting
energy status can be distinguished by those that are tonic, which reflect the status of
energy stored and tend to be longer term, and those that are episodic which arise
from the gastrointestinal tract in response to eating episodes and fluctuate
considerably within a day (Blundell, 2006). The integration of these signals by the
brain, as discussed later in section 1.5, enables the coordination of feeding
behaviour.
Episodic signals are synchronised with eating episodes so that during the course of
an eating occasion the gastrointestinal tract can efficiently digest and absorb
nutrients from ingested foods (Blundell, 2006). The gastrointestinal tract is
optimised to carry out these functions via motility (particularly the regulation of
gastric emptying) and neuroendocrine secretions, and in doing so can affect and
homeostatically regulate the short term control of appetite and energy intake. The
potential mechanisms underlying the effects of carbohydrate on food intake involve
processes generated by oro-sensory and gastric stimulation preceding the interaction
with receptors in the small intestine and associated satiety hormone release.
1.3.1 Oral factors
Although there are anticipatory cephalic responses to the sight or smell of food, the
oral cavity is the first physical point of contact with food to be ingested. Here the
sensory properties (e.g. taste and texture) are evaluated and innate physiological
responses, such as secretion of saliva and gastric acid, prepare the gastrointestinal
tract for receiving and processing of the food that is about to be eaten (Power and
Schulkin, 2008). Oral sensations and salivary secretomotor responses are mediated
via the facial and glossopharyngeal nerves, whilst gastric responses are affected by
vagal pathways. The sensory properties of foods can determine palatability,

23
classified as how pleasant or liked the food is, and are important contributors to food
selection and amount of food eaten (Sorensen et al., 2003). Increasing the
palatability of a food can increase intake of that food (de Graaf et al., 1999).
Furthermore, humans consume more from meals containing a variety of foods than
they would from meals of a single food caused by the sensory specific satiety
phenomenon defined as decreased pleasantness of an eaten food in contrast to the
pleasantness of an uneaten food (Rolls et al., 1981). This relates to the hedonic
aspects of the control of food intake involving the processing of sensory properties
of food in the brain (discussed later in section 1.5.3.1). However, this is not an
isolated process as decisions made will also be in the context of short term physical
and physiological signals originating from other areas of the gastrointestinal tract.
Taste originates in the oral cavity via taste buds that house taste cells. These cells can
be classified into four types depending on their features, with type II cells enabling
sensing of sweet, umami and bitter foods (Iwatsuki and Torii, 2012). Investigations
into the function of each cell type have led to the discovery of taste cell-specific
molecules and receptors that are specific to each taste quality.
1.3.1.1 Sugars, non-nutritive sweeteners and sweet taste receptors
Sweetness is one of the five tastes that humans experience, along with sour, bitter,
salty and umami, and in evolutionary terms is critical for determining whether a
potential food encountered is nutritious or potentially toxic. The mechanisms for
sweet taste have been well defined. Sweetness perception involves two G protein
receptors (GPCR), T1R2 and T1R3, which dimerize to form the sweet taste receptor
(Sclafani, 2007). Stimulation of the T1R2+T1R3 receptor by sugars or NNS, which
are agonists at T1Rs, activates intracellular signalling elements such as α-gustducin.
This in turn leads to activation of gustatory nerves transmitting sensory information
to the brain (figure 1.2). Lactisole, the sodium salt of 2-(4-methoxyphenoxy)-
propionic acid, a sweet taste receptor antagonist, blocks the sweet taste of several
compounds including sugars (fructose, glucose, sucrose) and NNS (aspartame,
acesulfame-K, saccharin) (Schiffman et al., 1999) by interacting with T1R3 and
preventing conformational changes required to exert sweet taste upon T1R2+3
24
activation (Jiang et al., 2005, Schiffman et al., 1999). Lactisole is patented as a
sweetness inhibiting agent, commercially available as an artificial flavour and
approved for use in confectionary and snack foods (Sclafani and Pérez, 1997).
Reducing the sugar content would perhaps be a wiser strategy for industry to
consider in terms of health benefit.
Sweet food and drinks are highly palatable for most people and potent drivers to eat
in humans (Bellisle et al., 2012) although there are individual differences in optimal
levels of sweetness (Sorensen et al., 2003). Biochemically, simple sugars can be
classified as monosaccharides, such as glucose, fructose, galactose and tagatose, and
disaccharides such as lactose (glucose + galactose) and sucrose (glucose + fructose).
The consumption of caloric sweeteners within beverages and soft drinks in particular
has been associated with excess energy intake and weight gain (Vartanian et al.,
2007). It is hypothesised that their high palatability can prompt overconsumption,
especially when there is no adequate limitation on availability.
In an attempt to combat the consumption of caloric sugars as the main source of
sweetness, there has been a marked increase in the use of NNS by the food and
beverage industry albeit in the absence of compelling evidence. NNS provide no/low
energy alternatives to sweetening foods and beverages with energy rich sugars,
particularly sucrose and fructose which are the main simple sugar ingredients in our
diet. However, the uncoupling of sweetness and energy intake has also been
implicated in the obesity epidemic as it is claimed intake of NNS can dysregulate the
body’s metabolic systems (Pepino and Bourne, 2011) and may lead to over
consumption at subsequent eating occasions regardless (Blundell et al., 1994).
The effect of sugar and NNS on peripheral and central appetite signals will be
discussed in further detail in sections 1.4.2 and 1.5 respectively. In addition,
sweetness and reward–relating brain signalling and the effect on appetite and energy
intake will be discussed in section 1.5.3.1.

25
Figure 1.2 Schematic representation of an oral taste receptor cell
Adapted from (Cummings and Overduin, 2007). Sweet tastants, sugars and non-
nutritive sweeteners (NNS), stimulate sweet taste receptor cells comprising of T1R2
and T1R3 of the tongue. This activates intracellular signalling pathways such as α-
gustducin (others not shown) which in turn leads to an increase in intracellular
calcium (Ca2+
). Rising intracellular Ca2+
triggers gustatory nerve terminals which
relay sensory information to the brain. Lactisole inhibits sweet taste perception by
binding to T1R3.
26
1.3.2 Gastric factors
The functional anatomy of the stomach can be divided into three regions; proximal,
which acts as a reservoir for ingested foods, the distal compartment which mixes and
grinds solid food and the pylorus which further modulates the emptying of the
stomach contents into the small intestine (Rayner et al., 2001, Hellström et al.,
2006). Nutrient liquids or water alone empty from the stomach from the outset of
consumption, whilst emptying of solids follows once they have been processed into
smaller particles, a process termed trituration (Horowitz et al., 1994). The difference
between the emptying of solid and liquid food is depicted in figure 1.3.
Increasing the volume of gastric contents induces mechanical gastric distension
which activates neural stretch receptors in the gastric wall and is associated with
satiety and reduced food intake (Oesch et al., 2006). This is principally mediated by
vagal reflexes. A role for gastric distension in inducing satiation shown was
demonstrated by a reduction in food intake observed when a gastric balloon was
inflated in the stomach of human subjects in the absence of any nutrients (Geliebter
et al., 1988). However, this invasive technique may cause discomfort to subjects and
its placement unquestionably interferes with normal physiology and feeding
behaviour. A subsequent study involving the intragastric administration of preloads
varying in volume, and/or energy, found a significant reduction in food intake with
400ml preloads compared to 200ml, but no effect of energy intake when volume was
kept constant (Rolls and Roe, 2002) demonstrating the potent effect of gastric
volume on satiation. However, the use of liquid gastric preloads cannot exclude the
effects of intestinal factors. Oral, gastric and post-gastric signals are likely to occur
simultaneously, with as much as 40% of a liquid meal emptied from the stomach
prior to meal termination (Kaplan et al., 1992). Gastric emptying progressively
reduces the volume of food in the stomach which decreases gastric distension and is
thought to contribute to the return of hunger (Oesch et al., 2006). Therefore, the
uncoupling of energy content and volume of a food is important. Increasing the
energy density of food without an increase in volume may lead to increased energy
intake as more energy is consumed compared to lower energy dense foods.
Furthermore, it is thought that when consumed in a liquid form food/nutrients are
less effective than solid counterparts at inducing satiety, and, since there is no

27
mechanism to sense ingested calories, the increased energy is often not compensated
for at subsequent eating occasions leading to an increased intake (DiMeglio and
Mattes, 2000).
Figure 1.3 Gastric emptying curves for a solid and liquid food test meal
(Hellström et al., 2006). Differing rates between the emptying of liquid and solid
meals from the stomach show liquid meals begin emptying immediately whereas
solid meals begin after a lag phase during which solid food components are broken
down into smaller particles.
The nutrient composition of gastric contents emptying into the small intestine and
the effects on energy intake have also been studied using rats fitted with an inflatable
pyloric cuff preventing the emptying of stomach contents into the small intestine
(Ritter, 2004). Although the distension caused by the retaining of stomach contents
contributed to satiation, rodents still consumed large quantities suggesting intestinal
factors play a role. The hypothesis is that the rate of gastric emptying is determined
by feedback from the small intestine and not by signals arising from the stomach

28
itself. It is believed that the nutrient composition of ingested food impacts on
satiation and satiety using a post gastric feedback mechanism whereby gastric
emptying will be delayed and maintain gastric distension (Phillips and Powley,
1996). The stomach is sensitive to physical changes such as tension and volume, the
output of which is relayed to the brain by vagal and spinal nerves (Phillips and
Powley, 2000).
1.3.3 Intestinal factors, absorption and post-absorptive mechanisms
The structure of the inner small intestinal surface is optimised for absorption due to
the large surface area provided by many villi contained within it. The villi are lined
with enterocytes and resident to specialised epithelial cells known as enteroendocrine
cells (EEC). The small intestine responds to ingested food via mechano-sensitive
pathways but is mainly reliant upon EEC in the mucosa recognising luminal content
by chemosensory mechanisms and responding accordingly (Farre and Tack, 2013).
The length and region of the small intestine exposed to nutrients is believed to have
influence on gastric emptying, appetite and energy intake (Lin et al., 1989). The
presence of nutrients in the small intestine induces a feedback mechanism that
controls the rate of emptying from the stomach via the enhancement of gastric
distension (Geliebter, 1988). Studies have demonstrated that intestinal carbohydrate
infusions can increase perceived fullness and reduce subsequent intake (Cook et al.,
1997, Lavin et al., 1996, Lavin et al., 1998) suggesting signals arising from the
lumen of the small intestine impact on satiety.
In the small intestine, glucose absorption is controlled via two transporters; the
active transporter sodium-glucose co-transporter (SGLT1) and the facilitative
glucose transporter 2 (GLUT2) (Kellett and Helliwell, 2000). SGLT1 functions to
transport glucose from the gut lumen into the enterocytes. This is particularly
important at low glucose concentrations as the expression of SGLT1 is proportional
to the amount of glucose in the lumen, thus glucose absorption is related to the
amount available (Renwick and Molinary, 2010). GLUT2 functions to transfer
intracellular glucose into the general circulation. Higher glucose concentrations in
the gut lumen lead to increased GLUT2 synthesis and expression in the apical
29
membrane to provide a mechanism via which absorptive capacity is promptly
matched to dietary intake (Kellett and Helliwell, 2000). Together these transporters
enable mechanisms of glucose absorption including uptake from the gut lumen into
the hepatic portal vein and the transfer from blood into tissues including the brain
(Renwick and Molinary, 2010).
Substantial variations in the day to day diet lead to constant changes in glucose
levels making it imperative that epithelial cells sense, respond and regulate their
function appropriately. Blood glucose increases following carbohydrate ingestion
and glucose uptake, and has long been related to hunger and food intake (Mayer,
1955). Mayer proposed the glucostatic theory for short term appetite regulation
which postulates that feeding is initiated when blood glucose utilisation is low
(Mayer, 1955).
Intraduodenally administered glucose reduces energy intake and hunger more than
intravenously administered glucose, despite comparable plasma glucose
concentrations. Furthermore, this effect can be abolished when gut hormone
secretion is inhibited with octreotide (Lavin et al., 1996). This suggests the appetite
suppressing effects of intestinal glucose are not regulated by blood glucose but more
likely a result of small intestinal stimulation leading to either direct vagal stimulation
and/or the release of satiety hormones.
1.3.4 Signals arising from the gastrointestinal tract
The gastrointestinal tract is the largest endocrine organ that synthesises and releases
orexigenic (increasing food intake) and anorexigenic (reduces food intake) hormones
to influence a number of physiologic processes and regulate gastrointestinal function
(Murphy and Bloom, 2006, Wren and Bloom, 2007). Identifying the precise
mechanisms by which gut hormones are stimulated and operate has received a lot of
attention, in particular their role in appetite control and therapeutic potential given
their influence on hunger and satiety prior to meal initiation and during the
postprandial period (Murphy and Bloom, 2006). The response of the gastrointestinal
tract to incoming nutrients is likely to be a coordinated response to achieve the
effects on food intake particularly for those hormones that share signalling pathways
30
and release mechanisms. The vagus nerve, for example, expresses receptors for both
orexigenic and anorexigenic hormones that are involved in long and short term
control (Raybould, 2007).
Ingestion of carbohydrate increases the blood glucose concentration and stimulates
the release of a number of gut hormones that have a fundamental role in food intake
(Feinle et al., 2002). Cholecystokinin (CCK) was the first gut hormone to be
implicated in the short term regulation of food intake (Kissileff et al., 1981) and
remains one of the most extensively studied to date. However, although glucose has
shown to slightly stimulate the release of CCK (Little et al., 2006a, Gerspach et al.,
2011), its release and subsequent effect on gastric emptying is generally associated
more with the ingestion of fat and protein rich meals (Lal et al., 2004) so will not be
discussed in detail at this stage.
Ingestion of carbohydrate more classically stimulates the release of glucagon-like
peptide-1 (GLP-1), glucose-dependent insulinotropic peptide (GIP) and to a lesser
extent peptide YY (PYY). In addition, the release of GLP-1 and GIP stimulates
glucose dependant insulin secretion from beta-cells of the pancreas. Circulating
insulin promotes glucose uptake into cells for utilisation and has been implicated in
the long term regulation of energy balance (Suzuki et al., 2012). Furthermore, insulin
acts within the CNS with receptors widely expressed in appetite regulating centres
within the brain (Pliquett et al., 2006).
The specific roles of GLP-1 and PYY in food intake are considered in greater detail
below. A brief overview of other gastrointestinal hormones involved in the short
term regulation of appetite control is outlined in table 1.1.
1.3.4.1 GLP-1
GLP-1 is a hormone released postprandially by enteroendocrine L-cells in the distal
small intestine and colon in response to ingested nutrients, particularly glucose
(Herrmann et al., 1995). Following a meal, GLP-1 is released in two phases. The
first rapid release occurs approximately five to ten minutes and the second extended
release 30 to 60 minutes postprandially (Baggio and Drucker, 2007). It is
hypothesised that the first phase of GLP-1 release is likely to be the result of a
31
proximal to distal signalling pathway due to GLP-1 secreting L cells not having had
direct contact with ingested nutrients at this initial stage (Roberge and Brubaker,
1993). The second phase of GLP-1 release is associated with direct stimulation of the
L cells by luminal contents (Lim et al., 2009). GLP-1 is rapidly degraded by the
enzyme dipeptidyl peptidase IV (DPP4) to an inactive form. GLP-1 enhances
glucose-stimulated insulin secretion from pancreatic islet beta cells, known as the
incretin effect, and suppresses glucagon secretion from islet alpha cells (Baggio and
Drucker, 2007). Thus, it has important effects on attenuating the rise in post-prandial
glucose, responses not seen when glucose is infused intravenously. Furthermore, the
release of GLP-1 and the subsequent rise in plasma levels following nutrient
ingestion are thought to play an important part in the slowing of gastric emptying
(Little et al., 2006b) and postprandial satiety (Stanley et al., 2004). Intravenous
administration in humans has demonstrated a suppression in appetite and decrease in
energy intake in some cases (Stanley et al., 2004, Verdich et al., 2001) but not all
(Long et al., 1999). A meta-analysis of the effect of GLP-1 infusion in human
subjects reported a dose dependent decrease in calorie intake (11.7%) which was
effective in both lean and obese subjects (Verdich et al., 2001).
The incretin properties of GLP-1 have gathered interest particularly in the treatment
of type 2 diabetes and more recently for its role in aiding weight loss (Shyangdan et
al., 2010). Exenatide (exendin-4) is a GLP-1 receptor agonist that is resistant to
DPP4 degradation. Its use along with other DPP4 resistant analogues have shown
improved glycaemic control in type 2 diabetics and sustained weight loss (Vilsbøll et
al., 2012), albeit with some subjects finding it hard to tolerate due to upper
gastrointestinal symptoms including nausea.
GLP-1 mediates its effects on the CNS via GLP-1 receptors activating neurons in the
area postrema (AP), nucleus of the solitary tract (NTS) of the brainstem which
receives vagal afferent inputs (D'Alessio, 2008), and the arcuate nucleus (ARC) and
paraventricular nucleus (PVN) of the hypothalamus (Chaudhri et al., 2006).
It has been suggested that GLP-1 may be a useful biomarker of satiation (de Graaf et
al., 2004). It is possible that consuming foods which enhance GLP-1 response may
reduce energy intake at that eating occasion and subsequent eating episodes.

32
However, such foods would need to be retained in the small intestine for longer in
order to more potently stimulate distal intestinal GLP-1 release.
1.3.4.2 PYY
Peptide YY (PYY) circulates in two forms in human blood; PYY 1-36 and PYY 3-36
with the latter constituting the majority of total circulating PYY in both a fasted and
postprandial state (Grandt et al., 1994). PYY is released postprandially from L cells
in the distal gut in proportion to calories ingested and binds to the Y2 receptor in the
ARC of the hypothalamus to inhibit the release of the appetite stimulant
neuropeptide Y (NPY) (Batterham et al., 2002). Its levels are low in the fasted state
and remain elevated postprandially for several hours.
Obese subjects have lower fasting PYY concentrations and demonstrate blunted
PYY responses (Batterham and Bloom, 2003). However, obesity is not associated
with a resistance to PYY as exogenous infusion leads to a reduction in intake
(Doggrell, 2004). Peripheral administration of PYY has reduced food intake and
corresponding subjective ratings of hunger and satiety in both obese and lean
subjects (Batterham et al., 2002, Batterham et al., 2003a) the effects of which have
been demonstrated to last for up to 12 hours after infusion (Batterham et al., 2004).
PYY is released predominantly following protein- and fat-rich meals but glucose
also stimulates its release (Stanley et al., 2004). PYY is an important mediator of
gastric emptying by the inhibition of proximal intestine and gastric motor activity
following nutrient stimulation (Camilleri and Grudell, 2007). Furthermore, its
elevation following gastric bypass surgery has been implicated in the mechanism of
weight loss following surgery (le Roux et al., 2007) and has the potential to emerge
as an anti-obesity drug.
1.3.4.3 Other gut hormones
A number of other gut hormones have been implicated in the control of appetite and
food intake. For brevity an overview of these hormones is outlined in table 1.1.

33
Hormone Source Main
Stimulus
Action(s) Effect on food
intake
Therapeutic potential
Amylin Pancreatic β cells Carbohydrate
Slows gastric emptying
Inhibits gastric secretion ↓
Analogue currently associated with improved glycaemic
control and weight loss in diabetics (Ratner et al., 2004).
Treatment for obesity under investigation.
CCK Intestinal I cells
Fat
Protein
Stimulates gall bladder
contraction
Inhibits gastric acid secretion
Slows gastric emptying
↓ Repeated administration of an agonist failed to support long
term use with no effect on weight loss (Jordan et al., 2007).
Ghrelin Gastric A cells Fasting
Meal initiator
Promotes gastric motility
Promotes pancreatic polypeptide
(PP) release
↑
Antagonists have been used in preclinical studies to show decreased food intake (Beck et al., 2004)1.
Treatment for obesity under investigation. Potential role to
stimulate eating in disease associated anorexia (Guillory et
al., 2013).
GIP Intestinal K cells
Carbohydrate
Fat
Enhances insulin secretion
→ 2
Antagonising GIP action has been proposed as anti-obesity
therapy (Miyawaki et al., 2002) 1 but no established
therapeutic potential for humans.
Oxyntomodulin
(OXM)
Intestinal L cells Fat Suppresses ghrelin
Slows gastric emptying ↓
OXM administration reduced energy intake and resulted in
weight loss (Wynne et al., 2005). Treatment for obesity
under investigation.
PP Pancreatic F cells
Protein
Fat
Slows gastric emptying
Reduces appetite ↓
Effects on appetite prolonged over 24 hour period.
(Batterham et al., 2003b). Analogue has been developed
and is currently under investigation in clinical trials
(Derosa and Maffioli, 2012).
Table 1.1 Overview of gastrointestinal hormones involved in appetite and food intake control ↑ Increase ↓ Decrease
1 Animal model 2 No evidence to support a major role in appetite and food intake control
34
1.4 Does the gut ‘taste’ sweetness?
Nutrient sensing by the cells of the gastrointestinal tract initiates a cascade of events
involving hormonal and neural pathways to induce digestion, the absorption of
nutrients and the control of energy intake (Rozengurt and Sternini, 2007). As
previously discussed, the presence of nutrients in the small intestine is associated
with decreased perceptions of hunger and decreased energy intake (Welch et al.,
1988) mediated by the modulation of gastric emptying, motility and the stimulation
of gastrointestinal hormones (Buchan, 1999). Furthermore, the action of specific
macronutrients to limit food intake varies suggesting the intestine may be able to
sense the presence of a particular nutrient. EEC are likely to be the first level of
integration of input from the gut lumen (Sternini et al., 2008) acting as primary
chemoreceptors to sense luminal contents and release signalling molecules. The
possible mechanisms underlying the chemosensory properties of EEC are depicted in
figure 1.4. However, EEC and their role in nutrient sensing are difficult to study in
humans as it is not possible to gain direct access to them. Furthermore, expression of
EEC is sparse and irregular along the gut and secretory responses and local
interaction with vagal afferents are either indirectly measured in hormone plasma
levels or not reflected at all. The initial recognition of nutrients and the subsequent
signalling mechanisms involved are still largely under investigation with the
majority of evidence based on in vitro and knockout animal models (Steinert and
Beglinger, 2011). Therefore, a degree of caution is needed when interpreting the data
as findings may not be representative of normal human in vivo EEC function.

35
Figure 1.4 Possible pathways involved in nutrient sensing by enteroendocrine
cells
Adapted from (Buchan, 1999, Sternini et al., 2008). Nutrients can interact directly
with enteroendocrine cells (EEC) (1) or adjacent epithelial cells (2) to act on
extrinsic and/or intrinsic afferent neurons. Finally, nutrients can interact with EEC
and other cells to stimulate the release of hormones (3) which can also have a
stimulatory (+) effect on neighbouring EEC and other epithelial cells.
1.4.1 Sweet taste receptors in the intestine: cell and animal models
As outlined in section 1.3.1.1, sugars and NNS are sensed in the mouth by the sweet
taste receptor T1R2 + T1R3. Their functional role as “taste receptors” in the
gastrointestinal tract has recently been established, at least in cell lines and rodent
models. The expression of sweet taste receptors (T1R2 + T1R3), as well as the G
36
protein α-gustducin involved in taste-specific signalling, have been found in EEC in
rats (Margolskee et al., 2007) and humans (Dyer et al., 2005, Jang et al., 2007). T1Rs
and α-gustducin were found to be expressed in enteroendocrine L cells which
stimulate the release of GLP-1. In addition, α-gustducin was also shown to be co-
localised with GIP expressing enteroendocrine K cells and GIP and GLP-1 co-
expressing enteroendocrine K/L cells (Jang et al., 2007). Rozengurt and colleagues
also demonstrated that α-gustducin was expressed in enteroendocrine L cells
expressing PYY and GLP-1 and co-expression with CCK in enteroendocrine I cells
(Rozengurt and Sternini, 2007, Rozengurt et al., 2006). Although molecular evidence
for expression may not always translate to function, the significance of these taste
signalling elements in EEC has been investigated.
Evidence for a possible functional role of sweet taste receptors was established by
Margolskee et al who demonstrated that T1R2 + T1R3 sweet receptor regulated
SGLT1 expression and increased glucose absorptive capacity in response to luminal
sugars and NNS in mice (Margolskee et al., 2007). Prior studies found SGLT1
expression was enhanced by glucose sensing, occurring independently of its
metabolism (Dyer et al., 2003) and was confirmed by Margolskee et al to be the
function of the T1R3 subunit (Margolskee et al., 2007). Furthermore, as apical
GLUT2 insertion is inhibited if SGLT1 activity is blocked, stimulation of the T1R3
also increases GLUT2 insertion (Mace et al., 2007). Comparable to the taste
receptors found in the mouth, gut expressed “taste receptors” respond to nutrients but
signal and communicate via mediators such as GLP-1. These signals are detected by
the enterocytes to cause an increase in SGLT1 expression and mediate glucose
metabolism, gastric emptying and augment satiety.
The sensing mechanisms involved are reliant upon direct contact with EEC as
intravenous administration of nutrients has shown no effect on gut hormone release
(Sternini et al., 2008). Using rodent EEC lines it was demonstrated that GLP-1 and
GIP secretion were enhanced when the concentration of sucralose, a NNS, was
increased (Dyer et al., 2007) and in the human enteroendocrine L cell line (NCI-
H716) glucose, sucrose and sucralose, all promoted GLP-1 release (Jang et al., 2007,
Margolskee et al., 2007). This effect can be blocked by the sweet taste receptor
antagonist, lactisole (Jiang et al., 2005) suggesting that the presence of sugars and
37
NNS can initiate gut-brain signalling via the release of gut hormone and concomitant
activation of vagal afferents. In vivo studies, using knockout mice lacking α-
gustducin or T1R3, observed no GLP-1 release following intragastric infusion of
glucose (Jang et al., 2007) highlighting the importance of the T1R3 and α-gustducin
system in sugar sensing.
1.4.2 Effects of sugars and non-nutritive sweeteners on the secretion of
gastrointestinal hormones and appetite: evidence in humans
Carbohydrate is a major source of energy in the diet and the majority of studies have
focused on glucose as the most important carbohydrate for human metabolism. It is
known that carbohydrate ingestion stimulates satiety mechanisms (Blundell et al.,
1994) but different sugars produce varying physiological responses. Sugar sensing in
the intestine modulates nutrient absorption, hormone release and gastrointestinal
motility (Dyer et al., 2003). The importance of intestinal glucose receptors in the
control of eating behaviour has been demonstrated to show that the presence of
glucose in the small intestine promotes hormone release and elicits vagal activity
(Lavin et al., 1996), both of which can affect appetite. The T1R2 +T1R3 receptors in
the gut would appear to be likely mediators of these effects given their role in the
mouth however the function of these receptors and the effect of carbohydrate
induced satiety requires further investigation. Comparable with the schematic
depicting oral sweet taste mechanisms in figure 1.2, a schematic representation
summarising the potential involvement of intestinal sweet taste receptor mechanisms
in response to sugars and NNS is modelled in figure 1.5.

38
Figure 1.5 Schematic representation of intestinal sweet taste receptor
mechanisms
Adapted from Cummings and Overduin, 2007. Sugars activate intracellular
signalling pathways such as α-gustducin (others not shown) leading to an increase
in intracellular calcium (Ca2+
). Rising intracellular Ca2+
leads to the release of
hormones such as glucagon-like peptide-1 (GLP-1) and peptide YY (PYY) which
enter the circulation or interact with vagal afferents to relay information to the brain
(1). In comparison, non-nutritive sweeteners (NNS) have no effect on gut hormone
release (2). The sweet taste receptor antagonist, lactisole, inhibits glucose stimulated
GLP-1 release (3) (* limited observations in vitro). The effect of sugars in
combination with NNS on gut hormone release has yielded inconsistent results (4).
EEC-enteroendocrine cell.

39
The differential effects of ingested sugars and the role of osmolality on gastric
emptying have been reported (Little et al., 2010b), and propose that a hexose sugar-
specific effect may mediate gastric emptying, rather than sweetness per se. Gastric
emptying is a brainstem mediated effect that can be used as an indirect proxy
measure of gut to brain signalling. The poorly absorbed hexose sugar, tagatose, an
epimer of fructose, slows gastric emptying more potently than either equi-osmolar
solutions of glucose or fructose (Little et al., 2010a). This highlights the possibility
for novel poorly absorbed sugars to maximise gut to brain signalling responses and
thereby suppress food intake. The sweetness of ingested sugars and NNS, and the
associated different effects on gastric emptying and gut hormone secretion, has also
been reported but curiously failed to show any change with equally sweet solutions
with only glucose potently stimulating the secretion of GLP-1 (Little et al., 2009,
Steinert et al., 2011). A potential problem was an unavoidable difference in
osmolality despite being matched for sweetness. However, all the sugars were given
at a concentration below that at which saline starts to slow gastric emptying (~1M).
Nonetheless this may suggest that sweet taste per se is not the underpinning
mechanism by which sweet tasting molecules delay gastric emptying in humans.
Furthermore it is possible that measuring gastric emptying, which occurs primarily
via a CCK1 receptor mediated pathway may not be a suitable measure particularly as
fatty acids are a potent stimulator of CCK (Lal et al., 2004), more so than
carbohydrates (unpublished data from this department). However, the CCK1
receptor antagonist dexloxiglumide completely abolishes the effects of glucose,
fructose and tagatose on gastric emptying (Little et al., 2010a). Therefore measuring
peripheral blood levels of CCK apparently overlooks physiologically active effects
of CCK, presumably operating by paracrine actions on adjacent vagal afferents that
do not translate to elevated plasma levels.
At the point in time that the studies in this thesis commenced, the data were limited,
with no published evidence that the effects of sweet tastants on human gastric
emptying are mediated via the sweet taste receptor. If this were the case it was
hypothesised that NNS should replicate the effects of glucose. However, given the
convincing data from cell and animal models, experimentally addressing this
possibility further in healthy humans substantially formed the part of the work
presented this thesis, and underpinned the funding received from BBSRC.
40
Subsequent publications that appeared during the latter course of my studies will be
introduced and discussed in the relevant chapters.
1.4.2.1 Potential significance of non-nutritive sweeteners to diet and health: a
conflicting and confused landscape
Whatever the cellular basis for the response, the recognition that EEC, in response to
luminal sugars, secrete anorectic gut hormones, such as GLP-1, is of increasing
importance in the face of the obesity epidemic. In particular the possible target of
sweet taste signalling would present a valuable opportunity for intervention by
nutritional manipulations. Not only do sweet tasting foods stimulate eating in
humans via hedonic mechanisms, but the increased consumption of processed food
products is frequently linked to the surge in obesity. As a consequence, the food
industry has increased their use of NNS in replace of simple sugars on the
assumption they are nutritionally inert (Kellett et al., 2008). The effect of NNS on
hormone secretion has been investigated using different models with inconsistent
results (Table 1.2). Jang et al (Jang et al., 2007) and Margolskee et al (Margolskee et
al., 2007) demonstrated the NNS, sucralose, stimulated GLP-1 secretion from a
human L-cell line (NCI-H716 cells) and mouse EEC line (GLUTag cells)
respectively. However, the majority of in vivo human data have failed to confirm the
effects of NNS on hormones secretion observed in vitro (Ma et al., 2009, Steinert et
al., 2011). This supports the consensus that NNS, at least in isolation, are not capable
of stimulating hormone secretion. It is also worth noting that the concentrations of
NNS used in these in vitro studies were excessive (19.8 grams vs. 0.06 grams in vivo
in humans).
NNS consumption and the effect on appetite and food intake have raised concerns
with suggestions NNS may increase appetite and lead to weight gain (Egan and
Margolskee, 2008). However, the majority of data suggests NNS do not have
undesirable effects on appetite, food intake, and blood glucose or insulin levels
(Anton et al., 2010, Bellisle and Drewnowski, 2007, De La Hunty et al., 2006). The
diversity of the human diet ensures consumption of NNS in isolation, usually in the
form of diet beverages, is uncommon. The regulation of intestinal glucose absorption

41
via both SGLT1 and the GLUT2 has shown sensitivity to NNS. This has been
demonstrated, albeit again only in animal models, by an up regulation of SGLT1 and
an increase in GLUT2 insertion following supplementation of the diet with
sucralose, acesulfame-k (ace-k) and saccharin (Mace et al., 2007, Margolskee et al.,
2007). Using a proxy measure of intestinal glucose absorption this effect was not
replicated in humans (Ma et al., 2010). One human study showed oral ingestion of
sucralose and ace-k (amounts not specified) caused an increase in GLP-1 after
subsequent glucose ingestion but no change in blood glucose or insulin (Brown et
al., 2009). Other GLP-1 effects such as satiety were not measured. In contrast Ma et
al (Ma et al., 2009) found no difference in GLP-1 concentrations following
intragastric infusion of a sucralose and glucose combination arguing against a
significant effect. The biological significance of the different findings is unclear but
interestingly the studies used different methods of administration (oral vs.
intragastric). There remains a lack of clarity about whether NNS in combination with
caloric sweeteners could alter appetite and/or glucose metabolism, not least due to
considerable variations in experimental protocols and outcome measures.
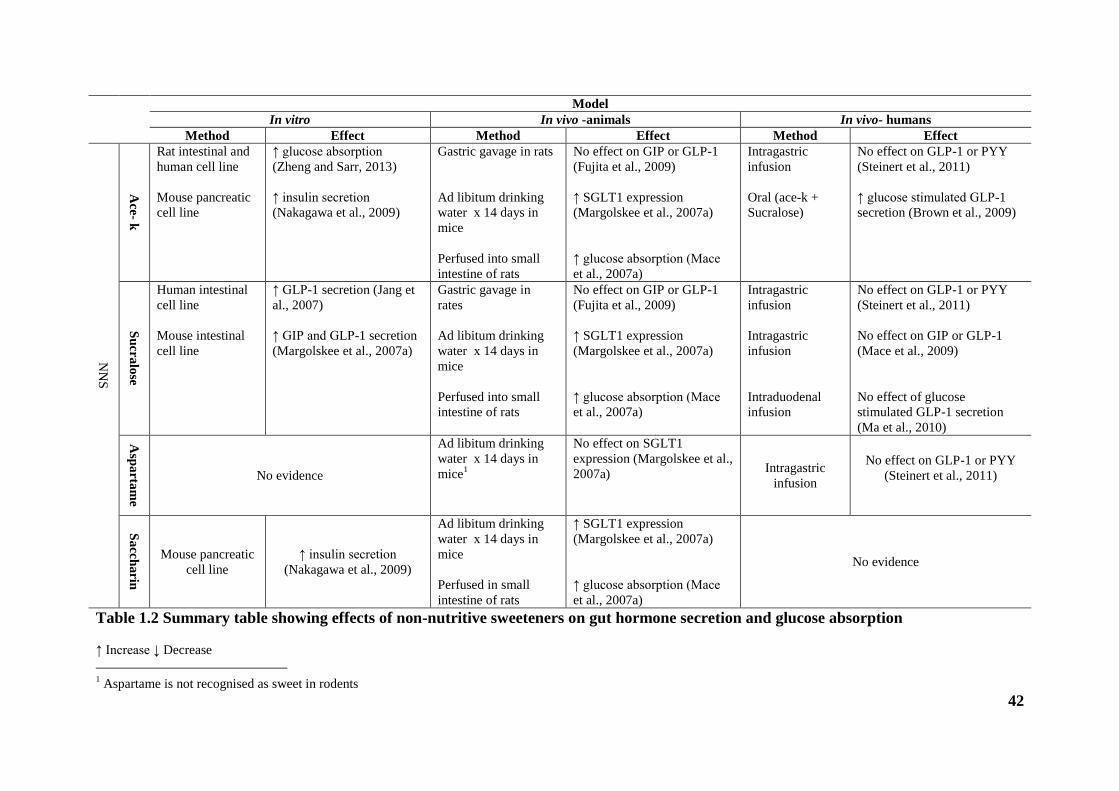
42
Model
In vitro In vivo -animals In vivo- humans
Method Effect Method Effect Method Effect
NN
S
Ace
- k
Rat intestinal and
human cell line
Mouse pancreatic
cell line
↑ glucose absorption
(Zheng and Sarr, 2013)
↑ insulin secretion
(Nakagawa et al., 2009)
Gastric gavage in rats
Ad libitum drinking
water x 14 days in
mice
Perfused into small
intestine of rats
No effect on GIP or GLP-1
(Fujita et al., 2009)
↑ SGLT1 expression
(Margolskee et al., 2007a)
↑ glucose absorption (Mace
et al., 2007a)
Intragastric
infusion
Oral (ace-k +
Sucralose)
No effect on GLP-1 or PYY
(Steinert et al., 2011)
↑ glucose stimulated GLP-1
secretion (Brown et al., 2009)
Su
cra
lose
Human intestinal
cell line
Mouse intestinal
cell line
↑ GLP-1 secretion (Jang et
al., 2007)
↑ GIP and GLP-1 secretion
(Margolskee et al., 2007a)
Gastric gavage in
rates
Ad libitum drinking
water x 14 days in
mice
Perfused into small
intestine of rats
No effect on GIP or GLP-1
(Fujita et al., 2009)
↑ SGLT1 expression
(Margolskee et al., 2007a)
↑ glucose absorption (Mace
et al., 2007a)
Intragastric
infusion
Intragastric
infusion
Intraduodenal
infusion
No effect on GLP-1 or PYY
(Steinert et al., 2011)
No effect on GIP or GLP-1
(Mace et al., 2009)
No effect of glucose
stimulated GLP-1 secretion
(Ma et al., 2010)
Asp
arta
me
No evidence
Ad libitum drinking
water x 14 days in
mice1
No effect on SGLT1
expression (Margolskee et al.,
2007a)
Intragastric
infusion
No effect on GLP-1 or PYY
(Steinert et al., 2011)
Sa
cch
arin
Mouse pancreatic
cell line
↑ insulin secretion
(Nakagawa et al., 2009)
Ad libitum drinking
water x 14 days in
mice
Perfused in small
intestine of rats
↑ SGLT1 expression
(Margolskee et al., 2007a)
↑ glucose absorption (Mace
et al., 2007a)
No evidence
Table 1.2 Summary table showing effects of non-nutritive sweeteners on gut hormone secretion and glucose absorption
↑ Increase ↓ Decrease
1 Aspartame is not recognised as sweet in rodents
43
1.5 Gut-brain communication and the pathways relating to appetite and food
intake
Multiple neural systems are involved in the control of food intake. The signals
arising from the gastrointestinal tract integrate in the brain, via the vagus nerve or
directly through an incomplete blood brain barrier (BBB), and the regulation of food
intake lies in the gut-brain axis. The hypothalamus and brainstem are at the core of
this homeostatic function receiving hormonal and neural input from the endocrine
system and gastrointestinal tract (Berthoud, 2008). The remainder of this section
focuses firstly on the way EEC sugar sensing and associated signals, outlined in
previous sections, interact with visceral afferents, and how they are integrated in the
brain to influence appetite and energy intake, and secondly how these homeostatic
functions are strongly influenced by non-homeostatic factors relating to the
environmental factors, discussed in 1.2 and 1.3.1, and processed via the limbic
system. Relevant brain areas involved in the control of appetite and food intake are
shown in figure 1.6.
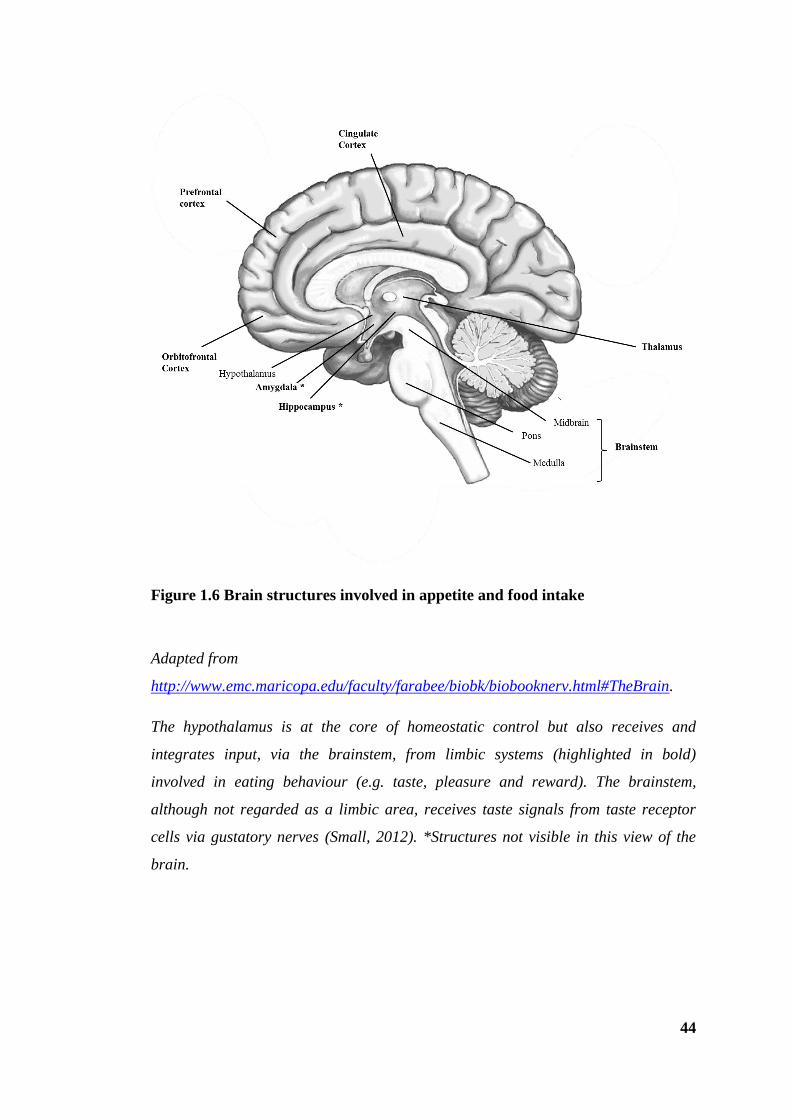
44
Figure 1.6 Brain structures involved in appetite and food intake
Adapted from
http://www.emc.maricopa.edu/faculty/farabee/biobk/biobooknerv.html#TheBrain.
The hypothalamus is at the core of homeostatic control but also receives and
integrates input, via the brainstem, from limbic systems (highlighted in bold)
involved in eating behaviour (e.g. taste, pleasure and reward). The brainstem,
although not regarded as a limbic area, receives taste signals from taste receptor
cells via gustatory nerves (Small, 2012). *Structures not visible in this view of the
brain.
45
1.5.1 Innervation of the gastrointestinal tract and interaction with
enteroendocrine cells
The accurate coordination of regulatory functions of the gastrointestinal tract, such
as absorption, secretion and motility, are modulated by intrinsic and extrinsic
innervation (Farre and Tack, 2013) which monitor the mechanical and chemical gut
environment in order to coordinate appropriate responses (Blackshaw et al., 2007).
Primary afferent nerves of the gastrointestinal tract are divided into intrinsic and
extrinsic categories. The connections and cell bodies of the intrinsic primary
afferents neurons (IPANs) lie completely within the gut wall and the extrinsic
primary afferents lie within vagal and spinal afferent neurons (Furness et al., 1998)
(figure 1.7). IPANs are situated in the enteric nervous system (ENS) and are
principally involved in the control and coordination of gastrointestinal motility and
secretion. The system comprises neurons of myenteric and submucosal plexuses
resembling those found in the CNS (Phillips and Powley, 2007) and are able to
perform in the absence of extrinsic innervation but coordinate and relay information
from both pathways. IPANs are stimulated by the presence of food in the
gastrointestinal lumen and convey to neurons in the ENS which control digestion
(Kunze and Furness, 1999).
The entire length of the gastrointestinal tract is innervated by spinal primary afferent
neurons in the distal gut and vagal primary afferent neurons predominating in the
proximal gut (Brookes et al., 2013). Vagal afferent nerves are able to detect chemical
and mechanical changes in the gut, and gastrointestinal function is thus modulated
when vagal afferents integrate with vagal efferents known as the vagovagal reflex
(Aziz and Thompson, 1998, Rogers et al., 1995). The circuitry for these reflexes lies
within the nucleus of solitary tract (NTS), where vagal afferents terminate, and the
dorsal motor nucleus (DMN) of the brainstem region (Konturek et al., 2004).
Activation of these afferent neurons is thought to depend on pre- and post-absorptive
mechanisms as they do not protrude into the gut lumen itself (Raybould, 1998).
Vagal chemoreceptors including glucoreceptors have been described and as
discussed previously gut hormone receptors (CCK, GLP-1 and Y2) have been
identified on afferent fibres (Nakagawa et al., 2004, Koda et al., 2005). Furthermore,
the ability of EEC, possibly via the sweet taste receptor system, to respond to
incoming carbohydrates and the concomitant stimulation of vagal afferents and gut

46
hormones, which also act to stimulate vagal afferents in close vicinity, provides the
interface between the gastrointestinal lumen and the nerve terminals (Höfer et al.,
1999, Steinert and Beglinger, 2011).
Figure 1.7 Arrangement of vagal, spinal and intrinsic primary afferents
Adapted from (Mayer, 2011). Mechanical and nutrient stimuli can activate extrinsic
(spinal and vagal) and intrinsic primary afferent neurons (IPANs). Vagal and spinal
afferent neurons relay information to the nucleus of the solitary tract (NTS) and
dorsal motor nucleus (DMN) of the brainstem and spinal cord respectively with
networks running into myenteric regions. IPANs are confined within the gut wall and
relay information locally to regulate gut function independent of extrinsic
innervation.
47
1.5.2 Areas of the brain involved in appetite and energy intake control
1.5.2.1 Hypothalamus
The hypothalamus receives and integrates tonic signals from adipocytes reflecting
energy stores (e.g. leptin), episodic signals from the gut, including hormones (e.g.
GLP-1), and circulating nutrients including glucose. The output of this integration of
tonic and episodic signals is energy homeostasis. These signals are processed in the
hypothalamic ARC in which two distinct pathways exist; the lateral hypothalamic
area (LHA) termed the “appetite centre” expresses anorectic factors, the other
involves the ventromedial hypothalamic area (VMH) also known as the “satiety
centre”, expressing orexigenic factors (Konturek et al., 2004). Early animal studies
in support of this demonstrate lesions in the LHA or VMH significantly alter feeding
behaviour, the latter causing a decrease in energy intake leading to cachexia and
anorexia and the former resulting in hyperphagia and obesity (Konturek et al., 2004).
ARC neurons, involved in the appetite inhibiting pathway, function through the
release of α-melanocyte–stimulating hormone (αMSH) derived from pro-
opiomelanocortin (POMC), which acts on melanocortin receptors (MCR3 and
MCR4) to inhibit food intake. Conversely ARC neurons, expressing the
neurotransmitter NPY and agouti–related peptide (AgRP), signal to stimulate
feeding. Alterations in the release of these neuropeptides to control feeding
behaviour occurs via NPY-POMC interactions (Broberger and Hökfelt, 2001). For
example, the release of AgRP has an antagonistic effect on MC3 and MC4 receptors
involved in the POMC pathway. Similarly, the peptides that stimulate the POMC act
as a brake on hypothalamic NPY signalling (Broberger and Hökfelt, 2001). A critical
target of the ARC neurons is the PVN which signals to higher brain centres and other
hypothalamic nuclei to increase or decrease appetite (Murphy and Bloom, 2006).
1.5.2.2 Brainstem
The hypothalamus is not exclusive in the homeostatic control of energy intake. A
network of neural circuits involved in tasks such as the digestion and absorption of
nutrients are contained within the brainstem and do not require input from

48
hypothalamic structures (Berthoud, 2008). Studies have demonstrated this using the
decerebrate rat (forebrain surgically disconnected) which showed the brainstem
capable of responding to gastrointestinal hormones necessary for the short term
regulation of energy intake (Broberger and Hökfelt, 2001). The dorsal vagal complex
(DVC) facilitates communication between the hypothalamus and periphery to
control food intake. The reciprocal connections between the hypothalamus and
brainstem enable the integration of signals to generate efferent signals that
coordinate food intake and gastrointestinal function (Hussain and Bloom, 2013,
Schwartz, 2000). Furthermore, vagal afferent nerves terminate in the NTS, making
neurons in this area the terminus for many signals arising from the gut in order to
limit food intake.
1.5.3 Signalling and central control of food intake
The gut-brain axis involves the coordination of hypothalamic, brainstem and vagal
signalling. The presence of ingested nutrients in the gastrointestinal tract stimulates
mechanoreceptors and chemoreceptors to signal via vagal afferents to control energy
intake. Gut hormone signals are also relayed via the median eminence (ME) and AP,
structures which have an incomplete BBB, to the ARC of the hypothalamus and
NTS of the brainstem respectively (Banks, 2006). The role of the BBB in mediating
communication between the brain and signals from the gastrointestinal tract is
believed to be an important mechanism underlying gut-brain interaction.
Mechanisms suggested include a direct transfer allowing hormones to act directly
upon neurons within areas of the brain involved in appetite and food intake
(Chaudhri et al., 2008, Rogers et al., 1995) and the ability of hormones to alter the
functions and/or secretions from the BBB to have an effect on feeding (Banks,
2006). A representation of these systems operating in the gut-brain axis control of
food intake and appetite is shown in figure 1.8.

49
Figure 1.8 Gut-brain pathways involved in the control of appetite and food intake
Adapted from (Hussain and Bloom, 2013, Suzuki et al., 2010). The hypothalamus, brainstem
and corticolimbic system integrate signals emanating from the gut and external stimuli (e.g.
emotional cues, taste). The vagus nerve conveys neural signals from the gut to nucleus of the
solitary tract in the brainstem. Gut hormones also act on the arcuate nucleus in the
hypothalamus via the median eminence which forms an incomplete blood brain barrier and
relays directly to the brainstem via area postrema. Solid black lines indicate inhibitory effects
and dashed lines indicate stimulatory effects. Hedonistic and environmental influences are
processed by the corticolimbic system which modulates hypothalamic feeding centres.

50
1.5.3.1 Hedonic mechanisms affecting appetite and energy intake
Alongside the homeostatic mechanisms mentioned above, the control of food intake
is strongly influenced by higher brain centres which process the sensory pleasure and
reward aspects of eating via the corticolimibic system. This system includes areas
such as the insula, amygdala, hippocampus, cingulate cortex, orbitofrontal cortex
(OFC), prefrontal cortex and ventral and dorsal striatum (Schloegl et al., 2011).
When food is presented, visual and olfactory information is processed via olfactory
fibres which relay to the DVC and corticolimbic system to determine palatability, a
principal determinant of food intake (Rolls, 2005, Rolls, 2006). At the time of
ingestion, gustatory, olfactory and somatosensory systems are stimulated, taste is
conveyed, via gustatory and sensory fibres to the DVC and corticolimbic system
(Rolls, 2006, Small, 2012) including the primary gustatory cortex which comprises
of the insula and frontal operculum (Frank et al., 2008) and the OFC, prefrontal
cortex and dorsal and ventral striatum which integrate with other cognitive inputs to
further characterise the reward value of the food ingested (O'Doherty et al., 2001,
O'Doherty et al., 2002). This is thought to constitute learning, underpinning
subsequent phenomena of ‘liking and wanting’ which motivate subsequent feeding
behaviour (Berthoud, 2006). This is integrated with homeostatic mechanisms to alter
food intake with environmental cues dominating homeostatic regulation (Berthoud,
2006) and gut hormones modulating neuronal activity in brain regions associated
with reward processing (Grill et al., 2007, Batterham et al., 2007).
1.6 Methodologies used to study feeding behaviour
In light of the current obesity epidemic the mechanisms controlling appetite and food
intake have been a major focus of research in recent years. In vitro research and in
vivo animal studies constitute the majority of work on mechanisms involving
intestinal sweet taste receptors and often focus on single processes in isolation.
However, it is evident from the literature presented in this chapter that there are
many complex pathways and mechanisms which may interact to influence feeding
behaviour making it difficult to translate and apply findings to humans particularly
51
as psychological and environmental processes are profound determinants of human
feeding behaviour.
Biomarkers of satiation and satiety in human physiology studies require markers that
are not only feasible but are sensitive and specific measures of appetite. Methods
employed include that of functional neuroimaging techniques to measure human
brain responses that relate to appetite. Furthermore, given the evidence supporting
gastric volume as a determinant of meal size, the use of physical measures such as
those relating to gastric distension and gastric emptying are also utilised. Gastric
emptying is considered to be a good surrogate marker for activation in the gut-vagus-
brain regulatory axis (Little et al., 2013, In review). Hormonal and biochemical (i.e.
glucose, insulin and GLP-1) measures are available as biomarkers of mechanisms
that regulate satiation and satiety and most human physiology studies are likely to
use a combination of these measures in conjunction with behavioural or subjective
appetite measures to understand not only the physiology of appetite and intake but
also the causal factors.
Visual analogue scales (VAS) are a commonly used tool to assess subjective feelings
of appetite (e.g. hunger and fullness) in studies examining the impact of various
foods. The reproducibility and validity of using VAS in appetite research was
confirmed (Flint et al., 2000) and correlates well with food intake. Measuring actual
food intake, either free-living outside the laboratory environment via self-reported
measures (e.g. diaries) and/or ad-libitum test meals (e.g. buffet) is also a commonly
used method. Both have inherent problems as they are subject to bias and
underreporting or do not accurately reflect intake due to the laboratory environment.
However, measuring food intake in the laboratory enables the intake of meals, with a
fixed macronutrient composition, to be quantified and has proved a reproducible
assessment of food intake (Gregersen et al., 2008).
1.6.1 Functional brain imaging
As previously discussed, nutrient sensing and the associated gut hormone release
result in neuronal responses in the brainstem and hypothalamus to mediate the
inhibitory effects of nutrient intake on gastric emptying, appetite and food intake.

52
The intricate connection of the gastrointestinal tract to the CNS is fundamental to
these mechanisms. Our knowledge of the CNS regions involved in maintaining
energy homeostasis has been significantly advanced by experimental studies in
animals (Fraser et al., 1995, Kuo et al., 2007). For example, nutrient induced c-fos
activation in the brainstem regions where gut vagal afferents terminate has furthered
our understanding of the role of vagal afferents in the gut-brain axis and
demonstrated how critical the vagal gut-bran axis is in controlling food intake as
evidenced by vagotomised animals (Schwartz, 2000). Furthermore, functional brain
imaging in intact and vagotomised rats has demonstrated the importance of
circulating factors such as insulin in addition to vagal pathways for the brain
responses to glucose (Tsurugizawa et al., 2009). However, the clinical relevance to
humans is restricted by species differences, not least in the degree of brain
development between the two. Studies using animal models are limited by their
inability to fully explore the more highly developed areas of the brain involved in
eating behaviour that are found in humans but not animals. Furthermore, subjective
perceptions cannot be measured in animals.
Unravelling the neuroanatomical sites of eating behaviour has been facilitated by the
development of neuroimaging techniques such as positron emission tomography
(PET) and functional magnetic resonance imaging (fMRI). Both techniques have
advantages and limitations associated with their use. However, fMRI is currently the
best tool for exploring brain function (Logothetis, 2008) and has the potential to
provide the most accurate measurement of the brains response to nutrient ingestion.
The tracking of neuronal activity in response to nutritional stimuli has begun to be
characterised in vivo through the use of fMRI (Lassman et al., 2010, Jones et al.,
2012). The MRI technique involves the use of a powerful magnetic field causing
protons to rotate about the axis. Upon their return to the original position in the
magnetic field they emit detectable radiofrequency energy (Howseman and Bowtell,
1999). fMRI enables the observation of changes in neural activity over time.
Increased neural activity leads to increased regional cerebral blood flow and an
associated increase in oxygenated blood; for this reason, increased neuronal activity
alters the concentrations of oxyhaemoglobin and deoxyhaemoglobin, which are
detected using MRI (Tataranni and DelParigi, 2003). fMRI measures changes in the

53
blood oxygen level dependant (BOLD) signal. The BOLD signal is a proxy measure
of neural activity and reflects the concentrations of deoxyhaemoglobin, an intrinsic
paramagnetic contrast agent, relative to the concentrations of oxyhaemoglobin thus
influencing the MR signal (Logothetis and Wandell, 2004). The major advantage of
fMRI is its relatively high spatial and temporal resolution with advances enabling
hypothalamic and brainstem imaging (Liu et al., 2000). That said, the hypothalamus
is positioned deep in the midbrain which makes imaging technically difficult.
Furthermore, the BOLD signal is a crude marker of neural response and imaging
lacks the specificity to identify the contribution of particular nuclei within
hypothalamic circuitries.
The most frequently used paradigm in fMRI studies examines brain responses to
different stimuli (visual food cues i.e. images of high vs. low calorie food) presented
in a block or event related design (Amaro and Barker, 2006). These approaches
explore primarily hedonic responses and often miss fundamental brain regions (e.g.
hypothalamus) which are key to homeostatic regulation.
A study by Liu et al was one of the first to use fMRI analysis to show neuronal
activation following the ingestion of glucose. A decrease in hypothalamic BOLD
signal occurred 7-12 minutes after oral ingestion of glucose (Liu et al., 2000). In this
instance, the relationship between glucose ingestion and brain activation was
demonstrated using a technique called time clustering analysis (TCA). Subsequent
studies have reinforced these findings showing a dose-dependent and prolonged
decrease in BOLD signal in the hypothalamus following glucose ingestion (Smeets
et al., 2005b). In a further study by Smeets et al they showed no hypothalamic
BOLD decrease following equally sweet (aspartame) or calorific (non-sweet
maltodextrin) solutions suggesting activity is glucose sensitive requiring both
sweetness and energy content (Smeets et al., 2005a). In addition, a more pronounced
response following oral glucose as opposed to intravenous administration was
demonstrated (Smeets et al., 2005b). However, these results may be flawed by the
hedonic responses to sugar ingestion as it is impossible to exclude the pre-gastric
effects relating to sight, smell and taste. Furthermore, the movement of the head and
neck during the swallowing and consumption of test meals can result in imaging
artefacts. Nutrients administered directly into the gut via oro- or naso-gastric tube

54
eliminates these confounding issues and theoretically enable the study of gut to brain
signalling independently. More recently, more detailed imaging of the brain
responses to glucose have been investigated within this department using
physiological MRI (physMRI) which enables the exploration of BOLD signal
response to nutrients over time with a high spatial and temporal resolution across the
whole brain (Jones et al., 2012, Little et al., 2013, In review). In particular, detailed
imaging of the brainstem, a region that is the first point of contact with signals
transmitted from the gastrointestinal tract via vagal afferents along with other
regions of interest was investigated following an intragastrically administered bolus
of glucose (Little et al., 2013, In review). In line with observations previously
discussed, a decrease in BOLD signal was demonstrated in the hypothalamus but
also in brainstem regions such as the medulla and pons. However, using a CCK
receptor antagonist the study demonstrated these responses were not solely
dependent on the activation on vagal afferents suggesting additional actions of
circulating glucose and gut hormones such as GLP-1 which were temporally related
to the observed decrease in BOLD signal.
physMRI differs from conventional fMRI in two ways; i) there is no predefined
model and ii) the setup in conventional fMRI usually consists of a task being
switched between separate conditions in an on/off manner. This is not the case for
physMRI where temporal changes in the BOLD signal are investigated from a
predefined baseline, usually the average of the images just before the infusion is
administered into the gut with no predefined model present and no switching
between on and off states.
The overall response to ingested nutrients will however not exclusively depend on
gut-to-brain signals. In particular, no work has ever been undertaken to integrate
brain responses to oral and gastrointestinal nutrient sensing, which more closely
resembles consumption.
1.7 Summary and aims
In summary, a cascade of gut derived and metabolic signals converge within the
CNS to control appetite and food intake. The role of gastrointestinal sweet ‘taste’
55
sensing in humans is unclear, and in particular, the important role of feedback
signalling from oral and gastrointestinal stimulation to the brain in response to sugar
and NNS ingestion is of great importance. Sugar and NNS consumption are
commonplace and the overall aim of this thesis is to better understand their effects in
the gut-brain axis.
The underpinning hypothesis is that sweet taste receptors in the gut contribute to the
effects of sweet tastants in the gut-brain axis.
All studies were conducted in healthy young adult humans.
Chapter 3: The role of the gut sweet taste receptor in mediating the responses to
glucose: an exploration using lactisole
Nutrient sensing in the gut is a rapidly evolving research field, albeit mostly in in
vitro and animal models, but it is tempting to speculate that sweet taste signalling
mechanisms expressed in the gut may function to mediate the responses to sugar and
be therapeutic targets for appetite related disorders. The objective of this study was
to use the sweet taste receptor antagonist lactisole as a tool to investigate the role of
the gut sweet taste receptors in mediating the physiological response to glucose.
Chapter 4: Non-nutritive sweeteners do not enhance the glycaemic or appetitive
responses to ingested glucose
NNS consumption has increased considerably and in most cases the putative
mechanisms by which they operate within the gastrointestinal system are studied in
isolation. However, consumption in isolation is rare in a diverse Westernised diet,
and concerns have been raised about the synergistic effect of NNS and sugars
potentially increasing glucose uptake via upregulation and insertion of transporters.
The objective of the study was therefore to determine the effects of a panel of three
commonly consumed NNS (aspartame, saccharin, ace-k) given in real-life doses in
combination with glucose on glycaemic and appetite responses.
56
Chapter 5: Gastric emptying and CNS responses to orally and intragastrically
administered sweet tastants
This chapter details two studies which aimed to further our understanding of the
influences of sugars and NNS in mediating mouth/gut to brain signalling and
appetite responses. Most studies investigate satiety mechanisms in isolation yet the
synergy between sequential oro-sensory and gastrointestinal factors is more
indicative of real life consumption, and may be essential for a particular effect to
become fully apparent. The first study aimed to establish whether sweet tastants have
equivalent effects on gastric emptying (again used as a proxy measure of gut-brain
signalling) and appetite responses when consumed orally or administrated
intragastrically. The second study aimed to define the areas in the human brain,
using fMRI, where oral and gastrointestinal ‘sweetness’ interact. This enabled the
dissection of the guts response to ingested sugar and the cerebral activation that
ensues and, the interplay with the hedonic system activated by oral taste. This is a
highly robust and non-subjective way to assess sensory and signalling mechanisms.

57
CHAPTER 2
General Methods
Two or more of the studies described in this thesis have the following methods,
protocols and measurements in common. Methods and protocols used in specific
studies are detailed in each experimental chapter.
2.1 Ethical Approval
Ethical approval was granted by the National Health Service North West Research
Ethics Committee and The University of Manchester prior to commencing study
recruitment. Specific references are given in each study chapter.
2.2 Participants
All participants were recruited from the staff and students of Salford Royal
Foundation Trust Hospital and The University of Manchester via poster and website
advertisement. Those who expressed an interest in volunteering were invited to
attend a pre-study screening. The screening assessed that participants met the
inclusion criteria for each particular study.
2.2.1 General inclusion criteria
The criteria for participation in studies were as follows, unless stated otherwise:
Aged between 18-45 years
BMI between 18-25kg/m2
General good health - no history of gastrointestinal disorders,
metabolic disorders or eating disorders
Non-smokers
58
Female participants neither pregnant or lactating
Not currently taking any medications (other than females taking oral
contraceptives)
No self-reported reported weight change +/- 3kg in previous six
months or currently dieting
No self-reported intolerance or allergy to foods supplied during the
study
Low score for dietary restraint (section 2.2.2.2)
No participation in other scientific research in three months prior to
study
Studies with additional or different inclusion criteria are specified in the methods
section of the specific experimental chapter.
2.2.2 Screening
Each participant was given a study specific information sheet to read prior to the
screening visit. During the screening, details of the study were explained to each
participant and they were given the opportunity to ask any questions. If they were
happy to take part, informed written consent was obtained. During the screening visit
anthropometric measurements (section 2.2.2.1) were collected and participants
completed the following questionnaires:
General information (Appendix I)
Medical screening (Appendix II)
Three factor eating questionnaire (TFEQ) (Appendix III)
2.2.2.1 Anthropometry
Measurements for height, weight and BMI were made for all studies in this thesis as
follows:
59
Weight was measured to the nearest 0.1kg using a flat scale (Seca, Hamburg,
Germany). Participants removed footwear and removed any heavy items
while being weighed.
Height was measured to the nearest 0.01m using a stadiometer (Seca,
Hamburg, Germany). Participants removed footwear and stood flat-footed
with their heels against a back plate.
BMI was calculated using the following formula:
BMI (kg/m2) = Body mass (kg)
Height2
(m2)
2.2.2.2 Three factor eating questionnaire
TFEQ is a tool that evaluates dietary restraint, disinhibition and hunger; three
dimensions of eating behaviour (Stunkard and Messick, 1985) and is a commonly
used tool to evaluate eating behaviour in appetite research (Blundell et al., 2010).
Dietary restraint theory is an approach that encompasses internalised behavioural and
cognitive processes determining eating behaviour. That is, cognitive processes
override physiological hunger and satiety cues (Bond et al., 2001). Restrained eaters
may restrict food consumption for a period of time to achieve certain goals such as
weight loss. However, studies have shown disinhibition experiences (emotional
stress) interfere with self-control and may result in overeating (Lowe, 1993). A
concept of one of the studies in this thesis (chapter three) relies upon participants
responding to internal cues that initiate meal termination at a test meal. Furthermore,
in all studies in this thesis participants are required to report subjective feelings of
appetite pre- and post-intervention making it essential to measure dietary restraint in
prospective participants.
The questionnaire consists of fifty one questions, divided into three sections, each
relating to one of the three dimensions of eating behaviour. Participants completed
all fifty one questions but the responses pertaining to dietary restraint only were
analysed and are reported herein. The first twenty one questions assess dietary
60
restraint in which responses are scored either zero or one and totalled to give a total
restraint score.
For example:
True False
I deliberately take small helpings as a means of controlling my weight
Higher scores indicate higher levels of dietary restraint (above ten) while low
dietary restraint is generally accepted as a score of five or lower. (Bellisle et al.,
2009). The median split of scores (high/low) is often used to determine a score
which indicates a high degree of dietary restraint (Rideout and Barr, 2009, Steere
and Cooper, 1993). Participants were categorised as restrained eaters according to
whether they fell above the median (score of six) determined from two previous
studies involving females (Yeomans et al., 2003) and male and female volunteers
(Lesdama et al., 2012). Therefore, any participants with a dietary restraint score
above six (one participant in chapter three part III) were therefore excluded from
taking part in the studies outlined herein.
2.3 Experimental protocols
2.3.1 Pre-study standardisation and fasting
Twenty four hours prior to each study visit participants were asked to refrain from
consuming alcohol or taking part in vigorous physical exercise. They were advised
to consume and complete their evening meal before 22:00 hours the night before
each visit following which they were instructed not to consume any other food or
drinks (excluding water) until they arrived at the laboratory the next day. Participants
were asked to consume similar foods for their evening meal the night before each
study visit.

61
2.3.1.2 Female participants
Hormonal fluctuations during the menstrual cycle can influence appetite and eating
behaviour (Dye and Blundell, 1997). It is therefore important to control the
menstrual cycle phase in which female participants are studied, particularly as it may
obscure responses to experimental conditions (Buffenstein et al., 1995). Female
participants not taking the oral contraceptive pill were therefore studied on days six
to twelve following menstruation.
2.3.2 Subjective appetite and taste ratings
VAS are tools that rate experience on a continuous dimension between two
possibilities such as ‘Not at all’ and ‘Extremely’. VAS are commonly used to
measure a variety of subjective sensations including in the field of appetite research.
Appetite ratings were collected in three out of four studies in this thesis using VAS
presented on single A4 paper sheets (Appendix IV). Each rating was presented as a
question with a 100mm horizontal line underneath and the terms ‘Not at all’ and
‘Extremely’ anchored at either end.
For example:
How strong is your desire to eat?
Not at all
Extremely
Eleven questions were asked at specific time points to measure ratings of ‘clear-
headed’, ‘desire to eat’, ‘energetic’, ‘friendly’, ‘full’, ‘happy’, ‘hungry’, ‘jittery’,
‘nauseous’, ‘relaxed’ and ‘thirsty’. The VAS included subjective ratings of mood
(e.g. relaxed and friendly) to distract participants from focusing on current
motivational state and are not reported herein. Each VAS was presented to the
participant at the necessary time point and they were asked to place a mark on the
line corresponding to their response. Ratings were then scored on a scale from zero
62
(not at all) to one hundred (extremely) using a ruler to measure, to the closest
millimetre, where the mark intersected the horizontal line. Higher scores implied a
greater subjective sensation. Participants were not permitted to review previously
completed VAS questionnaires.
Taste ratings were presented in a similar VAS format (Appendix V). After sampling
each test drink (chapter three and four), participants were asked ‘How (rating) is the
drink’ which included ‘creamy’, ‘pleasant’, ’fruity’, ‘salty’, ‘strong’, ‘sweet’, ‘bitter’
and ‘sour’. Each rating was presented as a question with a 100mm horizontal line
underneath and the terms ‘Not at all’ and ‘Extremely’ anchored at either end.
Participants were asked to place a mark on the line corresponding to their response
which was then scored on a scale from zero (not at all) to one hundred (extremely)
using a ruler to measure, to the closest millimetre, where the mark intersected the
horizontal line.
Studies investigating the validity and reliability for measuring appetite using this tool
have investigated the reproducibility of VAS questionnaires and their relationship to
food intake and feeding behaviour producing inconclusive results (Raben et al.,
1995, Flint et al., 2000, Stubbs et al., 2000, Parker et al., 2004). The validity of VAS
as a measure of appetite is multifaceted. Ratings of appetite are subjective and
should therefore be interpreted with caution or used in conjunction with other
methods such as measuring food intake. The VAS have shown motivational appetite
ratings such as ‘hunger’ and ‘desire to eat’ are related to subsequent food intake
(Parker et al., 2004) and best used in within subject, repeated measures designs
(Stubbs et al., 2000) as is used in studies within this thesis.
2.3.3 Gastric emptying - 13
C breath test
Assessment of gastric emptying rate was performed using the 13
C-labelled breath
test. Each test meal/drink was labelled with 100mg 13
C sodium acetate (CK Gas
Products, Hampshire, UK). The principle of this method is that acetate is
predominantly absorbed in the small intestine and then rapidly metabolised by the
liver to CO2 which is taken to the lungs via the pulmonary circulation where it is
exhaled in the breath. Hence the rate of 13
CO2 appearance in expired air represents
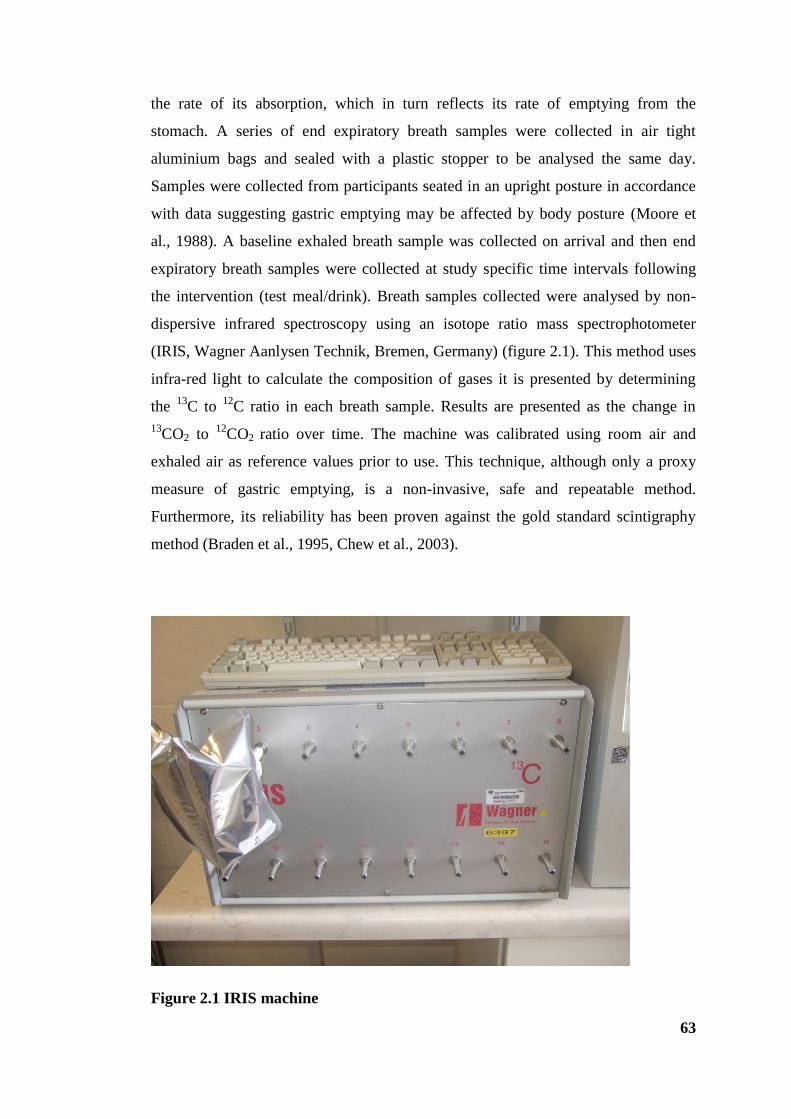
63
the rate of its absorption, which in turn reflects its rate of emptying from the
stomach. A series of end expiratory breath samples were collected in air tight
aluminium bags and sealed with a plastic stopper to be analysed the same day.
Samples were collected from participants seated in an upright posture in accordance
with data suggesting gastric emptying may be affected by body posture (Moore et
al., 1988). A baseline exhaled breath sample was collected on arrival and then end
expiratory breath samples were collected at study specific time intervals following
the intervention (test meal/drink). Breath samples collected were analysed by non-
dispersive infrared spectroscopy using an isotope ratio mass spectrophotometer
(IRIS, Wagner Aanlysen Technik, Bremen, Germany) (figure 2.1). This method uses
infra-red light to calculate the composition of gases it is presented by determining
the 13
C to 12
C ratio in each breath sample. Results are presented as the change in
13CO2 to
12CO2 ratio over time. The machine was calibrated using room air and
exhaled air as reference values prior to use. This technique, although only a proxy
measure of gastric emptying, is a non-invasive, safe and repeatable method.
Furthermore, its reliability has been proven against the gold standard scintigraphy
method (Braden et al., 1995, Chew et al., 2003).
Figure 2.1 IRIS machine
64
2.3.4 Blood sampling: collection and processing
The collection and processing of blood samples is described below. Samples
collected in chapters three and four were analysed for blood glucose the method of
which is described in section 2.3.4.1. Samples collected in chapter three part III were
analysed for blood glucose, insulin, GLP-1, GIP, PYY and PP the details of which
are outlined in the chapter.
A cannula (Venflon, Helsingborg, Sweden) was inserted into a forearm vein for
repeated blood collection. Samples were collected from a three way tap using a 10ml
syringe (Plastipak, Becton, Dickinson UK. Limited, UK) (figure 2.2). Following
each sample collection the cannula was flushed with ~ 10ml of sterile saline solution
(0.9%w/v sodium chloride, Baxter Healthcare Ltd, Thetford, UK) to ensure the
cannula remained patent. A 2ml sample was collected and discarded before each
blood sample collection to avoid any contamination with saline. A small sample was
drawn off from each blood sample for the immediate determination of blood glucose
and remaining samples were distributed between ethylenediaminetetraacetic acid
(EDTA) coated anticoagulant vacutainers (Sarstedt, Leicester, UK) containing 75µL
aprotinin (Trasylol, Sigma-Aldrich, Munich, Germany) and serum separating
vacutainers (Sarstedt, Leicester, UK). Tubes were centrifuged (Haraeus Labofuge
400R) immediately for fifteen minutes at 3000 revolutions per minute (RPM) and
4oC with the exception of serum separating tubes which were left to clot for thirty
minutes at room temperature before centrifuging. After centrifuging, serum for the
determination of insulin and plasma for the determination of gut hormones was
removed, aliquoted into labelled Eppendorph tubes on ice and stored at -80oC for
future analysis as detailed in chapter three.

65
Figure 2.2 Blood sample collection via a three way tap
2.3.4.1 Blood glucose
Blood glucose was analysed immediately using a HemoCue Glucose 201+ Analyser
(HemoCue, Angelholm, Sweden). The HemoCue analyser uses a dual wavelength
photometer to measure glucose in whole blood. Following the collection of each
sample a HemoCue cuvette was placed into a droplet of whole blood which was
absorbed through capillary action. The cuvette was wiped clean and placed in the
cuvette holder to be measured. Results were displayed and are presented in mmol/L.
2.4 Statistical analysis
Descriptive statistics were used for demographic variables such as age, weight,
height and BMI. Data were analysed using the Statistical Package for the Social
Sciences (SPSS) software (v20.0 for Windows, SPSS, Chicago, IL). Results are
reported as means ± standard error of the mean (SEM) unless stated otherwise.
Differences in fasting blood glucose, gut hormones and VAS score values were

66
determined using Student’s t-tests. Blood glucose, gut hormone profiles and gastric
emptying data are presented as raw values over time and areas under the curve
(AUC) calculated using the trapezoidal rule. Blood glucose, gut hormone profiles,
gastric emptying data and VAS scores were analysed using two–factor repeated
measures analysis of variance (ANOVA) with time and experimental trial as factors,
or for the AUC data, with trial, as a factor (chapters three, four and five study I). In
chapter five (study I), three-factor repeated measures ANOVA was used to examine
differences in variables between trials with the three main effects being condition,
route of administration and time. Where there were significant main effects, post-hoc
analysis using the Bonferroni correction for multiple comparisons were performed.
In addition, differences in gastric emptying AUC values for oral and intragastric
administration were determined using paired t-tests. Statistical significance was
accepted at P<0.05. Analysis of data collected from methods not outlined in this
section is discussed in the corresponding chapter.

67
CHAPTER 3
The role of the gut sweet taste receptor in mediating the responses to
glucose: an exploration using lactisole
3.1 Introduction
Taste cells in the oral cavity are the first point of contact and initial evaluation of
ingested nutrients, contributing not only to the selection of food but the specific
satiation and reward value of food. Sweet taste in the mouth has been well
characterised (Lindemann, 2001) and is a highly subjective experience involving
higher forebrain centres, but by what mechanism/s would the gut determine
sugars/sweetness in the absence of the psychological-physical interaction that occurs
within the mouth? Fundamental biological similarities between oral taste signalling
and ‘taste’ signalling in the gut have led to the suggestion that cells of the
gastrointestinal tract may be involved in ‘sugar sensing’ by pathways analogous to
those mediating and occurring in taste cells of the oral cavity. Beyond tasting at
ingestion, it is evident the gastrointestinal tract plays a major role in appetite and
food intake control. This is mediated by factors including gastric emptying and the
production and release of hormones, including GLP-1, GIP and PYY, from EEC that
signal to the CNS, operating via the blood stream and vagus nerve, to induce
satiation and thereby limit food intake (Verdich et al., 2001, Degen et al., 2005,
Lavin et al., 1996, Lavin et al., 1998).
It is known that glucose, when given orally or administered directly into the
gastrointestinal tract, elicits a much greater incretin hormone response than
intravenous glucose implying it is sensed from the gut itself (Lavin et al., 1998,
Schirra et al., 1996) to induce satiety and suppress intake (Feinle et al., 2002).
Following the demonstration of α-gustducin expression, a taste signalling protein
involved in taste signal transduction, (Hofer et al., 1996) and sweet taste receptor
(T1R2 and T1R3) expression in EEC of the human gut (Dyer et al., 2005,
Margolskee et al., 2007) the functional role of the gut sweet taste receptor in gut
nutrient sensing has to be experimentally explored. Enteroendocrine L and K cells
68
are well characterised for their secretion of hormones GLP-1 and GIP respectively
but are also thought to express the sweet taste receptor (Jang et al., 2007).
Studies in mice, using knockout models for α-gustducin or the sweet receptor
subunit, T1R3, have shown deficiencies in GLP-1 secretion providing evidence for
the involvement of GPCRs in nutrient stimulated hormone secretion (Jang et al.,
2007, Kokrashvili et al., 2009). Glucose stimulates the secretion of GLP-1 from the
human L cell line (NCI-H176) (Jang et al., 2007), a response that is blocked by the
sweet taste receptor antagonist, lactisole (Jiang et al., 2005). Furthermore, in vivo
lactisole suppresses sweet taste perception on the tongue in humans (Schiffman et
al., 1999). These observations suggest the gut sweet taste receptor could be involved
in the secretion of satiation hormones and that lactisole could be an ideal tool to
investigate the functional involvement of gut sweet taste receptors in humans.
Therefore, if glucose was sensed by the gut sweet taste receptor, then infusion of a
glucose and lactisole solution, administered directly into the stomach to bypass oral
taste receptors, should have a lesser effect than the responses to glucose alone. A
recent study in humans demonstrated that a glucose solution, administered following
lactisole, resulted in a lower mean peak blood glucose (Simpson et al., 2009). It is
however, unknown what the effects on gastric emptying, appetite and food intake
would be.
The above findings illustrate some of the advances in our knowledge of nutrient
sensing; however the exact contribution of the human gut sweet taste receptor system
is unclear and a better understanding of its role in hormone release, gastric emptying
and the subsequent effect on appetite and food intake presents as a target for
therapeutic intervention in obesity. It is not viable to study directly nutrient sensing
mechanisms operating within the gut of human subjects; therefore, I determined
whether the effect of lactisole on oral sweet taste receptors would have equivalent
effects on sweet taste receptors in the gut to modulate gastric emptying, appetite
perceptions, food intake and metabolic responses.
The objective was to use lactisole as a tool to investigate the role of gut sweet taste
receptors with the hypothesis that if the regulation of gastric emptying, appetite and
therefore subsequent food intake are dependent, at least in part, on gut sweet taste
receptors then lactisole would attenuate the responses to glucose.
69
3.2 Method
3.2.1 Design
The study consisted of three experimental parts, each performed as a single-blind
randomised cross-over design. Participants attended the laboratory on one occasion
in part I and on two or four separate occasions (plus a screening visit) for part II and
III respectively with at least five days between each visit (part II and III). Ethical
approval for the study was granted by the National Health Service North West
Research Ethics Committee (ref. 10/H1016/11).
3.2.2 Participants
Seven participants (four female, three male) participated in part I, nine in part II (all
male) and seven in part III (three female, four male). Two participants were involved
in both part II and III. All participants met the inclusion/exclusion criteria as detailed
in chapter 2.2.1.
3.2.3 Experimental protocol
Part I
This preliminary study was undertaken to identify the amount of lactisole necessary
to block sweet taste sensing in the study population. Participants were asked to
attend the Gastrointestinal Physiology research lab on one occasion prior to which
they were asked to refrain from eating, drinking and smoking for a minimum of one
hour. Participants were presented with four test drinks including 1M (45g, 180 kcal)
glucose, 1M glucose with 250 ppm (25mg/100ml) of lactisole, 1M glucose with 500
ppm (50mg/100ml) of lactisole and 500 ppm lactisole dissolved in tap water in a
randomised design. Each test drink consisted of 20ml solution in a plastic cup coded
with a letter for identification. Participants were instructed to swirl each sample
around their mouths for approximately 20 seconds and then to spit. After sampling
each test drink, participants were asked to rate the taste of the drink (chapter 2.3.2).
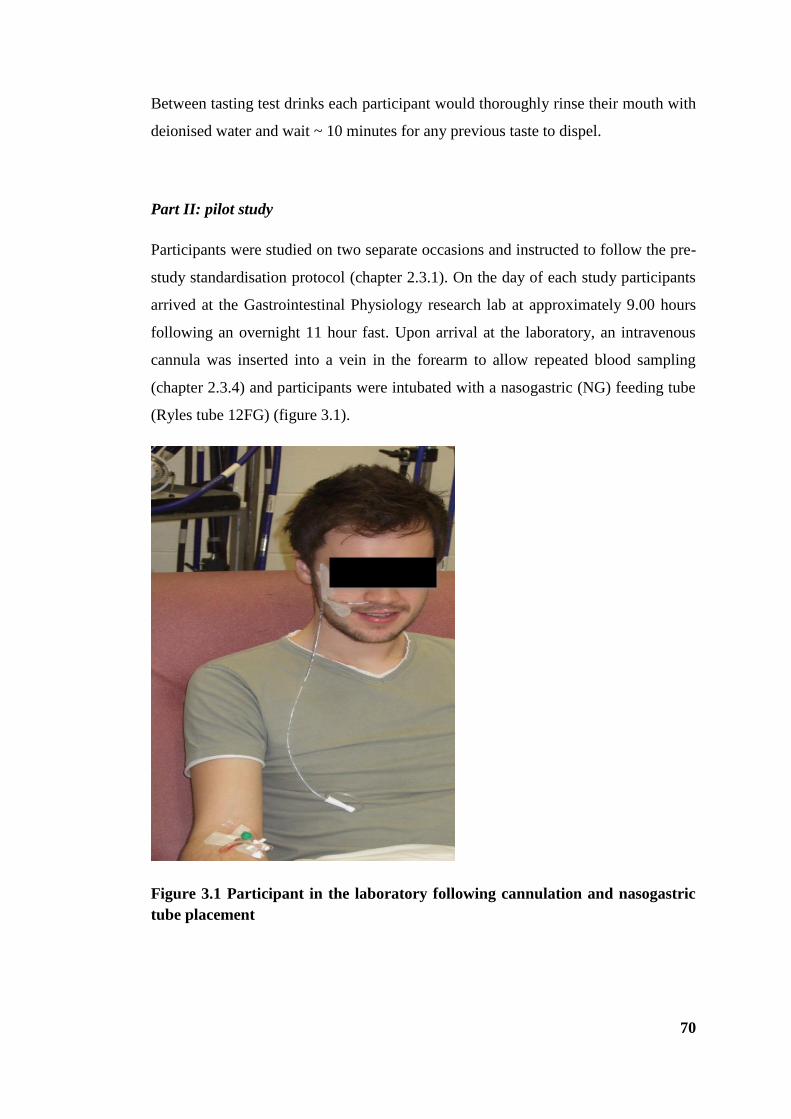
70
Between tasting test drinks each participant would thoroughly rinse their mouth with
deionised water and wait ~ 10 minutes for any previous taste to dispel.
Part II: pilot study
Participants were studied on two separate occasions and instructed to follow the pre-
study standardisation protocol (chapter 2.3.1). On the day of each study participants
arrived at the Gastrointestinal Physiology research lab at approximately 9.00 hours
following an overnight 11 hour fast. Upon arrival at the laboratory, an intravenous
cannula was inserted into a vein in the forearm to allow repeated blood sampling
(chapter 2.3.4) and participants were intubated with a nasogastric (NG) feeding tube
(Ryles tube 12FG) (figure 3.1).
Figure 3.1 Participant in the laboratory following cannulation and nasogastric
tube placement
71
A fasting baseline blood sample was collected and participants were asked to provide
a baseline, end-expiratory breath sample (chapters 2.3.4 and 2.3.3 respectively). A
baseline assessment of appetite was collected using VAS (chapter 2.3.2). All
participants received an intragastric infusion over 2 minutes (t= -2 -0min) of either a)
1M glucose or b) 1M glucose together with 250 ppm lactisole dissolved in tap
water to a total volume of 250ml. All infusions were prepared on the morning of the
trial at room temperature and were presented in transparent beakers as colourless
liquids with no visible differences. Infusions were administered through the NG tube
to conceal any olfactory and gustatory differences between infusions which could
influence appetite while also ensuring participants remained blind to the nature of the
infusions. All infusions were labelled with 100mg of [13
C] sodium acetate for
determination of gastric emptying rate, which was the primary end point based on
previous observations that gastric emptying is potently delayed by glucose. End-
expiratory breath samples and blood samples (10ml) were collected immediately
before the infusion (t= -5) and at t= 5, 10, 15, 30, 45, 60, 90, 120 and 150 min.
Subjective appetite perceptions of hunger, fullness and desire to eat were collected
using VAS immediately before and after the infusion (t= -5 and 0) and at 15 minute
intervals (t= 15, 30, 45, 60, 90, 120 and 150 min). The NG tube was removed
immediately following the infusion and after 150 min, the intravenous cannula was
removed. Participants were presented with an ad-libitum pasta based test meal the
composition of which is described below (chapter 3.2.5). Following the termination
of the test meal participants were free to leave the laboratory. The study protocol is
presented in figure 3.2.

72
Figure 3.2 Schematic representation of study protocol (part II)
Figure 3.2 Schematic representation of study protocol (part II)
Overnight
fast
22.00 hrs
0 15 30 45 60
Time
(mins)
Part
icip
an
ts c
an
nu
late
d
an
d i
ntu
bate
d
IG test
meal
infusion
Blood
sample
collection
Breath
sample
collection
VAS Ad-libitum test meal
Key:
90 120 150 -2
IG- intragastric
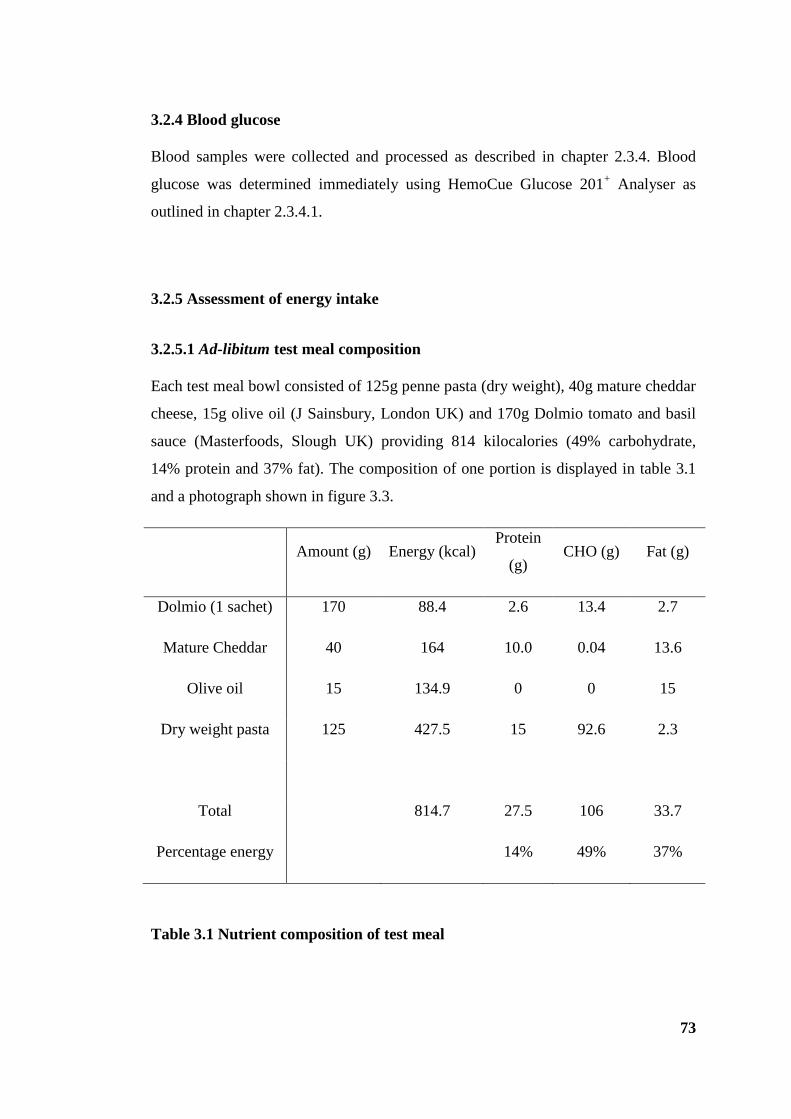
73
3.2.4 Blood glucose
Blood samples were collected and processed as described in chapter 2.3.4. Blood
glucose was determined immediately using HemoCue Glucose 201+ Analyser as
outlined in chapter 2.3.4.1.
3.2.5 Assessment of energy intake
3.2.5.1 Ad-libitum test meal composition
Each test meal bowl consisted of 125g penne pasta (dry weight), 40g mature cheddar
cheese, 15g olive oil (J Sainsbury, London UK) and 170g Dolmio tomato and basil
sauce (Masterfoods, Slough UK) providing 814 kilocalories (49% carbohydrate,
14% protein and 37% fat). The composition of one portion is displayed in table 3.1
and a photograph shown in figure 3.3.
Amount (g) Energy (kcal) Protein
(g) CHO (g) Fat (g)
Dolmio (1 sachet) 170 88.4 2.6 13.4 2.7
Mature Cheddar 40 164 10.0 0.04 13.6
Olive oil 15 134.9 0 0 15
Dry weight pasta 125 427.5 15 92.6 2.3
Total 814.7 27.5 106 33.7
Percentage energy 14% 49% 37%
Table 3.1 Nutrient composition of test meal

74
Figure 3.3 Ad-libitum test meal
3.2.5.2 Test meal preparation and energy intake calculation
Test meal portions were prepared in advance and heated in a microwave oven when
required to minimize any food related smells in the laboratory prior to the serving of
the meal, which could influence participants’ appetite (Yeomans, 2006). The ad-
libitum test meal was presented to participants in a bowl which was removed and
replaced with another following consumption until participants indicated they were
satiated. Calculation of total energy intake was determined by the weight of food
consumed. The homogeneous nature of the test meal enabled the calculation of
energy and macronutrient intake by the weight of food consumed. This method has
been verified as a reproducible method for assessing energy intake (Gregersen et al.,
2008).

75
3.2.6 Materials and test foods
D- (+)- Glucose (Sigma-Aldrich, Munich, Germany). The concentration of glucose
was based upon previous work showing 1M glucose to have a potent effect on
gastric emptying (Little et al., 2010a).
Lactisole (Endeavour Chemicals, Northamptonshire, UK). The chosen dose of
lactisole was derived from earlier work demonstrating a reduced sweet intensity
rating of a panel of sugars and NNS in mixtures with lactisole (Schiffman et al.,
1999).
[13
C] sodium acetate (CK Gas Products, Hampshire, UK).
3.2.7 Statistical analysis
Data are presented and analysed as described in chapter 2.4. Gastric emptying AUC
values and energy intake, presented in grams (g) and kilocalories (Kcal), were
analysed using a paired t-test (part II).
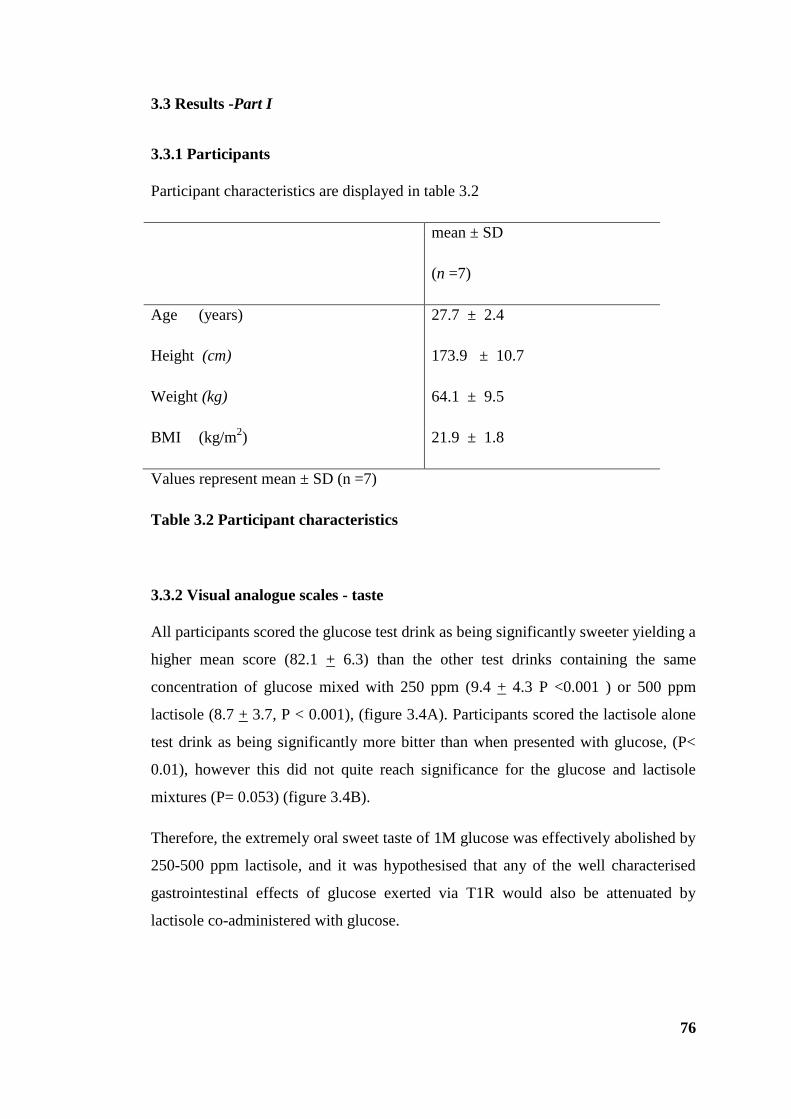
76
3.3 Results -Part I
3.3.1 Participants
Participant characteristics are displayed in table 3.2
mean ± SD
(n =7)
Age (years) 27.7 ± 2.4
Height (cm) 173.9 ± 10.7
Weight (kg) 64.1 ± 9.5
BMI (kg/m2) 21.9 ± 1.8
Values represent mean ± SD (n =7)
Table 3.2 Participant characteristics
3.3.2 Visual analogue scales - taste
All participants scored the glucose test drink as being significantly sweeter yielding a
higher mean score (82.1 + 6.3) than the other test drinks containing the same
concentration of glucose mixed with 250 ppm (9.4 + 4.3 P <0.001 ) or 500 ppm
lactisole (8.7 + 3.7, P < 0.001), (figure 3.4A). Participants scored the lactisole alone
test drink as being significantly more bitter than when presented with glucose, (P<
0.01), however this did not quite reach significance for the glucose and lactisole
mixtures (P= 0.053) (figure 3.4B).
Therefore, the extremely oral sweet taste of 1M glucose was effectively abolished by
250-500 ppm lactisole, and it was hypothesised that any of the well characterised
gastrointestinal effects of glucose exerted via T1R would also be attenuated by
lactisole co-administered with glucose.
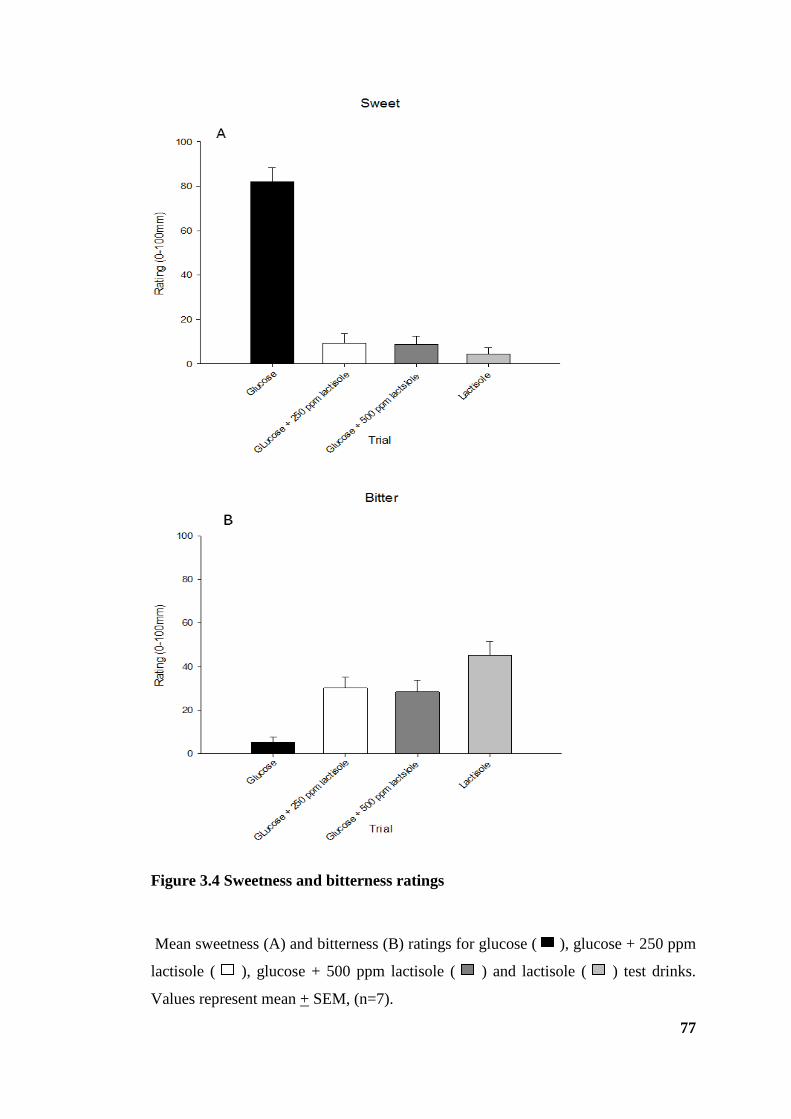
77
Figure 3.4 Sweetness and bitterness ratings
Mean sweetness (A) and bitterness (B) ratings for glucose ( ), glucose + 250 ppm
lactisole ( ), glucose + 500 ppm lactisole ( ) and lactisole ( ) test drinks.
Values represent mean + SEM, (n=7).

78
3.4 Results -Part II
3.4.1 Participants
Participant characteristics are displayed in table 3.3
mean ± SD
(n =9)
Age (years) 24.9 ± 2.5
Height (cm) 179.1 ± 6.9
Weight (kg) 72.7 ± 7.0
BMI (kg/m2) 22.7 ± 2.3
Restraint Score1 2.3 ± 1.8
Values represent mean ± SD (n =9)
1 Score of restraint using the three factor eating questionnaire (Stunkard and Messick,
1985)
Table 3.3 Participant characteristics
3.4.2 Gastric emptying
Following both infusions, there was a rise in 13
CO2 : 12
CO2 with peak values
reaching 40.3 + 3.3 and 43.6 + 1.6 in the glucose + lactisole and glucose conditions
respectively (figure 3.5A). Peak values were reached at 45 minutes after which 13
CO2
: 12
CO2 values began to decrease and by 60 minutes the plots converged indicating
the rates of gastric emptying were similar from that point forward. There was a main
effect of time (P < 0.001) but there was no significant effect of lactisole nor a trial x
time interaction on the rate of gastric emptying (P= 0.51 and P= 0.63 respectively) or
the area under the curve (P= 0.54) (figure 3.5B).

79
Figure 3.5 Gastric emptying rate
Gastric emptying rate for glucose + 250 ppm lactisole ( / ) and glucose ( / )
trials displayed over time (A) and as area under the curve (B). Values represent mean
+ SEM, (n=9).
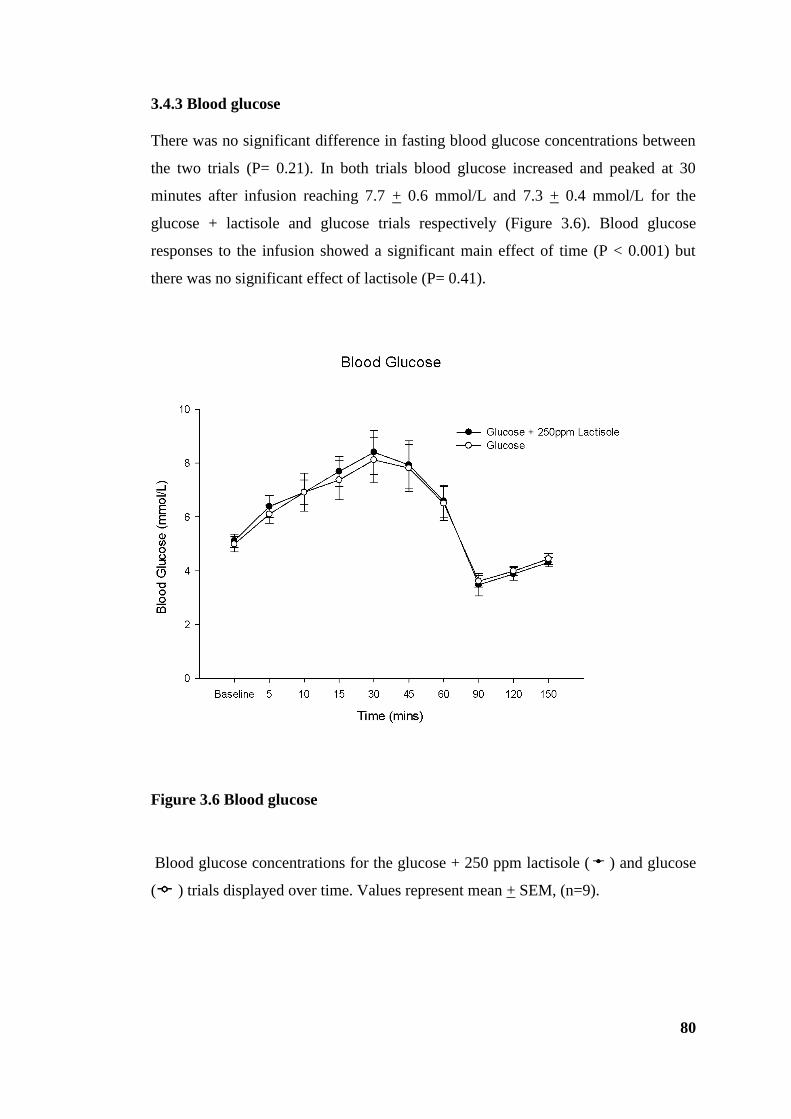
80
3.4.3 Blood glucose
There was no significant difference in fasting blood glucose concentrations between
the two trials (P= 0.21). In both trials blood glucose increased and peaked at 30
minutes after infusion reaching 7.7 + 0.6 mmol/L and 7.3 + 0.4 mmol/L for the
glucose + lactisole and glucose trials respectively (Figure 3.6). Blood glucose
responses to the infusion showed a significant main effect of time (P < 0.001) but
there was no significant effect of lactisole (P= 0.41).
Figure 3.6 Blood glucose
Blood glucose concentrations for the glucose + 250 ppm lactisole ( ) and glucose
( ) trials displayed over time. Values represent mean + SEM, (n=9).

81
3.4.4 Appetite perceptions
Baseline ratings of desire to eat, hunger, fullness and nausea were not significantly
different between the trials (P > 0.05). Ratings of desire to eat and hunger decreased
following the infusion while ratings of fullness and nausea increased in both trials
(figure 3.7). Ratings of desire to eat tended to be higher and ratings of fullness lower
in the glucose + lactisole trial compared to the glucose only trial however these
observations were not significant. There was a main effect of time (P < 0.001) for
each of the appetite perceptions assessed (desire to eat, hunger and fullness) but there
were no trial or trial x time interaction effects for desire to eat or fullness. For
hunger, there was a significant trial effect (P= 0.04) showing that ratings tended to
be higher in the glucose + lactisole trial compared to glucose alone. Following their
decline, ratings of hunger and desire to eat increased until the test meal. Similarly,
following the increase, ratings of fullness gradually decreased until the test meal.
There were no trial or interaction main effects for nausea and following a slight
increase post infusion, ratings decreased until the test meal.
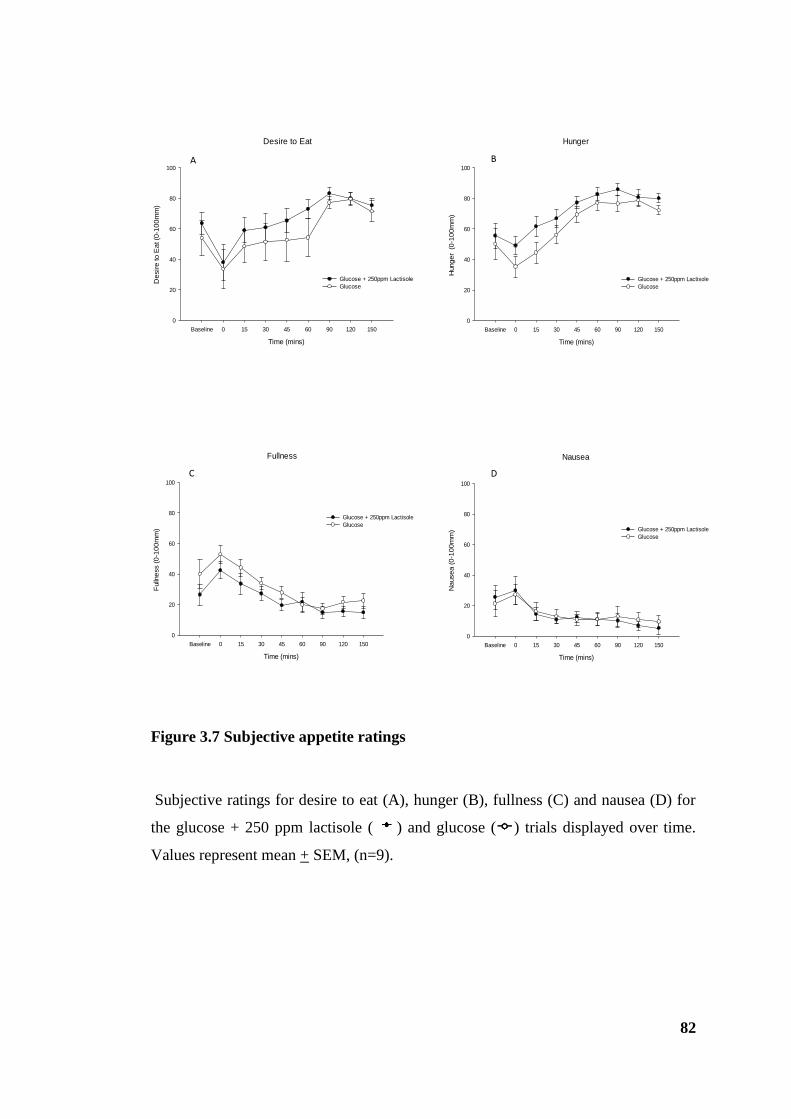
82
Figure 3.7 Subjective appetite ratings
Subjective ratings for desire to eat (A), hunger (B), fullness (C) and nausea (D) for
the glucose + 250 ppm lactisole ( ) and glucose ( ) trials displayed over time.
Values represent mean + SEM, (n=9).
Desire to Eat
Time (mins)
Baseline 0 15 30 45 60 90 120 150
De
sir
e to
Ea
t (0
-10
0m
m)
0
20
40
60
80
100
Glucose + 250ppm Lactisole
Glucose
Fullness
Time (mins)
Baseline 0 15 30 45 60 90 120 150
Fulln
ess (
0-1
00
mm
)
0
20
40
60
80
100
Glucose + 250ppm Lactisole
Glucose
Hunger
Time (mins)
Baseline 0 15 30 45 60 90 120 150
Hung
er
(0
-10
0m
m)
0
20
40
60
80
100
Glucose + 250ppm Lactisole
Glucose
Nausea
Time (mins)
Baseline 0 15 30 45 60 90 120 150
Na
use
a (
0-1
00
mm
)
0
20
40
60
80
100
Glucose + 250ppm Lactisole
Glucose
A B
C D
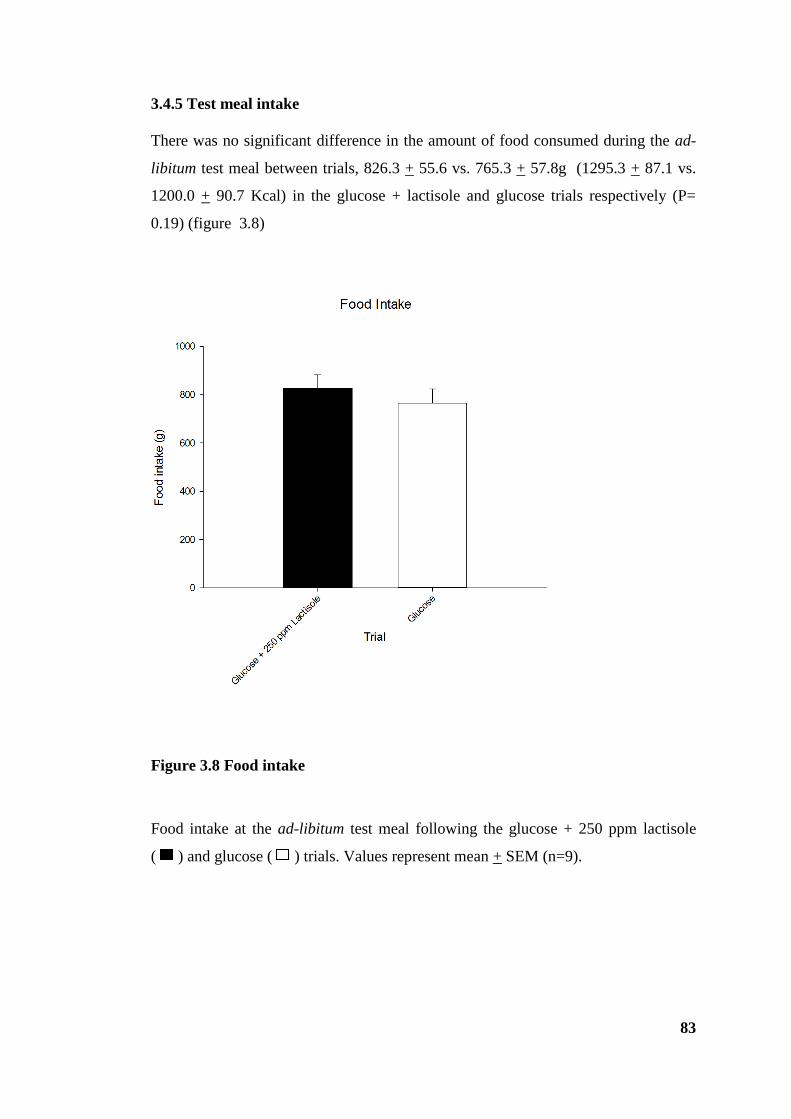
83
3.4.5 Test meal intake
There was no significant difference in the amount of food consumed during the ad-
libitum test meal between trials, 826.3 + 55.6 vs. 765.3 + 57.8g (1295.3 + 87.1 vs.
1200.0 + 90.7 Kcal) in the glucose + lactisole and glucose trials respectively (P=
0.19) (figure 3.8)
Figure 3.8 Food intake
Food intake at the ad-libitum test meal following the glucose + 250 ppm lactisole
( ) and glucose ( ) trials. Values represent mean + SEM (n=9).

84
3.5 Discussion Part I and II
Although the sample size of nine subjects was small in this proof of concept study,
interim analysis at this point made it clear that no significant difference in the
primary end point would be identified even with an extremely large study, so further
recruitment was discontinued. The study was halted at this stage and a new protocol
devised. A more controlled cross over study was initiated, but using the higher dose
of lactisole in case any dilutional effect in the stomach had dropped the 250 ppm
lactisole below an effective concentration.
The initial evaluation of nutrients being ingested takes place within the mouth.
Sweetness, one of five basic taste qualities that is distinguished, is mediated by
GPCRs, and is dependent on what has been identified as the sweet taste receptor,
comprising of the two subunits T1R2 and T1R3 (Nelson et al., 2001). Glucose, along
with other caloric sugars, is a known activator of sweet taste receptors in the oral
cavity enabling sweet taste perception, an effect which is suppressed by lactisole
(Schiffman et al., 1999) via its antagonistic binding to T1R3 (Jiang et al., 2005). In
the preliminary study (part I), lactisole at both 250 ppm and 500 ppm, when mixed
with glucose, significantly suppressed the sweetness of the mixture. This is in line
with previous work that showed lactisole blocking the sweetness intensity for a panel
of sugars and NNS (Johnson et al., 1994, Schiffman et al., 1999). The experience is
really quite striking when sampled by the investigative researchers during
preliminary development: 1M glucose is extremely sweet and this simply disappears.
Food intake is not only determined by the sense of taste but subsequently by cells of
the gastrointestinal tract. Following the identification of the same sweet taste
receptors expressed in the human gastrointestinal tract as in the mouth, it raises the
question of whether this system plays a functional role in sugar sensing in the small
intestine, and the physiological responses that ensue. Results from Part I formed the
basis for the design of Part II of the study. Lactisole at a concentration of 250 ppm
successfully blocked sweet taste receptors in the mouth presenting a tool to
investigate the role of the gut-expressed receptor counterparts. The aim of the study
(part II) was to investigate whether the responses to glucose were mediated, at least
in part, by the sweet taste receptors in the gut. Following an intragastric infusion of
glucose with or without the lactisole, the effects on gastric emptying, blood glucose,
85
appetite perceptions and food intake were measured. It is of course not feasible to
directly study taste receptor activation in the human gut; therefore, lactisole was used
as a tool. The current data demonstrate that, when administered directly into the gut
to bypass oral taste receptors, the addition of lactisole does not affect the rate of
gastric emptying, blood glucose or food intake in response to glucose.
To my knowledge this is the first study that has used an intragastric infusion of
lactisole in human subjects and measured the responses to a glucose solution
involving both physiological and subjective and actual measures of appetite and food
intake respectively. There were no differences in blood glucose between the two
conditions, unlike that found by Simpson and colleagues who found that lactisole
slightly attenuated postprandial hyperglycaemia (Simpson, Nixon et al 2009).
However, as lactisole is known as a competitive inhibitor (Schiffman et al., 1999) it
is not known how a pre-infusion of lactisole, as used by Simpson and colleagues,
would alter the blood glucose responses, since in our developmental work prior to
the experiments inhibition of oral taste was observed only when lactisole is mixed
with glucose prior to tasting.
There is also some evidence from animal models that glucose transport may be
increased by sweet taste receptor activation in the gut. However, lactisole did not
affect blood glucose levels in the current study. Although not currently significant,
inspection of the data suggests that a very minor difference may arise (in a larger
powered study) to show gastric emptying rate to be trivially faster for the first 60
minutes in the glucose + 250 ppm lactisole condition compared to glucose alone.
However, it is unlikely that such minor differences would have any biomedical
relevance, and the need to study large groups to detect small differences would not
be pragmatic or worthwhile using the current study protocol, requiring NG
intubation.
Furthermore, while food intake at the lunchtime test meal did not display any
significant differences between the two conditions, subjective appetite ratings
indicated increased hunger and desire to eat, and decreased fullness in the glucose +
250 ppm lactisole condition compared to glucose alone. The fact that results did not
reach statistical significance, except for hunger, may be due to low power, since data
for nine participants only were tested. The inability to detect differences in

86
subjective appetite scores could be due to the nature of subjective ratings that gives
rise to large between participant and within participant variability. This is an innate
problem with VAS, and as gastric emptying was the primary endpoint it was not
considered worthwhile to pursue this protocol further.
From the current data it appears the effect of glucose was preserved in the presence
of lactisole, and, although small differences may perhaps emerge with larger sample
sizes, 250 ppm lactisole appears to be having little effect. This does not support the
current hypothesis, but does accord with the earlier findings of Little et al who
showed no role for the sweetness of a meal in mediating gastric emptying or appetite
responses, in that responses induced by ingested sugar were not replicated by NNS
(Little et al., 2009). It may be therefore that the sweet taste receptors are not
implicated in these responses to glucose in humans and blocking will confer no
alteration in responses. However, given that the stimulation of T1R2 and T1R3 by
sugars and NNS, can increase uptake of an oral glucose load in animal models (Mace
2007), and thus the rate of glucose uptake is reported to be regulated by these
receptors (Dyer, Daly et al, 2007), it was thought that stimulation would factor in
blood glucose levels and gastric emptying. Factors which determine postprandial
blood glucose concentrations include the nutrient composition of meals, the rate of
gastric emptying, which influences the rate at which nutrients are delivered to the
small intestine from the stomach and the rate of glucose absorption in the small
intestine (Horrowitz, 1993). Furthermore, stimulation of these receptors has been
shown to promote the release of gut hormones, such as GLP-1 and GIP, which
control gastric motility and influence appetite and food intake.
The current data, taken with previously published work, suggest that in humans
T1R2 and T1R3 do not mediate the physiological effects of glucose on gastric
emptying, and may only play a small role in appetite. However, a number of
alternative possibilities may explain these observations: (i) the dose of lactisole is
insufficient to block the sweet taste receptors in the gut, (ii) limitations of the
protocol and method used. In particular, it is not possible to include a positive
experimental control for the effect of lactisole in blocking gut sweet taste receptors,
since there is no established physiological response to block. The use of oral sweet
taste abolition is the closest proxy I could use to demonstrate that the agent does

87
exert an effect in the study group, but clearly is limited in validity. Including a no-
glucose control to show that glucose itself had an effect in these subjects might have
been worthwhile, although this is extremely well established in multiple published
studies so was not considered essential in this early phase study.
In considering the first possibility, the dose of lactisole used in this study is based on
results from Part I in which 250 ppm lactisole successfully blocked sweet taste
receptors in the mouth and previous observations showing lactisole at the same
concentration, was able to lower the postprandial rise in blood glucose following a
glucose infusion (Simpson et al., 2009). Furthermore lactisole has been shown to
inhibit sweet taste at even lower concentrations (150 ppm) (Schiffman et al., 1999),
so it is unlikely that any lack of effect was purely dilutional. However, the present
study assumes that the sweet taste receptors found in the gut, function and signal
similarly to those in the mouth and thus the dose of lactisole which inhibits sweet
taste in the mouth would be sufficient enough to interact with domain of T1R3
receptor in the gut to block the effect of glucose. While T1R2 +T1R3 receptors and
intracellular signalling elements have been found in taste cells in the mouth and EEC
in the human gut (Margolskee, 2002), there may be differences in the level of
expression. Dyer and colleagues demonstrated, in mice, the expression of T1R
receptors and the signalling element, α-gustducin are expressed along the length of
the small intestine (Dyer 2005). However, they found expression levels were low and
equivalent to those detected on the tongue suggesting that either the level of
receptors expressed in cells is low or expression is limited to a subpopulation of cells
rather than all cells along the villus.
The second possibility relates to a number of limitations in the study design and
methods. The duration of the study may affect the sensitivity of the ad-libitum test
meal to detect any differences in food intake. Plots for gastric emptying converge
after 60 minutes and it is arguable that the test meal is being be served too late and
may be more sensitive if it was served between 40 and 60 minutes post-infusion.
Some of the neuroendocrine effects of a meal are however sustained for several
hours, and there is evidence that for example vagal sensitivity to gut hormones is
altered for a significant time period (le Roux and Bloom, 2005).

88
Taking into account these possible limitations, the protocol in part III was designed
to address these methodological issues: the hypothesis and aims remain the same. To
maximise the likelihood of finding effects, the dose of lactisole was doubled to 500
ppm. The effect of carbohydrate on food intake is dependent on the rate of gastric
emptying and in turn blood glucose and gut hormone release. Owing to this, the
study duration was shortened. In healthy subjects, blood glucose usually peaks at or
before 60 minutes following a carbohydrate test meal (Feinle et al., 2002) and given
the convergence of gastric emptying plots after 60 minutes it is thought that
decreasing the study duration and serving the ad-libitum test meal at 60 minutes may
impact on food intake. In keeping with this, potential effects that might have been
present in part II were noticed in the first hour.
Although blood was collected and processed for the determination of gut hormones it
was decided, based on the current observations, that further analysis would not be
worthwhile or economically justified. However, given the significance of gut
hormone secretion to gastrointestinal function and food intake, part III has
investigated the role of the human gut sweet taste receptor in regulating insulin,
GLP-1, PYY, GIP and PP release. Furthermore, the addition of two control
conditions, lactisole and water, were added to the protocol.
89
3.6 Experimental protocol - Part III
Participants were studied on four separate occasions and instructed to follow the pre-
study standardisation protocol (chapter 2.3.1). On the day of each study participants
arrived at the Gastrointestinal Physiology research lab at approximately 9.00 hours
following an overnight 11 hour fast. The experimental protocol was identical to the
protocol described in part II with the exception of the lactisole dose which was
increased from 250 ppm to 500 ppm and the duration of the study was changed to 60
minutes. These changes were based on the results of the pilot work in part II.
Furthermore, two control conditions were added to the protocol to take the total
number of visits, excluding the screening visit, up to four. All participants therefore
received an intragastric infusion over 2 minutes (t= -2-0min) of either a) 1M of
glucose, b) 1M glucose together with 500 ppm lactisole, c) 500 ppm lactisole or d)
tap water in a total volume of 250ml. In comparison to the all male participation in
part II, part III involved the inclusion of female participants who if not on the oral
contraceptive pill were studied during days 6-12 only of the menstrual cycle
(follicular phase) to avoid any potential effects of the menstrual cycle on appetite,
food intake and gastrointestinal function (Dye and Blundell, 1997, Brennan et al.,
2009) (chapter 2.3.1.2). The study protocol is presented in figure 3.9.
3.6.1 Gut hormone concentrations
Samples collected were analysed for blood glucose, insulin and GLP-1. Blood
glucose was determined immediately using HemoCue Glucose 201+ Analyser
(Hemocue, Angelholm, Sweden) (chapter 2.3.4.1). Serum samples were defrosted
and insulin concentrations determined using an ELISA (enzyme-linked
immunosorbent assay) kit (Alpco Diagnostics, Massachusetts, USA). Plasma
samples from whole blood collected in EDTA coated tubes containing aprotinin
were defrosted and total GLP-1 concentrations were determined by ELISA
immunoassay (Alpco Diagnostics, Massachusetts, USA) according to the
manufacturer’s instructions. To ensure precision of analysis, quality controls
supplied with each assay kit were run on each plate. All samples were measured in
duplicate (VersaMax, Molecular Diagnostics, Berkshire, UK) but the five and 60
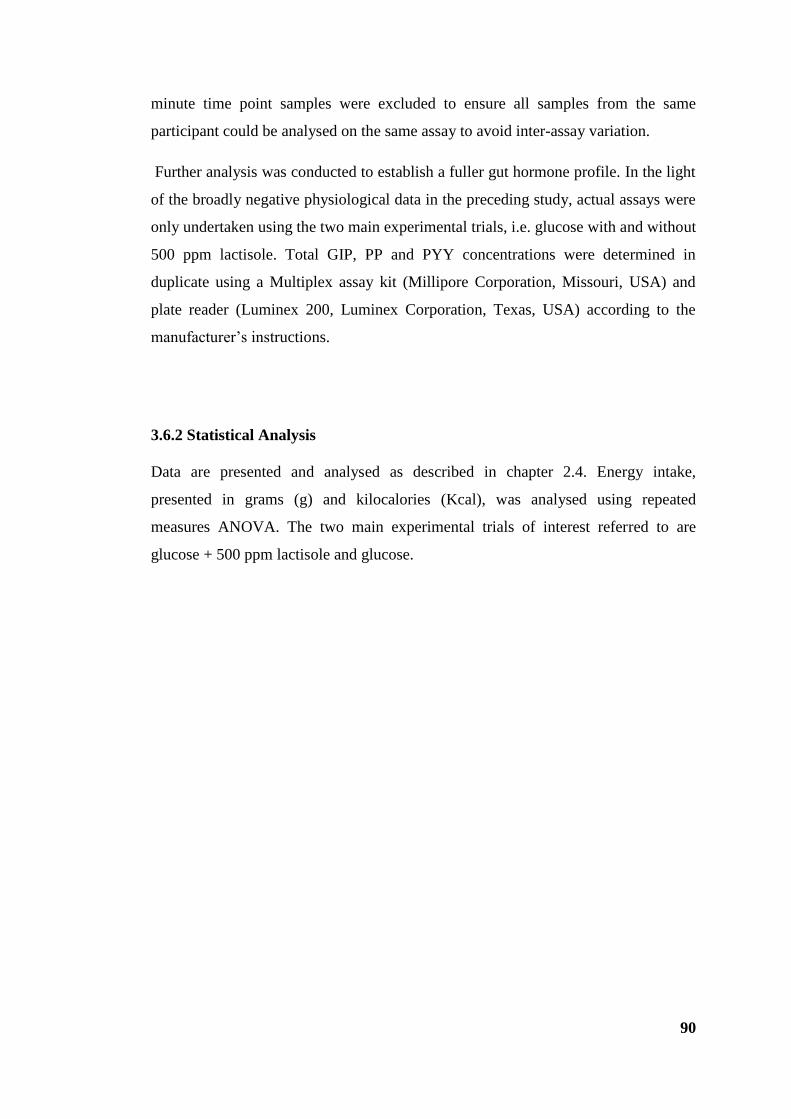
90
minute time point samples were excluded to ensure all samples from the same
participant could be analysed on the same assay to avoid inter-assay variation.
Further analysis was conducted to establish a fuller gut hormone profile. In the light
of the broadly negative physiological data in the preceding study, actual assays were
only undertaken using the two main experimental trials, i.e. glucose with and without
500 ppm lactisole. Total GIP, PP and PYY concentrations were determined in
duplicate using a Multiplex assay kit (Millipore Corporation, Missouri, USA) and
plate reader (Luminex 200, Luminex Corporation, Texas, USA) according to the
manufacturer’s instructions.
3.6.2 Statistical Analysis
Data are presented and analysed as described in chapter 2.4. Energy intake,
presented in grams (g) and kilocalories (Kcal), was analysed using repeated
measures ANOVA. The two main experimental trials of interest referred to are
glucose + 500 ppm lactisole and glucose.
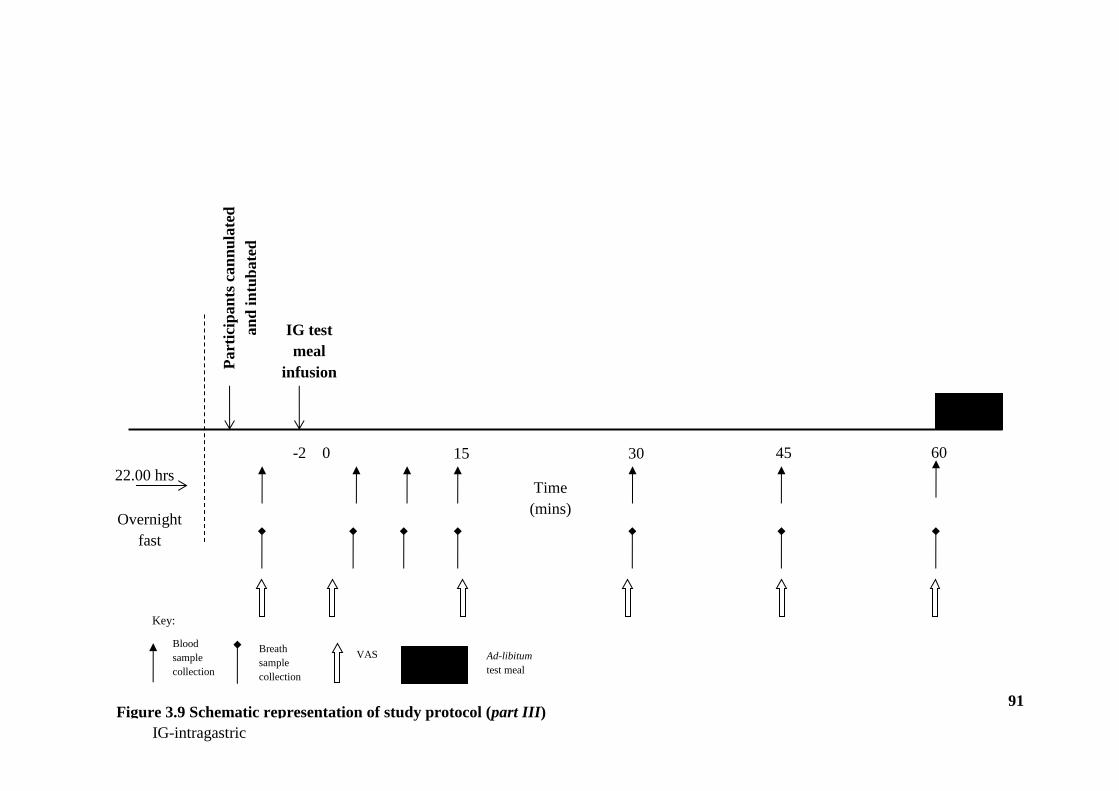
91
Figure 3.9 Schematic representation of study protocol (part III)
Overnight
fast
22.00 hrs
0 15 30 45 60
Time
(mins)
Part
icip
an
ts c
an
nu
late
d
an
d i
ntu
bate
d
IG test
meal
infusion
Blood
sample
collection
Breath
sample
collection
VAS Ad-libitum
test meal
Key:
-2
IG-intragastric
Figure 3.3 Schematic representation of study protocol (part III)
92
3.7 Results- Part III
3.7.1 Participants
Participant characteristics are displayed in table 3.4
mean ± SD
(n =7)
Age (years) 19.9 ± 1.1
Height (cm) 173 ± 10.7
Weight (kg) 66.7 ± 7.0
BMI (kg/m2) 22.1 ± 1.5
Restraint Score1 3.7 ± 2.3
Values represent mean ± SD (n =7)
1 Score of restraint using the three factor eating questionnaire (Stunkard and Messick,
1985)
Table 3.4 Participant characteristics
93
3.7.2 Gastric emptying
Gastric emptying was the primary end point in this study. There was a main effect of
time (P < 0.001). Following all infusions, there was a rise in 13
CO2 : 12
CO2 with peak
values reaching 40.2 + 1.5, and 35.1 + 4.0 in the glucose + lactisole and glucose
trials respectively (figure 3.10A). In the control trials, lactisole and water, values
peaked at 49.9 + 2.9 and 55.9 + 3.5 respectively. Peak values were reached at 30
minutes after which 13
CO2 :12
CO2 values began to decrease. As expected, glucose
slowed gastric emptying when compared with the lactisole and water trials. For
gastric emptying rate and AUC (figure 3.10B), there was a main effect of trial (P<
0.01), however post-hoc analysis revealed the lactisole + glucose trial had no
differential effect on gastric emptying rate or AUC compared with the glucose trial
(3080.3 + 159.1 vs. 2743.2 + 275.0).
Around the time that this work was being undertaken, Gerspach et al published a
large study involving 35 participants showing that lactisole had no effect at all on
gastric emptying when added in a similar dose (450ppm) to an even higher glucose
load (75g) or a mixed nutrient meal (Gerspach et al., 2011). Given the lack of any
effect on my primary endpoint at this stage a decision was made to terminate this
study rather than recruit more participants, on ethical and pragmatic grounds.
However the additional data are presented below and will be discussed in light of
Gerspach’s data.

94
Figure 3.10 Gastric emptying rate
Gastric emptying rate for glucose + 500 ppm lactisole ( / ), glucose ( / ),
lactisole ( / ) and water ( / ) trials displayed over time (A) and as area
under the curve (B). Values represent mean + SEM, (n=7).
A
B
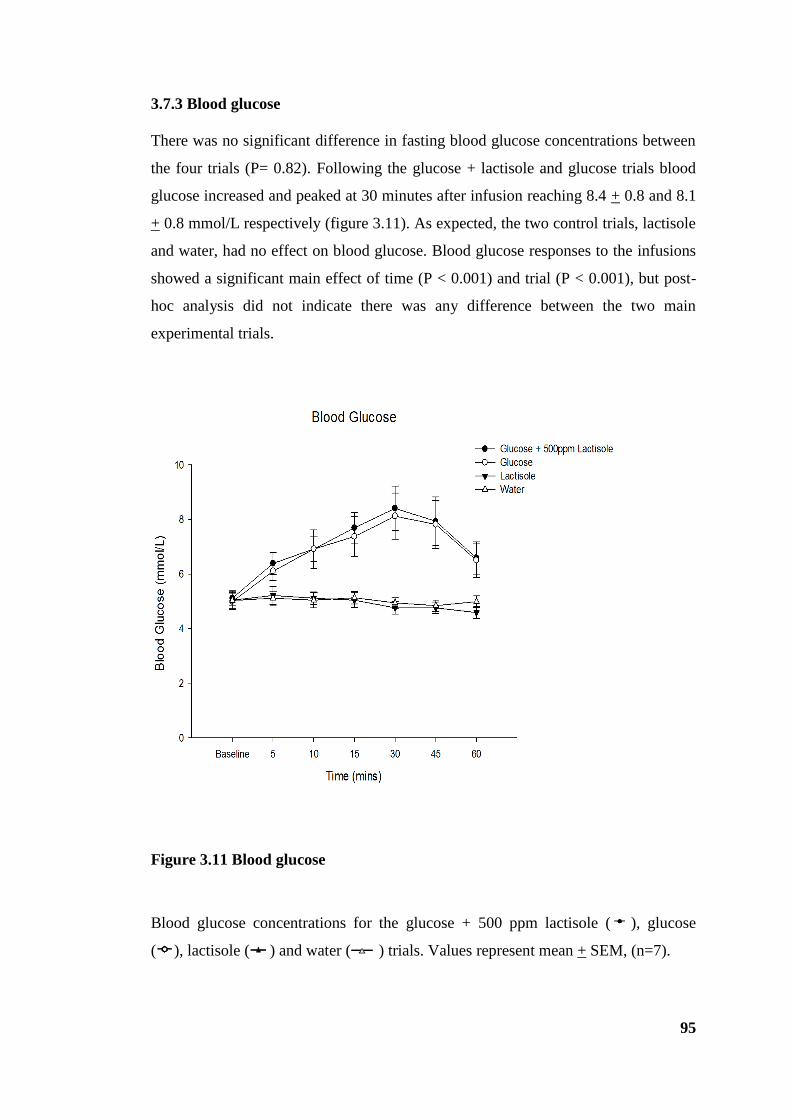
95
3.7.3 Blood glucose
There was no significant difference in fasting blood glucose concentrations between
the four trials (P= 0.82). Following the glucose + lactisole and glucose trials blood
glucose increased and peaked at 30 minutes after infusion reaching 8.4 + 0.8 and 8.1
+ 0.8 mmol/L respectively (figure 3.11). As expected, the two control trials, lactisole
and water, had no effect on blood glucose. Blood glucose responses to the infusions
showed a significant main effect of time (P < 0.001) and trial (P < 0.001), but post-
hoc analysis did not indicate there was any difference between the two main
experimental trials.
Figure 3.11 Blood glucose
Blood glucose concentrations for the glucose + 500 ppm lactisole ( ), glucose
( ), lactisole ( ) and water ( ) trials. Values represent mean + SEM, (n=7).
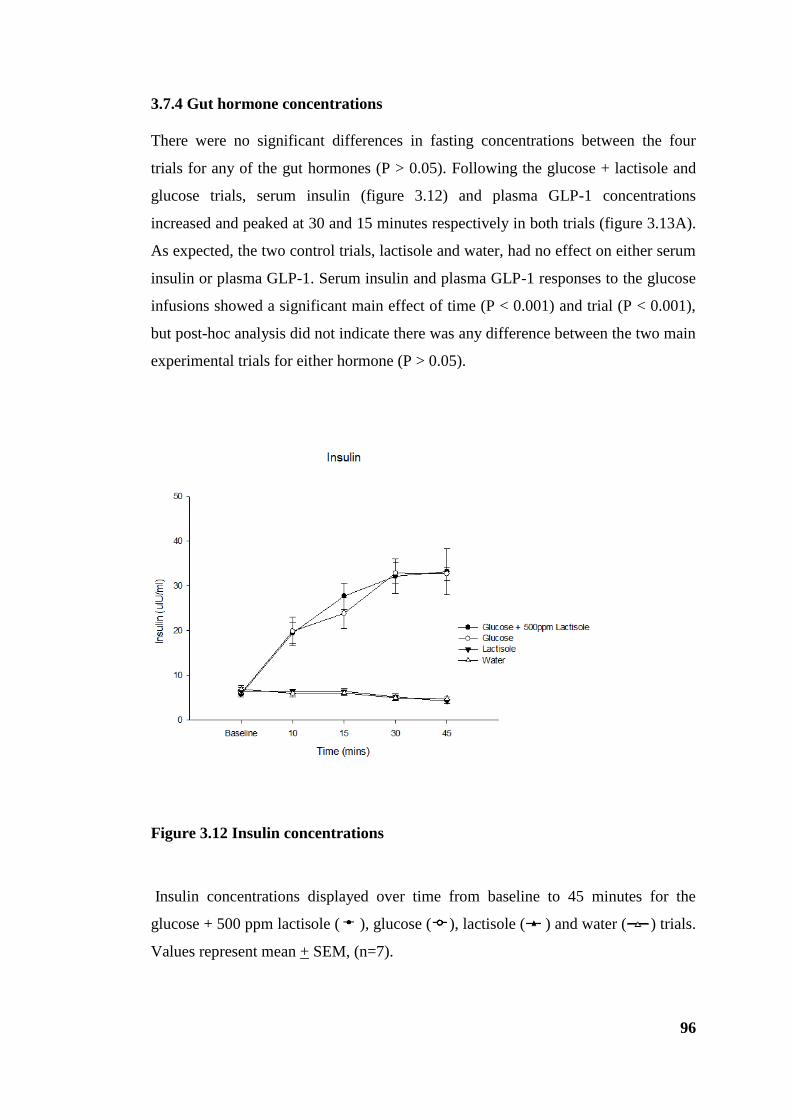
96
3.7.4 Gut hormone concentrations
There were no significant differences in fasting concentrations between the four
trials for any of the gut hormones (P > 0.05). Following the glucose + lactisole and
glucose trials, serum insulin (figure 3.12) and plasma GLP-1 concentrations
increased and peaked at 30 and 15 minutes respectively in both trials (figure 3.13A).
As expected, the two control trials, lactisole and water, had no effect on either serum
insulin or plasma GLP-1. Serum insulin and plasma GLP-1 responses to the glucose
infusions showed a significant main effect of time (P < 0.001) and trial (P < 0.001),
but post-hoc analysis did not indicate there was any difference between the two main
experimental trials for either hormone (P > 0.05).
Figure 3.12 Insulin concentrations
Insulin concentrations displayed over time from baseline to 45 minutes for the
glucose + 500 ppm lactisole ( ), glucose ( ), lactisole ( ) and water ( ) trials.
Values represent mean + SEM, (n=7).

97
Figure 3.13 GLP-1 concentrations
GLP-1 concentrations displayed over time for the glucose + 500 ppm lactisole ( ),
glucose ( ), lactisole ( ) and water ( ) trials (A). Values represent mean +
SEM, (n=7). Area under the curve from baseline (BL) to 45 minutes for each
participant for glucose ( ) and glucose + 500 ppm lactisole ( ) (B).
98
Following the glucose + lactisole and glucose trials, plasma GIP (figure 3.14A) and
PYY (figure 3.15A) concentrations increased. Plasma GIP concentrations increased
to 21.6 + 3.4 and 22.9 + 3.3 pmol/l and peaked at 15 and 30 minutes for the glucose
+ lactisole and glucose trials respectively. There was a main effect of time (P <
0.001) but no significant effect of trial (P= 0.6). Similarly, plasma PYY
concentrations increased to 93.0 + 13.3 and 101.2 + 26.0 pg/ml for the glucose +
lactisole and glucose trials respectively peaking at 15 minutes. There was no effect
of time or trial (P > 0.05) indicating lactisole had no effect on the plasma PYY
responses to glucose. Plasma PP (figure 3.16) concentrations increased to 115.3 +
39.6 pg/ml following the glucose infusion and peaked at 10 minutes compared to
84.6 + 12.1 pg/ml in the glucose + lactisole trial. There was a main effect of time (P
< 0.05) but no significant effect of trial (P= 0.3). Individual AUCs are shown for
each gut hormone to illustrate the variability between subjects.

99
Figure 3.14 GIP concentrations
GIP concentrations displayed over time for the glucose + 500 ppm lactisole ( )
and glucose ( ) trials (A). Values represent mean + SEM, (n=7). Area under the
curve from baseline (BL) to 45 minutes for each participant for glucose ( ) and
glucose + 500 ppm lactisole ( ) (B).

100
Figure 3.15 PYY concentrations
PYY concentrations displayed over time for the glucose + 500 ppm lactisole ( )
and glucose ( ) trials (A). Values represent mean + SEM, (n=7). Area under the
curve from baseline (BL) to 45 minutes for each participant for glucose ( ) and
glucose + 500 ppm lactisole ( ) (B).

101
Figure 3.16 PP concentrations
PP concentrations displayed over time for the glucose + 500 ppm lactisole ( ) and
glucose ( ) trials (A). Values represent mean + SEM, (n=7). Area under the curve
from baseline (BL) to 45 minutes for each participant for glucose ( ) and glucose
+ 500 ppm lactisole ( ) (B).
102
3.7.5 Appetite perceptions
Baseline ratings of desire to eat, hunger, fullness and nausea were not significantly
different between the trials (P > 0.05). Ratings of desire to eat and hunger decreased
following all infusions while ratings of fullness and nausea increased in all trials
(figure 3.17). Indeed, the rise in nausea was quite marked in this study, and
considerably higher than in part II. Ratings of desire to eat tended to be higher in the
glucose + lactisole trial compared to the glucose only trial however these
observations were not significant. There was a main effect of time (P < 0.001) for
each of the appetite perceptions assessed (desire to eat, hunger and fullness) but there
were no trial or trial x time interaction effects for desire to eat or fullness. For
hunger, there was a significant trial effect (P= 0.04) showing that ratings tended to
be higher in the glucose + lactisole trial compared to glucose alone. Following their
decline, ratings of hunger and desire to eat increased until the test meal. Similarly,
following the increase, ratings of fullness gradually decreased until the test meal.
There were no trial or interaction main effects for nausea with ratings decreasing
until the test meal.

103
Figure 3.17 Subjective appetite ratings
Subjective ratings for desire to eat (A), hunger (B), fullness (C) and nausea (D) for
glucose + 500 ppm lactisole ( ), glucose ( ), lactisole ( ), and water ( )
trials. Values represent mean + SEM, (n=7).
Desire to Eat
Time (mins)
Baseline 0 15 30 45 60
De
sir
e to
Ea
t (0
-10
0m
m)
0
20
40
60
80
100
Glucose + 500ppm Lactisole
Glucose
Lactisole
water
Hunger
Time (mins)
Baseline 0 15 30 45 60
Hung
er
(0-1
00
mm
)
0
20
40
60
80
100
Glucose + 500ppm Lactisole
Glucose
Lactisole
Water
Fullness
Time (mins)
Baseline 0 15 30 45 60
Fulln
ess (
0-1
00
mm
)
0
20
40
60
80
100
Glucose + 500ppm Lactisole
Glucose
Lactisole
Water
Nausea
Time (mins)
Baseline 0 15 30 45 60
Na
use
a (
0-1
00
mm
)
0
20
40
60
80
100
Glucose + 500ppm Lactisole
Glucose
Lactisole
Water
A B
C D

104
3.7.6 Test meal intake
Food intake at the ad-libitum test meal was significantly lower following the glucose
trial compared to lactisole and water only conditions (P < 0.05) but did not quite
reach statistical significance between the two main trials 441 + 20.9 vs. 295 + 25.5 g
(691.5 + 32.8 vs. 462.5 + 40.0 kcal, P= 0.06) (figure 3.18).
Figure 3.18 Food intake
Food intake at the ad-libitum test meal after the glucose + 500 ppm lactisole ( ),
glucose ( ), lactisole ( ), and water ( ) trials. Values represent mean + SEM,
(n=7).
105
3.8 Discussion
As discussed in section 3.7.2 following the commencement of part III, a larger
similar study was published by Gerspach et al. Using a comparable dose of lactisole
(450 ppm vs. 500 ppm herein), Gerspach et al investigated the hormone responses,
appetite perceptions and gastric emptying rates in response to an intragastric
administration of glucose (1.35M vs. 1M herein) or a mixed nutrient meal. Taken
together, the results can be summarised as follows. i) In both studies, gastric
emptying was unaffected by lactisole. Importantly lactisole had no effect on CCK
secretion in the Gerspach et al study (Gerspach et al., 2011) which is known to
modulate the effects of glucose on gastric emptying as evidenced by the
administration of the CCK1 receptor antagonist, dexloxiglumide (Little et al.,
2010a). ii) In the current study lactisole had no effect on GLP-1 or PYY secretion.
These results are not in line with the work by Gerspach et al who showed a
significant reduction in both hormones following an intragastric load of lactisole and
glucose. However, they demonstrated a much larger gut hormone response probably
as a consequence of the higher dose of glucose used. In addition, there was no effect
in the current study on the secretion of the hormones PP or GIP. Although there was
a trend for GLP-1, PYY and PP concentrations to be lower in the presence of
lactisole, the results were very variable between participants with no discernible
patterns. iii) In contrast to Gerspach et al, insulin was unaffected by lactisole in
the current study. As a likely consequence of the reduction they found in GLP-1
secretion, Gerspach et al found a reduction in insulin in the first 30 minutes
following infusion although this was not apparent in the latter half of the study.
Furthermore, and again as a likely consequence of the reduction in GLP-1 seen by
Gerspach et al, the AUC for blood glucose was increased by lactisole. A similar but
non-significant trend was apparent in the current study. iv) There was a minimal
effect on appetite perceptions in the current study. A trend for reduced feeling of
fullness were reported by Gerspach et al in line with a trend toward increased
feelings of hunger and desire to eat comparable to glucose alone in the current study.
However, the nausea, which was not reported in the Gerspach study, was quite
marked in the current study. v) The amount of food eaten at the ad-libitum test
meal was higher in the presence of lactisole compared to glucose alone, although this
did not quite reach significance. Food intake was not measured by Gerspach et al.
106
On the basis of the data and that published by Gerspach et al it was not considered
practical or economical to pursue the study any further than the seven participants
already recruited as large numbers would be required.
The lack of effect of lactisole on gastric emptying in the present study and that by
Gerspach et al is not consistent with the attenuated GLP-1 response they documented
if a mechanism of GLP-1 is to mediate gastric emptying in response to glucose as
suggested (Deane et al., 2010). However, this is consistent with a study by Nicolaus
et al who showed no effect of the GLP-1 receptor antagonist on gastric emptying rate
in response to a mixed meal (Nicolaus et al., 2011). Although not measured in the
current study, CCK secretion was unaffected by lactisole in Gerspach’s study
suggesting its release is not mediated via the sweet taste receptor and reinforcing its
role with respect to glucose control to delay gastric emptying (Little et al., 2010a).
One discrepancy between the two studies is the difference in gut hormone responses
observed. A number of possibilities could account for this. The higher dose of
glucose used in the Gerspach study caused a greater hormone response overall with
GLP-1 and PYY concentrations peaking at approximately 10pgmol/L and 160pg/ml
respectively following intragastric glucose compared to 4pgmol/L and 101pg/ml in
the current study. Large variability and small sample size also noted, and the assays
presented here were undertaken in house using commercial kits, which may produce
different absolute values.
Despite observing significantly different gut hormone responses in the Gerspach
study, and a trend for a difference in ad-libitum food intake at the test meal in the
current study, in both studies subjective appetite ratings were not significant. An
innate problem with VAS as proxy measure for food intake is the lack of sensitivity
and large between participant and within participant variability. Voluntary food
intake was determined by providing a standard test meal for participants to consume
ad libitum. This meant food intake could be calculated from the weight of food
consumed, and the macronutrient composition was fixed as opposed to buffet style
test meals which can compromise the measure of food intake by stimulating
participant’s appetite through the provision of a variety of foods (Feinle et al., 2002).
While food intake at the ad-libitum test meal did not quite reach significance, there
was a difference between the two main trials which may be evident in a larger
107
powered study. Although food intake for the control trial, lactisole, was similar to
the glucose + 500 ppm lactisole trial and thus the effect of lactisole itself cannot be
ruled out. Since there is evidence that sweet taste receptor expression can be
modulated by the agonist glucose, albeit in vivo animal models (Young et al., 2009),
it is reasonable to propose a possible comparable antagonistic effect of lactisole. The
effect of lactisole on sweet taste receptor expression is not known.
Due to the limited number of participants in the current study the results have to be
interpreted with caution as the study is obviously in part underpowered.
Speculations about the functional role of gut sweet taste receptors in humans stems
from in vitro and in vivo animal studies showing their involvement in glucose
stimulated GLP-1 and GIP secretion (Jang et al., 2007, Kokrashvili et al., 2009).
Based on these data the hypothesis raised was that:
(i) Sweet agonists such as glucose stimulate the sweet taste receptor on EEC.
(ii) This causes an increase in the secretion of gut hormones such as GLP-1,
GIP and PYY which can be blocked/diminished by the sweet receptor
antagonist lactisole.
(iii) Attenuating the secretion of these hormones with lactisole would alter
glucose metabolism, insulin release, modulate gastric emptying and
augment satiety.
(iv) Thus, gut sweet taste receptors present as potential therapeutic targets.
Although Gerspach et al found an effect of lactisole on GLP-1 and PYY secretion, it
was only a partial effect. The effect of the mixed meal, which was a composition of
protein, fat and carbohydrates, on all parameters was resistant to lactisole suggesting
the involvement of alternative mechanisms. Furthermore, the effect of lactisole
appeared to be offset by these other mechanisms questioning the functional
importance of the sweet taste receptor in regulating hormone release. In support of
this, but in contrast to in vitro experiments, studies have shown activation of sweet
taste receptors by equisweet solutions (sugars and NNS) is not enough to stimulate
hormone secretion and delay gastric emptying (Little et al., 2009, Steinert et al.,
2011, Fujita et al., 2009). It is clear that findings from in vitro studies are not always
representative of human physiology and in this case additional mechanisms are in
108
play. Sugar sensing independent of the sweet taste receptor mechanism may exist
and given the significance of glucose as a major fuel for the body, a glucose specific
mechanism has been proposed (Geraedts et al., 2012). Examples of a glucose
specific mechanism have been investigated by Sclafani et al who demonstrated
flavour conditioning in animal models (Sclafani, 2007, Sclafani and Ackroff, 2012).
Aside from the proposed functional role of sweet taste receptors in mediating the
physiological responses to glucose evidence suggests intestinal glucose absorption
may be mediated by gut sweet taste receptors (Margolskee et al., 2007). The
expression of SGLT1 was increased in mice models following a sugar and/or NNS
diet, an effect not seen in T1R3 knockout deficient mice (Margolskee et al., 2007).
At present, much remains to be discovered about the mechanisms of post-ingestive
glucose sensing, which appears to be different in whole human physiology when
compared to data from animal and cell line studies. Access to primary gut tissue to
culture and study EEC response will be required to achieve this, but this is not
currently feasible. In addition, the data presented here are in lean, healthy, young
subjects. It is possible that differences may arise if studied in obese or type 2 diabetic
individuals, in whom manipulation of sweet sensing in the gut may have possible
utility.
Although the data using the antagonist were broadly negative, multiple experimental
approaches are needed to confirm or refute potential mechanisms. Therefore, further
studies were undertaken using NNS as potential agonists of the sweet receptors, and
will be outlined in the next chapter.
109
CHAPTER 4
Non-nutritive sweeteners do not enhance the glycaemic or appetitive
responses to ingested glucose
4.1 Introduction
NNS consumption has increased considerably with a catalogue of data underlining
the safety and efficacy of NNS consumption leading to the general consensus that
they are metabolically inert (Anton et al., 2010, De La Hunty et al., 2006, Bellisle
and Drewnowski, 2007). Although this may be intrinsically true, recent data suggest
NNS may have physiological effects that alter appetite and/or glucose metabolism.
Following the identification of sweet taste receptors in the gut (Dyer et al., 2005) it is
logical to hypothesise that NNS could activate these receptors causing comparable
metabolic effects to their caloric sweet counterparts. Jang et al (Jang et al., 2007) and
Margolskee et al (Margolskee et al., 2007) demonstrated that the NNS, sucralose,
stimulated GLP-1 secretion from a human L-cell line (NCI-H716) and a murine EEC
line (GLUTag) respectively but the majority of in vivo human data have failed to
confirm the effects of NNS on hormone secretion observed in vitro (Ma et al., 2009,
Steinert et al., 2011), supporting the consensus that NNS, at least in isolation, are not
capable of stimulating hormone secretion in humans.
The data in chapter three, alongside others (Gerspach et al., 2011), demonstrated that
sweet taste receptors in the gut may only be partially responsible for glucose
mediated responses. Furthermore, equally sweet sugars and NNS (glucose, fructose,
ace-k, saccharin) did not have comparable effects on gut hormones responses and
gastric emptying (Little et al., 2009, Steinert et al., 2011) suggesting activation alone
is not enough and other mechanisms independent of the sweet taste receptor may be
crucial. Following reports that NNS could enhance sweet receptor activation in the
rodent gut concerns were raised about the synergistic effect of NNS and sugars,
potentially increasing small intestinal glucose absorption via upregulation and
insertion of transporters (Mace et al., 2007, Margolskee et al., 2007).
The diversity of the human diet ensures that consumption of NNS in isolation is
uncommon except in the form of diet beverages. This leads us to consider whether

110
NNS in combination with sugars could alter appetite and/or glucose metabolism. The
regulation of intestinal glucose absorption via both SGLT1 and the facilitative
transporter GLUT2 (Kellett et al., 2008) has shown a sensitivity to NNS. This has
been demonstrated by the upregulation of SGLT1 and the increase in GLUT2
insertion to the apical membrane following supplementation of the diet with
sucralose, albeit in animal models (Mace et al., 2007, Margolskee et al., 2007).
Using a proxy measure of intestinal glucose absorption this effect was not replicated
in humans (Ma et al., 2010).
The notion that consuming NNS in combination with sugars could potentially alter
glucose absorptive capacity and affect postprandial blood glucose is of great clinical
and nutritional relevance. One human study showed that oral ingestion of sucralose
and ace-k caused an increase in GLP-1 after subsequent glucose ingestion but no
change in blood glucose or insulin (Brown et al., 2009). Other GLP-1 effects such as
satiety were not measured. In contrast Ma et al (Ma et al., 2009) found no difference
in GLP-1 concentrations following infusion of a sucralose and glucose combination
arguing against any significant effect. There is also a lack of clarity about the effects
of NNS on appetite (Mattes and Popkin, 2009) when given in combination with
sugars (Brown et al., 2009). What is completely unknown is whether they exert any
effect in humans if ingested together at dietetically relevant doses.
The objective of the present study was to examine the effects of a panel of
commonly used NNS, aspartame, saccharin, and ace-k, given in combination with
glucose, on glycaemic responses and appetite in healthy humans. The hypothesis is
that, if a sugar and NNS have a synergistic effect and enhance glucose absorption
large enough to be dietetically relevant, then the addition of a NNS to a glucose
solution would increase blood glucose more than glucose alone.
4.2 Method
4.2.1 Design
This study was conducted as a single-blind randomised four-way cross-over study.
Participants attended the laboratory on four separate occasions plus one screening

111
visit with at least five days between each visit. Ethical approval for the study was
granted by the National Health Service North West Research Ethics Committee (ref.
10/H1017/52).
4.2.2 Participants
Ten participants (six male, four female) took part in the study. All participants met
the inclusion/exclusion criteria as detailed in chapter 2.2.1 with the additional
exclusion criteria for those presenting with the condition Phenylketonuria. This
disorder restricts intake of the amino acid phenylalanine which is a by-product of
aspartame. However no screened participants had this extremely rare condition.
4.2.3 Experimental protocol
Participants were studied on four separate occasions and instructed to follow the pre-
study standardisation protocol (chapter 2.3.1). On the day of each study, participants
arrived at the Gastrointestinal Physiology research lab at approximately 9.00 hours
following an overnight 11 hour fast. Upon arrival at the laboratory, an intravenous
cannula was inserted into a vein in the forearm to allow repeated blood sampling
(chapter 2.3.4). A fasting baseline blood sample was collected and a baseline
assessment of appetite was collected using VAS (chapter 2.3.4 and 2.3.2
respectively). All participants were then asked to consume through a drinking straw,
over two minutes (t= -2 min), either a) 45g glucose (180 kcal), b) 45g glucose and
150mg aspartame, c) 45g glucose and 20mg saccharin, or d) 45g glucose and 85mg
ace-k dissolved in tap water to a total volume of 250ml, in a randomised fashion. All
test drinks were prepared on the morning of the study at room temperature and were
presented in transparent beakers as colourless liquids. On completion of the test
drink, blood was sampled immediately following consumption (t= 0) and at t= 5, 10,
15, 30, 45 and 60 min. VAS questionnaires were completed immediately (t= 0) and
at t= 15, 30, and 60 min. Taste ratings were also collected immediately following
each test drink consumption (t= 0) (chapter 2.3.2). Blood samples were collected and
112
processed as described in chapter 2.3.4. Blood glucose was determined immediately
using HemoCue Glucose 201+ Analyser (Hemocue, Angelholm, Sweden) (chapter
2.3.4.1). After 60 minutes the cannula was removed and participants were given
refreshments and free to leave the laboratory with no further limitations. The study
protocol is presented in figure 4.1.
4.2.4 Materials and test foods
D- (+)- Glucose (Sigma-Aldrich, Munich, Germany). For consistency, the
concentration of glucose was kept the same as chapter three.
Aspartame and ace-k were a generous gift from Fuerst Day Lawson Ltd, London.
Saccharin (Hermesetas, Berkshire, UK).
The doses of NNS chosen were approximate to those used in commercial products
marketed by the food industry (e.g. sweetener tablets, diet drinks).
While the combination of pure glucose with NNS is rare in common soft drinks this
study was weighted more towards proof-of-concept. Glucose and NNS in
combination are not representative of a commercial product but the doses of NNS
used were deliberately chosen to reflect those in commercial products and the study
is otherwise modeled on previous studies using NNS preloads followed by ingestion
or intraduodenal glucose infusion (Brown et al., 2009, Ma et al., 2010). In whatever
form sugar is ingested (generally sucrose or fructose), glucose is liberated by
hydrolysis and then absorbed. A reductionist approach of administering pure glucose
overcame any inter-individual differences in macronutrient handling and digestion,
which would be an additional large confounding factor.
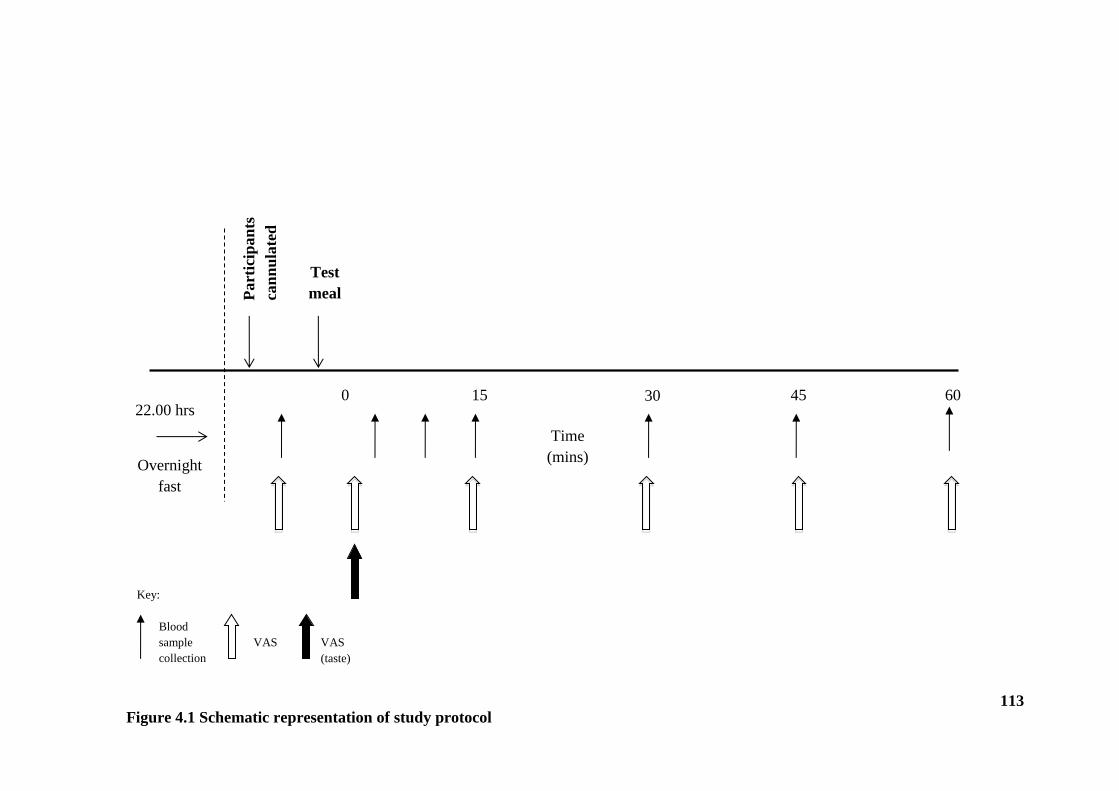
113
0 15 30 45 60
Time
(mins)
Part
icip
an
ts
can
nu
late
d
Test
meal
Overnight
fast
22.00 hrs
Blood
sample
collection
VAS
Key:
Figure 4.1 Schematic representation of study protocol
VAS
(taste)
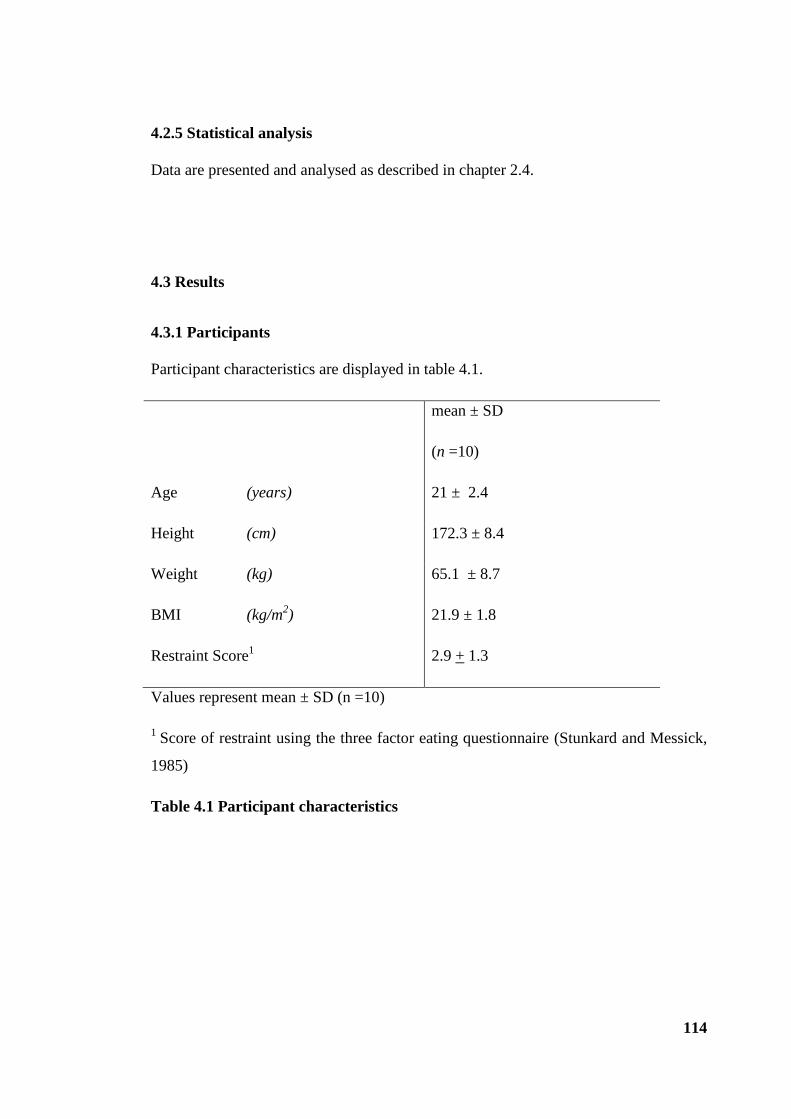
114
4.2.5 Statistical analysis
Data are presented and analysed as described in chapter 2.4.
4.3 Results
4.3.1 Participants
Participant characteristics are displayed in table 4.1.
mean ± SD
(n =10)
Age (years) 21 ± 2.4
Height (cm) 172.3 ± 8.4
Weight (kg) 65.1 ± 8.7
BMI (kg/m2) 21.9 ± 1.8
Restraint Score1 2.9 + 1.3
Values represent mean ± SD (n =10)
1 Score of restraint using the three factor eating questionnaire (Stunkard and Messick,
1985)
Table 4.1 Participant characteristics
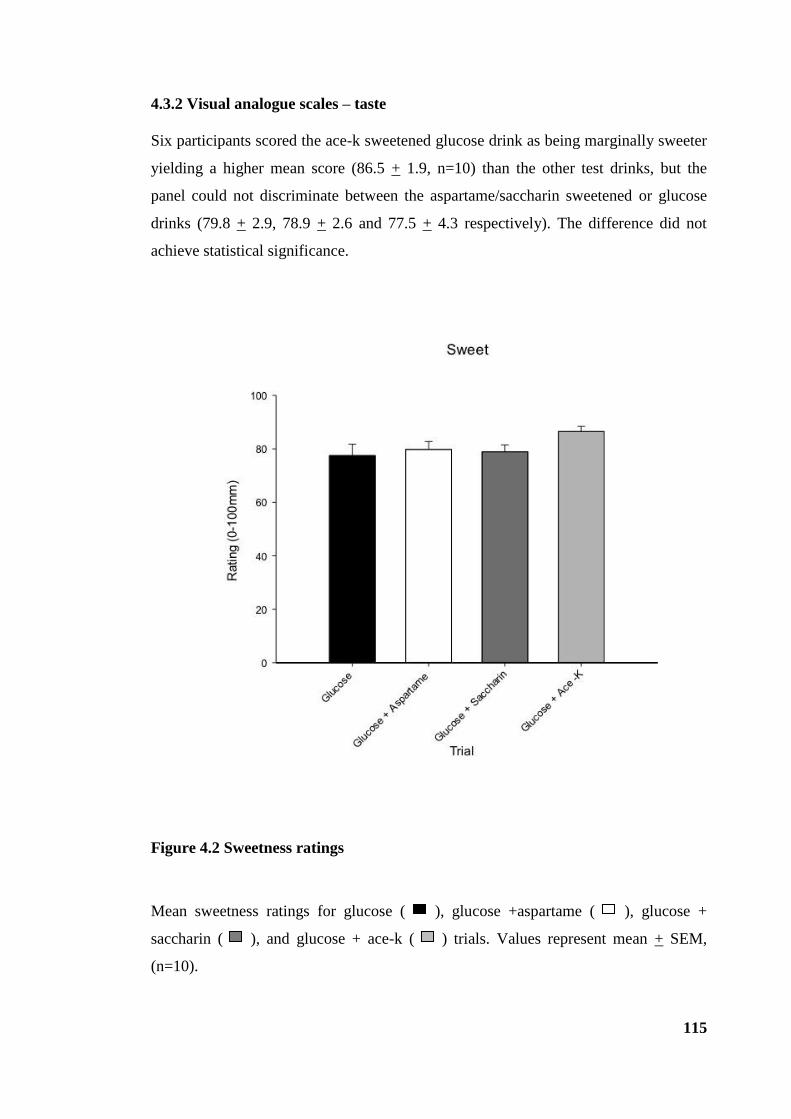
115
4.3.2 Visual analogue scales – taste
Six participants scored the ace-k sweetened glucose drink as being marginally sweeter
yielding a higher mean score (86.5 + 1.9, n=10) than the other test drinks, but the
panel could not discriminate between the aspartame/saccharin sweetened or glucose
drinks (79.8 + 2.9, 78.9 + 2.6 and 77.5 + 4.3 respectively). The difference did not
achieve statistical significance.
Figure 4.2 Sweetness ratings
Mean sweetness ratings for glucose ( ), glucose +aspartame ( ), glucose +
saccharin ( ), and glucose + ace-k ( ) trials. Values represent mean + SEM,
(n=10).

116
4.3.3 Blood glucose
There was no significant difference in fasting blood glucose concentrations between
the four conditions (P > 0.05). Following the ingestion of glucose alone, blood glucose
peaked 45 minutes after consumption reaching 7.6 + 0.5 mmol/L. The mean blood
glucose also peaked identically 45 minutes after the consumption of the glucose +
saccharin test drink at 7.7 + 0.5 mmol/L; the blood glucose values were trivially
greater after glucose + ace-k 8.2 + 0.7mmol/L. The mean blood glucose concentrations
peaked 30 minutes after the consumption of the glucose +aspartame test drink,
reaching a similar but earlier peak value of 7.4mmol/L + 0.3 mmol/L. There was a
main effect of time (P < 0.01) and time x treatment interaction (P < 0.05) indicating
blood glucose differed over time between the four conditions (figure 4.3). However
post-hoc analysis revealed no differences between the glucose and NNS conditions at
any time point. Analysis of AUC demonstrated a larger integrated glycaemic response
following ace-k compared to glucose alone (706.8 +37.7 and 556.2+ 28.0, P= 0.002)
(figure 4.3B) but there was no significant difference between glucose and aspartame
and saccharin trials.

117
Figure 4.3 Blood glucose
Blood glucose concentrations during the glucose ( / ), glucose + aspartame
( / ), glucose + saccharin ( / ) and glucose + ace-k ( / ) trials displayed
over time (A) and as area under the curve (B). Values represent mean + SEM, (n=10).
* Glucose + ace-k significantly larger than glucose trial (P = 0.002).

118
4.3.4 Appetite perceptions
Baseline ratings of desire to eat, hunger and fullness were not significantly different
between the trials (P > 0.05). Ratings of desire to eat and hunger decreased following
consumption of the test drinks while ratings of fullness increased in all trials (figure
4.4). There was a main effect of time (P < 0.001) for each of the appetite perceptions
assessed (desire to eat, hunger and fullness) but there were no trial or trial x time
interaction effects. Following the decline in ratings of hunger and desire to eat and the
increase in fullness there was no discernible patterns between the trials.
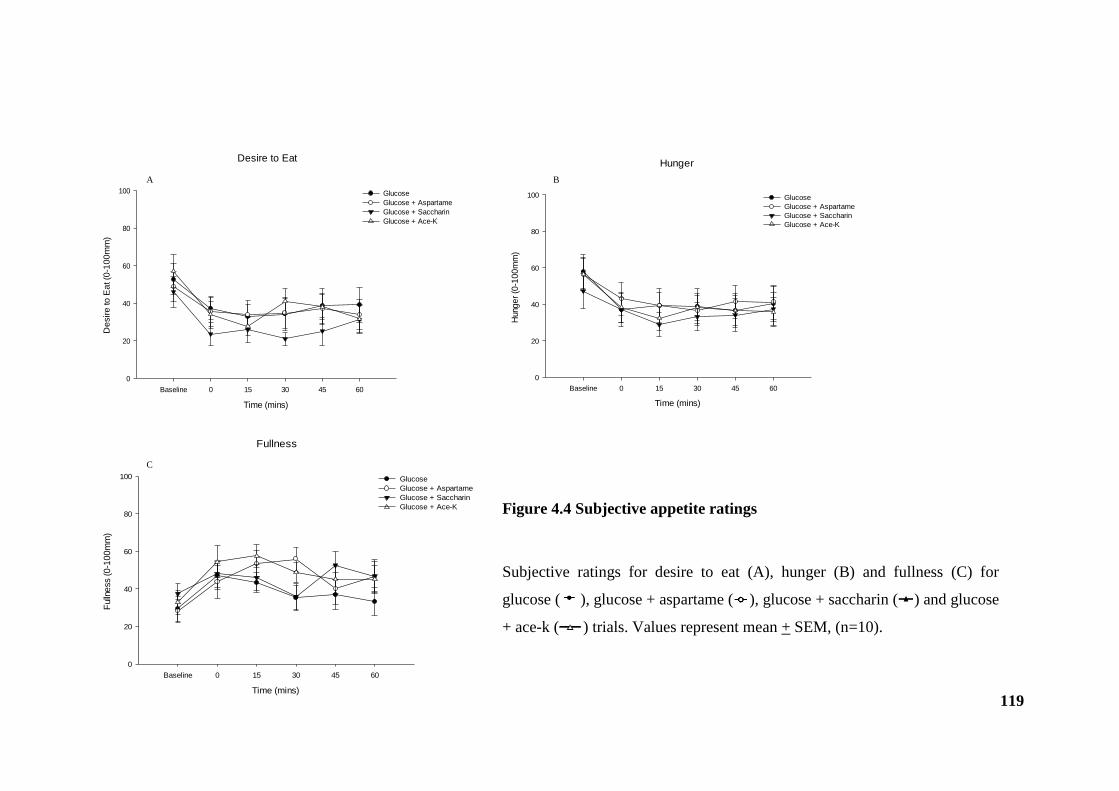
119
Desire to Eat
Time (mins)
Baseline 0 15 30 45 60
De
sir
e to
Ea
t (0
-10
0m
m)
0
20
40
60
80
100 Glucose
Glucose + Aspartame
Glucose + Saccharin
Glucose + Ace-K
Hunger
Time (mins)
Baseline 0 15 30 45 60
Hung
er
(0-1
00
mm
)
0
20
40
60
80
100 Glucose
Glucose + Aspartame
Glucose + Saccharin
Glucose + Ace-K
Fullness
Time (mins)
Baseline 0 15 30 45 60
Fulln
ess (
0-1
00
mm
)
0
20
40
60
80
100 Glucose
Glucose + Aspartame
Glucose + Saccharin
Glucose + Ace-K
A B
C
Figure 4.4 Subjective appetite ratings
Subjective ratings for desire to eat (A), hunger (B) and fullness (C) for
glucose ( ), glucose + aspartame ( ), glucose + saccharin ( ) and glucose
+ ace-k ( ) trials. Values represent mean + SEM, (n=10).

120
4.4 Discussion
This study is the first to directly evaluate the glycaemic and appetitive responses to a
panel of NNS (aspartame, saccharin and ace-k) ingested in combination with a
caloric sugar (glucose) to determine whether this combination could exert a readily
detectable synergistic effect in healthy humans. Such an effect was considered
possible based on the published data available to date. The body of research
surrounding NNS and the impact on glucose metabolism and appetite is predicated
on the identification of gut sweet taste receptors and their involvement in glucose
absorption (Margolskee et al., 2007). Despite human in vivo studies failing to
support any metabolic activity following NNS consumption (Ma et al., 2009, Ford et
al., 2011, Steinert et al., 2011), concerns about the synergistic effect of NNS and
sugars were raised following reports that such a combination could activate sweet
taste receptors in the gut and increase small intestinal glucose absorption via
upregulation and insertion of transporters (Margolskee et al., 2007, Mace et al.,
2007). Hence, a typical human diet involving the consumption of NNS with
carbohydrates raises not only a theoretical concern about raising postprandial
glycaemia in healthy individuals, but even more so in diabetics who already have an
over expression of SGLT1 and GLUT2 (Dyer et al., 2002).
Comparable to consumption of glucose alone, ingesting aspartame, saccharin and
ace-k in combination with glucose had similar effects on blood glucose and
perceptions of hunger, fullness and desire to eat. No significant differences were
present at any time point and therefore reject the hypothesis that NNS in
combination with glucose have a synergistic effect. There was however a small
enhancement when the AUC was measured for blood glucose following the glucose
and ace-k trial. The metabolic significance of this small effect is unclear and unlikely
to have any biological impact. Moreover, the response to ace-k was more variable,
but the data argue against a class effect of NNS enhancing responses by acting as
agonists at the sweet taste receptor since the other two NNS did not have a similar
profile. These broadly negative data are consistent with reports that also failed to
show any effect of pre-supplementation with NNS on blood glucose in humans (Ma
et al., 2010). Similarly Brown et al (Brown et al., 2009) also found no change in
blood glucose following the consumption of a diet soda containing both sucralose
121
and ace-k prior to a glucose load, although they demonstrated enhanced GLP-1
release. The clinical relevance of this finding remains unclear, particularly as insulin
and blood glucose were unaffected, and GLP-1 dependent factors (gastric emptying
and appetite) were not measured. Absorption of glucose is dependent on the rate of
delivery and the length of small intestine exposed to glucose (Little et al., 2006b) but
the reason for different findings in these studies remains unclear.
In the current study, similar to that of Brown et al (Brown et al., 2009), the test
drinks were consumed orally whereas Ma et al (Ma et al., 2010) infused directly into
the duodenum raising the possibility that oral sweet taste receptors or gastric effects
may have influenced the GLP-1 increase in the former study. The commercial doses
of each NNS used, meant the test drinks did not impart an equal degree of sweetness.
Participants failed to discriminate between the sweetness of drinks only scoring ace-
k marginally sweeter despite it being the least sweet NNS out of the three chosen.
Whether matching oral taste properties to downstream gastrointestinal effects would
matter is not something factored into the design. However, despite activation of oral
sweet taste receptors in the current study protocol the route of administration appears
to exert no effect, and comparable effects were found on blood glucose to Ma et al
(Ma et al., 2010). Furthermore, it should be noted that Brown et al (Brown et al.,
2009) did not look at the isolated effects of individual sweeteners or the ingestion as
one load, as has been performed in the present study, but used a commercially
marketed beverage containing a combination of NNS given in advance of the
glucose load. It is not known how this may have affected the study results but it is
difficult to assume that exposure of intestinal sweet taste receptors to NNS, which in
isolation do not cause a rise in GLP-1, would increase GLP-1 release following a
subsequent dose of glucose unless an unknown priming effect occurs.
Unlike cell line and animal models, the concentrations of NNS used herein
approximate to those used in commercial products marketed by the food industry
and, although it is not certain whether these concentrations are too high/low in terms
of sweet receptor biology, the study was designed to be nutritionally relevant.
The previously proposed increase in glucose absorption as a result of the synergy
between a NNS and sugar could potentially influence the rate of gastric emptying
and therefore appetite. However, in the current study, the addition of aspartame,
122
saccharin and ace-k to glucose had no additional effect on appetite compared with
glucose alone. This is consistent with the existing literature that NNS do not have
any unwanted effects on appetite (Bellisle and Drewnowski, 2007, Anton et al.,
2010). The observed decrease in hunger and increase in fullness following
consumption is presumably due to an increased intragastric volume (Schwartz,
2000). Again the negative VAS data cannot support substantive conclusions. As
discussed in chapter three, VAS ratings are subjective and should therefore be
interpreted with caution. The large variability, both within and between participants
can result in larger sample sizes, beyond the remit of this proof of concept study,
being required to detect differences.
A number of limitations in the study design need to be highlighted. Firstly, although
the sample size of ten participants was small, I sought to establish whether a readily
demonstrable/important effect existed – i.e. an effect that would impact on the
response of an individual person consuming a commercial dose of NNS- and to that
end consider the sample adequate, given the broadly negative data. A larger sample
might ‘squeeze out’ small effects that become statistically significant, but does not
lend itself to be dietetically relevant. Secondly, although blood was collected and
processed for the determination of gut hormones it was decided, based on the current
observations, that further analysis would not be worthwhile or economically
justified. A definitive study would standardly include insulin and gut hormone
profiles, but I did not consider these necessary in this small proof of concept study.
Indeed the lack of differential glycaemic responses between conditions would render
these superfluous and are not necessary in order to interpret the current data. If a
clear effect existed, then studying its mechanism would indeed require gut hormone
assays. Arguably the study is short at only 60 minutes and not comparable to other
studies that have measured variables over 120 minutes. However, measurements of
blood glucose after a relatively small glucose dose peak early, and fall almost to
baseline by the 60 minute end point. Any dietetically meaningful effect would be
expected to occur within this early phase and expecting a significant difference to
subsequently arise in an additional hour does not seem realistic.
To date there is no consistent evidence that NNS intake perturbs glucose absorption
and appetite in healthy human participants. However, NNS are widely consumed

123
including among obese and diabetic groups highlighting the need to investigate the
effects not only in the short term but also the effect of repeated or long term
exposure both in healthy and diabetic individuals. Participants’ long term intake was
not considered in the current study and future studies may need to stratify individuals
into low and high NNS consumers. Different methods of administration between
studies (i.e. oral vs. intragastric) also have to be considered. Appetite control is not
just a physiologically controlled mechanism and the effects of oral stimulation have
to be taken into account. Sensory and stimulatory influences, among which
sweetness is a factor, can affect appetite, not least due to input from higher brain
centres eliciting reward related signalling. Thus, it is important to explore the effects
of oral vs. intragastric administration since the effects seen may be dependent on the
experimental context as well as the test substance in question. The present study used
oral administration to replicate ‘real life’ beverage intake.
In conclusion, NNS as a class did not affect the glycaemic responses to ingested
glucose in healthy humans but ace-k may however merit separate attention as it may
have different properties. The effects on appetite warrant further investigation using
more robust methods.

124
CHAPTER 5
Gastric emptying and CNS responses to orally and intragastrically
administered sweet tastants
Much interest lies in attempting to elucidate the gut-brain signalling mechanisms that
regulate appetite and food intake. As mentioned in chapter one, human studies have
focused on physiological processes such as gastric emptying, metabolic secretions,
absorption and glucose homeostasis in response to sugars and NNS (Parker et al.,
2010, Young, 2011, Steinert et al., 2011, Gerspach et al., 2011). The previous
chapters of this thesis have focused on sweet taste receptors in the gut and their
potential role in mediating the appetitive response to sugars and NNS. However, the
modulation of appetite and food intake is likely to represent a combination of oro-
sensory and gastric signals. Sweet taste sensing begins in the mouth and continues
after ingestion with signals generated in the gut forwarded to and integrated within
the brain. fMRI has enabled the study of CNS appetite pathways and much is known
about parts of the brain that process sweet taste and evaluate the hedonic and reward
value of sweet taste (Small, 2012, Smeets et al., 2011, Li et al., 2012). Much less is
known about the relative contributions of oro-sensory and gastric stimulation to
appetite regulation and the integration of both within the brain.
This chapter is split into two experimental parts. Study I investigated whether there
are differential effects of oral and gastric stimulation by sweet tastants on
psychological (appetite) and physiological (gastric emptying) components. The
interaction of oral with gastrointestinal sweet stimuli on brain activation was then
studied using fMRI in study II. Each study is described in turn.

125
Study I: Effect of oral sweet taste on the gastric emptying of sweet solutions
5.1 Introduction
Initially, the mouth and gut were considered to be sites of feeding stimulation and
inhibition respectively (Sclafani and Ackroff, 2012). In reality oral taste sequentially
precedes gastrointestinal chemo-sensation and it is likely that mechanisms that
operate to control food intake in the short term include a combination of cognitive,
cephalic, gastrointestinal and post-absorptive responses that all contribute to satiety
(Cecil et al., 1998b, Oesch et al., 2006). Furthermore, it is not only a combination
but an interaction between these factors that is necessary to elicit satiety and control
food intake. The infusion of nutrients into the small intestine at a rate comparable
with gastric emptying had a weak effect on appetite and food intake suppression
compared to when the same nutrients were infused into the stomach or orally
ingested (Cecil et al., 1998a).
Research investigating mechanisms controlling eating behaviour in humans have
employed different methodologies to dissect the effect of oral, gastric and intestinal
stimulation on appetite and energy intake (French and Cecil, 2001). The direct
administration of nutrients into areas of the gastrointestinal tract eliminates the oro-
sensory and cognitive or learned responses such as experience and expectation as
well as hedonic aspects. However, caution must be exerted when results are
examined in comparison to normal feeding conditions. Previous research suggests an
important role for oro-sensory stimulation on the suppression of hunger and
generation of fullness produced by gastric distension (Cecil et al., 1998b, Wijlens et
al., 2012) which is thought to be affected at least in part by a slower gastric emptying
rate following oral ingestion as opposed to intragastric infusion. Therefore it is likely
that signals from the mouth to brain affect the regulation of gastric emptying,
although, further studies are essential. How these pathways interact in the human
brain has never been studied.
As a prerequisite to study II, the aim of study I was to establish whether sweet
tastants (glucose and saccharin) have equivalent effects on gastric emptying and
appetite responses if consumed orally then swallowed, or if they are directly
administered intragastrically, i.e. whether the rate of gastric emptying and appetite
126
are dependent on the route of administration. The experimental variable in study I is
whether or not oral taste has been activated. Determining changes in gastric
emptying rate, a vagovagal reflex requiring brainstem activation, is once again used
as an integrated proxy measure of gut-brain signalling.
5.2 Method
5.2.1 Design
This study was conducted as a single blind randomised cross-over study. Participants
attended the Wellcome Trust Clinical Research Facility on six occasions (plus a
screening visit) with at least three days between each trial visit. Ethical approval for
the study was granted by the National Health Service North West Research Ethics
Committee (ref. 10/H1016/134)
5.2.2 Participants
Ten participants (five female, five male) were involved. All participants met the
inclusion/exclusion criteria as detailed in chapter 2.2.1.
5.2.3 Experimental protocol (study I)
Participants were studied on six separate occasions and instructed to follow the pre-
study standardisation protocol (chapter 2.3.1). On the day of each trial visit
participants arrived at the facility at approximately 9.00 hours following an overnight
11 hour fast. On arrival, participants were asked to provide a baseline, end-
expiratory breath sample (chapter 2.3.3) and a baseline assessment of appetite was
collected using VAS (chapter 2.3.2). On three out of six trial visits participants were
then intubated with a NG feeding tube (Ryles tube 10FG) via which test solutions
were administered. The NG tube was removed immediately following the infusion.
Participants were asked to consume the test solutions through a drinking straw on the
127
remaining three trial visits. Participants received an intragastric infusion or
consumed orally, over 2 minutes (t= -2 - 0min), either a) 45g of glucose (180 kcal)
dissolved in tap water b) 20mg saccharin dissolved in tap water or c) tap water in a
total volume of 250ml in a randomised order. All test solutions were prepared on the
morning of the study at room temperature and were presented in transparent beakers
as colourless liquids with no visible differences. All test solutions were labelled with
100mg of [13
C] sodium acetate for determination of gastric emptying rate. End–
expiratory breath samples were collected immediately before and after
infusion/consumption (t= -5, t= 0) and at 5 minute intervals until 60 minutes.
Subjective appetite perceptions of hunger, fullness, desire to eat and nausea were
collected immediately before and after infusion/consumption (t= -5, t= 0) and at 15
minute intervals until 60 minutes. Following light refreshments, participants were
free to leave the facility. The study protocol is presented in figure 5.1.
5.2.4 Materials and test foods
D- (+)- Glucose (Sigma-Aldrich, Munich, Germany). The concentration of glucose
was based upon previous work showing 1M glucose to have a potent effect on
gastric emptying (Little et al., 2010a) and is consistent with previous studies in this
thesis.
Saccharin (Hermesetas, Berkshire, UK). The amount used was based on
commercially sourced dose units (i.e. sweetener tablets).
[13
C] sodium acetate (CK Gas Products, Hampshire, UK).

128
45 30 0 15 60
Time
(mins)
Part
icip
an
ts i
ntu
bate
d (
3 o
ut
of
6 o
ccasi
on
s)
Test
meal/drink
(Oral or IG
infusion)
Overnight
fast
22.00 hrs
Key:
Breath
sample
collection VAS
Figure 5.1 Schematic representation of study protocol
IG- intragastric
-5
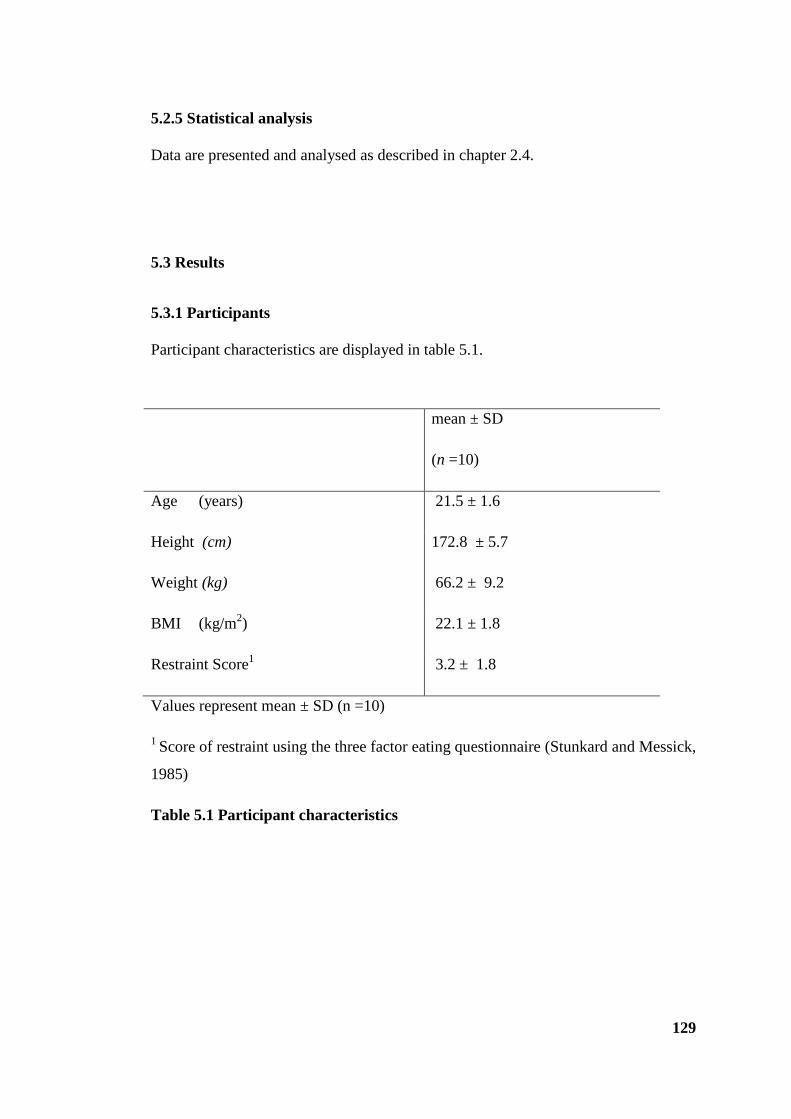
129
5.2.5 Statistical analysis
Data are presented and analysed as described in chapter 2.4.
5.3 Results
5.3.1 Participants
Participant characteristics are displayed in table 5.1.
mean ± SD
(n =10)
Age (years) 21.5 ± 1.6
Height (cm) 172.8 ± 5.7
Weight (kg) 66.2 ± 9.2
BMI (kg/m2) 22.1 ± 1.8
Restraint Score1 3.2 ± 1.8
Values represent mean ± SD (n =10)
1 Score of restraint using the three factor eating questionnaire (Stunkard and Messick,
1985)
Table 5.1 Participant characteristics

130
5.3.2 Gastric emptying
Following the oral consumption and intragastric infusions of test solutions, there was
a rise in 13
CO2 : 12
CO2 with values peaking at 25 minutes for orally and
intragastrically administered saccharin and water trials, and at 35 minutes for oral
and intragastric glucose, after which 13
CO2 : 12
CO2 values began to decrease (figure
5.2A). For both gastric emptying rate and AUC (figure 5.2B), there was a main
effect of time and condition (P < 0.001) but no effect of method of administration
(oral vs. intragastric). Oral and intragastric glucose slowed gastric emptying when
compared with the oral and intragastric saccharin and water trials. Therefore, in
keeping with previous data, saccharin had no effect on gastric emptying, and no
additional effect was exerted by including oral sweet tasting.

131
Figure 5.2 Gastric emptying rate
Gastric emptying rate of glucose oral ( / ), glucose intragastric (IG) ( / ),
saccharin oral ( / ), saccharin IG ( / ), water oral ( / ) and water IG
( / ) trials displayed over time (A) and as area under the curve (B). Values
represent mean + SEM, (n=10).
132
Although no overall effect was seen on gastric emptying rate between oral and
intragastric methods, closer inspection of the data suggested emptying rates differed
between the two routes of administration from baseline to 15 minutes and 15 minutes
to 60 minutes, particularly in the glucose trials. When analysed in these time bins,
intragastrically administered glucose emptied significantly faster than orally
administered glucose for the first 15 minutes (AUC; 469.2 + 62 vs. 346.7 + 20.8,
figure 5.3B) (P= 0.05) but the residual volume emptied significantly more slowly
for the remaining 45 minutes of the study (figure 5.3C) (P < 0.05). Peak 13
CO2 :
12CO2 values reaching 47.0 + 1.0 and 40.0 + 1.7 (AUC; 2858.2 + 60.2 vs. 2478.0 +
118.5) for oral and intragastric trials respectively. Similarly, intragastric water also
emptied faster for the first 15 minutes (AUC; 537.8 + 51.4 vs. 424.0 + 48.6, figure
5.5B) (P < 0.03). However, in contrast to glucose, intragastrically administered water
emptying remained faster than its orally swallowed counterpart, albeit not
significantly, for the remaining 45 minutes of the study (figure 5.5C) (P = 0.3) with
peak 13
CO2 : 12
CO2 values reaching 58.0 + 4.3 and 67.3 + 4.4 (AUC; 3485.0 + 208.1
vs. 3571.9 + 174.0) for oral and intragastric trials respectively. Orally and
intragastrically delivered saccharin displayed similar gastric emptying rates. Similar
to glucose and water, there was a trend for intragastric saccharin to empty faster
compared to oral saccharin in the first 15 minutes (AUC; 559.3 + 106 vs. 479.2 +
34.7, figure 5.4B) but this was not significant (P= 0.5). Intragastric saccharin
remained marginally faster for the remaining 45 minutes with peak 13
CO2 : 12
CO2
values reaching 58.5 + 3.4 and 61.8 + 4.7 (AUC; 3256.8 + 135.9 vs. 3396.5 + 210.8)
for oral and intragastric trials respectively (figure 5.4C).

133
Figure 5.3 Gastric emptying rate of glucose
Gastric emptying rate of glucose oral ( ) and intragastric (IG) ( ) trials displayed
over time (A). Area under the curve from baseline (BL) to 15 minutes (B) and 15
minutes to 60 minutes (C) for glucose oral ( ) and IG ( ) trials. Values represent
mean + SEM, (n=10). * Significant difference between trials (P < 0.05).
Glucose
Time (mins)
Baseline 0 5 10 15 20 25 30 35 40 45 50 55 60
13C
O2
: 1
2C
O2
0
10
20
30
40
50
60
Glucose oral
Glucose IG
Gastric emptying AUC
Trial
Gluco
se o
ral
Gluco
se IG
AU
C
13C
O2 : 1
2C
O2 (
BL
-15
min
)
0
100
200
300
400
500
600
Gastric emptying AUC
Trial
Gluco
se o
ral
Gluco
se IG
AU
C
13C
O2 : 1
2C
O2 (
15
-60
min
)
0
500
1000
1500
2000
2500
3000
3500
A
BC
* *

134
Figure 5.4 Gastric emptying rate of saccharin
Gastric emptying rate of saccharin oral ( ) and intragastric (IG) ( ) trials
displayed over time (A). Area under the curve from baseline (BL) to 15 minutes (B)
and 15 minutes to 60 minutes (C) for saccharin oral ( ) and IG ( ) trials. Values
represent mean + SEM, (n=10).
Saccharin
Time (mins)
Baseline 0 5 10 15 20 25 30 35 40 45 50 55 60
13C
O2
: 1
2C
O2
0
10
20
30
40
50
60
70
Saccharin oral
Saccharin IG
Gastric emptying AUC
Trial
Sac
char
in o
ral
Sac
char
in IG
AU
C
13C
O2 : 1
2C
O2 (
BL
-15
min
)
0
100
200
300
400
500
600
700
Gastric emptying AUC
Trial
Sac
char
in o
ral
Sac
char
in IG
AU
C
13C
O2 : 1
2C
O2 (
15
-60
min
)
0
500
1000
1500
2000
2500
3000
3500
4000
A
B C
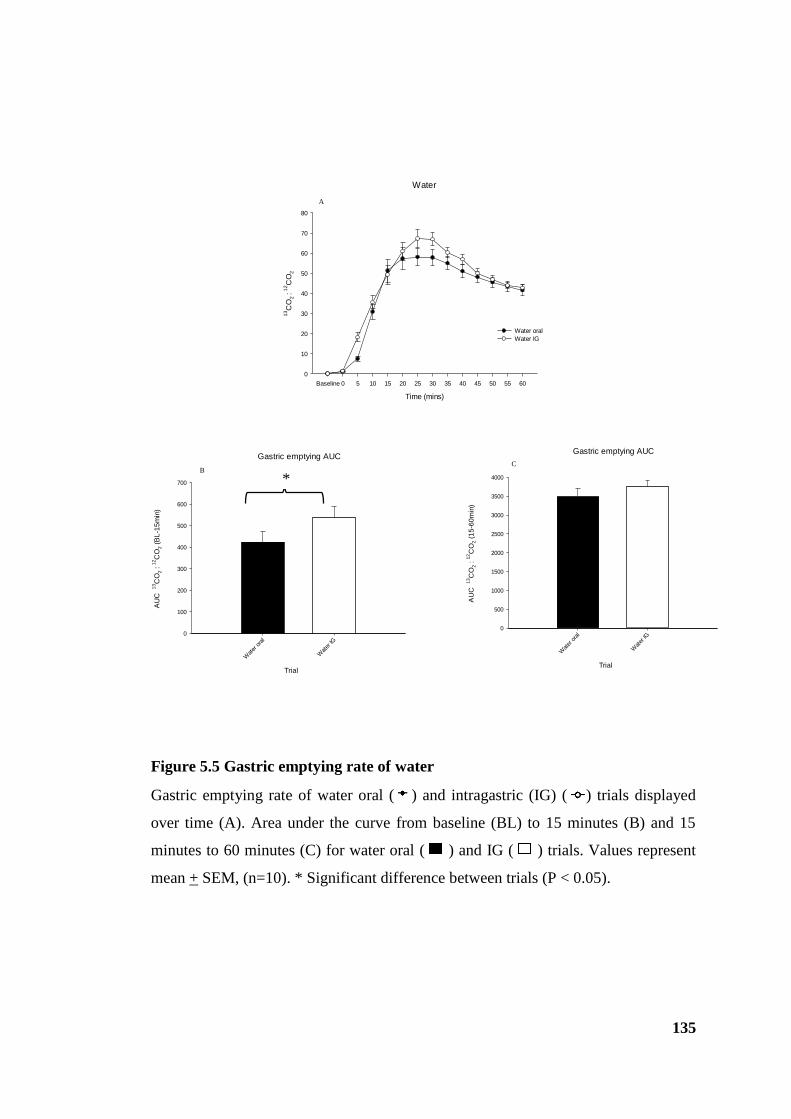
135
Figure 5.5 Gastric emptying rate of water
Gastric emptying rate of water oral ( ) and intragastric (IG) ( ) trials displayed
over time (A). Area under the curve from baseline (BL) to 15 minutes (B) and 15
minutes to 60 minutes (C) for water oral ( ) and IG ( ) trials. Values represent
mean + SEM, (n=10). * Significant difference between trials (P < 0.05).
Water
Time (mins)
Baseline 0 5 10 15 20 25 30 35 40 45 50 55 60
13C
O2
: 1
2C
O2
0
10
20
30
40
50
60
70
80
Water oral
Water IG
Gastric emptying AUC
Trial
Wat
er o
ral
Wat
er IG
AU
C
13C
O2 : 1
2C
O2 (
BL
-15
min
)
0
100
200
300
400
500
600
700
Gastric emptying AUC
Trial
Wat
er o
ral
Wat
er IG
AU
C
13C
O2 : 1
2C
O2 (
15
-60
min
)
0
500
1000
1500
2000
2500
3000
3500
4000
A
BC
*

136
5.3.3 Appetite perceptions
Baseline ratings for desire to eat, hunger, fullness and nausea were not significantly
different between the oral and intragastric trials for glucose, saccharin or water (P >
0.05). Ratings of desire to eat and hunger decreased following oral consumption and
intragastric infusions while ratings of fullness increased. There was a main effect of
time (P < 0.001) for each of the appetite perceptions assessed (desire to eat, hunger
and fullness) for glucose, saccharin and water trials but no effect of route of
administration or route of administration x time interaction. In the glucose and
saccharin trials, there was a trend for ratings of desire to eat to be lower and
perceptions of fullness to be higher in the intragastric trials compared to the oral
route of administration, immediately following test solution consumption or infusion
(Figure 5.6 and 5.7). Following their decline, ratings of hunger and desire to eat in
the glucose and saccharin trials, increased. Similarly, following the increase, ratings
of fullness gradually decreased. There was no discernible patterns following oral or
intragastric water on any of the appetite perceptions assessed (Figure 5.8). There was
a main effect of time (P < 0.001) and route of administration x time interaction (P <
0.01) for nausea. Although not significant, there was a trend for intragastric glucose,
saccharin and water to have higher nausea ratings following the infusion compared
to oral consumption.

137
Figure 5.6 Subjective appetite ratings following glucose test meals
Subjective ratings for desire to eat (A), hunger (B), fullness (C) and nausea (D)
during the glucose oral ( ) and glucose intragastric (IG) ( ) trials displayed over
time. Values represent mean + SEM, (n=10).
Desire to Eat
Time (mins)
Baseline 0 15 30 45 60
De
sir
e to
Ea
t (0
-10
0m
m)
0
20
40
60
80
100
Glucose oral
Glucose IG
Hunger
Time (mins)
Baseline 0 15 30 45 60
Hung
er
(0-1
00
mm
)
0
20
40
60
80
100
Glucose oral
Glucose IG
Fullness
Time (mins)
Baseline 0 15 30 45 60
Fulln
ess (
0-1
00
mm
)
0
20
40
60
80
100
Glucose oral
Glucose IG
Nausea
Time (mins)
Baseline 0 15 30 45 60
Na
use
a (
0-1
00
mm
)
0
20
40
60
80
100
Glucose oral
Glucose IG
AB
DC
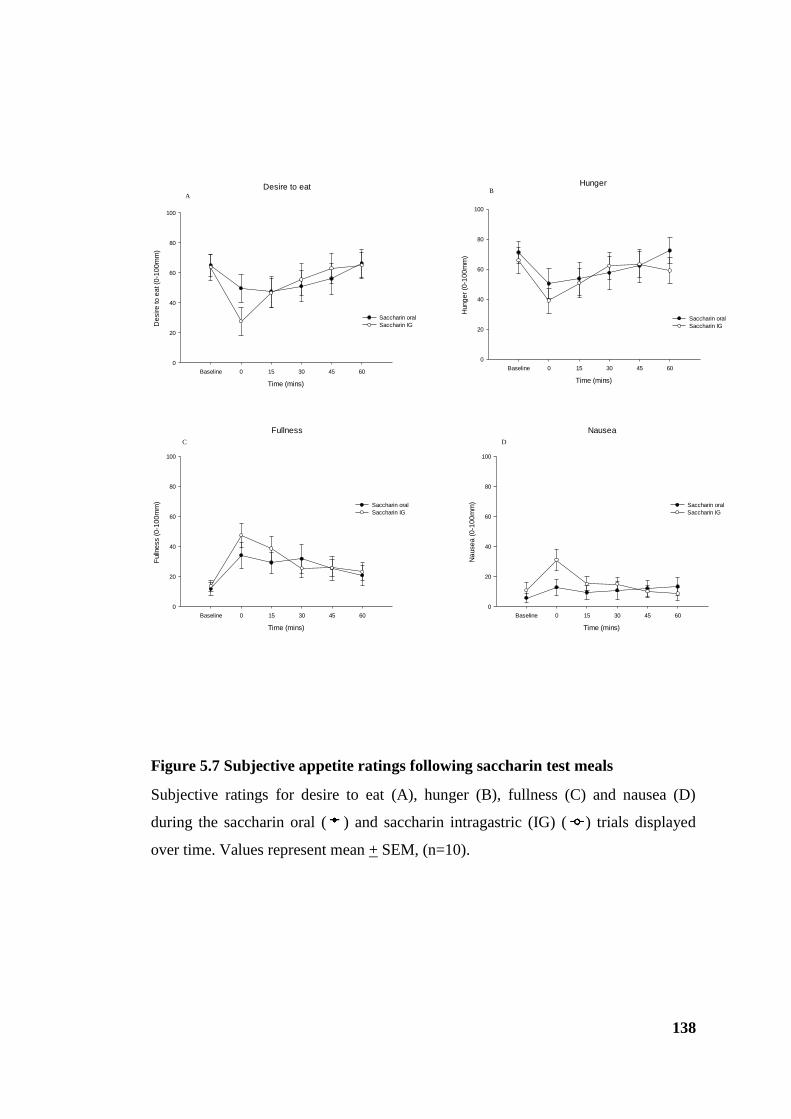
138
Figure 5.7 Subjective appetite ratings following saccharin test meals
Subjective ratings for desire to eat (A), hunger (B), fullness (C) and nausea (D)
during the saccharin oral ( ) and saccharin intragastric (IG) ( ) trials displayed
over time. Values represent mean + SEM, (n=10).
Desire to eat
Time (mins)
Baseline 0 15 30 45 60
De
sir
e to
ea
t (0
-10
0m
m)
0
20
40
60
80
100
Saccharin oral
Saccharin IG
Fullness
Time (mins)
Baseline 0 15 30 45 60
Fulln
ess (
0-1
00
mm
)
0
20
40
60
80
100
Saccharin oral
Saccharin IG
Hunger
Time (mins)
Baseline 0 15 30 45 60
Hung
er
(0-1
00
mm
)
0
20
40
60
80
100
Saccharin oral
Saccharin IG
Nausea
Time (mins)
Baseline 0 15 30 45 60
Na
use
a (
0-1
00
mm
)
0
20
40
60
80
100
Saccharin oral
Saccharin IG
AB
DC
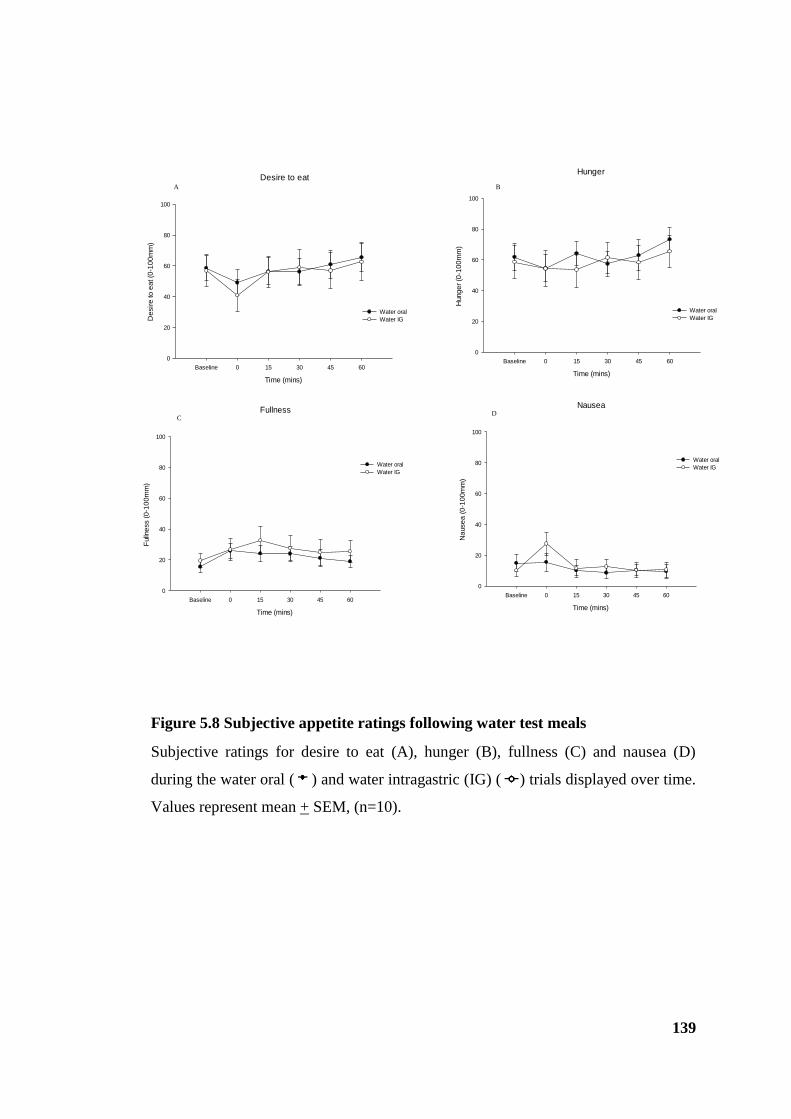
139
Figure 5.8 Subjective appetite ratings following water test meals
Subjective ratings for desire to eat (A), hunger (B), fullness (C) and nausea (D)
during the water oral ( ) and water intragastric (IG) ( ) trials displayed over time.
Values represent mean + SEM, (n=10).
Desire to eat
Time (mins)
Baseline 0 15 30 45 60
De
sir
e to
ea
t (0
-10
0m
m)
0
20
40
60
80
100
Water oral
Water IG
Fullness
Time (mins)
Baseline 0 15 30 45 60
Fulln
ess (
0-1
00
mm
)
0
20
40
60
80
100
Water oral
Water IG
Hunger
Time (mins)
Baseline 0 15 30 45 60
Hung
er
(0-1
00
mm
)
0
20
40
60
80
100
Water oral
Water IG
Nausea
Time (mins)
Baseline 0 15 30 45 60
Na
use
a (
0-1
00
mm
)
0
20
40
60
80
100
Water oral
Water IG
A B
DC
140
5.4 Discussion
This study has demonstrated that, the rate of gastric emptying for glucose differs
depending on whether it is consumed orally or administered directly into the stomach
to bypass oral taste receptors. Glucose slowed gastric emptying compared to
saccharin and water, independent of route of administration, which is consistent with
previous studies (Little et al., 2009, Steinert et al., 2011). The differences in gastric
emptying rate for glucose occurred in two phases with intragastric glucose emptying
faster then significantly slower in the first 15 and remaining 45 minutes respectively.
This pattern of emptying was not apparent for saccharin or water conditions with
intragastric administration of both emptying marginally faster for the duration of the
study. This cannot be a confounding effect of NG tube placement inducing slower
emptying for the last 45 minutes (no tube was placed for the orally consumed meal)
since the effect was confined to glucose, and not seen in the control condition.
As demonstrated in chapter three, an intragastric infusion of glucose results in
hormonal signals that contribute to the inhibition of gastric emptying and appetite,
but the stimulation of oral taste receptors in normal consumption of food and drink
may further modulate appetite by inducing cephalic phase responses (Lavin et al.,
2002, Smeets et al., 2010) and by activating appetite regulating centres within the
CNS (Rolls, 2007). However, there was no effect on desire to eat, hunger and
fullness ratings depending on whether solutions were given by mouth or
intragastrically administered, despite the significant slowing of gastric emptying by
glucose. A decrease in hunger, and increase in fullness was observed immediately
following all oral and intragastric infusions, although less obvious for water
conditions, presumably because of the increased gastric distension. However, there
was a trend for desire to eat to be lower and fullness ratings higher when glucose and
saccharin were intragastrically infused compared to consumed orally. This does not
support the suggestion that oro-sensory factors, including sweetness, can influence
feelings of hunger and prospective consumption (Cecil et al., 1998b, Poothullil,
1995). However, despite not being significant, the trend for intragastric
administration to magnify feelings of fullness may be influenced at least in part by
the presence of the NG tube and the infusion itself which induces higher nausea
scores than oral ingestion although the effect was short lived.
141
Overall, the changes in appetite responses were relatively small and any differences
between the route of administration were only apparent immediately following
consumption/infusion with no discernible patterns thereafter. This suggests a lack of
mechanistic relationship between the gastric emptying and appetite responses. As
intragastric glucose emptied more slowly than oral glucose in the last 45 minutes it
might have been expected to enhance feelings of fullness and suppression of hunger
due to an increased period of gastric distension. However, similar to Lavin et al, the
present VAS data did not support this, suggesting a low sensitivity of VAS ratings to
intragastrically administered solutions (Lavin et al., 2002). Although gastric
distension is an important factor for inducing feelings of fullness (Rolls and Roe,
2002), oro-sensory stimulation is still crucial. For instance, despite suppressed
subjective appetite responses as a result of gastric feedback this does not always
translate into a reduction in food intake without prior oral stimulation (Oesch et al.,
2006).
In conclusion, the pattern and rate of gastric emptying of glucose differed depending
on whether it was given orally or administered intragastrically. A further study is
required to ascertain the impact this might have on food intake. Given that a different
pattern of emptying occurred when glucose tasting had occurred, a new hypothesis
was generated, that oral glucose sensing would alter the CNS response to
intragastrically administered glucose.
142
Study II: Effect of sequential oral and gastrointestinal stimulation on brain
BOLD responses to glucose
5.5 Introduction
In humans, fMRI has become a popular and rapidly advancing research tool to study
appetite. A number of homeostatic (e.g. hypothalamus) and non-homeostatic (e.g.
insula, amygdala, OFC) regions associated with the regulation of appetite have been
identified (De Silva et al., 2012). With regard to homeostatic control, the
hypothalamus is recognised as a critical region for the integration of CNS appetite
signals to regulate food intake (Heijboer et al., 2006). One of the first studies using
fMRI showed a decrease in hypothalamic BOLD signal occurring 7-12 minutes after
oral ingestion of glucose (Liu, Gao et al. 2000). Subsequent studies have reinforced
these findings showing a dose-dependent and prolonged decrease in BOLD signal in
the hypothalamus following glucose ingestion (Smeets et al., 2005b, Smeets et al.,
2005a). Similarly, studies have demonstrated effects on non-homeostatic regions
following the ingestion of sugars and NNS (Smeets et al., 2005a, Smeets et al., 2011,
Chambers et al., 2009, Frank et al., 2008) and/or evaluating responses to food cues
using visual stimuli (Page et al., 2011) with little focus on the physiological
responses to nutrient ingestion. However, the aforementioned studies are technically
limited by drinking associated movements during the oral consumption of test meals
which induce imaging artefacts potentially obscuring the detection of possible
BOLD signal changes. This is an insurmountable problem particularly when imaging
the brainstem, since the areas of interest are extremely small and the changes
observed may be subtle. Moreover, detailed imaging of the brainstem during nutrient
ingestion had not been reported until recently and given it is the first point of contact,
with signals transmitted from the gastrointestinal tract via vagal afferents, it is
important to include this in CNS imaging studies. Furthermore, studying homeostatic
and non-homeostatic mechanisms in isolation is not representative of appetite
regulation and feeding behaviour as they do not function independently (De Silva et
al., 2012). To date no studies have been undertaken to integrate brain responses to
oral and gastrointestinal nutrient sensing, which more closely resembles
consumption.
143
As mentioned in chapter one, the development of physMRI in this department has
enabled the evaluation of BOLD signal responses to nutrients over time in the whole
brain with improved spatial and temporal resolution (Jones et al., 2012, Lassman et
al., 2010). In order to eliminate the confounding factors of oral ingestion, prior
departmental work has always investigated the effect of glucose on brain activation
(as with gastric emptying) by administering intragastrically, using an NG tube, an
approach which enables the study of gut to brain signalling independently. However,
this approach does not mimic the sequence of events that occurs when sweet
substances are ingested in real life. In reality, oral taste sequentially precedes
gastrointestinal chemo-sensation. The overall response to ingested nutrients will not
exclusively depend on gut-to-brain signals and it is likely an interaction between the
two sensory phases occurs within the CNS.
The differences in gastric emptying rate between orally and intragastrically delivered
glucose observed in study I form the basis and justification for this study. The
objective of the present study was to model the sequence of activation in normal
ingestive patterns, whilst minimising the artefacts and difficulties inherent on
imaging brain areas during swallowing. The purpose of the study was twofold: first,
to establish the effect of oral and sequential gastrointestinal “sweetness” on brain
activation and second, to investigate whether oral sweet taste affects the gut to brain
signal.
5.6 Method
5.6.1 Design
This study was conducted as a single blind randomised cross-over study. Participants
attended the Translational Imaging Unit on four occasions (plus a screening visit)
with at least three days between each trial visit. Ethical approval was granted by the
National Health Service North West Research Ethics Committee (ref. 11/NW/0663).
144
5.6.2 Participants
15 participants (six female, nine male) took part. One participant was involved in
both studies I and II. All participants met the inclusion/exclusion criteria as detailed
in chapter 2.2.1. In addition, participants completed a magnetic resonance imaging
patient declaration form (Appendix VI) as part of the screening process to exclude
anyone in whom MRI is contraindicated (e.g. pacemaker, metal foreign body).
5.6.3 Experimental protocol (study II)
Participants were studied on four separate occasions and instructed to follow the pre-
study standardisation protocol (chapter 2.3.1). On the day of each trial visit,
participants arrived at the Imaging Unit at approximately 9.00 hours following an
overnight 11 hour fast. Upon arrival, participants were intubated with a NG tube
(Ryles tube 10FG) which was then connected to adapted oxygen bubble tubing and a
syringe for intragastric test meal delivery in the scanner (Bunzl Healthcare,
Leicester, UK) (figure 5.9A). Participants were then positioned in the scanner (3.0T
Philips Achieva MR System) (figure 5.10) and the oral tubing (figure 5.9B) placed in
the participants mouth. Participants were scanned continuously for 35 minutes. After
a baseline period of five minutes a 20ml solution of either a) 1M glucose or b)
artificial saliva (AS) was delivered to the mouth (t= 5). Participants were instructed
to hold in the mouth for 20 seconds and were cued to swallow by a tap on the leg.
Participants then received a 250ml intragastric infusion over two minutes (t= 10-12)
of either c) 1M glucose or d) saline. Following the 35 minute scan, the NG tube was
removed and participants were free to leave the unit. The four trial visits are outlined
in table 5.2 and the study protocol is presented in figure 5.11. On each visit, an
additional ten minute structural scan was conducted to define each participants brain
anatomy.
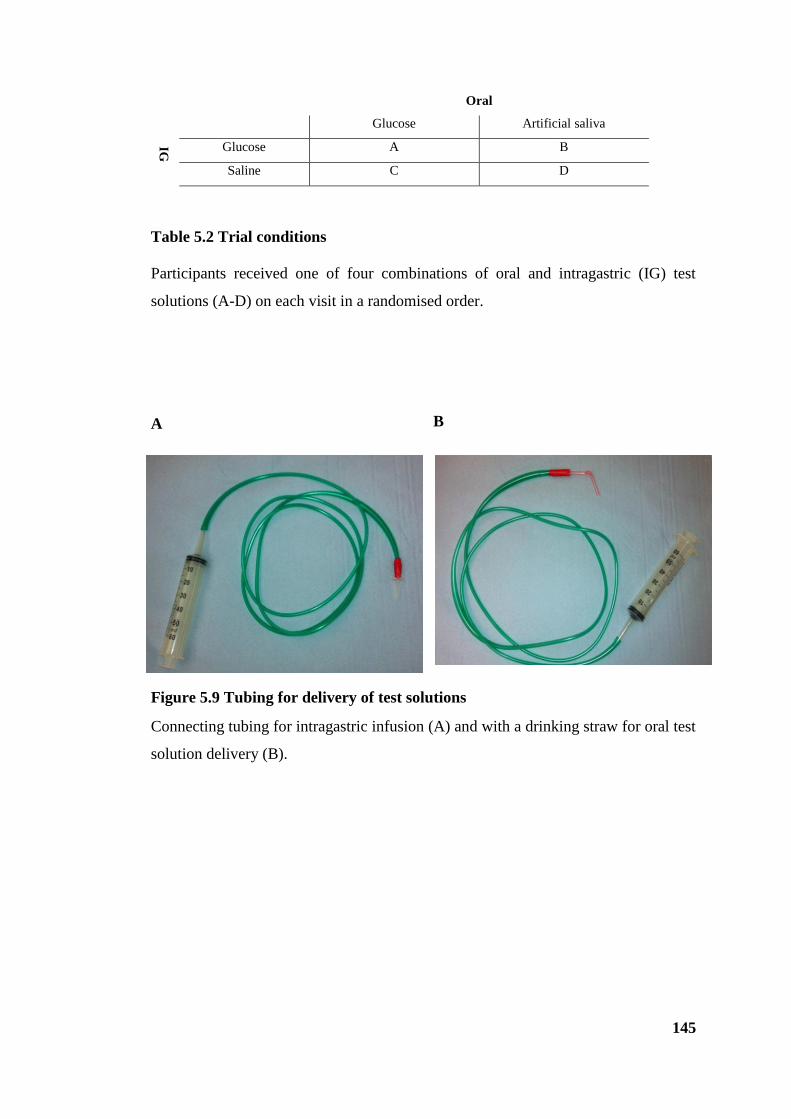
145
Oral
Glucose Artificial saliva
IG
Glucose A B
Saline C D
Table 5.2 Trial conditions
Participants received one of four combinations of oral and intragastric (IG) test
solutions (A-D) on each visit in a randomised order.
A
Figure 5.9 Tubing for delivery of test solutions
Connecting tubing for intragastric infusion (A) and with a drinking straw for oral test
solution delivery (B).
B
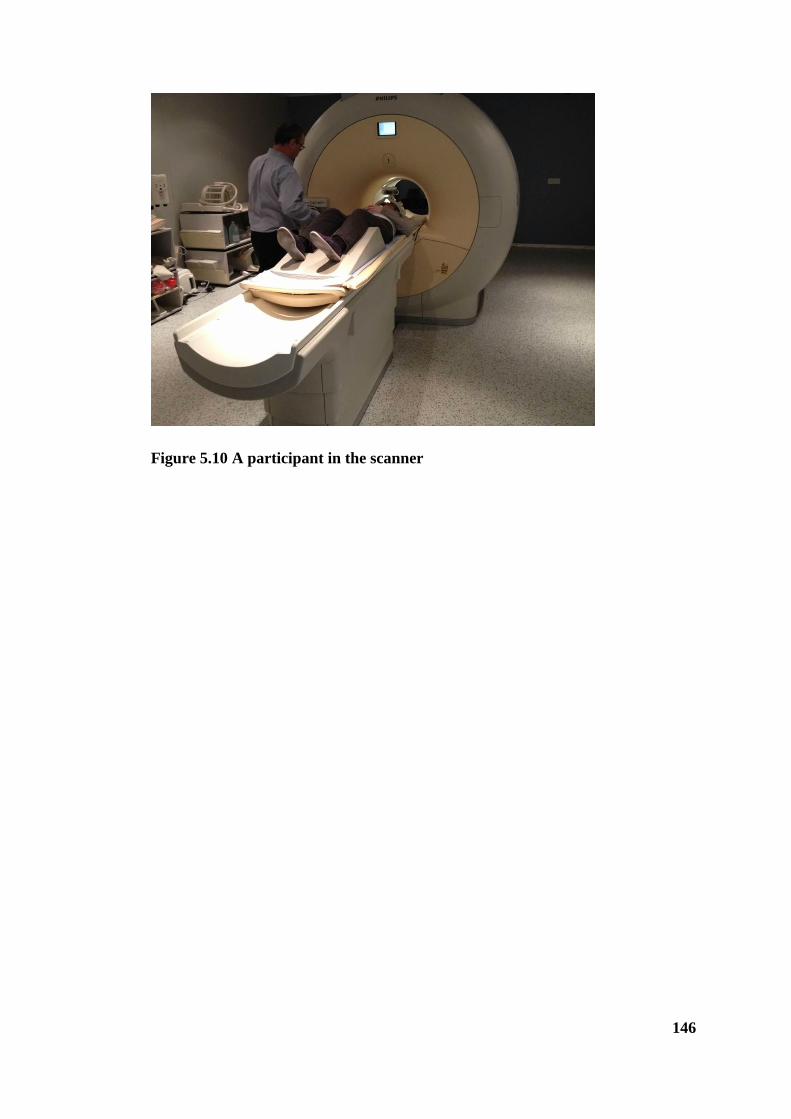
146
Figure 5.10 A participant in the scanner
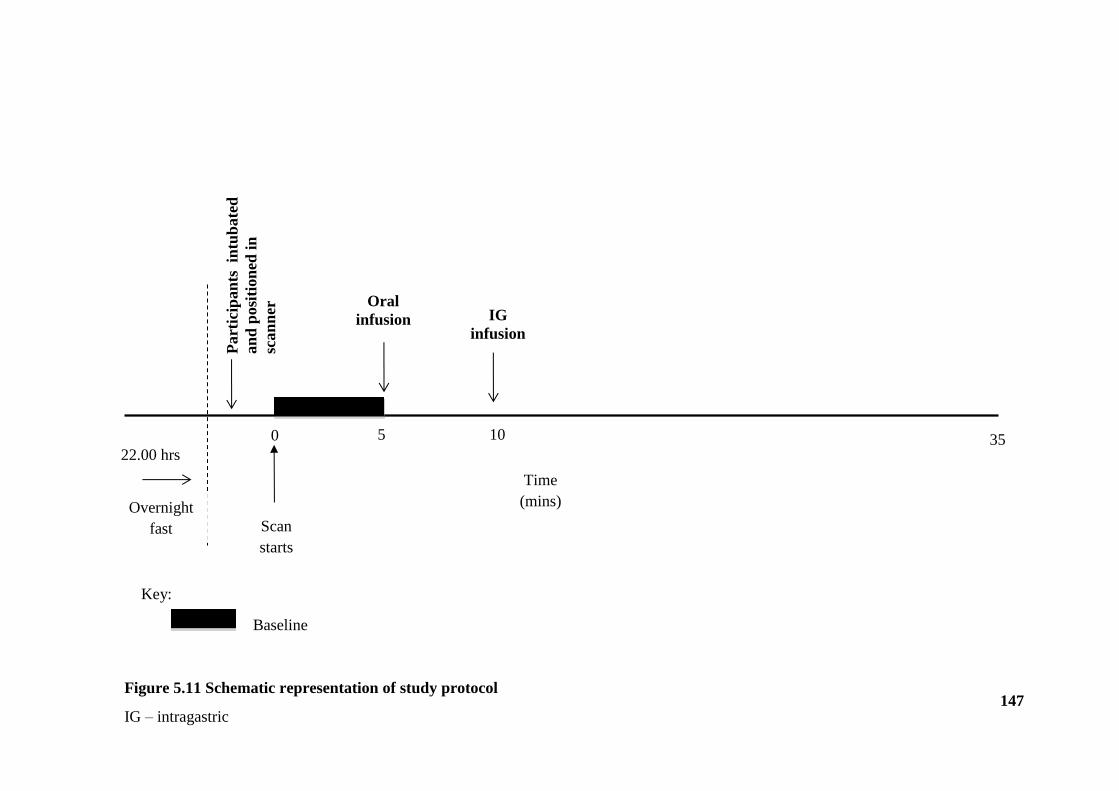
147
P
art
icip
an
ts in
tub
ate
d
an
d p
osi
tion
ed i
n
scan
ner
0 10 35
Time
(mins)
Oral
infusion
Overnight
fast
22.00 hrs
Key:
IG
infusion
5
Baseline
Figure 5.11 Schematic representation of study protocol
IG – intragastric
Scan
starts

148
5.6.4 Materials and test foods
The glucose solution was prepared on the morning of each visit. A batch of AS
solution was made up prior to the study commencing so that all participants received
the same solution. All infusions were prepared and served at room temperature.
D- (+)- Glucose (Sigma-Aldrich, Munich, Germany). The concentration of glucose
was based upon previous work showing 1M glucose to have a potent effect on
gastric emptying (Little et al., 2010a) and is consistent with previous studies in this
thesis.
AS was made up of 25 mM potassium chloride (Sigma-Aldrich, Munich, Germany)
and 2.5 mM sodium carbonate (Dr Oetker Ltd, Leeds, UK) in distilled water
(O'Doherty et al., 2001). AS was used as the oral control for glucose since saline
would induce its own tastant effects on account of its saltiness and water is believed
to activate regions of the OFC (Kringelbach et al., 2003). However, AS is not a
suitable control for the intragastric phase as it empties from the stomach extremely
quickly because it lacks any osmolar content and would therefore fail in its remit to
act as a volumatic control in the gastric part of the study. The intragastric control
used was saline (0.9%w/v sodium chloride, Baxter Healthcare Ltd, Thetford, UK).
Evidence from prior departmental studies show clear differences in brainstem
activation and gastric emptying between glucose and saline (Little et al., 2013, In
review).
5.6.5 MRI analysis
5.6.5.1 Data acquisition
Brain volumes were acquired (50 slices, voxel size 3 x 3 x 3mm) at five second
intervals (repetition time, TR= 5 secs), with 12 functional scans acquired every
minute to give a total of 420 scans. Real time adjustment of motion was done using
prospective motion correction.

149
5.6.5.2 Data analysis
Data analysis was carried out using Statistical Parametric Mapping (SPM 8,
http://www.fil.ion.ucl.ac.uk/spm/) using the physMRI technique (Jones et al., 2012,
Lassman et al., 2010). The data were pre-processed then split into two parts, part 1
(oral) and 2 (gastric), and analysed in two further stages as described below.
5.6.5.3 Pre-processing
Using SPM, the data were processed in the following steps:
Realignment: Participant movement in the scanner is inevitable, especially over 40
minutes, and can add to noise in the image series reducing the sensitivity of analysis.
Participant movement was therefore corrected using a six parameter rigid body
transformation compared to the first scan.
Co-registration: To accurately map areas of activation, the mean functional image
from the realignment stages was co-registered with the high resolution anatomical
image.
Segmentation and Spatial Normalisation: Individuals differ in brain size and
shape so in order to extrapolate the findings to the group as a whole, the images had
to be ‘standardised’. The image is segmented in to grey matter, white matter and
cerebrospinal fluid. The grey matter is then spatially normalised to fit a grey matter
template. This involved warping the images to fit a brain template so that regions
from different participants were as close together as possible and allowed direct
comparison of participant scans.
Smoothing: The BOLD signal response measured may be in different but similar
locations in individuals’ brains. Even though each individual’s brain has been
spatially standardised using normalisation, the data were smoothed in order to bring
these disparate locations closer together.

150
Due to the movement caused by swallowing in part 1, independent component
analysis was run using The MATLAB Group Independent Component Analysis of
fMRI toolbox (MATLAB toolbox GIFT v1.3i). The component time courses and
spatial distribution were visually inspected and components associated with
movement and drift were removed.
5.6.5.4 First level analysis
Analysis was performed on each participant. A diagram showing how the data were
divided and analysed is shown in figure 5.12.
Part 1 (oral pre-taste)
To investigate oral glucose induced BOLD signal the glucose and AS scans were
split into 11 consecutive 30 second time bins (one baseline and 10 post-infusion
bins) from t= 4.5 to t= 10 min. Using regression analysis, the average BOLD signal
for each time bin was compared to the baseline time bin; that is, the 30 second bin
immediately prior to the oral infusion of glucose or AS. This resulted in 10 %BOLD
signal intensity maps from baseline across time per condition. The AS scans were
contrasted to the glucose scans to show the effect of glucose taste over time. This
resulted in 10 contrast images which were then taken to second level analysis. Thus,
participants acted as their own control.
Part 2 (intragastric infusion)
To investigate the effect of oral glucose taste on BOLD signal changes induced by
intragastric glucose a similar first level analysis was performed with the glucose and
saline scans split into 13 consecutive two minute time bins (one baseline and 12
post- intragastric infusion bins) from t= 8 to t= 34 min. The last four time bins from
part 1 of the analysis formed the baseline for part 2 analysis. The last minute of the
scan (t= 34-35 min) was discarded as it did not fit into a two minute time bin. Using
regression analysis, the average BOLD signal for each bin was compared to the
baseline time bin, that is, the two minutes immediately prior to the intragastric
infusion of glucose, or saline, for all four trials as shown in table 5.2. This resulted in
12 %BOLD signal intensity maps from baseline across time per trial. The method of
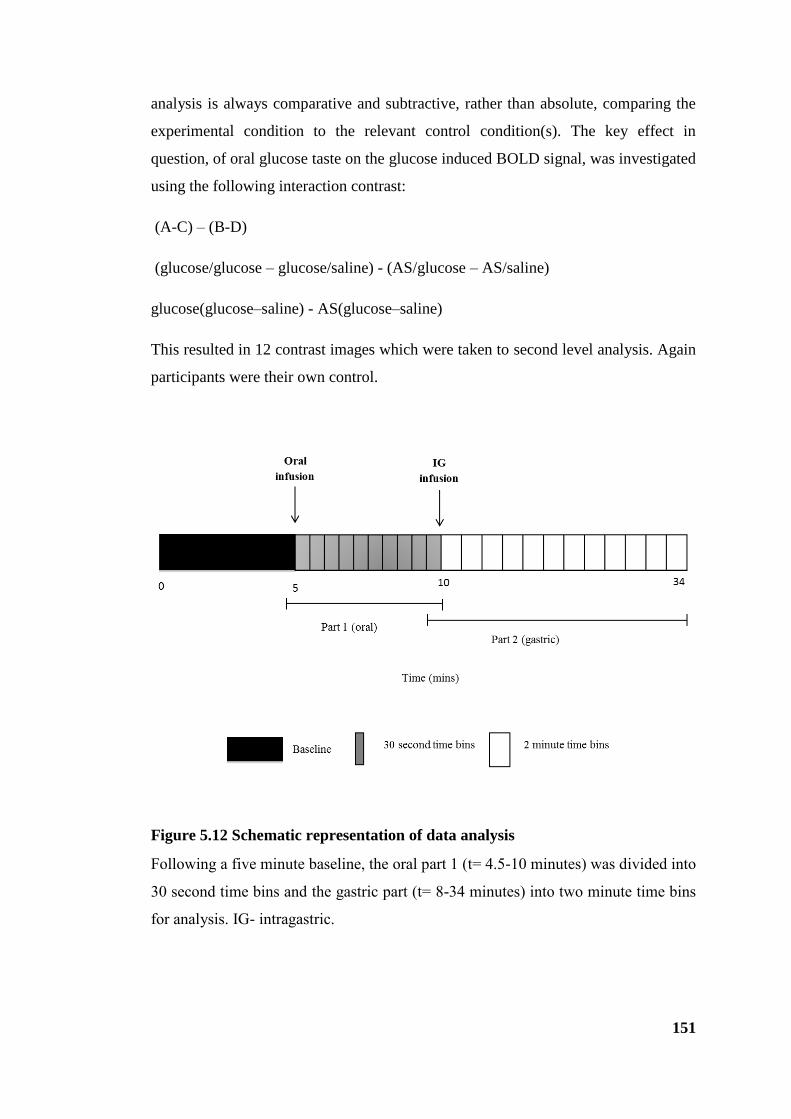
151
analysis is always comparative and subtractive, rather than absolute, comparing the
experimental condition to the relevant control condition(s). The key effect in
question, of oral glucose taste on the glucose induced BOLD signal, was investigated
using the following interaction contrast:
(A-C) – (B-D)
(glucose/glucose – glucose/saline) - (AS/glucose – AS/saline)
glucose(glucose–saline) - AS(glucose–saline)
This resulted in 12 contrast images which were taken to second level analysis. Again
participants were their own control.
Figure 5.12 Schematic representation of data analysis
Following a five minute baseline, the oral part 1 (t= 4.5-10 minutes) was divided into
30 second time bins and the gastric part (t= 8-34 minutes) into two minute time bins
for analysis. IG- intragastric.
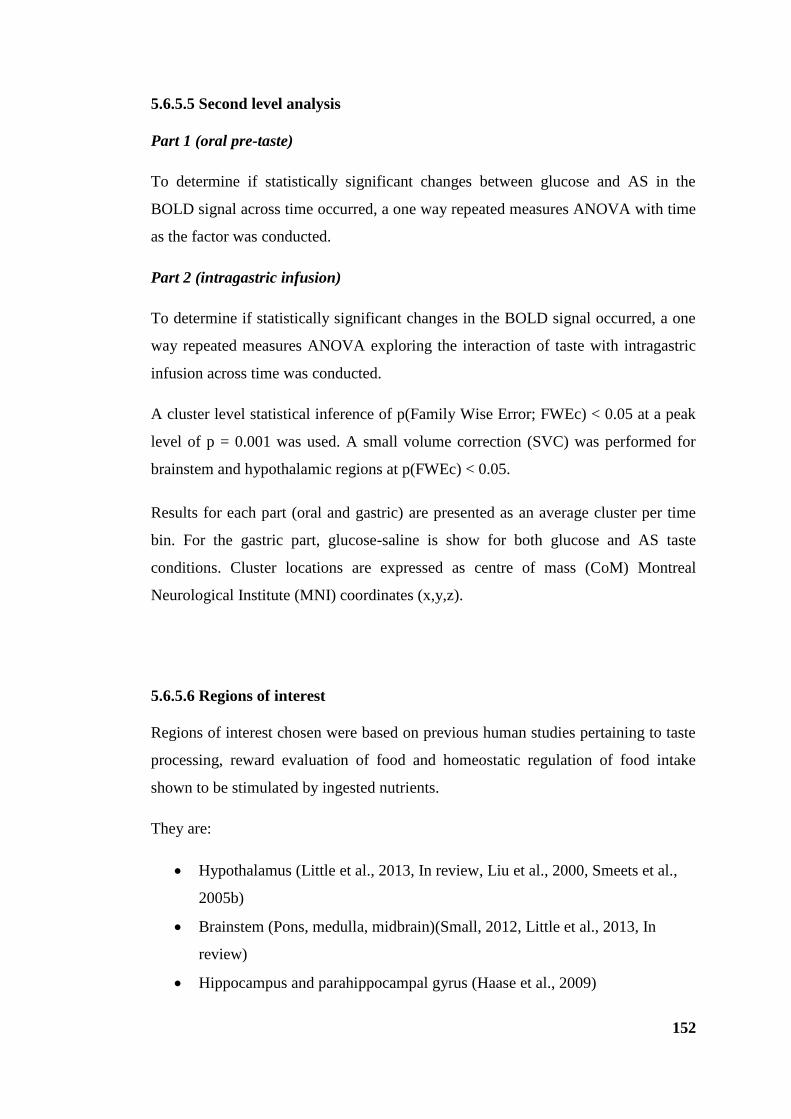
152
5.6.5.5 Second level analysis
Part 1 (oral pre-taste)
To determine if statistically significant changes between glucose and AS in the
BOLD signal across time occurred, a one way repeated measures ANOVA with time
as the factor was conducted.
Part 2 (intragastric infusion)
To determine if statistically significant changes in the BOLD signal occurred, a one
way repeated measures ANOVA exploring the interaction of taste with intragastric
infusion across time was conducted.
A cluster level statistical inference of p(Family Wise Error; FWEc) < 0.05 at a peak
level of p = 0.001 was used. A small volume correction (SVC) was performed for
brainstem and hypothalamic regions at p(FWEc) < 0.05.
Results for each part (oral and gastric) are presented as an average cluster per time
bin. For the gastric part, glucose-saline is show for both glucose and AS taste
conditions. Cluster locations are expressed as centre of mass (CoM) Montreal
Neurological Institute (MNI) coordinates (x,y,z).
5.6.5.6 Regions of interest
Regions of interest chosen were based on previous human studies pertaining to taste
processing, reward evaluation of food and homeostatic regulation of food intake
shown to be stimulated by ingested nutrients.
They are:
Hypothalamus (Little et al., 2013, In review, Liu et al., 2000, Smeets et al.,
2005b)
Brainstem (Pons, medulla, midbrain)(Small, 2012, Little et al., 2013, In
review)
Hippocampus and parahippocampal gyrus (Haase et al., 2009)
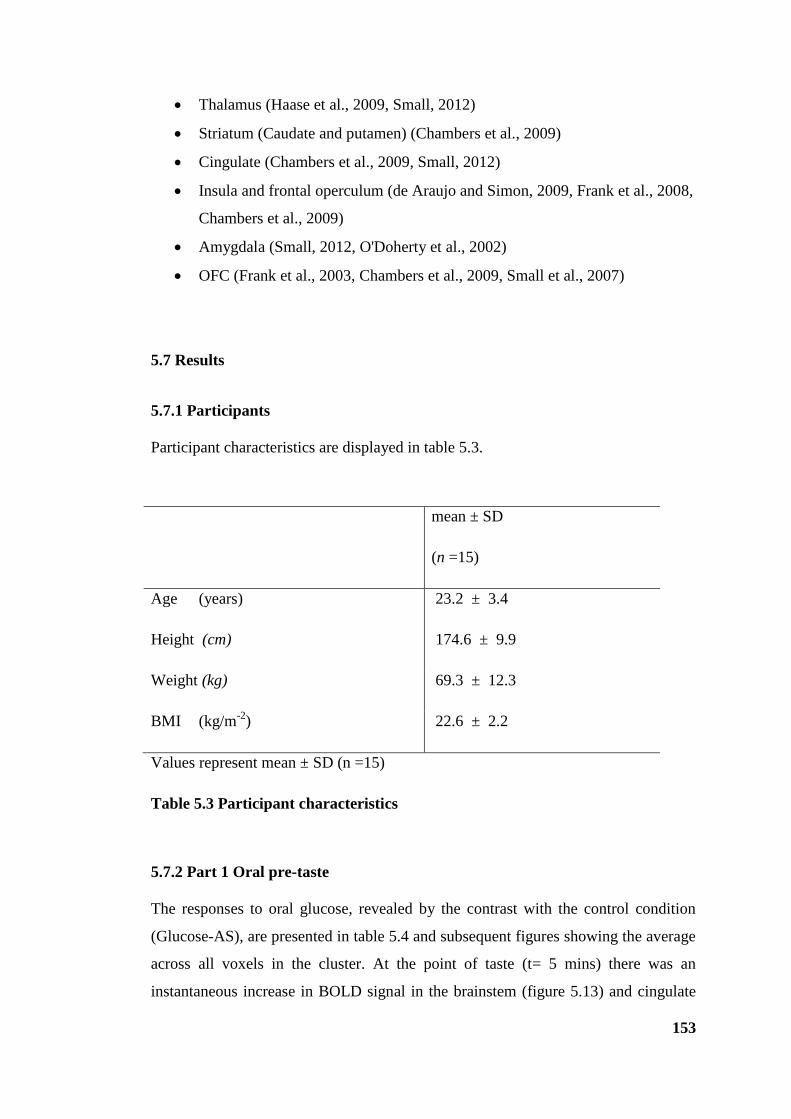
153
Thalamus (Haase et al., 2009, Small, 2012)
Striatum (Caudate and putamen) (Chambers et al., 2009)
Cingulate (Chambers et al., 2009, Small, 2012)
Insula and frontal operculum (de Araujo and Simon, 2009, Frank et al., 2008,
Chambers et al., 2009)
Amygdala (Small, 2012, O'Doherty et al., 2002)
OFC (Frank et al., 2003, Chambers et al., 2009, Small et al., 2007)
5.7 Results
5.7.1 Participants
Participant characteristics are displayed in table 5.3.
mean ± SD
(n =15)
Age (years) 23.2 ± 3.4
Height (cm) 174.6 ± 9.9
Weight (kg) 69.3 ± 12.3
BMI (kg/m-2
) 22.6 ± 2.2
Values represent mean ± SD (n =15)
Table 5.3 Participant characteristics
5.7.2 Part 1 Oral pre-taste
The responses to oral glucose, revealed by the contrast with the control condition
(Glucose-AS), are presented in table 5.4 and subsequent figures showing the average
across all voxels in the cluster. At the point of taste (t= 5 mins) there was an
instantaneous increase in BOLD signal in the brainstem (figure 5.13) and cingulate

154
cortex (figure 5.14a and b) following which the signal decreased. In regions of the
frontal cortex and left insula (figure 5.15a, b and c) there was no or a smaller
increase in the BOLD signal at the point of taste with the signal decreasing
thereafter. There was signal change in the right insula but the cluster size did not
reach significance. No signal change was apparent in any other regions of interest
hypothesised in section 5.6.5.6.
cluster
statistics
CoM
TD Region k pFWEc x,y,z (mm)
Brainstem - Pons/Medulla 34 0.012 -2 -38 -41
AAL Region
Superior frontal _R/ Medial frontal_R 76 <0.001 13 59 22
Superior frontal_L/Middle frontral_L 244 <0.001 -24 54 13
Inferior frontal_L/Insula_L 49 0.003 -40 28 -10
Middle frontal_R 72 <0.001 29 50 10
Superior frontal_L 40 0.007 -18 18 39
Anterior cingulate 75 <0.001 1 27 -7
Mid Cingulate 42 0.005 -6 -32 39
Table 5.4 Significant clusters exhibiting an effect of glucose taste
TD- Talairach Daemon; k – number of voxels in cluster; pFWEc- cluster size Family Wise Error
corrected p-value; CoM- centre of mass (MNI coordinates); AAL- anatomical automatic labelling; L-
left; R-right.

155
Figure 5.13 Change in blood oxygen level dependent signal over time in the
brainstem in response to glucose taste
Change in blood oxygen level dependent signal (BOLD) over time from baseline
(BL) in the pons and medulla cluster following glucose taste relative to AS. Values
represent mean + SEM, (n=15). Oral taste. Brain image with cross hairs
pinpointing the precise area of interest.
156
Figure 5.14a Change in blood oxygen level dependent signal over time in the
cingulate cortex in response to glucose taste
Change in blood oxygen level dependent signal (BOLD) over time from baseline
(BL) in the cingulate cortex following glucose taste relative to AS. Values represent
mean + SEM, (n=15). Oral taste. Brain image with cross hairs pinpointing the
precise area of interest.
-2
-1.5
-1
-0.5
0
0.5
1
1.5
4.5 5.0 5.5 6.0 6.5 7.0 7.5 8.0 8.5 9.0 9.5 10.0
% c
ha
ng
e in
BO
LD
sig
na
l fr
om
BL
Time (mins)
Mid cingulate cortex
157
Figure 5.14b Change in blood oxygen level dependent signal over time in the
anterior cingulate cortex in response to glucose taste
Change in blood oxygen level dependent signal (BOLD) over time from baseline
(BL) in the anterior area of the cingulate cortex following glucose taste relative to
AS. Values represent mean + SEM, (n=15). Oral taste. Brain image with cross
hairs pinpointing the precise area of interest.
-2
-1.5
-1
-0.5
0
0.5
1
1.5
4.5 5.0 5.5 6.0 6.5 7.0 7.5 8.0 8.5 9.0 9.5 10.0
% B
OL
D s
ign
al
ch
an
ge
fro
m B
L
Time (mins)
Anterior cingulate cortex

158
-2
-1.5
-1
-0.5
0
0.5
1
1.5
4.5 5.0 5.5 6.0 6.5 7.0 7.5 8.0 8.5 9.0 9.5 10.0
% B
OL
D s
ign
al
ch
an
ge
fro
m
BL
Time (mins)
Middle frontal cortex (L)
-2
-1.5
-1
-0.5
0
0.5
1
1.5
4.5 5.0 5.5 6.0 6.5 7.0 7.5 8.0 8.5 9.0 9.5 10.0% B
OL
D s
ign
al
ch
an
ge
fro
m
BL
Time (mins)
Middle frontal cortex (R)
A
B
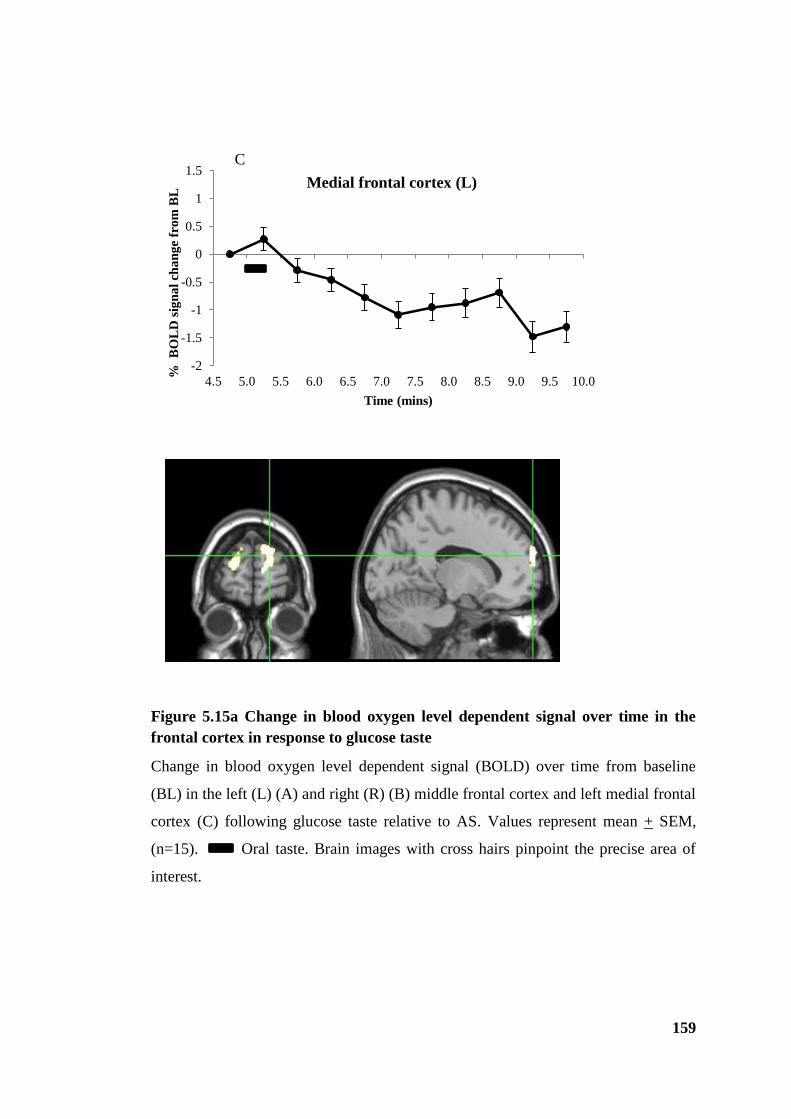
159
Figure 5.15a Change in blood oxygen level dependent signal over time in the
frontal cortex in response to glucose taste
Change in blood oxygen level dependent signal (BOLD) over time from baseline
(BL) in the left (L) (A) and right (R) (B) middle frontal cortex and left medial frontal
cortex (C) following glucose taste relative to AS. Values represent mean + SEM,
(n=15). Oral taste. Brain images with cross hairs pinpoint the precise area of
interest.
-2
-1.5
-1
-0.5
0
0.5
1
1.5
4.5 5.0 5.5 6.0 6.5 7.0 7.5 8.0 8.5 9.0 9.5 10.0
% B
OL
D s
ign
al
cha
ng
e fr
om
BL
Time (mins)
Medial frontal cortex (L)
C

160
Figure 5.15b Change in blood oxygen level dependent signal over time in the
superior frontal cortex in response to glucose taste
Change in blood oxygen level dependent signal (BOLD) over time from baseline
(BL) in the left (L) superior frontal cortex and left medial frontal cortex following
glucose taste relative to AS. Values represent mean + SEM, (n=15). Oral taste.
Brain image with cross hairs pinpoints the precise area of interest.

161
Figure 5.15c Change in blood oxygen level dependent signal over time in the
inferior frontal cortex in response to glucose taste
Change in blood oxygen level dependent signal (BOLD) over time from baseline
(BL) in the left (L) superior frontal cortex and left medial frontal cortex following
glucose taste relative to AS. Values represent mean + SEM, (n=15). Oral taste.
Brain image with cross hairs pinpoints the precise area of interest.
-2
-1.5
-1
-0.5
0
0.5
1
1.5
4.5 5.0 5.5 6.0 6.5 7.0 7.5 8.0 8.5 9.0 9.5 10.0
% B
OL
D s
ign
al
ch
an
ge
fro
m B
L
Time (mins)
Inferior frontal cortex/ Insula (L)
162
5.7.3 Part 2 Responses following intragastric infusions
There was a significant interaction between glucose taste and intragastric glucose
infusion as indicated by changes in the BOLD signal bilaterally in the midbrain,
pons and hypothalamus following an oral glucose but not AS taste prior to gastric
infusion. In general terms, the well established reduction in BOLD signal following
intragastrically administered glucose was unaffected by the AS oral taste condition,
whilst the oral taste of glucose prior to intragastrically administered glucose radically
altered the response observed. There were also significant clusters bilaterally in
higher brain centres such as the putamen, olfactory bulb, areas of the cingulate
cortex, caudate, hippocampus, thalamus and laterally in the insula (figure 5.16 and
table 5.5). Areas of the frontal cortex that were activated by glucose taste in part 1
also displayed significant clusters along with occipital regions (cuneus, calcarine,
lingual). Time course plots for the significant areas are presented and discussed in
detail below.

163
Figure 5.16 Brain images showing areas exhibiting a significant interaction
between intragastric glucose infusion and glucose taste
ACC- anterior cingulate cortex; Caud- caudate; Hypo- hypothalamus; Med- medulla; Mid- midbrain;
PHG- parahippocampal gyrus; Prec- precuneus; Thal- thalamus.
ACC
CaudCaud
HypoHypo
ThalThal
Mid/Pons Mid/PonsMed
Prec Prec
Thal
Insula
ACC
Hypo
PHG
Midbrain
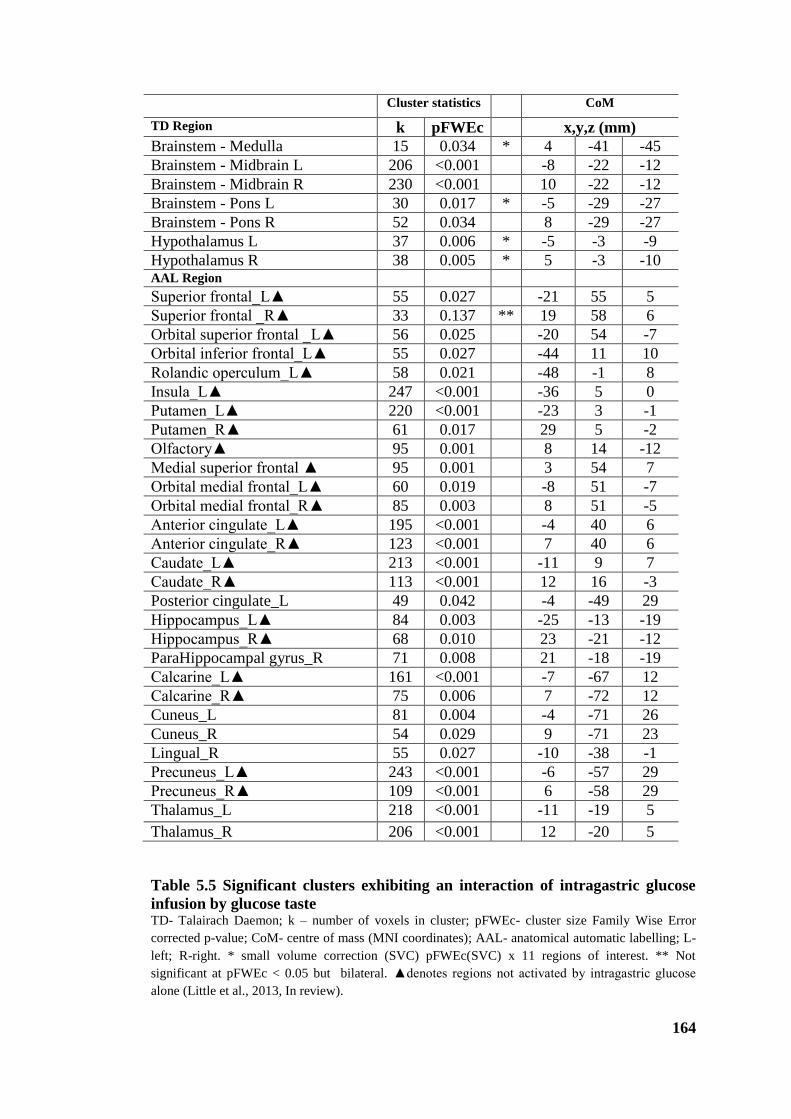
164
Cluster statistics CoM
TD Region k pFWEc x,y,z (mm)
Brainstem - Medulla 15 0.034 * 4 -41 -45
Brainstem - Midbrain L 206 <0.001 -8 -22 -12
Brainstem - Midbrain R 230 <0.001 10 -22 -12
Brainstem - Pons L 30 0.017 * -5 -29 -27
Brainstem - Pons R 52 0.034 8 -29 -27
Hypothalamus L 37 0.006 * -5 -3 -9
Hypothalamus R 38 0.005 * 5 -3 -10 AAL Region Superior frontal_L▲ 55 0.027 -21 55 5
Superior frontal _R▲ 33 0.137 ** 19 58 6
Orbital superior frontal _L▲ 56 0.025 -20 54 -7
Orbital inferior frontal_L▲ 55 0.027 -44 11 10
Rolandic operculum_L▲ 58 0.021 -48 -1 8
Insula_L▲ 247 <0.001 -36 5 0
Putamen_L▲ 220 <0.001 -23 3 -1
Putamen_R▲ 61 0.017 29 5 -2
Olfactory▲ 95 0.001 8 14 -12
Medial superior frontal ▲ 95 0.001 3 54 7
Orbital medial frontal_L▲ 60 0.019 -8 51 -7
Orbital medial frontal_R▲ 85 0.003 8 51 -5
Anterior cingulate_L▲ 195 <0.001 -4 40 6
Anterior cingulate_R▲ 123 <0.001 7 40 6
Caudate_L▲ 213 <0.001 -11 9 7
Caudate_R▲ 113 <0.001 12 16 -3
Posterior cingulate_L 49 0.042 -4 -49 29
Hippocampus_L▲ 84 0.003 -25 -13 -19
Hippocampus_R▲ 68 0.010 23 -21 -12
ParaHippocampal gyrus_R 71 0.008 21 -18 -19
Calcarine_L▲ 161 <0.001 -7 -67 12
Calcarine_R▲ 75 0.006 7 -72 12
Cuneus_L 81 0.004 -4 -71 26
Cuneus_R 54 0.029 9 -71 23
Lingual_R 55 0.027 -10 -38 -1
Precuneus_L▲ 243 <0.001 -6 -57 29
Precuneus_R▲ 109 <0.001 6 -58 29
Thalamus_L 218 <0.001 -11 -19 5
Thalamus_R 206 <0.001 12 -20 5
Table 5.5 Significant clusters exhibiting an interaction of intragastric glucose
infusion by glucose taste TD- Talairach Daemon; k – number of voxels in cluster; pFWEc- cluster size Family Wise Error
corrected p-value; CoM- centre of mass (MNI coordinates); AAL- anatomical automatic labelling; L-
left; R-right. * small volume correction (SVC) pFWEc(SVC) x 11 regions of interest. ** Not
significant at pFWEc < 0.05 but bilateral. ▲denotes regions not activated by intragastric glucose
alone (Little et al., 2013, In review).
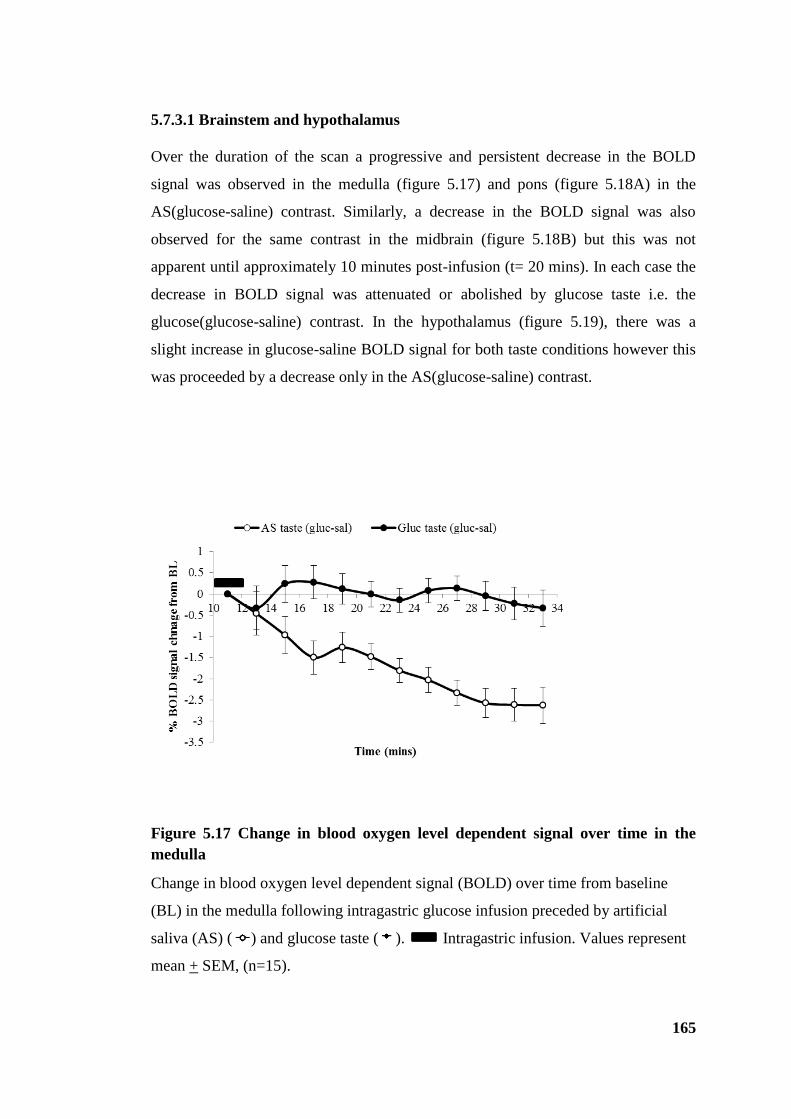
165
5.7.3.1 Brainstem and hypothalamus
Over the duration of the scan a progressive and persistent decrease in the BOLD
signal was observed in the medulla (figure 5.17) and pons (figure 5.18A) in the
AS(glucose-saline) contrast. Similarly, a decrease in the BOLD signal was also
observed for the same contrast in the midbrain (figure 5.18B) but this was not
apparent until approximately 10 minutes post-infusion (t= 20 mins). In each case the
decrease in BOLD signal was attenuated or abolished by glucose taste i.e. the
glucose(glucose-saline) contrast. In the hypothalamus (figure 5.19), there was a
slight increase in glucose-saline BOLD signal for both taste conditions however this
was proceeded by a decrease only in the AS(glucose-saline) contrast.
Figure 5.17 Change in blood oxygen level dependent signal over time in the
medulla
Change in blood oxygen level dependent signal (BOLD) over time from baseline
(BL) in the medulla following intragastric glucose infusion preceded by artificial
saliva (AS) ( ) and glucose taste ( ). Intragastric infusion. Values represent
mean + SEM, (n=15).

166
Figure 5.18 Change in blood oxygen level dependent signal over time in the pons and midbrain
Change in blood oxygen level dependent signal (BOLD) over time from baseline (BL) in the pons (A) and midbrain (B) following intragastric
glucose infusion preceded by artificial saliva (AS) ( ) and glucose taste ( ).Values represent mean + SEM, (n=15). Intragastric infusion.
-2
-1.5
-1
-0.5
0
0.5
1
10 12 14 16 18 20 22 24 26 28 30 32 34
% B
OL
D s
ign
al c
han
ge f
rom
BL
Time (mins)
AS taste(gluc-sal) Gluc taste(gluc-sal)
A Pons L
-2
-1.5
-1
-0.5
0
0.5
1
10 12 14 16 18 20 22 24 26 28 30 32 34
% B
OL
D s
ign
al c
han
ge f
rom
BL
Time (mins)
AS taste(gluc-sal) Gluc taste(gluc-sal)
R
-2
-1.5
-1
-0.5
0
0.5
1
10 12 14 16 18 20 22 24 26 28 30 32 34
% B
OL
D s
ign
al c
han
ge f
rom
BL
Time (mins)
AS taste(gluc-sal) Gluc taste(gluc-sal)
B Midbrain L
-1.5
-1
-0.5
0
0.5
1
10 12 14 16 18 20 22 24 26 28 30 32 34
% B
OL
D s
ign
al c
han
ge f
rom
BL
Time (mins)
AS taste(gluc-sal) Gluc taste(gluc-sal)
R

167
Figure 5.19 Change in blood oxygen level dependent signal over time in the hypothalamus
Change in blood oxygen level dependent signal (BOLD) over time from baseline (BL) in the hypothalamus following intragastric glucose
infusion preceded by artificial saliva (AS) ( ) and glucose taste ( ).Values represent mean + SEM, (n=15). Intragastric infusion.
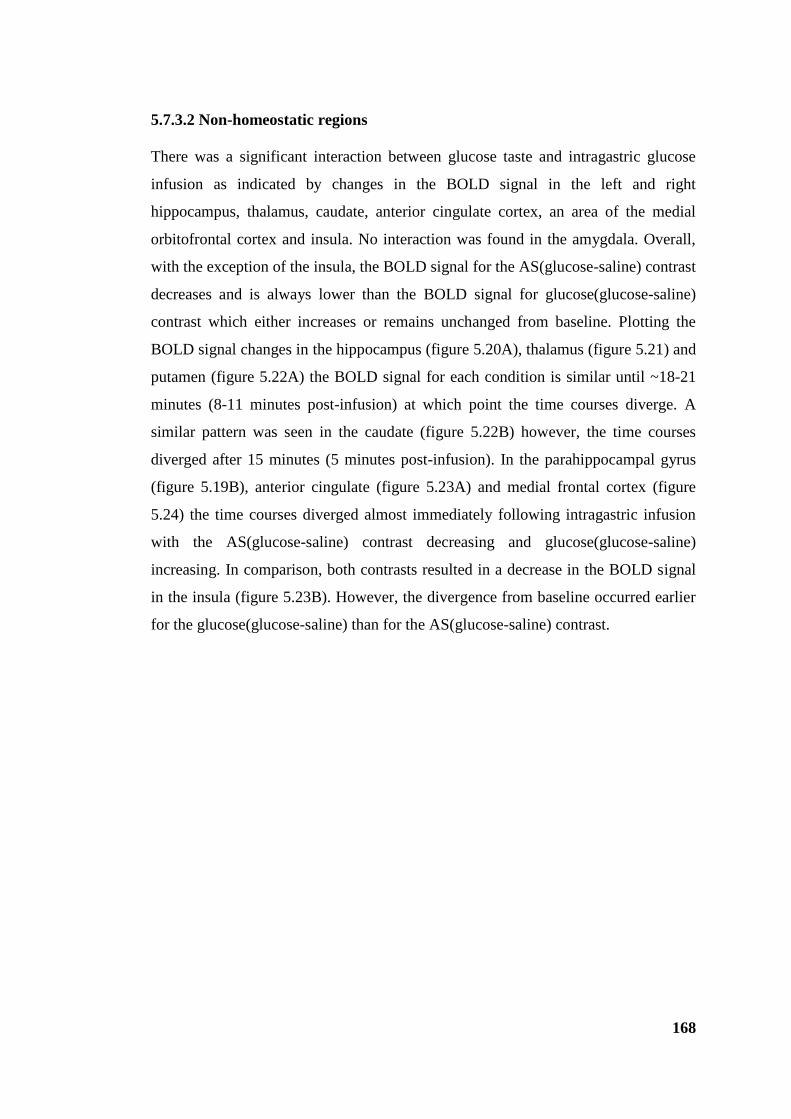
168
5.7.3.2 Non-homeostatic regions
There was a significant interaction between glucose taste and intragastric glucose
infusion as indicated by changes in the BOLD signal in the left and right
hippocampus, thalamus, caudate, anterior cingulate cortex, an area of the medial
orbitofrontal cortex and insula. No interaction was found in the amygdala. Overall,
with the exception of the insula, the BOLD signal for the AS(glucose-saline) contrast
decreases and is always lower than the BOLD signal for glucose(glucose-saline)
contrast which either increases or remains unchanged from baseline. Plotting the
BOLD signal changes in the hippocampus (figure 5.20A), thalamus (figure 5.21) and
putamen (figure 5.22A) the BOLD signal for each condition is similar until ~18-21
minutes (8-11 minutes post-infusion) at which point the time courses diverge. A
similar pattern was seen in the caudate (figure 5.22B) however, the time courses
diverged after 15 minutes (5 minutes post-infusion). In the parahippocampal gyrus
(figure 5.19B), anterior cingulate (figure 5.23A) and medial frontal cortex (figure
5.24) the time courses diverged almost immediately following intragastric infusion
with the AS(glucose-saline) contrast decreasing and glucose(glucose-saline)
increasing. In comparison, both contrasts resulted in a decrease in the BOLD signal
in the insula (figure 5.23B). However, the divergence from baseline occurred earlier
for the glucose(glucose-saline) than for the AS(glucose-saline) contrast.
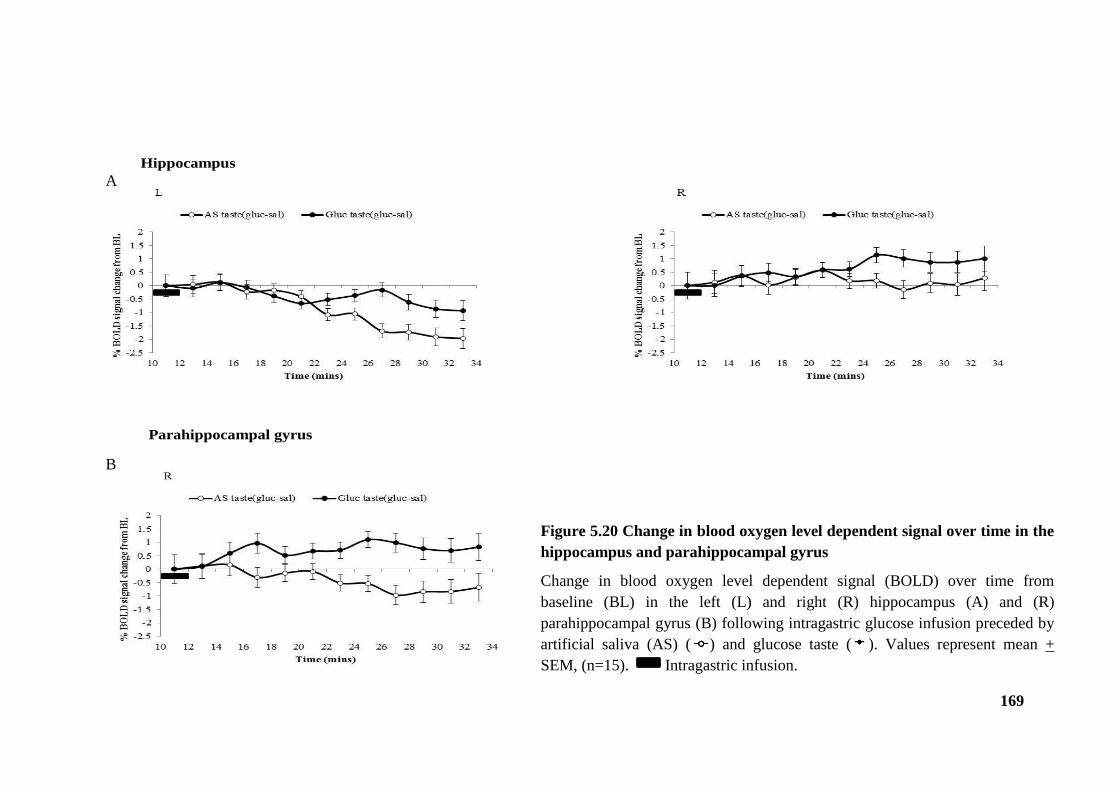
169
Hippocampus
Parahippocampal gyrus
Figure 5.20 Change in blood oxygen level dependent signal over time in the
hippocampus and parahippocampal gyrus
Change in blood oxygen level dependent signal (BOLD) over time from
baseline (BL) in the left (L) and right (R) hippocampus (A) and (R)
parahippocampal gyrus (B) following intragastric glucose infusion preceded by
artificial saliva (AS) ( ) and glucose taste ( ). Values represent mean +
SEM, (n=15). Intragastric infusion.
A
B
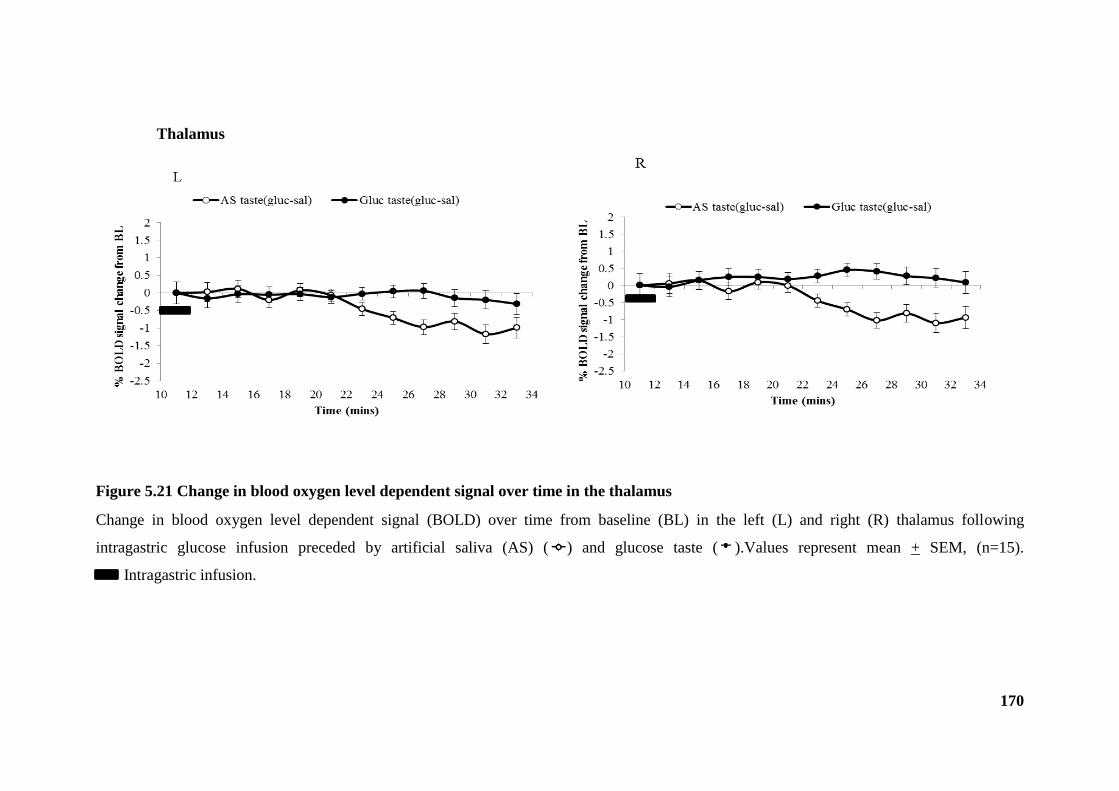
170
Figure 5.21 Change in blood oxygen level dependent signal over time in the thalamus
Change in blood oxygen level dependent signal (BOLD) over time from baseline (BL) in the left (L) and right (R) thalamus following
intragastric glucose infusion preceded by artificial saliva (AS) ( ) and glucose taste ( ).Values represent mean + SEM, (n=15).
Intragastric infusion.
Thalamus
171
-2.5
-2
-1.5
-1
-0.5
0
0.5
1
1.5
2
10 12 14 16 18 20 22 24 26 28 30 32 34
% B
OL
D s
ign
al
cha
ng
e fr
om
BL
Time (mins)
AS taste(gluc-sal) Gluc taste(gluc-sal)L
-2.5
-2
-1.5
-1
-0.5
0
0.5
1
1.5
2
10 12 14 16 18 20 22 24 26 28 30 32 34
% B
OL
D s
ign
al
cha
ng
e fr
om
BL
Time (mins)
AS taste(gluc-sal) Gluc taste(gluc-sal)
R
-2.5
-2
-1.5
-1
-0.5
0
0.5
1
1.5
2
10 12 14 16 18 20 22 24 26 28 30 32 34
% B
OL
D s
ign
al
cha
ng
e fr
om
BL
Time (mins)
AS taste(gluc-sal) Gluc taste(gluc-sal)
L
-2.5
-2
-1.5
-1
-0.5
0
0.5
1
1.5
2
10 12 14 16 18 20 22 24 26 28 30 32 34%
BO
LD
sig
na
l ch
an
ge
fro
m B
L
Time (mins)
AS taste(gluc-sal) Gluc taste(gluc-sal)
R
A Putamen
B Caudate
Figure 5.22 Change in blood oxygen level dependent signal over time in the putamen and caudate
Change in blood oxygen level dependent signal (BOLD) over time from baseline (BL) in the left (L) and right (R) putamen (A) and
caudate (B) following intragastric glucose infusion preceded by artificial saliva (AS) ( ) and glucose taste ( ).Values represent mean
+ SEM, (n=15). Intragastric infusion.

172
Insula L
A
B
Figure 5.23 Change in blood oxygen level dependent signal over time in the
anterior cingulate cortex and insula
Change in blood oxygen level dependent signal (BOLD) over time from
baseline (BL) in the anterior cingulate cortex (A) and left insula (B) following
intragastric glucose infusion preceded by artificial saliva (AS) ( ) and glucose
taste ( ). Values represent mean + SEM, (n=15). Intragastric infusion.

173
Figure 5.24 Change in blood oxygen level dependent signal over time in the medial frontal cortex
Change in blood oxygen level dependent signal (BOLD) over time from baseline (BL) in the thalamus (A) and caudate (B) following intragastric
glucose infusion preceded by artificial saliva (AS) ( ) and glucose taste ( ). Values represent mean + SEM, (n=15). Intragastric infusion.
174
5.7.3.3 Comparison to intragastric glucose infusion without oral taste stimulation
The glucose-saline responses in the brainstem and hypothalamus for the AS condition were
consistent with previous findings investigating the effect of intragastric glucose infusion on
brain BOLD response without oral taste stimulation (Little et al., 2013, In review). In
addition, a number of non-homeostatic brain areas were identified as outlined by ▲ in table
5.5. This included regions of the frontal cortex, insula, putamen, anterior cingulate, caudate,
hippocampus and parahippocampal gyrus.
5.8 Discussion
This is the first study to investigate the effects of oral and sequential gastrointestinal
“sweetness” on functional human brain response in order to determine whether oral sweet
taste affects gut-brain signalling. The prequel (study I) formed the basis for this, in that
including an oral taste of glucose affected its subsequent rate of gastric emptying, a process
known to occur under vagal and neuroendocrine regulation. Previous studies largely omitted
an oral taste phase to prevent ‘confounding’ effects during the study of gastric emptying,
when in reality it is a key part of the physiological and psychological response to food.
The objective was therefore to model the sequence as close to normal ingestive patterns as
possible whilst minimising the artefacts and difficulties inherent on imaging brain responses
during swallowing. There are however limitations to what can be achieved in the MR
scanning scenario, so the current protocol was developed to model ingestion as closely as
possible, whilst embedding appropriate control conditions. In part 1 (oral taste, t= 5-10 mins),
there was a decrease in BOLD signal following the initial increase due to glucose taste in the
brainstem (pons/medulla), regions of the frontal cortex, left insula and the cingulate cortex.
However, a number of studies report opposite results. Increases in BOLD signal have been
reported after glucose, or other sugars, in brain areas not found in the current part of this
study (Chambers et al., 2009, Frank et al., 2008, Smeets et al., 2011). These inconsistencies
may be attributed to differences in experimental protocol and analysis. In the current study
the phase of ingestion was included in the analysis whereas most studies, due to the
confounding effects of movement during swallowing, either ignore the ingestion phase
completely or begin scanning post-ingestion with subjects consuming outside the scanner.
Therefore this is the first study to capture the immediate effects of ingestion.

175
Previous fMRI studies, have observed BOLD responses in regions such as the thalamus and
caudate (Haase et al., 2009, Chambers et al., 2009). These regions formed the basis of the
pre-hypothesised areas in the current study. However, in the first phase of the current study a
trivial amount of glucose (20ml) was used in comparison to other studies (Smeets et al., 2011,
Li et al., 2012) that have involved much higher loads (e.g. 300- 450ml) therefore, meaningful
signals arising from the gut via mechano- and chemo-sensitive pathways are inevitable. The
current imaging protocol minimises these issues and therefore may be a more accurate
representation of the initial response in human ingestion. Despite using an imaging correction
protocol to minimise movement (prospective motion correction) and running independent
component analysis, to remove components associated with movement, the data were still
unavoidably subject to movement artefact during the oral phase. Also data from 30 second
time bins (6 images) were averaged for the oral part of the study, compared to 2 minutes time
bins (24 images) for the gastric part, meaning the analysis was more subject to temporal
effects of movement.
This study has shown a transient increase in BOLD signal at the point of taste, as well as a
subsequent decrease, in regions of the brainstem in response to oral glucose. The medulla
region of the brainstem is part of the central taste pathway that receives sensory information
via facial and glossopharyngeal nerves. In addition, the similar BOLD signal response
observed in the anterior cingulate cortex and regions of the frontal cortex and insula reflect
the function of these areas in taste processing and perception (Kobayashi et al., 2004).
However, the response in these higher brain centres cannot be attributed to taste only but also
to the processing of olfactory and somatosensory information.
To determine whether initial glucose taste affected the BOLD signal induced by
intragastrically infused glucose, the interaction between glucose taste and intragastric glucose
infusion [glucose(glucose-saline) – AS(glucose-saline)] was explored i.e. brain regions where
intragastric glucose signalling (glucose-saline) was altered by a prior taste of glucose. It is
important to note that the baseline for the gastric part of the study differs from the baseline
used in the oral part. The 30 seconds prior to oral infusion were used for part 1 and the 2
minutes preceding intragastric infusion were used for part 2.
In the medulla, pons and midbrain brainstem regions and the hypothalamus, the BOLD signal
decreased in the AS(glucose-saline) contrast compared to glucose(glucose-saline) contrast
which remained unchanged from baseline. The response of AS(glucose-saline) maps to the
176
homeostatic regions previously identified using intragastric glucose and lipid infusion (Little
et al., 2013, In review, Lassman et al., 2010, Smeets et al., 2005b). The present study also
revealed a significant interaction in non-homeostatic areas such as the insula, the primary
taste cortex, and medial region of the frontal cortex, assumed to be the secondary taste cortex
(Rolls, 2007). The primary taste cortex is believed to project to the striatum (Fudge et al.,
2005), which includes the caudate and putamen, regions which also showed a significant
interaction. This region, along with the anterior cingulate, which also shows a significant
interaction, encodes food reward (Schloegl et al., 2011, Rolls, 2007).
A significant interaction was also observed in the thalamus, hippocampus and
parahippocampal gyrus. The thalamus is thought to have a role in processing taste and is
modulated by the reward value of the taste stimuli (Kobayashi et al., 2004). The hippocampus
and parahippocampal gyrus are involved in memory including learning of food stimuli
(Haase et al., 2009).
In contrast to other studies a significant interaction was not observed in the amygdala (Smeets
et al., 2011, Li et al., 2012). However, it is believed to be more sensitive to protein than
carbohydrate (Li et al., 2012) therefore the current data further support that possibility.
It appears from these results that stimulating oral taste receptors with glucose prior to an
intragastric glucose load [glucose(glucose-saline)] attenuates the BOLD signal in the usually
observed homeostatic regions (Little et al., 2013, In review). In addition the significant
interactions observed in non-homeostatic regions are not usually observed after intragastric
infusion of glucose. This implies that the whole brain response to glucose is composite, with
homeostatic and hedonic signals triggered by oral tasting, but exerting a persistent and long
lasting post-taste effect on subsequent brain responses for at least the 30 minutes during
which images were acquired. In seeking to explore possible mechanisms for this effect it is
interesting to consider first the gastric emptying results from study I in this chapter and,
second the potential effects of non-homeostatic regions. The differences in the gastric
emptying rates of oral and intragastric glucose may relate to the onset of BOLD signal
changes observed in the current study and the relative contribution of oral and gastric
stimulation to CNS responses. The onset of decrease in BOLD signal for the AS(glucose-
saline) contrast or the point at which the two contrasts diverged occurred approximately 10
minutes post-infusion in some brain regions (midbrain, hypothalamus, hippocampus,
thalamus and caudate) which may contribute to the differences seen in gastric emptying rate
177
between orally and intragastrically administered glucose in the first 15 minutes and remaining
45 minutes of study I. Furthermore, the gastric emptying of glucose administered
intragastrically was significantly slower than that of orally delivered glucose which is
consistent with the decrease in BOLD signal observed in the AS(glucose-saline) contrast and
the loss of decreased BOLD signal observed for the glucose(glucose-saline) contrast.
The significance of a negative BOLD signal in the current study and that of others (Smeets et
al., 2007, Li et al., 2012) is only a proxy measure of the overall activity of the target brain
regions, and as yet cannot be used to directly correspond to neuronal effects occurring at a
neurophysiological level. However, it is assumed that a reduction in BOLD signal indicates
that neuronal activations are relatively less in that region, and it appears likely that the
different kinetics of gastric emptying, but not satiety, described in study I are the
physiological counterpart of the changes observed.
A greater reduction in BOLD signal is observed with glucose in the gastrointestinal tract than
intravenous glucose despite lower circulating glucose concentrations (Smeets et al., 2007)
suggesting that signals emanating from the gastrointestinal tract play an important role.
Chapter one highlighted the important role of gut hormones in regulating appetite and food
intake and although not measured in the current study, previous fMRI studies have
demonstrated a relationship between BOLD signal and blood glucose and gut hormone
concentrations (Liu et al., 2000, Li et al., 2012). The presence of glucose sensing neurons in
hypothalamic and brainstem regions are believed to be sensitive to elevated glucose
concentrations.
Oral and cephalic responses are clearly important components in vivo. Signals from receptors
in the mouth, which are bypassed by an intragastric infusion, may influence neural pathways
responsible for modulating responses to food. An obvious question would be to determine the
effects of other taste stimuli such as NNS which may have a similar perceived sweetness but
lack caloric content. Conversely, non-sweet carbohydrates such as maltodextrin or even
aversive tastes such as bitter substances may produce different brain responses and modulate
the gut-brain signal differently. Future work using this paradigm should investigate the
effects of other nutrient classes.
In comparison to other studies using single sex populations (usually male), the current study
involved both male and female participants. It has been shown that males and females exhibit

178
differential brain responses in taste and reward areas in response to taste stimuli (Haase et al.,
2011). However, establishing gender differences in the current study was beyond the remit of
this study and would require a much higher number of participants to be statistically
significant.
The study was limited by several factors. As previously discussed the confounding effects of
movement during swallowing cannot be totally eliminated but the protocol was designed to
minimise this as much as possible. Second, the BOLD signal is only a proxy measure of
activity. Nevertheless in absence of non-invasive markers of neuronal activity, this is
currently the measure utilised in fMRI studies which remains the gold standard. Third, gut
hormone and glycaemic responses were not measured in the current study due to the
impractical nature of taking blood while participants are positioned in the scanner and
previous experience that this increases movement artefact diminishing data quality. Fourth, as
participants were in a supine position in the scanner this may have had an unavoidable effect
on the rate of gastric emptying rate (Ikeda et al., 2008).
In conclusion, it appears that stimulating oral taste receptors with glucose prior to an
intragastric glucose load attenuates the BOLD signal in the usually observed homeostatic
regions and causes a significant interaction in non-homeostatic regions not usually observed
at all. The response of higher brain centres may provide a mechanism to explain choices and
food preference, and now requires further study in responses to nutrient classes, and clinical
scenarios such as obesity and anorexia of disease.
179
CHAPTER 6
General Discussion
Chapter one highlighted the multifaceted nature of the complex systems working in synergy
to control appetite and food intake. The gut plays an unquestionable role in this control and
its interaction with the brain has become increasingly apparent in recent years. That said, the
body of existing literature is somewhat limited by species differences and experimental
designs which often look at potential mechanisms in isolation or in unrealistic protocols.
Conflicting data and inconsistent findings further complicate matters.
Understanding the impact and the mechanisms mediating the effects of sugars and NNS on
appetite and food intake is of major nutritional and clinical importance, and may be a useful
strategy for the development of novel foods in the treatment of obesity and appetite related
disorders. The research presented within this thesis complements current knowledge
surrounding the effects of sweet tastants (glucose and NNS) on appetite, hormones, gastric
emptying and CNS responses. This chapter will collate the findings from the studies
presented herein, highlight methodological issues and conclude with future directions. An
overview of each study is summarised in table 6.1 and the main findings summarised
thereafter.
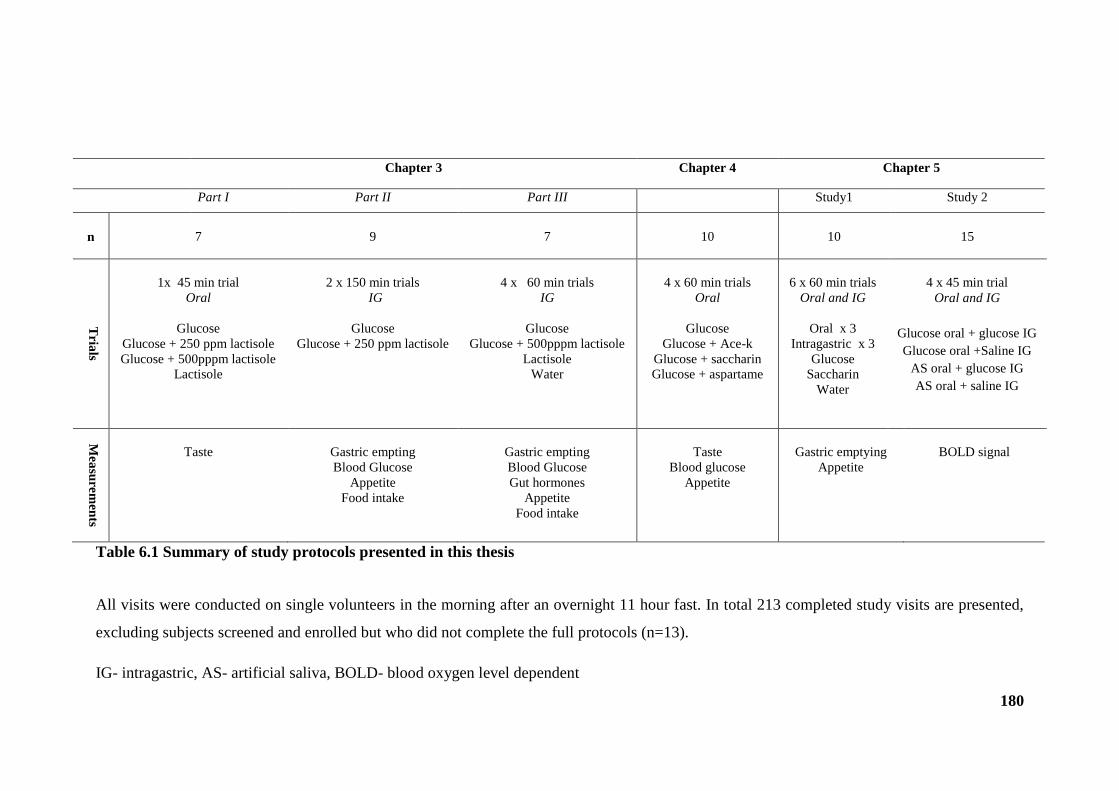
180
Chapter 3 Chapter 4 Chapter 5
Part I Part II Part III Study1 Study 2
n 7 9 7 10 10 15
Tria
ls
1x 45 min trial
Oral
Glucose
Glucose + 250 ppm lactisole
Glucose + 500pppm lactisole
Lactisole
2 x 150 min trials
IG
Glucose
Glucose + 250 ppm lactisole
4 x 60 min trials
IG
Glucose
Glucose + 500pppm lactisole
Lactisole
Water
4 x 60 min trials
Oral
Glucose
Glucose + Ace-k
Glucose + saccharin
Glucose + aspartame
6 x 60 min trials
Oral and IG
Oral x 3
Intragastric x 3
Glucose
Saccharin
Water
4 x 45 min trial
Oral and IG
Glucose oral + glucose IG
Glucose oral +Saline IG
AS oral + glucose IG
AS oral + saline IG
Mea
sure
men
ts
Taste
Gastric empting
Blood Glucose
Appetite
Food intake
Gastric empting
Blood Glucose
Gut hormones
Appetite
Food intake
Taste
Blood glucose
Appetite
Gastric emptying
Appetite
BOLD signal
Table 6.1 Summary of study protocols presented in this thesis
All visits were conducted on single volunteers in the morning after an overnight 11 hour fast. In total 213 completed study visits are presented,
excluding subjects screened and enrolled but who did not complete the full protocols (n=13).
IG- intragastric, AS- artificial saliva, BOLD- blood oxygen level dependent
181
6.1 Glucose, non-nutritive sweeteners and the gut sweet taste receptor
The main findings from chapters three and four are outlined below and depicted in
figure 6.1.
The oral sweet taste of 1M glucose was effectively abolished by 250 and 500
ppm lactisole in the oral cavity (A). Following an intragastric infusion of
glucose and lactisole (500 ppm), the previously described responses to
glucose were preserved (B) with no effect of lactisole on gastric emptying,
blood glucose, gut hormones, appetite ratings and food intake suggesting
additional sweet sensing mechanism/s not blocked by lactisole or a non-taste
pathway glucose specific mechanism may exist to modulate the responses to
intragastric glucose infusion (C). I cannot however exclude the possibility
that higher doses of lactisole would be required to block sweet taste receptors
‘pharmacologically’ in the gut. However the amounts used here certainly
exceed those used by the food industry.
Comparable to glucose ingestion alone, ingesting aspartame, saccharin and
ace-k in combination with glucose had similar effects on blood glucose and
appetite ratings (D). However, ace-k did result in a small enhancement in
AUC for blood glucose although the metabolic significance of such a small
effect is unlikely to have any dietetically relevant impact.

182
Figure 6.1 Summary schematic depicting findings from chapters three and four
Stimulates Inhibits Incompletely inhibits (Gerspach et al., 2011) Proposed pathway (Mace et a., 2007) No effect on blood glucose
183
The results from chapter three (part III) in conjunction with those found by Gerspach
et al propose a limited role for the gut sweet taste receptor but highlight the need for
further studies to fully elucidate the mechanism behind glucose sensing. Access to
the human gastrointestinal tract and EEC cells directly remains a challenge in human
research thus the majority of evidence stems from in vitro and animal models.
Whether these findings are representative of human in vivo function is obviously
questionable: my data would suggest not. An example of this issue was highlighted
by chapter four which demonstrated no increase in glucose absorption, as measured
by blood glucose concentrations, following ingestion of glucose in combination with
a panel of NNS compared to ingestion of glucose alone despite in vitro and in vivo
animal models suggesting otherwise (Margolskee et al., 2007, Mace et al., 2007).
That said, discrepancies between human studies are just as inherent in research
published to date. Some differences can be attributed to experimental approach.
However variation both between individuals and within individuals can also be a
confounding factor. The large variability in gut hormone responses observed in
chapter three part III is one example of this. Furthermore, gut hormone response is
only an indirect measure of the epithelial secretory response to the portal circulation
and may not translate to elevated peripheral plasma levels.
The two published studies conducted in humans so far (Brown et al., 2009, Ma et al.,
2010) and the results of chapter four indicate that glucose in combination with a
NNS is insufficient to alter blood glucose, albeit given acutely in healthy humans.
Both studies in chapter three and four focused on results derived from short-term
measures and it is possible that chronic ingestion or repeated exposure to the test
meals used, particularly NNS diet supplementation, may infer different results. With
that in mind it may be useful for future studies to control for this and stratify
participants into high and low sugar and NNS consumers as previous dietary intake
of participants was not taken into account in the current studies.
6.2 Sweet tastants in the gut-brain axis: brain integration of oral and gastric
sensing
As alluded to in chapter one, the control of appetite and food intake involves a
combination of homeostatic and non-homeostatic mechanisms which involve
184
processes including sensory, cognitive, post-ingestive and post absorptive as depicted
in the satiety cascade (figure 1.1).
The approach used in chapter five is the first of its kind, and I demonstrated that oral
pre-tasting of sweetness has a marked impact on the subsequent CNS response to
intragastric glucose. This means that in order to study whole-organism responses to
nutrients it may not be appropriate to bypass the oral and cephalic phase. Indeed, the
subtle but real differences in gastric emptying depending on route of administration
make this point more strongly. This links altered CNS activity to changes in gut
function with a temperospatial matrix that makes biological sense, within the
limitations of fMRI. This has important implications for the design of healthy yet
appetising food, a key interest of the food industry.
fMRI is the current gold standard, and recent imaging and analytic advances were
required to obtain good enough spatial resolution to study the brainstem structures
key to gut-brain interactions. The lack of ionising radiation permits repeat studies in
individuals, but it provides only an indirect measure of brain activity. The
physiological meaning of increased or reduced BOLD is a topic of debate, but it is
clear that different nutrients induce different changes. In stark contrast to reduced
BOLD in response to intragastric glucose, intragastric lipid infusion increases BOLD
signal in the hypothalamus and other regions (Lassman et al., 2010) and these
responses can be modulated by infusing the gut peptide ghrelin (Jones et al., 2012).
Current work in my department shows that fructose exerts similar effects to lipid
rather than glucose, despite also being a hexose sugar like glucose. From these
studies a common anatomical nutrient sensitive matrix appears to exist, but with
differential response. What if any impact oral pre-tasting of fat, or other tastants
including NNS, would have on lipid- or fructose –induced BOLD changes remains to
be established.
Compared with lean individuals, there is a marked attenuation of this inhibitory
response in obese individuals (Matsuda et al., 1999). Furthermore, in moderately
obese type 2 diabetics, ingestion of an oral glucose loads fails to inhibit
hypothalamic neuronal activity (Vidarsdottir et al., 2007). Further work is clearly
required to move these findings into key clinical areas.
185
6.3 Limitations and future directions
All participants were studied in the fully fasted state to standardise each experimental
condition. There is a possibility that this outweighs any effect of the test meal in
question. Future studies need to consider the effects of sugars and NNS in
participants when fasted for varying times, at different times of the days and when
sated, particularly as CNS responses have shown a sensitivity to the physiological
state participants are in (Haase et al., 2009).
The study population was a homogenous group (young, healthy and lean) and this
limits the applicability of the findings to other population groups. Of interest would
be to compare the effects in overweight/obese with lean individuals. This is
becoming increasingly popular in neuroimaging studies although is somewhat
restricted by current scanner limitations of size and weight of participants.
Furthermore, targeting gut sweet taste receptor mechanisms in type 2 diabetics may
be useful particularly as elevated blood glucose concentrations have been linked to
disordered control of sweet taste receptor expression (Young et al., 2009, Young et
al., 2013). Potential effects of sugars and NNS on appetite and food intake also have
relevance to the management of other eating disorders such as anorexia of disease
and age related disturbances of appetite.
In considering the effects of sugars and NNS it is important to remember that the
human diet is diverse and consumption of single nutrient classes in isolation is rare,
and mainly confined to sports nutrition. Thus, the relative effects should be
considered not only comparatively to other macronutrients but collectively to mimic
real life intake. Furthermore, all the test meals used in the studies were liquids. The
effects of solid test meals would likely infer different results not least due to differing
gastric emptying rates. On the other hand, liquid emptying is rapid and less regulated
than the early phase solid emptying (figure 1.3), so demonstrating the differences
presented herein shows the responses are robust.
VAS scales were used in three out of the four studies in this thesis. Their use in
appetite research is common and provides a basic and standard scale for self-
assessment of subjective appetite in healthy adults (Blundell et al., 2010). However,
there is large between subject and within subject variability requiring large numbers
of participants to detect differences between experimental conditions using repeated
measures design. This may explain why no significant differences were detected for

186
subjective appetite ratings between trials in the current studies. Despite this, the
method did show a sensitivity to changes in subjective appetite ratings over time and
the effect of the test meal ingestion/infusion. Indeed, attempting to capture perceived
state of hunger, specific sensations (fullness) and motivation (desire) to eat using
VAS may require additional measurements to fully investigate the complex nature of
eating behaviour.
The use of fMRI to study CNS appetite pathways in humans is a rapidly evolving
research field and brings the prospect that one day brain centres may be sufficiently
well understood and manipulated by new therapies and novel food products to
influence food intake and thereby control obesity. The development of BOLD has
enabled the identification of a number of brain regions but its physiological basis has
to be questioned as it is only an indirect measure of brain activity. At present, fMRI
BOLD signals are a research mapping tool used to study appetite. The current
challenge is to move this research into a clinical domain and study the effects of
novel exogenous agents on CNS responses to further our understanding of the
intricate nature of human ingestive behaviour
6.4 Summary
In summary, the research presented in this thesis provides valuable and novel
insights into the effects of glucose and NNS in the gastrointestinal tract, and into
CNS responses. It also highlights important discrepancies between humans and
animal studies both in vitro and in vivo. This lays the foundations for further work in
human participants within this area, and cautions against pursuing the field of
enquiry in models such as rodents. Teasing out effects of putative mechanisms in
isolation (i.e. oral vs. gastric) is not representative of reality and physiologically
flawed, as it overlooks the interaction between these mechanisms and their effects
that contribute to satiety. Only studies in whole humans can ultimately be regarded
as appropriate in the study of human ingestive behaviour.
187
REFERENCES
Amaro, E. & Barker, G. J. 2006. Study design in fMRI: Basic principles. Brain and
Cognition, 60, 220-232.
Anton, S. D., Martin, C. K., Han, H., Coulon, S., Cefalu, W. T., Geiselman, P. &
Williamson, D. A. 2010. Effects of stevia, aspartame, and sucrose on food
intake, satiety, and postprandial glucose and insulin levels. Appetite, 55, 37-
43.
Aziz, Q. & Thompson, D. G. 1998. Brain-gut axis in health and disease.
Gastroenterology, 114, 559-578.
Baggio, L. L. & Drucker, D. J. 2007. Biology of Incretins: GLP-1 and GIP.
Gastroenterology, 132, 2131-2157.
Banks, W. A. 2006. Blood-Brain Barrier and Energy Balance. Obesity, 14, 234S-
237S.
Batterham, R. L. & Bloom, S. R. 2003. The Gut Hormone Peptide YY Regulates
Appetite. Annals of the New York Academy of Sciences, 994, 162-168.
Batterham, R. L., Cohen, M. A., Ellis, S. M., Le Roux, C. W., Withers, D. J., Frost,
G. S., Ghatei, M. A. & Bloom, S. R. 2003a. Inhibition of Food Intake in
Obese Subjects by Peptide YY3–36. New England Journal of Medicine, 349,
941-948.
Batterham, R. L., Cowley, M. A., Small, C. J., Herzog, H., Cohen, M. A., Dakin, C.
L., Wren, A. M., Brynes, A. E., Low, M. J., Ghatei, M. A., Cone, R. D. &
Bloom, S. R. 2002. Gut hormone PYY3-36 physiologically inhibits food
intake. Nature, 418, 650-654.
Batterham, R. L., Cowley, M. A., Small, C. J., Herzog, H., Cohen, M. A., Dakin, C.
L., Wren, A. M., Brynes, A. E., Low, M. J., Ghatei, M. A., Cone, R. D. &
Bloom, S. R. 2004. Physiology: Does gut hormone PYY3-36 decrease food
intake in rodents? (reply). Nature, 430.
Batterham, R. L., Ffytche, D. H., Rosenthal, J. M., Zelaya, F. O., Barker, G. J.,
Withers, D. J. & Williams, S. C. R. 2007. PYY modulation of cortical and
hypothalamic brain areas predicts feeding behaviour in humans. Nature, 450,
106-109.
Batterham, R. L., Le Roux, C. W., Cohen, M. A., Park, A. J., Ellis, S. M., Patterson,
M., Frost, G. S., Ghatei, M. A. & Bloom, S. R. 2003b. Pancreatic Polypeptide
Reduces Appetite and Food Intake in Humans. Journal of Clinical
Endocrinology & Metabolism, 88, 3989-3992.
Beck, B., Richy, S. & Stricker-Krongrad, A. 2004. Feeding response to ghrelin
agonist and antagonist in lean and obese Zucker rats. Life Sciences, 76, 473-
478.
Bellisle, F., Dalix, A.-M., Airinei, G., Hercberg, S. & Péneau, S. 2009. Influence of
dietary restraint and environmental factors on meal size in normal-weight
women. A laboratory study. Appetite, 53, 309-313.
Bellisle, F. & Drewnowski, A. 2007. Intense sweeteners, energy intake and the
control of body weight. European Journal of Clinical Nutrition, 61, 691-700.
Bellisle, F., Drewnowski, A., Anderson, G. H., Westerterp-Plantenga, M. & Martin,
C. K. 2012. Sweetness, Satiation, and Satiety. The Journal of Nutrition, 142,
1149S-1154S.
Berthoud, H.-R. 2006. Homeostatic and Non-homeostatic Pathways Involved in the
Control of Food Intake and Energy Balance. Obesity, 14, 197S-200S.

188
Berthoud, H.-R. & Morrison, C. 2008. The Brain, Appetite, and Obesity. Annual
Review of Psychology, 59, 55-92.
Berthoud, H. R. 2008. Vagal and hormonal gut–brain communication: from satiation
to satisfaction. Neurogastroenterology & Motility, 20, 64-72.
Blackshaw, L. A., Brookes, S. J. H., Grundy, D. & Schemann, M. 2007. Sensory
transmission in the gastrointestinal tract. Neurogastroenterology & Motility,
19, 1-19.
Blundell, J. 1991. Pharmacological approaches to appetite suppression. Trends in
Pharmacological Sciences, 12, 147-157.
Blundell, J., Graaf, C. D., Hulshof, T., Jebb, S., Livingstone, B., Lluch, A., Mela, D.,
Salah, S., Schuring, E., Knaap, H. V. D. & Westerterp, M. 2010. Appetite
control: methodological aspects of the evaluation of foods. Obesity Reviews,
11, 251-270.
Blundell, J. E. 2006. Perspective on the Central Control of Appetite. Obesity, 14,
S160-S163.
Blundell, J. E., Green, S. & Burley, V. 1994. Carbohydrates and human appetite.
American JOurnal of Clinical Nutrition, 59, 728-734.
Bond, M. J., Mcdowell, A. J. & Wilkinson, J. Y. 2001. The measurement of dietary
restraint, disinhibition and hunger: an examination of the factor structure of
the Three Factor Eating Questionnaire (TFEQ). International Journal of
Obesity, 25, 900-906.
Braden, B., Adams, S. & Duan, L. P. 1995. The [13C]acetate breath test accurately
reflects gastric emptying of liquids in both liquid and semisolid test meals.
Gastroenterology, 108, 2751-1761.
Brennan, I. M., Feltrin, K. L., Nair, N. S., Hausken, T., Little, T. J., Gentilcore, D.,
Wishart, J. M., Jones, K. L., Horowitz, M. & Feinle-Bisset, C. 2009. Effects
of the phases of the menstrual cycle on gastric emptying, glycemia, plasma
GLP-1 and insulin, and energy intake in healthy lean women. American
Journal of Physiology Gastrointestinal Liver Physiolology, 297, G602-610.
Broberger, C. & Hökfelt, T. 2001. Hypothalamic and vagal neuropeptide circuitries
regulating food intake. Physiology & Behavior, 74, 669-682.
Brookes, S. J. H., Spencer, N. J., Costa, M. & Zagorodnyuk, V. P. 2013. Extrinsic
primary afferent signalling in the gut. Nature Review Gastroenterology and
Hepatology, 10, 286-296.
Brown, R. J., Walter, M. & Rother, K. I. 2009. Ingestion of Diet Soda Before a
Glucose Load Augments Glucagon-Like Peptide-1 Secretion. Diabetes Care,
32, 2184-2186.
Buchan, A. M. J. 1999. Nutrient Tasting and Signaling Mechanisms in the Gut. III.
Endocrine cell recognition of luminal nutrients. American Journal of
Physiology Gastrointestinal Liver Physiolology, 277, G1103-1107.
Buffenstein, R., Poppitt, S. D., Mcdevitt, R. M. & Prentice, A. M. 1995. Food intake
and the menstrual cycle: A retrospective analysis, with implications for
appetite research. Physiology & Behavior, 58, 1067-1077.
Camilleri, M. & Grudell, A. B. 2007. Appetite and obesity: a gastroenterologist's
perspective. Neurogastroenterology and motility, 19, 333-341.
Cecil, J. E., Castiglione, K., French, S., Francis, J. & Read, N. W. 1998a. Effects of
Intragastric Infusions of Fat and Carbohydrate on Appetite Ratings and Food
Intake from a Test Meal. Appetite, 30, 65-77.
Cecil, J. E., Francis, J. & Read, N. W. 1998b. Relative Contributions of Intestinal,
Gastric, Oro-sensory Influences and Information to Changes in Appetite
Induced by the Same Liquid Meal. Appetite, 31, 377-390.
189
Chambers, E. S., Bridge, M. W. & Jones, D. A. 2009. Carbohydrate sensing in the
human mouth: effects on exercise performance and brain activity. The
Journal of Physiology, 587, 1779-1794.
Chaudhri, O., Small, C. & Bloom, S. 2006. Gastrointestinal hormones regulating
appetite. Philosophical Transactions of the Royal Society B: Biological
Sciences, 361, 1187-1209.
Chaudhri, O. B., Salem, V., Murphy, K. G. & Bloom, S. R. 2008. Gastrointestinal
Satiety Signals. Annual Review of Physiology, 70, 239-255.
Chew, C., Bartholomeusz, F. D. L., Bellon, M. & Chatterton, B. 2003. Simultaneous
13C/14C dual isotope breath test measurement of gastric emptying of solid
and liquid in normal subjects and patients: comparison with scintigraphy.
Nuclear medicine review, 6, 29-33.
Cook, C. G., Andrews, J. M., Jones, K. L., Wittert, G. A., Chapman, I. M., Morley, J.
E. & Horowitz, M. 1997. Effects of small intestinal nutrient infusion on
appetite and pyloric motility are modified by age. American Journal of
Physiology Regulatory Integrative Comparative Physiology, 273, R755-761.
Cummings, D. E. & Overduin, J. 2007. Gastrointestinal regulation of food intake.
The Journal of Clinical Investigation, 117, 13-23.
D'alessio, D. 2008. Intestinal Hormones and Regulation of Satiety: The Case for
CCK, GLP-1, PYY, and Apo A-IV. Journal of Parenteral and Enteral
Nutrition, 32, 567-568.
De Araujo, I. E. & Simon, S. A. 2009. The gustatory cortex and multisensory
integration. International Journal of Obesity, 33, S34-S43.
De Graaf, C., Blom, W. M., Smeets, P. M., Stafleu, A. & Hendriks, H. F. J. 2004.
Biomarkers of satiation and satiety. The American Journal of Clinical
Nutrition, 79, 946-961.
De Graaf, C., De Jong, L. S. & Lambers, A. C. 1999. Palatability Affects Satiation
But Not Satiety. Physiology & Behavior, 66, 681-688.
De La Hunty, A., Gibson, S. & Ashwell, M. 2006. A review of the effectiveness of
aspartame in helping with weight control. Nutrition Bulletin, 31, 115-128.
De Silva, A., Salem, V., Matthews, P. M. & Dhillo, W. S. 2012. The Use of
Functional MRI to Study Appetite Control in the CNS. Experimental
Diabetes Research, 2012, 13.
Deane, A. M., Nguyen, N. Q., Stevens, J. E., Fraser, R. J. L., Holloway, R. H.,
Besanko, L. K., Burgstad, C., Jones, K. L., Chapman, M. J., Rayner, C. K. &
Horowitz, M. 2010. Endogenous Glucagon-Like Peptide-1 Slows Gastric
Emptying in Healthy Subjects, Attenuating Postprandial Glycemia. Journal
of Clinical Endocrinology & Metabolism, 95, 215-221.
Degen, L., Oesch, S., Casanova, M., Graf, S., Ketterer, S., Drewe, J. & Beglinger, C.
2005. Effect of Peptide YY3-36 on Food Intake in Humans.
Gastroenterology, 129, 1430-1436.
Derosa, G. & Maffioli, P. 2012. Anti-obesity drugs: a review about their effects and
their safety. Expert Opinion on Drug Safety, 11, 459-471.
Dimeglio, D. P. & Mattes, R. D. 2000. Liquid versus solid carbohydrate: effects on
food intake and body weight. International Journal of Obesity, 24.
Doggrell, S. A. 2004. Can food intake be reduced with peptide YY3-36? Expert
Opinion on Investigational Drugs, 13, 285-287.
Dye, L. & Blundell, J. E. 1997. Menstrual cycle and appetite control: implications for
weight regulation. Human Reproduction, 12, 1142-1151.
Dyer, J., Daly, K., Salmon, K. S. H., Arora, D. K., Kokrashvili, Z., Margolskee, R. F.
& Shirazi-Beechey, S. P. 2007. Intestinal glucose sensing and regulation of

190
intestinal glucose absorption. Biochemical Society Transactions, 035, 1191-
1194.
Dyer, J., Salmon, K. S. H., Zibrik, L. & Shirazi-Beechey, S. P. 2005. Expression of
sweet taste receptors of the T1R family in the intestinal tract and
enteroendocrine cells. Biochemecial Society Transactions, 33, 302-305.
Dyer, J., Vayro, S. & Shirazi-Beechey, S. P. 2003. Mechanism of glucose sensing in
the small intestine. Biochememical Society Transactions, 31, 1140-1142.
Dyer, J., Wood, I. S., Palejwala, A., Ellis, A. & Shirazi-Beechey, S. P. 2002.
Expression of monosaccharide transporters in intestine of diabetic humans.
American Journal of Physiology - Gastrointestinal and Liver Physiology,
282, G241-G248.
Egan, J. M. & Margolskee, R. F. 2008. Taste Cells of the Gut and Gastrointestinal
Chemosensation. Molecular Interventions, 8, 78-81.
Farre, R. & Tack, J. 2013. Food and Symptom Generation in Functional
Gastrointestinal Disorders: Physiological Aspects. American Journal of
Gastroenterology, 108, 698-706.
Feinle, C., O'donovan, D. & Horowitz, M. 2002. Carbohydrate and Satiety. Nutrition
Reviews, 60, 155-169.
Flint, A., Raben, A., Blundell, J. E. & Astrup, A. 2000. Reproducibility, power and
validity of visual analogue scales in assessment of appetite sensations in
single test meal studies. International Journal of Obesity, 24, 38-48.
Ford, H. E., Peters, V., Martin, N. M., Sleeth, M. L., Ghatei, M. A., Frost, G. S. &
Bloom, S. R. 2011. Effects of oral ingestion of sucralose on gut hormone
response and appetite in healthy normal-weight subjects. European Journal
of Clinical Nutrition, 65, 508-513.
Frank, G. K., Kaye, W. H., Carter, C. S., Brooks, S., May, C., Fissell, K. & Stenger,
V. A. 2003. The evaluation of brain activity in response to taste stimuli—a
pilot study and method for central taste activation as assessed by event-
related fMRI. Journal of Neuroscience Methods, 131, 99-105.
Frank, G. K. W., Oberndorfer, T. A., Simmons, A. N., Paulus, M. P., Fudge, J. L.,
Yang, T. T. & Kaye, W. H. 2008. Sucrose activates human taste pathways
differently from artificial sweetener. NeuroImage, 39, 1559-1569.
Fraser, K. A., Raizada, E. & Davison, J. S. 1995. Oral-pharyngeal-esophageal and
gastric cues contribute to meal-induced c- fos expression. American Journal
of Physiology - Regulatory Integrative and Comparative Physiology, 268,
R223-R230.
Frayn, K. N. 2003. Metabolic Regulation : A Human Perspective, Oxford Blackwell
Science.
French, S. J. & Cecil, J. E. 2001. Oral, gastric and intestinal influences on human
feeding. Physiology & Behavior, 74, 729-734.
Fudge, J. L., Breitbart, M. A., Danish, M. & Pannoni, V. 2005. Insular and gustatory
inputs to the caudal ventral striatum in primates. The Journal of Comparative
Neurology, 490, 101-118.
Fujita, Y., Wideman, R. D., Speck, M., Asadi, A., King, D. S., Webber, T. D.,
Haneda, M. & Kieffer, T. J. 2009. Incretin release from gut is acutely
enhanced by sugar but not by sweeteners in vivo. America Journal of
Physiology Endocrinology and Metabolism, 296, E473-479.
Furness, J. B., Kunze, W. a. A., Bertrand, P. P., Clerc, N. & Bornstein, J. C. 1998.
Intrinsic primary afferent neurons of the intestine. Progress in Neurobiology,
54, 1-18.
191
Geliebter, A. 1988. Gastric distension and gastric capacity in relation to food intake
in humans. Physiology & Behavior, 44, 665-668.
Geliebter, A., Westreich, S. & Gage, D. 1988. Gastric distention by balloon and test-
meal intake in obese and lean subjects. The American Journal of Clinical
Nutrition, 48, 592-594.
Geraedts, M. C. P., Takahashi, T., Vigues, S., Markwardt, M. L., Nkobena, A.,
Cockerham, R. E., Hajnal, A., Dotson, C. D., Rizzo, M. A. & Munger, S. D.
2012. Transformation of postingestive glucose responses after deletion of
sweet taste receptor subunits or gastric bypass surgery. American Journal of
Physiology - Endocrinology And Metabolism, 303, E464-E474.
Gerspach, A. C., Steinert, R. E., Schanenberger, L., Graber-Maier, A. & Beglinger,
C. 2011. The role of the gut sweet taste receptor in regulating GLP-1, PYY,
and CCK release in humans. American Journal of Physiology -
Endocrinology And Metabolism, 301, E317-E325.
Grandt, D., Schimiczek, M., Beglinger, C., Layer, P., Goebell, H., Eysselein, V. E. &
Reeve Jr, J. R. 1994. Two molecular forms of Peptide YY (PYY) are
abundant in human blood: characterization of a radioimmunoassay
recognizing PYY 1–36 and PYY 3–36. Regulatory Peptides, 51, 151-159.
Gregersen, N. T., Flint, A., Bitz, C., Blundell, J. E., Raben, A. & Astrup, A. 2008.
Reproducibility and power of ad libitum energy intake assessed by repeated
single meals. The American Journal of Clinical Nutrition, 87, 1277-1281.
Grill, H. J., Skibicka, K. P. & Hayes, M. R. 2007. Imaging Obesity: fMRI, Food
Reward, and Feeding. Cell Metabolism, 6, 423-425.
Guillory, B., Splenser, A. & Garcia, J. 2013. The Role of Ghrelin in Anorexia–
Cachexia Syndromes. In: GERALD, L. (ed.) Vitamins & Hormones.
Academic Press.
Haase, L., Cerf-Ducastel, B. & Murphy, C. 2009. Cortical activation in response to
pure taste stimuli during the physiological states of hunger and satiety.
NeuroImage, 44, 1008-1021.
Haase, L., Green, E. & Murphy, C. 2011. Males and females show differential brain
activation to taste when hungry and sated in gustatory and reward areas.
Appetite, 57, 421-434.
Heijboer, A. C., Pijl, H., Van Den Hoek, A. M., Havekes, L. M., Romijn, J. A. &
Corssmit, E. P. M. 2006. Gut–Brain Axis: Regulation of Glucose
Metabolism. Journal of Neuroendocrinology, 18, 883-894.
Hellström, P. M., Grybäck, P. & Jacobsson, H. 2006. The physiology of gastric
emptying. Best Practice & Research Clinical Anaesthesiology, 20, 397-407.
Herrmann, C., Göke, R., Richter, G., Fehmann, H. C., Arnold, R. & Göke, B. 1995.
Glucagon-Like Peptide-1 and Glucose-Dependent Insulin-Releasing
Polypeptide Plasma Levels in Response to Nutrients. Digestion, 56, 117-126.
Höfer, D., Asan, E. & Drenckhahn, D. 1999. Chemosensory Perception in the Gut.
Physiology, 14, 18-23.
Hofer, D., Puschel, B. & Drenckhahn, D. 1996. Taste receptor-like cells in the rat gut
identified by expression of alpha-gustducin. Proceedings of the National
Academy of Sciences, 93, 6631-6634.
Horowitz, M., Dent, J., Fraser, R., Sun, W. & Hebbard, G. 1994. Role and
integration of mechanisms controlling gastric emptying. Digestive Diseases
and Sciences, 39, 7S-13S.
Howseman, A. M. & Bowtell, R. W. 1999. Functional Magnetic Resonance Imaging:
Imaging Techniques and Contrast Mechanisms. Philosophical Transactions:
Biological Sciences, 354, 1179-1194.

192
Hussain, S. S. & Bloom, S. R. 2011. The pharmacological treatment and
management of obesity. Postgraduate Medicine, 123, 34-44.
Hussain, S. S. & Bloom, S. R. 2013. The regulation of food intake by the gut-brain
axis: implications for obesity. International Journal Obesity, 37, 625-633.
Ikeda, T., Inamori, M., Fujisawa, N., Iwasaki, T. & Akiyama, T. 2008. Effects of
body positions on gastric emptying with enteral nutrtion: a crossover study
using a continous real time 13C breath test. Hepatogastroenterology, 55,
1905-1907.
Iwatsuki, K. & Torii, K. 2012. Peripheral chemosensing system for tastants and
nutrients. Current Opinion in Endocrinology, Diabetes and Obesity, 19, 19-
25.
Jang, H.-J., Kokrashvili, Z., Theodorakis, M. J., Carlson, O. D., Kim, B.-J., Zhou, J.,
Kim, H. H., Xu, X., Chan, S. L., Juhaszova, M., Bernier, M., Mosinger, B.,
Margolskee, R. F. & Egan, J. M. 2007. Gut-expressed gustducin and taste
receptors regulate secretion of glucagon-like peptide-1. Proceedings of the
National Academy of Sciences, 104, 15069-15074.
Jiang, P., Cui, M., Zhao, B., Liu, Z., Snyder, L. A., Benard, L. M. J., Osman, R.,
Margolskee, R. F. & Max, M. 2005. Lactisole Interacts with the
Transmembrane Domains of Human T1R3 to Inhibit Sweet Taste. Journal of
Biological Chemistry, 280, 15238-15246.
Johnson, C., Birch, G. G. & Macdougall, D. B. 1994. The effect of the sweetness
inhibitor 2(-4-methoxyphenoxy)propanoic acid (sodium salt) (Na-PMP) on
the taste of bitter-sweet stimuli. Chemical Senses, 19, 349-358.
Jones, R. B., Mckie, S., Astbury, N., Little, T. J., Tivey, S., Lassman, D. J.,
Mclaughlin, J., Luckman, S., Williams, S. R., Dockray, G. J. & Thompson,
D. G. 2012. Functional neuroimaging demonstrates that ghrelin inhibits the
central nervous system response to ingested lipid. Gut, 61, 1543-1551.
Jordan, J., Greenway, F. L., Leiter, L. A., Li, Z., Jacobson, P., Murphy, K., Hill, J.,
Kler, L. & Aftring, R. P. 2007. Stimulation of Cholecystokinin-A Receptors
With GI181771X does not Cause Weight Loss in Overweight or Obese
Patients. Clinical Pharmacology and Therapeutics, 83, 281-287.
Kaplan, J. M., Spector, A. C. & Grill, H. J. 1992. Dynamics of gastric emptying
during and after stomach fill. American Journal of Physiology - Regulatory,
Integrative and Comparative Physiology, 263, R813-R819.
Kellett, G. L., Brot-Laroche, E., Mace, O. J. & Leturque, A. 2008. Sugar Absorption
in the Intestine: The Role of GLUT2. Annual Review of Nutrition, 28, 35-54.
Kellett, G. L. & Helliwell, P. A. 2000. The diffusive component of intestinal glucose
absorption is mediated by the glucose-induced recruitment of GLUT2 to the
brush-border membrane. Journal of Biochemistry, 350, 155-162.
Kissileff, H. R., Pi-Sunyer, F. X., Thornton, J. & Smith, G. P. 1981. C-terminal
octapeptide of cholecystokinin decreases food intake in man. The American
Journal of Clinical Nutrition, 34, 154-160.
Kobayashi, M., Takeda, M., Hattori, N., Fukunaga, M., Sasabe, T., Inoue, N., Nagai,
Y., Sawada, T., Sadato, N. & Watanabe, Y. 2004. Functional imaging of
gustatory perception and imagery: “top-down” processing of gustatory
signals. NeuroImage, 23, 1271-1282.
Koda, S., Date, Y., Murakami, N., Shimbara, T., Hanada, T., Toshinai, K., Niijima,
A., Furuya, M., Inomata, N., Osuye, K. & Nakazato, M. 2005. The Role of
the Vagal Nerve in Peripheral PYY3–36-Induced Feeding Reduction in Rats.
Endocrinology, 146, 2369-2375.
193
Kokrashvili, Z., Mosinger, B. & Margolskee, R. F. 2009. Taste signaling elements
expressed in gut enteroendocrine cells regulate nutrient-responsive secretion
of gut hormones. The American Journal of Clinical Nutrition, 90, 822S-825.
Konturek, S. J., Konturek, J. W., Pawlik, T. & Brzoozowki, T. 2004. Brain-Gut axis
and its role in the control of food intake. Journal of Physiology and
Pharmacology, 55, 137-154.
Kringelbach, M. L., O'Doherty, J., Rolls, E. T. & Andrews, C. 2003. Activation of
the Human Orbitofrontal Cortex to a Liquid Food Stimulus is Correlated with
its Subjective Pleasantness. Cerebral Cortex, 13, 1064-1071.
Kunze, W. a. A. & Furness, J. B. 1999. The enteric nervous system and regulation of
intestinal motility. Annual Review of Physiology, 61, 117-142.
Kuo, Y.-T., Parkinson, J. R. C., Chaudhri, O. B., Herlihy, A. H., So, P.-W., Dhillo,
W. S., Small, C. J., Bloom, S. R. & Bell, J. D. 2007. The Temporal Sequence
of Gut Peptide CNS Interactions Tracked In Vivo by Magnetic Resonance
Imaging. Journal of Neuroscience, 27, 12341-12348.
Lake, A. & Townshend, T. 2006. Obesogenic environments: exploring the built and
food environments. The Journal of the Royal Society for the Promotion of
Health, 126, 262-267.
Lal, S., Mclaughlin, J., Barlow, J., D'amato, M., Giacovelli, G., Varro, A., Dockray,
G. J. & Thompson, D. G. 2004. Cholecystokinin pathways modulate
sensations induced by gastric distension in humans. American Journal of
Physiology Gastrointestal Liver Physiology, 287, G72-79.
Lassman, D. J., Mckie, S., Gregory, L. J., Lal, S., D'amato, M., Steele, I., Varro, A.,
Dockray, G. J., Williams, S. C. R. & Thompson, D. G. 2010. Defining the
Role of Cholecystokinin in the Lipid-Induced Human Brain Activation
Matrix. Gastroenterology, 138, 1514-1524.
Lavin, J. H., French, S. & Read, N. W. 2002. Comparison of oral and gasric
administration f sucrose and maltose on gastric empting rate and appetite.
International Journal of Obesity, 26, 80-86.
Lavin, J. H., Wittert, G., Sun, W. M., Horowitz, M., Morley, J. E. & Read, N. W.
1996. Appetite regulation by carbohydrate: role of blood glucose and
gastrointestinal hormones. American Journal of Physiology Endocrinology
and Metabolism, 271, E209-214.
Lavin, J. H., Wittert, G. A., Andrews, J., Yeap, B., Wishart, J. M., Morris, H. A.,
Morley, J. E., Horowitz, M. & Read, N. W. 1998. Interaction of insulin,
glucagon-like peptide 1, gastric inhibitory polypeptide, and appetite in
response to intraduodenal carbohydrate. The American Journal of Clinical
Nutrition, 68, 591-598.
Le Roux, C. W. & Bloom, S. R. 2005. Peptide YY, appetite and food intake.
Proceedings of the Nutrition Society, 64, 213-216.
Le Roux, C. W., Welbourn, R., Werling, M., Osborne, A., Kokkinos, A., Laurenius,
A., Lönroth, H., Fändriks, L., Ghatei, M. A., Bloom, S. R. & Olbers, T. 2007.
Gut Hormones as Mediators of Appetite and Weight Loss After Roux-en-Y
Gastric Bypass. Annals of Surgery, 246, 780-785.
Lesdama, A., Fromentin, G., Daudin, J.-J., Arlotti, A., Vinoy, S., Tome, D. &
Marsset-Baglieri, A. 2012. Characterization of the Three-Factor Eating
Questionnaire scores of a young French cohort. Appetite, 59, 385-390.
Li, J., An, R., Zhang, Y., Li, X. & Wang, S. 2012. Correlations of macronutrient-
induced functional magnetic resonance imaging signal changes in human
brain and gut hormone responses. The American Journal of Clinical
Nutrition.
194
Lim, G. E., Huang, G. J., Flora, N., Leroith, D., Rhodes, C. J. & Brubaker, P. L.
2009. Insulin Regulates Glucagon-Like Peptide-1 Secretion from the
Enteroendocrine L Cell. Endocrinology, 150, 580-591.
Lin, H. C., Doty, J. E., Reedy, T. J. & Meyer, J. H. 1989. Inhibition of gastric
emptying by glucose depends on length of intestine exposed to nutrient.
American Journal of Physiology Gastrointestinal Liver Physiology, 256,
G404-411.
Lindemann, B. 2001. Receptors and transduction in taste. Nature, 413, 219-225.
Little, T. J., Doran, S., Meyer, J. H., Smout, A. J. P. M., O'donovan, D. G., Wu, K.-
L., Jones, K. L., Wishart, J., Rayner, C. K., Horowitz, M., Feinle-Bisset, C.
2006a. The release of GLP-1 and ghrelin, but not GIP and CCK, by glucose is
dependent upon the length of small intestine exposed. American Journal of
Physiology - Endocrinology And Metabolism, 291, E647-E655.
Little, T. J., Gopinath, A., Patel, E., Mcglone, A., Lassman, D. J., D’amato, M.,
Mclaughlin, J. T. & Thompson, D. G. 2010. Gastric emptying of hexose
sugars: role of osmolality, molecular structure and the CCK1 receptor.
Neurogastroenterology & Motility, 22, 1183-e1314.
Little, T. J., Gupta, N., Case, R. M., Thompson, D. G. & Mclaughlin, J. T. 2009.
Sweetness and bitterness taste of meals per se does not mediate gastric
emptying in humans. American Journal of Physiology Regulatory Integrative
Comparative Physiology, 297, R632-639.
Little, T. J., Mckie, S., Jones, R. B., D'amato, M., Smith, C., Kiss, O., Thompson, D.
G. & Mclaughlin, J. 2013, In review. Mapping effects of cholecystokinin
receptor blockade on glucose mediate gut to brain signaling pathways in
humans. Human Brain Mapping.
Little, T. J., Pilichiewicz, A. N., Russo, A., Phillips, L., Jones, K. L., Nauck, M. A.,
Wishart, J., Horowitz, M. & Feinle-Bisset, C. 2006b. Effects of Intravenous
Glucagon-Like Peptide-1 on Gastric Emptying and Intragastric Distribution
in Healthy Subjects: Relationships with Postprandial Glycemic and
Insulinemic Responses. Journal of Clinical Endocrinology and Metabolism,
91, 1916-1923.
Liu, Y., Gao, J.-H., Liu, H.-L. & Fox, P. T. 2000. The temporal response of the brain
after eating revealed by functional MRI. Nature, 405, 1058-1062.
Logothetis, N. K. 2008. What we can do and what we cannot do with fMRI. Nature,
453, 869-878.
Logothetis, N. K. & Wandell, B. A. 2004. Interpreting the BOLD Signal. Annual
Review of Physiology, 66, 735-769.
Long, S. J., Sutton, J. A., Amaee, W. B., Giouvanoudi, A., Spyrou, N. M., Rogers, P.
J. & Morgan, L. M. 1999. No effect of glucagon-like peptide-1 on short-term
satiety and energy intake in man. British Journal of Nutrition, 81, 273-279.
Lowe, M. R. 1993. The effects of dieting on eating behavior: A three-factor model.
Psychological Bulletin, 114, 100-121.
Ma, J., Bellon, M., Wishart, J. M., Young, R., Blackshaw, L. A., Jones, K. L.,
Horowitz, M. & Rayner, C. K. 2009. Effect of the artificial sweetener,
sucralose, on gastric emptying and incretin hormone release in healthy
subjects. American Journal of Physiology Gastrointestal Liver Physiology,
296, G735-739.
Ma, J., Chang, J., Checklin, H. L., Young, R. L., Jones, K. L., Horowitz, M. &
Rayner, C. K. 2010. Effect of the artificial sweetener, sucralose, on small
intestinal glucose absorption in healthy human subjects. British Journal of
Nutrition, 104 803-806.

195
Mace, O. J., Affleck, J., Patel, N. & Kellett, G. L. 2007. Sweet taste receptors in rat
small intestine stimulate glucose absorption through apical GLUT2. The
Journal of Physiology, 582, 379-392.
Margolskee, R. F. 2002. Molecular Mechanisms of Bitter and Sweet Taste
Transduction. Journal of Biological Chemistry, 277, 1-4.
Margolskee, R. F., Dyer, J., Kokrashvili, Z., Salmon, K. S. H., Ilegems, E., Daly, K.,
Maillet, E. L., Ninomiya, Y., Mosinger, B. & Shirazi-Beechey, S. P. 2007.
T1R3 and gustducin in gut sense sugars to regulate expression of Na+-
glucose cotransporter 1. Proceedings of the National Academy of Sciences,
104, 15075-15080.
Matsuda, M., Liu, Y., Mahankali, S., Pu, Y., Mahankali, A., Wang, J., Defronzo, R.
A., Fox, P. T. & Gao, J. H. 1999. Altered hypothalamic function in response
to glucose ingestion in obese humans. Diabetes, 48, 1801-1806.
Mattes, R. D. & Popkin, B. M. 2009. Nonnutritive sweetener consumption in
humans: effect on appetite and food intake and their putative mechanisms.
The American Journal of Clinical Nutrition, 89, 1-14.
Mayer, E. A. 2011. Gut feelings: the emerging biology of gut-brain communication.
Nature Review Neuroscience, 12, 453-466.
Mayer, J. 1955. Regulation of energy intake and the bodyweight: The glucostatic
theory and the lipostatic hypothesis. Annals of the New York Academy of
Sciences, 63, 15-43.
Miyawaki, K., Yamada, Y., Ban, N., Ihara, Y., Tsukiyama, K., Zhou, H. & Et Al.
2002. Inhibition of gastric inhibitory polypeptide signaling prevents obesity.
Nature Medicine, 8, 738-742.
Moore, J. G., Datz, F. L., Christian, P. E., Greenberg, E. & Alazraki, N. 1988. Effect
of body posture on radionuclide measurements of gastric emptying. Digestive
Diseases and Sciences, 33, 1592-1595.
Murphy, K. G. & Bloom, S. R. 2006. Gut hormones and the regulation of energy
homeostasis. Nature, 444, 854-859.
Nakagawa, A., Satake, H., Nakabayashi, H., Nishizawa, M., Furuya, K., Nakano, S.,
Kigoshi, T., Nakayama, K. & Uchida, K. 2004. Receptor gene expression of
glucagon-like peptide-1, but not glucose-dependent insulinotropic
polypeptide, in rat nodose ganglion cells. Autonomic Neuroscience, 110, 36-
43.
Nakagawa, Y., Nagasawa, M., Yamada, S., Hara, A., Mogami, H., Nikolaev, V. O.,
Lohse, M. J., Shigemura, N., Ninomiya, Y. & Kojima, I. 2009. Sweet Taste
Receptor Expressed in Pancreatic β-Cells Activates the Calcium and Cyclic
AMP Signaling Systems and Stimulates Insulin Secretion. PLoS ONE, 4,
e5106.
Nelson, G., Hoon, M. A., Chandrashekar, J., Zhang, Y., Ryba, N. J. P. & Zuker, C. S.
2001. Mammalian Sweet Taste Receptors. Cell, 106, 381-390.
Nicolaus, M., Brödl, J., Linke, R., Woerle, H.-J., Göke, B. & Schirra, J. 2011.
Endogenous GLP-1 Regulates Postprandial Glycemia in Humans: Relative
Contributions of Insulin, Glucagon, and Gastric Emptying. Journal of
Clinical Endocrinology and Metabolism, 96, 229-236.
O'doherty, J., Rolls, E. T., Francis, S., Bowtell, R. & Mcglone, F. 2001.
Representation of Pleasant and Aversive Taste in the Human Brain. Journal
of Neurophysiology, 85, 1315-1321.
O'doherty, J. P., Deichmann, R., Critchley, H. D. & Dolan, R. J. 2002. Neural
Responses during Anticipation of a Primary Taste Reward. Neuron, 33, 815-
826.
196
Oesch, S., Rüegg, C., Fischer, B., Degen, L. & Beglinger, C. 2006. Effect of gastric
distension prior to eating on food intake and feelings of satiety in humans.
Physiology and Behavior, 87, 903-910.
Page, K. A., Seo, D., Belfort-Deaguiar, R., Lacadie, C., Dzuira, J., Naik, S.,
Amarnath, S., Constable, R. T., Sherwin, R. S. & Sinha, R. 2011. Circulating
glucose levels modulate neural control of desire for high-calorie foods in
humans. The Journal of Clinical Investigation, 121, 4161-4169.
Parker, B. A., Sturm, K., Macintosh, C. G., Feinle, C., Horowitz, M. & Chapman, I.
M. 2004. Relation between food intake and visual analogue scale ratings of
appetite and other sensations in healthy older and young subjects. European
Journal of Clinical Nutrition, 58, 212-218.
Parker, H. E., Reimann, F. & Gribble, F. M. 2010. Molecular mechanisms
underlying nutrient-stimulated incretin secretion. Expert Reviews in
Molecular Medicine, 12, null-null.
Pepino, M. Y. & Bourne, C. 2011. Non-nutritive sweeteners, energy balance, and
glucose homeostasis. Current Opinion in Clinical Nutrition & Metabolic
Care, 14, 391-395.
Phillips, R. J. & Powley, T. L. 1996. Gastric volume rather than nutrient content
inhibits food intake. American Journal of Physiology Regulatory Integrative
Comparative Physiology, 271, R766-769.
Phillips, R. J. & Powley, T. L. 2000. Tension and stretch receptors in gastrointestinal
smooth muscle: re-evaluating vagal mechanoreceptor electrophysiology.
Brain Research Reviews, 34, 1-26.
Phillips, R. J. & Powley, T. L. 2007. Innervation of the gastrointestinal tract: Patterns
of aging. Autonomic Neuroscience, 136, 1-19.
Pliquett, R. U., Führer, D., Falk, S., Zysset, S., Von Cramon, D. Y. & Stumvoll, M.
2006. The Effects of Insulin on the Central Nervous System - Focus on
Appetite Regulation. Hormone and Metabolic Research, 38, 442-446.
Poothullil, J. M. 1995. Oral satiation and regulation of intake. Physiology &
Behavior, 57, 349-352.
Power, M. L. & Schulkin, J. 2008. Anticipatory physiological regulation in feeding
biology: Cephalic phase responses. Appetite, 50, 194-206.
Raben, A., Tagliabue, A. & Astrup, A. 1995. The reproducibility of subjective
appetite scores. British Journal of Nutrition, 73, 517-530.
Ratner, R. E., Dickey, R., Fineman, M., Maggs, D. G., Shen, L., Strobel, S. A.,
Weyer, C. & Kolterman, O. G. 2004. Amylin replacement with pramlintide as
an adjunct to insulin therapy improves long-term glycaemic and weight
control in Type 1 diabetes mellitus: a 1-year, randomized controlled trial.
Diabetic Medicine, 21, 1204-1212.
Raybould, H. E. 1998. Does Your Gut Taste? Sensory Transduction in the
Gastrointestinal Tract. Physiology, 13, 275-280.
Raybould, H. E. 2007. Mechanisms of CCK signaling from gut to brain. Current
Opinion in Pharmacology, 7, 570-574.
Rayner, C. K., Samsom, M., Jones, K. L. & Horowitz, M. 2001. Relationships of
Upper Gastrointestinal Motor and Sensory Function With Glycemic Control.
Diabetes Care, 24, 371-381.
Renwick, A. G. & Molinary, S. V. 2010. Sweet-taste receptors, low-energy
sweeteners, glucose absorption and insulin release. British Journal of
Nutrition, First View, 1-6.
Rideout, C. A. & Barr, S. I. 2009. Restrained Eating vs Trying to Lose Weight: How
Are They Associated with Body Weight and Tendency to Overeat among

197
Postmenopausal Women? Journal of the American Dietetic Association, 109,
890-893.
Ritter, R. C. 2004. Gastrointestinal mechanisms of satiation for food. Physiology &
Behavior, 81, 249-273.
Roberge, J. N. & Brubaker, P. L. 1993. Regulation of intestinal proglucagon-derived
peptide secretion by glucose-dependent insulinotropic peptide in a novel
enteroendocrine loop. Endocrinology, 133, 233-240.
Rogers, R. C., Mctigue, D. M. & Hermann, G. E. 1995. Vagovagal reflex control of
digestion: afferent modulation by neural and "endoneurocrine" factors.
American Journal of Physiology Gastrointestal Liver Physiology, 268, G1-
10.
Rolls, B. J. & Roe, L. S. 2002. Effect of the volume of liquid food infused
intragastrically on satiety in women. Physiology and Behavior, 76, 623-631.
Rolls, B. J., Rolls, E. T., Rowe, E. A. & Sweeney, K. 1981. Sensory specific satiety
in man. Physiology and Behavior, 27, 137-142.
Rolls, E. T. 2005. Taste, olfactory, and food texture processing in the brain, and the
control of food intake. Physiology & Behavior, 85, 45-56.
Rolls, E. T. 2006. Brain mechanisms underlying flavour and appetite. Philosophical
Transactions of the Royal Society B: Biological Sciences, 361, 1123-1136.
Rolls, E. T. 2007. Sensory processing in the brain related to the control of food
intake. Proceedings of the Nutrition Society, 66, 96-112.
Rozengurt, E. & Sternini, C. 2007. Taste receptor signaling in the mammalian gut.
Current Opinion in Pharmacology, 7, 557-562.
Rozengurt, N., Wu, S. V., Chen, M. C., Huang, C., Sternini, C. & Rozengurt, E.
2006. Colocalization of the α-subunit of gustducin with PYY and GLP-1 in L
cells of human colon. American Journal of Physiology Gastrointestinal Liver
Physiology, 291, G792-G802.
Saris, W. H. M. & Foster, G. D. 2006. Simple carbohydrates and obesity: Fact,
Fiction and Future. International Journal Obesity, 30, S1-S3.
Schiffman, S. S., Booth, B. J., Sattely-Miller, E. A., Graham, B. G. & Gibes, K. M.
1999. Selective Inhibition of Sweetness by the Sodium Salt of {+/-}2-(4-
Methoxyphenoxy)propanoic Acid. Chemical Senses, 24, 439-447.
Schirra, J., Katschinski, M., Weidmann, C., Schafer, T., Wank, U., Arnold, R. &
Goke, B. 1996. Gastric emptying and release of incretin hormones after
glucose ingestion in humans. The Journal of Clinical Investigation, 97, 92-
103.
Schloegl, H., Percik, R., Horstmann, A., Villringer, A. & Stumvoll, M. 2011. Peptide
hormones regulating appetite—focus on neuroimaging studies in humans.
Diabetes/Metabolism Research and Reviews, 27, 104-112.
Schwartz, G. J. 2000. The role of gastrointestinal vagal afferents in the control of
food intake: current prospects. Nutrition, 16, 866-873.
Sclafani, A. 2007. Sweet taste signaling in the gut. Proceedings of the National
Academy of Sciences, 104, 14887-14888.
Sclafani, A. & Ackroff, K. 2012. Invited Review: The role of gut nutrient sensing in
stimulating appetite and conditioning food preferences. American Journal of
Physiology Regulatory Integrative and Comparative Physiology, 302, 1119-
1133.
Sclafani, A. & Pérez, C. 1997. Cypha(TM) [Propionic acid, 2-(4-methoxyphenol)
salt] inhibits sweet taste in humans, but not in rats. Physiology and Behavior,
61, 25-29.
198
Shirazi-Beechey, S. P., Moran, A. W., Batchelor, D. J., Daly, K. & Al-Rammahi, M.
2011. Glucose sensing and signalling; regulation of intestinal glucose
transport. Proceedings of the Nutrition Society, 70, 185-193.
Shyangdan, D., Royle, P., Clar, C., Sharma, P. & Waugh, N. 2010. Glucagon-like
peptide analogues for type 2 diabetes mellitus: systematic review and meta-
analysis. BMC Endocrine Disorders, 10, 1-26.
Simpson, E. J., Nixon, A. V., Taylor, A. J. & Macdonald, I. A. 2009. The sweetness
inhibitor Lactisole attenuates postprandial hyperglycaemia. Proceedings of
the Nutrition Society, 68.
Small, D. M. 2012. Flavor is in the brain. Physiology & Behavior, 107, 540-552.
Small, D. M., Bender, G., Veldhuizen, M. G., Rudenga, K., Nachtigal, D. & Felsted,
J. 2007. The Role of the Human Orbitofrontal Cortex in Taste and Flavor
Processing. Annals of the New York Academy of Sciences, 1121, 136-151.
Smeets, P. a. M., De Graaf, C., Stafleu, A., Van Osch, M. J. P. & Van Der Grond, J.
2005a. Functional magnetic resonance imaging of human hypothalamic
responses to sweet taste and calories. The American Journal of Clinical
Nutrition, 82, 1011-1016.
Smeets, P. a. M., De Graaf, C., Stafleu, A., Van Osch, M. J. P. & Van Der Grond, J.
2005b. Functional MRI of human hypothalamic responses following glucose
ingestion. NeuroImage, 24, 363-368.
Smeets, P. a. M., Erkner, A. & De Graaf, C. 2010. Cephalic phase responses and
appetite. Nutrition Reviews, 68, 643-655.
Smeets, P. a. M., Vidarsdottir, S., De Graaf, C., Stafleu, A., Van Osch, M. J. P.,
Viergever, M. A., Pijl, H. & Van Der Grond, J. 2007. Oral glucose intake
inhibits hypothalamic neuronal activity more effectively than glucose
infusion. American Journal of Physiology - Endocrinology And Metabolism,
293, E754-E758.
Smeets, P. a. M., Weijzen, P., De Graaf, C. & Viergever, M. A. 2011. Consumption
of caloric and non-caloric versions of a soft drink differentially affects brain
activation during tasting. NeuroImage, 54, 1367-1374.
Sorensen, L. B., Moller, P., Flint, A., Martens, M. & Raben, A. 2003. Effect of
sensory perception of foods on appetite and food intake: a review of studies
on humans. International Journal of Obesity and Related Metabolic
Disorders, 27, 1152-1166.
Stanley, S., Wynne, K. & Bloom, S. 2004. Gastrointestinal Satiety Signals III.
Glucagon-like peptide 1, oxyntomodulin, peptide YY, and pancreatic
polypeptide. American Journal of Physiology Gastrointestal Liver
Physiology, 286, G693-697.
Steere, J. & Cooper, P. J. 1993. The effects on eating of dietary restraint, anxiety, and
hunger. The International journal of eating disorders, 13, 211-219.
Steinert, R. E. & Beglinger, C. 2011. Nutrient sensing in the gut: interactions
between chemosensory cells, visceral afferents and the secretion of satiation
peptides. Physiology and Behavior, 105, 62-70.
Steinert, R. E., Frey, F., Antonia.Töpfer, Drewe, J. & Beglinger, C. 2011. Effects of
carbohydrate sugars and artificial sweeteners on appetite and the secretion of
gastrointestinal satiety peptides. British Journal of Nutrition, 105 1320-1328
Sternini, C. a. B., Anselmi, L. A. & Rozengurt, E. A. 2008. Enteroendocrine cells: a
site of 'taste' in gastrointestinal chemosensing. Current Opinion in
Endocrinology, Diabetes & Obesity, 15, 73-78.
Stubbs, R. J., Hughes, D. A., Johnstone, A. M., Rowley, E., Reid, C., Elia, M.,
Stratton, R., Delargy, H., King, N. & Blundell, J. E. 2000. The use of visual

199
analogue scales to assess motivation to eat in human subjects: a review of
their reliability and validity with an evaluation of new hand-held
computerized systems for temporal tracking of appetite ratings. British
Journal of Nutrition, 84, 405-415.
Stunkard, A. J. & Messick, S. 1985. The three-factor eating questionnaire to measure
dietary restraint, disinhibition and hunger. Journal of Psychosomatic
Research, 29, 71-83.
Suzuki, K., Jayasena, C. N. & Bloom, S. R. 2012. Obesity and Appetite Control.
Experimental Diabetes Research, 2012, 19.
Suzuki, K., Simpson, K. A., Minnion, J. S., Shillito, J. C. & Bloom, S. R. 2010. The
role of gut hormones and the hypothalamus in appetite regulation. Endocrine
Journal, 57, 359-372.
Trueman, P., Haynes, S. M., Felicity Lyons, G., Louise Mccombie, E., Mcquigg, M.
S. A., Mongia, S., Noble, P. A., Quinn, M. F., Ross, H. M., Thompson, F.,
Broom, J. I., Laws, R. A., Reckless, J. P. D., Kumar, S., Lean, M. E. J., Frost,
G. S., Finer, N., Haslam, D. W., Morrison, D. & Sloan, B. 2010. Long-term
cost-effectiveness of weight management in primary care. International
Journal of Clinical Practice, 64, 775-783.
Tsurugizawa, T., Uematsu, A., Nakamura, E., Hasumura, M., Hirota, M., Kondoh,
T., Uneyama, H. & Torii, K. 2009. Mechanisms of Neural Response to
Gastrointestinal Nutritive Stimuli: The Gut-Brain Axis. Gastroenterology,
137, 262-273.
Vartanian, L. R., Schwartz, M. B. & Brownell, K. D. 2007. Effects of Soft Drink
Consumption on Nutrition and Health: A Systematic Review and Meta-
Analysis. American Journal of Public Health, 97, 667-675.
Verdich, C., Flint, A., Gutzwiller, J. P., Naslund, E., Beglinger, C., Hellstrom, P. M.,
Long, S. J., Morgan, L. M., Holst, J. J. & Astrup, A. 2001. A Meta-Analysis
of the Effect of Glucagon-Like Peptide-1 (7-36) Amide on Ad Libitum
Energy Intake in Humans. Journal of Clinical Endocrinology and
Metabolism, 86, 4382-4389.
Vidarsdottir, S., Smeets, P. a. M., Eichelsheim, D. L., Van Osch, M. J. P., Viergever,
M. A., Romijn, J. A., Van Der Grond, J. & Pijl, H. 2007. Glucose Ingestion
Fails to Inhibit Hypothalamic Neuronal Activity in Patients With Type 2
Diabetes. Diabetes, 56, 2547-2550.
Vilsbøll, T., Christensen, M., Junker, A. E., Knop, F. K. & Gluud, L. L. 2012.
Effects of glucagon-like peptide-1 receptor agonists on weight loss:
systematic review and meta-analyses of randomised controlled trials. British
Medical Journal, 344.
Welch, I. M., Sepple, C. P. & Read, N. W. 1988. Comparisons of the effects on
satiety and eating behaviour of infusion of lipid into the different regions of
the small intestine. Gut, 29, 306-311.
Wijlens, A. G. M., Erkner, A., Alexander, E., Mars, M., Smeets, P. a. M. & De
Graaf, C. 2012. Effects of Oral and Gastric Stimulation on Appetite and
Energy Intake. Obesity, 20, 2226-2232.
Wren, A. M. & Bloom, S. R. 2007. Gut Hormones and Appetite Control.
Gastroenterology, 132, 2116-2130.
Wynne, K., Park, A. J., Small, C. J., Patterson, M., Ellis, S. M., Murphy, K. G.,
Wren, A. M., Frost, G. S., Meeran, K., Ghatei, M. A. & Bloom, S. R. 2005.
Subcutaneous Oxyntomodulin Reduces Body Weight in Overweight and
Obese Subjects: A Double-Blind, Randomized, Controlled Trial. Diabetes,
54, 2390-2395.
200
Yeomans, M. R. 2006. Olfactory influences on appetite and satiety in humans.
Physiology and Behavior, 87, 800-804.
Yeomans, M. R., Tovey, H. M., Tinley, E. M. & Haynes, C. J. 2003. Effects of
manipulated palatability on appetite depend on restraint and disinhibition
scores from the Three-Factor Eating Questionnaire. International Journal of
Obesity Related Metabolic Disorders, 28, 144-151.
Young, R. L. 2011. Sensing via intestinal sweet taste pathways. Frontiers in
Neuroscience, 5.
Young, R. L., Chia, B., Isaacs, N. J., Ma, J., Khoo, J., Wu, T., Horowitz, M. &
Rayner, C. K. 2013. Disordered control of intestinal sweet taste receptor
expression and glucose absorption in type 2 diabetes. Diabetes.
Young, R. L., Sutherland, K., Pezos, N., Brierley, S. M., Horowitz, M., Rayner, C.
K. & Blackshaw, L. A. 2009. Expression of taste molecules in the upper
gastrointestinal tract in humans with and without type 2 diabetes. Gut, 58,
337-346.
Zheng, Y. & Sarr, M. 2013. Effect of the Artificial Sweetener, Acesulfame
Potassium, a Sweet Taste Receptor Agonist, on Glucose Uptake in Small
Intestinal Cell Lines. Journal of Gastrointestinal Surgery, 17, 153-158.
201
Appendix I
Participant Name : ………………………………………………Code :................
PERSONAL DETAILS
Contact Address: ……………………………………………….
……………………………………………….
……………………………………………….
Contact details: (home tel): ……………………………
(work tel): ……………………………
(mobile): ……………………………
(email): ……………………………
DOB: ….……/…….…/……….
Sex: Male Female

202
Appendix II
Participant code: ……………….. Date completed: …….../ ………./……..
DOB: ………./………./ ………. Age:..............
Weight……….. Height: ………….. BMI: ...................
Please answer the following questions to the best of your knowledge.
If you are unsure about any question please ask the researcher.
Thank you
Has your body weight been stable over the last 3 months?
Yes No
If you answered no please indicate whether your weight has increased or decreased
over the last 3 months and please state the approximate amount:
……………… Kg / stone/ lbs * Gain Loss
*Please delete as appropriate
Have you dieted in the past in order to lose weight?
Yes No
If yes please specify the last time:
…………………………………………………………………………………………
………………………………
How much weight did you lose?
…………………………………………………………………………………………
………………………………

203
Are you currently taking any medication other than the contraceptive pill?
Yes No
If yes please give details:
…………………………………………………………………………………………
…………………………………………………………………………………………
………………………………………………………………
Females: Are you pregnant or currently breastfeeding?
Yes No
Are you currently taking any dietary supplements i.e. multivitamins, cod liver oil?
Yes No
If yes please give details:
…………………………………………………………………………………………
………………………………………………………………………………….............
............................................
Are you currently or have you ever suffered from any of the following;
Breathing problems i.e. Asthma, exercise induced bronchospasm
Yes No
If yes please give details:
…………………………………………………………………………………………
…………………………………………………………………………………………
………………………………………………………………
204
Gastrointestinal disorders
Yes No
If yes please give details:
.........................................................................................................................................
........................................................................................................................................
Cardiovascular Disease i.e. Angina, heart attack, stroke or hypertension
Yes No
If yes please give details:
…………………………………………………………………………………………
…………………………………………………………………………………………
Metabolic Disease i.e. diabetes, hypothyroidism
Yes No
If yes please give details:
…………………………………………………………………………………………
…………………………………………………………………………………………
Epilepsy or nervous disorder
Yes No
If yes please give details:
…………………………………………………………………………………………
…………………………………………………………………………………………
205
Have you taken part in any other research in within the last 3 months?
Yes No
If yes please give details:
…………………………………………………………………………………………
…………………………………………………………………………………………
Do you smoke tobacco/ cigarettes?
Yes No
If yes please give details:
…………………………………………………………………………………………
…………………………………………………………………………………………
If no have you ever smoked?
Never Gave up ………. years ago
Do you suffer from any food allergies or intolerance? i.e. celiac disease, lactose
intolerance.
Yes No
If yes please give details:
…………………………………………………………………………………………
…………………………………………………………………………………………
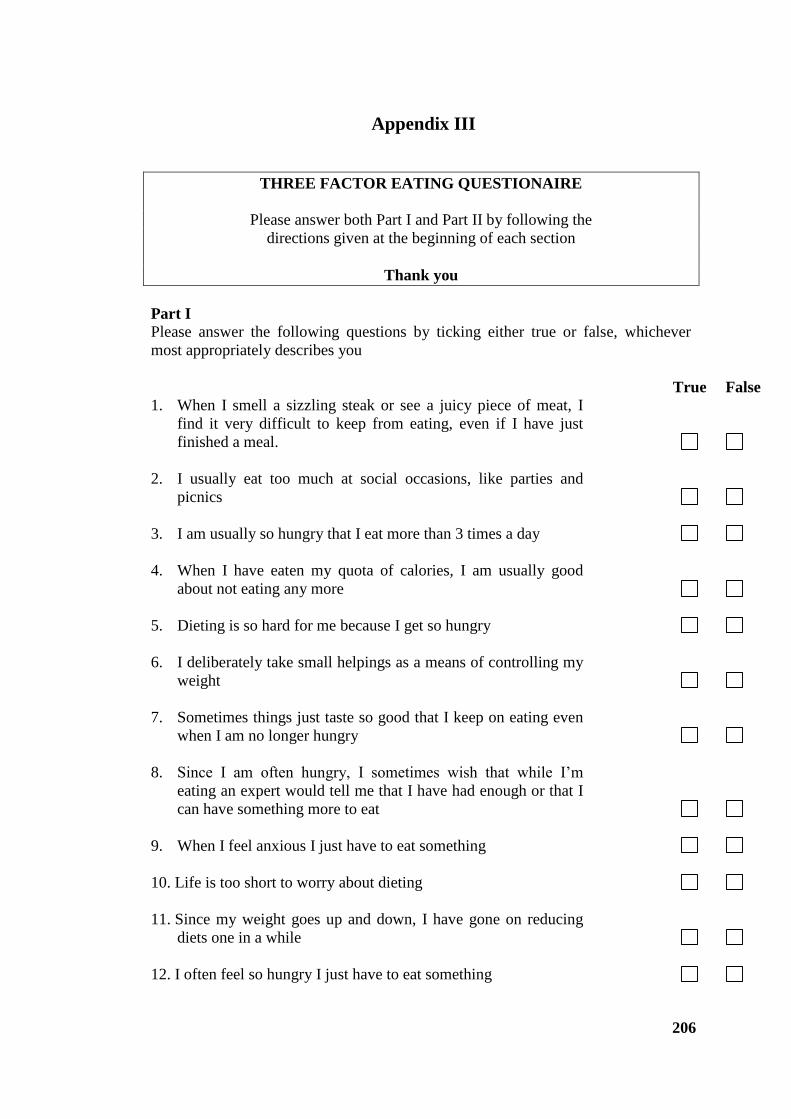
206
Appendix III
THREE FACTOR EATING QUESTIONAIRE
Please answer both Part I and Part II by following the
directions given at the beginning of each section
Thank you
Part I
Please answer the following questions by ticking either true or false, whichever
most appropriately describes you
True False
1. When I smell a sizzling steak or see a juicy piece of meat, I
find it very difficult to keep from eating, even if I have just
finished a meal.
2. I usually eat too much at social occasions, like parties and
picnics
3. I am usually so hungry that I eat more than 3 times a day
4. When I have eaten my quota of calories, I am usually good
about not eating any more
5. Dieting is so hard for me because I get so hungry
6. I deliberately take small helpings as a means of controlling my
weight
7. Sometimes things just taste so good that I keep on eating even
when I am no longer hungry
8. Since I am often hungry, I sometimes wish that while I’m
eating an expert would tell me that I have had enough or that I
can have something more to eat
9. When I feel anxious I just have to eat something
10. Life is too short to worry about dieting
11. Since my weight goes up and down, I have gone on reducing
diets one in a while
12. I often feel so hungry I just have to eat something
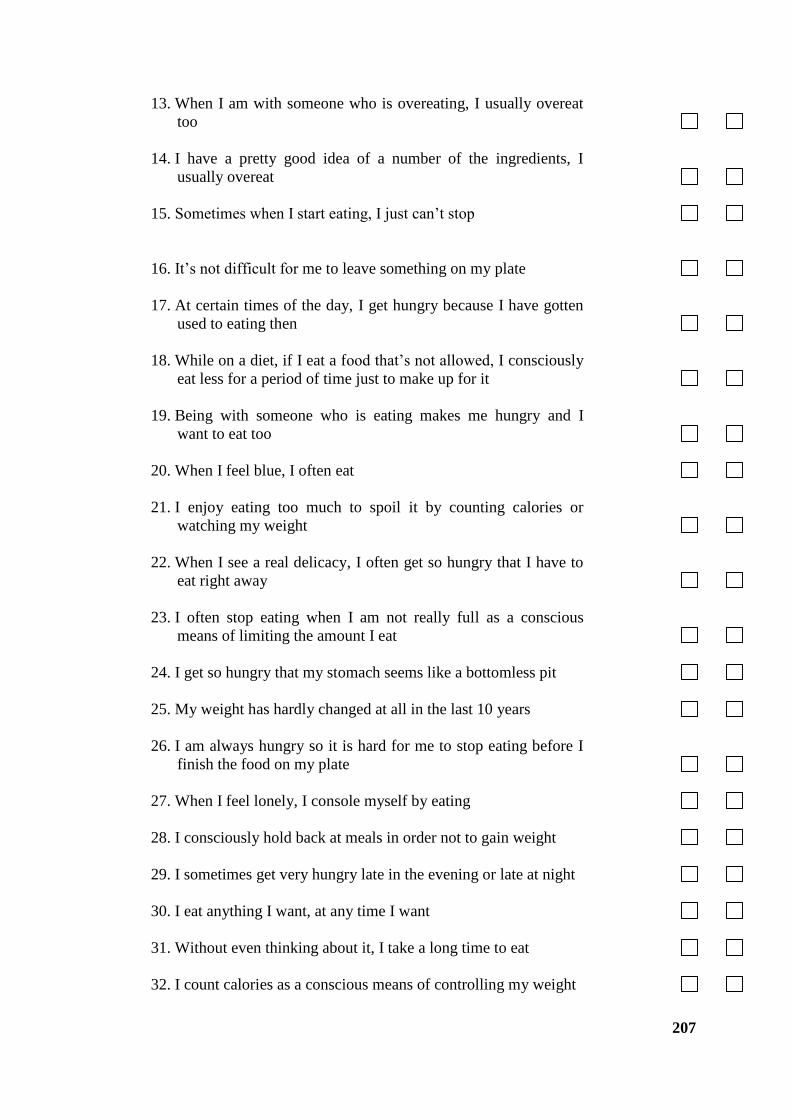
207
13. When I am with someone who is overeating, I usually overeat
too
14. I have a pretty good idea of a number of the ingredients, I
usually overeat
15. Sometimes when I start eating, I just can’t stop
16. It’s not difficult for me to leave something on my plate
17. At certain times of the day, I get hungry because I have gotten
used to eating then
18. While on a diet, if I eat a food that’s not allowed, I consciously
eat less for a period of time just to make up for it
19. Being with someone who is eating makes me hungry and I
want to eat too
20. When I feel blue, I often eat
21. I enjoy eating too much to spoil it by counting calories or
watching my weight
22. When I see a real delicacy, I often get so hungry that I have to
eat right away
23. I often stop eating when I am not really full as a conscious
means of limiting the amount I eat
24. I get so hungry that my stomach seems like a bottomless pit
25. My weight has hardly changed at all in the last 10 years
26. I am always hungry so it is hard for me to stop eating before I
finish the food on my plate
27. When I feel lonely, I console myself by eating
28. I consciously hold back at meals in order not to gain weight
29. I sometimes get very hungry late in the evening or late at night
30. I eat anything I want, at any time I want
31. Without even thinking about it, I take a long time to eat
32. I count calories as a conscious means of controlling my weight

208
33. I do not eat some foods because they make me fat
34. I am always hungry enough to eat at any time
35. I pay a great deal of attention to changes in my figure
36. While on a diet if I eat a food that is not allowed, I often
splurge and eat other high calorie foods
Part II
Please answer the following questions by circling the number
above the response that is most appropriate to you
37. How often are you dieting in conscious effort to control your weight?
1 2 3 4
rarely sometimes usually always
38. Would a weight fluctuation of 5lbs affect the way you live your life?
1 2 3 4
rarely sometimes usually always
39. How often do you feel hungry?
1 2 3 4
rarely sometimes usually always
40. Do your feelings of guilt about overeating help you control your food intake?
1 2 3 4
rarely sometimes usually always
41. How difficult would it be for you to stop eating halfway through dinner and not
eat for the next four hours?
1 2 3 4
rarely sometimes usually always
42. How conscious are you of what you are eating?
1 2 3 4
rarely sometimes usually always
43. How frequently do you avoid ‘stocking up’ on tempting foods?
1 2 3 4
rarely sometimes usually always
44. How likely are you to shop for low calorie foods?
1 2 3 4
rarely sometimes usually always
45. Do you eat sensibly in front of others and splurge when alone?
1 2 3 4
rarely sometimes usually always

209
46. How likely are you to consciously eat slowly in order to cut down on how much
you eat?
1 2 3 4
rarely sometimes usually always
47. How frequently do you skip dessert because you are no longer hungry?
1 2 3 4
rarely sometimes usually always
48. How likely are you to consciously eat less than you want?
1 2 3 4
rarely sometimes usually always
49. Do you go on eating binges even though you are not hungry?
1 2 3 4
rarely sometimes usually always
50. On a scale of 0 to 5, where 0 means no restraint (eating whatever you want
whenever you want it) and 5 means total restraint (constantly limiting food
intake and never ‘giving in’) what number would you give yourself
0
eat whatever you want, whenever you want
1
usually eat whatever you want, whenever you want it
2
often eat whatever you want, whenever you want it
3
often limit food intake, but often ‘give in’
4
often limit food intake, but rarely ‘give in’
5
constantly limiting food intake, never ‘giving in’
51. To what extent does this statement describe your eating behaviour?
“ I start dieting in the morning, but because of any number of things happen during
the day, by evening I have given up and eat what I want, promising myself to start
dieting again tomorrow”
1 2 3 4
Not like me little like me pretty good describes me
description of me perfectly
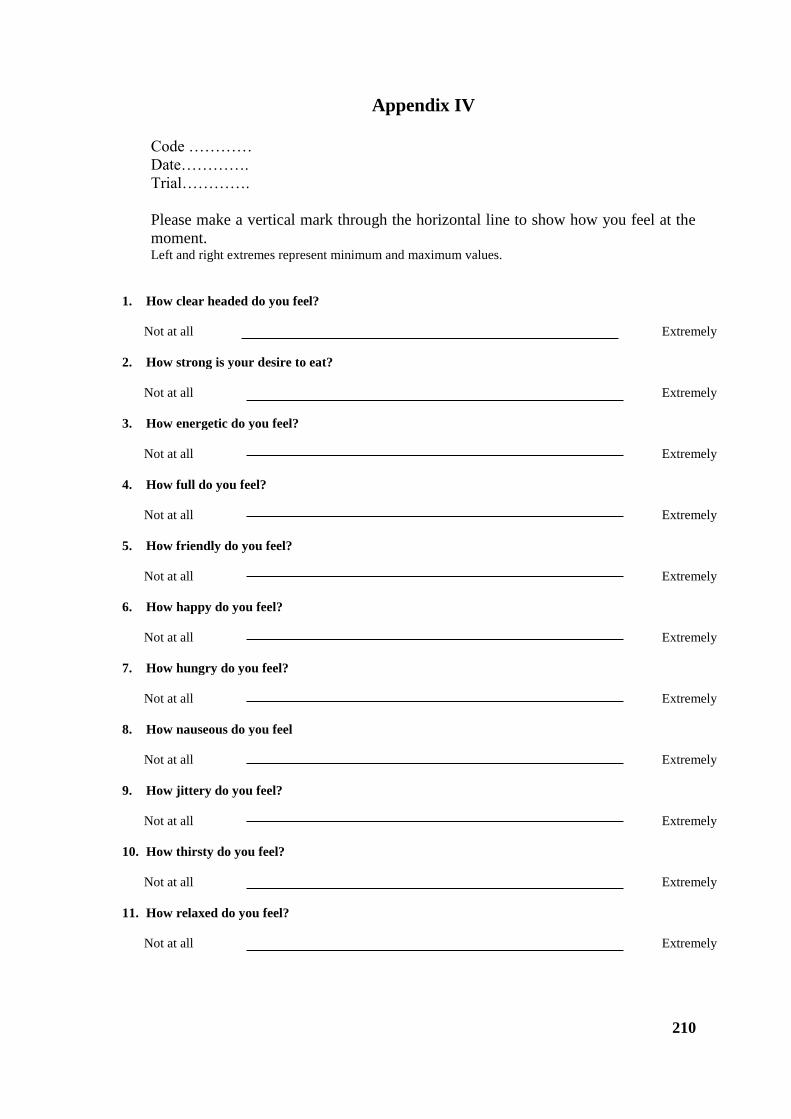
210
Appendix IV
Code …………
Date………….
Trial………….
Please make a vertical mark through the horizontal line to show how you feel at the
moment. Left and right extremes represent minimum and maximum values.
1. How clear headed do you feel?
Not at all
Extremely
2. How strong is your desire to eat?
Not at all
Extremely
3. How energetic do you feel?
Not at all
Extremely
4. How full do you feel?
Not at all
Extremely
5. How friendly do you feel?
Not at all
Extremely
6. How happy do you feel?
Not at all
Extremely
7. How hungry do you feel?
Not at all
Extremely
8. How nauseous do you feel
Not at all
Extremely
9. How jittery do you feel?
Not at all
Extremely
10. How thirsty do you feel?
Not at all
Extremely
11. How relaxed do you feel?
Not at all
Extremely

211
Appendix V
Code …………
Date………….
Trial………….
Please make a vertical mark through the horizontal line to show how you feel at the
moment.
Left and right extremes represent minimum and maximum values.
1. How creamy is the drink?
Not at all
Extremely
2. How pleasant is the drink?
Not at all
Extremely
3. How fruity is the drink?
Not at all
Extremely
4. How salty is the drink?
Not at all
Extremely
5. How strong is the drink?
Not at all
Extremely
6. How sweet is the drink?
Not at all
Extremely
7. How bitter is the drink?
Not at all
Extremely
8. How sour is the drink?
Not at all
Extremely

212
Appendix VI
MAGNETIC RESONANCE IMAGING PATIENT DECLARATION
THIS MUST BE COMPLETED BEFORE EXAMINATION COMMENCES
INVESTIGATOR USE: Participant ID
Please answer the following questions by deleting yes/no as relevant:
1) Do you have a pacemaker or artificial heart valve? YES/NO
2) Have you ever had heart surgery? YES/NO
3) Do you have a hydrocephalus shunt? YES/NO
If yes, is it a programmable shunt? YES/NO
4) Have you had any operations on your head? YES/NO
5) Have you had any surgery to your head or body within the last 2 months?
YES/NO
6) Do you have any joint replacements or metal implants? YES/NO
7) Have you EVER had metal in your eyes or worked with metal at high speed?
YES/NO
8) Do you have any shrapnel from a war injury? YES/NO
9) Do you wear a false limb, calliper or brace? YES/NO
10) Do you have dentures, a dental plate of a hearing aid? YES/NO
11) Do you have a hearing aid of any kind (including a cochlear implant)?
YES/NO
12) Have you suffered from epilepsy or blackouts? YES/NO
13) Are you currently wearing a home detention curfew tag? YES/NO
PLEASE NOTE: If you answered YES to any questions above, please
contact one of the researchers before arranging a trial visit.
For FEMALE PARTICIPANTS OF CHILD BEARING AGE ONLY:
1) Is it possible that you may be pregnant? YES/NO
2) Are your breastfeeding? YES/NO
3) Do you have any intrauterine contraceptive device or coil? YES/NO
I confirm that I have read the above questions and that the answers are correct to the
best of my knowledge and belief:
Name: Date:
If you are suitable for inclusion in the study, you will be asked by the radiographer present at your trial appointments to
complete this form again and they will make the ultimate decision about whether to proceed with MRI scanning.