Embed Size (px)
Citation preview

Disruptive Demographics: Implications for K-12 and Higher
Education in Alabama
February 2014
James H. Johnson, Jr.
Allan Parnell Frank Hawkins Kenan Institute of Private Enterprise
Kenan-Flagler Business School University of North Carolina at Chapel Hill

OVERVIEW
• Demographic Trends
• Challenges & Opportunities
• Discussion

what
February 2014
CENSUS 2010will REVEAL

6 DISRUPTIVE TRENDS
• The South Rises – Again• The Browning of America• Marrying Out is “In”• The Silver Tsunami is About to Hit• The End of Men?• Cooling Water from Grandma’s Well…
and Grandpa’s Too!
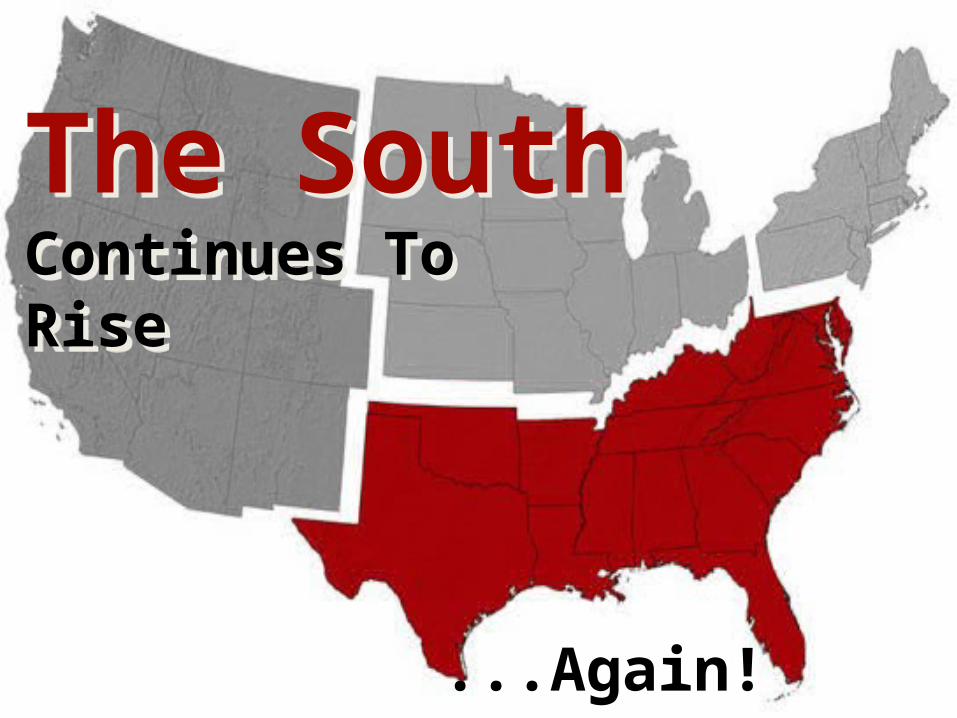
The South Continues To Rise
The South Continues To Rise
...Again!
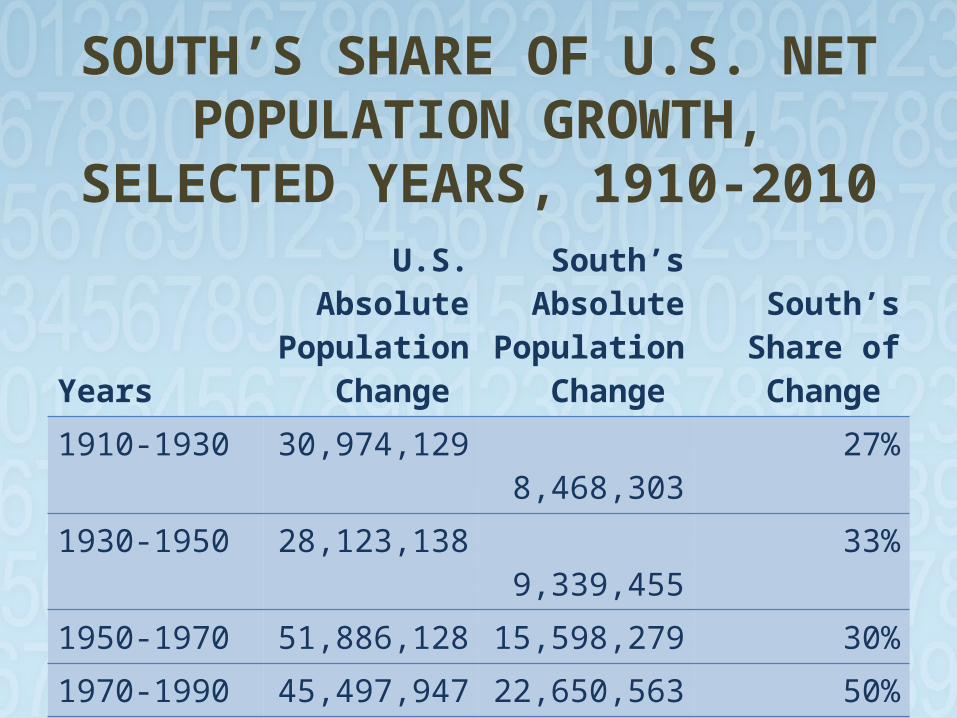
SOUTH’S SHARE OF U.S. NET POPULATION GROWTH,
SELECTED YEARS, 1910-2010
Years
U.S. Absolute Population
Change
South’s Absolute
Population Change
South’s Share of Change
1910-1930 30,974,129 8,468,303 27%1930-1950 28,123,138 9,339,455 33%1950-1970 51,886,128 15,598,279 30%1970-1990 45,497,947 22,650,563 50%1990-2010 60,035,665 29,104,814 49%
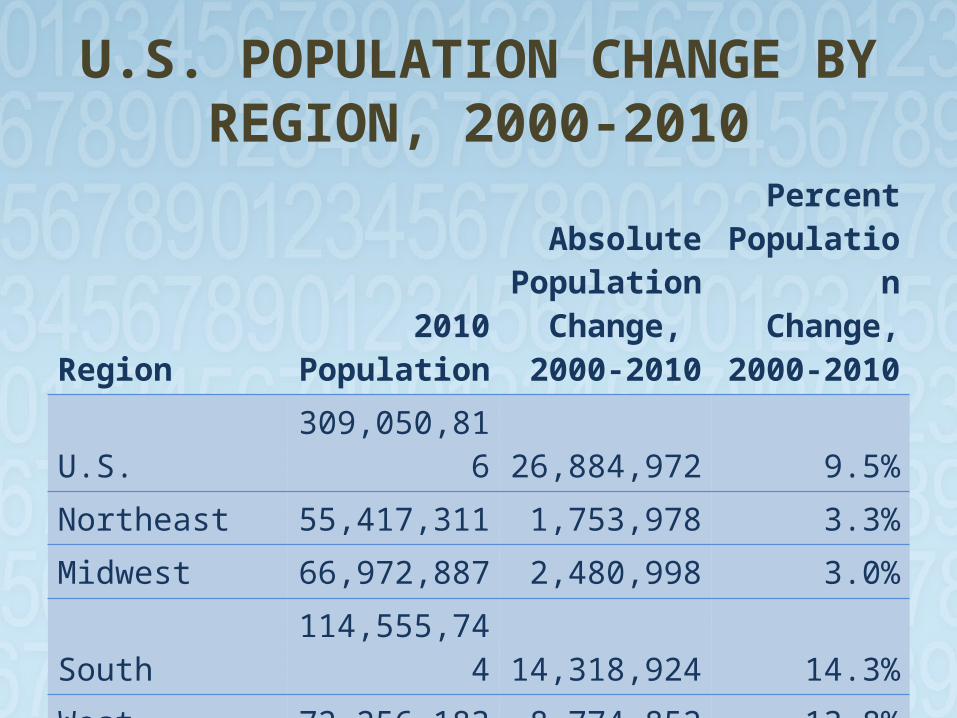
U.S. POPULATION CHANGE BY REGION, 2000-2010
Region2010
Population
AbsolutePopulation
Change, 2000-2010
PercentPopulation
Change,2000-2010
U.S. 309,050,816 26,884,972 9.5%
Northeast 55,417,311 1,753,978 3.3%
Midwest 66,972,887 2,480,998 3.0%
South 114,555,744 14,318,924 14.3%
West 72,256,183 8,774,852 13.8%
Alabama 4,779,736 332,636 7.5%
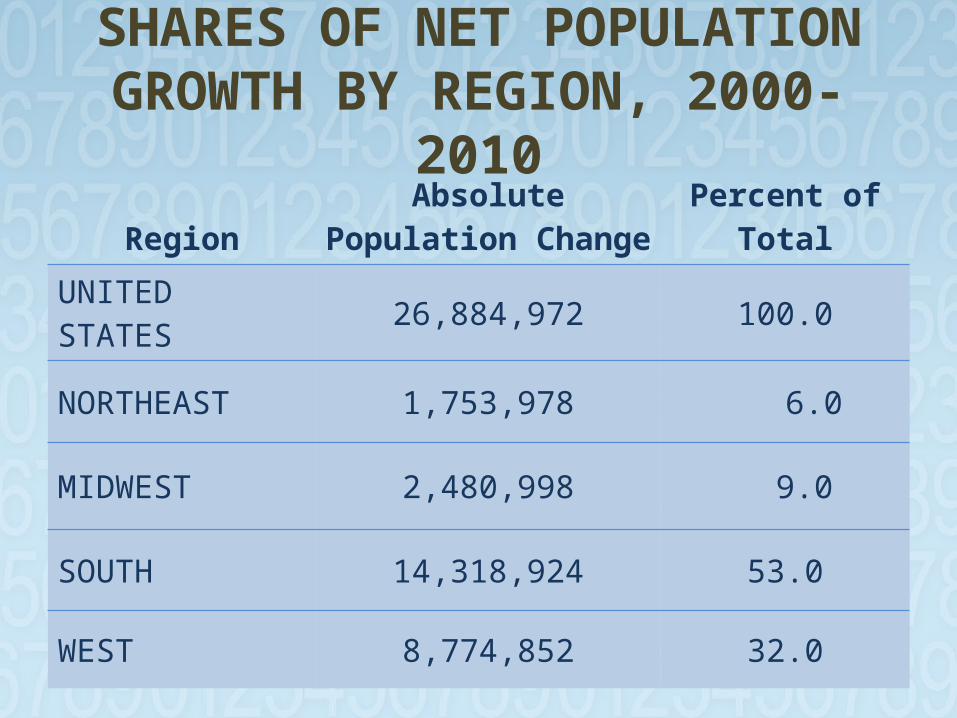
SHARES OF NET POPULATION GROWTH BY
REGION, 2000-2010Region
Absolute Population Change Percent of Total
UNITED STATES 26,884,972 100.0
NORTHEAST 1,753,978 6.0
MIDWEST 2,480,998 9.0
SOUTH 14,318,924 53.0
WEST 8,774,852 32.0
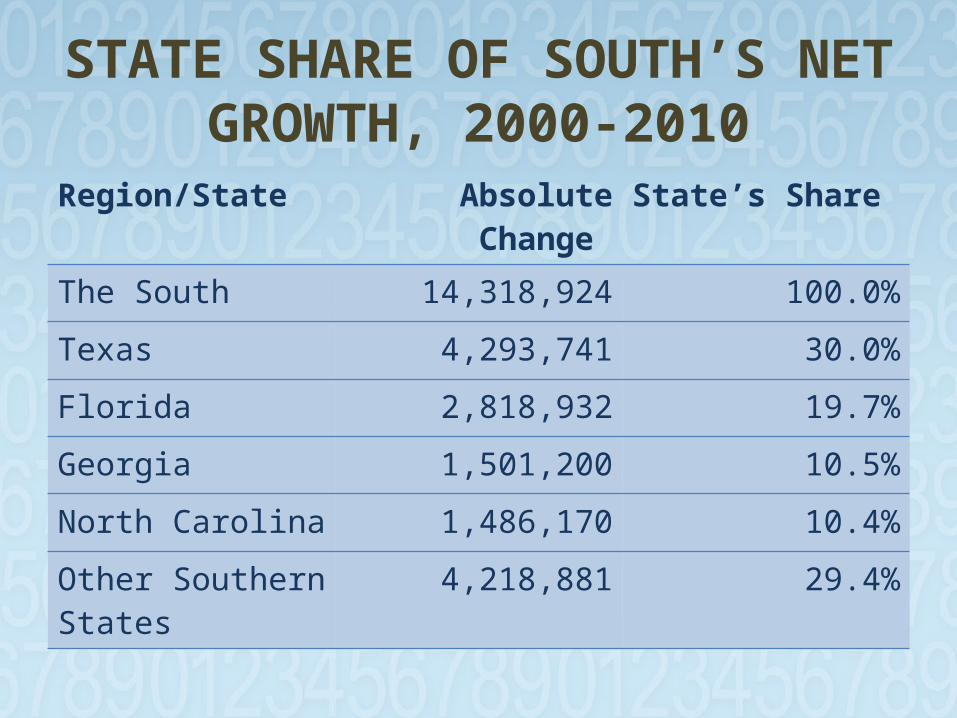
STATE SHARE OF SOUTH’S NET GROWTH, 2000-2010
Region/State Absolute Change State’s Share
The South 14,318,924 100.0%
Texas 4,293,741 30.0%
Florida 2,818,932 19.7%
Georgia 1,501,200 10.5%
North Carolina 1,486,170 10.4%
Other Southern States 4,218,881 29.4%
Migration-Induced Population Change
Domestic and International
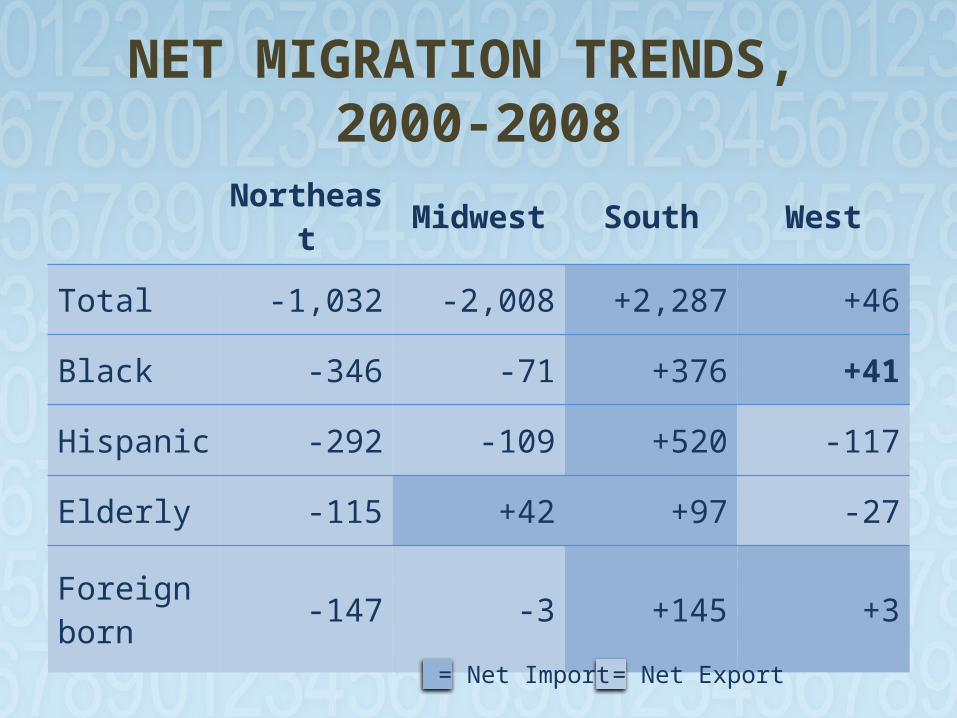
NET MIGRATION TRENDS, 2000-2008
Northeast Midwest South West
Total -1,032 -2,008 +2,287 +46
Black -346 -71 +376 +41
Hispanic -292 -109 +520 -117
Elderly -115 +42 +97 -27
Foreign born -147 -3 +145 +3
= Net Import = Net Export
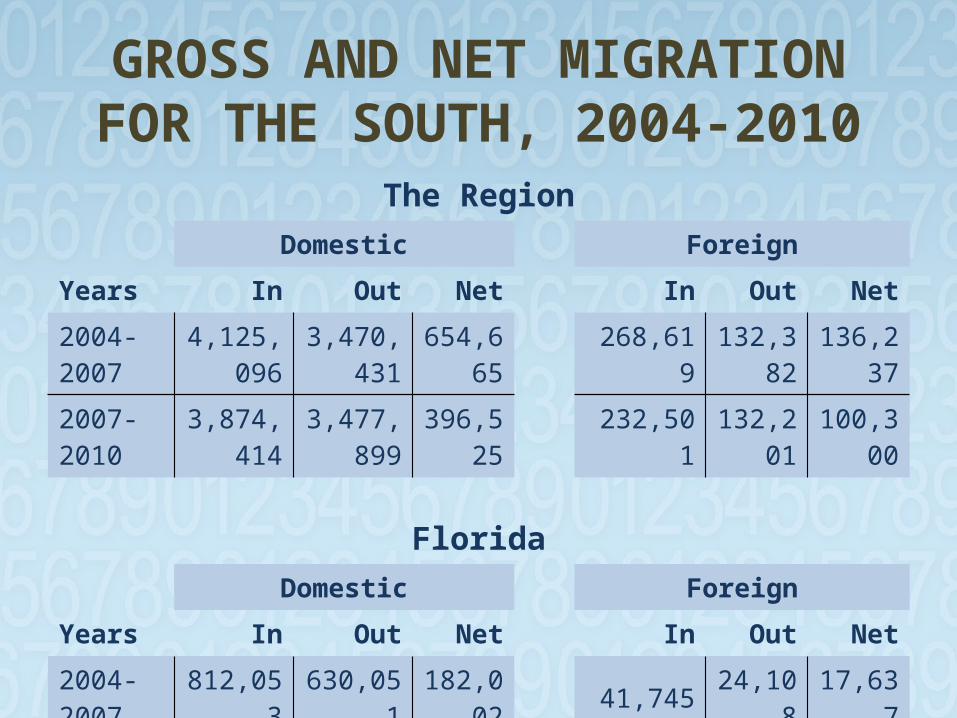
GROSS AND NET MIGRATION FOR THE SOUTH, 2004-2010
The RegionDomestic Foreign
Years In Out Net In Out Net2004-2007 4,125,096 3,470,431 654,665 268,619 132,382 136,2372007-2010 3,874,414 3,477,899 396,525 232,501 132,201 100,300
FloridaDomestic Foreign
Years In Out Net In Out Net2004-2007 812,053 630,051 182,002 41,745 24,108 17,6372007-2010 654,931 668,087 -13,156 33,095 32,094 1,001
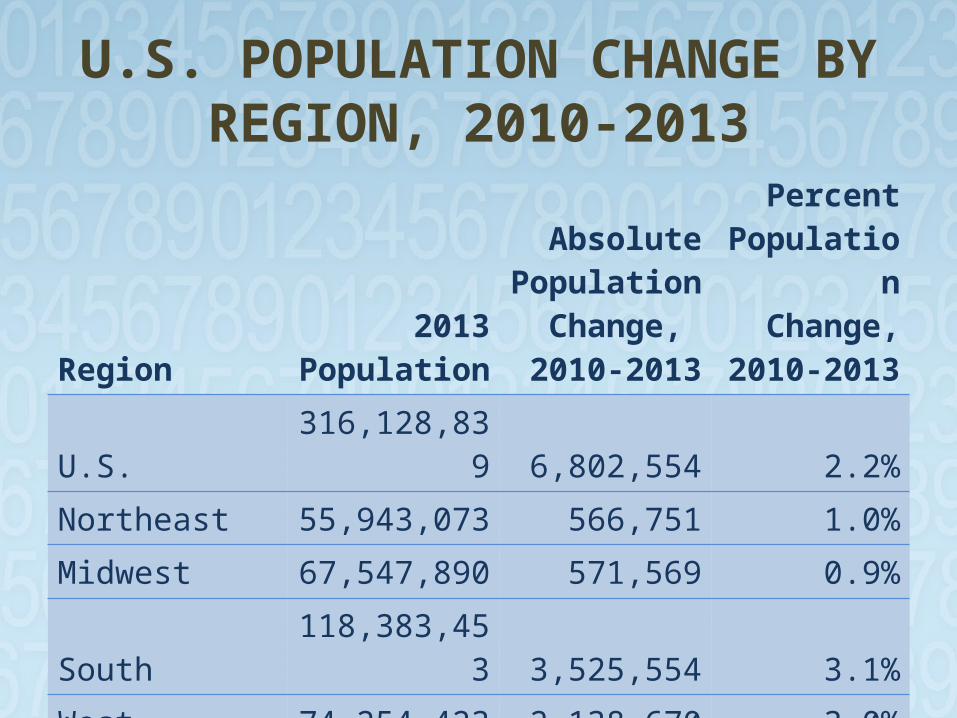
U.S. POPULATION CHANGE BY REGION, 2010-2013
Region2013
Population
AbsolutePopulation
Change, 2010-2013
PercentPopulation
Change,2010-2013
U.S. 316,128,839 6,802,554 2.2%
Northeast 55,943,073 566,751 1.0%
Midwest 67,547,890 571,569 0.9%
South 118,383,453 3,525,554 3.1%
West 74,254,423 2,138,670 3.0%
Alabama 4,883,722 53,986 1.1%
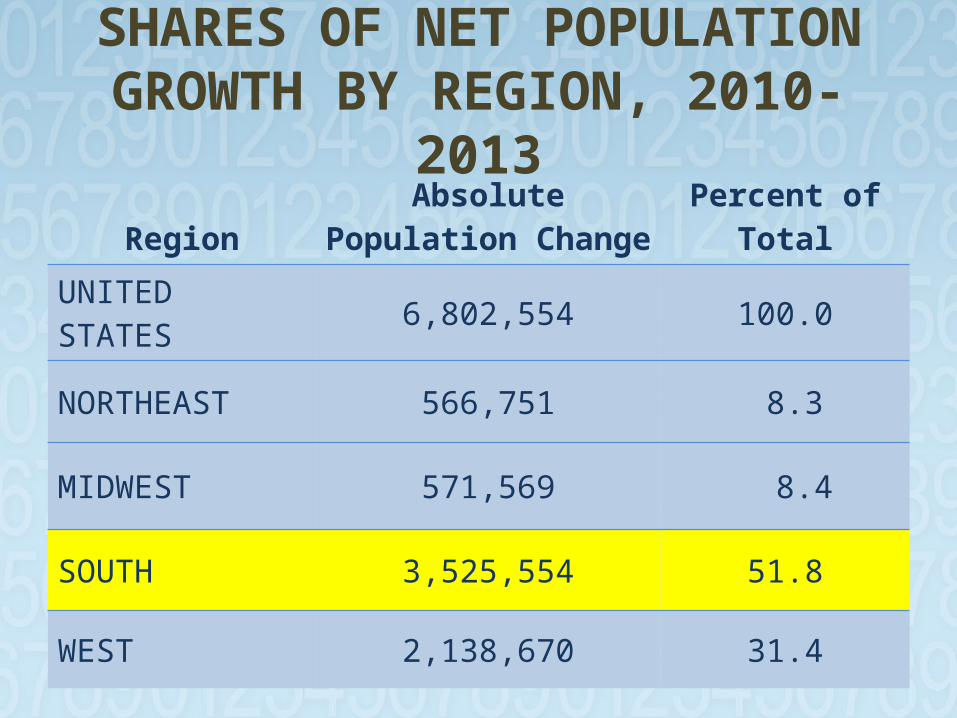
SHARES OF NET POPULATION GROWTH BY
REGION, 2010-2013Region
Absolute Population Change Percent of Total
UNITED STATES 6,802,554 100.0
NORTHEAST 566,751 8.3
MIDWEST 571,569 8.4
SOUTH 3,525,554 51.8
WEST 2,138,670 31.4
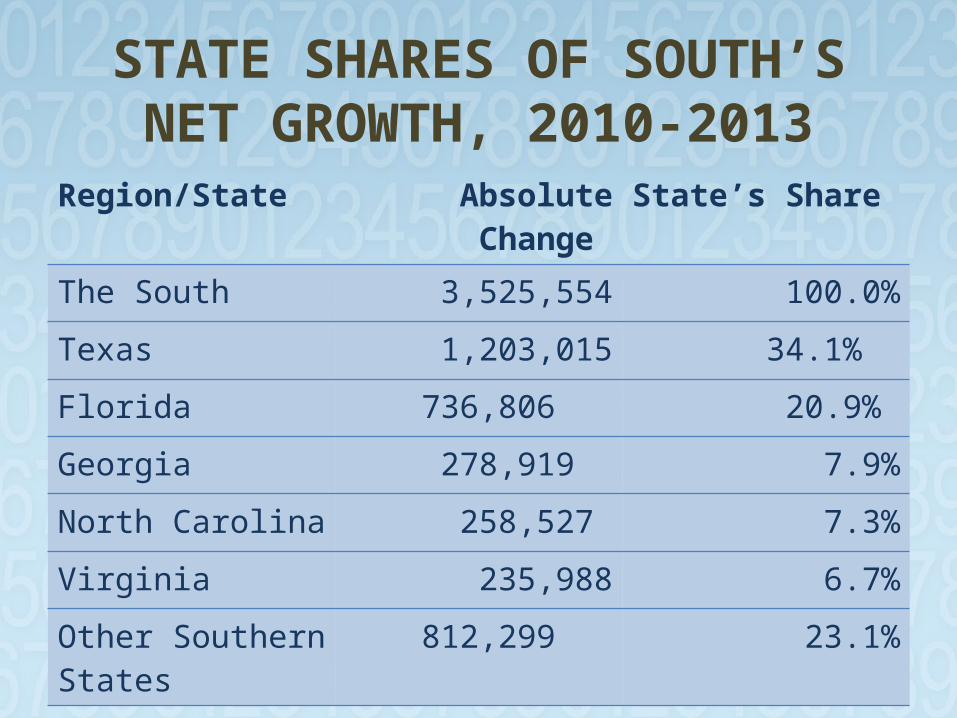
STATE SHARES OF SOUTH’S NET GROWTH, 2010-2013
Region/State Absolute Change State’s Share
The South 3,525,554 100.0%
Texas 1,203,015 34.1%
Florida 736,806 20.9%
Georgia 278,919 7.9%
North Carolina 258,527 7.3%
Virginia 235,988 6.7%
Other Southern States 812,299 23.1%

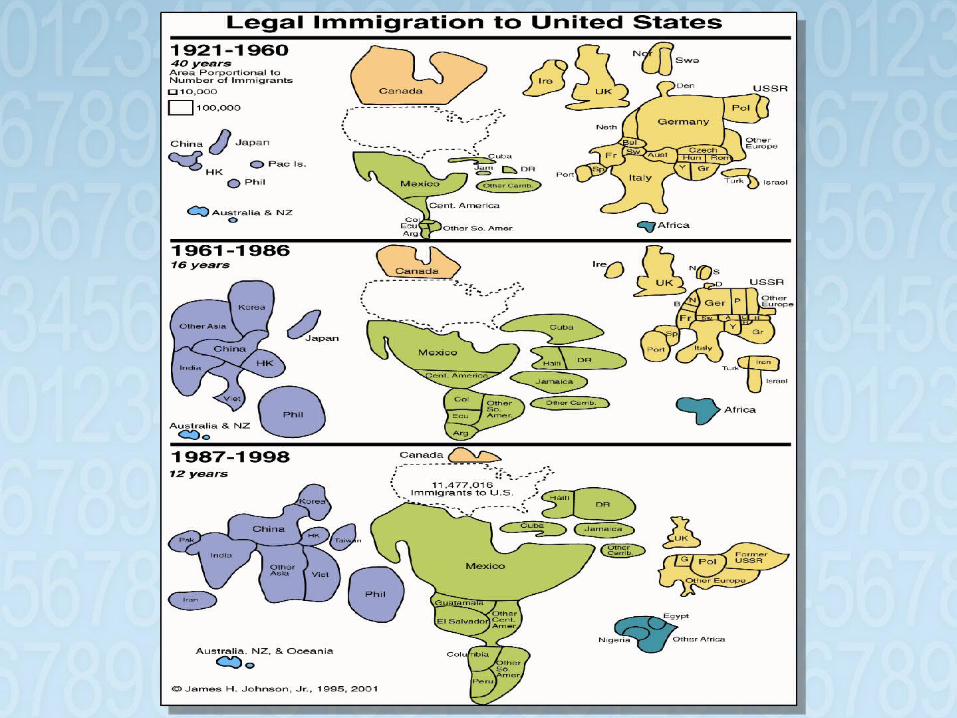
A Brief Immigration
History
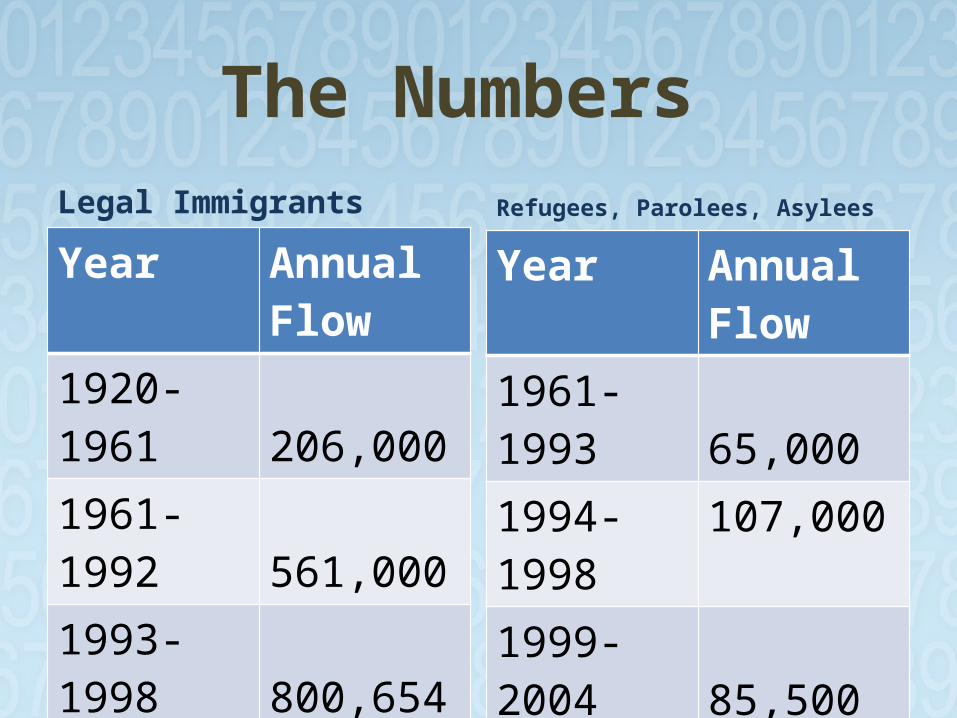
The Numbers
Year Annual Flow
1920-1961 206,0001961-1992 561,0001993-1998 800,6541999-2004 879,4002005-2008 1,137,0002009-2012 1,067,000
Refugees, Parolees, Asylees
Year Annual Flow
1961-1993 65,000
1994-1998 107,000
1999-2004 85,500
2005-2008 75,000
2009-2012 92,500
Legal Immigrants
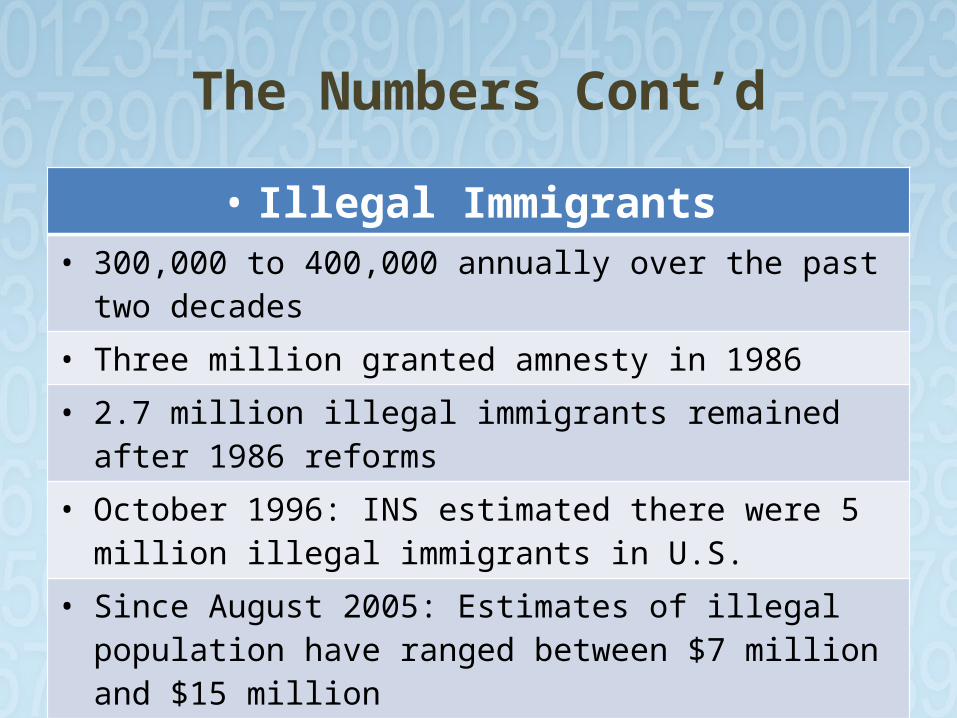
The Numbers Cont’d
• Illegal Immigrants • 300,000 to 400,000 annually over the past two decades • Three million granted amnesty in 1986• 2.7 million illegal immigrants remained after 1986 reforms• October 1996: INS estimated there were 5 million illegal
immigrants in U.S. • Since August 2005: Estimates of illegal population have
ranged between $7 million and $15 million • Today: An estimated 11.5 million unauthorized immigrants
reside in U.S.
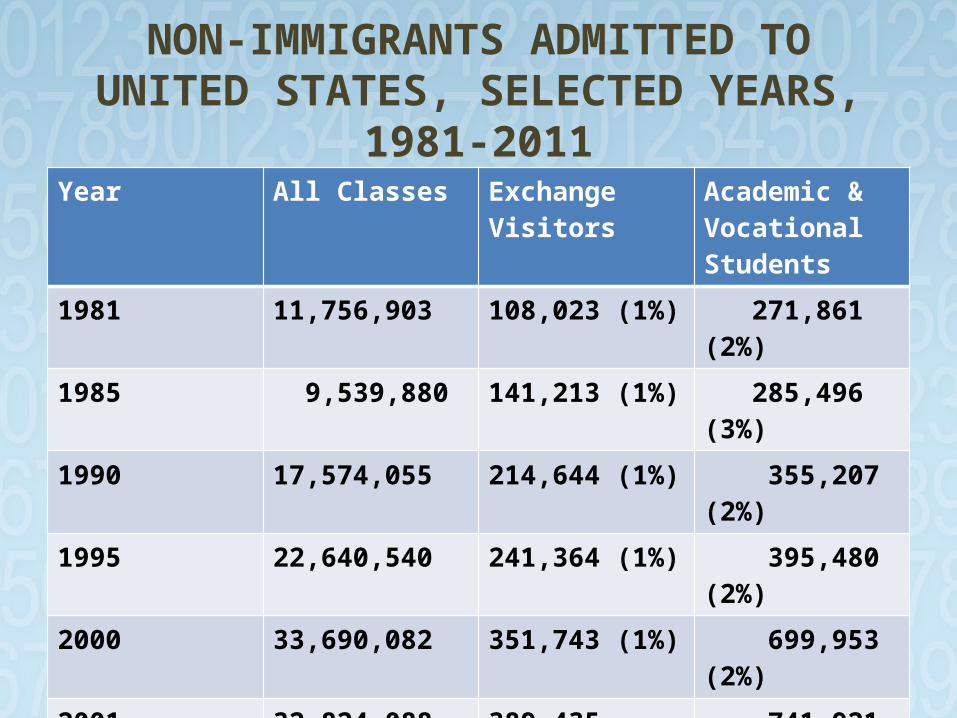
NON-IMMIGRANTS ADMITTED TO UNITED STATES, SELECTED YEARS,
1981-2011Year All Classes Exchange Visitors Academic &
Vocational Students
1981 11,756,903 108,023 (1%) 271,861 (2%)1985 9,539,880 141,213 (1%) 285,496 (3%)1990 17,574,055 214,644 (1%) 355,207 (2%)1995 22,640,540 241,364 (1%) 395,480 (2%)2000 33,690,082 351,743 (1%) 699,953 (2%)2001 32,824,088 389,435 (1%) 741,921 (2%)2002 27,907,139 370,176 (1%) 687,506 (2%)2008 39,381,928 506,138 (1%) 917,373 (2%)2011 53,082,286 526, 931 (1%) 1,702,730 (3%)
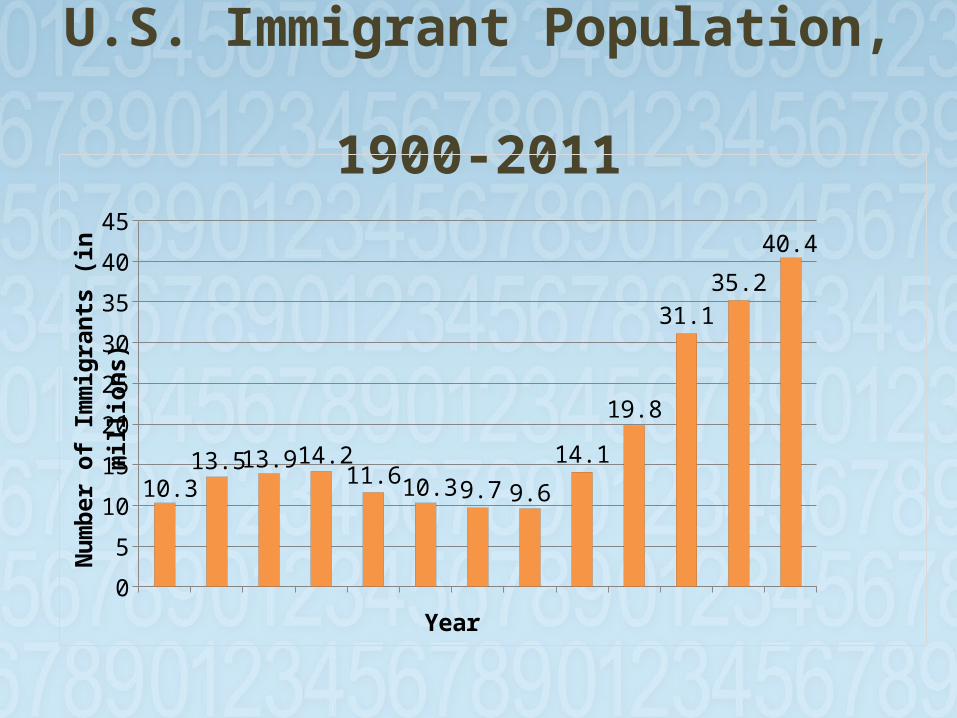
U.S. Immigrant Population, 1900-2011
1900 1910 1920 1930 1940 1950 1960 1970 1980 1990 2000 2005 20110
5
10
15
20
25
30
35
40
45
10.313.5 13.9 14.2
11.6 10.3 9.7 9.6
14.1
19.8
31.135.2
40.4
Year
Num
ber o
f Im
mig
rant
s (in
mill
ions
)
23
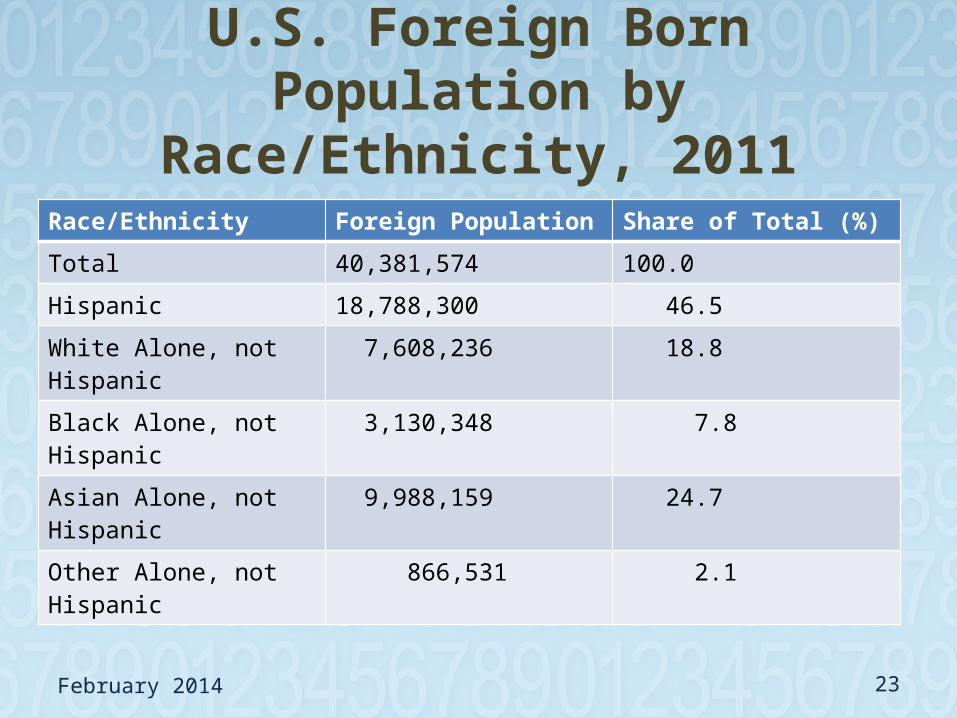
U.S. Foreign Born Population by
Race/Ethnicity, 2011Race/Ethnicity Foreign Population Share of Total (%)
Total 40,381,574 100.0
Hispanic 18,788,300 46.5
White Alone, not Hispanic 7,608,236 18.8
Black Alone, not Hispanic 3,130,348 7.8
Asian Alone, not Hispanic 9,988,159 24.7
Other Alone, not Hispanic 866,531 2.1
February 2014
THE “BROWNING” OF AMERICA
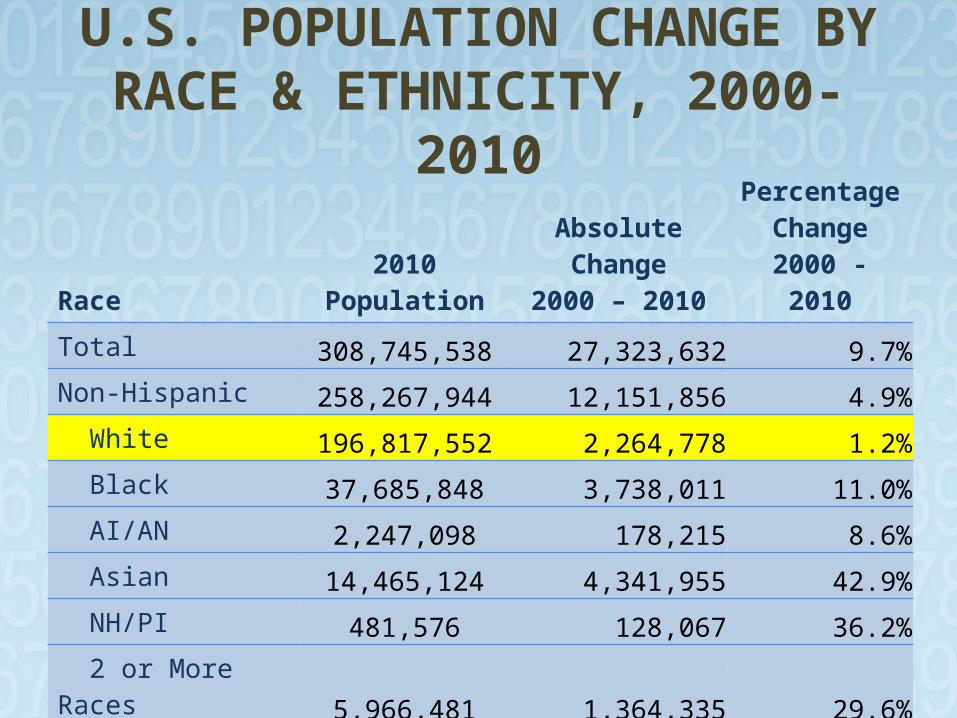
U.S. POPULATION CHANGE BY RACE & ETHNICITY,
2000-2010
Race 2010 PopulationAbsolute Change
2000 – 2010
Percentage Change
2000 - 2010Total 308,745,538 27,323,632 9.7%Non-Hispanic 258,267,944 12,151,856 4.9% White 196,817,552 2,264,778 1.2% Black 37,685,848 3,738,011 11.0% AI/AN 2,247,098 178,215 8.6% Asian 14,465,124 4,341,955 42.9% NH/PI 481,576 128,067 36.2% 2 or More Races 5,966,481 1,364,335 29.6%Hispanic 50,477,594 15,171,776 43.0%
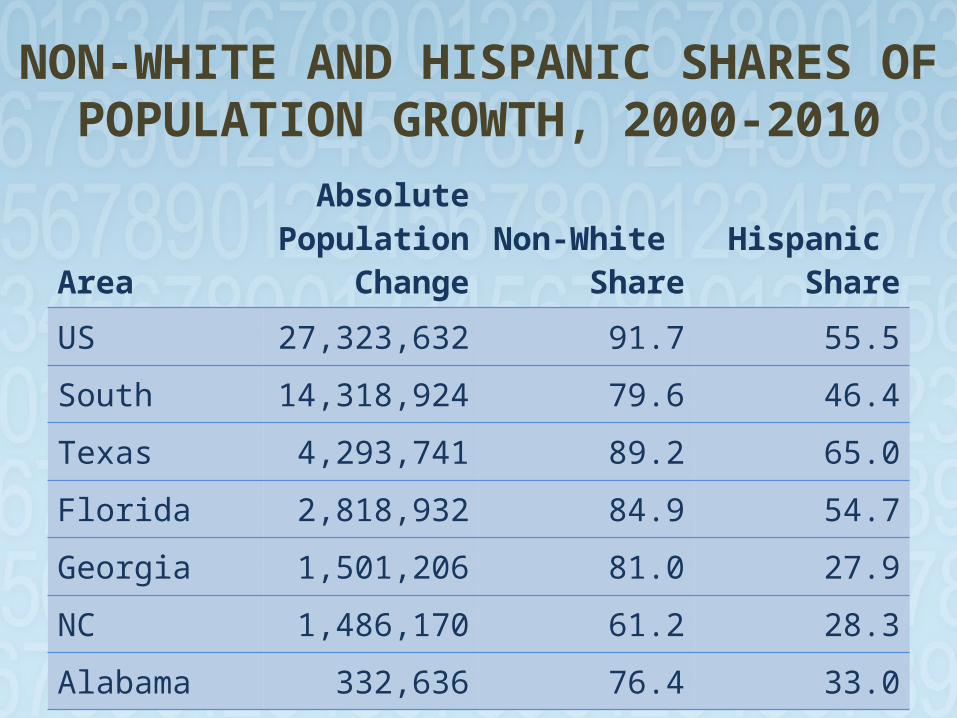
NON-WHITE AND HISPANIC SHARES OF POPULATION
GROWTH, 2000-2010
Area
AbsolutePopulation
ChangeNon-White
ShareHispanic
Share
US 27,323,632 91.7 55.5
South 14,318,924 79.6 46.4
Texas 4,293,741 89.2 65.0
Florida 2,818,932 84.9 54.7
Georgia 1,501,206 81.0 27.9
NC 1,486,170 61.2 28.3
Alabama 332,636 76.4 33.0
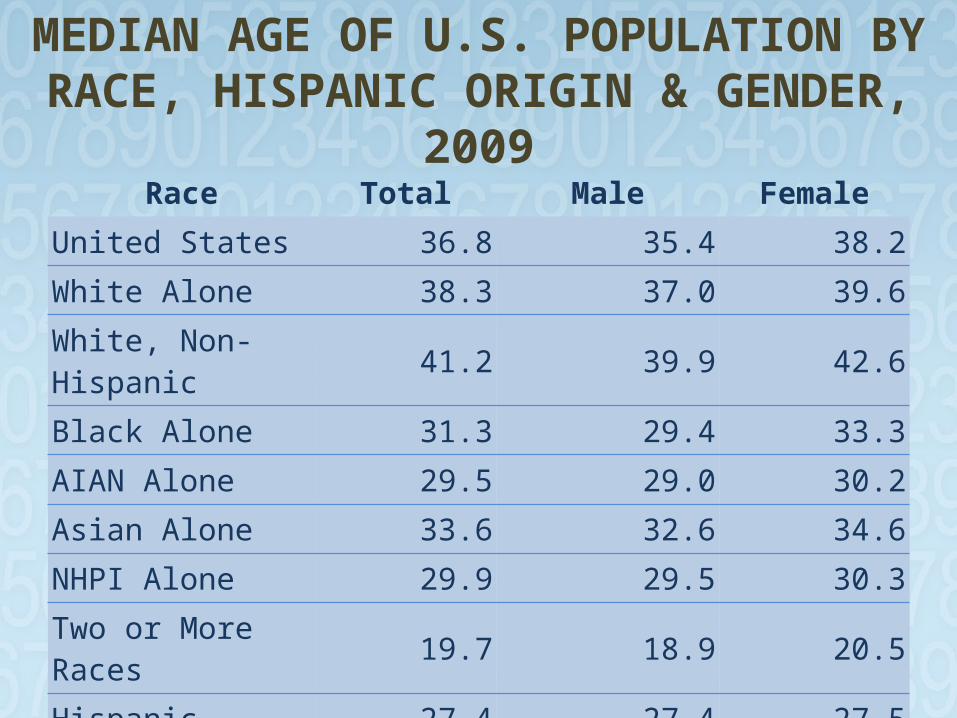
MEDIAN AGE OF U.S. POPULATION BY RACE, HISPANIC ORIGIN &
GENDER, 2009Race Total Male Female
United States 36.8 35.4 38.2
White Alone 38.3 37.0 39.6
White, Non-Hispanic 41.2 39.9 42.6
Black Alone 31.3 29.4 33.3
AIAN Alone 29.5 29.0 30.2
Asian Alone 33.6 32.6 34.6
NHPI Alone 29.9 29.5 30.3
Two or More Races 19.7 18.9 20.5
Hispanic 27.4 27.4 27.5
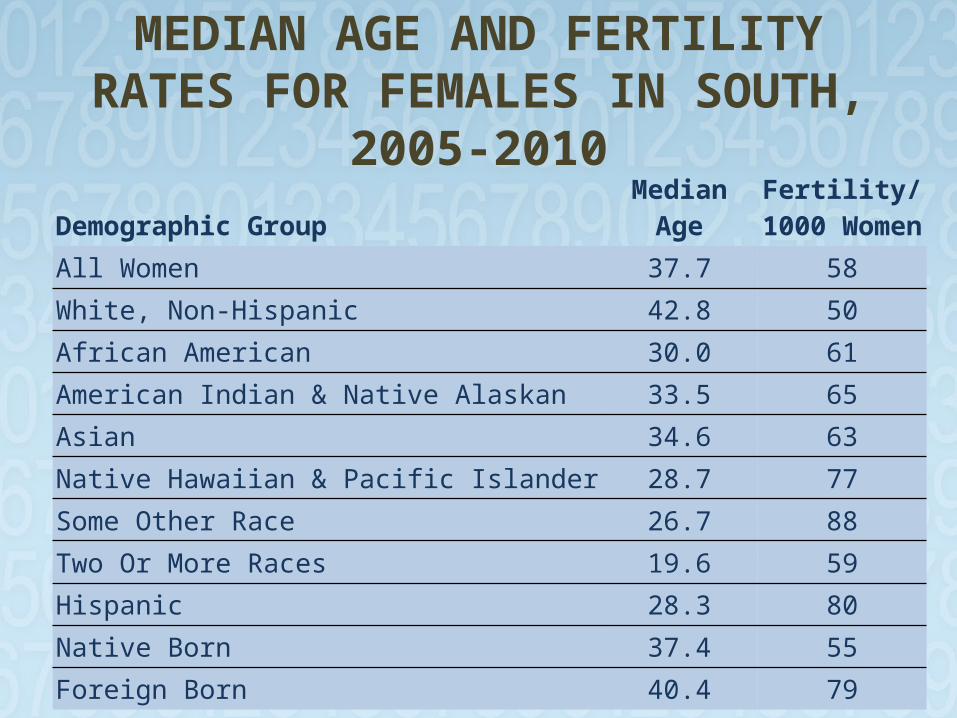
MEDIAN AGE AND FERTILITY RATES FOR FEMALES IN
SOUTH, 2005-2010Demographic Group Median Age
Fertility/1000 Women
All Women 37.7 58White, Non-Hispanic 42.8 50African American 30.0 61American Indian & Native Alaskan 33.5 65Asian 34.6 63Native Hawaiian & Pacific Islander 28.7 77Some Other Race 26.7 88Two Or More Races 19.6 59Hispanic 28.3 80Native Born 37.4 55Foreign Born 40.4 79

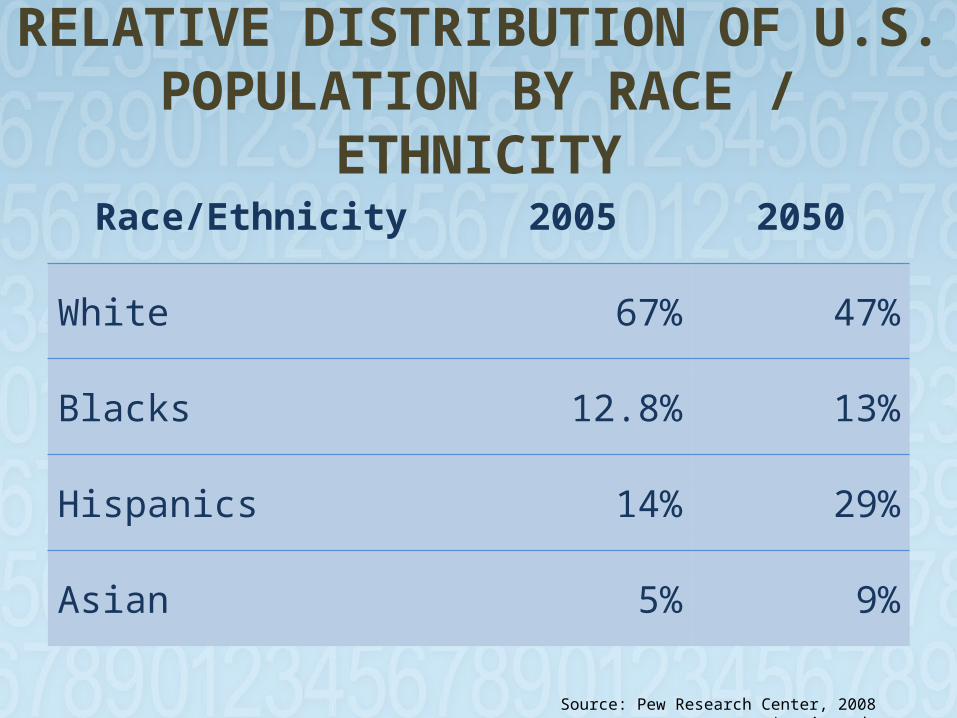
RELATIVE DISTRIBUTION OF U.S. POPULATION BY RACE /
ETHNICITYRace/Ethnicity 2005 2050
White 67% 47%
Blacks 12.8% 13%
Hispanics 14% 29%
Asian 5% 9%
Source: Pew Research Center, 2008 *projected.
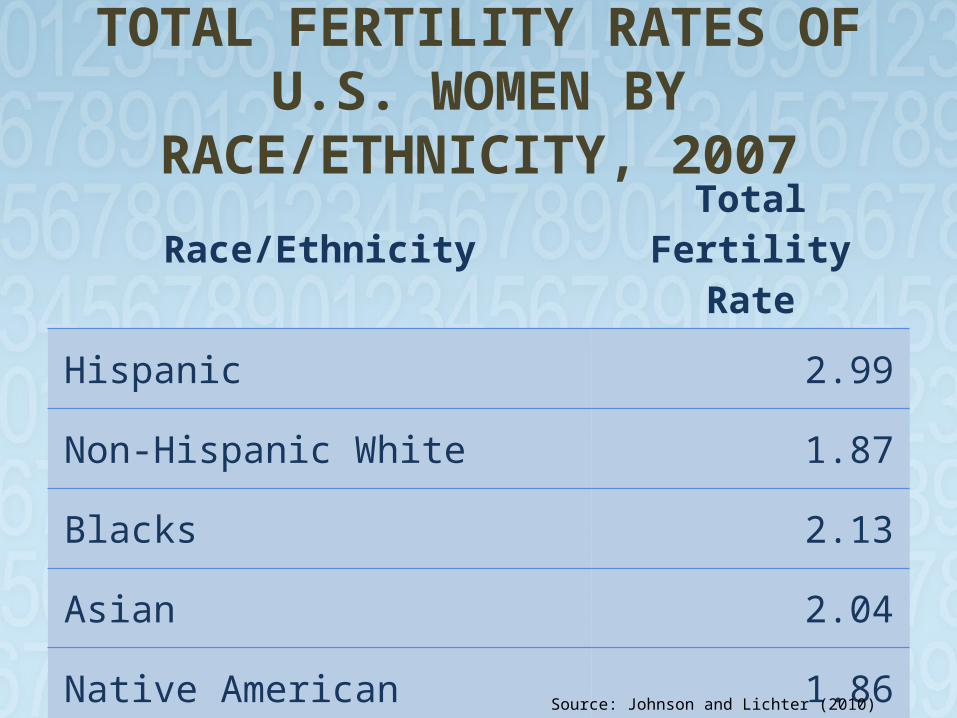
TOTAL FERTILITY RATES OF U.S. WOMEN BY
RACE/ETHNICITY, 2007Race/Ethnicity Total Fertility Rate
Hispanic 2.99
Non-Hispanic White 1.87
Blacks 2.13
Asian 2.04
Native American 1.86
Source: Johnson and Lichter (2010)
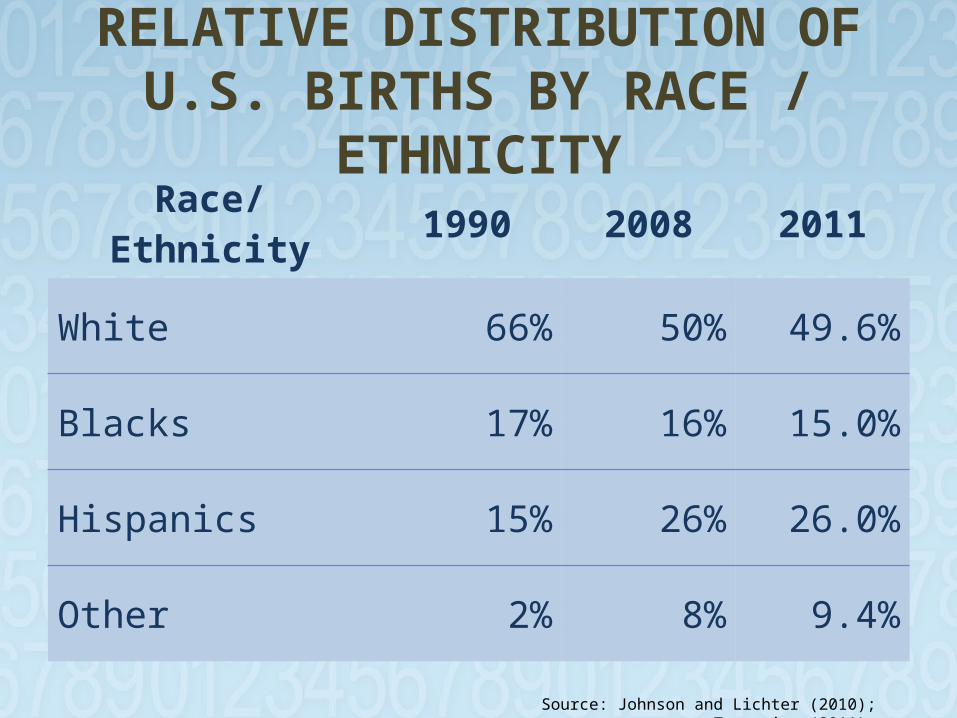
RELATIVE DISTRIBUTION OF U.S. BIRTHS BY RACE /
ETHNICITYRace/Ethnicity 1990 2008 2011
White 66% 50% 49.6%
Blacks 17% 16% 15.0%
Hispanics 15% 26% 26.0%
Other 2% 8% 9.4%
Source: Johnson and Lichter (2010); Tavernise (2011).
RELATIVE DISTRIBUTION OF U.S. POPULATION BY RACE /
ETHNICITYRace/Ethnicity 2005 2050
White 67% 47%
Blacks 12.8% 13%
Hispanics 14% 29%
Asian 5% 9%
Source: Pew Research Center, 2008 *projected.
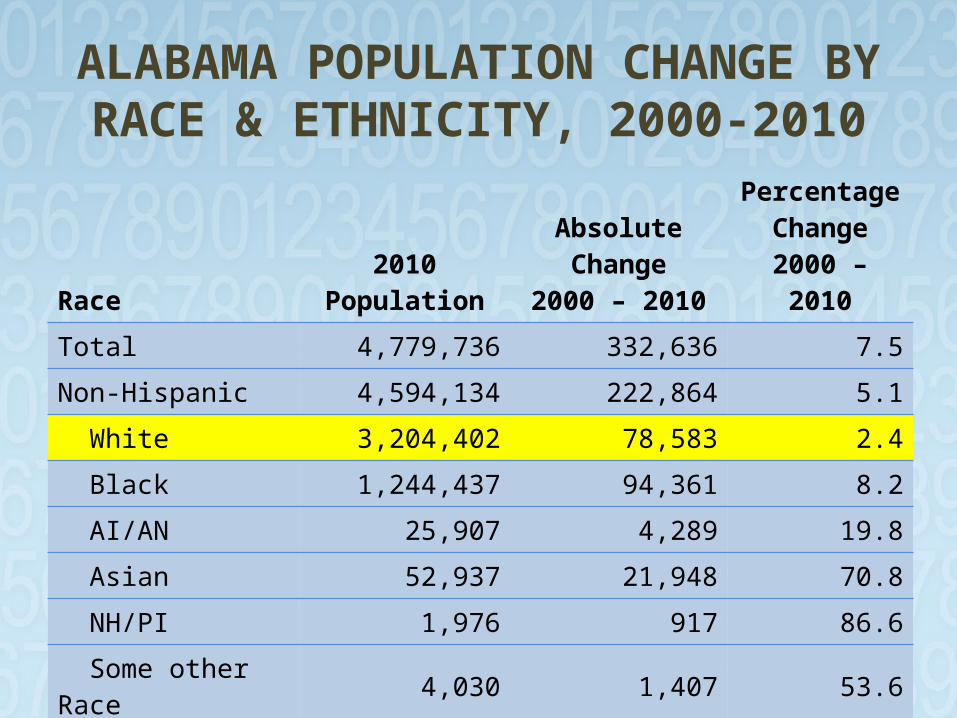
ALABAMA POPULATION CHANGE BY RACE & ETHNICITY,
2000-2010
Race 2010 PopulationAbsolute Change
2000 – 2010
Percentage Change
2000 – 2010Total 4,779,736 332,636 7.5
Non-Hispanic 4,594,134 222,864 5.1
White 3,204,402 78,583 2.4
Black 1,244,437 94,361 8.2
AI/AN 25,907 4,289 19.8
Asian 52,937 21,948 70.8
NH/PI 1,976 917 86.6
Some other Race 4,030 1,407 53.6
2 or More Races 60,445 21,359 54.6
Hispanic 185,602 109,772 144.8
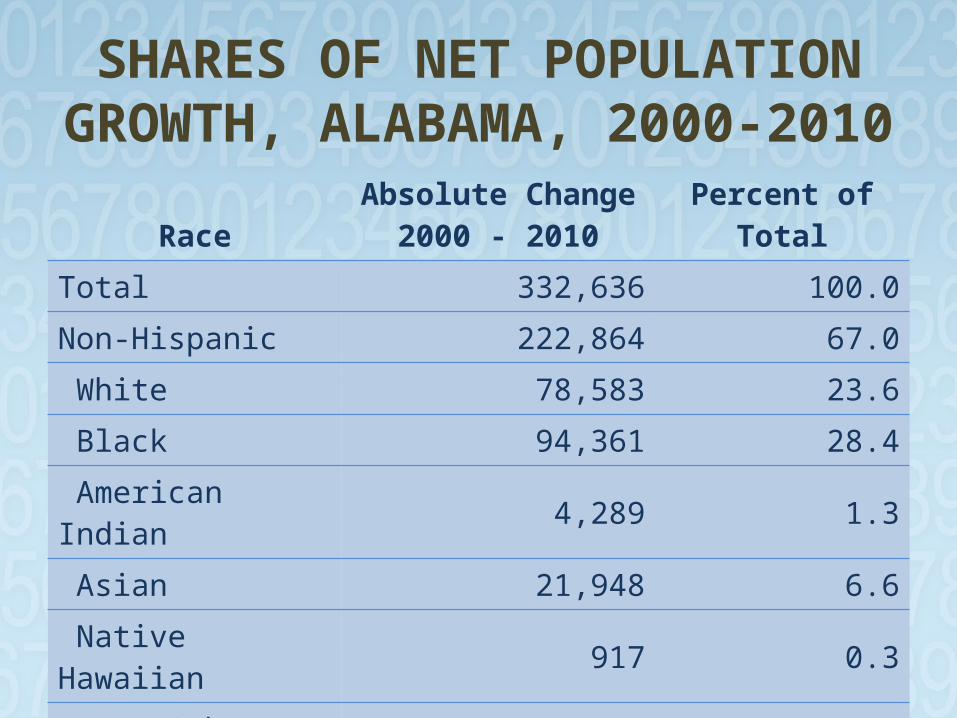
SHARES OF NET POPULATION GROWTH, ALABAMA, 2000-2010Race
Absolute Change2000 - 2010 Percent of Total
Total 332,636 100.0Non-Hispanic 222,864 67.0 White 78,583 23.6 Black 94,361 28.4 American Indian 4,289 1.3 Asian 21,948 6.6 Native Hawaiian 917 0.3 Some Other Race 1,407 0.4 Two or More Races 21,359 6.4Hispanic 109,772 33.0
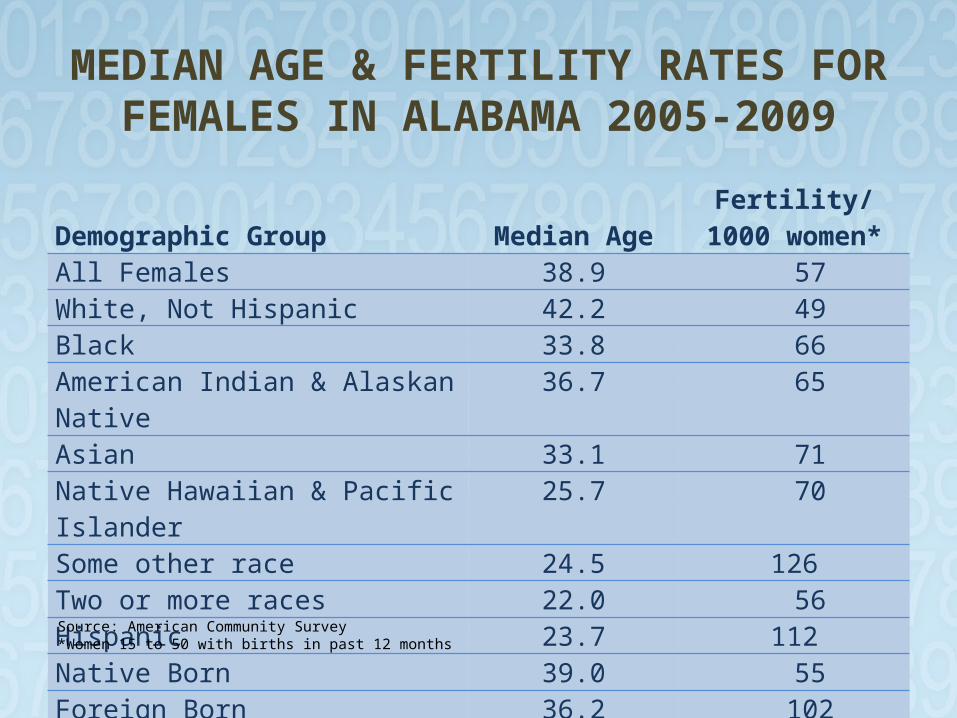
MEDIAN AGE & FERTILITY RATES FOR FEMALES IN ALABAMA 2005-
2009 Demographic Group Median Age
Fertility/1000 women*
All Females 38.9 57White, Not Hispanic 42.2 49Black 33.8 66American Indian & Alaskan Native 36.7 65Asian 33.1 71Native Hawaiian & Pacific Islander 25.7 70Some other race 24.5 126Two or more races 22.0 56Hispanic 23.7 112Native Born 39.0 55Foreign Born 36.2 102
.
Source: American Community Survey *Women 15 to 50 with births in past 12 months

is “In”is “In”
Marrying Out
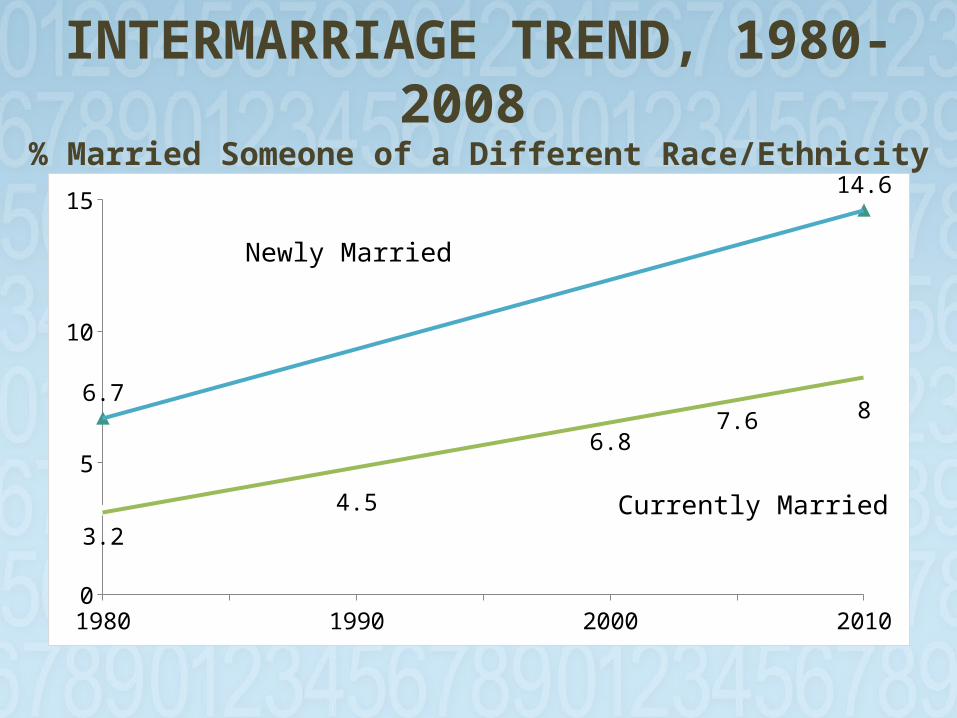
INTERMARRIAGE TREND, 1980-2008
% Married Someone of a Different Race/Ethnicity
1980 1990 2000 20100
5
10
15
6.7
14.6
3.24.5
6.87.6 8
Currently Married
Newly Married
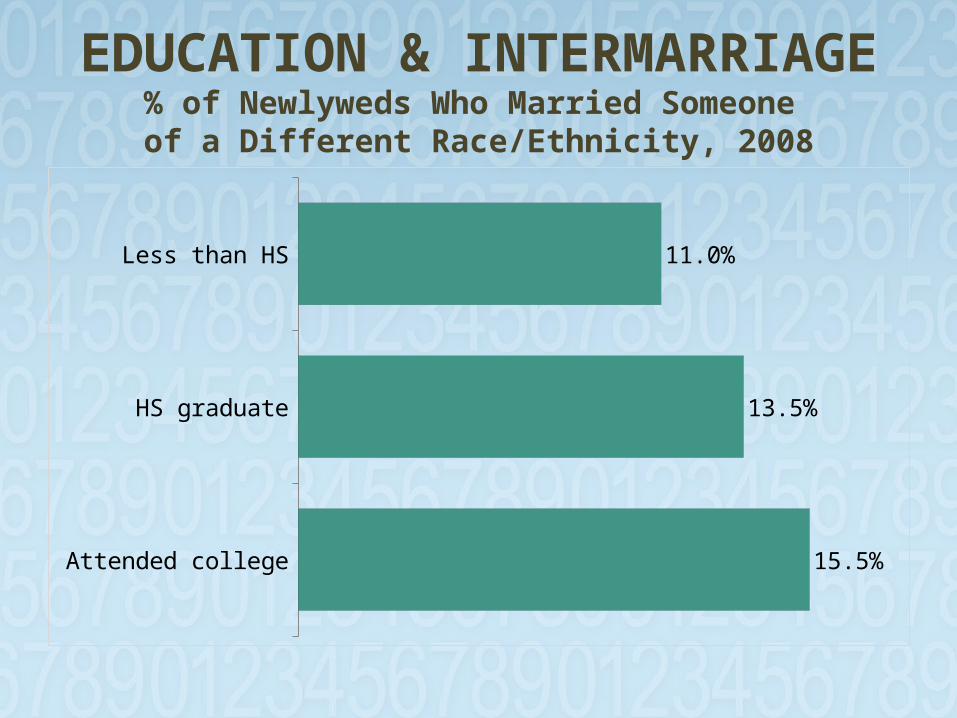
EDUCATION & INTERMARRIAGE
% of Newlyweds Who Married Someone of a Different Race/Ethnicity, 2008
Attended college
HS graduate
Less than HS
15.5%
13.5%
11.0%
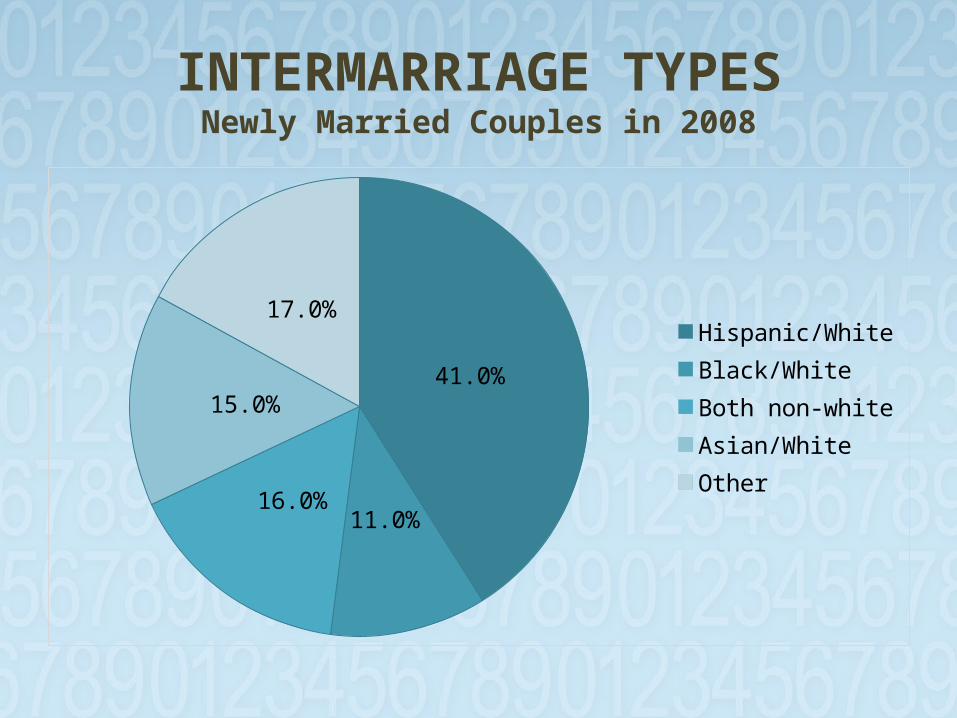
41.0%
11.0%16.0%
15.0%
17.0%
Hispanic/WhiteBlack/WhiteBoth non-whiteAsian/WhiteOther
INTERMARRIAGE TYPESNewly Married Couples in 2008
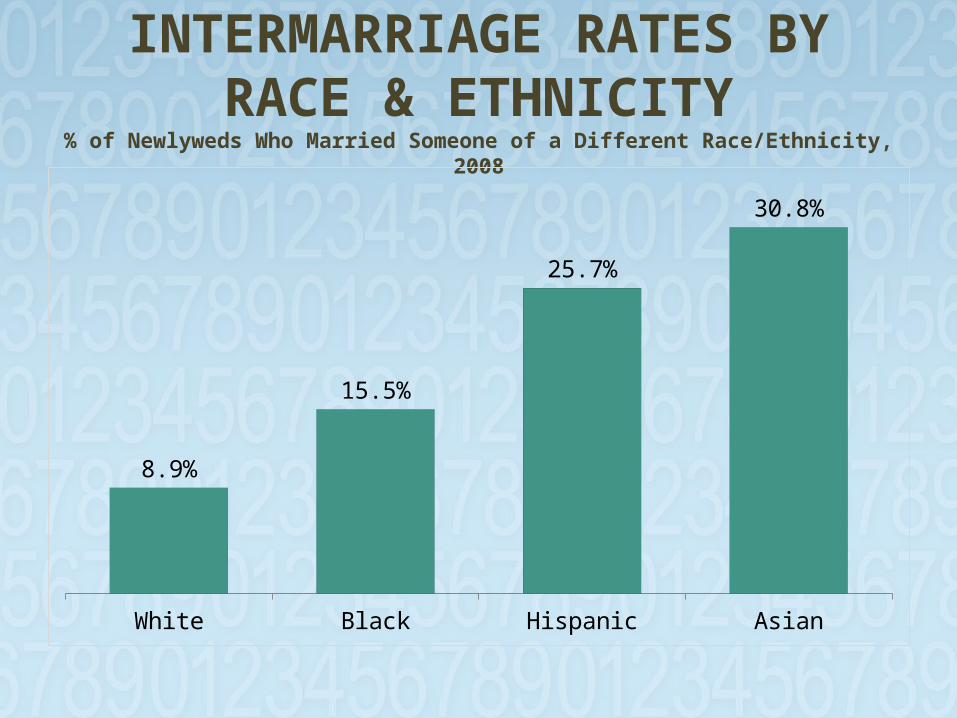
INTERMARRIAGE RATES BY RACE & ETHNICITY
% of Newlyweds Who Married Someone of a Different Race/Ethnicity, 2008
White Black Hispanic Asian
8.9%
15.5%
25.7%
30.8%

THE SILVER TSUNAMI
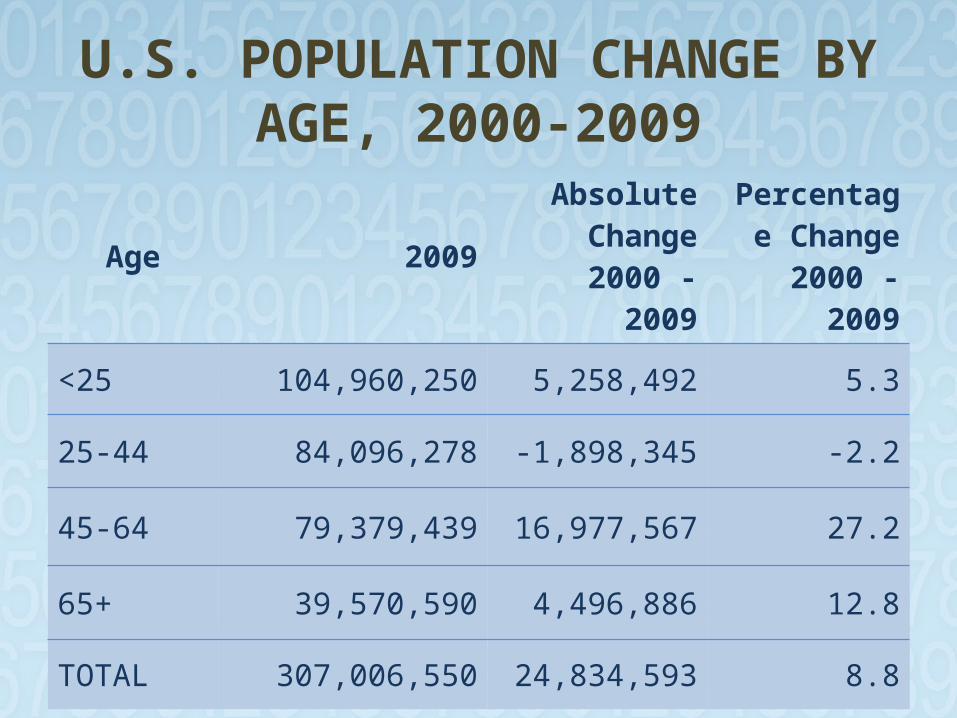
U.S. POPULATION CHANGE BY AGE, 2000-2009
Age 2009Absolute
Change2000 - 2009
Percentage Change
2000 - 2009
<25 104,960,250 5,258,492 5.3
25-44 84,096,278 -1,898,345 -2.2
45-64 79,379,439 16,977,567 27.2
65+ 39,570,590 4,496,886 12.8
TOTAL 307,006,550 24,834,593 8.8
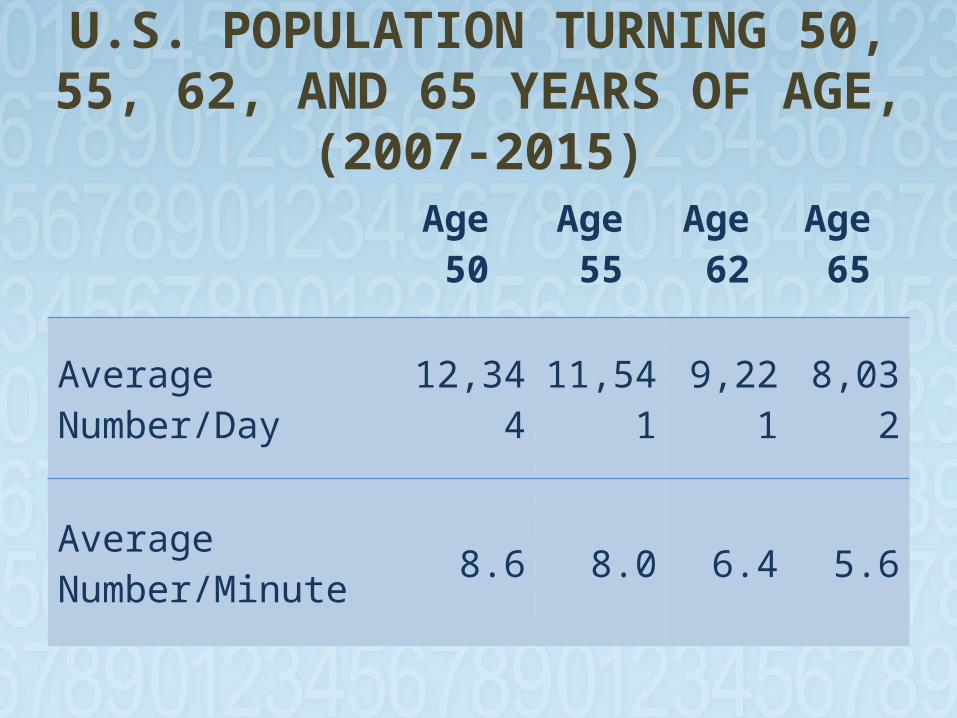
U.S. POPULATION TURNING 50, 55, 62, AND 65 YEARS OF AGE,
(2007-2015)Age 50
Age 55
Age 62
Age 65
Average Number/Day 12,344 11,541 9,221 8,032
Average Number/Minute 8.6 8.0 6.4 5.6
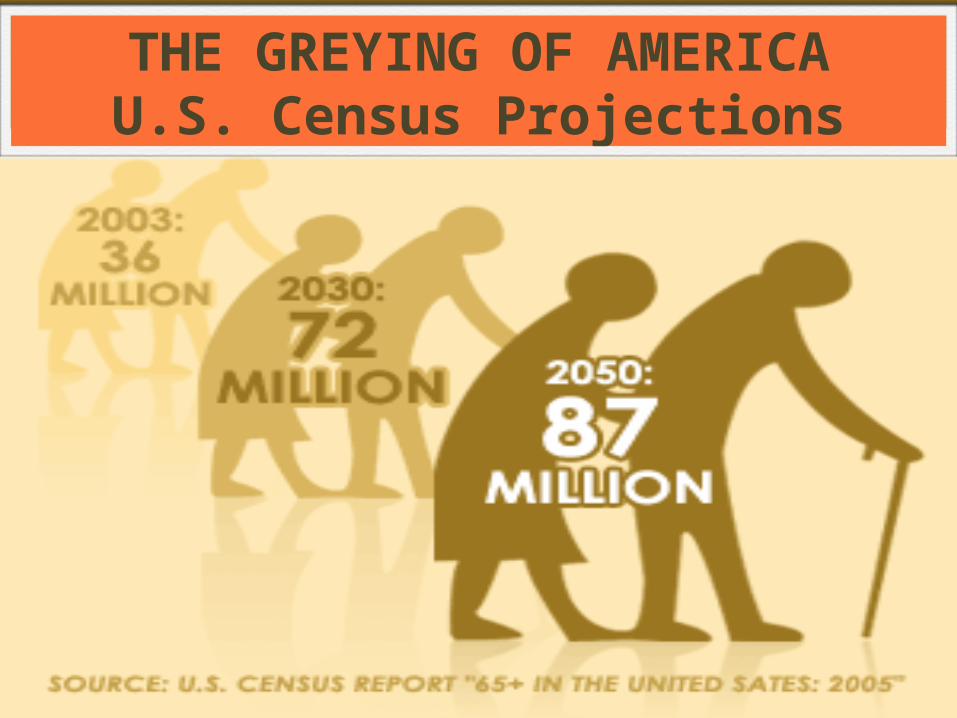
THE GREYING OF AMERICAU.S. Census Projections
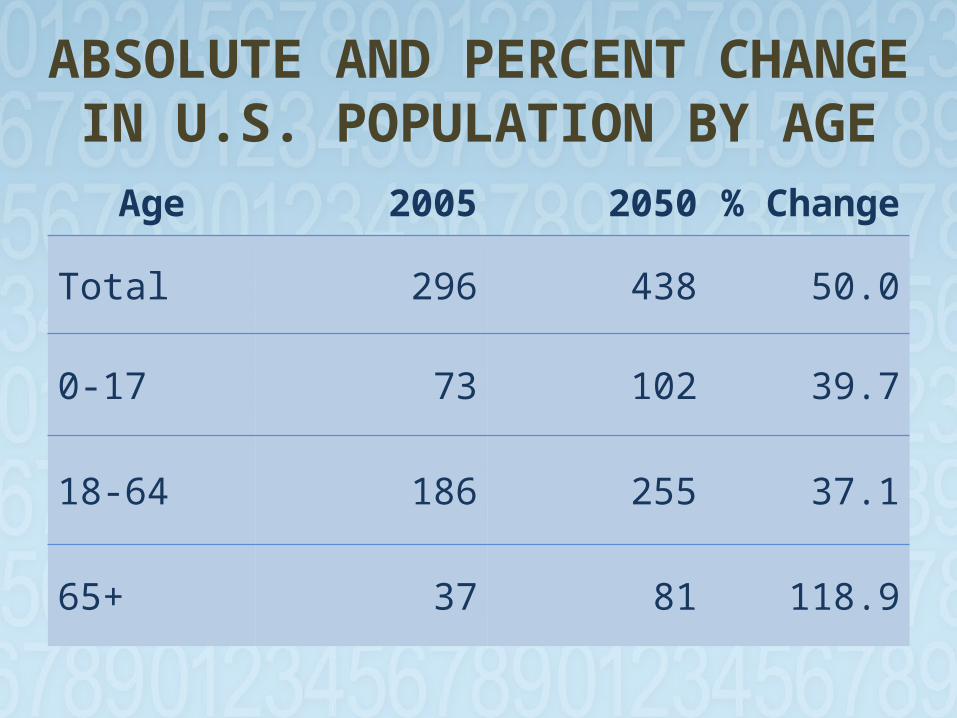
ABSOLUTE AND PERCENT CHANGE IN U.S. POPULATION
BY AGEAge 2005 2050 % Change
Total 296 438 50.0
0-17 73 102 39.7
18-64 186 255 37.1
65+ 37 81 118.9
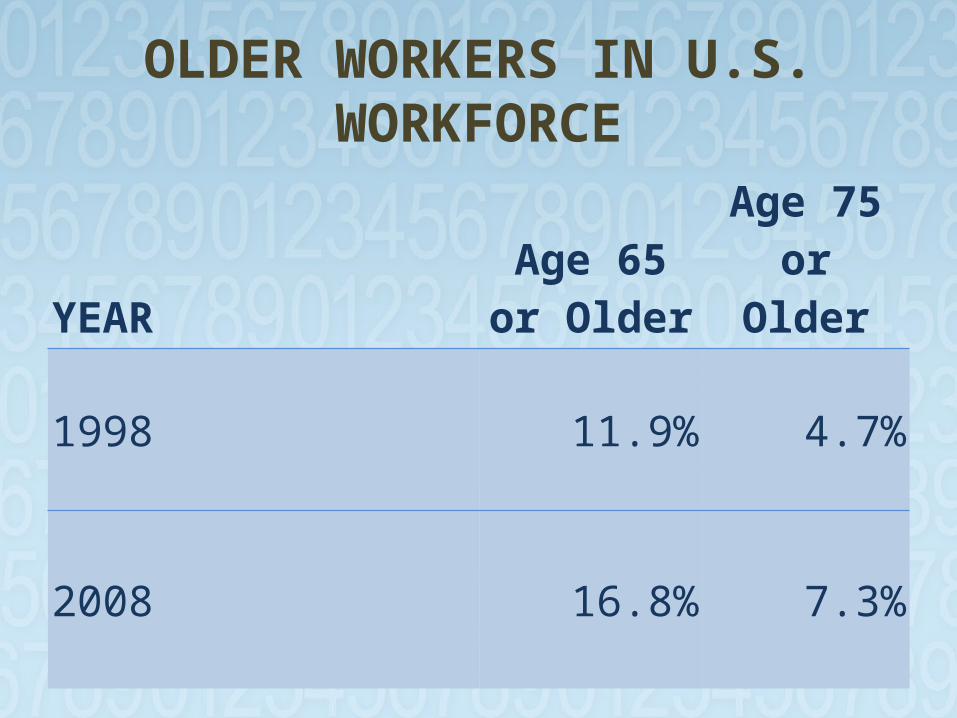
OLDER WORKERS IN U.S. WORKFORCE
YEARAge 65 or
OlderAge 75 or
Older
1998 11.9% 4.7%
2008 16.8% 7.3%
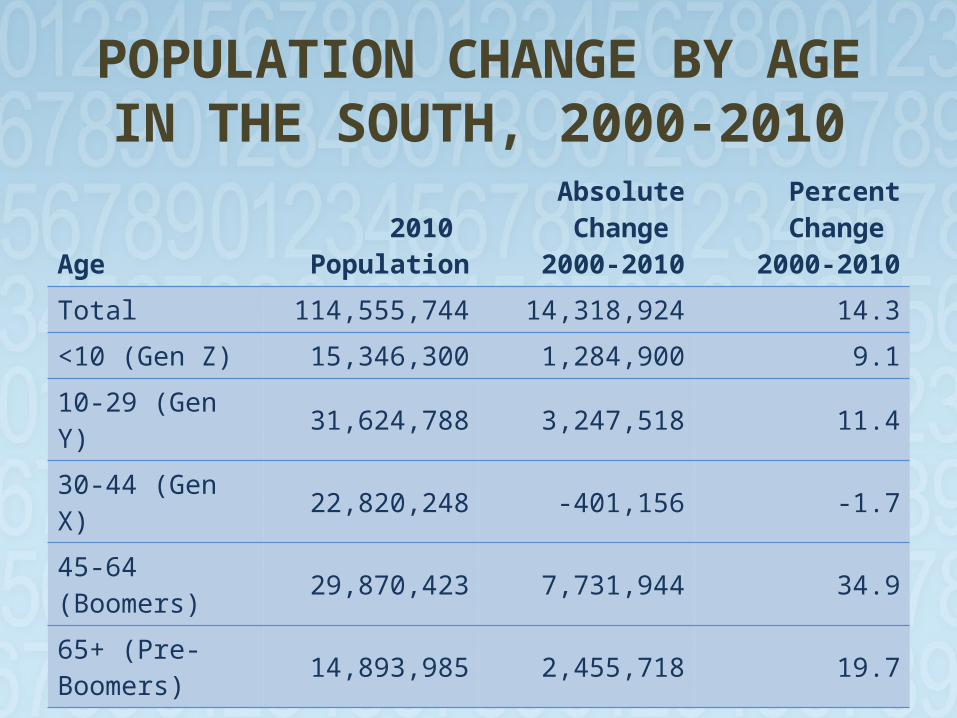
POPULATION CHANGE BY AGE IN THE SOUTH, 2000-
2010
Age2010
Population
AbsoluteChange
2000-2010
PercentChange
2000-2010Total 114,555,744 14,318,924 14.3
<10 (Gen Z) 15,346,300 1,284,900 9.1
10-29 (Gen Y) 31,624,788 3,247,518 11.4
30-44 (Gen X) 22,820,248 -401,156 -1.7
45-64 (Boomers) 29,870,423 7,731,944 34.9
65+ (Pre-Boomers) 14,893,985 2,455,718 19.7
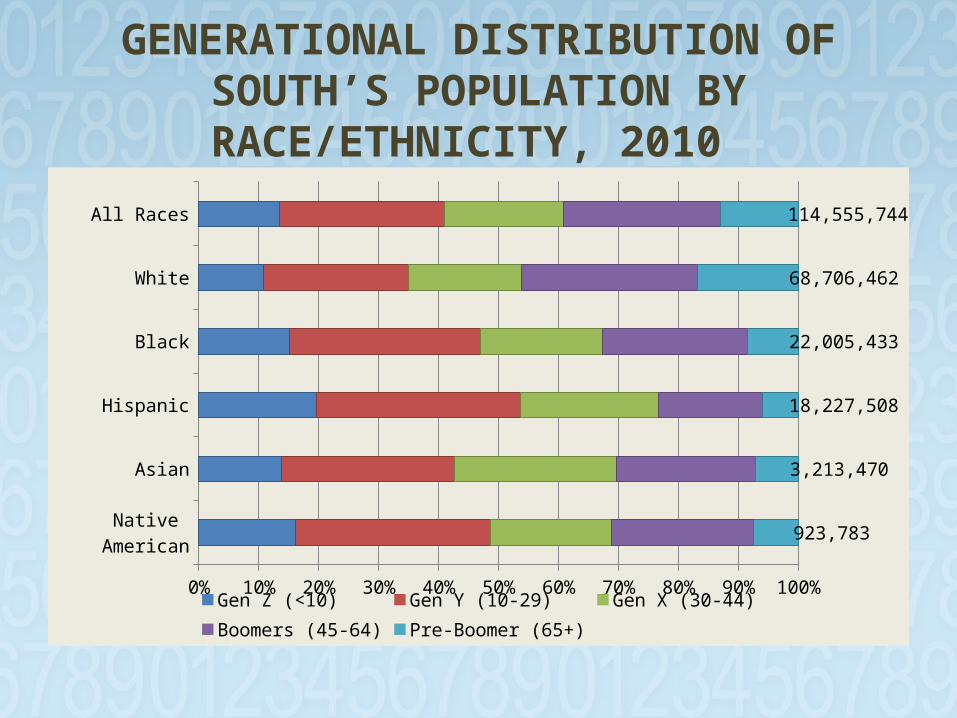
GENERATIONAL DISTRIBUTION OF SOUTH’S POPULATION BY RACE/ETHNICITY, 2010
Native American
Asian
Hispanic
Black
White
All Races
0% 10% 20% 30% 40% 50% 60% 70% 80% 90% 100%
923,783
3,213,470
18,227,508
22,005,433
68,706,462
114,555,744
Gen Z (<10) Gen Y (10-29) Gen X (30-44) Boomers (45-64) Pre-Boomer (65+)
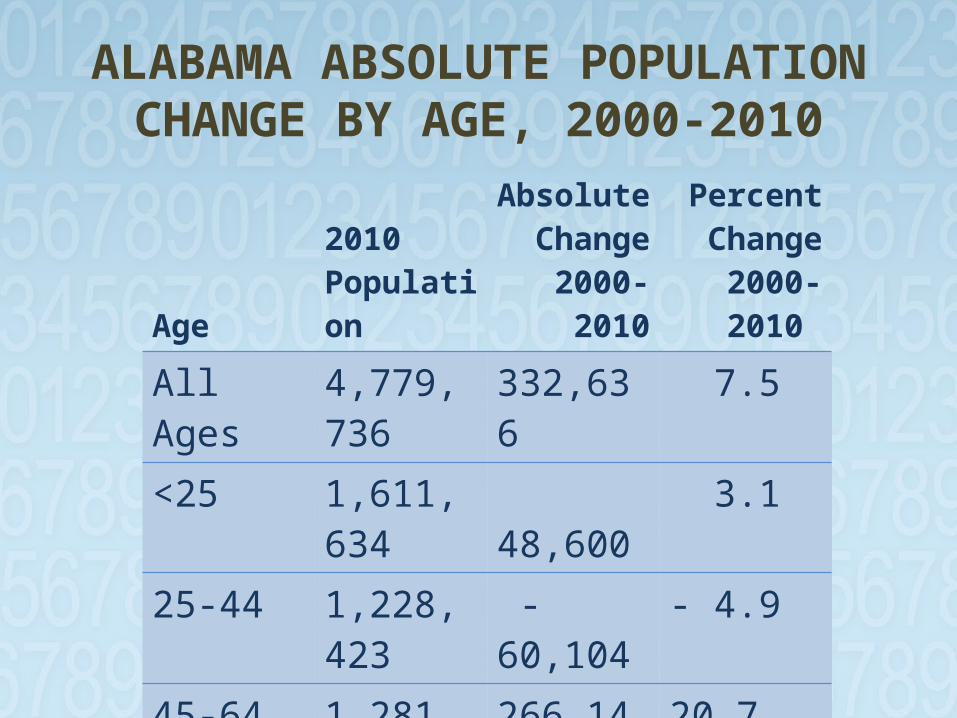
ALABAMA ABSOLUTE POPULATION CHANGE BY AGE,
2000-2010
Age 2010 Population
Absolute Change
2000-2010
Percent Change
2000-2010 All Ages 4,779,736 332,636 7.5<25 1,611,634 48,600 3.125-44 1,228,423 -60,104 - 4.945-64 1,281,887 266,146 20.765+ 657,792 77,994 3.5

The End of Men?
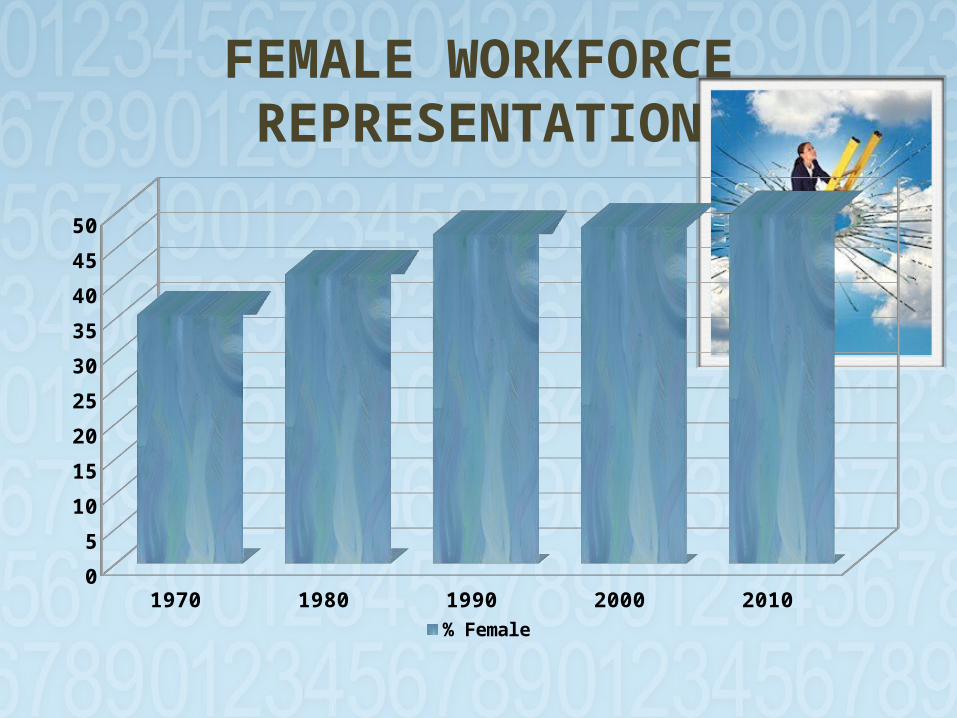
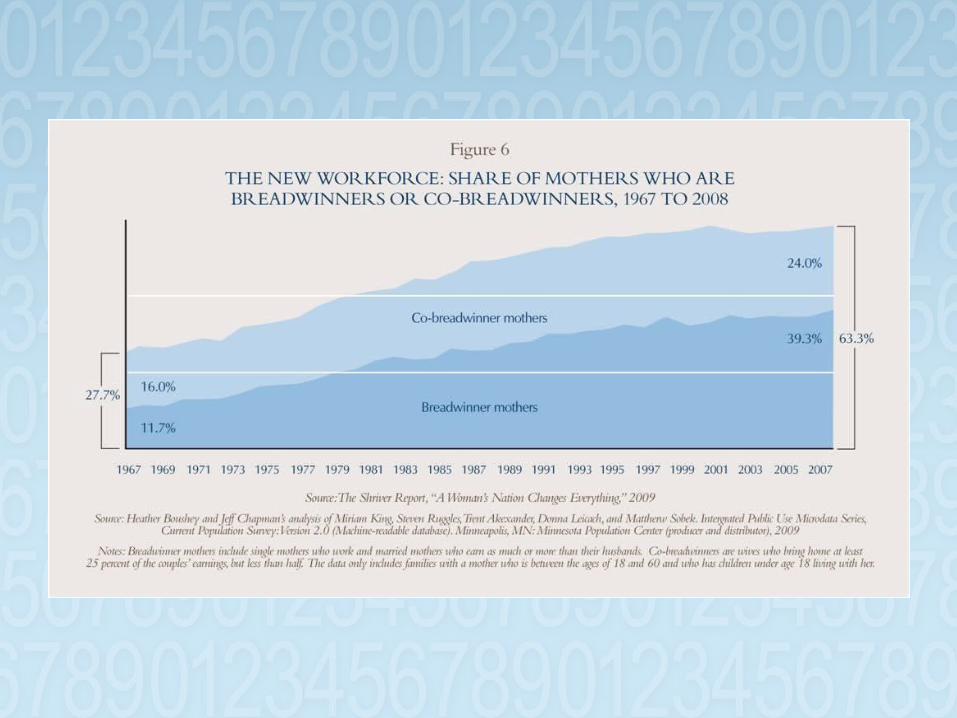
FEMALE WORKFORCE REPRESENTATION
1970 1980 1990 2000 20100
5
10
15
20
25
30
35
40
45
50
% Female
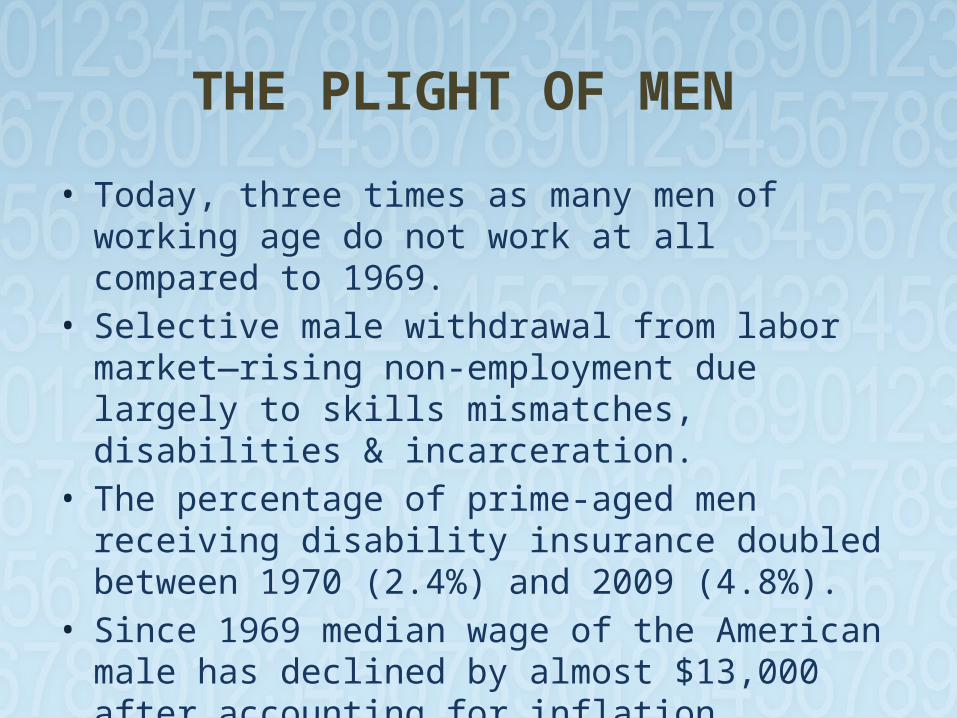
THE PLIGHT OF MEN
• Today, three times as many men of working age do not work at all compared to 1969.
• Selective male withdrawal from labor market—rising non-employment due largely to skills mismatches, disabilities & incarceration.
• The percentage of prime-aged men receiving disability insurance doubled between 1970 (2.4%) and 2009 (4.8%).
• Since 1969 median wage of the American male has declined by almost $13,000 after accounting for inflation.
• After peaking in 1977, male college completion rates have barely changed over the past 35 years.
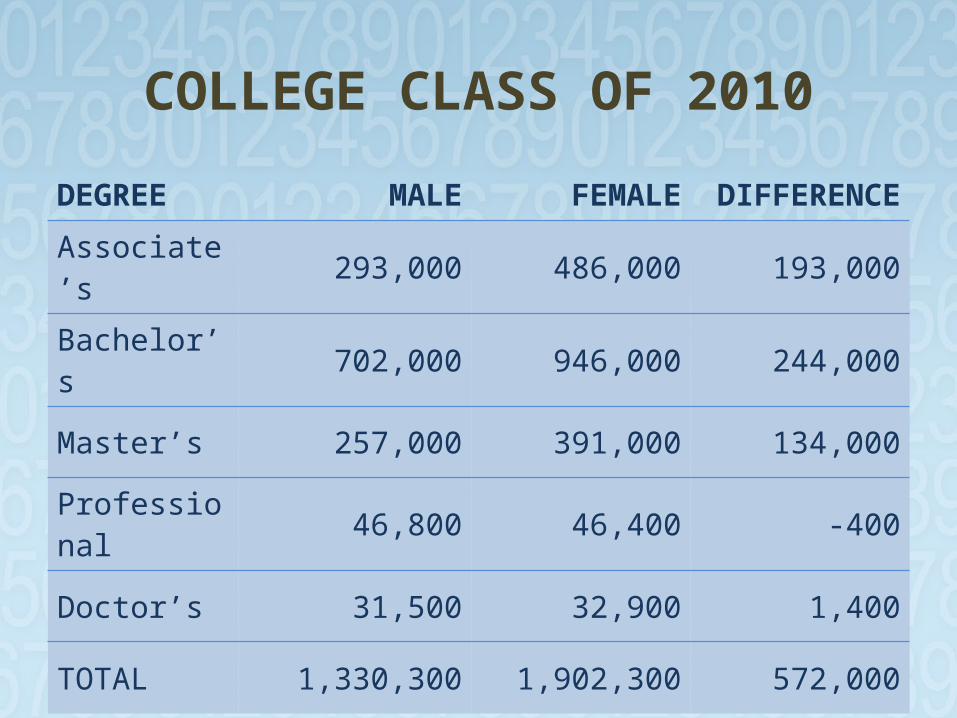
COLLEGE CLASS OF 2010
DEGREE MALE FEMALE DIFFERENCE
Associate’s 293,000 486,000 193,000
Bachelor’s 702,000 946,000 244,000
Master’s 257,000 391,000 134,000
Professional 46,800 46,400 -400
Doctor’s 31,500 32,900 1,400
TOTAL 1,330,300 1,902,300 572,000
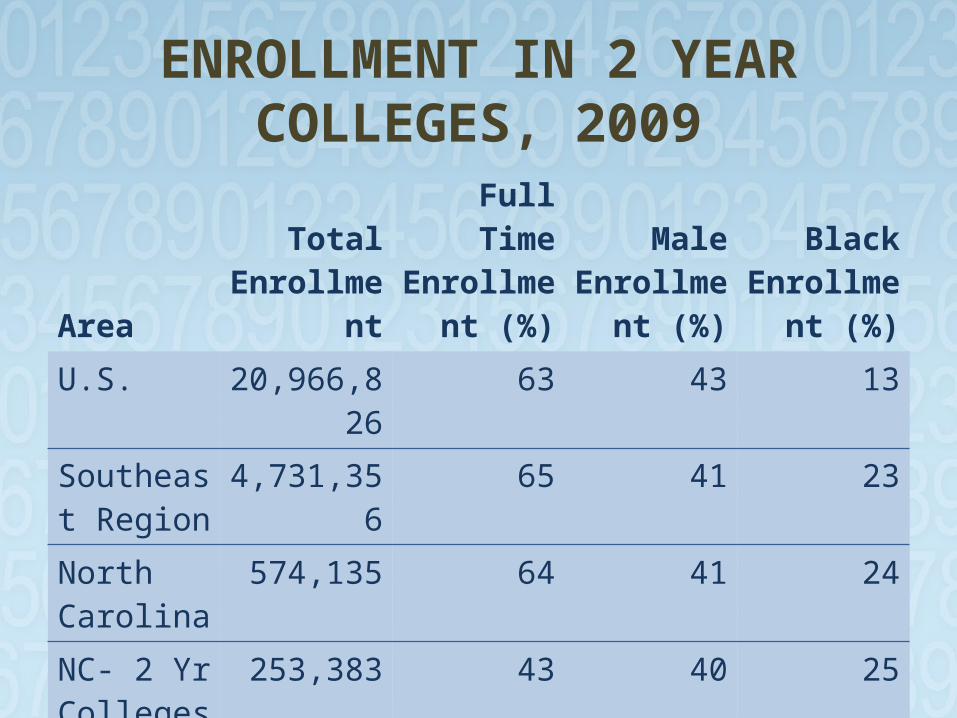
ENROLLMENT IN 2 YEAR COLLEGES, 2009
Area Total
Enrollment
Full Time Enrollment
(%)
Male Enrollment
(%)
Black Enrollment
(%)U.S. 20,966,826 63 43 13Southeast Region
4,731,356 65 41 23
North Carolina
574,135 64 41 24
NC- 2 Yr Colleges
253,383 43 40 25
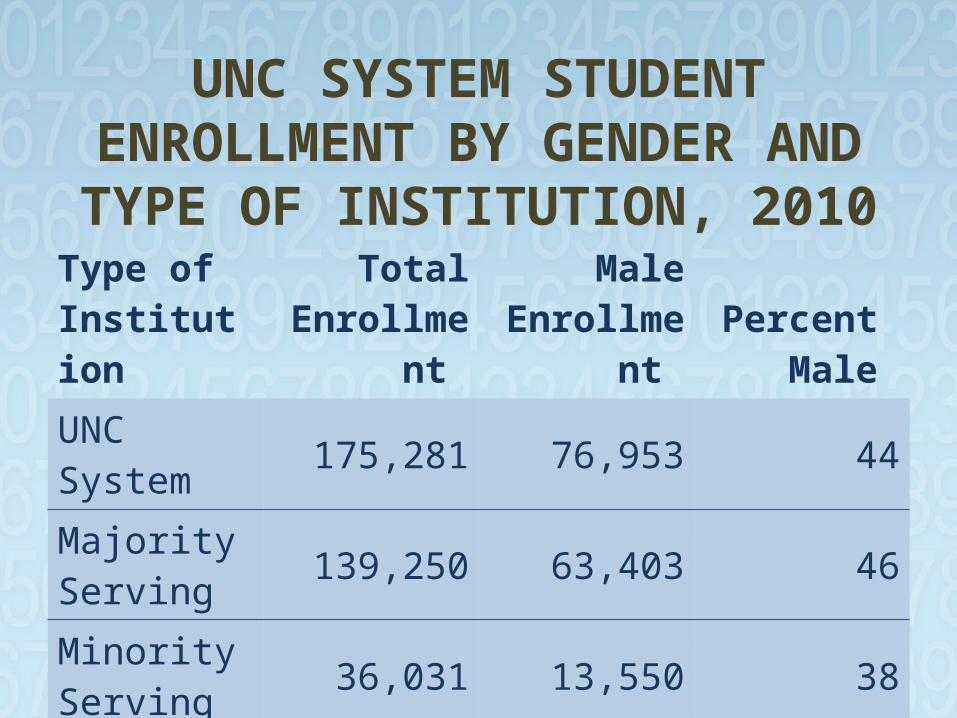
UNC SYSTEM STUDENT ENROLLMENT BY GENDER
AND TYPE OF INSTITUTION, 2010Type of
Institution Total
Enrollment Male
Enrollment Percent
Male UNC System 175,281 76,953 44Majority Serving 139,250 63,403 46
Minority Serving 36,031 13,550 38
HBUs 29,865 11,191 37
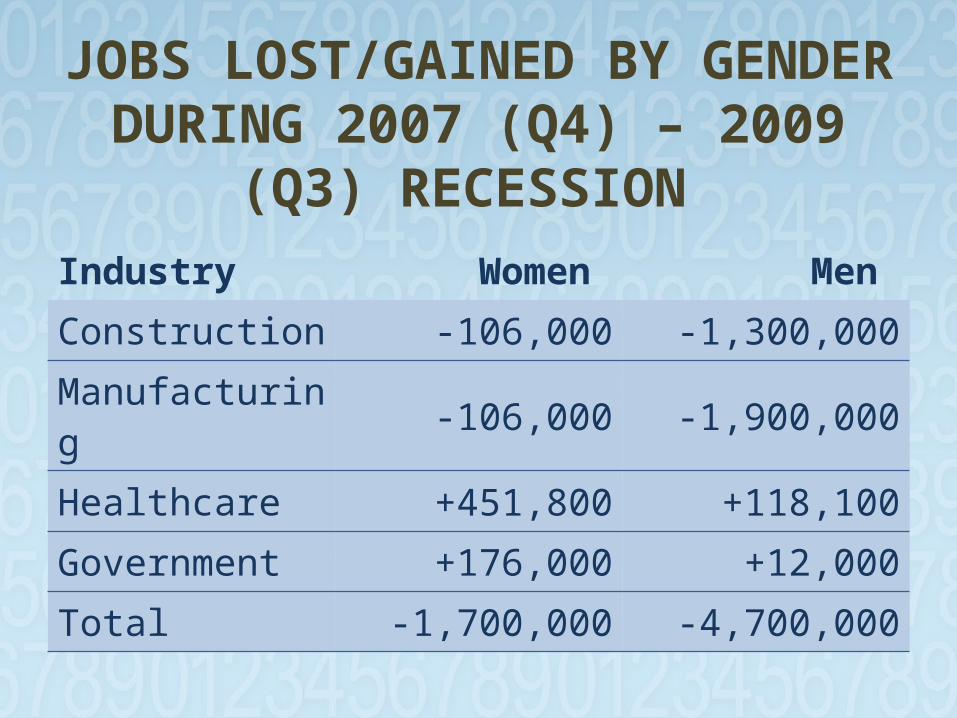
JOBS LOST/GAINED BY GENDER DURING 2007 (Q4)
– 2009 (Q3) RECESSION Industry Women Men Construction -106,000 -1,300,000Manufacturing -106,000 -1,900,000Healthcare +451,800 +118,100Government +176,000 +12,000Total -1,700,000 -4,700,000

COOLING WATERS FROM GRANDMA’S
WELL And Grandpa’s Too!
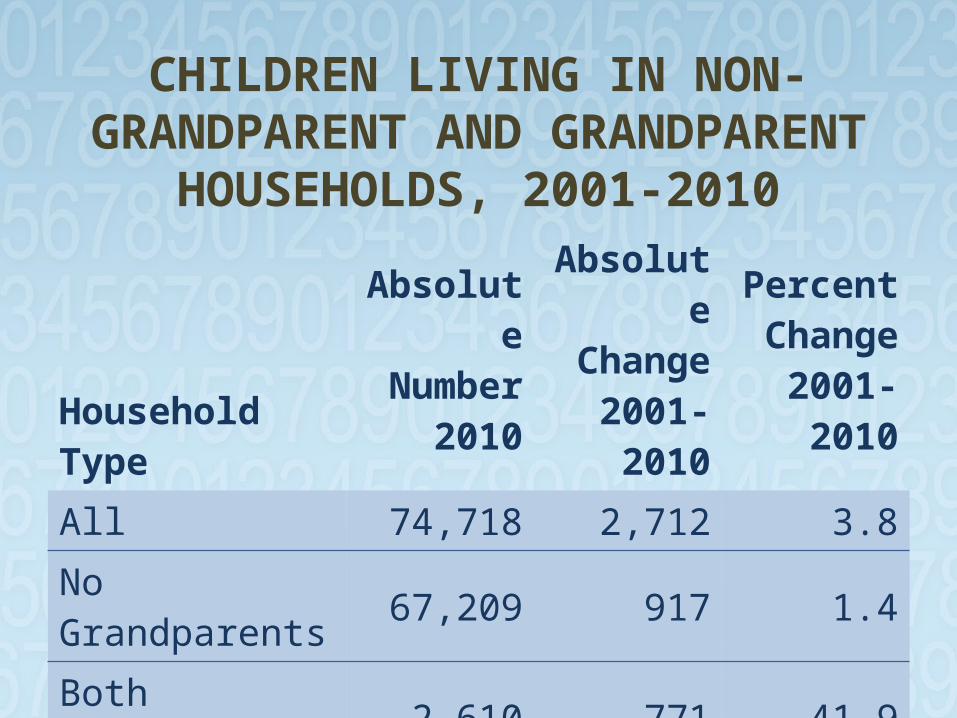
CHILDREN LIVING IN NON-GRANDPARENT AND
GRANDPARENT HOUSEHOLDS, 2001-2010
Household Type
Absolute Number
2010
Absolute Change
2001-2010
Percent Change
2001-2010All 74,718 2,712 3.8No Grandparents 67,209 917 1.4Both Grandparents 2,610 771 41.9Grandmother Only 1,922 164 9.3Grandfather Only 318 71 28.7
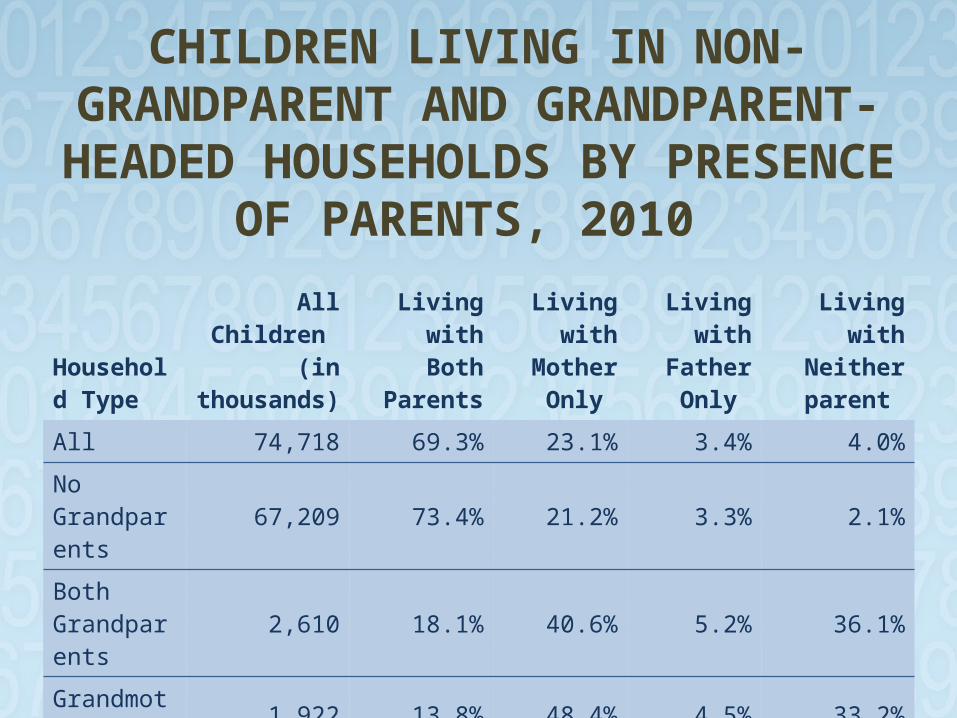
CHILDREN LIVING IN NON-GRANDPARENT AND
GRANDPARENT-HEADED HOUSEHOLDS BY PRESENCE OF
PARENTS, 2010 Household Type
All Children (in thousands)
Living withBoth Parents
Living with Mother Only
Living with Father Only
Living with Neither parent
All 74,718 69.3% 23.1% 3.4% 4.0%No Grandparents 67,209 73.4% 21.2% 3.3% 2.1%
Both Grandparents 2,610 18.1% 40.6% 5.2% 36.1%
Grandmother Only 1,922 13.8% 48.4% 4.5% 33.2%
Grandfather Only 318 26.4% 45.9% 4.4% 23.6%
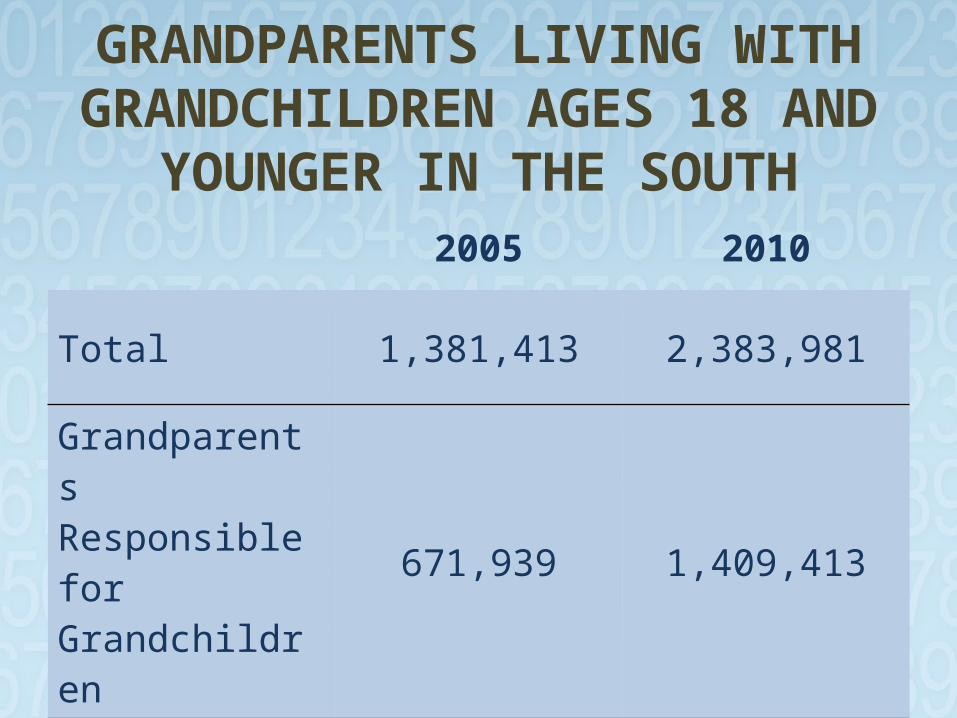
GRANDPARENTS LIVING WITH GRANDCHILDREN
AGES 18 AND YOUNGER IN THE SOUTH
2005 2010
Total 1,381,413 2,383,981
Grandparents Responsible for Grandchildren
671,939 1,409,413
Child's Parents in Household 290,882 946,390

...but Challenges Abound...but Challenges Abound
DIVERSITY RULESDIVERSITY RULES

...but insufficient...but insufficient
Education is NecessaryEducation is Necessary
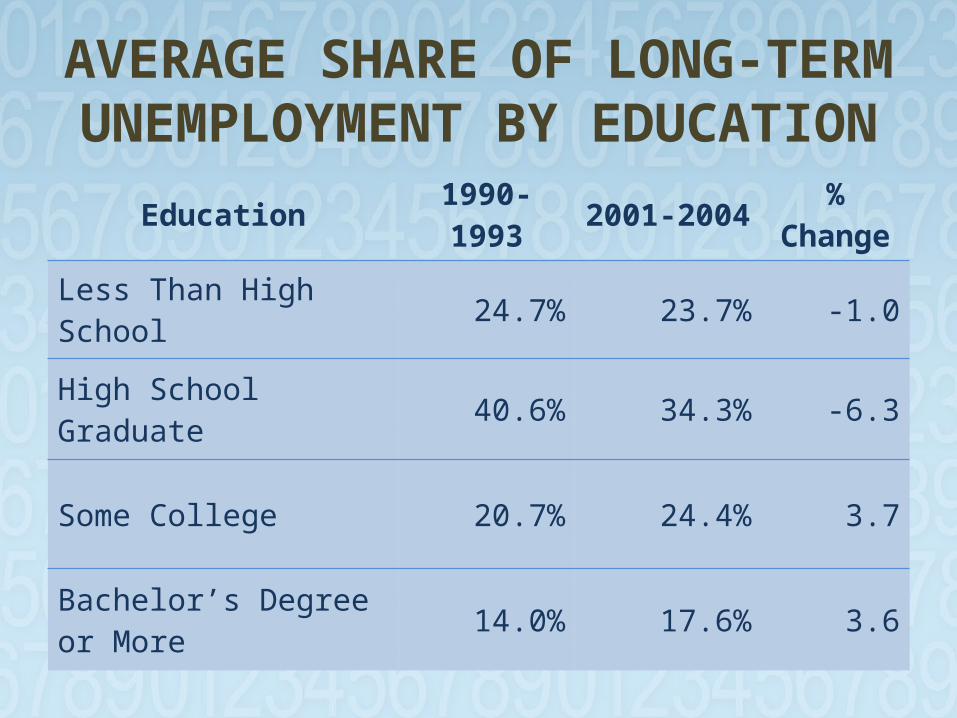
AVERAGE SHARE OF LONG-TERM UNEMPLOYMENT BY
EDUCATIONEducation 1990-1993 2001-2004 % Change
Less Than High School 24.7% 23.7% -1.0
High School Graduate 40.6% 34.3% -6.3
Some College 20.7% 24.4% 3.7
Bachelor’s Degree or More 14.0% 17.6% 3.6
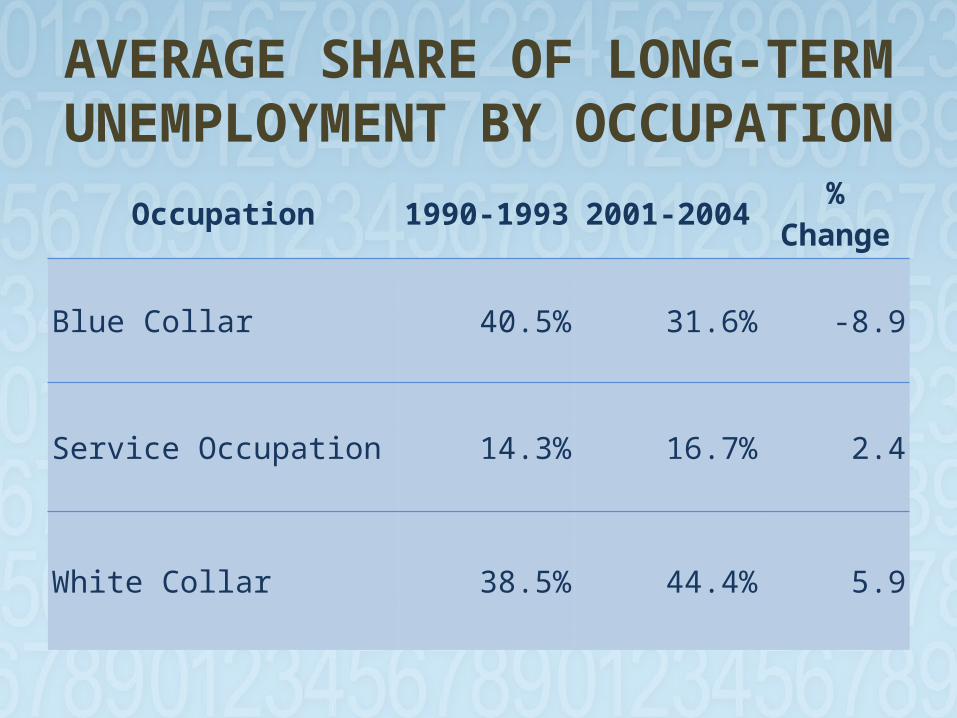
AVERAGE SHARE OF LONG-TERM UNEMPLOYMENT BY
OCCUPATIONOccupation 1990-1993 2001-2004 % Change
Blue Collar 40.5% 31.6% -8.9
Service Occupation 14.3% 16.7% 2.4
White Collar 38.5% 44.4% 5.9
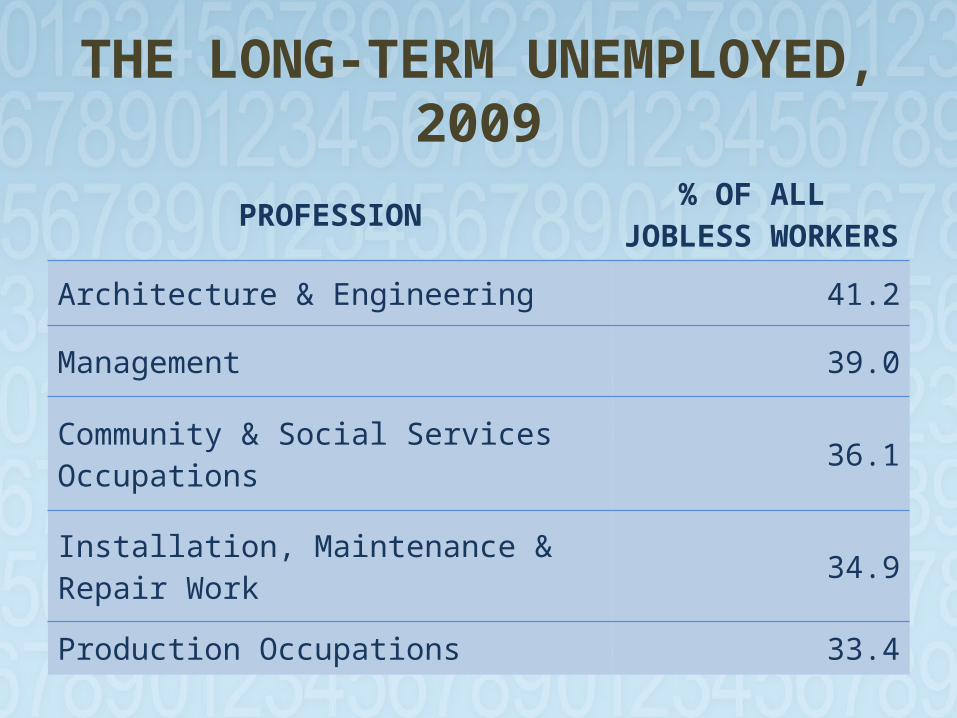
THE LONG-TERM UNEMPLOYED, 2009
PROFESSION % OF ALL JOBLESS WORKERS
Architecture & Engineering 41.2
Management 39.0
Community & Social Services Occupations 36.1
Installation, Maintenance & Repair Work 34.9
Production Occupations 33.4
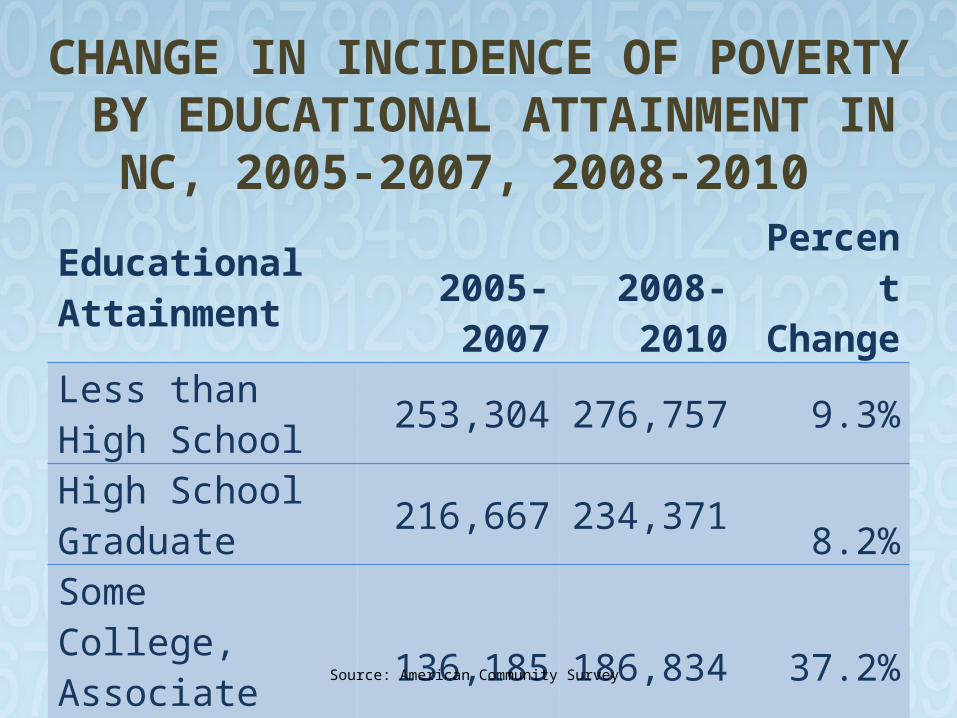
CHANGE IN INCIDENCE OF POVERTY BY EDUCATIONAL
ATTAINMENT IN NC, 2005-2007, 2008-2010 Educational
Attainment 2005-2007 2008-2010Percent Change
Less than High School 253,304 276,757 9.3%High School Graduate 216,667 234,371 8.2%Some College, Associate Degree 136,185 186,834 37.2%Bachelor’s degree or higher 49,082 57,919 18.0%
Source: American Community Survey

THE COMPETITIVE TOOL KIT
• Analytical Reasoning • Entrepreneurial Acumen• Contextual Intelligence • Soft Skills/Cultural Elasticity • Agility and Flexibility

Implications for Workforce Planning and Development
• Managing transition from the “graying” to the “browning” of America.
• Competition for talent will be fierce – and global.• Embrace immigrants. • Successful recruitment and retention will hinge on
your ability to effectively manage the full nexus of “diversity” issues.
• Actively engage in K-12 Education to ensure a steady flow of talent into higher education.
• Prepare students for the freelance economy July 2013 70
GROWING DEPENDENCY A Train Wreck in the Making
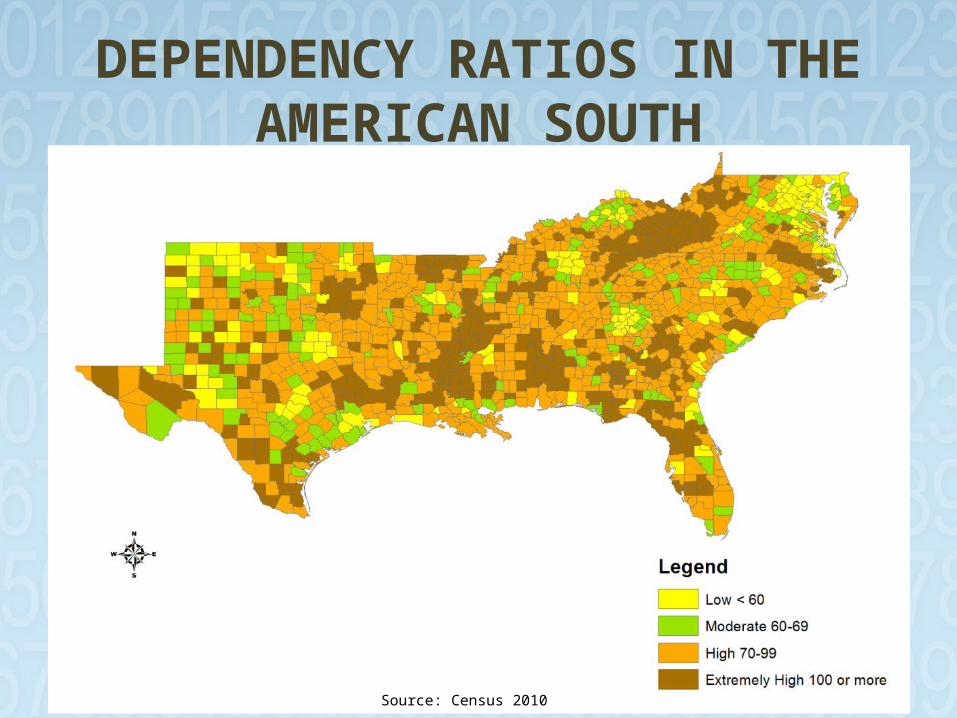
DEPENDENCY RATIOS IN THE AMERICAN SOUTH
Source: Census 2010
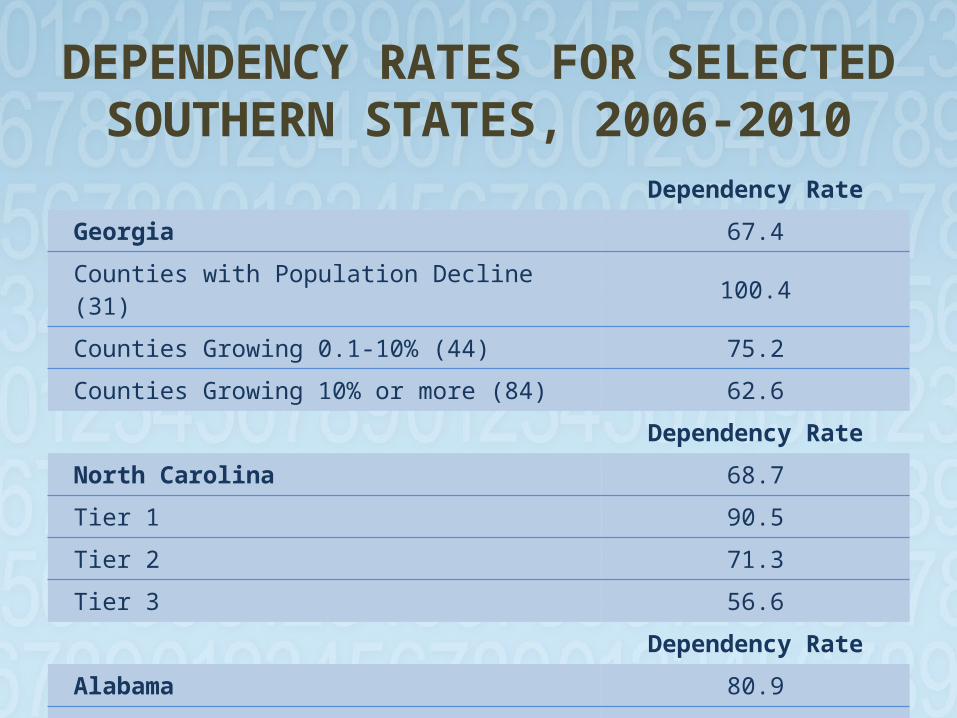
DEPENDENCY RATES FOR SELECTED SOUTHERN STATES,
2006-2010Dependency Rate
Georgia 67.4Counties with Population Decline (31) 100.4Counties Growing 0.1-10% (44) 75.2Counties Growing 10% or more (84) 62.6
Dependency RateNorth Carolina 68.7Tier 1 90.5Tier 2 71.3Tier 3 56.6
Dependency RateAlabama 80.95 Counties with Greatest % Loss 152.55 Counties with Greatest % Gain 67.1

THE END

Supplementary Slides
Immigrant Costs and Benefits
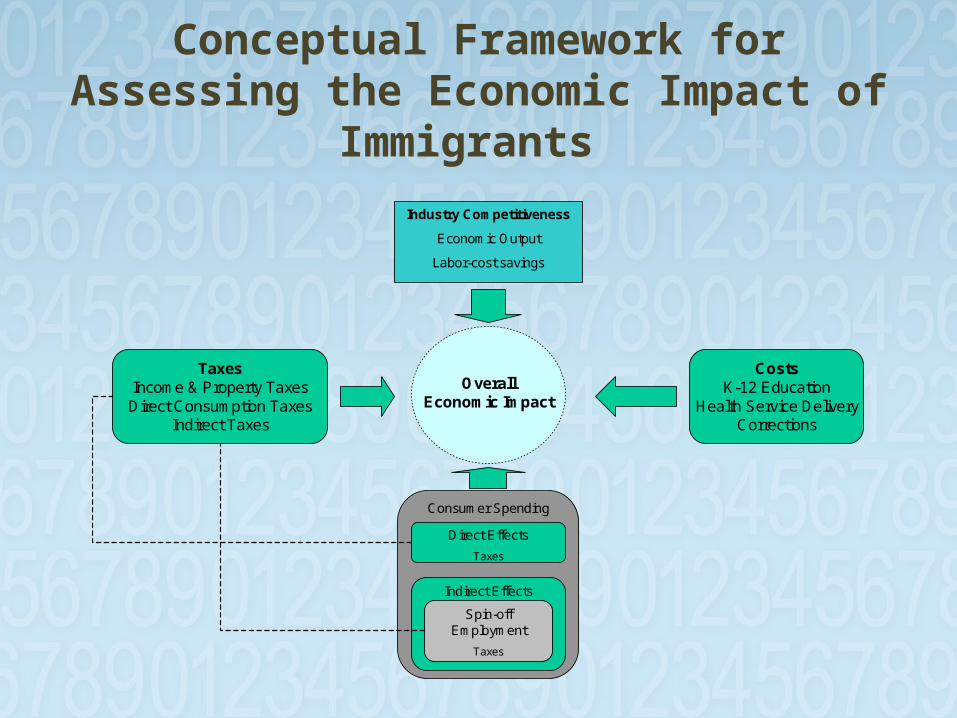
Conceptual Framework for Assessing the Economic Impact of
Immigrants
TaxesIncome & Property TaxesDirect Consumption Taxes
Indirect Taxes
Consumer Spending
Direct Effects
Taxes
Indirect Effects
Spin-off Employment
Taxes
Overall Economic Impact
Industry Competitiveness
Economic Output
Labor-cost savings
CostsK-12 Education
Health Service DeliveryCorrections
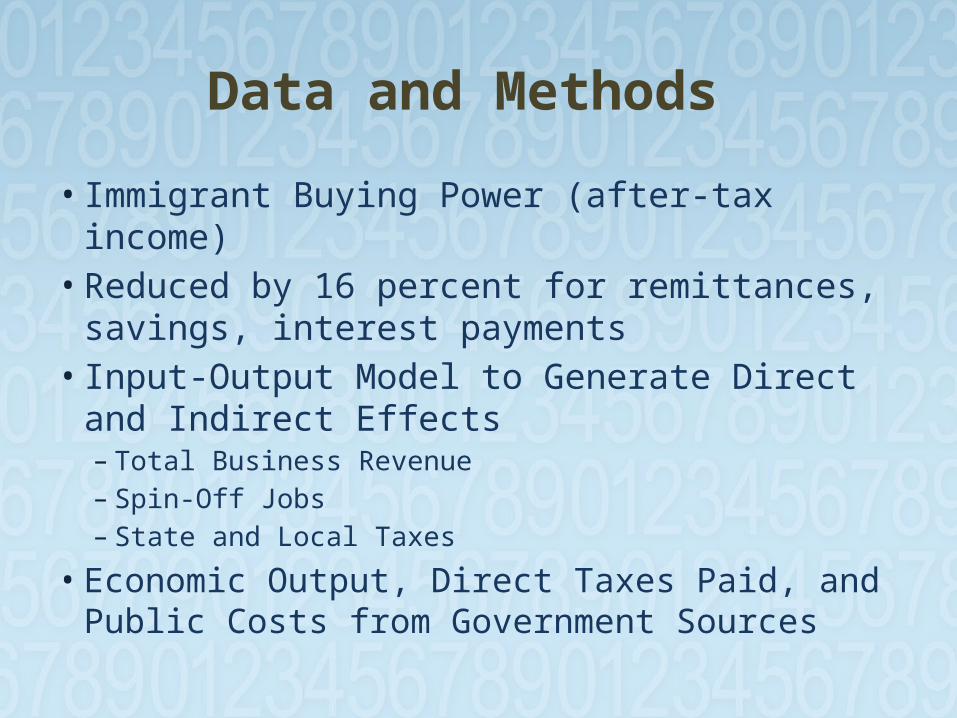
Data and Methods
• Immigrant Buying Power (after-tax income)• Reduced by 16 percent for remittances, savings,
interest payments• Input-Output Model to Generate Direct and
Indirect Effects– Total Business Revenue – Spin-Off Jobs– State and Local Taxes
• Economic Output, Direct Taxes Paid, and Public Costs from Government Sources
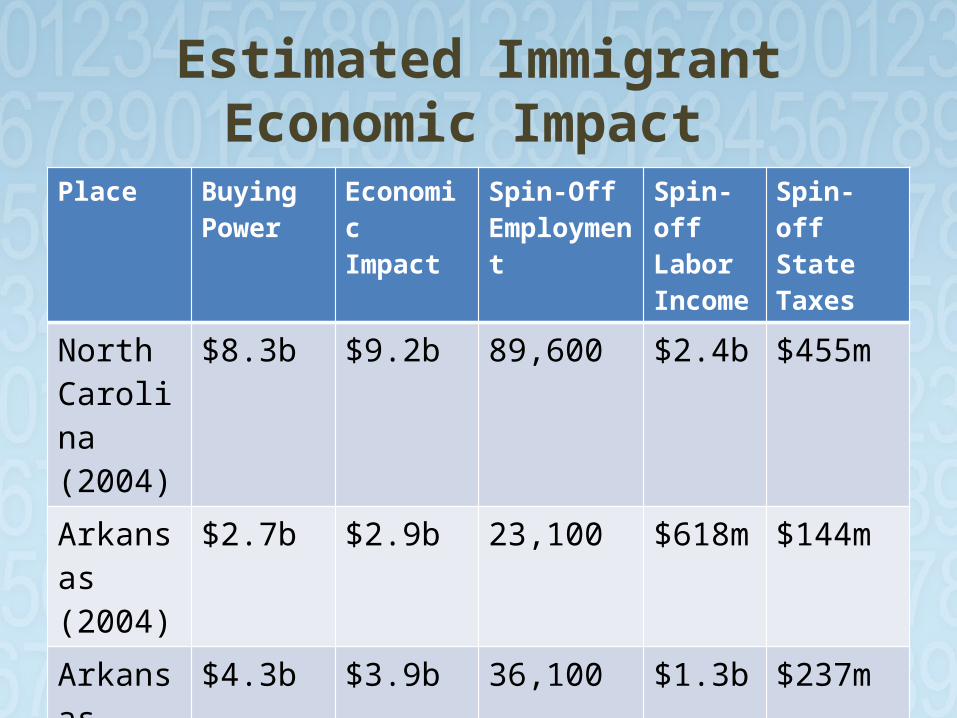
Estimated Immigrant Economic Impact
Place Buying Power
Economic Impact
Spin-Off Employment
Spin-off Labor Income
Spin-off State Taxes
North Carolina (2004)
$8.3b $9.2b 89,600 $2.4b $455m
Arkansas (2004)
$2.7b $2.9b 23,100 $618m $144m
Arkansas (2010)
$4.3b $3.9b 36,100 $1.3b $237m
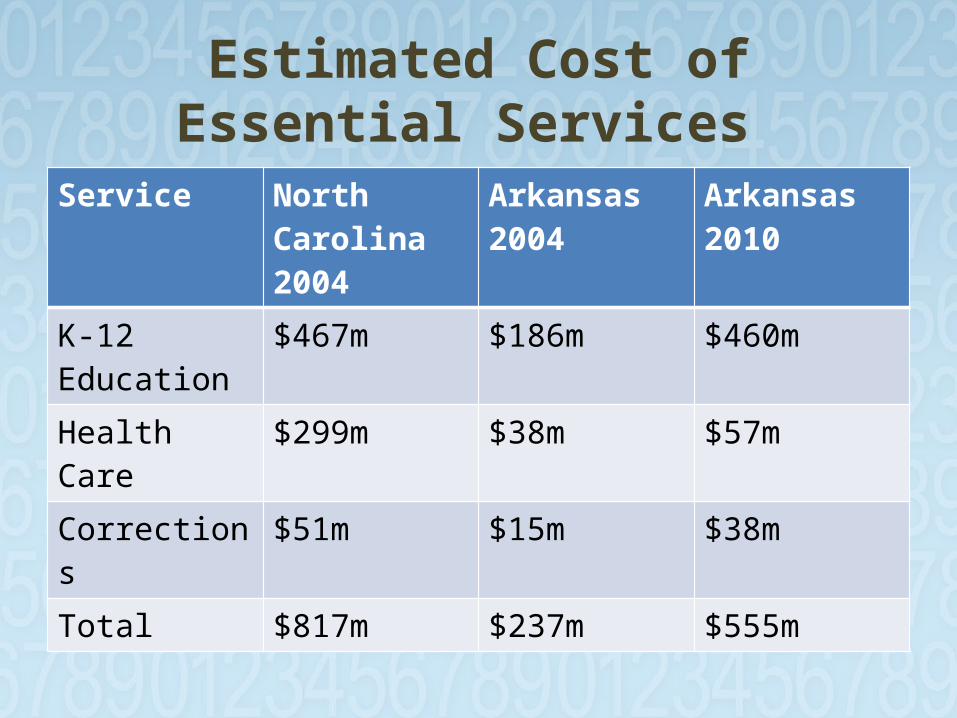
Estimated Cost of Essential Services
Service North Carolina 2004
Arkansas 2004
Arkansas 2010
K-12 Education $467m $186m $460mHealth Care $299m $38m $57mCorrections $51m $15m $38mTotal $817m $237m $555m
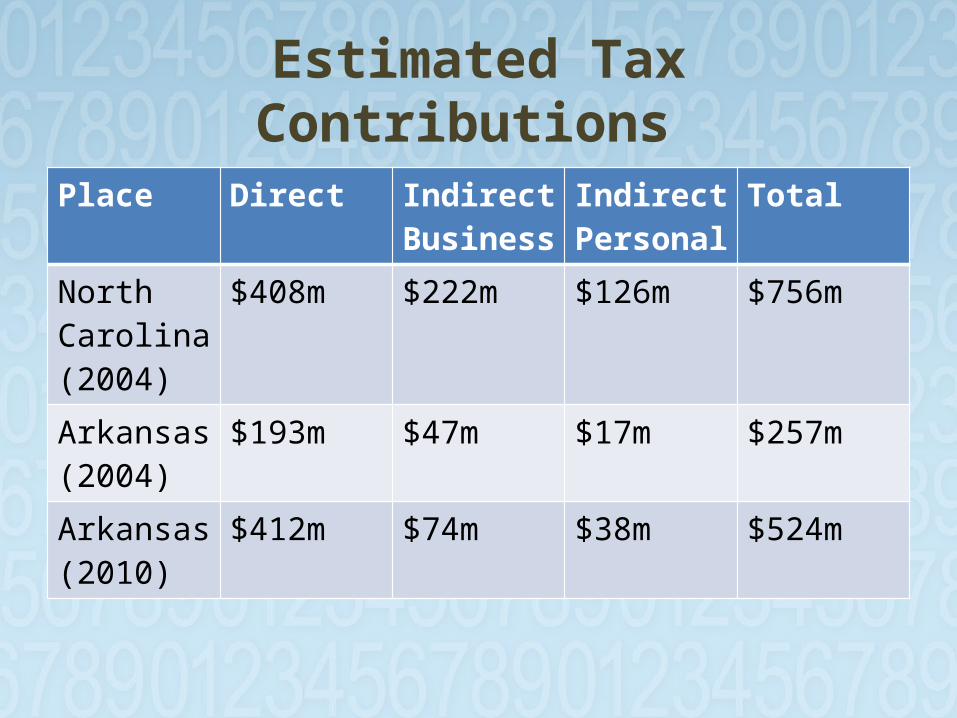
Estimated Tax Contributions
Place Direct IndirectBusiness
IndirectPersonal
Total
North Carolina(2004)
$408m $222m $126m $756m
Arkansas (2004)
$193m $47m $17m $257m
Arkansas (2010)
$412m $74m $38m $524m
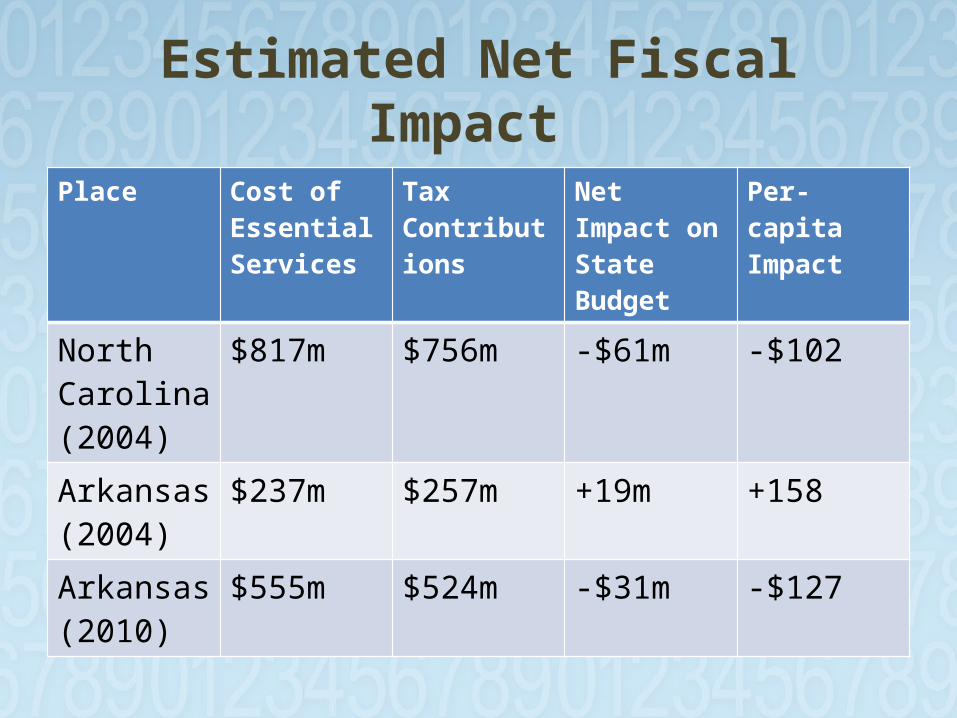
Estimated Net Fiscal Impact
Place Cost of Essential Services
Tax Contributions
Net Impact on State Budget
Per-capitaImpact
North Carolina (2004)
$817m $756m -$61m -$102
Arkansas (2004)
$237m $257m +19m +158
Arkansas (2010)
$555m $524m -$31m -$127
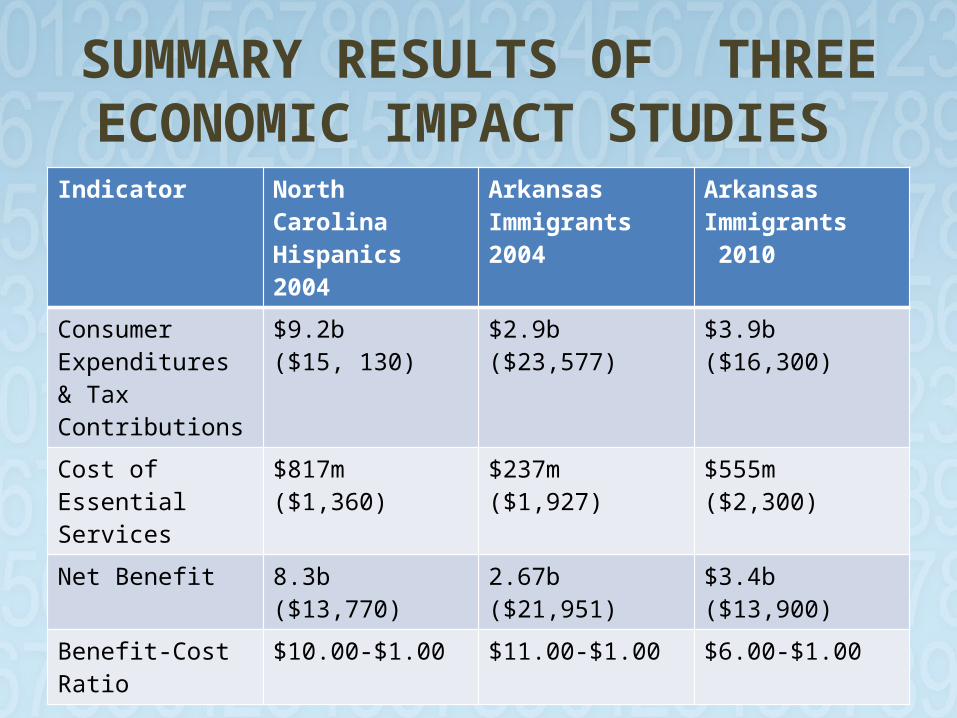
SUMMARY RESULTS OF THREE ECONOMIC IMPACT
STUDIES Indicator North Carolina
Hispanics 2004
Arkansas Immigrants 2004
Arkansas Immigrants 2010
Consumer Expenditures & Tax Contributions
$9.2b($15, 130)
$2.9b($23,577)
$3.9b($16,300)
Cost of Essential Services
$817m($1,360)
$237m($1,927)
$555m($2,300)
Net Benefit 8.3b($13,770)
2.67b($21,951)
$3.4b($13,900)
Benefit-Cost Ratio $10.00-$1.00 $11.00-$1.00 $6.00-$1.00
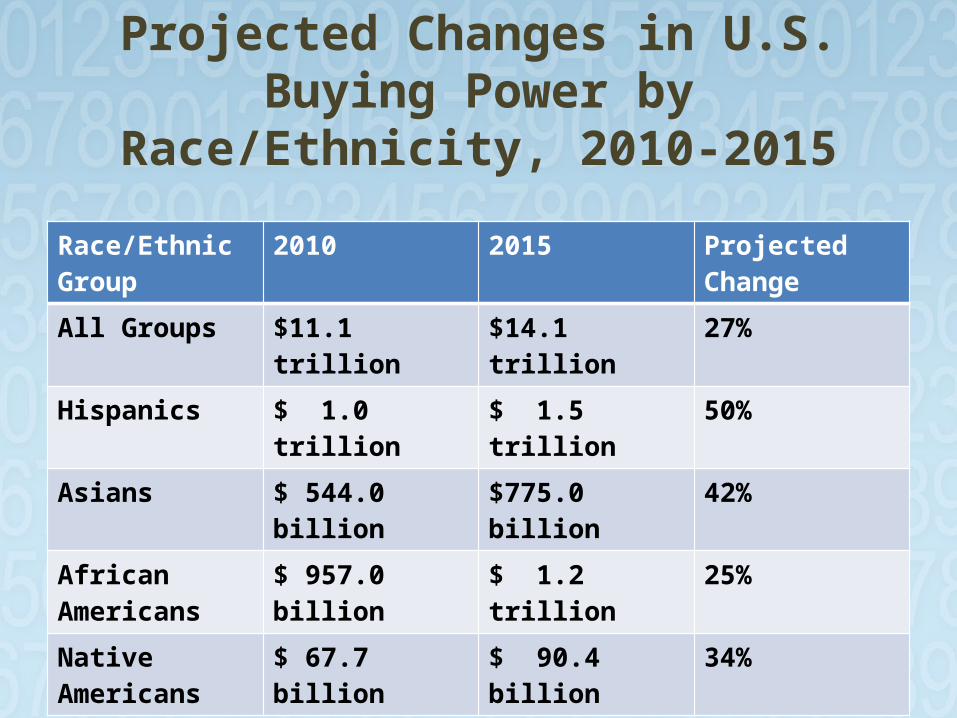
Projected Changes in U.S. Buying Power by
Race/Ethnicity, 2010-2015
Race/Ethnic Group
2010 2015 Projected Change
All Groups $11.1 trillion $14.1 trillion 27%Hispanics $ 1.0 trillion $ 1.5 trillion 50%Asians $ 544.0 billion $775.0 billion 42%African Americans
$ 957.0 billion $ 1.2 trillion 25%
Native Americans $ 67.7 billion $ 90.4 billion 34%
Value-Adds of Immigrants
• Boost economic growth & prosperity • Fuel knowledge creation • Contribute to innovation & technological
progress • Raise human capital levels & diversify
business leadership • Fill 3-D jobs • Increase tax revenues