Embed Size (px)
Citation preview

Graduate Theses, Dissertations, and Problem Reports
2018
Dispositional Optimism and Autonomic Reactivity during Difficult Dispositional Optimism and Autonomic Reactivity during Difficult
and Easy Stress Tasks and Easy Stress Tasks
Daniel Stephenson
Follow this and additional works at: https://researchrepository.wvu.edu/etd
Recommended Citation Recommended Citation Stephenson, Daniel, "Dispositional Optimism and Autonomic Reactivity during Difficult and Easy Stress Tasks" (2018). Graduate Theses, Dissertations, and Problem Reports. 6722. https://researchrepository.wvu.edu/etd/6722
This Dissertation is protected by copyright and/or related rights. It has been brought to you by the The Research Repository @ WVU with permission from the rights-holder(s). You are free to use this Dissertation in any way that is permitted by the copyright and related rights legislation that applies to your use. For other uses you must obtain permission from the rights-holder(s) directly, unless additional rights are indicated by a Creative Commons license in the record and/ or on the work itself. This Dissertation has been accepted for inclusion in WVU Graduate Theses, Dissertations, and Problem Reports collection by an authorized administrator of The Research Repository @ WVU. For more information, please contact [email protected].

Dispositional Optimism and Autonomic Reactivity During
Difficult and Easy Stress Tasks
Daniel Stephenson
Dissertation submitted
to the Eberly College of Arts and Sciences
at West Virginia University
in partial fulfillment of the requirements for the degree of
Doctor of Philosophy in Psychology
Kevin Larkin, Ph.D. – Chair
Amy Fiske, Ph.D.
Daniel McNeil, Ph.D.
Nicholas Turiano, Ph.D.
Stephanie Frisbee, Ph.D.
Department of Psychology
Morgantown, West Virginia
2018
Keywords: optimism, pessimism, stress task, autonomic reactivity
Copyright 2018 Daniel Stephenson
ABSTRACT
Dispositional Optimism and Autonomic Reactivity During
Difficult and Easy Stress Tasks
Daniel Stephenson
Studies examining the association between dispositional optimism and autonomic reactivity to
stress have yielded mixed results, with some studies finding associations between optimism and
less reactivity, some studies finding no association between optimism and reactivity, and some
finding that optimism was associated with greater reactivity. One factor not considered
previously in this literature is difficulty of the stressful task employed to elicit autonomic
reactivity. The current study was based on Carver and Scheier’s Behavioral Self-Regulation
Model (Carver & Scheier, 2000), that states that optimists are more likely to persist in
overcoming challenging obstacles than pessimists. The current study investigated whether the
relation between optimism and autonomic reactivity to stress differed depending on the difficulty
of the stressful task. This study employed a quasi-experimental design in which participants
were classified as optimists or pessimists based on their score on a validated measure of
optimism. Participants were randomized to complete either an easy Raven’s Matrices stress task
or a difficult Raven’s Matrices stress task. Blood pressure (systolic, diastolic, mean arterial),
heart rate, and heart rate variability were measured throughout the pre-task rest period, the task
period, and a recovery period. It was hypothesized that optimists would exhibit increased
cardiovascular reactivity when confronting a difficult stress task compared to pessimists, due to
fully engaging their resources to overcome the task. Conversely, pessimists were hypothesized
to exhibit less cardiovascular reactivity during the difficult task, because they were not fully
engaged in solving the problems. No differences in cardiovascular reactivity between optimists
and pessimists were hypothesized during the easy task, because both groups would be equally
engaged with the task.
Results revealed that optimists had greater diastolic blood pressure reactivity to both the
easy and difficult stress tasks compared to pessimists, suggesting they may have been more
engaged with the tasks compared to pessimists. Indeed, optimists reported being more persistent
in completing the problems and performing better on them compared to pessimists. Analysis of
affective responses to the tasks showed that optimists reported more positive affect and less
negative affect than pessimists during the laboratory session. However, there were no
differences between optimists and pessimists on task performance, ratings of task self-efficacy,
and ratings of task difficulty, stressfulness, discomfort, or perceived effort. Significant task
effects were revealed as well, verifying that the easy and difficult tasks were experienced
differently. Participants completing the difficult task performed more poorly, reported less
positive and more negative affect in response to the task, and rated the task as more difficult,
stressful, effortful, and upsetting than participants completing the easy task. Although results of
the study failed to confirm study hypotheses, they added credence to the Behavioral Self-
Regulation Model because optimists appeared to be engaging more with both easy and difficult
versions of the stress task than pessimists, and consequently, experienced greater DBP reactions
during the task period than pessimists.

iii
TABLE OF CONTENTS
Introduction 1
Dispositional Optimism and its Associated Health Benefits 2
Mechanisms through which Optimism Improves Health 5
Optimism and Decreased Autonomic Reactivity to Stress 7
The Behavioral Self-Regulation Model 14
The Behavioral Self-Regulation Model and Reactivity to Stress Tasks 15
Aims of Proposed Study 17
Method 18
Participants 18
Measures 20
Experimental Design 25
Stress task development and pilot testing 25
Procedure 27
Results 29
Data Cleaning and Reduction 29
Preliminary Analyses 30
Cardiovascular Measures at Rest 35
Primary Analyses: Cardiovascular Reactivity to the Task 35
Primary Analyses: Cardiovascular Recovery from Stress 38
Task Score 40
Measures of Affect 41
Post-Experimental Questionnaire 42

iv
Self-efficacy Ratings 44
Analysis of Optimism and Pessimism Subscales 45
Health Behaviors and Demographic Differences Between Optimists 46
and Pessimists
Chaos Theory 47
Discussion 48
Health Behaviors and Demographic Differences Between Optimists 59
and Pessimists
Strengths and Limitations 60
Future Directions 63
Summary and Conclusions 64
References 66
Tables 79
Figures 83
Appendices 90

OPTIMISM AND AUTONOMIC REACTIVITY 1
Dispositional Optimism and Autonomic Reactivity During
Difficult and Easy Stress Tasks
The influence of psychosocial factors on physical health is well documented. For several
decades, evidence demonstrating that negative psychosocial factors, including depression,
anxiety, hostility, social isolation, and chronic stress are related to poor physical health has
accrued. For example, depression and social isolation are both related to increased risk of all-
cause mortality (e.g., House, Landis, & Umberson, 1988; Zivin et al., 2015). Both depression
and anxiety are related to increased experience of chronic pain and increased disability related to
chronic pain (e.g., Lerman, Rudich, Brill, Shalev, & Shahar, 2015). Depression, anxiety, and
social isolation are also linked to poorer prognosis following the diagnosis of several chronic
diseases (Boden-Albala, Litwak, Elkind, Rundek, & Sacco, 2005; Chan, Wan Ahmad, Yusof,
Ho, & Krupat, 2015; Noyes Jr, & Kathol, 1985).
Negative psychosocial factors also specifically influence cardiovascular health. For
example, depression, anxiety, social isolation, chronic life stress, and hostility each contribute to
the etiology of coronary artery disease (CAD; e.g., Rozanski, Blumenthal, & Kaplan, 1999;
Shimbo et al., 2009; Whooley & Wong, 2013). Depression, anxiety, hostility, and social
isolation are also related to increased initial cardiac events among community samples and
higher mortality rate among patients already diagnosed with CAD (e.g., Barth, Schumacher, &
Herrmann-Lingen, 2004; Roest, Martens, Denollet, & de Jonge, 2010; Wong, Sin, & Whooley,
2014). Despite the importance of considering psychosocial risk factors along with the standard
risk factors for CAD (i.e., sex; family history of CAD; smoking; hypercholesterolemia,
hypertension, diabetes), considerable variance in predicting onset of CAD remains unexplained.
This has led toward the examination of additional constructs that may be useful in predicting the
negative health consequences associated with CAD.

OPTIMISM AND AUTONOMIC REACTIVITY 2
Recently, evidence that positive psychosocial factors are associated with improved
physical health has been accumulating. For example, those with high levels of social support
have better health outcomes than those with low social support (Uchino, 2006). Specifically,
high social support is related to lower mortality caused by cancer, infectious diseases, and
cardiovascular disease. Forgiveness is also linked to improved health; following a traumatic
injury, those who forgave the person responsible for the accident experienced faster recovery and
improved health status than those who did not engage in forgiveness (Webb, Toussaint,
Kalpakjian, & Tate, 2010). Furthermore, numerous constructs from positive psychology,
including forgiveness, emotional vitality, social support, and optimism, have all been linked to a
decreased risk of developing CAD (Tay, Tan, Diener, & Gonzalez, 2013; Tindle et al., 2009;
Waltman, et al., 2009). The proposed study aims to examine one of these constructs,
dispositional optimism, by exploring the proposed physiological mechanisms through which it
could exert its salubrious effects on cardiovascular health.
Dispositional Optimism and its Associated Health Benefits
Dispositional optimism is a positive psychosocial trait that has received considerable
attention. Dispositional optimism is defined as a pattern of expecting that, in the future, good
things will be more abundant than bad things (Scheier & Carver, 1992). Optimists generally
expect the future to be favorable, and believe that they are capable of obtaining their goals
(Scheier & Carver, 1992). Conversely, those low in optimism expect future outcomes to be less
positive, and believe that their goals may not be entirely obtainable. Dispositional optimism is
most frequently measured using the Life Orientation Test or the Life Orientation Test – Revised
(LOT and LOT-R, respectively; Scheier & Carver, 1992), a 10-item self-report scale. Many
theorists have conceptualized the LOT/LOT-R as representing a single construct, with high and

OPTIMISM AND AUTONOMIC REACTIVITY 3
low scores falling on a single continuum of “optimism” (i.e., low optimism is equivalent to
pessimism). However, several investigators have found that the LOT/LOT-R has a two-factor
structure, each measuring distinct constructs of optimism and pessimism (Kubzansky,
Kubzansky, & Maselko, 2004; Raikkonen, & Matthews, 2008; Scheier, Carver, & Bridges,
1994). From this perspective, being low on optimism does not necessarily translate into being
pessimistic. Based upon this conceptualization of this positive psychology construct, developers
of the LOT/LOT-R have recommended that initial “total optimism score” analyses should be
followed by analyzing the optimism and pessimism subscales separately (Scheier et al., 1994).
Although several studies have found that the LOT/LOT-R has two separate factors, the majority
of research examining the relation between optimism and health has utilized the LOT/LOT-R as
a measure of a single construct (Rasmussen, Scheier, & Greenhouse, 2009). Optimism as a
construct is conceptually and inversely related to other personality traits such as neuroticism and
trait anxiety, and it has been suggested that these variables be included as covariates when
assessing relations between optimism and health (Scheier et al., 1994; Kennedy & Hughes,
2004).
The health benefits related to dispositional optimism are well documented. For instance,
in a longitudinal study by Peterson, Seligman, and Vaillant (1988), 99 healthy male graduates of
Harvard University were followed from age 25 to age 60 years. Those with high levels of
optimism had better overall health and lower mortality rates 30 years later than males with low
optimism scores. Evidence also suggests that optimism may increase immune functioning.
Using a self-report weekly stress log, Cohen et al. (1999) found that during weeks with high
levels of acute stress (e.g., stressors lasting less than one week), immune markers such as CD4
helper t-cell and CD8 cytotoxic t-cell counts were significantly higher among individuals with

OPTIMISM AND AUTONOMIC REACTIVITY 4
high dispositional optimism (Cohen et al., 1999). Similarly, among law students in their first
semester of law school, optimistic students were found to have better immune functioning (e.g.,
higher numbers of helper T cells and higher natural killer cell cytotoxicity) than less optimistic
students (Segerstrom, Taylor, Kemeny, & Fahey, 1998). Optimism may also influence
pulmonary functioning; among men aged 45-89 years, those with high optimism had a slower
decline in pulmonary functioning than those with low optimism over the course of approximately
10 years (Kubzansky et al., 2002).
While dispositional optimism clearly is associated with a broad range of positive health
outcomes, the best-documented association between optimism and health is the link between
optimism and cardiovascular-related health outcomes. Substantial evidence from prospective
studies confirms that having an optimistic disposition is associated with reduced risk of
cardiovascular disease (CVD). A longitudinal study that followed initially healthy males (mean
age 60.8 years) in a community sample showed that those who were optimistic were less likely
to have developed or died from CVD 10 years later than those with low scores on optimism
(Kubzansky, Sparrow, Vokonas, & Kawachi, 2001). Lower rates of CVD and death due to CVD
have also been found among post-menopausal women high in optimism aged 50-79 years who
were followed for approximately eight years (Tindle et al., 2009). Indeed, some evidence
suggests that having high dispositional optimism may be associated with a reduction in risk of
CVD by up to 50% (Boehm & Kubzansky, 2012). While being optimistic is associated with a
reduction in the likelihood that one will develop CVD in the future, it also is associated with
better prognosis after developing the disease; cardiac patients high in optimism have fewer
subsequent cardiac events, lower cardiovascular-related mortality rates, report less pain, have
fewer complications, and recover more quickly than those low in optimism following myocardial

OPTIMISM AND AUTONOMIC REACTIVITY 5
infarction and/or cardiac surgery (e.g., Grewen et al., 2000; Mahler, & Kulik, 2000; Scheier, &
Carver, 1987).
Mechanisms through which Optimism Improves Health
The relation between dispositional optimism and physical health, especially
cardiovascular health, is well established. However, the specific mechanisms through which
optimism influences health are unknown. One possible mechanism by which optimism
influences physical health is through the range and type of coping strategies an individual uses to
manage stress. According to Carver and Scheier (2000), when an obstacle is encountered,
individuals typically assess the likelihood that they can overcome the obstacle. Because
optimists believe they can obtain their goals, they are more likely to approach and strive to
overcome obstacles. Less optimistic individuals may not believe they are able to overcome
obstacles, and are therefore less likely to attempt to overcome them. Indeed, optimistic
individuals tend to use approach-focused coping strategies, in which they work to overcome or
remove the stressor by dealing with it directly, more than other coping strategies (Billingsley,
Waehler, & Hardin, 1993; Scheier, Weintraub, & Carver, 1986). Optimists may also use
problem-focused coping strategies when faced with health-related obstacles. For example, if
optimists know that they have a family history of heart disease (obstacle), they are more likely to
address the obstacle directly by exercising or eating a healthy diet, so that health can be
maintained (goal). Conversely, pessimists who have family histories of heart disease may be less
likely to see future health as attainable, and therefore, be less likely to engage in preventive
measures.
Another clue to how optimism may improve health is found in the relation between
optimism and health behaviors. Dispositional optimism has been linked to higher levels of

OPTIMISM AND AUTONOMIC REACTIVITY 6
physical activity, greater consumption of nutrient-rich foods, and lower levels of tobacco use
(e.g., Giltay, Geleijnse, Zitman, Buijsse, & Kromhout, 2007; Kelloniemi, Ek, & Laitinen, 2005).
Health behaviors engaged in by optimists may be conceptualized as approach-style coping
strategies in which a desired health outcome is the goal. Consequently, it is likely that the
improved cardiovascular health observed among optimists is related to their adherence to a
healthier lifestyle.
Several researchers have suggested a third mechanism through which dispositional
optimism influences health outcomes: the magnitude and pattern of one’s autonomic nervous
system response to stress. The autonomic nervous system consists of the sympathetic branch and
the parasympathetic branch, both of which are responsive to exposure to stress (McEwen &
Stellar, 1993). In brief, during stress, both branches of the autonomic nervous system interact,
resulting in increased blood pressure (BP), respiration rate, sweating on the hands and feet
(resulting in increased electrical skin conductance), dilation of the pupils, accelerated heart rate
(HR), and decreased gastro-intestinal activity and heart-rate variability (HRV). Multiple studies
have demonstrated that the magnitude of one’s autonomic response (especially cardiovascular
response) to stress is predictive of future cardiovascular disease (e.g., Carroll et al., 2012; Krantz
& Manuck, 1984; Treiber et al., 2003). Furthermore, prolonged elevation of cardiovascular
parameters following a stressful experience (i.e., delayed recovery) is also indicative of future
cardiovascular disease (e.g., Chida & Steptoe, 2010; Steptoe & Marmot, 2005). Thus, those
whose autonomic nervous systems exhibit the highest reactivity during stress and slowest
recovery to resting levels following stress are more likely to develop CVD.
Several researchers have examined the possibility that the link between optimism and
physical health is due, at least in part, to lower autonomic reactivity and/or quicker autonomic

OPTIMISM AND AUTONOMIC REACTIVITY 7
recovery when exposed to stress among those high in optimism. Because BP and HR reactivity
to stress are the most closely linked to future CVD, most of the research on this topic has focused
on these two indicators of autonomic reactivity. However, other indices of autonomic activity,
such as skin conductance, have also been examined in relation to dispositional optimism.
Optimism and Decreased Autonomic Reactivity to Stress
In all, 13 studies completed between 1990 and 2017 have examined the relation between
dispositional optimism and attenuated autonomic reactivity to stress. Of these studies, 11
assessed autonomic parameters during an acute laboratory stressor and two assessed ambulatory
blood pressure over an extended period of time. BP, HR, and skin conductance are the only
autonomic parameters that have been examined in these studies. A brief description of each of
these 13 studies follows.
Williams, Riels, and Roper (1990) were the first to examine the association between
optimism and BP response to stress. Fifty-six undergraduate students completed both a mental
arithmetic stress task, during which their mistakes were corrected, and a Simon® stress task,
during which the participant replicated a pattern of lights displayed as quickly as possible. Both
stress tasks were six minutes in duration and were preceded by rest periods. They found that
those high in dispositional optimism had lower diastolic blood pressure (DBP) reactivity during
the mental arithmetic stress task only, in comparison to those low in optimism. Optimism did
not influence systolic blood pressure (SBP) or HR reactivity during the mental arithmetic task,
and did not affect SBP, DBP, or HR reactivity during the Simon® stress task. The authors
concluded that their results supported the hypothesis that the mechanism through which
dispositional optimism was associated with improved health could be reduced autonomic
reactivity to stress (Williams et al., 1990).

OPTIMISM AND AUTONOMIC REACTIVITY 8
Eleven years later, Segerstrom (2001) examined the relation between optimism and
attentional bias. Forty-seven undergraduate students completed an “emotional Stroop task”
containing words with emotional valence (positive or negative). They found that when words
with negative emotional meaning were presented, optimism was negatively related to skin
conductance, indicating less autonomic arousal. However, when words with positive emotional
meaning were presented, the association between optimism and skin conductance was positive,
(albeit a weaker relation than when negative stimuli were presented). The authors noted,
however, that after controlling for trait anxiety, the interaction between optimism and emotional
content of the words was no longer significant in predicting skin conductance reactivity.
In 2004, Kennedy and Hughes (2004) sought to replicate the findings of Williams et al.
(1990) and explore neuroticism as a possible moderator of the relation between optimism and
BP/HR reactivity to an acute laboratory stressor. After a rest period, each of the 50 female
undergraduate participants completed a brief (3 minute) mental arithmetic task (without
correction of mistakes), followed by a 5-minute recovery period. They found no differences
between high-optimists and low-optimists in SBP, DBP, or HR reactivity or recovery during or
after the stress task. The main effect for optimism was not significant either with or without
neuroticism included as a covariate. However, they found that neuroticism was directly related
to both SBP and DBP reactivity during the stress task. They concluded that dispositional
optimism did not influence BP or HR reactivity during stress, but that other personality variables,
such as neuroticism, may be underlying factors that account for any optimism-stress reactivity
relations observed in prior work (Kennedy & Hughes, 2004).
Following the recommendation by Kennedy and Hughes (2004) to examine the relation
between dispositional optimism and stress reactivity in light of other variables, several later

OPTIMISM AND AUTONOMIC REACTIVITY 9
studies included various moderator variables in their examination of the association between
dispositional optimism and reactivity to stress. Bonfiglio (2005) examined the moderating
effects of social support on the optimism-stress reactivity relation. After a rest period, all 85
female undergraduate participants completed a five minute mental arithmetic task during which
they were instructed to “work faster and more accurately.” The author found that neither
optimism nor social support was associated with SBP, DBP, or HR reactivity during stress.
Furthermore, dispositional optimism and social support did not interact to influence BP or HR
reactivity to stress. Dispositional optimism was also unrelated to SBP, DBP, or HR recovery
following the stress task.
Contrary to the majority of researchers examining the optimism-autonomic arousal
association, Nes, Segerstrom, and Sephton (2005) predicted that optimists, in contrast to
pessimists, were likely to engage more and persist in a task longer when their goals were viewed
as obtainable (see Carver and Scheier, 2000), and therefore experience more autonomic nervous
system (HR and skin conductance) reactivity to a stressor. They also hypothesized that this
relation would be moderated by self-awareness (measured by the Self-Consciousness Scale),
which makes one’s current status related to goals more salient. If one was optimistic and aware
of their current standing with their goals, they would be more likely to persist and have greater
arousal. Fifty-four undergraduates completed a 20-minute anagram stress task compromised of
11 anagrams, of which the first was insoluble, and the remaining 10 were solvable and of
moderate difficulty. Optimism was not associated with either HR or skin conductance reactivity
to the anagram task. During recovery, however, optimism interacted with self-awareness to
predict skin conductance recovery; optimism was associated with slower skin conductance
recovery, but only for those participants in the high self-awareness condition.

OPTIMISM AND AUTONOMIC REACTIVITY 10
One year later, Clark, Benkert, and Flack (2006) examined how optimism and history of
violence exposure interacted to predict BP and HR reactivity to stress. One-hundred seventy-two
black youth (mean age of 11.5 years) underwent a 10-minute rest period followed by a six
minute digits-forward and digits-backward recollection task. Using the Perceived Life Chances
Scale (Jessor, Donovan & Costa, 1996) as an index of optimism, they found that optimism alone
was not a significant predictor of SBP, DBP, or HR reactivity to stress. However, dispositional
optimism moderated the effect of violence exposure on both SBP and HR reactivity to the task.
For those high in optimism, violence exposure was inversely related to SBP reactivity. For those
low in optimism, no relation between violence exposure and SBP reactivity was observed.
However, for those low in optimism, violence exposure was positively related to HR reactivity to
stress, while no relation was observed for those high in optimism.
Richman, Bennett, Pek, Siegler, and Williams, (2007) examined the association between
several variables (optimism, race, past discrimination, trait-hostility) and cardiovascular
reactivity to stress. Participants from a community sample consisting of 165 adults (ages 18-50)
completed a 5 minute “stress” task during which they were supposed to recall and relate a
personal experience that made them very angry. While they did not find a main effect of
optimism on any cardiovascular reactivity parameter, they found a three-way interaction between
race, perceived discrimination, and optimism on DBP reactivity to the anger-recall task. DBP
increased among participants who had high perceived past discrimination and were high in
optimism, and this relation was more pronounced among black participants. While there was no
main effect of dispositional optimism on BP or HR reactivity or recovery, the observed
interaction is contrary to the hypothesis that optimism is associated with reduced cardiovascular
reactivity to stress.

OPTIMISM AND AUTONOMIC REACTIVITY 11
Later, Geers, Wellman, Helfer, Fowler, and France (2008) examined the relation between
dispositional optimism and pain. They hypothesized that priming participants with either
“health” or neutral primes would influence reactivity to the task. Seventy-two undergraduate
participants underwent a 10-minute rest period, followed by a sentence-scramble task and a two-
minute cold-pressor task. Their results indicated that high dispositional optimism was associated
with lower HR reactivity to the cold-pressor task; however, this finding was qualified by a
significant interaction between optimism and prime condition on HR reactivity. High optimism
was associated with lower HR reactivity only in the neutral primed group. A similar interaction
between optimism and prime condition for DBP was observed; high optimism was related to
lower DBP reactivity only in the group that received the neutral prime.
Terrill, Ruiz, and Garofalo (2010) sought to determine if the buffering effect of optimism
on cardiovascular reactivity to stress depended on the nature of the stressor. Ninety
undergraduate participants completed both a three-minute cold-pressor task and an 8-minute
social speech task (3 minutes mental rehearsal, 5 minutes of speech delivery) during which they
related a personally embarrassing experience in front of a video camera. When subscales of the
LOT-R were analyzed separately, higher optimism was linked to less MAP reactivity to the
mental rehearsal portion of the speech task. The authors also noted that optimism had a marginal
inverse association with DBP reactivity during mental rehearsal (p = 0.06). Furthermore, higher
optimism was associated with faster SBP and MAP recovery following the speech task. The
authors commented that given their results, the cardiovascular benefits of optimism (e.g.,
attenuated BP response and faster BP recovery) may only be present during social stress, as
opposed to non-social stressors.

OPTIMISM AND AUTONOMIC REACTIVITY 12
Puig-Perez et al. (2015) examined the association between optimism and HR response to
a stressor among an older sample (ages: 55-76 years). Participants were randomized into either a
stress group or a control group. In the stress group, participants completed a 10-minute Trier
Social Stress Task (TSST), in which they gave a 5-minute speech about why they were a good
job candidate, followed by five minutes of serial subtraction, both performed in front of two
confederate observers. The control group task involved giving a five-minute speech about a
neutral topic, followed by five minutes of easy serial addition. In the control group, neither task
was performed in front of a committee. Puig-Perez et al. (2015) first ran their analyses with a
total LOT-R score, and did not find significant results. However, when running separate
analyses for optimism and pessimism subscales, they found that optimism, but not pessimism,
was related to HR reactivity. They found that optimism had a negative association with HR
reactivity in both the stress group and the control group during the task. Optimism was not
linked with faster HR recovery following the task.
Most recently, Puig-Perez, Hacket, Salvador, and Steptoe (2017) exposed 140
participants with Type II Diabetes to a laboratory stress task. Participants completed both a five-
minute Stroop color-word task and a five-minute mirror-trace stress task. SBP, DBP, and HR
were assessed throughout the tasks. They found that optimism was related to increased SBP and
DBP reactivity during the stress task.
Two other studies examining autonomic reactivity as a possible mechanism through
which optimism increases health have employed ambulatory assessment methods instead of
using a laboratory stressor (Räikkönen & Matthews, 2008; Räikkönen, Matthews, Flory, Owens,
& Gump, 1999). In both of these studies, measures of BP were obtained during daily living on
samples of 201 adolescents aged 14-16 years (Räikkönen & Matthews, 2008) and 100 adults,

OPTIMISM AND AUTONOMIC REACTIVITY 13
aged 30-45 years (Räikkönen et al., 1999). Both studies found that dispositional optimism was
associated with reduced ambulatory blood pressures over several days. Räikkönen and
Matthews (2008) found that, when experiencing daily stress, however, optimists’ BP was just as
elevated as that of pessimists.
Overall, studies examining the relation between optimism and autonomic reactivity to
stress have reported mixed findings. Some studies found support for relations between
dispositional optimism and attenuated physiological reactivity to stress (e.g., Geers et al., 2008;
Puig-Perez et al., 2015; Terrill et al., 2010; Williams et al., 1990), but others failed to find any
relation between optimism and physiological response parameters (e.g., Bonfiglio, 2005;
Kennedy & Hughes, 2004). Still other studies found that the relation between optimism and
physiological response to stress was moderated by a third variable (e.g., Clark et al., 2006;
Segerstrom, 2001). Finally, three studies found support for an association between optimism and
increased reactivity to and delayed recovery from stress (Nes et al., 2005; Richman et al., 2007;
Puig-Perez et al., 2017). Based upon this constellation of findings, the question of whether
optimism is associated with attenuated autonomic reactivity remains largely unanswered.
The literature examining the relation between optimism and autonomic response to stress
cited above has several weaknesses that warrant attention. For example, only seven of the 13
studies reviewed controlled for (either experimentally or statistically) extraneous variables that
were relevant to physiological assessment (e.g., sex, BMI), or the optimism construct itself (other
personality characteristics such as trait anxiety, neuroticism, etc.). Furthermore, only seven of
the 13 studies controlled for other important variables that are known to influence autonomic
activity, such as caffeine, nicotine, and prescription drug use prior to the experiment. Also, the
majority of studies did not analyze pessimism and optimism subscales of the LOT/LOT-R

OPTIMISM AND AUTONOMIC REACTIVITY 14
separately as suggested by Scheier and colleagues (1994). In at least two cases (Puig-Perez et
al., 2015; Terrill et al., 2010), no association was observed between LOT/LOT-R total score and
autonomic reactivity parameters, but an association emerged once subscale scores were
analyzed.
The Behavioral Self-Regulation Model
As noted above, three studies contained in this literature found that optimists’ autonomic
systems were more reactive to a stressor in certain situations (Nes et al., 2005; Richman et al.,
2007; Puig-Perez et al., 2017). This finding is conceivable in light of Carver and Scheier’s
(2000) behavioral self-regulation model. According to this model, optimists are more likely to
employ approach-focused coping when faced with a stressor; they engage in efforts to reduce or
eliminate strains induced by a stressor to overcome it as a barrier. Accordingly, when optimists
believe that their desired goals are attainable, they are likely to put forth more effort to reach
their goals compared to persons low in optimism or high in pessimism (Carver & Scheier, 2000).
Research has shown that pessimists are more likely to give up when their goals are blocked than
optimists because they do not see their desired goals as attainable (e.g., Carver, Lehman, &
Antoni, 2003; Strack, Carver, & Blaney, 1987).
Based upon this Behavioral Self-Regulation Model, it follows that during times of stress,
particularly during especially difficult stressors, optimists may experience greater autonomic
arousal than pessimists as they attempt to solve the problems they are confronting. From this
perspective, task difficulty may be an important factor that has yet to be explored in this
literature. It seems likely that the degree to which optimists and pessimists react to a given
challenge would depend upon its perceived difficulty or solvability. Indeed, research supports
the idea optimists and pessimists react and perform differently during stressors of varying

OPTIMISM AND AUTONOMIC REACTIVITY 15
difficulty. During particularly difficult tasks, optimists tend to perform better than pessimists.
For example, Seligman and Schulman (1986) studied job performance among insurance
salesman, an especially stressful job. They found that optimistic insurance agents sold
approximately 27% more insurance plans compared to pessimistic agents during a specific time
period. Helton, Dember, Warm, and Matthews (1999) also found that optimists performed better
than pessimists on a particularly difficult computerized vigilance task. Seligman and Schulman
(1986) also found that optimists were more persistent in difficult tasks; the pessimistic insurance
agents quit their jobs at twice the rate of optimistic agents. Nes et al. (2005) also found that
optimists persisted longer on a difficult anagram task compared to pessimists. In contrast, these
performance and persistence differences between optimists and pessimists are not typically
observed while engaging in easy tasks. Werenfels (2006) had optimists and pessimists complete
three trials of a relatively easy clerical checking task, and found no performance differences.
Similarly, Geers et al. (2008) employed a cold-pressor task (although uncomfortable, this is a
simple task), and found no difference in length of time that optimists and pessimists persisted in
the task.
The Behavioral Self-Regulation Model and Reactivity to Stress Tasks
It follows that during a very difficult and challenging stressor, optimists are likely to
fully engage behavioral and cognitive resources to overcome the stressor, which may result in a
significant increase in autonomic activity. In contrast, pessimists are less likely to fully engage
all of their resources during a particularly difficult stressor, perhaps resulting in a smaller
increase in autonomic activity during the stressor. When confronting tasks that are easily solved,
optimists may not differ from pessimists on measures of physiological reactivity because they

OPTIMISM AND AUTONOMIC REACTIVITY 16
will continue to exert effort to solve the problem at hand and the pessimists may engage more
fully in solving easy problems.
Unfortunately, studies that have examined optimism and autonomic reactivity to acute
stress have employed various laboratory stressors without considering difficulty of the task.
Stressors examined included mental arithmetic (Williams et al., 1990; Kennedy & Hughes, 2004;
Bonfiglio, 2005), digit-forward/digit backward (Clark et al., 2006), Simon® (Williams et al.,
1990), anger experience recall (Richman et al., 2007), cold pressor (Geers et al., 2008; Terril et
al., 2010), delivery of a speech (Puig-Perez et al., 2015; Terril et al., 2010), Stroop word-color
task (Puig-Perez et al., 2017; Segerstrom, 2001), and anagram tasks (Nes et al., 2005). All of
these tasks have been shown to elicit BP and HR reactivity in prior studies, so they represent
appropriate methods for eliciting cardiovascular reactivity to stress in the studies that comprise
this literature (Krantz, Manuck, & Wing, 1986; Tuomisto, Majahalme, Kahonen, Fredrikson, &
Turjanmaa, 2005). However, all of these tasks were developed for purposes of eliciting a
consistent level of task performance across an entire task period by maintaining constant
attention to the mental task. Consequently, tasks employed in this literature were not devised for
use in studies where exposure to tasks of varying levels of difficulty was desired. In fact, with
the exception of the first anagram problem presented in Nes et al.’s study that was described as
“insolvable,” all other stimuli used in these studies were presented as solvable to study
participants if they exerted some degree of effort on the task. Interestingly, the Nes et al. study
was one of the two studies in this literature that demonstrated a slower recovery in skin
conductance response among participants high in optimism, albeit only those with high self-
awareness. Congruent with the Behavioral Self-Regulation Model, it is possible that participants
low in optimism in this study gave up early and consequently recovered more quickly from the

OPTIMISM AND AUTONOMIC REACTIVITY 17
stressful task. Because the role of task difficulty has yet to be examined with respect to the
relation between optimism and cardiovascular reactivity to stress, a task amenable to
modification on the basis of task difficulty was required.
In the current study, puzzles from Raven’s Progressive Matrices intelligence test were
used as stimuli for the stress task (Raven, Raven, & Court, 2004; see Stress Task Development
section of the study method for details). The Raven’s Progressive Matrices test includes a range
of puzzles that vary widely in difficulty, allowing for the creation of difficult and easy versions
of stress tasks that contain similar stimulus formats and task instructions. Additionally, the
Raven’s Matrices test is considered an active coping task in that each participant has
instrumental control over the outcome (i.e., good or poor performance) and is known to elicit
beta-adrenergic responses to stress (Hollenberg, Williams, & Adams, 1981; Larkin, Polefrone, &
Francis, unpublished report). Because Raven’s Matrices stimuli have been used to measure
intelligence, a digit-symbol task (Wechsler, 2008), which has also been used to assess
intelligence, was completed. Scores on the digit-symbol task were used as a covariate to account
for the effects of intelligence on Raven’s Matrices task performance.
Aims of the Proposed Study
The purpose of the proposed study was twofold. First, because the current literature
assessing the association between dispositional optimism and autonomic reactivity to stress has
significant shortcomings and findings have been mixed regarding study outcomes, this study
sought to explore the association between optimism and cardiovascular reactivity to stress by
addressing several of the shortcomings of previous studies. Second, this study sought to test
Carver and Scheier’s Behavioral Self-Regulation Model, which hypothesizes that optimists,
compared to pessimists, are likely to engage more with mental tasks (and potentially experience

OPTIMISM AND AUTONOMIC REACTIVITY 18
more autonomic arousal) when their goals are blocked by obstacles. The results of this study
aimed to explain why previous studies examining optimism and autonomic reactivity have
exhibited mixed findings. Participants high and low in optimism were recruited from the student
population at West Virginia University. To test whether participants high and low in optimism
reacted differently based on the difficulty of the stressor, half of the study participants completed
a highly difficult stress task while the other half completed a stress task of low difficulty. Based
upon the Behavioral Self-Regulation Model, during the high difficult task, we hypothesized that
participants high in optimism would use approach-focused coping and display more autonomic
reactivity and slower recovery than those low in optimism, who would be more likely to
disengage from a difficult task. Evidence for task engagement was examined by comparing task
performance scores of high and low optimism participants. In response to the difficult task, we
expected high optimism participants to perform better than those low in optimism. In contrast,
during the easy task, we hypothesized that there would be no difference in autonomic reactivity
or recovery between participants high and low in optimism because both groups would be
equally engaged and view puzzles as solvable.
Method
Participants
One hundred fifty-two participants were recruited from undergraduate classes at West
Virginia University. Participants were excluded if they smoked or used any kind of tobacco, had
any chronic major health concerns (i.e., heart disease, cancer, diabetes), or were taking
medications that influenced heart rate or blood pressure. Participants were asked via email to
abstain from caffeine, alcohol, and vigorous exercise for two hours prior to the experimental
session.

OPTIMISM AND AUTONOMIC REACTIVITY 19
The sample size for this study was determined using G*Power 3.1.9.2, by entering the
study design as “a priori, ANCOVA: Fixed effects, main effects, and interactions,” with an effect
size of f = .2723, α = .05, and power of .80. This effect size was obtained from Puig-Perez et al.,
(2015), in which optimism accounted for 6.9% of the variance in HR reactivity (R2 = .069
converts to an effect size f of .2723). This effect size represented a medium effect size, which
was consistent with effect sizes reported by other studies that examined the relation between
optimism and autonomic reactivity to stress. The power analysis indicated that a sample size of
152 was needed to detect an effect size of this magnitude.
Participants were selected from a screening sample of 1167 students enrolled in
undergraduate courses based upon their scores on the LOT-R. The total screening sample
consisted of 938 women and 229 men. In regard to racial composition, 44 identified as African
American, 40 identified as Asian (Chinese, Korean, Japanese, Filipino, Indian), 992 identified as
White, 66 identified as mixed race, 13 identified as other race, one identified as Native American
or Alaskan Native, and 11 declined to answer. A tertile split of all participants completing the
LOT-R was performed. Results indicated that participants scoring 22 or above were considered
high in optimism (i.e., optimists) and participants scoring 17 or below were considered low in
optimism (i.e., pessimists). Two previous studies examining optimism and cardiovascular
reactivity selected participants based on their LOT-R scores, similar to the current study
(Bonfiglio, 2005; Kenedy & Hughes, 2004). Bonfiglio considered participants pessimists if their
LOT-R scores were less than or equal to 12, and optimists if their LOT-R scores were greater
than or equal to 18. Kennedy and Hughes did not report cut-offs for their groups, but the mean
LOT-R score of their pessimist group was 8.93 (SD = 2.8) and the mean LOT-R score of the
optimist group was 20 (SD = 1.64). Compared to optimist and pessimist groups employed in

OPTIMISM AND AUTONOMIC REACTIVITY 20
these prior studies, the sampling distribution of students examined in the current study was more
optimistic.
Of the 152 participants who completed the laboratory portion of the study, 130 were
women and 22 were men. In regard to race/ethnicity, eight identified as African American, eight
identified as Asian, 124 identified as White, seven identified as mixed race, one identified as
American Indian or Alaskan Native, one identified as other race, and three declined to answer.
Comparisons of the groups invited to participate in the experimental session revealed that
optimists had a mean LOT-R score of 24.99 (SE = .26), and pessimists had a mean LOT-R score
of 13.33 (SE = .29). When broken down into study groups, the optimist group completing the
difficult task had 32 women and five men, of which 29 were White, three were African
American, one was Asian, two were mixed race, and 1 identified as Other race. The optimists
completing the easy task consisted of 32 women and five men, of which 32 were White, two
were African American, two were Asian, and one declined to answer. Among the pessimists
completing the difficult task, 33 were women and six were men, of which 31 were White, one
was African American, two were Asian, three were mixed race, and two declined to answer.
Among the pessimists completing the easy task, 33 were women and six were men, among
which 32 were White, two were African American, three were Asian, and two were mixed race.
Measures
Blood pressure. An Industrial and Biomedical Sensors, Inc. Model SD-700A (Waltham,
MA) automated sphygmomanometer was used to measure SBP, DBP, and MAP. This device
uses an automated occluding cuff positioned on the brachial artery of the participants’ non-
dominant arm to detect Kortokoff sounds (via a microphone), ensuring accurate BP

OPTIMISM AND AUTONOMIC REACTIVITY 21
measurement. Maximum cuff inflation was set at 165 millimeters of Mercury (mm Hg) and rate
of deflation was set at 3 mm Hg per sec.
Heart rate (HR). HR was measured using a Polar heart rate monitor Model 810i (Lake
Success, New York). This device measures HR continuously throughout data collection by
sending ECG signals from a sensor strapped around the participants’ chest to a receiver attached
to a computer. Three measures of heart rate variability (HRV) were determined from the
continuous HR signals: standard deviation of the normal sinus interbeat interval-to-normal sinus
interbeat interval (SDNN); low frequency (LF) HRV, and high frequency (HF) HRV. Kubios
HRV v2.0 software was used to examine HR signals for clarity and conduct the spectral
waveform analyses (Niskanen et al., 2004).
Self-report measures
Demographic form. A short demographic form used in previous studies in the Behavioral
Physiology Laboratory (e.g., Stephenson, 2015) was used in this study. This questionnaire
includes items pertaining to age, sex, height, weight, race/ethnicity, year in school, and parental
socioeconomic status. In regard to parental socioeconomic status, an adaptation of the
MacArthur Subjective Social Status Ladder, which has been used in numerous studies as a
measure of subjective SES and has demonstrated good construct validity (Cundiff, Smith,
Uchino, & Berg, 2013), was used. Participants are asked to imagine a ladder representing
social/economic status of families in the United States, including factors such as money,
education, and respected jobs. Those higher on the ladder have more money, more education,
and more respected jobs. Participants were asked to identify which rung of the ladder (there are
10 rungs) their respective family falls. The form also includes general questions about
participants’ health status and behaviors (See Appendix B).

OPTIMISM AND AUTONOMIC REACTIVITY 22
Life Orientation Test – Revised (LOT-R). The LOT-R is a six-item questionnaire (with
four additional distractor items) designed to assess dispositional optimism (Scheier, Carver, &
Bridges, 1994). The creators of the LOT-R intended it to assess a single construct of optimism.
However, some have argued that that a two-factor model, with optimism and pessimism factors,
fit the data better (Chang and McBride-Chang 1996; Glaesmer et al., 2012; Robinson-Whelen et
al. 1997), while others have argued a single factor fits the data better and makes better
conceptual sense (Rauch, Schweizer, & Moosbrugger, 2007; Scheier et al., 1994). Scheier et al.
(1994) suggests that total LOT-R scores should be followed-up by analyzing optimism and
pessimism subscales separately. The LOT-R total score has demonstrated good internal
consistency (alpha = 0.78) and test-retest reliability (28-month correlation = 0.79; Scheier et al.,
1994). Individual optimism and pessimism subscales, each containing 3 items, also demonstrate
good internal consistency (alpha = 0.70, alpha = 0.74, respectively; Glaesmer et al., 2012). The
LOT-R has also demonstrated acceptable discriminant validity, sharing only modest amounts of
variance with conceptually similar constructs such as neuroticism, trait anxiety, and self-esteem
(Scheier et al., 1994). In the current study, the LOT-R total score demonstrated good internal
consistency (alpha = 0.90). The optimism and pessimism subscales also demonstrated good
internal consistency (alphas = 0.78 and 0.90, respectively) in the current study.
State-Trait Anxiety Inventory (STAI). The STAI has both state and trait anxiety
subscales. For the purposes of this study only the trait anxiety subscale was used, which is
comprised of 20 items. The trait anxiety subscale of the STAI has previously demonstrated good
internal consistency (alpha = 0.90) and good test-retest reliability (30-day correlation = 0.73;
Spielberger, Gorsuch, Lushene, Vagg, & Jacobs, 1983). The trait anxiety subscale also
demonstrated good concurrent validity and discriminant validity, as evidenced by its strong
OPTIMISM AND AUTONOMIC REACTIVITY 23
association with the IPAT Anxiety Scale and the Manifest Anxiety Scale, and its weak
associations with other personality factors on the Edwards Personal Preference Checklist (a
personality inventory) and school aptitude (e.g., GPA, class rank, etc.; Spielberger et al., 1983).
In the current study, the trait anxiety subscale of the STAI demonstrated good internal
consistency (alpha = 0.94).
Big Five Inventory (BFI-2). The BFI-2 is a 60-item questionnaire that assesses the Big
Five personality domains: Extraversion, Agreeableness, Conscientiousness, Negative
Emotionality, and Open-Mindedness. Additionally, it assesses 15 more-specific facet traits.
Each item is a brief adjective or description of an attribute or interest; the participant is instructed
to endorse to what degree the adjective/description describes him or her on a five-point Likert-
type scale. All five domain scales have demonstrated alpha reliabilities over 0.83, and test-retest
reliability of at least 0.76 (Soto & John, 2016). In the current study, all subscales demonstrated
good internal consistency: Extraversion (alpha = 0.88), Agreeableness (alpha = 0.82),
Conscientiousness (alpha = 0.84), Neuroticism (alpha = 0.90), and Openness to Experience
(alpha = 0.80). The BFI-2 has demonstrated good discriminant and concurrent validity as
evidenced by strong correlations with corresponding personality traits on the NEO Personality
Inventory. For purposes of the proposed study, only the (Negative Emotionality) Neuroticism
scale was used.
Multiple Affect Adjective Checklist-Revised (MAACL-R). The MAACL-R (Zuckerman
& Lubin, 1985) is a checklist-type questionnaire containing 66 adjectives describing state and/or
trait affect. Participants were asked to complete the MAACL-R after the completion of the
recovery phase, and asked to indicate how they felt during the stress task. This measure
traditionally has five sub-scales: Anxiety, Depression, Hostility, Positive Affect, and Sensation

OPTIMISM AND AUTONOMIC REACTIVITY 24
Seeking. However, evidence suggests the MAACL-R may be better represented with a two-
factor model: positive affect and negative affect (Hunsley, 1990). For the purpose of this study,
the two-factor model was utilized. This scale has demonstrated good concurrent validity as
evidenced by strong correlations with similar state affect scores on the State Trait Personality
Inventory, Sensation Seeking Scale, and Affect Balance Scale. It has also demonstrated good
discriminant validity as evidenced by weak associations with less similar constructs also
measured by these scales (Lubin, Van Whitlock, Reddy, & Petren, 2001).
Self-efficacy Questionnaire. The purpose of this questionnaire was to ensure the
participants’ understanding of the types of puzzles they encountered during the stress task and to
assess confidence in their ability to complete the task. The self-efficacy questionnaire included a
sample item from the Raven’s Matrices (Raven, Raven, & Court, 2004), similar to the items that
they would encounter during the stress task. It then instructed participants to rate how confident
they are that they will be able to complete all of the items during the stress task accurately.
Participants responded to this item on a four-point Likert type scale. This questionnaire was
designed specifically for the proposed study. Although its psychometric characteristics have not
been reported, it was formatted based on similar self-efficacy scales in the literature.
Post-Task Questionnaire. The post-task questionnaire consisted of items that assessed
the stress level experienced during the task, perceived difficulty of the task, and other factors
related to the participants’ experiences during the stress task.
Digit-Symbol Task. The digit-symbol task is a simple task which is a component of
several well-known IQ tests, including the Wechsler Adult Intelligence scale (WAIS; Wechsler,
2008). This task is a measure of processing speed, a major component of IQ. Participants are
given a coding key and a series of numbers, and must record the corresponding symbol for as

OPTIMISM AND AUTONOMIC REACTIVITY 25
many numbers in the series as they are able in 90 seconds. The digit-symbol task has shown
good test-retest reliability (r = 0.74 over an 80-day period; Morrison, Simone, Ng, & Hardy,
2015). This measure was included in order to account for the influence of participants’
intelligence on task completion. The score from this task was used as a covariate in analyses
examining the stress task score.
Experimental design
This study employed a quasi-experimental design. The independent variables of interest
were optimism level of participant (optimist, pessimist), and difficulty of stress task (difficult vs.
easy). Participants were assigned to the optimism or pessimism group based on their LOT-R
total score; participants scoring in the top and bottom tertiles were invited to participate in the
laboratory portion of the study. Participants were assigned to complete either the difficult or the
easy stress task based on a random number generator after they arrived in the laboratory.
Stress task development and pilot testing
Raven’s Matrices puzzles were obtained from the Standard Progressive Matrices Sets A,
B, C, D, and E test booklet (Raven, 1998). Puzzles from these sets range in difficulty, with
easier puzzles occurring toward the beginning of each set and more difficult puzzles toward the
end of each set. Fourteen puzzles that were judged by the researcher to be easy and 14 that were
judged to be difficult were selected to be piloted for consideration as test stimuli for the primary
study. During both the pilot and experimental portions of the study, all Raven’s Matrices were
presented electronically on a Dell Inspiron (Model 1525) laptop computer. Eight graduate
students in the Department of Psychology completed the 28 puzzles (difficult and easy) and the
duration for stating an answer was timed for each puzzle. The average time to answer the easy
puzzles was approximately seven seconds (ranged from 5.1 - 14.9 seconds), while the average

OPTIMISM AND AUTONOMIC REACTIVITY 26
time to answer the difficult puzzles was approximately 28 seconds (ranged from 13.6 - 36.9
seconds). Based upon these data showing that all easy puzzles were completed in less than 16
sec and most difficult puzzles took longer than 16 sec to complete, a 16-sec response interval
was selected for all 28 puzzles, followed by a five sec period in which the participant was
instructed to state their answer aloud and the researcher would inform them whether it was
correct or not.
Data were collected on two graduate students using the timing selected to determine if 16
seconds was a sufficient amount of time for each puzzle to be displayed. The graduate student
who completed the difficult stress task was unable to correctly answer any of the puzzles
correctly, and reported that the time limit (16 seconds) was not enough time to grasp any of the
patterns. The graduate student who completed the easy stress task correctly answered 13 out of
14 puzzles.
Out of concern that the puzzle-viewing period (16 seconds) was too short to solve the
difficult puzzles, we decided to compare viewing 14-puzzles (seeing each puzzle for 16 seconds)
with viewing 12-puzzles (seeing each puzzle for 20 seconds) on a sample of 10 undergraduate
students. We asked five pilot participants who completed the difficult task whether the allotted
time was enough time to come up with an answer, whether they were able to at least eliminate 2-
3 of the possible answers, and how difficult the task was on a scale of 1-10. We asked five pilot
participants who completed the easy task if they were able to solve the puzzle during the first 5-8
seconds, or if it took them the entire time to get the answer. They were also asked what they did
during the remaining time if they got the answer in the first 5-8 seconds. Finally, they were
asked how difficult the task was on a scale of 1-10.

OPTIMISM AND AUTONOMIC REACTIVITY 27
For the three students who completed the difficult stress task with 14 puzzles, the average
number of correctly solved puzzles was 1.66. They reported that 16 seconds was not enough
time to complete the puzzle, that they only had enough time to eliminate 1 of 8 possible answers,
and that the task was judged a 10 out of 10 on the scale of difficulty. For the three students who
completed the easy stress task with 14 puzzles, the average number of correctly solved puzzles
was 10.66. They indicated that they were able to solve most of the puzzles in the first 5-8
seconds, and that they double-checked their answer during the remaining time. They said the
task was a 4-5 on a 1-10 scale of difficulty.
Two students completed the difficult stress task using the 12-puzzle format. On average,
they correctly solved two puzzles. They indicated that 20 seconds was enough time to solve a
few of the puzzles, but it was not enough time to solve many of them. They indicated that 20
seconds was enough time to eliminate 2-3 of the possible alternatives. They rated the difficulty
as 8-9 on a 10-point scale. The two students who completed the easy stress task with 12 puzzles
both correctly solved all 12 puzzles. Both indicated that it took them approximately 10 seconds
to solve each puzzle, and that they used the remaining time to check their answer. They rated the
difficulty as 3-4 on a 10-point scale.
Based upon these pilot data, it was determined that 16 seconds was not a long enough
duration to solve any of the difficult puzzles. To ensure that participants did not become
discouraged during the difficult task, the 12-puzzle format was adopted in which each puzzle
appeared for 20 seconds for both easy and difficult matrices.
Procedure
Participants completed the demographic and other pertinent questionnaires online using
the SONA system. Those who scored either in the top or bottom tertile on the LOT-R and met

OPTIMISM AND AUTONOMIC REACTIVITY 28
all other inclusion criteria (no medications that would affect cardiovascular activity, etc.) were
invited to schedule a session in the Behavioral Physiology Laboratory. Upon entering the
laboratory, the participant met the experimenter, was dressed in a white lab coat and behaved in a
professional manner. The experimenter described the study, went over potential risks and
benefits with the participant, and obtained his/her informed consent using an approved consent
agreement. Then, the experimenter measured the height and weight of the participant and
confirmed that he or she had abstained from caffeine, alcohol, and exercise for the previous two
hours. The experimenter then left the room so the participant could attach the Polar heart rate
monitor around his or her chest privately. The experimenter attached the blood pressure cuff to
the participants’ non-dominant upper arm and HR and BP signals were examined to assure
clarity. Participants were then instructed to sit quietly with both feet on the floor for a 15-minute
rest period. Blood pressure measurements began eight minutes into the rest period and were
taken every two minutes for the remainder of the rest period and HR was measured continuously
during the rest period.
Following completion of the rest period, participants were provided instruction about
how to complete the problems on the Raven’s Matrices stress task and, after viewing the sample
problem, completed the self-efficacy questionnaire. Once the experimenter gave the participant
the signal to begin, the participant pressed a single key on a laptop computer, which launched the
stress task. As noted above, participants were randomly assigned to receive either the easy or
difficult version of the task. In both the easy and difficult stress tasks, each puzzle appeared for
20 seconds, followed by a screen that stated “Answer?” for five seconds. During the 20 second
period in which the puzzle was shown, the participant was expected to attempt to solve the
puzzle. Task performance was monitored by watching the participant through a one-way
OPTIMISM AND AUTONOMIC REACTIVITY 29
mirrored window and listening to answers on an intercom. When they saw “Answer?” screen,
they were instructed to state their answer aloud so that the experimenter could record it and
provide them verbal feedback (e.g., “correct” or “incorrect) regarding their answer via an
intercom. After the screen that prompted them to give their answer was displayed for five
seconds, this screen disappeared and the next puzzle was presented. Both the difficult and easy
stress tasks contained a total of 12 puzzles and lasted five minutes. Both tasks were completed in
an identical manner using identical instructions and format, so that the only difference between
conditions was level of difficulty of the puzzles. BP was measured during the first, third, and
fifth minutes of the task period and HR was measured continuously.
Following the completion of the stress task, participants sat quietly for a five-minute
recovery period. BP and HR measures were obtained in an identical manner to measures during
the task period. Following the recovery period, participants completed the post-task
questionnaire and the MAACL-R. They were then given instructions and completed the 90-
second digit-symbol task. Following the digit-symbol task, experimental apparatuses were
detached and participants were debriefed and paid $10 for their time.
Results
Data Cleaning and Reduction
Invalid or questionable measures of BP were removed using the criteria outlined by
Marler, Jacob, Lehoszky, and Shapiro (1988). Accordingly, SBPs below 70 mm Hg or above
250 mm Hg or DBPs below 45 mm Hg or above 150 mm Hg were replaced with the most
proximate valid BP value within that experimental period. Furthermore, when pulse pressure
between a SBP and its paired DBP was less than 30 mm Hg, BPs that were inconsistent with
their proximate BPs were replaced with the mean of two proximate, valid BPs. A total of 37 BP

OPTIMISM AND AUTONOMIC REACTIVITY 30
measurements (out of 2980 total BP measurements or approximately 1% of BP measures) were
flagged as questionable and replaced according to these criteria.
Heart rate data were analyzed for artefacts using the Polar 810i software set at a low
filtering level. This software replaces erroneous HR values typically observed when participants
move excessively or the signal from the Polar Monitor is momentarily lost. HRs were then
calculated for each minute during the rest, task, and recovery periods. It should be noted that
complete HR data were not obtained for three participants.
Preliminary Analyses
Rest Period. One way repeated measures ANOVAs were conducted to examine variation
that might occur in each cardiovascular parameter across each minute of the rest period (See
ANOVA Summary Tables 1-6 in Appendix B). Analysis of resting SBP, F(2, 302) = 1.92, p =
0.148, resting DBP, F(2, 302) = 0.84, p = 0.435, and resting MAP, F(2, 302) = 0.32, p = 0.730,
revealed no significant main effects, so BP values during the rest period were averaged to arrive
at a mean resting level for each parameter (i.e., resting SBP, resting DBP, resting MAP). In
contrast, the repeated measures ANOVA on resting HR revealed a significant main effect, F(2,
298) = 6.08, p = 0.003, ηp2 = 0.039. Follow-up mean comparisons showed that HR during
minute 10 (76.05 bpm) was significantly lower than HR during minute 14 (77.07 bpm). These
differences did not indicate any systematic change in HR across the baseline period, so all HRs
were averaged to yield a single resting HR measure.
Because assessment of HRV is unreliable across durations as brief as one minute,
interbeat intervals from all valid HR values during the rest period were subjected to HRV
analysis, producing one measure at rest for each HRV parameter (SDNN, HF, LF). By
OPTIMISM AND AUTONOMIC REACTIVITY 31
convention, all HF and LF measures throughout the experiment were transformed using
logarithmic transformations in order to normalize distributions for purposes of analysis.
Task Period. For purposes of analyzing cardiovascular reactivity to the task, measures
of HR and BP were averaged across minutes to obtain average cardiovascular reactions to the
entire Raven’s Matrices task. Like the rest period, a single measure for each SDNN, HF, and LF
was determined for the task period. To confirm that participants reacted to the Raven’s Matrices
tasks with increased autonomic activity, Group (Easy, Difficult) X Period (Rest, Task) mixed
factors ANOVAs were conducted for each cardiovascular parameter (See ANOVA Summary
Tables 7-19 in Appendix B). For SBP, the main effect of Period was significant, F(1, 150) =
149.18, p = 0.000, ηp2 = 0.499. SBP was higher during the stress task (M = 118.4 mm Hg, SE =
0.97), than during the rest period (M = 111.5 mm Hg, SE = 0.87). The Group X Period
interaction effect, F(1, 150) = 0.229, p = 0.633, ηp2 = 0.002 was not significant, indicating no
significant difference in SBP reactivity between those completing the easy task compared to
those completing the difficult task. Similarly, for DBP, the main effect of Period was significant,
F(1, 150) = 132.09, p = 0.000, ηp2 = 0.468. DBP was higher during the stress task (M = 71.1 mm
Hg, SE = 0.75), than during the rest period (M = 65.4 mm Hg, SE = 0.72). The Group X Period
interaction effect, F(1, 150) = 0.54, p = 0.464, ηp2 = 0.004, was not significant. Analysis of MAP
revealed similar results; the main effect of Period was significant, F(1, 150) = 203.0, p = 0.000,
ηp2 = 0.575. MAP was higher during the stress task (M = 86.9 mm Hg, SE = 0.69), than during
the rest period (M = 80.8 mm Hg, SE = 0.64). The Group X Period interaction effect, F(1, 150)
= 0.13, p = 0.724, ηp2 = 0.001, was not significant.
HR during the stress task (M = 81.3 bpm, SE = 0.91), was significantly higher than
during rest (M = 77.4 bpm, SE = 0.89), F(1, 147) = 57.07, p = 0.000, ηp2 = 0.280. The Group X
OPTIMISM AND AUTONOMIC REACTIVITY 32
Period interaction effect was not significant, F(1, 147) = 0.75, p = 0.389, ηp2 = 0.005. For
SDNN, neither the Period, F(1, 147) = 2.46, p = 0.119, ηp2 = 0.016, nor the Period X Group
interaction effect, F(1, 147) = 3.81, p = 0.053, ηp2 = 0.025, were significant, indicating that the
stressful task did not alter SDNN. HF-HRV showed a pattern similar to blood pressure and HR
measures. The main effect of Period was significant, F(1, 147) = 8.49, p = 0.004, ηp2 = 0.055.
HF-HRV was lower during the stress task (M = 1334.6 ms2, SE = 223.18), than during the rest
period (M = 2370.4 ms2, SE = 910.49). The Group X Period interaction effect, F(1, 147) = 0.50,
p = 0.480, ηp2 = 0.003, was not significant. For LF-HRV, the Period main effect, F(1, 147) =
4.99, p = 0.027, ηp2 = 0.033 was significant. Additionally, the Group X Period interaction effect,
F(1, 147) = 5.16, p = 0.025, ηp2 = 0.034, was significant. For those completing the difficult task,
resting LF-HRV (M = 1379.8 ms2, SE = 134.19) was higher than during the stress task, (M =
998.7 ms2, SE = 132.05). However, for those completing the easy task, resting LF-HRV (M =
1303.1 ms2, SE = 135.10) was not significantly different from task LF-HRV (M = 1401.1 ms2,
SE = 132.94). In sum, with the exception of SDNN, autonomic arousal occurred in response to
the difficult task and for all but LF-HRV in response to the easy task.
Group (Easy, Difficult) X Minute (Task minutes 1, 3, 5) mixed factors ANOVAs were
also used to examine minute-to-minute differences in cardiovascular parameters during
completion of the Raven’s Matrices tasks (See ANOVA Summary Tables 20-29 in Appendix B).
For SBP, the main effect for Period was significant, F(2, 300) = 41.85, p = 0.000, ηp2 = 0.218.
SBP during the first minute of the stress task (M = 120.8 mm Hg, SE = 1.04) was significantly
higher than SBP during minute 3, (M = 118.7 mm Hg, SE = 1.07), which was significantly
higher than SBP during minute 5, (M = 115.8 mm Hg, SE = 0.94). The Group X Period
interaction effect, F(2, 300) = 1.18, p = 0.308, ηp2 = 0.008, was not significant, meaning there

OPTIMISM AND AUTONOMIC REACTIVITY 33
was no difference in patterns of SBP reactivity between those completing the easy and difficult
tasks. For DBP, the main effect for Period, F(2, 300) = 12.01, p = 0.000, ηp2 = 0.074, was
significant, while the Group X Period interaction effect, F(2, 300) = 0.905, p = 0.406, ηp2 =
0.006, was not significant. DBP during the first minute of the stress task (M = 73.09 mm Hg, SE
= 0.80) was significantly higher than DBP during minute 3, (M = 70.24 mm Hg, SE = 0.88) and
DBP during minute 5, (M = 70.04 mm Hg, SE = 0.87). There was no difference between DBP
during minutes 3 and 5 of the task. The pattern of reactivity for MAP was similar to that of SBP;
the main effect for Period, F(2, 300) = 27.5, p = 0.000, ηp2 = 0.155, was significant, while the
Group X Period interaction effect, F(2, 300) = 1.52, p = 0.220, ηp2 = 0.010, was not significant.
MAP during the first minute of the stress task (M = 89.0 mm Hg, SE = 0.72) was significantly
higher than MAP during minute 3, (M = 86.38 mm Hg, SE = 0.79), which was significantly
higher than MAP during minute 5, (M = 85.30 mm Hg, SE = 0.75).
For HR, both the main effect for Period, F(2, 294) = 19.51, p = 0.000, ηp2 = 0.117, and
the Group X Period interaction effect, F(2, 294) = 4.41, p = 0.013, ηp2 = 0.029, were significant.
For those completing the difficult task, HR significantly decreased from minute one, (M = 82.41
bpm, SE = 1.49), to minute three, (M = 81.44 bpm, SE = 1.33), and again decreased from minute
three to minute five, (M = 80.49 bpm, SE = 1.23). However, for those completing the easy task,
HR significantly decreased from minute one, (M = 83.40 bpm, SE = 1.50), to minute three, (M =
79.80 bpm, SE = 1.34), but did not decrease from minute three to minute five (M = 80.31 bpm,
SE = 1.24). For those completing the difficult task, HR decreased more slowly during the task
compared to those completing the easy task. Across all BP and HR parameters, the greatest
reactions occurred during the first minute of the task.

OPTIMISM AND AUTONOMIC REACTIVITY 34
For purposes of analyzing cardiovascular reactivity to the Raven’s Matrices tasks to
examine the primary study hypotheses, measures of BP were averaged across minutes to obtain
average cardiovascular reactions for the entire task. The average of continuous HR for the
entirety of the task was used for HR analyses to examine study hypotheses.
Recovery Period. Individual values for each cardiovascular parameter during the
recovery period were used to calculate area under the curve (AUC) using the formula used by
Whited et al. (2010), Neumann, Waldstein, Sellers, Thayer, and Sorkin (2004), and Friedberg,
Suchday, and Shelov (2007). The formula used was:
Excursion = (0.5*120)*((cardiovascular measure at Task min 4) + (2* cardiovascular
measure at recovery min 1) + (2*cardiovascular measure at recovery min 3) +
(cardiovascular measure at recovery min 5) – (cardiovascular measure at baseline * 360).
By transforming values into this measure of area, rate of recovery can be captured in a
single value for each cardiovascular measure. A larger number, or larger area under the curve,
indicated a more prolonged recovery.
Consideration of Covariates. Potential covariates were assessed by calculating
correlation coefficients between each potential covariate and resting and reactivity measures for
each cardiovascular parameter (See Correlation Summary Tables 30-34 in Appendix B).
Continuous variables assessed as potential covariates included BMI, trait anxiety, and
neuroticism/negative affect. BMI was significantly related to resting SBP (r = 0.412, p = 0.000),
task SBP (r = 0.350, p = 0.000), resting DBP (r = 0.261, p = 0.001), task DBP (r = 0.253, p =
0.002), resting MAP (r = 0.382, p = 0.000), and task MAP (r = 0.347, p = 0.000). BMI was
therefore entered as a covariate in all BP analyses. Trait anxiety was significantly related to
optimism, (r = -0.777, p = 0.000). Neuroticism/negative emotionality was also significantly

OPTIMISM AND AUTONOMIC REACTIVITY 35
correlated with optimism (r = -0.660, p = 0.000). Therefore, as the literature suggests, trait
anxiety and neuroticism were used as covariates in all analyses. BMI was not related to any
measure of HR, SDNN, HF-HRV, or LF-HRV. Intelligence (measured by digit-symbol task)
was not related to any cardiovascular parameter,
Cardiovascular Measures at Rest
Optimism (optimist, pessimist) X Task Difficulty (Easy, Difficult) ANCOVAs were
conducted for each cardiovascular parameter to determine if there were any differences during
the initial rest period between groups (See ANCOVA Summary Tables 35-41 in Appendix B).
Covariates included BMI, trait anxiety, and Neuroticism. There were no significant differences
between groups at rest. See the first panel of Figures 1-4 and Table 2 for means, standard errors,
and standard deviations for resting SBP, DBP, MAP, and HR.
Primary Analyses: Cardiovascular Reactivity to the Task
Because the primary hypotheses of this study pertain to differences between optimists
and pessimists to stressors of differing difficulty, two-way Optimism (optimist, pessimist) X
Task Difficulty (Easy, Difficult) ANCOVAs were conducted for each parameter, covarying
resting levels, BMI (for BP analyses), trait anxiety, and negative emotionality (See ANCOVA
Summary Tables 42-51 in Appendix B). See the middle panel of Figures 1-4 for means and
standard errors for SBP, DBP, MAP, and HR during the Raven’s Matrices task.
Systolic Blood Pressure. The ANCOVA on SBP reactivity to the stress tasks revealed no
significant main effects for Optimism, F(1, 143) = 3.62, p = 0.059, ηp2 = 0.025, or Task
Difficulty, F(1, 143) = 0.623, p = 0.431, ηp2 = 0.004. The Optimism X Task Difficulty
interaction effect was also not significant, F(1, 143) = 0.329 p = 0.567, ηp2 = 0.002. It should be
noted a post-hoc power analysis using the obtained effect size from the analysis of SBP

OPTIMISM AND AUTONOMIC REACTIVITY 36
reactivity to the task (ηp2 = 0.025) revealed the obtained power of this experiment was 0.500,
indicating there was a 50.0% chance statistically significant difference would be found when
such a difference truly existed.
Diastolic Blood Pressure. The ANCOVA on DBP reactivity to the Raven’s Matrices task
revealed a main effect for Optimism, F(1, 143) = 5.82, p = 0.017, ηp2 = 0.039. Optimists
exhibited greater DBP reactivity to the task (covariate adjusted M = 72.8 mm Hg, SE = 0.88)
compared to pessimists (covariate adjusted M = 69.3 mm Hg, SE = 0.84). Neither the main
effect for Task Difficulty, F(1, 143) = 0.686, p = 0.409., ηp2 = 0.005, nor the Optimism X Task
Difficulty interaction, F(1,143) = 0.457, p = 0.500, ηp2 = 0.003, was significant.
Mean Arterial Pressure. Analysis of MAP during the Raven’s Matrices’ task revealed
that main effects for Optimism, F(1, 143) = 0.989, p = 0.322, ηp2 = 0.007, Task Difficulty, F(1,
143) = 0.092, p = 0.762, ηp2 = 0.001, and the Optimism X Task Difficulty interaction effect, F(1,
143) = 0.662, p = 0.417, ηp2 = 0.005, were not significant.
Heart Rate. The ANCOVA on HR reactivity to the tasks revealed no significant main or
interaction effects. Neither the main effects for Optimism, F(1, 140) = 0.628, p = 0.430, ηp2 =
0.004, or Task Difficulty, F(1, 140) = 0.723, p = 0.396, ηp2 = 0.005, nor the Optimism X Task
Difficulty interaction, F(1, 140) = 0.340, p = 0.561, ηp2 = 0.002, were significant.
High Frequency Heart Rate Variability. The ANCOVA on HF-HRV reactivity to the
tasks revealed no significant main or interaction effects. Neither the main effects for Optimism,
F(1, 140) = 0.005, p = 0.945, ηp2 = 0.000, or Task Difficulty, F(1, 140) = 2.095, p = 0.150, ηp
2 =
0.015, nor the Optimism X Task Difficulty interaction, F(1, 140) = 0.010, p = 0.922, ηp2 = 0.000,
were significant.

OPTIMISM AND AUTONOMIC REACTIVITY 37
Standard Deviation of Normal to Normal R-R Intervals (SDNN). The ANCOVA on
SDNN reactivity to the tasks revealed the main effect for Optimism, F(1, 140) = 0.370, p =
0.544, ηp2 = 0.003, was not significant. However, the main effect for Task Difficulty, F(1, 140)
= 4.97, p = 0.027, ηp2 = 0.034, was significant. Those completing the difficult task exhibited
greater SDNN reactivity to the task (covariate adjusted M = 58.0 ms, SE = 2.83; lower SDNN
indicates greater reactivity) compared to those completing the easy task (covariate adjusted M =
67.0 ms, SE = 2.83). The Optimism X Task Difficulty interaction, F(1, 140) = 3.26, p = 0.073,
ηp2 = 0.023, was not significant.
Low Frequency Heart Rate Variability. Similar to SDNN, the ANCOVA on LF-HRV
reactivity to the tasks revealed neither the main effect for Optimism, F(1, 140) = 1.09, p = 0.298,
ηp2 = 0.008, nor a Optimism X Task Difficulty interaction effect, F(1, 140) = 1.27, p = 0.261, ηp
2
= 0.009. The main effect for Task Difficulty, F(1, 140) = 8.17, p = 0.005, ηp2 = 0.055, was
significant. Those completing the difficult task exhibited greater LF-HRV reactivity to the task
(covariate adjusted M = 969.9 ms2, SE = 118.07; lower LF-HRV indicates greater reactivity)
compared to those completing the easy task (covariate adjusted M = 1427.5 ms2, SE = 117.78).
Comparisons of Reactivity during the first minute of the task. Analyses indicated that
SBP, DBP, MAP, and HR increased from baseline significantly during the first minute of the
task, then decreased from minute one to minute three. Due to the tendency of participants to
habituate to stress tasks, follow-up two-way Optimism X Task Difficulty ANCOVAs were
conducted for each parameter, using just the first minute of the task as the dependent variable
instead of the averaged reactivity over the course of the task (See ANCOVA Summary Tables
52-55 in Appendix B). The goal of this analysis was to capture participants when they are
displaying the most reactivity to the task. Using this approach, there were no significant

OPTIMISM AND AUTONOMIC REACTIVITY 38
Optimism or Task Difficulty main effects or Optimism X Task Difficulty interaction effects for
any cardiovascular parameter.
Comparisons of Reactivity between “true pessimists” and “slight pessimists.” Given
samples from some previous studies were more pessimistic than the current sample, pessimists in
the current sample were divided into “true pessimists,” (LOT-R 12 or under; n = 28) and “slight
pessimists,” (LOT-R between 13 and 17; n = 50). A series of one-way ANCOVAs (covarying
BMI, trait anxiety, neuroticism, and resting levels of the cardiovascular parameter) were
conducted to compare reactivity levels between the two pessimistic groups (See ANCOVA
Summary Tables 56-63 in Appendix B). For SBP, there was a significant effect of pessimist
group, F(1, 72) = 5.41, p = 0.023, ηp2 = 0.070. Slight pessimists (covariate adjusted M = 120.3
mm Hg, SE = 1.05) had higher reactivity compared to true pessimists (covariate adjusted M =
116.1 mm Hg, SE = 1.42). There were no differences between true and slight pessimists for any
other cardiovascular parameter.
Primary Analyses: Cardiovascular Recovery from Stress
To assess whether optimists and pessimists differed in cardiovascular recovery following
stress, two-way Optimism X Task Difficulty ANCOVAs were conducted on the Area under the
curve (AUC) for each HR and BP parameter. Averaged reactivity during each task, trait anxiety,
neuroticism, and BMI were included as covariates for each BP analysis (See ANCOVA
Summary Tables 64-71 in Appendix B). BMI was not included as a covariate in any HR or HRV
analyses. See the final panel of Figures 1-4 for means and standard errors for measures of SBP,
DBP, MAP, and HR during the recovery period.
Systolic Blood Pressure. Analysis indicated that there were no significant main effects
for either Optimism, F(1, 143) = 0.751, p = 0.387, ηp2 = 0.005, or Task Difficulty, F(1, 143) =

OPTIMISM AND AUTONOMIC REACTIVITY 39
3.03, p = 0.084, ηp2 = 0.021 on SBP AUC. Likewise, the interaction between Optimism and Task
Difficulty was not significant, F(1, 143) = 0.31, p = 0.580, ηp2 = 0.002.
Diastolic Blood Pressure. For DBP AUC, the main effects of Optimism, F(1, 143) =
1.57, p = 0.214, ηp2 = 0.011, and Task Difficulty, F(1, 143) = 3.74, p = 0.055, ηp
2 = 0.026, were
not significant. The Optimism X Task Difficulty interaction was also not significant, F(1, 143) =
1.81, p = 0.180, ηp2 = 0.013.
Mean Arterial Pressure. The main effects for Optimism, F(1, 143) = 0.372, p = 0.543,
ηp2 = 0.003, and Task Difficulty, F(1, 143) = 0.816, p = 0.368, ηp
2 = 0.006, were not significant
for MAP AUC. The Optimism X Task Difficulty interaction effect was also not significant, F(1,
143) = 1.825, p = 0.179, ηp2 = 0.013.
Heart Rate. Analysis indicated that there were no significant main effects for either
Optimism, F(1, 142) = 0.000, p = 0.992, ηp2 = 0.000, or Task Difficulty, F(1, 142) = 1.96, p =
0.164, ηp2 = 0.014, on HR AUC. Likewise, the interaction between Optimism and Task
Difficulty was not significant, F(1, 142) = 0.12, p = 0.732, ηp2 = 0.001.
HF-HRV. Because HRV can only be measured reliably over longer periods of time (e.g.,
at least five minutes), AUC was not calculated for HF-HRV, LF-HRV, or SDNN. Instead,
recovery analysis used single values for the entire five-minute recovery period. For HF HRV
recovery, the Optimism, F(1, 142) = 0.23, p = 0.630, ηp2 = 0.002, and Task Difficulty, F(1, 142)
= 0.67, p = 0.415, ηp2 = 0.005, main effects were not significant. The Optimism X Task
Difficulty interaction effect, F(1, 142) = 0.078, p = 0.78, ηp2 = 0.001, was also not significant.
SDNN. For SDNN recovery, the Optimism, F(1, 142) = 0.04, p = 0.841, ηp2 = 0.000, and
Task Difficulty, F(1, 142) = 0.73, p = 0.394, ηp2 = 0.005, main effects were not significant. The
OPTIMISM AND AUTONOMIC REACTIVITY 40
Optimism X Task Difficulty interaction effect, F(1, 142) = 2.20, p = 0.140, ηp2 = 0.015, was also
not significant.
LF-HRV. For LF-HRV recovery, the Optimism main effect, F(1, 142) = 1.40, p = 0.238,
ηp2 = 0.010, and the Optimism X Task Difficulty interaction effect, F(1, 142) = 0.09, p = 0.766,
ηp2 = 0.001, were not significant. The main effect for Task Difficulty, F(1, 142) = 5.84, p =
0.017, ηp2 = 0.040, however, was significant. Those completing the difficult task exhibited
greater LF-HRV recovery from the task (covariate adjusted M = 1614.36 ms2, SE = 135.26;
higher LF-HRV indicates more complete recovery, because LF-HRV is high at rest, then dips
during stress) compared to those completing the easy task (covariate adjusted M = 1330.4 ms2,
SE = 136.05).
Task Score
Scores on the Raven’s Matrices task were analyzed in order to determine if there were
performance differences between optimists and pessimists on the difficult and easy tasks. A
two-way (Optimism X Task Difficulty) ANCOVA (covarying digit-symbol score) was
conducted (See ANCOVA Summary Tables 72-76 in Appendix B). Results indicated that the
main effect for Task Difficulty, F(1, 147) = 808.42, p = 0.000, ηp2 = 0.846, was significant.
Participants completing the difficult task solved fewer of the puzzles correctly (M = 2.45, SE =
0.18) than those completing the easy task (M = 9.58, SE = 0.18). Neither the Optimism main
effect, F(1, 147) = 0.237, p = 0.627, ηp2 = 0.002, nor the Optimism X Task Difficulty interaction
effect, F(1, 147) = 1.50, p = 0.229, ηp2 = 0.010, were significant.
Participants were divided into “true optimists” (LOT-R total score of 25-30) and “true
pessimists” (LOT-R score of 12 or below) in order to determine whether a more distinctive gap
between optimists and pessimists would result in task performance differences. A two-way

OPTIMISM AND AUTONOMIC REACTIVITY 41
(True optimist/true pessimist X Task Difficulty) ANCOVA (covarying digit-symbol score) was
conducted to assess task performance differences between true optimists and true pessimists.
The optimist group main effect, F(1, 62) = 2.38, p = 0.128, ηp2 = 0.037, and optimist group X
task difficulty interaction effect, F(1, 62) = 2.39, p = 0.127, ηp2 = 0.037, were both not
significant. The Task Difficulty main effect, F(1, 62) = 341.59, p = 0.000, ηp2 = 0.846, was
significant. Participants completing the difficult task solved fewer of the puzzles correctly (M =
2.36, SE = 0.29) than those completing the easy task (M = 9.58, SE = 0.26).
Task performance can also be conceptualized as an indicator of task engagement.
Because differences in task performance may account for the increased DBP reactivity observed
among optimists in contrast to pessimists, an additional Optimism X Task Difficulty ANCOVA
was conducted on DBP reactivity, covarying BMI, trait anxiety, neuroticism, resting levels, and
task score. Results were similar to the initial analyses of DBP reactivity without adding task
score as a covariate. The Optimism main effect, F(1, 142) = 6.25, p = 0.014, ηp2 = 0.042,
remained significant, while the Task Difficulty main effect, F(1, 142) = 0.56, p = 0.457, ηp2 =
0.004, and the Optimism X Task Difficulty interaction effect, F(1, 142) = 0.31, p = 0.581, ηp2 =
0.002, were not significant. These results suggest that task engagement did not account for the
difference in DBP reactivity between optimists and pessimists.
Measures of Affect
The MAACL-R was given immediately after the completion of the recovery period.
Scores on three MAACL-R subscales (Anxiety, Depression, and Hostility) were combined to
obtain a single negative affect score. For means and standard deviations of positive and negative
affective responses during the experiment, see Table 3. Because measures of positive and
negative affect were positively skewed, all affect scores were transformed using a square root

OPTIMISM AND AUTONOMIC REACTIVITY 42
transformation to reach normality. Separate two-way ANOVAs (Optimism vs. Task Difficulty)
were conducted on the measure of positive affect and negative affect (See ANOVA Summary
Tables 77-82 in Appendix B).
Positive affect. The ANOVA on positive affect revealed a significant main effect for
Optimism, F(1, 148) = 35.36, p = 0.000, ηp2 = 0.193. Optimists reported more positive affect (M
= 4.03, SE = 0.27) than pessimists (M = 1.82, SE = 0.27). The main effect for Task Difficulty
was also significant, F(1, 148) = 54.97, p = 0.000, ηp2 = 0.271. Those completing the easy task
reported more positive affect (M = 4.18, SE = 0.27) compared to those who completed the
difficult task (M = 1.67, SE = 0.27). The Optimism X Task Difficulty interaction effect, F(1,
148) = 0.002, p = 0.962, ηp2 = 0.000, however, was not significant.
Negative affect. The ANOVA on negative affect also showed a significant main effect
for Optimism, F(1, 148) = 4.33, p = 0.039, ηp2 = 0.028. Optimists reported less negative affect
(M = 3.32, SE = 0.35) than pessimists (M = 4.21, SE = 0.34). The main effect for Task
Difficulty was also significant, F(1, 148) = 22.71, p = 0.000, ηp2 = 0.133. Those completing the
difficult task reported more negative affect (M = 4.95, SE = 0.35) compared to those who
completed the easy task (M = 2.58, SE = 0.35). The Optimism X Task Difficulty interaction
effect, F(1, 148) = 1.57, p = 0.212, ηp2 = 0.011, however, was not significant.
Post-experimental questionnaire
To examine responses to items on the Post-Experiment Questionnaire, a series of 2 X 2
(Optimism by Task Difficulty) ANOVAs was conducted (See ANOVA Summary Tables 83-96
in Appendix B). Means and standard errors for each item of the Post-Experiment Questionnaire
are shown in Table 4. For purposes of presenting these results, only significant effects will be
reported here.

OPTIMISM AND AUTONOMIC REACTIVITY 43
How stressful was the task? There was a significant Task Difficulty main effect for the
item “How stressful was the task?” F(1, 148) = 64.94, p = 0.000, ηp 2 = 0.305. Those completing
the difficult task rated the task as more stressful (M = 3.44, SE = 0.10) compared to those
completing the easy task (M = 2.33, SE = 0.10).
How difficult were the problems? There was a significant Task Difficulty main effect
for the item “How difficult were the problems on this task?” F(1, 148) = 190.11, p = 0.000, ηp2 =
0.562. Those completing the difficult task rated the problems as more difficult (M = 4.33, SE =
0.10) compared to those completing the easy task (M = 2.57, SE = 0.10).
How much effort to complete the task? The Task Difficulty main effect was also
significant for the item “How much effort did you put into completing the problems?” F(1, 148)
= 17.17, p = 0.000, ηp 2 = 0.104. Those completing the difficult task indicated that they put more
effort into completing the problems (M = 4.18, SE = 0.09) compared to those completing the
easy task (M = 3.70, SE = 0.09).
Perceived performance Rating. There was also a significant Task Difficulty main effect
for the item “How well do you think you performed on the task?” F(1, 148) = 327.19, p = 0.000,
ηp2 = 0.689. Participants completing the easy task reported performing better (M = 3.73, SE =
0.09) compared to completing the difficult task (M = 1.53, SE = 0.09). The Optimism main
effect was also significant for this item, F(1, 148) = 5.43, p = 0.021, ηp2 = 0.035. Optimists
perceived that they performed better on the task (M = 2.77, SE = 0.09) compared to pessimists
(M = 2.49, SE = 0.09).
Persistence Rating. Main effects for both Optimism, F(1, 148) = 6.51, p = 0.012, ηp 2=
0.042, and Task Difficulty, F(1, 148) = 20.54, p = 0.000, ηp 2= 0.122, were significant for the
item “How persistent were you in completing the task?” Optimists rated themselves as more

OPTIMISM AND AUTONOMIC REACTIVITY 44
persistent in completing the task (M = 4.08, SE = 0.11) compared to pessimists (M = 3.71, SE =
0.10). Those completing the easy task rated themselves as more persistent (M = 4.23, SE = 0.10)
compared to those completing the difficult task (M = 3.56, SE = 0.10).
Discontent with performance Rating. There was a significant Task Difficulty main
effect for the item “How upset are you about your performance on the task?” F(1, 148) = 30.96,
p = 0.000, ηp 2= 0.173. Participants completing the difficult task were more upset with their
performance (M = 2.71 SE = 0.12) compared to those completing the easy task (M = 1.76, SE =
0.12).
Self-efficacy Ratings.
Participants completed the self-efficacy questionnaire to assess confidence in their ability
to complete the task prior to task engagement. There was little variation among participants, as
nearly every participant endorsed being “somewhat confident” or “very confident” they would be
able to accurately complete all of the items during the task. Regardless, an Optimism X Task
Difficulty ANOVA was performed to determine if there were differences between groups in
regard to self-efficacy (See ANOVA Summary Table 97-99 in Appendix B). There were no
differences between optimists and pessimists, F(1, 148) = 0.149, p = 0.700, ηp 2= 0.001, or
between participants completing the easy versus difficult tasks, F(1, 148) = 0.10, p = 0.756, ηp 2=
0.001.
Additionally, to determine whether self-efficacy and digit-symbol score predicted one’s
task performance score, regression analyses were conducted for those completing the difficult
task and those completing the easy task separately. For those completing the difficult task,
neither self-efficacy, β = 0.119, p = 0.305, nor digit-symbol task score, β = 0.124, p = 0.285,
were significantly associated with task performance. However, for those completing the easy
OPTIMISM AND AUTONOMIC REACTIVITY 45
task, self-efficacy, β = 0.288, p = 0.011, significantly predicted task performance, such that
higher self-efficacy was related to higher task performance. Digit-symbol score, β = -0.191, p =
0.088, did not predict task performance for those completing the easy task.
Analysis of Optimism and Pessimism Subscales.
Two previous studies examining the relation between optimism and cardiovascular
reactivity to stress (Puig-Perez et al., 2015; Terrill et al., 2010) found no relation when utilizing
the LOT-R total score, but found a significant relation when LOT-R optimism and pessimism
subscales were analyzed separately. Therefore, additional analyses examining optimism and
pessimism subscales were warranted.
Reactivity to task. Hierarchical regressions entering resting levels of the designated
cardiovascular parameter, BMI (for BP analyses), trait anxiety, and neuroticism in the first step
and LOT-R optimist and pessimist subscales and task difficulty in the second step, were
performed to predict reactivity to the stress task for each cardiovascular parameter (See
Regression Summary Tables 100-107 in Appendix B). The pessimism scale was a significant
predictor of reactivity to the stress task for both DBP, β = 0.177, p = 0.023, and MAP, β = 0.183,
p = 0.014. In both cases, low pessimism was associated with increased reactivity to the task.
Task difficulty was not related to reactivity for either DBP or MAP.
Task Difficulty was a significant predictor for reactivity for both SDNN, β = 0.128, p =
0.040, and LF-HRV, β = 0.171, p = 0.007. Previous analyses demonstrated those completing the
difficult task had greater SDNN and LF-HRV reactivity compared to those completing the easy
task. This finding was confirmed in this analysis.
Recovery from task. Hierarchical regressions entering BMI (for BP analyses), trait
anxiety, and neuroticism in the first step and LOT-R optimist and pessimist subscales and task

OPTIMISM AND AUTONOMIC REACTIVITY 46
difficulty in the second step, were performed to predict recovery following the stress task for
each cardiovascular parameter (See Regression Summary Tables in Appendix C on Pages 108-
113). For HRV analyses, task levels were entered in the first step of the regression. Neither
optimism nor pessimism subscales were significant predictors of recovery for any cardiovascular
parameter. Congruent with the primary analyses, Task Difficulty was a significant predictor of
LF-HRV recovery: β = -0.142, p = 0.028. Those completing the difficult task had more
complete recovery to resting levels compared to those completing the easy task.
Health behaviors and demographic differences between optimists and pessimists.
In order to assess for differences in health behaviors and perceived SES between groups,
Optimism X Task Difficulty ANOVAs were conducted on the following variables: caffeine
intake, alcohol intake, exercise, and perceived SES (See ANOVA Summary Tables 114-118 in
Appendix B). There were no significant main or interaction effects for caffeine intake,
[Optimism, F(1, 148) = 1.48, p = 0.226, ηp2 = 0.010, Task Difficulty, F(1, 148) = 0.05, p = 0.821,
ηp2 = 0.000, Optimism X Task Difficulty interaction, F(1, 148) = 0.000, p = 0.995, ηp
2 = 0.000],
alcohol intake, [Optimism, F(1, 148) = 1.53, p = 0.218, ηp2 = 0.010, Task Difficulty, F(1, 148) =
3.21, p = 0.075, ηp2 = 0.021, Optimism X Task Difficulty interaction, F(1, 148) = 0.16, p = 0.687,
ηp2 = 0.001], or exercise, [Optimism, F(1, 148) = 0.53, p = 0.470, ηp
2 = 0.004, Task Difficulty,
F(1, 148) = 0.01, p = 0.932, ηp2 = 0.000, Optimism X Task Difficulty interaction, F(1, 148) =
3.30, p = 0.071, ηp2 = 0.022]. Results for SES revealed a significant main effect for Optimism,
F(1, 148) = 3.95, p = 0.049, ηp2 = 0.026. Optimists perceived themselves as having higher SES
(based on a scale of one to 10, with one being lower SES and 10 being higher SES; M = 6.01, SE
= 0.19), compared to pessimists (M = 5.49, SE = 0.19). Neither the main effect for Task

OPTIMISM AND AUTONOMIC REACTIVITY 47
Difficulty, F(1, 148) = 0.003, p = 0.959, ηp2 = 0.000, nor the Optimism X Task Difficulty
interaction effect, F(1, 148) = 0.003, p = 0.959, ηp2 = 0.000, was significant.
Chaos theory
In the current study, BP and HR was averaged across time periods for analytic purposes.
Another perspective, chaos theory, is interested in individual differences in changes or
fluctuations of cardiovascular parameters that occur across a time period, as opposed to
averaging across a time period (Goldberger, 2000). For example, HR naturally fluctuates in a
somewhat chaotic manner across time, however, when under stress, these fluctuations are
reduced and HR becomes more patterned. Both HF-HRV and LF-HRV are measures that are
calculated by examining the variability of waveforms across time using spectral waveform
analysis, and therefore reflect values that take into account variations in time associated with
chaotic activity.
In the current study, BP was measured only three times per period (rest, task, recovery),
and thus chaotic fluctuations in BP occurring continuously were not able to be assessed.
However, one could attempt to explore patterns of reactivity by examining changes which
occurred across the task period from the perspective of chaos theory. To examine differential
patterns of reactivity during the stress task, participants were classified as falling into one of five
patterns: (1) sustained reactors (BP reaction stays stable across entire task), (2) habituators (BP
reaction declines across the task), (3) sensitizers (BP reactions intensify over the duration of the
task), (4) mixed (BP reactions increases from minute one to minute three, but then decreases
from minute three to minute five), or (5) non-reactors (BP does not increase more than two mm
Hg above resting levels at any point during the stress task). Because task differences in BP
reactivity were not observed in this study, task difficulty was not considered in categorizing

OPTIMISM AND AUTONOMIC REACTIVITY 48
participants in this way. LOT-R scores and performance scores of participants categorized into
these five patterns of reactivity were compared using one-way ANCOVA’s, using trait-anxiety
and neuroticism as covariates (See ANCOVA Summary Tables 119-123 in Appendix B).
Patterns of SBP reactivity, F(4, 145) = 0.726, p = 0.576, ηp2 = 0.020, and MAP reactivity, F(4,
145) = 2.197, p = 0.072, ηp2 = 0.057, were not associated with LOT-R score. However, LOT-R
score differed across patterns of DBP reactivity, F(4, 145) = 4.01, p = 0.004, ηp2 = 0.100. Those
who were categorized as non-reactors had significantly lower LOT-R scores (more pessimistic)
(M = 16.39, SE = 0.97) than those categorized as either sustained reactors (M = 20.18, SE =
0.744) or sensitizers (M = 20.64, SE = 0.774). Patterns of SBP reactivity, F(4, 145) = 1.195, p =
0.315, ηp2 = 0.032, DBP reactivity, F(4, 145) = 0.511, p = 0.728, ηp
2 = 0.014, and MAP
reactivity, F(4, 145) = 0.286, p = 0.887, ηp2 = 0.008, were not associated with task performance.
Discussion
Several previous studies have examined the relation between optimism and
cardiovascular reactivity to stress; however, many of these studies had significant shortcomings.
The purpose of this study was to examine the association between optimism and cardiovascular
reactivity to stress by addressing several of the shortcomings of previous studies. This study also
sought to test Carver and Scheier’s Behavioral Self-Regulation Model, which hypothesizes that
optimists, compared to pessimists, are likely to engage more (and potentially experience more
autonomic arousal) when their goals are blocked by obstacles. First, it was hypothesized during
a difficult task, optimists would fully engage their resources, and thus display greater autonomic
reactivity compared to pessimists. This was indeed true, as optimists displayed greater DBP
reactivity compared to pessimists during the difficult task. It was also hypothesized optimists
would display better performance in completing the difficult task, and slower recovery following
OPTIMISM AND AUTONOMIC REACTIVITY 49
the task compared to pessimists. Neither of these hypotheses were realized, as there were no
differences in task performance or recovery following the task. Finally, it was hypothesized
there would be no difference in autonomic reactivity or recovery between optimists and
pessimists who completed the easy task. This hypothesis was not founded, as optimists
displayed greater reactivity on the easy task. There was no difference in reactivity following the
easy task. These findings are congruent with the Behavioral Self-Regulation Model, as optimists
appeared to put forth more effort in both tasks and displayed greater autonomic reactivity to both
tasks.
Previous studies have found mixed results regarding the relation between optimism and
cardiovascular reactivity to stress. Some have found that optimists have smaller reactions to
stress tasks compared to pessimists (Geers et al., 2008; Puig-Perez et al., 2015; Terrill et al.,
2010; Williams et al., 1990), some have found no difference between optimists and pessimists
(Bonfiglio, 2005; Kennedy & Hughes, 2004; Nes et al., 2005), and some have found that
optimists are actually more reactive to stress tasks than pessimists (Richman et al., 2007; Puig-
Perez et al., 2017). One study (Nes et al., 2005) found optimists had slower autonomic recovery
following the stress task, although few studies have measured cardiovascular measures during
recovery periods.
Although the current study found no significant differences between optimists and
pessimists for most of the cardiovascular parameters assessed (i.e., MAP, HR, HF-HRV, SDNN,
and LF-HRV), optimists exhibited larger DBP reactions to the experimental task than pessimists,
regardless of task difficulty. This may indicate that optimists displayed greater effort in
completing the task than pessimists. The pattern of reactivity was similar for SBP (optimists
displaying slightly greater reactivity to both tasks), however, the difference in SBP reactivity

OPTIMISM AND AUTONOMIC REACTIVITY 50
between optimists and pessimists was not significant (p = .059). This finding appears to support
Carver and Scheier’s Behavioral Self-Regulation model, which states that optimists
engage/persist more in task completion in order to overcome the obstacle compared to
pessimists. This finding is congruent with the findings of Richman et al. (2007) and Puig-Perez
et al. (2017), who also found optimists were more reactive to stress tasks compared to pessimists.
Indeed, following the completion of the stress tasks, optimists rated themselves as performing
better and being more persistent on both easy and difficult versions of the task compared to
pessimists’ ratings of their perceived performance and persistence (despite task performance
scores being similar for both groups). Together, these findings are consistent with the hypothesis
that optimists engage more and display greater cardiovascular reactivity to a stress task
compared to pessimists. Despite the differences between optimists and pessimists on measures
of DBP reactivity and task persistence, no differences were observed on actual task performance
between optimists and pessimists. This indicates that while optimists may have been more
engaged with the task, it had no detectable impact on their performance. In this regard, the
increased persistence and effort in completing these tasks did not have any tangible benefits for
optimists.
Although significant differences were detected on how optimists and pessimists engaged
with the Raven’s Matrices task in this study, there were no differences in cardiovascular
recovery from the task between optimism groups. This is consistent with previous studies
measuring autonomic recovery among optimists and pessimists following stress tasks. Of the six
studies measuring recovery following the task, four (Bonfiglio, 2005; Kennedy and Hughes,
2004; Puig-Perez, et al., 2015; Richman et al., 2007) found no relation between optimism and
recovery following a stress task. Nes, Segerstrom, and Sephton (2005) found optimism was

OPTIMISM AND AUTONOMIC REACTIVITY 51
related with slower recovery from stress, and Terrill et al., (2010) found optimism was related
with faster recovery from stress. The current finding lends credence to the majority of studies,
which found no relation between optimism and recovery from stress.
Interestingly, optimists in the current study thought they performed better on the tasks
than pessimists, but this difference was not reflected by differences in actual task scores between
them. It seems optimists were overly confident regarding their performance. The definition of
an optimist is someone who tends to believe he/she will perform well in the future (Carver,
Scheier, Segerstrom, 2010); however, in the context of the current study, it appears that optimists
may overestimate their past success or performance as well. Overestimating one’s success or
performance may actually be adaptive in some circumstances. One possible benefit to being
overly confident in one’s performance is that an optimist may tend to ruminate less regarding
performances that have not gone very well. Indeed, rumination has been linked to poorer
physical and psychological health (Williams et al., 2017; Zawadski, 2015). An alternative
hypothesis is that optimists and pessimists interpreted the question ‘How well do you think you
performed on the task?’ differently. For example, pessimists might interpret this question as
referring to the number of problems they correctly solved (i.e., one out of 10), in which case,
they would view their performance as poor. However, optimists may interpret this question in a
manner friendlier to themselves (i.e., “Given I have never completed a problem like that, getting
one out of 10 correct is pretty good”). Whether optimists actually believed they performed better
or whether they interpreted the question differently, both scenarios would result in less
rumination about their performance. To the extent that optimism reduces rumination, this may
prove to be another possible mechanism through which optimism leads to better health. While
optimists may react to stressors with increased autonomic arousal, they may ruminate less if they

OPTIMISM AND AUTONOMIC REACTIVITY 52
perceive their performance as acceptable (despite their actual poor performance), resulting in
better overall health. Less rumination over the course of weeks, months, years, and a lifetime
could lead to better health outcomes.
While optimists and pessimists did not actually differ in task performance in the current
study, there were several significant task differences observed. First, those completing the
difficult task rated the task as more stressful and rated the problems as more difficult compared
to those completing the easy task. Additionally, those completing the difficult task reported
putting more effort into completing the problems compared to those who completed the easy task
and becoming more upset than those who completed the easy task. Finally, those who completed
the easy task rated their task persistence and perceived performance higher than those who
completed the difficult task. Of note, the increased perceived performance ratings for those
completing the easy task accurately reflected their superior performance on the task in
comparison to those completing the difficult task. Additionally, the type of task influenced
ratings of affect obtained at the end of the study; participants completing the easy task reported
much greater positive affect and lesser negative affect than those completing the difficult task.
In sum, there is evidence that the experience of completing a difficult task in this study was quite
different from the experience of completing an easy task.
In regard to cardiovascular differences between those completing the difficult and easy
tasks, two (out of seven) parameters showed task differences. For both SDNN and LF-HRV,
those completing the difficult task demonstrated greater reactivity. The task differences for
SDNN and LF-HRV are what one would expect to find; greater reactivity to a more difficult
stress task matches the participants’ self-report ratings and affective responses to the difficult
task. It is curious, then, that these differences were seen for SDNN and LF-HRV, and not for

OPTIMISM AND AUTONOMIC REACTIVITY 53
other autonomic parameters. This finding is actually consistent with some past research. For
example, Solomon, Holmes, and McCaul (1980) found that there was no difference in HR
reactivity between a difficult and easy stress task; however, those completing the difficult task
reported more anxiety than those completing the easy task. Light and Obrist (1983) found
similar results. In some cases, then, difficulty of the task may not be the most important factor
when measuring cardiovascular responses to stress, at least when measuring HR and BP. In
contrast to HR, that reflects the combined influences of the sympathetic and parasympathetic
branches of the autonomic nervous system, measures of HRV are thought to be influenced
predominantly by parasympathetic activity mediated by the vagal nerve. It is possible that task
difficulty influences parasympathetic withdrawal more than sympathetic activation, and
consequently, measures of BP and HR are not sensitive enough to detect these specific neural
actions.
Another explanation for the lack of differences detected on measures of HR and BP in
response to task difficulty, particularly with respect to comparing cardiovascular responses of
optimists and pessimists, might be the failure of experimental work to examine how
cardiovascular responses change over the course of the task period as optimists and pessimists
encounter tasks of varying difficulty. For example, optimists may fully engage their resources
early in the task period to overcome obstacles, regardless of the difficulty of the task, but as the
task proceeds, optimists may continue to persist and engage full resources if the task is difficult,
but decrease their effort if the task is easy, recognizing that less engagement/persistence is
needed to complete the task. Some prior research supports this idea. For example, Hoffman
(2001) found that for participants completing a longer duration difficult anagram task, in which
the rules were constantly changing, optimism was positively related to task engagement.

OPTIMISM AND AUTONOMIC REACTIVITY 54
However, for those completing a longer duration straightforward anagram task in which the rules
remained constant, optimism was not related to task engagement. In the current study, the stress
task only lasted five minutes in duration. The five-minute stress task was long enough to capture
the optimists’ initial full engagement in the task (thus elevated DBP reactivity to both tasks), but
may have been too short of a period to capture the optimists’ decreased engagement in the easy
task. Had the task periods in the current study been longer, DBP responses of optimists may
have habituated to the easy task, while continuing to remain engaged in the difficult task,
resulting in differences in reactivity for the two tasks. During the first minute of the stress task,
there was no difference in DBP reactivity observed between optimists and pessimists; therefore,
the differences in DBP emerged later as the task progressed. This suggests optimists continued
to engage in task completion fully, while pessimists habituated to the tasks quickly, suggesting
pessimists became less engaged in both tasks more quickly than optimists. Future research will
be needed employing various task durations to examine this hypothesis thoroughly.
Examination of patterns of reactivity across the task revealed interesting information
about participants’ persistence during task completion. Analyses examining the patterns of
reactivity over the course of the stress tasks suggest that optimists may have been more persistent
during the tasks. For example, those who were categorized as sustained DBP reactors or
sensitizers (DBP remained elevated or increased across the duration of the task) had significantly
higher LOT-R scores (more optimistic) compared to those who were non-reactors. This
sustained elevation or increase of DBP from the beginning to the end of the task possibly
represents continued persistence and engagement throughout the entirety of the five-minute task.
This is consistent with self-report data, in which optimists rated themselves as being more
persistent compared to pessimists to both tasks. These findings are consistent with the

OPTIMISM AND AUTONOMIC REACTIVITY 55
Behavioral Self-Regulation model, in which optimists are hypothesized to engage more in
pursuit of desired goals than pessimists.
Given substantial evidence suggesting optimists have better health outcomes, including
cardiovascular health, compared to pessimists, it is interesting that optimists displayed increased
reactivity to the stress task, especially since increased reactivity to stress tasks is generally
associated with poorer cardiovascular health outcomes. There are several possible reasons why
optimists have better health outcomes despite increased reactivity to stress. First, some studies
have shown optimists have lower ambulatory BP over 3-day periods (Räikkönen & Matthews,
2008; Räikkönen et al., 1999). If optimists are faced with an obstacle, they engage their
resources and use approach-focused coping to overcome the obstacle and overcome an obstacle
more quickly than pessimists. In this case, they would experience stress for a shorter period of
time because the obstacle would be overcome more quickly, resulting in lower ambulatory BP.
If the stressful experience is of longer duration, such as unemployment, housing issues, or
relationship issues, an optimist’s increased engagement and use of approach-focused coping
could result in overcoming the stressor days, weeks, or months more quickly compared to a
pessimist, and in turn, lower ambulatory BP. The result of less stress and lower ambulatory BP
in general would be better health, specifically cardiovascular health. Additionally, as discussed
previously, optimists may tend to ruminate less about past performance and experiences
compared to pessimists, which could lead to less stress overall. In sum, optimism may be related
to better health due to optimists experiencing less stress generally due to using approach-focused
coping, lower ambulatory BP, less rumination, and being from higher SES backgrounds
compared to pessimists.

OPTIMISM AND AUTONOMIC REACTIVITY 56
Another factor to consider in explaining why optimism has been associated with better
health outcomes but was associated with greater DBP reactivity in this study is our lack of
knowledge regarding the optimal level of reactivity that should accompany completion of the
Raven’s Matrices Task. It could be, for example, that optimists exhibited the appropriate DBP
response for completing this type of cognitive task, but that pessimists displayed a less-than-
optimal under-aroused DBP response. Although McEwen and Stellar (1993) identified a blunted
autonomic response as a form of allostatic load, not much research has focused on this pattern of
physiological responding to stress until recently (e.g., al’Absi, 2018). al’Absi has demonstrated
that such blunted cardiovascular responses are equally problematic as exaggerated responses and
may shed light on behavioral risk for conditions like cardiovascular disease, pain disorders, and
addiction. From this perspective, pessimists may display blunted cardiovascular responses to
stress that render them incapable of solving cognitive challenges like the one used in this study.
In two previous studies (Puig-Perez et al., 2015; Terrill et al., 2010), initial analysis of
total LOT-R scores did not demonstrate a relation between optimism and autonomic reactivity.
However, when optimism and pessimism subscales were analyzed separately, a relation between
the optimism subscale and autonomic reactivity was revealed. In contrast to these prior studies,
in the current study, pessimism subscale scores, but not optimism subscale scores, were
associated with DBP and MAP reactivity to the task. Higher pessimism was associated with
decreased reactivity on both parameters. In other words, expecting negative outcomes in the
future impacted reactivity more than a lack of expectations of positive outcomes. It could be that
actively expecting bad things to happen changes how one reacts to stressful situations more than
simply not expecting good things to happen. However, because these findings were not
consistent with findings from the prior work, future investigations will need to examine potential

OPTIMISM AND AUTONOMIC REACTIVITY 57
reasons why pessimism was associated with the stress task used in the current study more than
optimism, and the opposite pattern of findings was observed in studies that used social speech
tasks as a stressor. It is interesting that the optimism subscale was related to autonomic
reactivity in stress tasks involving social interaction, but the pessimism subscale was related to
reactivity in the current task, which involved minimal social interaction. It may be expecting (or
not expecting) good things to happen drives reactivity during social interaction, but expecting (or
not expecting) negative outcomes drives reactivity in tasks not involving social interaction.
While the differing relation between reactivity and optimism and pessimism subscales
may represent a difference in how expecting good things to happen vs. not expecting bad things
to happen influences reactivity in different circumstances, some have argued the difference
between optimism and pessimism subscales is simply a difference in wording. For example, the
LOT-R pessimism scale consists of all negatively-worded items while the optimism subscale
consists of all positively-worded items. Therefore, the nature of the LOT-R subscales makes it
difficult to interpret differences between the subscales meaningfully. Indeed, the creators of the
LOT-R point out that the meaning attached to separate optimism and pessimism subscales is
unclear; they attribute the two-factor structure of the LOT-R to item wording rather than
meaningful item content (Scheier et al., 1994). With this understanding, it may be the relation
between pessimism subscales and reactivity in the current study, and optimism subscales in
previous studies with social interaction stressors, is coincidental.
As noted earlier, the screening sample in the current study apparently was more
optimistic than those reported in prior studies (e.g., Bonfiglio, 2005; Kennedy & Hughes, 2004).
Consequently, the cut-off values and mean scores on the LOT-R were somewhat higher in the
current study than previous work. Samples of both Bonfiglio and Kennedy and Hughes

OPTIMISM AND AUTONOMIC REACTIVITY 58
consisted of undergraduate women in contrast the current study that consisted of both men and
women (although predominantly women). There was no difference in optimism levels between
men and women in the current study, however, so the difference between the current sample and
those in previous studies does not seem to be related to sex of participants. Samples of previous
studies were similar to the current sample with regard to age and undergraduate student status. It
is possible that regional differences exist in optimism. Some have postulated that optimism is
affected by the context of the culture from which a person comes (You, Fung, & Isaacowitz,
2009); cultures that emphasize optimism tend to produce individuals who are more optimistic.
From this perspective, however, it is difficult to generate reasons why students at West Virginia
University would be more optimistic than students at other institutions. In fact, because a
substantial number of students who attend West Virginia University come from Appalachia, the
literature does not suggest that optimism is commonly associated with this culture (Smokowski,
Evans, Cotto, & Guo, 2014; Zullig & Hendryx, 2011). It is also possible that the differences in
optimism levels between the current sample and previous samples reflect generational
differences in optimism. Students comprising Generation Y or the Millennial Generation have
been reported to express considerable optimism (De Hauw & De Vos, 2010; Salahuddin, 2010),
so it is possible differences in sample characteristics in optimism are related to the predominant
generation of the student sample. Regardless of the reason for this difference in sample
characteristics, the current findings may not generalize to samples with lower levels of optimism.
Interestingly, if the pessimist group was defined based on LOT-R cut-offs or levels reported in
prior work, different between-group differences in cardiovascular reactivity to the stressor may
have been observed. By adopting a lower cut-off score to define “true pessimists” in the current
study (LOT-R 12 or below), lower SBP reactions were only observed in this group and not those

OPTIMISM AND AUTONOMIC REACTIVITY 59
categorized as “slight pessimists” (LOT-R between 13-17). This finding confirms that the least
reactive participants were those with the lowest scores on the LOT-R, lending further support to
the finding that they may have been the least engaged with the task.
Health behaviors and demographic differences between optimists and pessimists
Others have proposed that possible differences in health behaviors and other variables
(e.g., socioeconomic status) between optimists and pessimists may contribute to their disparate
health outcomes. The current study also considered several of these variables in assessing for
differences in health behaviors that might exist between optimists and pessimists. Interestingly,
our sample did not display differences between optimists and pessimists in regard to alcohol or
caffeine intake, or amount of exercise. However, in our sample optimists reported to be from
higher SES compared pessimists. Other studies have shown that higher SES is linked to
improved health (Adler & Ostrove, 1999), so given that optimists in our sample may come from
higher SES backgrounds than pessimists, SES is possibly an additional contributing factor to
explaining the health differences between optimists and pessimists. However, the nature of the
relation between optimism and SES requires further exploration. In our sample, participants
reported their perception of where they fall on a spectrum of perceived social status; however,
their actual SES, including parents’ education, occupation, and income was not assessed.
Whether their perceived SES accurately reflects their actual SES is unclear. It is possible that
optimistic participants tend to view their life circumstances as more favorable compared to
pessimists, despite no real differences in SES. It is also possible that optimistic people are more
optimistic because they have higher SES, and therefore have more resources and opportunities
than participants with less optimism. Further, optimists may strive harder and seek out more
opportunities than pessimists because they are confident that their plans will work, and therefore

OPTIMISM AND AUTONOMIC REACTIVITY 60
they move upward on the SES spectrum. Whatever the nature of the relation between optimism
and SES, SES should be explored as a potential mechanism through which optimists obtain
better health in future work.
Strengths and Limitations
There are several strengths of this study that lend credence to its findings. First, the
majority of previous studies measuring the relation between optimism and autonomic reactivity
to stress were designed to assess variables other than optimism, and optimism analyses were
secondary research questions. The current study was designed specifically to assess the relation
between optimism and autonomic reactivity to stress. Given the specific goal of this study, the
study was powered appropriately to examine study hypotheses as well as control for several
covariates known to be associated with optimism (e.g., trait anxiety, neuroticism).
Second, the current study possessed an adequate amount of internal validity, despite its
quasi-experimental design. Variables such as sex, BMI, other pertinent personality variables,
prescription medication use, caffeine intake, exercise, and tobacco and other drug use were all
controlled either statistically or experimentally. Additionally, participants were randomly
assigned to task difficulty conditions to provide some additional control over threats to
experimental validity.
Third, the study employed “easy” and “difficult” stress tasks. Results clearly showed
differences in task performance and perceived difficulty of the two tasks, indicating the tasks
could be confirmed as “easy” and “difficult.” Effect sizes for self-report questions related to the
two tasks and task performance differences were generally in the medium to large range,
demonstrating a clear difference in difficulty between the tasks.

OPTIMISM AND AUTONOMIC REACTIVITY 61
There were some limitations to this study. First, the Behavioral Self-Regulation Model
stipulates optimists will engage all of their resources to overcome obstacles and obtain their
goals more than pessimists. This study employed a brief, five-minute laboratory stressor, which
is unlikely to be similar to stressors or obstacles faced on a day-to-day basis. The brevity of the
Raven Matrices task used did not allow for a thorough examination of the pattern of reactivity
among optimists and pessimists during prolonged stressors, such as preparing for a test, finding a
job, dealing with relationship problems, etc. It is possible patterns of reactivity that occur during
more prolonged stressors, like those encountered in daily life, would reveal a more complete
picture of how optimists and pessimists react to stressors emotionally, cognitively, and
physiologically.
The Raven’s Matrices tasks were equal in all but difficulty, increasing internal validity of
this study. However, the ecological validity of these stress tasks is limited. Day-to-day stressors
optimists and pessimists encounter are highly variable, and may include stress due to
unemployment, relationship problems, financial problems, or health problems. It is possible
optimists and pessimists react differently to stressors that are more pertinent to their lives.
Future research should examine both autonomic and behavioral reactions to real-life stressors
among optimists and pessimists.
It should also be noted the Raven’s Matrices Stress tasks used in this study are cognitive
stress tasks. It is possible results may differ when social or physical stress tasks are employed.
Another limitation of this study was the time of the semester that optimists and pessimists
were recruited. Significantly more optimists signed up to participate towards the beginning of
the study, which commenced during the Fall, 2016 semester and the first month of the Spring,
2017 semester. Pessimists did not sign up for the study as readily as optimists, and thus,

OPTIMISM AND AUTONOMIC REACTIVITY 62
recruitment of these participants took longer. More than half of the pessimists participated in the
second half of the Spring, 2017 semester and the Summer, 2017 term. To complete data
collection, 10 pessimists participated in the study during the first month of the Fall, 2017
semester. It is possible that differences exist between volunteers who participate at the
beginning of semesters and those who participate at the end of semesters. Because the majority
of pessimists participated later during data collection than optimists, any differences that
emerged may be influenced by this difference in participant recruitment employed in the current
study. However, it is also possible that the measure of optimism used in this study was
associated with other dispositional characteristics that influence participants to seek out
opportunities to obtain extra credit in their courses early versus those who delay pursuit of these
opportunities.
Another limitation of the study is that the sample in the current study was relatively
homogenous. Participants were predominantly Caucasian and predominantly female, ranging in
age from 18-25 years old. All participants were undergraduate university students. This study
would need to be conducted with a more heterogeneous community sample to determine if the
observed effects are generalizable to non-student populations. This would be important given
that some previous studies using different samples found different results related to optimism
and reactivity during a stress task (e.g., Nes et al., 2005; Puig-Perez et al., 2015).
Additionally, the unique sample of optimists and pessimists in the current study is a
limitation. In the current study, both optimists and pessimists generally had higher LOT-R
scores (were more optimistic) compared to previous studies. While some participants in the
study would be considered true pessimists, the pessimist group contained several participants
who would not have been characterized as pessimists according to criteria reported in prior work,

OPTIMISM AND AUTONOMIC REACTIVITY 63
but were considered relative pessimists in this sample because their LOT-R scores were within
the bottom tertile of scores of our student sample distribution. As shown previously, slight
pessimists in the current study had greater SBP reactivity compared to true pessimists. The
current sample’s higher optimism levels may have influenced the manner in which they reacted
to the stress tasks. The current sample comprised of mostly Caucasian participants who are
receiving a college education is likely different in levels of optimism and pessimism compared to
the general population.
Another limitation to this study is that numerous analyses were conducted. It is possible
that the few significant findings reported were due to an increased Type I error rate, given the
large number of analyses that were conducted. However, the study was powered adequately to
test study hypotheses and findings with smaller effect sizes make contributions to the literature in
this area.
Future Directions
Few studies have been designed specifically to assess the difference in reactivity to stress
between optimists and pessimists. Evidence is mounting that supports the idea that optimists
have increased reactivity to stress tasks compared to pessimists. However, the majority of these
studies have employed brief laboratory stressors. More studies designed to demonstrate this
phenomenon in externally valid situations are necessary. For example, more studies employing
ambulatory measurement methods would help shed light on how and under what circumstances
optimists display exaggerated autonomic reactions to daily stressors. Such studies may
distinguish between different types of stressors. For example, participants could provide
information about the nature of the stressor: stressful social interactions, work-related stress (i.e.,
thinking about deadlines, etc.), or stress related to physical and/or emotional danger.

OPTIMISM AND AUTONOMIC REACTIVITY 64
Additionally, future laboratory studies designed to examine the relation between
optimism and stress reactivity may employ stress tasks of varying lengths. Employing tasks of
varying lengths would allow researchers to determine whether optimists initially engage more,
but then adjust their level of engagement depending on the demands of the task. This type of
research could also examine the temporal characteristics of task performance to determine
whether task engagement is sustained throughout the entire task period or wanes as the task
period progresses. If the Behavioral Self-Regulation Model is accurate, one would expect the
performance of optimists and pessimists to differ, particularly in response to information
regarding whether the participant is succeeding of failing at the designated task.
Finally, generational differences of the linkage between optimism and autonomic
response to stress are worthy of future investigations. By solely studying undergraduate
students, researchers are restricting the broad generalizations needed in order to make any firm
conclusions about the beneficial aspects of optimism on health outcomes.
Summary and Conclusions
Among previous studies that examined the relation between optimism and cardiovascular
reactivity to stress, four studies found that optimists were less reactive to tasks compared to
pessimists (Geers et al., 2008; Puig-Perez et al., 2015; Terrill et al., 2010; Williams et al., 1990),
three studies found no relation (Bonfiglio, 2005; Kennedy & Hughes, 2004; Nes et al., 2005),
and three studies found that in some situations optimists were more reactive to stress than
pessimists (Richman et al., 2007; Puig-Perez et al., 2017). Although Nes et al. (2005) did not
find an association between optimism and reactivity, they found that optimists had slower
recovery than pessimists following the task. Many of these previous studies were designed to
test various other hypotheses and findings examining associations between optimism and
OPTIMISM AND AUTONOMIC REACTIVITY 65
cardiovascular reactivity hypothesis reflected secondary analyses, so they often were not
powered adequately or to control for important covariates to make meaningful contributions to
the literature. The current study was designed specifically to test the optimism-cardiovascular
reactivity relation. Unlike many of the previous studies, this current study controlled for several
factors related to optimism (e.g., neuroticism, trait anxiety) and several factors that may
influence cardiovascular reactivity, including caffeine/nicotine intake, prescription drugs, and
BMI. The increased control of these factors in this study increases its internal validity, thus
bolstering its findings in comparison with prior work in this area. This study adds credence to
previous studies’ findings that optimists are actually more reactive to stress compared to
pessimists, at least in response to brief mental stress tasks. This study, however, failed to support
the previous finding that optimists and pessimists differed in their cardiovascular recovery
following stress tasks during recovery periods (Nes, Segerstrom, & Sephton, 2005).
It is also important to acknowledge prior studies that found optimists have lower
ambulatory BP compared to pessimists, but had similar BP reactivity to pessimists during acute
stressors (Räikkönen & Matthews, 2008; Räikkönen et al., 1999). Combined with the findings of
the current study, it seems that during periods of acute stress, optimists’ BP appears to be equally
or more reactive than pessimists’ BP. However, over the course of entire days, weeks, and
months, optimists may have lower average BP than pessimists, and in the end, the prolonged
positive physiological and emotional aspects of optimism are likely to make more substantial
contributions to better health than how optimists and pessimists respond to brief, acute
environmental stressors.

OPTIMISM AND AUTONOMIC REACTIVITY 66
References
Adler, N. E., & Ostrove, J. M. (1999). Socioeconomic status and health: What we know and
what we don't. Annals of the New York Academy of Sciences, 896(1), 3-15.
al’Absi, M. (2018). Stress and addiction: When a robust stress response indicates resiliency.
Psychosomatic Medicine, 80, 2-16. doi: 10.1097/PSY.0000000000000520.
Barth, J., Schumacher, M., & Herrmann-Lingen, C. (2004). Depression as a risk factor for
mortality in patients with coronary heart disease: a meta-analysis. Psychosomatic
Medicine, 66(6), 802-813.
Billingsley, K. D., Waehler, C. A., & Hardin, S. I. (1993). Stability of optimism and choice of
coping strategy. Perceptual and Motor Skills, 76(1), 91-97.
doi:10.2466/pms.1993.76.1.91
Boden-Albala, B., Litwak, E., Elkind, M.S.V., Rundek, T., & Sacco, R. L. (2005). Social
isolation and outcomes post stroke. Neurology, 64(11), 1888-1892.
Boehm, J. K., & Kubzansky, L. D. (2012). The heart's content: The association between positive
psychological well-being and cardiovascular health. Psychological Bulletin, 138(4), 655-
691. doi:10.1037/a0027448
Bonfiglio, D. V. (2005). The interaction of dispositional optimism and social support in the
moderation of cardiovascular responses to acute psychosocial stress. Dissertation
Abstracts Internationa, 66, 3456.
Carroll, D., Ginty, A. T., Der, G., Hunt, K., Benzeval, M., & Phillips, A. C. (2012). Increased
blood pressure reactions to acute mental stress are associated with 16-year cardiovascular
disease mortality. Psychophysiology, 49(10), 1444-1448. doi:10.1111/j.1469-
8986.2012.01463.x.

OPTIMISM AND AUTONOMIC REACTIVITY 67
Carver, C. S., Lehman, J. M., & Antoni, M. H. (2003). Dispositional pessimism predicts illness-
related disruption of social and recreational activities among breast cancer
patients. Journal of Personality and Social Psychology, 84(4), 813-821.
doi:10.1037/0022-3514.84.4.813
Carver, C., & Scheier, M. (2000). On the structure of behavioral self-regulation. In M.
Boekaerts, P. Pintrich, & M. Zeidner (Eds.), Handbook of self-regulation (pp. 41–84).
San Diego: Academic.
Carver, C. S., Scheier, M. F., & Segerstrom, S. C. (2010). Optimism. Clinical psychology
review, 30(7), 879-889.
Chan, C. H., Wan Ahmad, W. A., Yusof, M. M., Ho, G., & Krupat, E. (2015). Effects of
depression and anxiety on mortality in a mixed cancer group: A longitudinal approach
using standardized diagnostic interviews. Psycho-Oncology, 24(6), 718-725.
doi:10.1002/pon.3714
Chang, L., & McBride-Chang, C. (1996). The factor structure of the Life Orientation Test.
Educational and Psychological Measurement, 56(2), 325-329.
Chida, Y., & Steptoe, A. (2010). Greater cardiovascular responses to laboratory mental stress are
associated with poor subsequent cardiovascular risk status a meta-analysis of prospective
evidence. Hypertension, 55(4), 1026-1032.
Clark, R., Benkert, R. A., & Flack, J. M. (2006). Violence Exposure and Optimism Predict Task-
Induced Changes in Blood Pressure and Pulse Rate in a Normotensive Sample of Inner-
City Black Youth. Psychosomatic Medicine, 68(1), 73-79.
doi:10.1097/01.psy.0000195744.13608.11

OPTIMISM AND AUTONOMIC REACTIVITY 68
Cohen, F., Kearney, K. A., Zegans, L. S., Kemeny, M. E., Neuhaus, J. M., & Stites, D. P. (1999).
Differential immune system changes with acute and persistent stress for optimists vs
pessimists. Brain, Behavior, and Immunity, 13(2), 155-174.
Cundiff, J. M., Smith, T. W., Uchino, B. N., & Berg, C. A. (2013). Subjective social status:
construct validity and associations with psychosocial vulnerability and self-rated
health. International Journal of Behavioral Medicine, 20(1), 148-158.
De Hauw, S., & De Vos, A. (2010). Millennials’ career perspective and psychological contract
expectations: Does the recession lead to lowered expectations? Journal of Business and
Psychology, 25(2), 293-302. doi:10.1007/s10869-010-9162-9
Friedberg, J. P., Suchday, S., & Srinivas, V. S. (2009). Relationship between forgiveness and
psychological indices in cardiac patients. International Journal of Behavioral Medicine,
16(3), 205-211. doi:10.1007/s12529-008-9016-2.
Geers, A. L., Wellman, J. A., Helfer, S. G., Fowler, S. L., & France, C. R. (2008). Dispositional
optimism and thoughts of well-being determine sensitivity to an experimental pain task.
Annals of Behavioral Medicine, 36(3), 304-313.
Giltay, E., Geleijnse, J., Zitman, F., Buijsse, B., & Kromhout, D. (2007). Lifestyle and dietary
correlates of dispositional optimism in men: The Zutphen Elderly Study. Journal of
Psychosomatic Research, 63, 483–490.
Glaesmer, H., Rief, W., Martin, A., Mewes, R., Brähler, E., Zenger, M., & Hinz, A. (2012).
Psychometric properties and population‐based norms of the Life Orientation Test
Revised (LOT‐R). British Journal of Health Psychology, 17(2), 432-445.

OPTIMISM AND AUTONOMIC REACTIVITY 69
Goldberger, A.L. (2000). Nonlinear dynamics, fractals, and chaos theory for clinicians:
Implications for neuroautonomic heart rate control in health and disease. Circulation, 23,
215-220.
Grewen, K., Girdler, S. S., West, S. G., Bragdon, E., Costello, N., & Light, K. C. (2000). Stable
pessimistic attributions interact with socioeconomic status to influence blood pressure
and vulnerability to hypertension. Journal of Women's Health & Gender-based Medicine,
9(8), 905-915.
Helton, W. S., Dember, W. N., Warm, J. S., & Matthews, G. (1999). Optimism, pessimism, and
false failure feedback: Effects on vigilance performance. Current Psychology, 18(4), 311-
325.
Hoffman, R. I. (2001, March). The relation of optimism and self-mastery to responses to
unfavorable contingency changes. Dissertation Abstracts International, 61, 5055.
House, J. S., Landis, K. R., & Umberson, D. (1988). Social relationships and health. Science,
241(4865), 540-545.
Hunsley, J. (1990). Dimensionality of the Multiple Affect Adjective Check List-Revised: A
comparison of factor analytic procedures. Journal of Psychopathology and Behavioral
Assessment, 12(1), 81-91.
Jessor, R., Donovan, J. E., & Costa, F. (1996). Personality, perceived life chances, and
adolescent behavior. In K. Hurrelmann, S. F. Hamilton, K. Hurrelmann, S. F. Hamilton
(Eds.), Social problems and social contexts in adolescence: Perspectives across
boundaries (pp. 219-233). Hawthorne, NY, US: Aldine de Gruyter.
Kelloniemi, H., Ek, E., & Laitinen, J. (2005). Optimism, dietary habits, body mass index and
smoking among young Finnish adults. Appetite, 45, 169–176.

OPTIMISM AND AUTONOMIC REACTIVITY 70
Kennedy, D. K., & Hughes, B. M. (2004). The optimism-neuroticism question: An evaluation
based on cardiovascular reactivity in female college students. Psychological Record,
54(3), 373-386.
Krantz, D. S., & Manuck, S. B. (1984). Acute psychophysiologic reactivity and risk of
cardiovascular disease: a review and methodologic critique. Psychological Bulletin, 96(3),
435-464.
Krantz, D., Manuck, S., & Wing, R. (1986). Psychological stressors and task variables as
elicitors of reactivity. In Handbook of Stress, Reactivity, and Cardiovascular Disease (pp.
85-108). New York, NY: John Wiley & Sons Inc.
Kubzansky, L. D., Kubzansky, P. E., & Maselko, J. (2004). Optimism and pessimism in the
context of health: Bipolar opposites or separate constructs? Personality and Social
Psychology Bulletin, 30, 943–956.
Kubzansky, L. D., Sparrow, D., Vokonas, P., & Kawachi, I. (2001). Is the glass half empty or
half full? A prospective study of optimism and coronary heart disease in the normative
aging study. Psychosomatic Medicine, 63(6), 910-916.
Kubzansky, L. D., Wright, R. J., Cohen, S., Weiss, S., Rosner, B., & Sparrow, D. (2002).
Breathing easy: A prospective study of optimism and pulmonary function in the
normative aging study. Annals of Behavioral Medicine, 24(4), 345-353.
Lerman, S. F., Rudich, Z., Brill, S., Shalev, H., & Shahar, G. (2015). Longitudinal associations
between depression, anxiety, pain, and pain-related disability in chronic pain patients.
Psychosomatic Medicine, 77(3), 333-341. doi:10.1097/PSY.0000000000000158.
Light, K. C., & Obrist, P. A. (1983). Task Difficulty, Heart Rate Reactivity, and Cardiovascular
Responses to an Appetitive Reaction Time Task. Psychophysiology, 20(3), 301-312.

OPTIMISM AND AUTONOMIC REACTIVITY 71
Lubin, B., Van Whitlock, R., Reddy, D., & Petren, S. (2001). A comparison of the short and long
forms of the Multiple Affect Adjective Check List—Revised (MAACL‐R). Journal of
Clinical Psychology, 57(3), 411-416.
Mahler, H. I. M., & Kulik, J. A. (2000). Optimism, pessimism and recovery from coronary
bypass surgery: prediction of affect, pain, and functional status. Psychology, Health, and
Medicine, 5(4), 347-358.
Marler, M. R., Jacob, R. G., Lehoszky, J. P., & Shapiro, A. P. (1988). The statistical analysis of
treatment effects in 24-hour ambulatory blood pressure recordings. Statistics in Medicine,
7, 697-716.
McEwen, B. S., & Stellar, E. (1993). Stress and the individual: Mechanisms leading to disease.
Archives of Internal Medicine, 153(18), 2093-2101.
doi:10.1001/archinte.1993.00410180039004.
Morrison, G. E., Simone, C. M., Ng, N. F., & Hardy, J. L. (2015). Reliability and validity of the
NeuroCognitive Performance Test, a web-based neuropsychological
assessment. Frontiers in Psychology, 6, 1652. http://doi.org/10.3389/fpsyg.2015.01652.
Nes, L. S., Segerstrom, S. C., & Sephton, S. E. (2005). Engagement and arousal: Optimism’s
effects during a brief stressor. Personality and Social Psychology Bulletin, 31(1), 111-
120.
Neumann, S. A., Waldstein, S. R., Sellers III, J. J., Thayer, J. F., & Sorkin, J. D. (2004). Hostility
and distraction have differential influences on cardiovascular recovery from anger recall
in women. Health Psychology, 23(6), 631-640.
Niskanen, J. P., Tarvainen, M. P., Ranta-Aho, P. O., & Karjalainen, P. A. (2004). Software for
advanced HRV analysis. Computer methods and programs in biomedicine, 76(1), 73-81.

OPTIMISM AND AUTONOMIC REACTIVITY 72
Noyes Jr, R., & Kathol, R. G. (1985). Depression and cancer. Psychiatric Developments, 4(2),
77-100.
Peterson, C., Seligman, M. E., & Vaillant, G. E. (1988). Pessimistic explanatory style is a risk
factor for physical illness: a thirty-five-year longitudinal study. Journal of Personality
and Social Psychology, 55(1), 23.
Puig‐Perez, S., Hackett, R. A., Salvador, A., & Steptoe, A. (2017). Optimism moderates
psychophysiological responses to stress in older people with type 2 diabetes.
Psychophysiology, 54(4), 536-543. doi:10.1111/psyp.12806
Puig-Perez, S., Villada, C., Pulopulos, M. M., Almela, M., Hidalgo, V., & Salvador, A. (2015).
Optimism and pessimism are related to different components of the stress response in
healthy older people. International Journal of Psychophysiology, 98(2), 213-221.
Räikkönen, K., Matthews, K. A., Flory, J. D., Owens, J. F., & Gump, B. B. (1999). Effects of
optimism, pessimism, and trait anxiety on ambulatory blood pressure and mood during
everyday life. Journal of Personality and Social Psychology, 76(1), 104.
Räikkönen, K., & Matthews, K. A. (2008). Do dispositional pessimism and optimism predict
ambulatory blood pressure during schooldays and nights in adolescents? Journal of
Personality, 76, 605–630.
Rasmussen, H. N., Scheier, M. F., & Greenhouse, J. B. (2009). Optimism and physical health: A
meta-analytic review. Annals of Behavioral Medicine, 37(3), 239-256.
Rauch, W. A., Schweizer, K., & Moosbrugger, H. (2007). Method effects due to social
desirability as a parsimonious explanation of the deviation from unidimensionality in
LOT-R scores. Personality and Individual Differences, 42(8), 1597-1607.
doi:10.1016/j.paid.2006.10.035
OPTIMISM AND AUTONOMIC REACTIVITY 73
Raven, J. (1998). Standard Progressive Matrices Sets A, B, C, D, & E. Bloomington, MN:
Pearson Inc.
Raven, J., Raven, J. C., & Court, J. H. (2004). Manual for Raven's Progressive Matrices and
Vocabulary Scales. San Antonio, TX: Harcourt Assessment.
Richman, L. S., Bennett, G. G., Pek, J., Siegler, I., & Williams, R. J. (2007). Discrimination,
dispositions, and cardiovascular responses to stress. Health Psychology, 26(6), 675-683.
doi:10.1037/0278-6133.26.6.675
Robinson-Whelen, S., Kim, C., MacCallum, R. C., & Kiecolt-Glaser, J. K. (1997).
Distinguishing optimism from pessimism in older adults: Is it more important to be
optimistic or not to be pessimistic? Journal of Personality and Social
Psychology, 73(6), 1345-1353. doi:10.1037/0022-3514.73.6.1345
Roest, A. M., Martens, E. J., Denollet, J., & de Jonge, P. (2010). Prognostic association of
anxiety post myocardial infarction with mortality and new cardiac events: A meta-
analysis. Psychosomatic Medicine, 72(6), 563-569.
Rozanski, A., Blumenthal, J. A., & Kaplan, J. (1999). Impact of psychological factors on the
pathogenesis of cardiovascular disease and implications for therapy. Circulation, 99(16),
2192-2217.
Salahuddin, M. M. (2010). Generational differences impact on leadership style and
organizational success. Journal of Diversity Management, 5(2), 1-6.
Scheier, M. F. & Carver, C. S. (1987). Dispositional optimism and physical well-being: the
influence of generalized outcome expectancies on health. Journal of Personality, 55(2),
169-210.

OPTIMISM AND AUTONOMIC REACTIVITY 74
Scheier, M. F., & Carver, C. S. (1992). Effects of optimism on psychological and physical well-
being: Theoretical overview and empirical update. Cognitive Therapy and Research,
16(2), 201-228. doi:10.1007/BF01173489
Scheier, M. F., Carver, C. S., & Bridges, M. W. (1994). Distinguishing optimism from
neuroticism (and trait anxiety, self-mastery, and self-esteem): A reevaluation of the Life
Orientation Test. Journal of Personality and Social Psychology, 67(6), 1063-1078.
doi:10.1037/0022-3514.67.6.1063
Scheier, M. F., Weintraub, J. K., & Carver, C. S. (1986). Coping with stress: divergent strategies
of optimists and pessimists. Journal of Personality and Social Psychology, 51(6), 1257-
1264. doi:10.1037/0022-3514.51.6.1257.
Segerstrom, S. C., Taylor, S. E., Kemeny, M. E., & Fahey, J. L. (1998). Optimism is associated
with mood, coping, and immune changes in response to stress. Journal of Personality and
Social Psychology, 74, 1646-1655.
Segerstrom, S. C. (2001). Optimism and attentional bias for negative and positive stimuli.
Personality and Social Psychology Bulletin, 27(10), 1334-1343.
Seligman, M. E., & Schulman, P. (1986). Explanatory style as a predictor of productivity and
quitting among life insurance sales agents. Journal of Personality and Social Psychology,
50(4), 832-838. doi:10.1037/0022-3514.50.4.832.
Shimbo, D., Chaplin, W., Kuruvilla, S., Wasson, L. T., Abraham, D., & Burg, M. M. (2009).
Hostility and platelet reactivity in individuals without a history of cardiovascular disease
events. Psychosomatic Medicine, 71(7), 741-747. doi:10.1097/PSY.0b013e3181ad18b6
OPTIMISM AND AUTONOMIC REACTIVITY 75
Smokowski, P. R., Evans, C. R., Cotter, K. L., & Guo, S. (2014). Ecological correlates of
depression and self-esteem in rural youth. Child Psychiatry & Human Development,
45(5), 500-518. doi:10.1007/s10578-013-0420-8
Solomon, S., Holmes, D. S., & McCaul, K. D. (1980). Behavioral control over aversive events:
Does control that requires effort reduce anxiety and physiological arousal? Journal of
Personality and Social Psychology, 39(4), 729-736. doi:10.1037/0022-3514.39.4.729
Soto, C. J., & John, O. P. (2016). The next Big Five Inventory (BFI-2): Developing and
assessing a hierarchical model with 15 facets to enhance bandwidth, fidelity, and
predictive power. Journal of Personality and Social Psychology, 113(1), 117-143.
doi:10.1037/pspp0000096
Spielberger, C. D., Gorsuch, R. L., Lushene, R., Vagg, P. R., & Jacobs, G. A. (1983). Manual for
the State-Trait Anxiety Inventory. Palo Alto, CA: Consulting Psychologists Press.
Steptoe, A., & Marmot, M. (2005). Impaired cardiovascular recovery following stress predicts 3-
year increases in blood pressure. Journal of Hypertension, 23(3), 529-536.
Strack, S., Carver, C. S., & Blaney, P. H. (1987). Predicting successful completion of an
aftercare program following treatment for alcoholism: The role of dispositional optimism.
Journal of Personality and Social Psychology, 53(3), 579-584. doi:10.1037/0022-
3514.53.3.579
Tay, L., Tan, K., Diener, E., & Gonzalez, E. (2013). Social relations, health behaviors, and
health outcomes: A survey and synthesis. Applied Psychology: Health and Well-being, 5(1),
28-78. doi:10.1111/aphw.12000

OPTIMISM AND AUTONOMIC REACTIVITY 76
Terrill, A. L., Ruiz, J. M., & Garofalo, J. P. (2010). Look on the bright side: Do the benefits of
optimism depend on the social nature of the stressor? Journal of Behavioral Medicine,
33(5), 399-414. doi: 10.1007/s10865-010-9268-6
Tindle, H. A., Chang, Y. F., Kuller, L. H., Manson, J. E., Robinson, J. G., Rosal, M. C., &
Matthews, K. A. (2009). Optimism, cynical hostility, and incident coronary heart disease
and mortality in the Women’s Health Initiative. Circulation, 120(8), 656-662.
Treiber, F. A., Kamarck, T., Schneiderman, N., Sheffield, D., Kapuku, G., & Taylor, T. (2003).
Cardiovascular reactivity and development of preclinical and clinical disease states.
Psychosomatic Medicine, 65(1), 46-62.
Tuomisto, M. T., Majahalme, S., Kahonen, M., Fredrikson, M., & Turjanmaa, V. (2005).
Psychological stress tasks in the prediction of blood pressure level and need for
antihypertensive medication: 9–12 years of follow-up. Health Psychology, 24(1), 77-87.
Uchino, B. N. (2006). Social support and health: a review of physiological processes potentially
underlying links to disease outcomes. Journal of Behavioral Medicine, 29(4), 377-387.
Waltman, M. A., Russell, D. C., Coyle, C. T., Enright, R. D., Holter, A. C., & Swoboda, C. M.
(2009). The effects of a forgiveness intervention on patients with coronary artery disease.
Psychology & Health, 24(1), 11-27. doi:10.1080/08870440801975127
Webb, J. R., Toussaint, L., Kalpakjian, C. Z., & Tate, D. G. (2010). Forgiveness and health-
related outcomes among people with spinal cord injury. Disability and Rehabilitation,
32(5), 360-366.
Wechsler, D. (2008). Wechsler Adult Intelligence Scale–Fourth Edition (WAIS–IV). San
Antonio, TX: NCS Pearson, 22, 498.

OPTIMISM AND AUTONOMIC REACTIVITY 77
Werenfels, P. D. (2006). Effects of optimism on goal-setting performance. Dissertation Abstracts
International, 66, 3988.
Whited, M. C., Wheat, A. L., & Larkin, K. T. (2010). The influence of forgiveness and apology
on cardiovascular reactivity and recovery in response to mental stress. Journal of
Behavioral Medicine, 33(4), 293-304. doi:10.1007/s10865-010-9259-7
Whooley, M. A., & Wong, J. M. (2013). Depression and cardiovascular disorders. Annual
Review of Clinical Psychology, 9, 327-354.
Williams, D. P., Feeling, N. R., Hill, L. K., Spangler, D. P., Koenig, J., & Thayer, J. F. (2017).
Resting heart rate variability, facets of rumination and trait anxiety: Implications for the
perseverative cognition hypothesis. Frontiers In Human Neuroscience,
doi:10.3389/fnhum.2017.00520
Williams, R. D., Riels, A. G., & Roper, K. A. (1990). Optimism and distractibility in
cardiovascular reactivity. The Psychological Record, 40(3), 451-457.
Wong, J. M., Sin, N. L., & Whooley, M. A. (2014). A comparison of Cook-Medley hostility
subscales and mortality in patients with coronary heart disease: Data from the Heart and
Soul Study. Psychosomatic Medicine, 76(4), 311-317.
doi:10.1097/PSY.0000000000000059
Zawadzki, M. J. (2015). Rumination is independently associated with poor psychological health:
Comparing emotion regulation strategies. Psychology & Health, 30(10), 1146-1163.
doi:10.1080/08870446.2015.1026904
Zivin, K., Yosef, M., Miller, E. M., Valenstein, M., Duffy, S., Kales, H. C., Vijan, S., & Kim, H.
M. (2015). Associations between depression and all-cause and cause-specific risk of

OPTIMISM AND AUTONOMIC REACTIVITY 78
death: A retrospective cohort study in the Veterans Health Administration. Journal of
Psychosomatic Research, 78(4), 324-331. doi:10.1016/j.jpsychores.2015.01.014
Zullig, K. J., & Hendryx, M. (2011). Health-related quality of life among central Appalachian
residents in mountaintop mining counties. American Journal Of Public Health, 101(5),
848-853. doi:10.2105/AJPH.2010.300073

OPTIMISM AND AUTONOMIC REACTIVITY 79
Table 1. Demographics
Optimist (n = 74)
Pessimist (n = 78)
Mean(SD) Count(%) Mean(SD) Count(%)
Women 64(85%) 66(84.6%)
Men 10(15%) 12(15.4%)
Age 19.4 (1.5) 19.2(1.5)
Race
White 61(82.4%) 63(80.8%)
Black 5(6.8%) 3(3.8%)
Asian 3(4.1%) 5(6.4%)
Native American 1(1.4%) 0
Mixed 2(2.8%) 5(6.4%
Other 1(1.4%) 0
Undisclosed 1(2.8%) 2(2.6%)
LOT-R total 25.0(2.3)a 13.3(2.6)a
Perceived SES 6.0(1.5)a 5.5(1.7)a
BMI 25.6 (5.6) 25.3(4.8)
Resting SBP (mm
Hg) 111.7(11.6) 111.3(9.8)
Resting DBP (mm
Hg) 65.4(8.6) 65.5(9.1)
Resting MAP (mm
Hg) 80.8(8.2) 80.7(7.6)
Resting HR 78.0(11.0) 77.0(10.6)
Resting SDNN 67.0(27.3) 64.2(28.8)
Trait Anxiety 36.1(8.8)a 53.5(7.5)a
Neuroticism 30.8(9.1)a 43.5(7.6)a
Agreeableness 48.6(6.7)a 42.4(7.8)a
Open Mindedness 46.3(7.7)a 42.1(7.2)a
Conscientiousness 46.4(9.0)a 40.7(8.6)a
Extraversion 42.9(8.9)a 34.7(8.8)a
Note: a indicates a significant difference between optimists and pessimists.
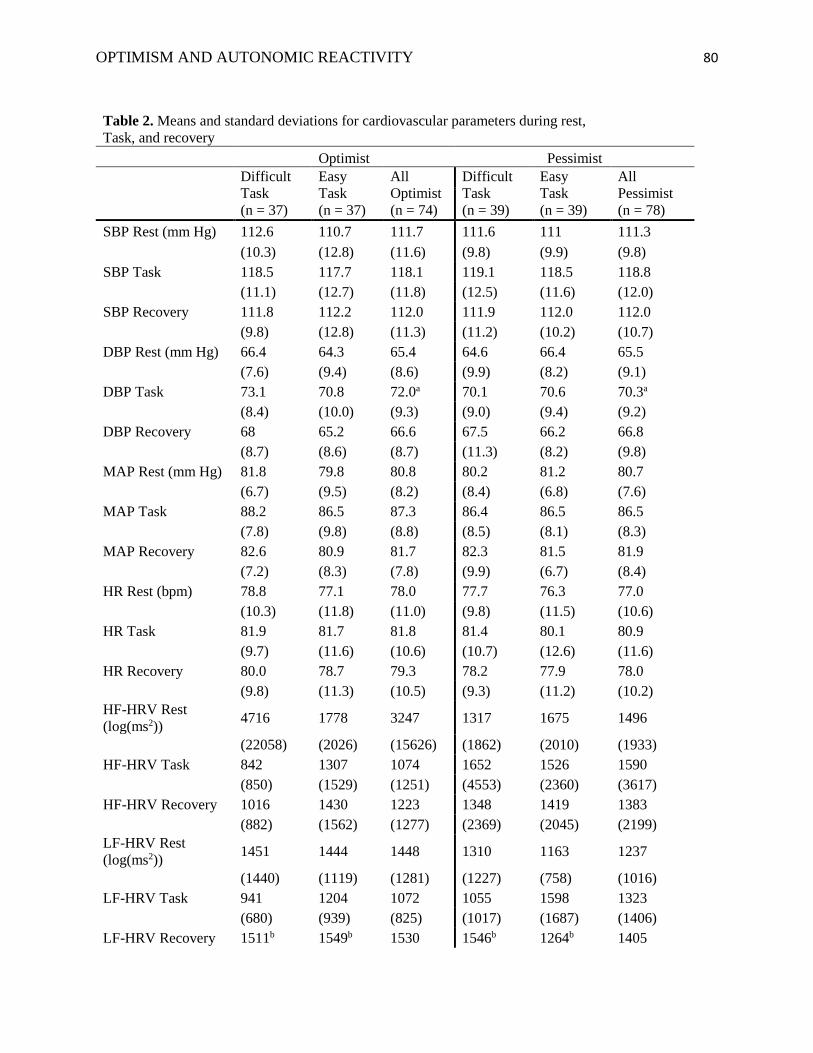
OPTIMISM AND AUTONOMIC REACTIVITY 80
Table 2. Means and standard deviations for cardiovascular parameters during rest,
Task, and recovery
Optimist Pessimist
Difficult
Task
(n = 37)
Easy
Task
(n = 37)
All
Optimist
(n = 74)
Difficult
Task
(n = 39)
Easy
Task
(n = 39)
All
Pessimist
(n = 78)
SBP Rest (mm Hg) 112.6 110.7 111.7 111.6 111 111.3
(10.3) (12.8) (11.6) (9.8) (9.9) (9.8)
SBP Task 118.5 117.7 118.1 119.1 118.5 118.8
(11.1) (12.7) (11.8) (12.5) (11.6) (12.0)
SBP Recovery 111.8 112.2 112.0 111.9 112.0 112.0
(9.8) (12.8) (11.3) (11.2) (10.2) (10.7)
DBP Rest (mm Hg) 66.4 64.3 65.4 64.6 66.4 65.5
(7.6) (9.4) (8.6) (9.9) (8.2) (9.1)
DBP Task 73.1 70.8 72.0a 70.1 70.6 70.3a
(8.4) (10.0) (9.3) (9.0) (9.4) (9.2)
DBP Recovery 68 65.2 66.6 67.5 66.2 66.8
(8.7) (8.6) (8.7) (11.3) (8.2) (9.8)
MAP Rest (mm Hg) 81.8 79.8 80.8 80.2 81.2 80.7
(6.7) (9.5) (8.2) (8.4) (6.8) (7.6)
MAP Task 88.2 86.5 87.3 86.4 86.5 86.5
(7.8) (9.8) (8.8) (8.5) (8.1) (8.3)
MAP Recovery 82.6 80.9 81.7 82.3 81.5 81.9
(7.2) (8.3) (7.8) (9.9) (6.7) (8.4)
HR Rest (bpm) 78.8 77.1 78.0 77.7 76.3 77.0
(10.3) (11.8) (11.0) (9.8) (11.5) (10.6)
HR Task 81.9 81.7 81.8 81.4 80.1 80.9
(9.7) (11.6) (10.6) (10.7) (12.6) (11.6)
HR Recovery 80.0 78.7 79.3 78.2 77.9 78.0
(9.8) (11.3) (10.5) (9.3) (11.2) (10.2)
HF-HRV Rest
(log(ms2)) 4716 1778 3247 1317 1675 1496
(22058) (2026) (15626) (1862) (2010) (1933)
HF-HRV Task 842 1307 1074 1652 1526 1590
(850) (1529) (1251) (4553) (2360) (3617)
HF-HRV Recovery 1016 1430 1223 1348 1419 1383
(882) (1562) (1277) (2369) (2045) (2199)
LF-HRV Rest
(log(ms2)) 1451 1444 1448 1310 1163 1237
(1440) (1119) (1281) (1227) (758) (1016)
LF-HRV Task 941 1204 1072 1055 1598 1323
(680) (939) (825) (1017) (1687) (1406)
LF-HRV Recovery 1511b 1549b 1530 1546b 1264b 1405

OPTIMISM AND AUTONOMIC REACTIVITY 81
(1053) (1401) (1231) (1588) (868) (1279)
SDNN Rest (ms) 64.1 69.9 67.0 64.5 63.9 64.2
(24.9) (29.5) (27.0) (32.3) (25.2) (28.8)
SDNN Task 60.0 64.3 62 54.7 71.4 62.9
(21.5) (24.0) (22.8) (26.6) (49.5) (40.2)
SDNN Recovery 64.9b 69.7b 67.3 64.6b 63.6b 64.1
(23.1) (26.2) (24.7) (30.9) (23.5) (27.3)
Note: a indicates a significant difference between optimists and pessimists at the p < .05 level; b indicates
a significant difference between difficult and easy tasks at the p < .05 level; Systolic Blood Pressure
(SBP), Diastolic Blood Pressure (DBP), Mean Arterial Pressure (MAP), Heart Rate (HR), High-
Frequency Heart Rate Variability (HF-HRV), Low Frequency Heart Rate Variability (LF-HRV),
Standard Deviation of N-N Intervals (SDNN)

OPTIMISM AND AUTONOMIC REACTIVITY 82
Table 3. Means and standard errors for responses to the post-experimental
questionnaire
Optimist (n = 74) Pessimist (n = 78)
Difficult task
(n = 37)
Easy task
(n = 37)
Difficult task
(n = 39)
Easy task
(n = 39)
How stressful
was the task? 3.3(.15) 2.4(.13) 3.6(.15) 2.3(.12)
How difficult
were the
problems on this
task?
4.2(.14) 2.6(.15) 4.5(.09) 2.5(.13)
How much effort
did you put into
completing the
problems?
4.2(.10) 3.4(.15) 4.2(.10) 3.6(.15)
How well do you
think you
performed on the
task?
1.6(.14) 3.9(.12) 1.4(.09 3.6(.14)
How persistent
were you in
completing the
task?
3.8(.16) 4.4(.10) 3.3(.19) 4.1(.11)
How upset are
you by your
performance on
the task?
2.5(.19) 1.7(.14) 2.9(.18) 1.8(.16)

OPTIMISM AND AUTONOMIC REACTIVITY 83
Figure 1: SBP of optimist easy (OE), optimist difficult (OD), pessimist easy (PE), and pessimist
difficult (PD) during rest, task period, and recovery.
110
112
114
116
118
120
122
124
126
rest 10 rest 12 rest 14 task 1 task 3 task 5 rec 1 rec 3 rec 5
mm
Hg
OE OD PE PD

OPTIMISM AND AUTONOMIC REACTIVITY 84
Figure 2: DBP of optimist easy (OE), optimist difficult (OD), pessimist easy (PE), and pessimist
difficult (PD) during rest, task period, and recovery.
62
64
66
68
70
72
74
76
rest 10 rest 12 rest 14 task 1 task 3 task 5 rec 1 rec 3 rec 5
mm
Hg
OE OD PE PD

OPTIMISM AND AUTONOMIC REACTIVITY 85
Figure 3: MAP of optimist easy (OE), optimist difficult (OD), pessimist easy (PE), and pessimist
difficult (PD) during rest, task period, and recovery.
78
80
82
84
86
88
90
92
94
rest 10 rest 12 rest 14 task 1 task 3 task 5 rec 1 rec 3 rec 5
mm
Hg
OE OD PE PD

OPTIMISM AND AUTONOMIC REACTIVITY 86
Figure 4: HR of optimist easy (OE), optimist difficult (OD), pessimist easy (PE), and pessimist
difficult (PD) during rest, task period, and recovery.
74
76
78
80
82
84
86
88
rest 10 rest 12 rest 14 task 1 task 3 task 5 rec 1 rec 3 rec 5
BP
M
OE OD PE PD
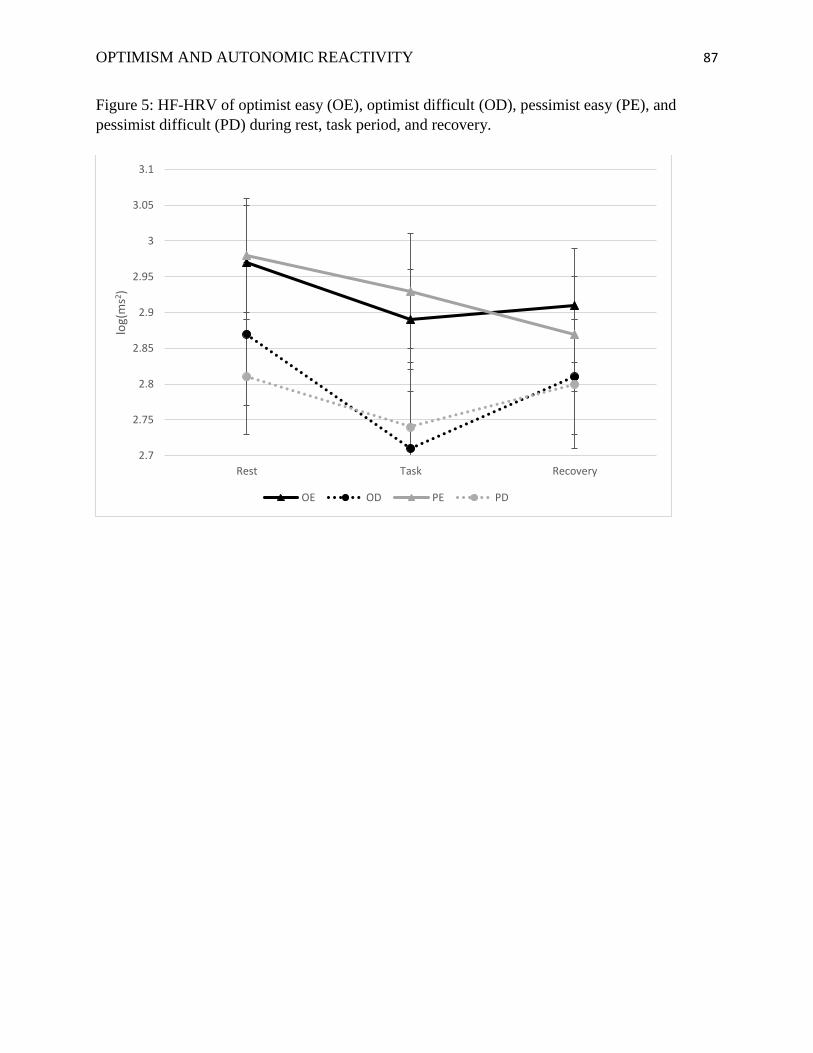
OPTIMISM AND AUTONOMIC REACTIVITY 87
Figure 5: HF-HRV of optimist easy (OE), optimist difficult (OD), pessimist easy (PE), and
pessimist difficult (PD) during rest, task period, and recovery.
2.7
2.75
2.8
2.85
2.9
2.95
3
3.05
3.1
Rest Task Recovery
log(
ms2
)
OE OD PE PD
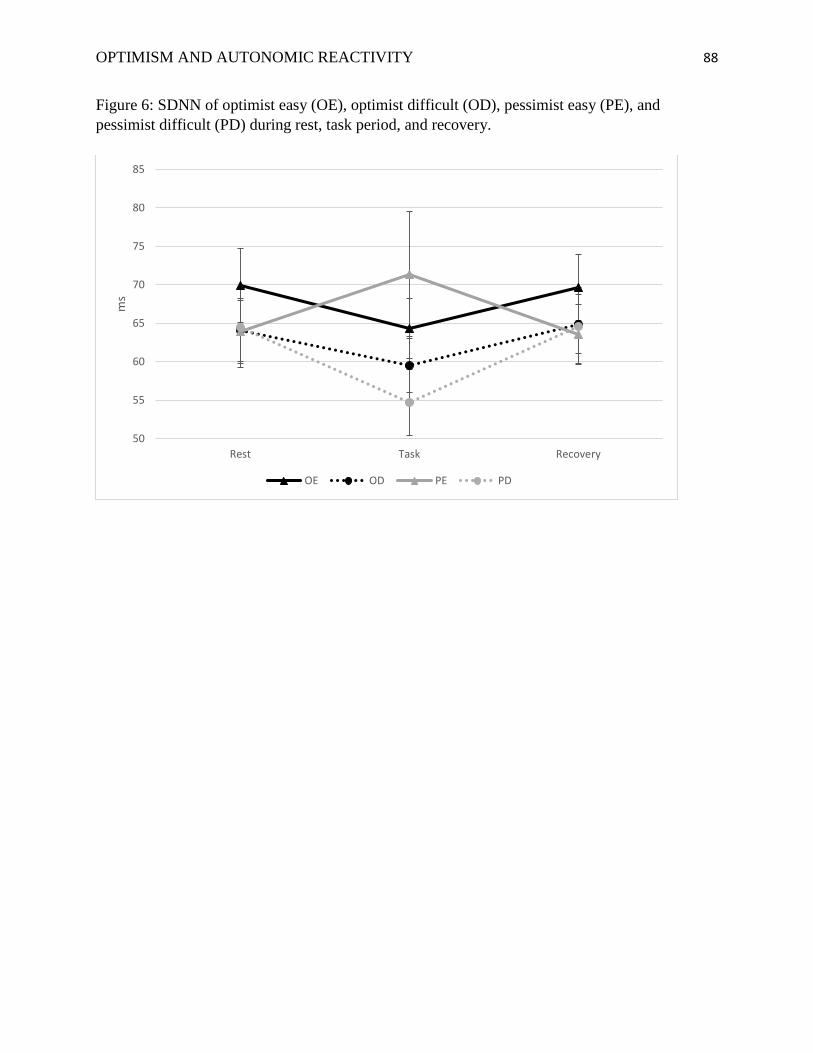
OPTIMISM AND AUTONOMIC REACTIVITY 88
Figure 6: SDNN of optimist easy (OE), optimist difficult (OD), pessimist easy (PE), and
pessimist difficult (PD) during rest, task period, and recovery.
50
55
60
65
70
75
80
85
Rest Task Recovery
ms
OE OD PE PD

OPTIMISM AND AUTONOMIC REACTIVITY 89
Figure 7: LF-HRV of optimist easy (OE), optimist difficult (OD), pessimist easy (PE), and
pessimist difficult (PD) during rest, task period, and recovery.
2.8
2.85
2.9
2.95
3
3.05
3.1
3.15
3.2
Rest Task Recovery
log(
ms2
)
OE OD PE PD

OPTIMISM AND AUTONOMIC REACTIVITY 90
Appendix A
Attachments
1. Demographics Questionnaire
2. Self-Efficacy Questionnaire
3. Post-task Questionnaire

OPTIMISM AND AUTONOMIC REACTIVITY 91
Demographics Questionnaire
Participant #:_______________________ Date:________________________
Height(in.):_________ Weight(lbs):_________
Please provide your email address so that we can contact you for part 2 of the
study:________________________
Your Information:
Your age _____
Your sex
○ Male
○ Female
Are you Hispanic, Latino, or of Spanish origin?
o No, not of Hispanic, Latino, or Spanish origin
o Yes, Mexican, Mexican Am., Chicano
o Yes, Puerto Rican
o Yes, Cuban
o Yes, another Hispanic, Latino, or Spanish origin (please indicate) ____________
Your race- check all that apply
○ White
○ Black, African Am., or Negro
○ American Indian or Alaska Native
○ Asian Indian
○ Chinese
○ Filipino

OPTIMISM AND AUTONOMIC REACTIVITY 92
o Japanese
o Korean
o Vietnamese
o Native Hawaiian
o Guamanian or Chamorro
o Samoan
o Other Pacific Islander (please indicate)______________
o Other Asian (please indicate) _______________
o Other race (please indicate) _______________
Indicate the highest level of education you have completed:
○ High school
○ 1 year college
○ 2 years college
○ 3 years college
○ 4 or more years college
Please describe any cardiovascular related illness that you may have, including high blood
pressure
Please list any other medical or psychiatric problems that you have:
Please list any major surgeries and medical, or psychiatric illnesses you have had in the past.
Females: Are you currently pregnant?
○ Yes
○ No
Females: Are you currently on birth control (contraceptives).

OPTIMISM AND AUTONOMIC REACTIVITY 93
○ Yes
○ No
What type of birth control are you taking? ________________________
Please list any drugs (legal or otherwise) that you are currently taking including; birth control
(contraceptives), heart medications, cold or allergy medications, over the counter medications,
asthma medications, Beta-Blockers (i.e. Inderal, Tenormin), psychoactive drugs (i.e. Adderall,
Xanax, Haldol, Lithium, Prozac), or diet pills.
Do you currently smoke cigarettes (within the last month)?
○ Yes
○ No
Do you currently use smokeless tobacco (within the past month)?
○ Yes
○ No
How often do you drink alcohol?
○ never
○ infrequently (a few drinks per year)
○ occasionally (1-2 drinks per month)
○ weekly (1-3 drinks per week)
○ weekly (3-6 drinks per week)
○ daily (7-14 drinks per week)
○ daily (more than 14 drinks per week)

OPTIMISM AND AUTONOMIC REACTIVITY 94
How many cups of caffeinated coffee, tea, or soda do you have per day?
○ none
○ 1-2 cups per day
○ 3-4 cups per day
○ 5-6 cups per day
○ 7-8 cups per day
○ greater than eight cups per day
How many times per week do you engage in aerobic physical activity?
○ never
○ 1-2 times
○ 3-6 times
○ 7 or more times
For how long do you typically exercise on each occasion?
○ 5-10 minutes
○ 10-15 minutes
○ 15-30 minutes
○ 30-60 minutes
○ more than 60 minutes
Family Information:
Imagine a ladder that represents where people stand in the United States.
At the top of the ladder are the people who are the best off – those who have the most money,
the most education, and the most respected jobs. At the bottom are the people who are the worst
off – who have the least money, least education, and the least respected jobs or no job. The

OPTIMISM AND AUTONOMIC REACTIVITY 95
higher up you are on this ladder, the closer you are to the people at the very top; the lower you
are, the closer you are to the people at the very bottom.
On which rung of the ladder (1 being the lowest rung and 10 being the highest rung)
would you place your family?
1……….2……….3……….4……….5……….6……….7……….8……….9……….10
Is your father currently living?
○ yes
○ no
Approximately how old is your father? _________
Did/does your father have high blood pressure (hypertension)?
○ yes
○ no
How certain are you that he did, or did not, have high blood pressure (hypertension)?
○ Absolutely (100%) certain
○ Almost (75%) certain
○ Not sure at all (25%)
○ No information by which to judge (0%)
Did/does your father have any heart problems such as angina (chest pains), a heart attack, or
coronary heart disease?
○ yes
○ no
If yes, please specify if you are able: ______________________________________________.

OPTIMISM AND AUTONOMIC REACTIVITY 96
How certain are you that he did, or did not, have a heart problem as indicated above?
○ Absolutely (100%) certain
○ Almost (75%) certain
○ Not sure at all (25%)
○ No information by which to judge (0%)
Is your mother currently living?
○ yes
○ no
Approximately how old is your mother? _________
Did/does your mother have high blood pressure (hypertension)?
○ yes
○ no
How certain are you that she did, or did not, have high blood pressure (hypertension)?
○ Absolutely (100%) certain
○ Almost (75%) certain
○ Not sure at all (25%)
○ No information by which to judge (0%)
Did/does your mother have any heart problems such as angina (chest pains), a heart attack, or
coronary heart disease?
○ yes

OPTIMISM AND AUTONOMIC REACTIVITY 97
○ no
If yes, please specify if you are able: ______________________________________________.
How certain are you that she did, or did not, have a heart problem as indicated above?
○ Absolutely (100%) certain
○ Almost (75%) certain
○ Not sure at all (25%)
○ No information by which to judge (0%)
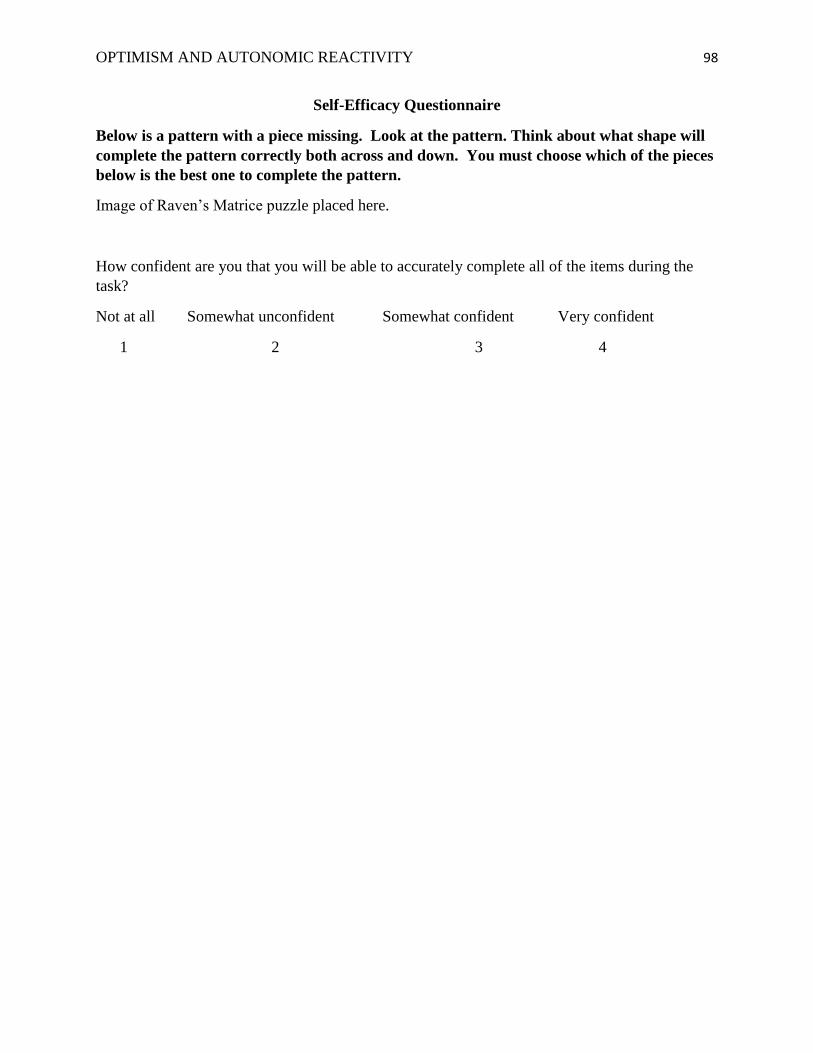
OPTIMISM AND AUTONOMIC REACTIVITY 98
Self-Efficacy Questionnaire
Below is a pattern with a piece missing. Look at the pattern. Think about what shape will
complete the pattern correctly both across and down. You must choose which of the pieces
below is the best one to complete the pattern.
Image of Raven’s Matrice puzzle placed here.
How confident are you that you will be able to accurately complete all of the items during the
task?
Not at all Somewhat unconfident Somewhat confident Very confident
1 2 3 4

OPTIMISM AND AUTONOMIC REACTIVITY 99
Post Task Questionnaire
Instructions:
Please select the response below each question that best represents your answer to
the question.
1. How stressful was the task?
Not at all Minimally stressful Neutral Fairly stressful Extremely stressful
2. How difficult were the problems on this task?
Not at all Minimally difficult Neutral Fairly difficult Extremely difficult
3. How much effort did you put into completing the problems?
None Minimal effort Neutral Fair amount of effort A lot of effort
4. How well do you think you performed on the task?
Extremely poorly Somewhat poorly Unsure Somewhat well Extremely well
5. How persistent were you in completing the task?
Not at all Minimally persistent Neutral Fairly persistent Very persistent
6. How upset are you by your performance on the task?
Not at all Somewhat upset Neutral Fairly upset Extremely upset

OPTIMISM AND AUTONOMIC REACTIVITY 100
Appendix B: Statistical Tables
Rest Period - Repeated Measures ANOVAs across Minute (Min 1, 3, and 5)
1. SBP
Tests of Within-Subjects Effects
Measure: rest
Source
Type III Sum
of Squares df Mean Square F Sig.
Partial Eta
Squared
SBPrest Sphericity Assumed 65.837 2 32.918 1.922 .148 .013
Greenhouse-Geisser 65.837 1.945 33.855 1.922 .149 .013
Huynh-Feldt 65.837 1.970 33.425 1.922 .149 .013
Lower-bound 65.837 1.000 65.837 1.922 .168 .013
Error(SBPrest) Sphericity Assumed 5171.997 302 17.126
Greenhouse-Geisser 5171.997 293.644 17.613
Huynh-Feldt 5171.997 297.419 17.390
Lower-bound 5171.997 151.000 34.252
2. DBP
Tests of Within-Subjects Effects
Measure: rest
Source
Type III Sum
of Squares df Mean Square F Sig.
Partial Eta
Squared
DBP Sphericity Assumed 43.543 2 21.771 .835 .435 .006
Greenhouse-Geisser 43.543 1.991 21.871 .835 .434 .006
Huynh-Feldt 43.543 2.000 21.771 .835 .435 .006
Lower-bound 43.543 1.000 43.543 .835 .362 .006
Error(DBP) Sphericity Assumed 7873.291 302 26.070
Greenhouse-Geisser 7873.291 300.619 26.190
Huynh-Feldt 7873.291 302.000 26.070
Lower-bound 7873.291 151.000 52.141

OPTIMISM AND AUTONOMIC REACTIVITY 101
3. MAP
Tests of Within-Subjects Effects
Measure: rest
Source
Type III Sum
of Squares df Mean Square F Sig.
Partial Eta
Squared
MAP Sphericity Assumed 8.678 2 4.339 .315 .730 .002
Greenhouse-Geisser 8.678 1.993 4.354 .315 .729 .002
Huynh-Feldt 8.678 2.000 4.339 .315 .730 .002
Lower-bound 8.678 1.000 8.678 .315 .576 .002
Error(MAP) Sphericity Assumed 4163.156 302 13.785
Greenhouse-Geisser 4163.156 300.922 13.835
Huynh-Feldt 4163.156 302.000 13.785
Lower-bound 4163.156 151.000 27.571
4. HR
Tests of Within-Subjects Effects
Measure: rest
Source
Type III Sum
of Squares df Mean Square F Sig.
Partial Eta
Squared
HR Sphericity Assumed 79.701 2 39.850 6.080 .003 .039
Greenhouse-Geisser 79.701 1.987 40.114 6.080 .003 .039
Huynh-Feldt 79.701 2.000 39.850 6.080 .003 .039
Lower-bound 79.701 1.000 79.701 6.080 .015 .039
Error(HR) Sphericity Assumed 1953.273 298 6.555
Greenhouse-Geisser 1953.273 296.043 6.598
Huynh-Feldt 1953.273 298.000 6.555
Lower-bound 1953.273 149.000 13.109

OPTIMISM AND AUTONOMIC REACTIVITY 102
5.
Pairwise Comparisons
Measure: rest
(I) HR (J) HR
Mean Difference
(I-J) Std. Error Sig.b
95% Confidence Interval for
Differenceb
Lower Bound Upper Bound
1 2 -.676 .307 .088 -1.420 .068
3 -1.012* .291 .002 -1.717 -.307
2 1 .676 .307 .088 -.068 1.420
3 -.336 .288 .736 -1.033 .361
3 1 1.012* .291 .002 .307 1.717
2 .336 .288 .736 -.361 1.033
6.
Estimates
Measure: rest
HR Mean Std. Error
95% Confidence Interval
Lower Bound Upper Bound
1 76.053 .870 74.334 77.771
2 76.729 .879 74.992 78.466
3 77.065 .896 75.295 78.835

OPTIMISM AND AUTONOMIC REACTIVITY 103
Task Period Reactivity - Group (Easy, Difficult) X Period (Rest, Task) ANOVAs
7. SBP
Tests of Within-Subjects Effects
Measure: SBP
Source
Type III Sum
of Squares df Mean Square F Sig.
Partial Eta
Squared
Period Sphericity Assumed 3690.244 1 3690.244 149.180 .000 .499
Greenhouse-Geisser 3690.244 1.000 3690.244 149.180 .000 .499
Huynh-Feldt 3690.244 1.000 3690.244 149.180 .000 .499
Lower-bound 3690.244 1.000 3690.244 149.180 .000 .499
Period * Task
Difficulty
Sphericity Assumed 5.665 1 5.665 .229 .633 .002
Greenhouse-Geisser 5.665 1.000 5.665 .229 .633 .002
Huynh-Feldt 5.665 1.000 5.665 .229 .633 .002
Lower-bound 5.665 1.000 5.665 .229 .633 .002
Error(time) Sphericity Assumed 3710.522 150 24.737
Greenhouse-Geisser 3710.522 150.000 24.737
Huynh-Feldt 3710.522 150.000 24.737
Lower-bound 3710.522 150.000 24.737
8.
Estimates
Measure: SBP
time Mean Std. Error
95% Confidence Interval
Lower Bound Upper Bound
1 111.468 .867 109.756 113.181
2 118.436 .966 116.528 120.345

OPTIMISM AND AUTONOMIC REACTIVITY 104
9. DBP
Tests of Within-Subjects Effects
Measure: DBP
Source
Type III Sum
of Squares df
Mean
Square F Sig.
Partial Eta
Squared
period Sphericity Assumed 2479.320 1 2479.320 132.092 .000 .468
Greenhouse-
Geisser
2479.320 1.000 2479.320 132.092 .000 .468
Huynh-Feldt 2479.320 1.000 2479.320 132.092 .000 .468
Lower-bound 2479.320 1.000 2479.320 132.092 .000 .468
period *
TASK_difficult_easy
Sphericity Assumed 10.132 1 10.132 .540 .464 .004
Greenhouse-
Geisser
10.132 1.000 10.132 .540 .464 .004
Huynh-Feldt 10.132 1.000 10.132 .540 .464 .004
Lower-bound 10.132 1.000 10.132 .540 .464 .004
Error(time) Sphericity Assumed 2815.450 150 18.770
Greenhouse-
Geisser
2815.450 150.000 18.770
Huynh-Feldt 2815.450 150.000 18.770
Lower-bound 2815.450 150.000 18.770
10.
Estimates
Measure: DBP
time Mean Std. Error
95% Confidence Interval
Lower Bound Upper Bound
1 65.411 .716 63.997 66.825
2 71.123 .749 69.644 72.602

OPTIMISM AND AUTONOMIC REACTIVITY 105
11. MAP
Tests of Within-Subjects Effects
Measure: MAP
Source
Type III Sum
of Squares df
Mean
Square F Sig.
Partial Eta
Squared
period Sphericity
Assumed
2856.294 1 2856.294 203.019 .000 .575
Greenhouse-
Geisser
2856.294 1.000 2856.294 203.019 .000 .575
Huynh-Feldt 2856.294 1.000 2856.294 203.019 .000 .575
Lower-bound 2856.294 1.000 2856.294 203.019 .000 .575
period *
TASK_difficult_easy
Sphericity
Assumed
1.765 1 1.765 .125 .724 .001
Greenhouse-
Geisser
1.765 1.000 1.765 .125 .724 .001
Huynh-Feldt 1.765 1.000 1.765 .125 .724 .001
Lower-bound 1.765 1.000 1.765 .125 .724 .001
Error(time) Sphericity
Assumed
2110.365 150 14.069
Greenhouse-
Geisser
2110.365 150.000 14.069
Huynh-Feldt 2110.365 150.000 14.069
Lower-bound 2110.365 150.000 14.069
12.
Estimates
Measure: MAP
Time Mean Std. Error
95% Confidence Interval
Lower Bound Upper Bound
1 80.764 .641 79.497 82.030
2 86.894 .693 85.525 88.263

OPTIMISM AND AUTONOMIC REACTIVITY 106
13. HR
Tests of Within-Subjects Effects
Measure: HR
Source
Type III Sum
of Squares df
Mean
Square F Sig.
Partial Eta
Squared
Period Sphericity
Assumed
1117.173 1 1117.173 57.068 .000 .280
Greenhouse-
Geisser
1117.173 1.000 1117.173 57.068 .000 .280
Huynh-Feldt 1117.173 1.000 1117.173 57.068 .000 .280
Lower-bound 1117.173 1.000 1117.173 57.068 .000 .280
period *
TASK_difficult_easy
Sphericity
Assumed
14.631 1 14.631 .747 .389 .005
Greenhouse-
Geisser
14.631 1.000 14.631 .747 .389 .005
Huynh-Feldt 14.631 1.000 14.631 .747 .389 .005
Lower-bound 14.631 1.000 14.631 .747 .389 .005
Error(time) Sphericity
Assumed
2877.717 147 19.576
Greenhouse-
Geisser
2877.717 147.000 19.576
Huynh-Feldt 2877.717 147.000 19.576
Lower-bound 2877.717 147.000 19.576
14.
Estimates
Measure: HR
Time Mean Std. Error
95% Confidence Interval
Lower Bound Upper Bound
1 77.428 .886 75.676 79.180
2 81.301 .912 79.499 83.102

OPTIMISM AND AUTONOMIC REACTIVITY 107
15. SDNN
Tests of Within-Subjects Effects
Measure: SDNN
Source
Type III Sum
of Squares df Mean Square F Sig.
Partial Eta
Squared
period Sphericity Assumed 766.708 1 766.708 2.457 .119 .016
Greenhouse-Geisser 766.708 1.000 766.708 2.457 .119 .016
Huynh-Feldt 766.708 1.000 766.708 2.457 .119 .016
Lower-bound 766.708 1.000 766.708 2.457 .119 .016
period *
TASK_difficult_easy
Sphericity Assumed 1188.716 1 1188.716 3.810 .053 .025
Greenhouse-Geisser 1188.716 1.000 1188.716 3.810 .053 .025
Huynh-Feldt 1188.716 1.000 1188.716 3.810 .053 .025
Lower-bound 1188.716 1.000 1188.716 3.810 .053 .025
Error(time) Sphericity Assumed 45867.503 147 312.024
Greenhouse-Geisser 45867.503 147.000 312.024
Huynh-Feldt 45867.503 147.000 312.024
Lower-bound 45867.503 147.000 312.024
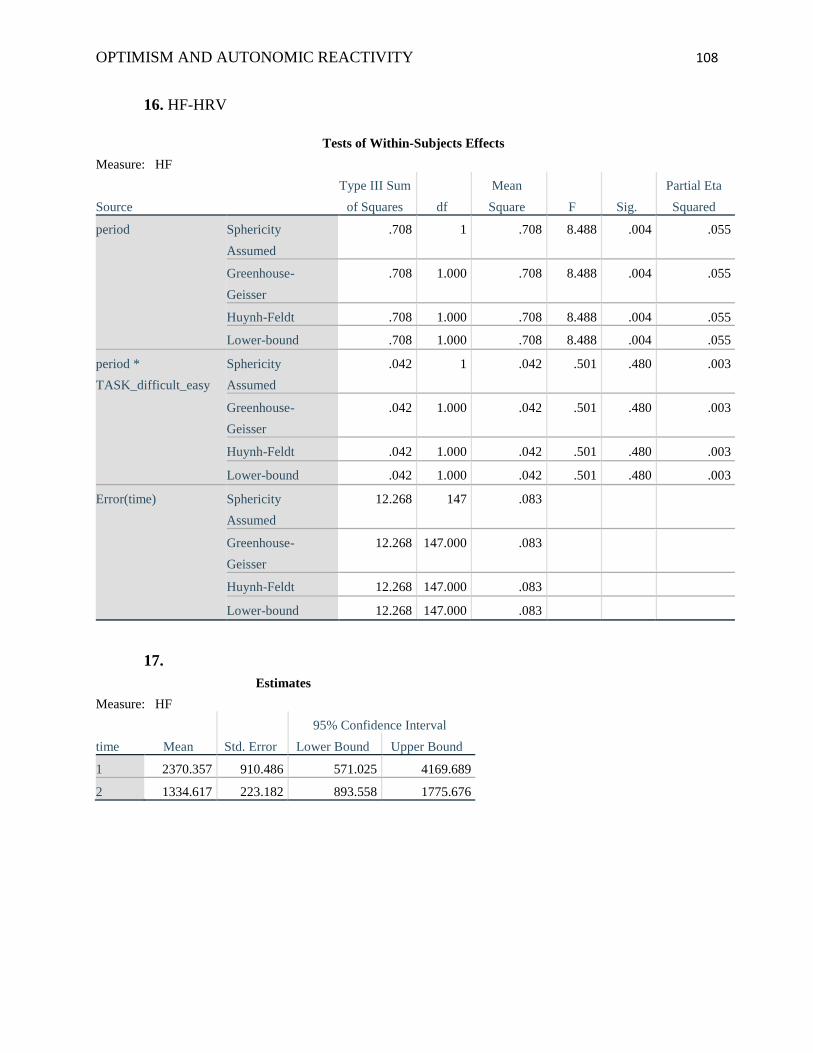
OPTIMISM AND AUTONOMIC REACTIVITY 108
16. HF-HRV
Tests of Within-Subjects Effects
Measure: HF
Source
Type III Sum
of Squares df
Mean
Square F Sig.
Partial Eta
Squared
period Sphericity
Assumed
.708 1 .708 8.488 .004 .055
Greenhouse-
Geisser
.708 1.000 .708 8.488 .004 .055
Huynh-Feldt .708 1.000 .708 8.488 .004 .055
Lower-bound .708 1.000 .708 8.488 .004 .055
period *
TASK_difficult_easy
Sphericity
Assumed
.042 1 .042 .501 .480 .003
Greenhouse-
Geisser
.042 1.000 .042 .501 .480 .003
Huynh-Feldt .042 1.000 .042 .501 .480 .003
Lower-bound .042 1.000 .042 .501 .480 .003
Error(time) Sphericity
Assumed
12.268 147 .083
Greenhouse-
Geisser
12.268 147.000 .083
Huynh-Feldt 12.268 147.000 .083
Lower-bound 12.268 147.000 .083
17.
Estimates
Measure: HF
time Mean Std. Error
95% Confidence Interval
Lower Bound Upper Bound
1 2370.357 910.486 571.025 4169.689
2 1334.617 223.182 893.558 1775.676

OPTIMISM AND AUTONOMIC REACTIVITY 109
18. LF-HRV
Tests of Within-Subjects Effects
Measure: LF
Source
Type III Sum
of Squares df Mean Square F Sig.
Partial Eta
Squared
period Sphericity Assumed .221 1 .221 4.989 .027 .033
Greenhouse-Geisser .221 1.000 .221 4.989 .027 .033
Huynh-Feldt .221 1.000 .221 4.989 .027 .033
Lower-bound .221 1.000 .221 4.989 .027 .033
period *
TASK_difficult_easy
Sphericity Assumed .228 1 .228 5.158 .025 .034
Greenhouse-Geisser .228 1.000 .228 5.158 .025 .034
Huynh-Feldt .228 1.000 .228 5.158 .025 .034
Lower-bound .228 1.000 .228 5.158 .025 .034
Error(time) Sphericity Assumed 6.498 147 .044
Greenhouse-Geisser 6.498 147.000 .044
Huynh-Feldt 6.498 147.000 .044
Lower-bound 6.498 147.000 .044
19.
4. TASK_difficult_easy * time
Measure: LF
TASK_difficult_easy time Mean Std. Error
95% Confidence Interval
Lower Bound Upper Bound
1.00 1 1379.787 134.187 1114.602 1644.971
2 998.693 132.049 737.733 1259.654
2.00 1 1303.108 135.090 1036.138 1570.078
2 1401.122 132.939 1138.404 1663.839

OPTIMISM AND AUTONOMIC REACTIVITY 110
Group X Period Mixed factors ANOVAs for task period
20. SBP
Tests of Within-Subjects Effects
Measure: task
Source
Type III Sum
of Squares df Mean Square F Sig.
Partial Eta
Squared
SBP Sphericity Assumed 1924.041 2 962.020 41.848 .000 .218
Greenhouse-Geisser 1924.041 1.939 992.209 41.848 .000 .218
Huynh-Feldt 1924.041 1.977 973.099 41.848 .000 .218
Lower-bound 1924.041 1.000 1924.041 41.848 .000 .218
SBP *
TASK_difficult_easy
Sphericity Assumed 54.378 2 27.189 1.183 .308 .008
Greenhouse-Geisser 54.378 1.939 28.042 1.183 .307 .008
Huynh-Feldt 54.378 1.977 27.502 1.183 .308 .008
Lower-bound 54.378 1.000 54.378 1.183 .279 .008
Error(SBP) Sphericity Assumed 6896.581 300 22.989
Greenhouse-Geisser 6896.581 290.872 23.710
Huynh-Feldt 6896.581 296.585 23.253
Lower-bound 6896.581 150.000 45.977
21.
Pairwise Comparisons
Measure: task
(I) SBP (J) SBP
Mean Difference
(I-J) Std. Error Sig.b
95% Confidence Interval for
Differenceb
Lower Bound Upper Bound
1 2 2.171* .556 .000 .825 3.517
3 5.016* .588 .000 3.594 6.439
2 1 -2.171* .556 .000 -3.517 -.825
3 2.845* .503 .000 1.627 4.064
3 1 -5.016* .588 .000 -6.439 -3.594
2 -2.845* .503 .000 -4.064 -1.627
Based on estimated marginal means
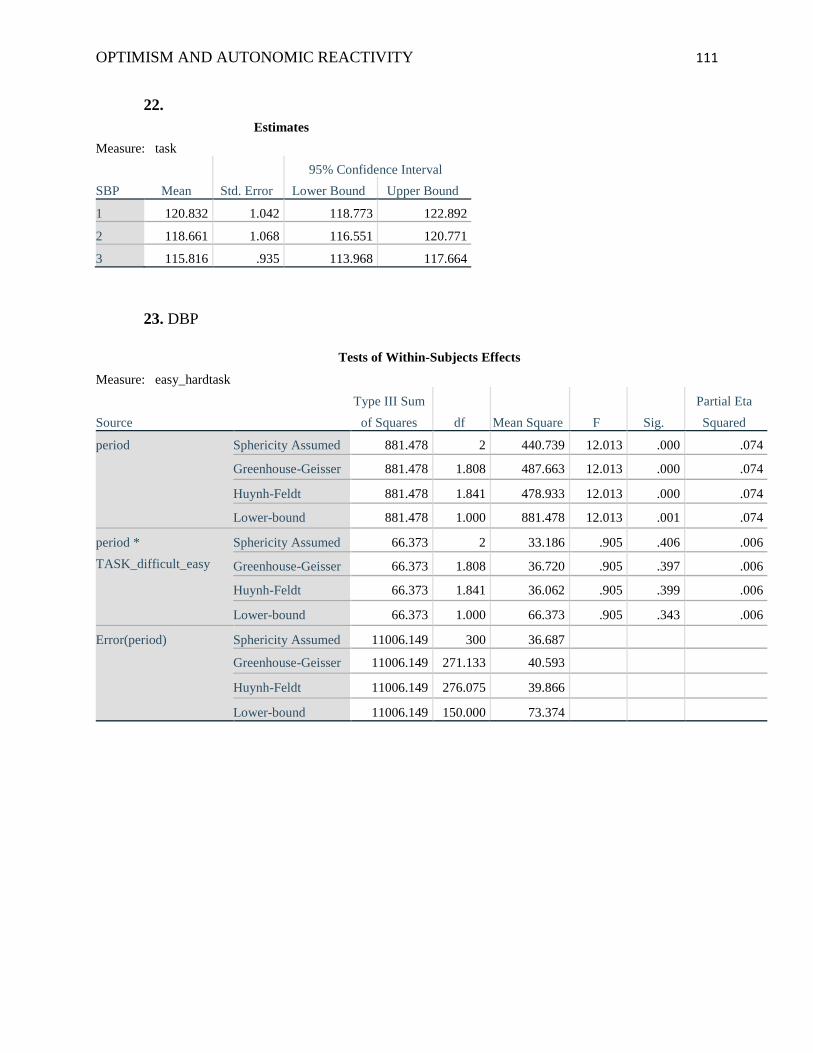
OPTIMISM AND AUTONOMIC REACTIVITY 111
22.
Estimates
Measure: task
SBP Mean Std. Error
95% Confidence Interval
Lower Bound Upper Bound
1 120.832 1.042 118.773 122.892
2 118.661 1.068 116.551 120.771
3 115.816 .935 113.968 117.664
23. DBP
Tests of Within-Subjects Effects
Measure: easy_hardtask
Source
Type III Sum
of Squares df Mean Square F Sig.
Partial Eta
Squared
period Sphericity Assumed 881.478 2 440.739 12.013 .000 .074
Greenhouse-Geisser 881.478 1.808 487.663 12.013 .000 .074
Huynh-Feldt 881.478 1.841 478.933 12.013 .000 .074
Lower-bound 881.478 1.000 881.478 12.013 .001 .074
period *
TASK_difficult_easy
Sphericity Assumed 66.373 2 33.186 .905 .406 .006
Greenhouse-Geisser 66.373 1.808 36.720 .905 .397 .006
Huynh-Feldt 66.373 1.841 36.062 .905 .399 .006
Lower-bound 66.373 1.000 66.373 .905 .343 .006
Error(period) Sphericity Assumed 11006.149 300 36.687
Greenhouse-Geisser 11006.149 271.133 40.593
Huynh-Feldt 11006.149 276.075 39.866
Lower-bound 11006.149 150.000 73.374

OPTIMISM AND AUTONOMIC REACTIVITY 112
24.
Pairwise Comparisons
Measure: easy_hardtask
(I) period (J) period
Mean Difference
(I-J) Std. Error Sig.b
95% Confidence Interval for
Differenceb
Lower Bound Upper Bound
1 2 2.842* .771 .001 .976 4.709
3 3.046* .723 .000 1.295 4.797
2 1 -2.842* .771 .001 -4.709 -.976
3 .204 .575 1.000 -1.188 1.596
3 1 -3.046* .723 .000 -4.797 -1.295
2 -.204 .575 1.000 -1.596 1.188
Based on estimated marginal means
*. The mean difference is significant at the .05 level.
b. Adjustment for multiple comparisons: Bonferroni.
25.
Estimates
Measure: easy_hardtask
period Mean Std. Error
95% Confidence Interval
Lower Bound Upper Bound
1 73.086 .804 71.496 74.675
2 70.243 .877 68.510 71.977
3 70.039 .865 68.331 71.748

OPTIMISM AND AUTONOMIC REACTIVITY 113
26. MAP
Tests of Within-Subjects Effects
Measure: easy_hardtask
Source
Type III Sum
of Squares df Mean Square F Sig.
Partial Eta
Squared
period Sphericity Assumed 1101.657 2 550.828 27.500 .000 .155
Greenhouse-Geisser 1101.657 1.783 617.724 27.500 .000 .155
Huynh-Feldt 1101.657 1.815 606.825 27.500 .000 .155
Lower-bound 1101.657 1.000 1101.657 27.500 .000 .155
period *
TASK_difficult_easy
Sphericity Assumed 61.041 2 30.521 1.524 .220 .010
Greenhouse-Geisser 61.041 1.783 34.227 1.524 .221 .010
Huynh-Feldt 61.041 1.815 33.623 1.524 .221 .010
Lower-bound 61.041 1.000 61.041 1.524 .219 .010
Error(period) Sphericity Assumed 6008.969 300 20.030
Greenhouse-Geisser 6008.969 267.512 22.462
Huynh-Feldt 6008.969 272.316 22.066
Lower-bound 6008.969 150.000 40.060

OPTIMISM AND AUTONOMIC REACTIVITY 114
27.
Pairwise Comparisons
Measure: easy_hardtask
(I) period (J) period
Mean Difference
(I-J) Std. Error Sig.b
95% Confidence Interval for
Differenceb
Lower Bound Upper Bound
1 2 2.618* .572 .000 1.235 4.002
3 3.703* .538 .000 2.400 5.006
2 1 -2.618* .572 .000 -4.002 -1.235
3 1.084* .417 .031 .074 2.095
3 1 -3.703* .538 .000 -5.006 -2.400
2 -1.084* .417 .031 -2.095 -.074
28. HR
Tests of Within-Subjects Effects
Measure: easy_hardtask
Source
Type III Sum
of Squares df Mean Square F Sig.
Partial Eta
Squared
period Sphericity Assumed 574.799 2 287.400 19.511 .000 .117
Greenhouse-Geisser 574.799 1.783 322.320 19.511 .000 .117
Huynh-Feldt 574.799 1.816 316.519 19.511 .000 .117
Lower-bound 574.799 1.000 574.799 19.511 .000 .117
period *
TASK_difficult_easy
Sphericity Assumed 129.993 2 64.997 4.413 .013 .029
Greenhouse-Geisser 129.993 1.783 72.894 4.413 .016 .029
Huynh-Feldt 129.993 1.816 71.582 4.413 .016 .029
Lower-bound 129.993 1.000 129.993 4.413 .037 .029
Error(period) Sphericity Assumed 4330.619 294 14.730
Greenhouse-Geisser 4330.619 262.148 16.520
Huynh-Feldt 4330.619 266.953 16.222
Lower-bound 4330.619 147.000 29.460

OPTIMISM AND AUTONOMIC REACTIVITY 115
29.
3. TASK_difficult_easy * period
Measure: easy_hardtask
TASK_difficult_easy period Mean Std. Error
95% Confidence Interval
Lower Bound Upper Bound
1.00 1 82.411 1.488 79.471 85.350
2 81.439 1.332 78.805 84.072
3 80.488 1.231 78.055 82.921
2.00 1 83.401 1.498 80.442 86.361
2 79.793 1.341 77.142 82.444
3 80.311 1.239 77.861 82.760

OPTIMISM AND AUTONOMIC REACTIVITY 116
Consideration of covariates
30.
Correlations
BMI
LOTR_t
ot
STAI_tot
al
Negative_e
motionality
digitspan_sc
ore
SysRest_A
VER
SysStress_A
VER
BMI Pearson
Correlation
1 .039 -.001 -.013 -.067 .412** .350**
Sig. (2-tailed) .631 .992 .875 .414 .000 .000
N 151 151 151 151 151 151 151
LOTR_tot Pearson
Correlation
.039 1 -.777** -.660** .125 .036 .031
Sig. (2-tailed) .631 .000 .000 .124 .657 .708
N 151 152 152 152 152 152 152
STAI_total Pearson
Correlation
-.001 -.777** 1 .839** -.100 .041 .025
Sig. (2-tailed) .992 .000 .000 .221 .613 .761
N 151 152 152 152 152 152 152
Negative_emotion
ality
Pearson
Correlation
-.013 -.660** .839** 1 .019 -.003 -.022
Sig. (2-tailed) .875 .000 .000 .813 .969 .790
N 151 152 152 152 152 152 152
digitspan_score Pearson
Correlation
-.067 .125 -.100 .019 1 -.003 .038
Sig. (2-tailed) .414 .124 .221 .813 .971 .645
N 151 152 152 152 152 152 152
SysRest_AVER Pearson
Correlation
.412** .036 .041 -.003 -.003 1 .811**
Sig. (2-tailed) .000 .657 .613 .969 .971 .000
N 151 152 152 152 152 152 152
SysStress_AVER Pearson
Correlation
.350** .031 .025 -.022 .038 .811** 1
Sig. (2-tailed) .000 .708 .761 .790 .645 .000
N 151 152 152 152 152 152 152
**. Correlation is significant at the 0.01 level (2-tailed).
OPTIMISM AND AUTONOMIC REACTIVITY 117
31.
Correlations
BMI
LOTR_t
ot
STAI_tot
al
Negative_e
motionality
digitspan_sc
ore
DiaRest_A
VER
DiaStress_A
VER
BMI Pearson
Correlation
1 .039 -.001 -.013 -.067 .261** .253**
Sig. (2-tailed) .631 .992 .875 .414 .001 .002
N 151 151 151 151 151 151 151
LOTR_tot Pearson
Correlation
.039 1 -.777** -.660** .125 .006 .089
Sig. (2-tailed) .631 .000 .000 .124 .939 .274
N 151 152 152 152 152 152 152
STAI_total Pearson
Correlation
-.001 -.777** 1 .839** -.100 .027 .015
Sig. (2-tailed) .992 .000 .000 .221 .737 .856
N 151 152 152 152 152 152 152
Negative_emotion
ality
Pearson
Correlation
-.013 -.660** .839** 1 .019 -.069 -.078
Sig. (2-tailed) .875 .000 .000 .813 .397 .339
N 151 152 152 152 152 152 152
digitspan_score Pearson
Correlation
-.067 .125 -.100 .019 1 .092 .113
Sig. (2-tailed) .414 .124 .221 .813 .258 .165
N 151 152 152 152 152 152 152
DiaRest_AVER Pearson
Correlation
.261** .006 .027 -.069 .092 1 .770**
Sig. (2-tailed) .001 .939 .737 .397 .258 .000
N 151 152 152 152 152 152 152
DiaStress_AVER Pearson
Correlation
.253** .089 .015 -.078 .113 .770** 1
Sig. (2-tailed) .002 .274 .856 .339 .165 .000
N 151 152 152 152 152 152 152
**. Correlation is significant at the 0.01 level (2-tailed).

OPTIMISM AND AUTONOMIC REACTIVITY 118
32.
Correlations
BMI
LOTR_t
ot
STAI_to
tal
Negative_e
motionality
MAP_Rest_
AVER
MAPTask_
AVER
digitspan_sc
ore
BMI Pearson
Correlation
1 .039 -.001 -.013 .382** .347** -.067
Sig. (2-tailed) .631 .992 .875 .000 .000 .414
N 151 151 151 151 151 151 151
LOTR_tot Pearson
Correlation
.039 1 -.777** -.660** .021 .079 .125
Sig. (2-tailed) .631 .000 .000 .797 .336 .124
N 151 152 152 152 152 152 152
STAI_total Pearson
Correlation
-.001 -.777** 1 .839** .039 .022 -.100
Sig. (2-tailed) .992 .000 .000 .632 .786 .221
N 151 152 152 152 152 152 152
Negative_emotion
ality
Pearson
Correlation
-.013 -.660** .839** 1 -.053 -.066 .019
Sig. (2-tailed) .875 .000 .000 .517 .417 .813
N 151 152 152 152 152 152 152
MAP_Rest_AVE
R
Pearson
Correlation
.382** .021 .039 -.053 1 .795** .067
Sig. (2-tailed) .000 .797 .632 .517 .000 .409
N 151 152 152 152 152 152 152
MAPTask_AVER Pearson
Correlation
.347** .079 .022 -.066 .795** 1 .099
Sig. (2-tailed) .000 .336 .786 .417 .000 .225
N 151 152 152 152 152 152 152
digitspan_score Pearson
Correlation
-.067 .125 -.100 .019 .067 .099 1
Sig. (2-tailed) .414 .124 .221 .813 .409 .225
N 151 152 152 152 152 152 152
**. Correlation is significant at the 0.01 level (2-tailed).

OPTIMISM AND AUTONOMIC REACTIVITY 119
33.
Correlations
BMI
digitspan_sco
re
HRRest_AV
ER
HRTask_AV
ER SDNN_Rest
SDNN_Tas
k
BMI Pearson
Correlation
1 -.067 .006 .023 .029 .035
Sig. (2-tailed) .414 .943 .779 .726 .670
N 151 151 149 148 149 148
digitspan_score Pearson
Correlation
-.067 1 .026 .032 -.006 .052
Sig. (2-tailed) .414 .753 .695 .944 .525
N 151 152 150 149 150 149
HRRest_AVER Pearson
Correlation
.006 .026 1 .837** -.627** -.479**
Sig. (2-tailed) .943 .753 .000 .000 .000
N 149 150 150 149 150 149
HRTask_AVE
R
Pearson
Correlation
.023 .032 .837** 1 -.566** -.552**
Sig. (2-tailed) .779 .695 .000 .000 .000
N 148 149 149 149 149 149
SDNN_Rest Pearson
Correlation
.029 -.006 -.627** -.566** 1 .664**
Sig. (2-tailed) .726 .944 .000 .000 .000
N 149 150 150 149 150 149
SDNN_Task Pearson
Correlation
.035 .052 -.479** -.552** .664** 1
Sig. (2-tailed) .670 .525 .000 .000 .000
N 148 149 149 149 149 149
**. Correlation is significant at the 0.01 level (2-tailed).

OPTIMISM AND AUTONOMIC REACTIVITY 120
34.
Correlations
BMI digitspan_score HF_Rest HF_Task LF_Rest LF_Task
BMI Pearson Correlation 1 -.067 .082 -.020 .065 .022
Sig. (2-tailed) .414 .321 .809 .431 .790
N 151 151 149 148 149 148
digitspan_score Pearson Correlation -.067 1 -.064 -.036 -.038 .025
Sig. (2-tailed) .414 .436 .662 .640 .762
N 151 152 150 149 150 149
HF_Rest Pearson Correlation .082 -.064 1 .053 .513** .079
Sig. (2-tailed) .321 .436 .520 .000 .338
N 149 150 150 149 150 149
HF_Task Pearson Correlation -.020 -.036 .053 1 .246** .496**
Sig. (2-tailed) .809 .662 .520 .002 .000
N 148 149 149 149 149 149
LF_Rest Pearson Correlation .065 -.038 .513** .246** 1 .458**
Sig. (2-tailed) .431 .640 .000 .002 .000
N 149 150 150 149 150 149
LF_Task Pearson Correlation .022 .025 .079 .496** .458** 1
Sig. (2-tailed) .790 .762 .338 .000 .000
N 148 149 149 149 149 149
**. Correlation is significant at the 0.01 level (2-tailed).

OPTIMISM AND AUTONOMIC REACTIVITY 121
Cardiovascular Measures at Rest: Group X Task ANCOVAs for resting levels
35. SBP
Tests of Between-Subjects Effects
Dependent Variable: SysRest_AVER
Source
Type III Sum of
Squares df Mean Square F Sig.
Partial Eta
Squared
Corrected Model 3108.184a 6 518.031 5.338 .000 .182
Intercept 19549.968 1 19549.968 201.465 .000 .583
BMI 2887.340 1 2887.340 29.754 .000 .171
Negative_emotionality 74.931 1 74.931 .772 .381 .005
STAI_total 151.801 1 151.801 1.564 .213 .011
Opt_Pess 49.130 1 49.130 .506 .478 .004
TASK_difficult_easy 24.331 1 24.331 .251 .617 .002
Opt_Pess *
TASK_difficult_easy
60.149 1 60.149 .620 .432 .004
Error 13973.604 144 97.039
Total 1891008.028 151
Corrected Total 17081.788 150
a. R Squared = .182 (Adjusted R Squared = .148)
36. DBP
Tests of Between-Subjects Effects
Dependent Variable: DiaRest_AVER
Source
Type III Sum of
Squares df Mean Square F Sig.
Partial Eta
Squared
Corrected Model 1078.222a 6 179.704 2.508 .024 .095
Intercept 8077.712 1 8077.712 112.735 .000 .439
BMI 718.264 1 718.264 10.024 .002 .065
Negative_emotionality 250.637 1 250.637 3.498 .063 .024
STAI_total 131.669 1 131.669 1.838 .177 .013
Opt_Pess 1.646 1 1.646 .023 .880 .000
TASK_difficult_easy 6.043 1 6.043 .084 .772 .001
Opt_Pess *
TASK_difficult_easy
9.539 1 9.539 .133 .716 .001
Error 10317.873 144 71.652
Total 655299.806 151
Corrected Total 11396.095 150
OPTIMISM AND AUTONOMIC REACTIVITY 122
37. MAP
Tests of Between-Subjects Effects
Dependent Variable: MAP_Rest_AVER
Source
Type III Sum of
Squares df Mean Square F Sig.
Partial Eta
Squared
Corrected Model 1532.792a 6 255.465 4.822 .000 .167
Intercept 11347.461 1 11347.461 214.177 .000 .598
BMI 1280.086 1 1280.086 24.161 .000 .144
Negative_emotionality 180.627 1 180.627 3.409 .067 .023
STAI_total 138.221 1 138.221 2.609 .108 .018
Opt_Pess 2.194 1 2.194 .041 .839 .000
TASK_difficult_easy 2.945E-5 1 2.945E-5 .000 .999 .000
Opt_Pess *
TASK_difficult_easy
.277 1 .277 .005 .942 .000
Error 7629.371 144 52.982
Total 991762.830 151
Corrected Total 9162.163 150
a. R Squared = .167 (Adjusted R Squared = .133)

OPTIMISM AND AUTONOMIC REACTIVITY 123
38. HR
Tests of Between-Subjects Effects
Dependent Variable: HRRest_AVER
Source
Type III Sum of
Squares df Mean Square F Sig.
Partial Eta
Squared
Corrected Model 349.700a 6 58.283 .491 .814 .020
Intercept 13974.132 1 13974.132 117.674 .000 .453
BMI .077 1 .077 .001 .980 .000
Negative_emotionality 55.324 1 55.324 .466 .496 .003
STAI_total 177.635 1 177.635 1.496 .223 .010
Opt_Pess 186.808 1 186.808 1.573 .212 .011
TASK_difficult_easy 131.401 1 131.401 1.107 .295 .008
Opt_Pess *
TASK_difficult_easy
.006 1 .006 .000 .994 .000
Error 16862.980 142 118.753
Total 913153.264 149
Corrected Total 17212.680 148
a. R Squared = .020 (Adjusted R Squared = -.021)
39. HF-HRV
Tests of Between-Subjects Effects
Dependent Variable: HFRest_transformed
Source
Type III Sum of
Squares df Mean Square F Sig.
Partial Eta
Squared
Corrected Model 1.149a 6 .191 .622 .713 .026
Intercept 26.346 1 26.346 85.552 .000 .376
BMI .010 1 .010 .033 .856 .000
Negative_emotionality .004 1 .004 .012 .913 .000
STAI_total .143 1 .143 .464 .497 .003
Opt_Pess .106 1 .106 .343 .559 .002
TASK_difficult_easy .798 1 .798 2.591 .110 .018
Opt_Pess *
TASK_difficult_easy
.045 1 .045 .147 .702 .001
Error 43.729 142 .308
Total 1307.259 149
Corrected Total 44.878 148

OPTIMISM AND AUTONOMIC REACTIVITY 124
40. SDNN
Tests of Between-Subjects Effects
Dependent Variable: SDNN_Rest
Source
Type III Sum of
Squares df Mean Square F Sig.
Partial Eta
Squared
Corrected Model 2251.279a 5 450.256 .567 .725 .019
Intercept 31468.797 1 31468.797 39.641 .000 .216
Negative_emotionality 78.597 1 78.597 .099 .753 .001
STAI_total 306.398 1 306.398 .386 .535 .003
Opt_Pess 195.213 1 195.213 .246 .621 .002
TASK_difficult_easy 412.475 1 412.475 .520 .472 .004
Opt_Pess *
TASK_difficult_easy
335.116 1 335.116 .422 .517 .003
Error 114314.434 144 793.850
Total 761164.750 150
Corrected Total 116565.713 149
a. R Squared = .019 (Adjusted R Squared = -.015)
41. LF-HRV
Tests of Between-Subjects Effects
Dependent Variable: LFRest_transformed
Source
Type III Sum of
Squares df Mean Square F Sig.
Partial Eta
Squared
Corrected Model .304a 5 .061 .478 .792 .016
Intercept 45.792 1 45.792 359.983 .000 .714
Negative_emotionality .000 1 .000 .004 .951 .000
STAI_total .037 1 .037 .291 .591 .002
Opt_Pess .003 1 .003 .022 .882 .000
TASK_difficult_easy .053 1 .053 .419 .518 .003
Opt_Pess *
TASK_difficult_easy
.003 1 .003 .026 .873 .000
Error 18.318 144 .127
Total 1359.730 150
Corrected Total 18.622 149
a. R Squared = .016 (Adjusted R Squared = -.018)

OPTIMISM AND AUTONOMIC REACTIVITY 125
Primary Analyses: Cardiovascular Reactivity to the Task 42. SBP task
Tests of Between-Subjects Effects
Dependent Variable: SysStress_AVER
Source
Type III Sum of
Squares df Mean Square F Sig.
Partial Eta
Squared
Corrected Model 13947.042a 7 1992.435 41.210 .000 .669
Intercept 566.226 1 566.226 11.711 .001 .076
SysRest_AVER 11124.763 1 11124.763 230.095 .000 .617
BMI 11.312 1 11.312 .234 .629 .002
STAI_total 29.304 1 29.304 .606 .438 .004
Negative_emotionality 8.693 1 8.693 .180 .672 .001
Opt_Pess 174.815 1 174.815 3.616 .059 .025
TASK_difficult_easy 30.125 1 30.125 .623 .431 .004
Opt_Pess *
TASK_difficult_easy
15.891 1 15.891 .329 .567 .002
Error 6913.848 143 48.349
Total 2134097.167 151
Corrected Total 20860.890 150
a. R Squared = .669 (Adjusted R Squared = .652)

OPTIMISM AND AUTONOMIC REACTIVITY 126
43. DBP task
Tests of Between-Subjects Effects
Dependent Variable: DiaStress_AVER
Source
Type III Sum of
Squares df Mean Square F Sig.
Partial Eta
Squared
Corrected Model 7487.447a 7 1069.635 31.347 .000 .605
Intercept 265.467 1 265.467 7.780 .006 .052
BMI 36.481 1 36.481 1.069 .303 .007
STAI_total 105.411 1 105.411 3.089 .081 .021
Negative_emotionality 22.902 1 22.902 .671 .414 .005
DiaRest_AVER 6234.647 1 6234.647 182.714 .000 .561
Opt_Pess 198.494 1 198.494 5.817 .017 .039
TASK_difficult_easy 23.413 1 23.413 .686 .409 .005
Opt_Pess *
TASK_difficult_easy
15.598 1 15.598 .457 .500 .003
Error 4879.517 143 34.122
Total 773226.667 151
Corrected Total 12366.964 150
a. R Squared = .605 (Adjusted R Squared = .586)
44.
Estimates
Dependent Variable: DiaStress_AVER
Opt_Pess Mean Std. Error
95% Confidence Interval
Lower Bound Upper Bound
1.00 72.757a .875 71.027 74.488
2.00 69.326a .836 67.674 70.978
a. Covariates appearing in the model are evaluated at the following values:
BMI = 25.4503, STAI_total = 44.9404, Negative_emotionality = 37.3179,
DiaRest_AVER = 65.3013.
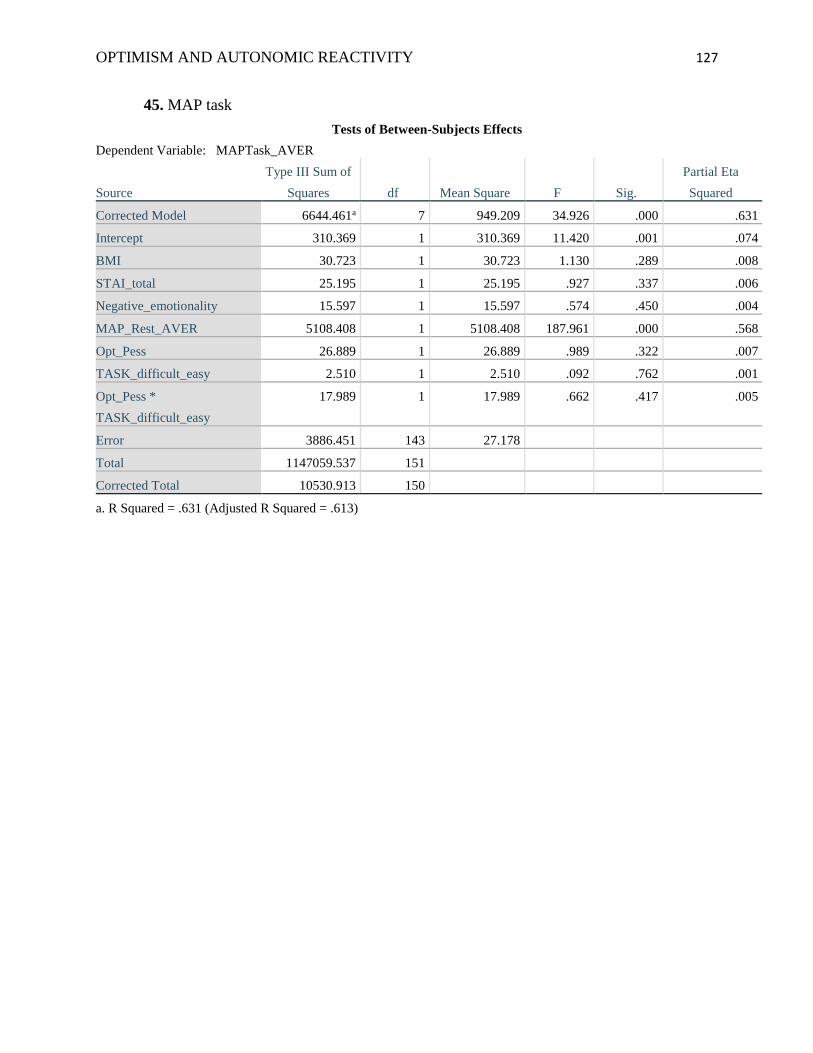
OPTIMISM AND AUTONOMIC REACTIVITY 127
45. MAP task
Tests of Between-Subjects Effects
Dependent Variable: MAPTask_AVER
Source
Type III Sum of
Squares df Mean Square F Sig.
Partial Eta
Squared
Corrected Model 6644.461a 7 949.209 34.926 .000 .631
Intercept 310.369 1 310.369 11.420 .001 .074
BMI 30.723 1 30.723 1.130 .289 .008
STAI_total 25.195 1 25.195 .927 .337 .006
Negative_emotionality 15.597 1 15.597 .574 .450 .004
MAP_Rest_AVER 5108.408 1 5108.408 187.961 .000 .568
Opt_Pess 26.889 1 26.889 .989 .322 .007
TASK_difficult_easy 2.510 1 2.510 .092 .762 .001
Opt_Pess *
TASK_difficult_easy
17.989 1 17.989 .662 .417 .005
Error 3886.451 143 27.178
Total 1147059.537 151
Corrected Total 10530.913 150
a. R Squared = .631 (Adjusted R Squared = .613)

OPTIMISM AND AUTONOMIC REACTIVITY 128
46. HR task
Tests of Between-Subjects Effects
Dependent Variable: HRTask_AVER
Source
Type III Sum of
Squares df Mean Square F Sig.
Partial Eta
Squared
Corrected Model 12799.893a 7 1828.556 47.885 .000 .705
Intercept 353.095 1 353.095 9.247 .003 .062
BMI 14.438 1 14.438 .378 .540 .003
STAI_total 32.926 1 32.926 .862 .355 .006
Negative_emotionality 1.836 1 1.836 .048 .827 .000
HRRest_AVER 12672.739 1 12672.739 331.865 .000 .703
Opt_Pess 23.962 1 23.962 .628 .430 .004
TASK_difficult_easy 27.625 1 27.625 .723 .396 .005
Opt_Pess *
TASK_difficult_easy
12.979 1 12.979 .340 .561 .002
Error 5346.097 140 38.186
Total 997887.993 148
Corrected Total 18145.990 147
a. R Squared = .705 (Adjusted R Squared = .691)

OPTIMISM AND AUTONOMIC REACTIVITY 129
47. HF-HRV
Tests of Between-Subjects Effects
Dependent Variable: HFTask_transformed
Source
Type III Sum of
Squares df Mean Square F Sig.
Partial Eta
Squared
Corrected Model 19.263a 7 2.752 21.768 .000 .521
Intercept 1.315 1 1.315 10.399 .002 .069
BMI .075 1 .075 .591 .443 .004
STAI_total .059 1 .059 .468 .495 .003
Negative_emotionality .415 1 .415 3.283 .072 .023
HFRest_transformed 17.481 1 17.481 138.281 .000 .497
Opt_Pess .001 1 .001 .005 .945 .000
TASK_difficult_easy .265 1 .265 2.095 .150 .015
Opt_Pess *
TASK_difficult_easy
.001 1 .001 .010 .922 .000
Error 17.698 140 .126
Total 1210.823 148
Corrected Total 36.962 147
a. R Squared = .521 (Adjusted R Squared = .497)
48. SDNN
Tests of Between-Subjects Effects
Dependent Variable: SDNN_Task
Source
Type III Sum of
Squares df Mean Square F Sig.
Partial Eta
Squared
Corrected Model 75853.425a 7 10836.204 18.541 .000 .481
Intercept 400.189 1 400.189 .685 .409 .005
BMI 3.512 1 3.512 .006 .938 .000
STAI_total 219.852 1 219.852 .376 .541 .003
Negative_emotionality 521.283 1 521.283 .892 .347 .006
SDNN_Rest 68271.791 1 68271.791 116.816 .000 .455
Opt_Pess 216.274 1 216.274 .370 .544 .003
TASK_difficult_easy 2905.690 1 2905.690 4.972 .027 .034
Opt_Pess *
TASK_difficult_easy
1905.922 1 1905.922 3.261 .073 .023
Error 81821.618 140 584.440
Total 735125.240 148
Corrected Total 157675.043 147

OPTIMISM AND AUTONOMIC REACTIVITY 130
49.
Estimates
Dependent Variable: SDNN_Task
TASK_difficult_easy Mean Std. Error
95% Confidence Interval
Lower Bound Upper Bound
1.00 57.996a 2.834 52.392 63.599
2.00 66.983a 2.827 61.394 72.572
a. Covariates appearing in the model are evaluated at the following values: BMI =
25.4595, STAI_total = 44.6892, Negative_emotionality = 37.0946, SDNN_Rest =
65.7845.
50. LF-HRV
Tests of Between-Subjects Effects
Dependent Variable: LFTask_transformed
Source
Type III Sum of
Squares df Mean Square F Sig.
Partial Eta
Squared
Corrected Model 8.728a 7 1.247 17.416 .000 .465
Intercept 1.390 1 1.390 19.422 .000 .122
BMI .029 1 .029 .404 .526 .003
STAI_total .054 1 .054 .755 .386 .005
Negative_emotionality .142 1 .142 1.983 .161 .014
LFRest_transformed 7.641 1 7.641 106.735 .000 .433
Opt_Pess .078 1 .078 1.091 .298 .008
TASK_difficult_easy .585 1 .585 8.165 .005 .055
Opt_Pess *
TASK_difficult_easy
.091 1 .091 1.272 .261 .009
Error 10.023 140 .072
Total 1293.237 148
Corrected Total 18.751 147
a. R Squared = .465 (Adjusted R Squared = .439)
51.
Estimates
Dependent Variable: LF_Task
TASK_difficult_easy Mean Std. Error
95% Confidence Interval
Lower Bound Upper Bound
1.00 969.945a 118.068 736.518 1203.373
2.00 1427.468a 117.781 1194.608 1660.328

OPTIMISM AND AUTONOMIC REACTIVITY 131
Comparisons of Reactivity during the first minute of the task
52. SBP
Tests of Between-Subjects Effects
Dependent Variable: SysStress_0min
Source
Type III Sum of
Squares df Mean Square F Sig.
Partial Eta
Squared
Corrected Model 13482.590a 7 1926.084 25.024 .000 .551
Intercept 959.109 1 959.109 12.461 .001 .080
BMI 47.379 1 47.379 .616 .434 .004
STAI_total 62.911 1 62.911 .817 .367 .006
Negative_emotionality 13.789 1 13.789 .179 .673 .001
SysRest_AVER 10275.767 1 10275.767 133.506 .000 .483
Opt_Pess 276.424 1 276.424 3.591 .060 .024
TASK_difficult_easy .213 1 .213 .003 .958 .000
Opt_Pess *
TASK_difficult_easy
17.110 1 17.110 .222 .638 .002
Error 11006.545 143 76.969
Total 2224524.250 151
Corrected Total 24489.136 150
a. R Squared = .551 (Adjusted R Squared = .529)

OPTIMISM AND AUTONOMIC REACTIVITY 132
53. DBP
Tests of Between-Subjects Effects
Dependent Variable: DiaStress_0min
Source
Type III Sum of
Squares df Mean Square F Sig.
Partial Eta
Squared
Corrected Model 6088.586a 7 869.798 14.874 .000 .421
Intercept 624.387 1 624.387 10.678 .001 .069
BMI 87.460 1 87.460 1.496 .223 .010
STAI_total 35.956 1 35.956 .615 .434 .004
Negative_emotionality .012 1 .012 .000 .989 .000
DiaRest_AVER 4775.095 1 4775.095 81.659 .000 .363
Opt_Pess 141.745 1 141.745 2.424 .122 .017
TASK_difficult_easy 93.317 1 93.317 1.596 .209 .011
Opt_Pess *
TASK_difficult_easy
30.990 1 30.990 .530 .468 .004
Error 8362.089 143 58.476
Total 818108.000 151
Corrected Total 14450.676 150
a. R Squared = .421 (Adjusted R Squared = .393)

OPTIMISM AND AUTONOMIC REACTIVITY 133
54. MAP
Tests of Between-Subjects Effects
Dependent Variable: MAPTask_0
Source
Type III Sum of
Squares df Mean Square F Sig.
Partial Eta
Squared
Corrected Model 5581.146a 7 797.307 19.207 .000 .485
Intercept 738.622 1 738.622 17.793 .000 .111
BMI 102.180 1 102.180 2.461 .119 .017
STAI_total 2.812 1 2.812 .068 .795 .000
Negative_emotionality 1.457 1 1.457 .035 .852 .000
MAP_Rest_AVER 3893.542 1 3893.542 93.794 .000 .396
Opt_Pess 7.558 1 7.558 .182 .670 .001
TASK_difficult_easy 43.285 1 43.285 1.043 .309 .007
Opt_Pess *
TASK_difficult_easy
21.663 1 21.663 .522 .471 .004
Error 5936.142 143 41.511
Total 1204119.806 151
Corrected Total 11517.287 150
a. R Squared = .485 (Adjusted R Squared = .459)
55. HR
Tests of Between-Subjects Effects
Dependent Variable: HRTask_0
Source
Type III Sum of
Squares df Mean Square F Sig.
Partial Eta
Squared
Corrected Model 13940.351a 6 2323.392 31.439 .000 .571
Intercept 661.270 1 661.270 8.948 .003 .059
STAI_total 99.533 1 99.533 1.347 .248 .009
Negative_emotionality 4.365 1 4.365 .059 .808 .000
HRRest_AVER 13806.696 1 13806.696 186.826 .000 .568
Opt_Pess 107.170 1 107.170 1.450 .231 .010
TASK_difficult_easy 258.865 1 258.865 3.503 .063 .024
Opt_Pess *
TASK_difficult_easy
32.669 1 32.669 .442 .507 .003
Error 10494.018 142 73.902
Total 1048488.122 149
Corrected Total 24434.369 148

OPTIMISM AND AUTONOMIC REACTIVITY 134
Comparisons of Reactivity between “true pessimists” and “slight pessimists.”
56. SBP
Tests of Between-Subjects Effectsa
Dependent Variable: SysStress_AVER
Source
Type III Sum of
Squares df Mean Square F Sig.
Partial Eta
Squared
Corrected Model 7129.241b 5 1425.848 26.384 .000 .647
Intercept 325.632 1 325.632 6.026 .017 .077
BMI 17.441 1 17.441 .323 .572 .004
STAI_total 11.200 1 11.200 .207 .650 .003
Negative_emotionality 127.120 1 127.120 2.352 .129 .032
SysRest_AVER 5468.712 1 5468.712 101.194 .000 .584
true_Pessimist 292.502 1 292.502 5.413 .023 .070
Error 3890.998 72 54.042
Total 1111535.944 78
Corrected Total 11020.239 77
a. Opt_Pess = 2.00
b. R Squared = .647 (Adjusted R Squared = .622)
57.
Estimatesa
Dependent Variable: SysStress_AVER
true_Pessimist Mean Std. Error
95% Confidence Interval
Lower Bound Upper Bound
true pessimist (under 12) 116.101b 1.421 113.268 118.935
slight pessimist (13-17) 120.283b 1.053 118.184 122.383
a. Opt_Pess = 2.00
b. Covariates appearing in the model are evaluated at the following values: BMI =
25.3462, STAI_total = 53.4615, Negative_emotionality = 43.5000, SysRest_AVER =
111.2885.

OPTIMISM AND AUTONOMIC REACTIVITY 135
58. DBP
Tests of Between-Subjects Effectsa
Dependent Variable: DiaStress_AVER
Source
Type III Sum of
Squares df Mean Square F Sig.
Partial Eta
Squared
Corrected Model 3798.792b 5 759.758 20.637 .000 .589
Intercept 310.138 1 310.138 8.424 .005 .105
BMI 26.997 1 26.997 .733 .395 .010
STAI_total 6.443 1 6.443 .175 .677 .002
Negative_emotionality 45.714 1 45.714 1.242 .269 .017
DiaRest_AVER 2654.310 1 2654.310 72.099 .000 .500
true_Pessimist 13.296 1 13.296 .361 .550 .005
Error 2650.651 72 36.815
Total 392251.222 78
Corrected Total 6449.443 77
a. Opt_Pess = 2.00
b. R Squared = .589 (Adjusted R Squared = .560)
59. MAP
Tests of Between-Subjects Effectsa
Dependent Variable: MAPTask_AVER
Source
Type III Sum of
Squares df Mean Square F Sig.
Partial Eta
Squared
Corrected Model 3246.396b 5 649.279 23.166 .000 .617
Intercept 310.211 1 310.211 11.068 .001 .133
BMI 28.773 1 28.773 1.027 .314 .014
STAI_total .825 1 .825 .029 .864 .000
Negative_emotionality 62.785 1 62.785 2.240 .139 .030
MAP_Rest_AVER 2002.917 1 2002.917 71.464 .000 .498
true_Pessimist 67.572 1 67.572 2.411 .125 .032
Error 2017.944 72 28.027
Total 588610.759 78
Corrected Total 5264.339 77
a. Opt_Pess = 2.00
b. R Squared = .617 (Adjusted R Squared = .590)

OPTIMISM AND AUTONOMIC REACTIVITY 136
60. HR
Tests of Between-Subjects Effectsa
Dependent Variable: HRTask_AVER
Source
Type III Sum of
Squares df Mean Square F Sig.
Partial Eta
Squared
Corrected Model 7047.275b 5 1409.455 33.124 .000 .706
Intercept 81.055 1 81.055 1.905 .172 .027
BMI 5.923 1 5.923 .139 .710 .002
STAI_total 8.068 1 8.068 .190 .665 .003
Negative_emotionality 3.544 1 3.544 .083 .774 .001
HRRest_AVER 6319.910 1 6319.910 148.525 .000 .683
true_Pessimist 55.015 1 55.015 1.293 .259 .018
Error 2936.039 69 42.551
Total 499453.570 75
Corrected Total 9983.314 74
a. Opt_Pess = 2.00
b. R Squared = .706 (Adjusted R Squared = .685)
61. HF-HRV
Tests of Between-Subjects Effectsa
Dependent Variable: HFTask_transformed
Source
Type III Sum of
Squares df Mean Square F Sig.
Partial Eta
Squared
Corrected Model 14.682b 5 2.936 32.012 .000 .699
Intercept .130 1 .130 1.417 .238 .020
BMI 6.652E-8 1 6.652E-8 .000 .999 .000
STAI_total .090 1 .090 .977 .326 .014
Negative_emotionality .134 1 .134 1.459 .231 .021
HFRest_transformed 13.681 1 13.681 149.146 .000 .684
true_Pessimist .313 1 .313 3.413 .069 .047
Error 6.329 69 .092
Total 622.467 75
Corrected Total 21.012 74
a. Opt_Pess = 2.00
b. R Squared = .699 (Adjusted R Squared = .677)

OPTIMISM AND AUTONOMIC REACTIVITY 137
62. SDNN
Tests of Between-Subjects Effectsa
Dependent Variable: SDNN_Task
Source
Type III Sum of
Squares df Mean Square F Sig.
Partial Eta
Squared
Corrected Model 48801.619b 5 9760.324 9.483 .000 .407
Intercept 271.325 1 271.325 .264 .609 .004
BMI 9.680 1 9.680 .009 .923 .000
STAI_total 320.169 1 320.169 .311 .579 .004
Negative_emotionality 1102.403 1 1102.403 1.071 .304 .015
SDNN_Rest 45150.147 1 45150.147 43.865 .000 .389
true_Pessimist 15.413 1 15.413 .015 .903 .000
Error 71020.788 69 1029.287
Total 416993.620 75
Corrected Total 119822.407 74
a. Opt_Pess = 2.00
b. R Squared = .407 (Adjusted R Squared = .364)
63. LF-HRV
Tests of Between-Subjects Effectsa
Dependent Variable: LFTask_transformed
Source
Type III Sum of
Squares df Mean Square F Sig.
Partial Eta
Squared
Corrected Model 5.739b 5 1.148 12.170 .000 .469
Intercept .277 1 .277 2.941 .091 .041
BMI .000 1 .000 .005 .944 .000
STAI_total .218 1 .218 2.308 .133 .032
Negative_emotionality .364 1 .364 3.858 .054 .053
LFRest_transformed 5.217 1 5.217 55.311 .000 .445
true_Pessimist .068 1 .068 .722 .398 .010
Error 6.508 69 .094
Total 660.880 75
Corrected Total 12.247 74
a. Opt_Pess = 2.00
b. R Squared = .469 (Adjusted R Squared = .430)

OPTIMISM AND AUTONOMIC REACTIVITY 138
Primary Analyses: Cardiovascular Recovery from Stress
64. SBP
Tests of Between-Subjects Effects
Dependent Variable: SYS_AUC
Source
Type III Sum of
Squares df Mean Square F Sig.
Partial Eta
Squared
Corrected Model 39215146.570a 7 5602163.796 1.390 .214 .064
Intercept 398591.004 1 398591.004 .099 .754 .001
STAI_total 2533597.244 1 2533597.244 .628 .429 .004
Negative_emotionality 1062499.419 1 1062499.419 .264 .608 .002
BMI 12557984.110 1 12557984.110 3.115 .080 .021
SysStress_AVER 12597162.610 1 12597162.610 3.125 .079 .021
Opt_Pess 3029503.733 1 3029503.733 .751 .387 .005
TASK_difficult_easy 12197494.950 1 12197494.950 3.026 .084 .021
Opt_Pess *
TASK_difficult_easy
1242963.196 1 1242963.196 .308 .580 .002
Error 576476618.100 143 4031305.022
Total 648063891.400 151
Corrected Total 615691764.700 150
a. R Squared = .064 (Adjusted R Squared = .018)
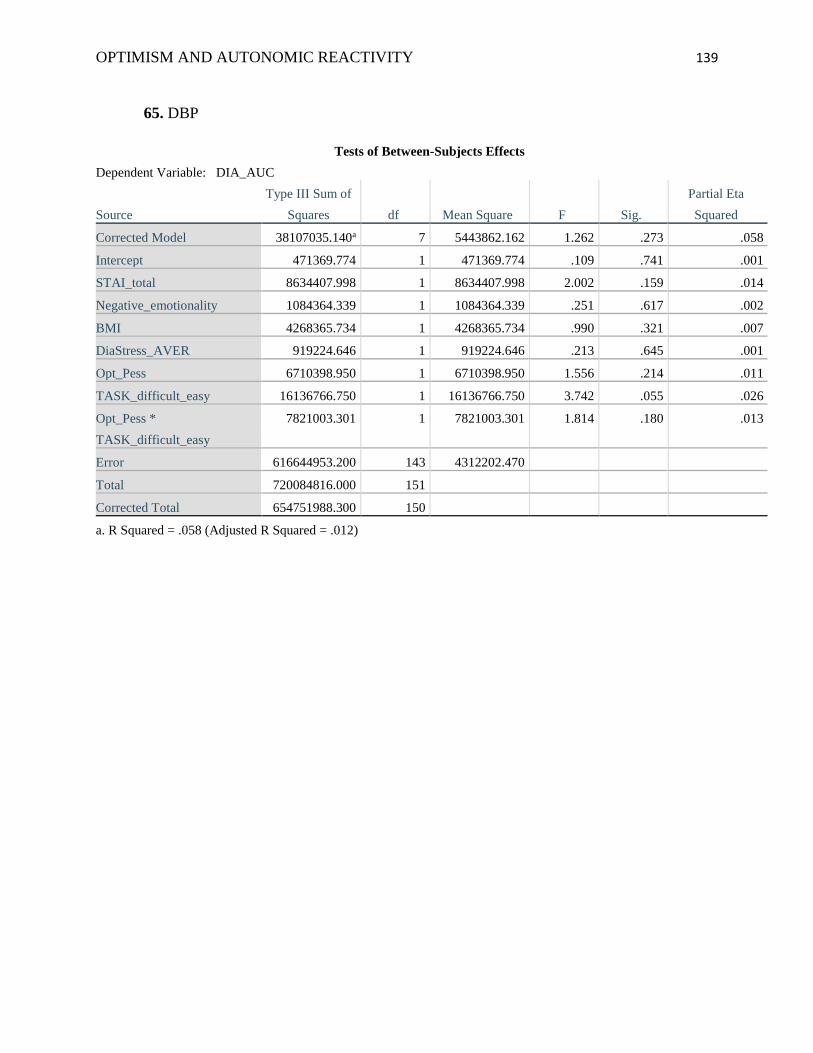
OPTIMISM AND AUTONOMIC REACTIVITY 139
65. DBP
Tests of Between-Subjects Effects
Dependent Variable: DIA_AUC
Source
Type III Sum of
Squares df Mean Square F Sig.
Partial Eta
Squared
Corrected Model 38107035.140a 7 5443862.162 1.262 .273 .058
Intercept 471369.774 1 471369.774 .109 .741 .001
STAI_total 8634407.998 1 8634407.998 2.002 .159 .014
Negative_emotionality 1084364.339 1 1084364.339 .251 .617 .002
BMI 4268365.734 1 4268365.734 .990 .321 .007
DiaStress_AVER 919224.646 1 919224.646 .213 .645 .001
Opt_Pess 6710398.950 1 6710398.950 1.556 .214 .011
TASK_difficult_easy 16136766.750 1 16136766.750 3.742 .055 .026
Opt_Pess *
TASK_difficult_easy
7821003.301 1 7821003.301 1.814 .180 .013
Error 616644953.200 143 4312202.470
Total 720084816.000 151
Corrected Total 654751988.300 150
a. R Squared = .058 (Adjusted R Squared = .012)

OPTIMISM AND AUTONOMIC REACTIVITY 140
66. MAP
Tests of Between-Subjects Effects
Dependent Variable: MAP_AUC
Source
Type III Sum of
Squares df Mean Square F Sig.
Partial Eta
Squared
Corrected Model 22657149.450a 7 3236735.636 1.207 .302 .056
Intercept 1815829.473 1 1815829.473 .677 .412 .005
STAI_total 1458680.062 1 1458680.062 .544 .462 .004
Negative_emotionality 20358.091 1 20358.091 .008 .931 .000
BMI 8109658.633 1 8109658.633 3.025 .084 .021
MAPTask_AVER 6800919.197 1 6800919.197 2.537 .113 .017
Opt_Pess 997722.350 1 997722.350 .372 .543 .003
TASK_difficult_easy 2187783.939 1 2187783.939 .816 .368 .006
Opt_Pess *
TASK_difficult_easy
4892314.840 1 4892314.840 1.825 .179 .013
Error 383365832.600 143 2680879.949
Total 459096129.400 151
Corrected Total 406022982.100 150
a. R Squared = .056 (Adjusted R Squared = .010)
67. HR
Tests of Between-Subjects Effects
Dependent Variable: HR_AUC
Source
Type III Sum of
Squares df Mean Square F Sig.
Partial Eta
Squared
Corrected Model 3040709.367a 6 506784.895 .376 .893 .016
Intercept 787556.097 1 787556.097 .585 .446 .004
STAI_total 62596.138 1 62596.138 .046 .830 .000
Negative_emotionality 23332.378 1 23332.378 .017 .895 .000
HRTask_AVER 114434.578 1 114434.578 .085 .771 .001
Opt_Pess 128.019 1 128.019 .000 .992 .000
TASK_difficult_easy 2637693.656 1 2637693.656 1.958 .164 .014
Opt_Pess *
TASK_difficult_easy
158201.371 1 158201.371 .117 .732 .001
Error 191300809.400 142 1347188.798
Total 216243857.200 149
Corrected Total 194341518.700 148

OPTIMISM AND AUTONOMIC REACTIVITY 141
68. HF-HRV
Tests of Between-Subjects Effects
Dependent Variable: HFRecov_transformed
Source
Type III Sum of
Squares df Mean Square F Sig.
Partial Eta
Squared
Corrected Model 23.041a 6 3.840 38.002 .000 .616
Intercept 1.593 1 1.593 15.766 .000 .100
STAI_total 7.943E-7 1 7.943E-7 .000 .998 .000
Negative_emotionality .177 1 .177 1.753 .188 .012
HFTask_transformed 22.476 1 22.476 222.419 .000 .610
Opt_Pess .024 1 .024 .234 .630 .002
TASK_difficult_easy .068 1 .068 .670 .415 .005
Opt_Pess *
TASK_difficult_easy
.008 1 .008 .078 .781 .001
Error 14.350 142 .101
Total 1249.507 149
Corrected Total 37.391 148
a. R Squared = .616 (Adjusted R Squared = .600)
69. SDNN
Tests of Between-Subjects Effects
Dependent Variable: SDNN_Recov
Source
Type III Sum of
Squares df Mean Square F Sig.
Partial Eta
Squared
Corrected Model 38800.089a 6 6466.681 14.945 .000 .387
Intercept 6562.106 1 6562.106 15.165 .000 .096
STAI_total 214.311 1 214.311 .495 .483 .003
Negative_emotionality 47.812 1 47.812 .110 .740 .001
SDNN_Task 37210.995 1 37210.995 85.996 .000 .377
Opt_Pess 17.449 1 17.449 .040 .841 .000
TASK_difficult_easy 316.669 1 316.669 .732 .394 .005
Opt_Pess *
TASK_difficult_easy
952.249 1 952.249 2.201 .140 .015
Error 61444.359 142 432.707
Total 745821.490 149
Corrected Total 100244.448 148
a. R Squared = .387 (Adjusted R Squared = .361)

OPTIMISM AND AUTONOMIC REACTIVITY 142
70. LF-HRV
Tests of Between-Subjects Effects
Dependent Variable: LFRecov_transformed
Source
Type III Sum of
Squares df Mean Square F Sig.
Partial Eta
Squared
Corrected Model 8.972a 6 1.495 19.439 .000 .451
Intercept 1.224 1 1.224 15.909 .000 .101
STAI_total .012 1 .012 .156 .693 .001
Negative_emotionality .024 1 .024 .311 .578 .002
LFTask_transformed 8.734 1 8.734 113.546 .000 .444
Opt_Pess .108 1 .108 1.401 .238 .010
TASK_difficult_easy .450 1 .450 5.844 .017 .040
Opt_Pess *
TASK_difficult_easy
.007 1 .007 .089 .766 .001
Error 10.923 142 .077
Total 1385.335 149
Corrected Total 19.894 148
a. R Squared = .451 (Adjusted R Squared = .428)
71.
Estimates
Dependent Variable: LF_Recov
TASK_difficult_easy Mean Std. Error
95% Confidence Interval
Lower Bound Upper Bound
1.00 1614.361a 135.263 1346.972 1881.750
2.00 1330.363a 136.053 1061.413 1599.313
a. Covariates appearing in the model are evaluated at the following values: STAI_total
= 44.7383, Negative_emotionality = 37.1007, LF_Task = 1198.5570.
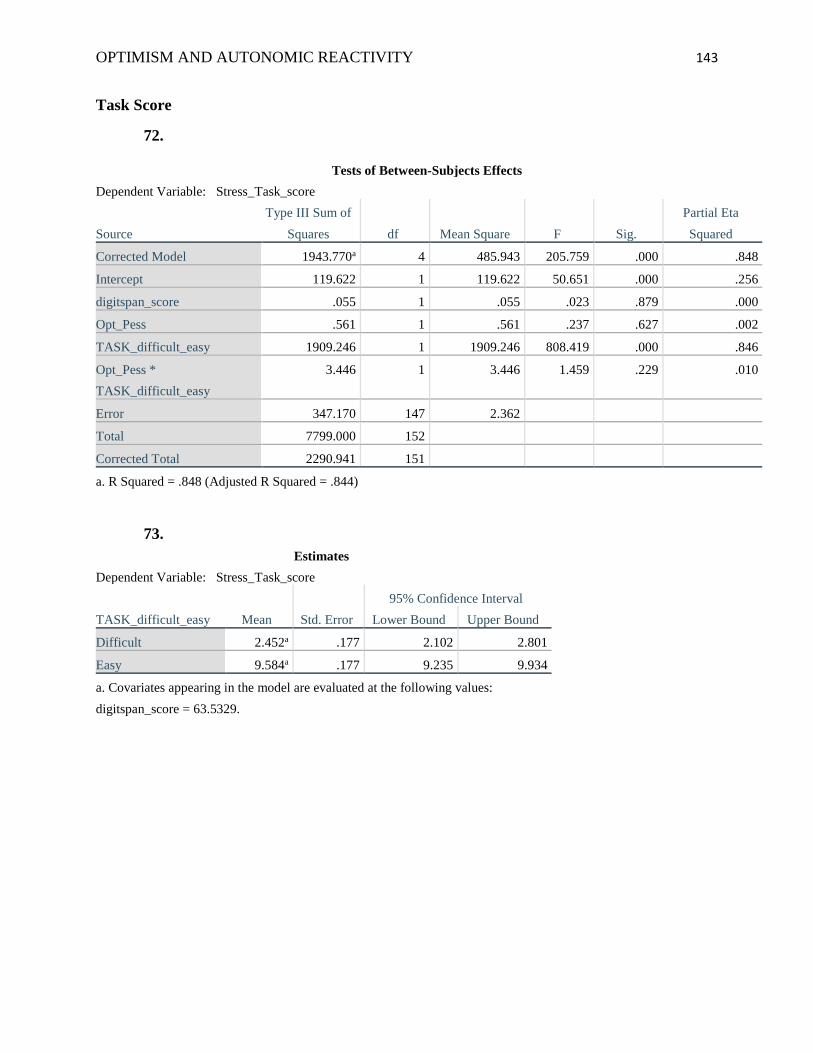
OPTIMISM AND AUTONOMIC REACTIVITY 143
Task Score
72.
Tests of Between-Subjects Effects
Dependent Variable: Stress_Task_score
Source
Type III Sum of
Squares df Mean Square F Sig.
Partial Eta
Squared
Corrected Model 1943.770a 4 485.943 205.759 .000 .848
Intercept 119.622 1 119.622 50.651 .000 .256
digitspan_score .055 1 .055 .023 .879 .000
Opt_Pess .561 1 .561 .237 .627 .002
TASK_difficult_easy 1909.246 1 1909.246 808.419 .000 .846
Opt_Pess *
TASK_difficult_easy
3.446 1 3.446 1.459 .229 .010
Error 347.170 147 2.362
Total 7799.000 152
Corrected Total 2290.941 151
a. R Squared = .848 (Adjusted R Squared = .844)
73.
Estimates
Dependent Variable: Stress_Task_score
TASK_difficult_easy Mean Std. Error
95% Confidence Interval
Lower Bound Upper Bound
Difficult 2.452a .177 2.102 2.801
Easy 9.584a .177 9.235 9.934
a. Covariates appearing in the model are evaluated at the following values:
digitspan_score = 63.5329.

OPTIMISM AND AUTONOMIC REACTIVITY 144
74. True Optimists vs. True pessimists task score
Tests of Between-Subjects Effects
Dependent Variable: Stress_Task_score
Source
Type III Sum of
Squares df Mean Square F Sig.
Partial Eta
Squared
Corrected Model 886.588a 4 221.647 94.233 .000 .859
Intercept 50.816 1 50.816 21.605 .000 .258
digitspan_score .283 1 .283 .120 .730 .002
true_Pessimist 5.587 1 5.587 2.375 .128 .037
TASK_difficult_easy 803.448 1 803.448 341.587 .000 .846
true_Pessimist *
TASK_difficult_easy
5.616 1 5.616 2.388 .127 .037
Error 145.830 62 2.352
Total 3703.000 67
Corrected Total 1032.418 66
a. R Squared = .859 (Adjusted R Squared = .850)
75.
Estimates
Dependent Variable: Stress_Task_score
TASK_difficult_easy Mean Std. Error
95% Confidence Interval
Lower Bound Upper Bound
1.00 2.364a .288 1.789 2.939
2.00 9.583a .258 9.066 10.099
a. Covariates appearing in the model are evaluated at the following values:
digitspan_score = 63.2090.

OPTIMISM AND AUTONOMIC REACTIVITY 145
76. DBP with Task score covariate
Tests of Between-Subjects Effects
Dependent Variable: DiaStress_AVER
Source
Type III Sum of
Squares df Mean Square F Sig.
Partial Eta
Squared
Corrected Model 7533.704a 8 941.713 27.667 .000 .609
Intercept 311.285 1 311.285 9.145 .003 .061
BMI 27.066 1 27.066 .795 .374 .006
STAI_total 118.845 1 118.845 3.492 .064 .024
Negative_emotionality 23.341 1 23.341 .686 .409 .005
DiaRest_AVER 6244.487 1 6244.487 183.462 .000 .564
Stress_Task_score 46.257 1 46.257 1.359 .246 .009
Opt_Pess 212.864 1 212.864 6.254 .014 .042
TASK_difficult_easy 18.932 1 18.932 .556 .457 .004
Opt_Pess *
TASK_difficult_easy
10.440 1 10.440 .307 .581 .002
Error 4833.260 142 34.037
Total 773226.667 151
Corrected Total 12366.964 150
a. R Squared = .609 (Adjusted R Squared = .587)

OPTIMISM AND AUTONOMIC REACTIVITY 146
Measures of Affect
77. Positive affect
Tests of Between-Subjects Effects
Dependent Variable: PosAffect_transformed
Source
Type III Sum of
Squares df Mean Square F Sig.
Partial Eta
Squared
Corrected Model 50.628a 3 16.876 30.119 .000 .379
Intercept 310.349 1 310.349 553.899 .000 .789
Opt_Pess 19.815 1 19.815 35.364 .000 .193
TASK_difficult_easy 30.801 1 30.801 54.972 .000 .271
Opt_Pess *
TASK_difficult_easy
.001 1 .001 .002 .962 .000
Error 82.924 148 .560
Total 440.000 152
Corrected Total 133.552 151
a. R Squared = .379 (Adjusted R Squared = .367)
78.
Estimates
Dependent Variable: MAACl_R_pos
Opt_Pess Mean Std. Error
95% Confidence Interval
Lower Bound Upper Bound
Optimist 4.027 .274 3.486 4.568
Pessimist 1.821 .267 1.293 2.348
79.
Estimates
Dependent Variable: MAACl_R_pos
TASK_difficult_easy Mean Std. Error
95% Confidence Interval
Lower Bound Upper Bound
Difficult 1.666 .270 1.131 2.200
Easy 4.182 .270 3.648 4.716

OPTIMISM AND AUTONOMIC REACTIVITY 147
80. Negative Affect
Tests of Between-Subjects Effects
Dependent Variable: NegAffect_transformed
Source
Type III Sum of
Squares df Mean Square F Sig.
Partial Eta
Squared
Corrected Model 20.377a 3 6.792 9.437 .000 .161
Intercept 444.832 1 444.832 618.052 .000 .807
Opt_Pess 3.113 1 3.113 4.325 .039 .028
TASK_difficult_easy 16.348 1 16.348 22.713 .000 .133
Opt_Pess *
TASK_difficult_easy
1.131 1 1.131 1.572 .212 .011
Error 106.520 148 .720
Total 574.000 152
Corrected Total 126.898 151
a. R Squared = .161 (Adjusted R Squared = .144)
81.
Estimates
Dependent Variable: MAACL_r_dys
Opt_Pess Mean Std. Error
95% Confidence Interval
Lower Bound Upper Bound
Optimist 3.324 .351 2.631 4.018
Pessimist 4.205 .342 3.530 4.880
82.
Estimates
Dependent Variable: MAACL_r_dys
TASK_difficult_easy Mean Std. Error
95% Confidence Interval
Lower Bound Upper Bound
Difficult 4.953 .346 4.269 5.637
Easy 2.576 .346 1.892 3.261

OPTIMISM AND AUTONOMIC REACTIVITY 148
Post-experimental questionnaire
83.
Tests of Between-Subjects Effects
Dependent Variable: How_Stressful_was_task
Source
Type III Sum of
Squares df Mean Square F Sig.
Partial Eta
Squared
Corrected Model 49.970a 3 16.657 23.012 .000 .318
Intercept 1265.588 1 1265.588 1748.437 .000 .922
Opt_Pess .588 1 .588 .812 .369 .005
TASK_difficult_easy 47.008 1 47.008 64.942 .000 .305
Opt_Pess *
TASK_difficult_easy
1.850 1 1.850 2.556 .112 .017
Error 107.128 148 .724
Total 1425.000 152
Corrected Total 157.099 151
a. R Squared = .318 (Adjusted R Squared = .304)
84.
Estimates
Dependent Variable: How_Stressful_was_task
TASK_difficult_easy Mean Std. Error
95% Confidence Interval
Lower Bound Upper Bound
Difficult 3.443 .098 3.250 3.636
Easy 2.330 .098 2.137 2.523

OPTIMISM AND AUTONOMIC REACTIVITY 149
85.
Tests of Between-Subjects Effects
Dependent Variable: How_Difficult_were_problems
Source
Type III Sum of
Squares df Mean Square F Sig.
Partial Eta
Squared
Corrected Model 120.197a 3 40.066 64.890 .000 .568
Intercept 1803.318 1 1803.318 2920.614 .000 .952
Opt_Pess .686 1 .686 1.112 .293 .007
TASK_difficult_easy 117.379 1 117.379 190.105 .000 .562
Opt_Pess *
TASK_difficult_easy
1.379 1 1.379 2.234 .137 .015
Error 91.382 148 .617
Total 2018.000 152
Corrected Total 211.579 151
a. R Squared = .568 (Adjusted R Squared = .559)
86.
Estimates
Dependent Variable: How_Difficult_were_problems
TASK_difficult_easy Mean Std. Error
95% Confidence Interval
Lower Bound Upper Bound
difficult 4.325 .090 4.146 4.503
easy 2.567 .090 2.388 2.745
87.
Tests of Between-Subjects Effects
Dependent Variable: How_much_effort_to_complete_tasks
Source
Type III Sum of
Squares df Mean Square F Sig.
Partial Eta
Squared
Corrected Model 11.233a 3 3.744 6.170 .001 .111
Intercept 2336.915 1 2336.915 3850.636 .000 .963
Opt_Pess .389 1 .389 .641 .425 .004
TASK_difficult_easy 10.423 1 10.423 17.174 .000 .104
Opt_Pess *
TASK_difficult_easy
.318 1 .318 .524 .470 .004
Error 89.820 148 .607
Total 2438.000 152
Corrected Total 101.053 151

OPTIMISM AND AUTONOMIC REACTIVITY 150
88.
Estimates
Dependent Variable: How_much_effort_to_complete_tasks
TASK_difficult_easy Mean Std. Error
95% Confidence Interval
Lower Bound Upper Bound
difficult 4.184 .089 4.008 4.361
easy 3.660 .089 3.484 3.837

OPTIMISM AND AUTONOMIC REACTIVITY 151
89.
Tests of Between-Subjects Effects
Dependent Variable: How_Well_did_you_perform_on_task
Source
Type III Sum of
Squares df Mean Square F Sig.
Partial Eta
Squared
Corrected Model 186.599a 3 62.200 110.876 .000 .692
Intercept 1049.622 1 1049.622 1871.037 .000 .927
Opt_Pess 3.043 1 3.043 5.425 .021 .035
TASK_difficult_easy 183.550 1 183.550 327.192 .000 .689
Opt_Pess *
TASK_difficult_easy
.076 1 .076 .135 .714 .001
Error 83.026 148 .561
Total 1317.000 152
Corrected Total 269.625 151
a. R Squared = .692 (Adjusted R Squared = .686)
90.
Estimates
Dependent Variable: How_Well_did_you_perform_on_task
Opt_Pess Mean Std. Error
95% Confidence Interval
Lower Bound Upper Bound
1.00 2.770 .087 2.598 2.942
2.00 2.487 .085 2.320 2.655
91.
Estimates
Dependent Variable: How_Well_did_you_perform_on_task
TASK_difficult_easy Mean Std. Error
95% Confidence Interval
Lower Bound Upper Bound
difficult 1.529 .086 1.360 1.699
easy 3.728 .086 3.558 3.898

OPTIMISM AND AUTONOMIC REACTIVITY 152
92.
Tests of Between-Subjects Effects
Dependent Variable: How_persistent_were_you_on_task
Source
Type III Sum of
Squares df Mean Square F Sig.
Partial Eta
Squared
Corrected Model 23.093a 3 7.698 9.338 .000 .159
Intercept 2302.157 1 2302.157 2792.653 .000 .950
Opt_Pess 5.367 1 5.367 6.511 .012 .042
TASK_difficult_easy 16.930 1 16.930 20.537 .000 .122
Opt_Pess *
TASK_difficult_easy
.614 1 .614 .745 .389 .005
Error 122.006 148 .824
Total 2443.000 152
Corrected Total 145.099 151
a. R Squared = .159 (Adjusted R Squared = .142)
93.
Estimates
Dependent Variable: How_persistent_were_you_on_task
Opt_Pess Mean Std. Error
95% Confidence Interval
Lower Bound Upper Bound
Optimist 4.081 .106 3.873 4.290
Pessimist 3.705 .103 3.502 3.908
94.
Estimates
Dependent Variable: How_persistent_were_you_on_task
TASK_difficult_easy Mean Std. Error
95% Confidence Interval
Lower Bound Upper Bound
difficult 3.559 .104 3.353 3.765
easy 4.227 .104 4.021 4.433

OPTIMISM AND AUTONOMIC REACTIVITY 153
95.
Tests of Between-Subjects Effects
Dependent Variable: How_upset_are_you_about_performance_on_task
Source
Type III Sum of
Squares df Mean Square F Sig.
Partial Eta
Squared
Corrected Model 37.988a 3 12.663 11.605 .000 .190
Intercept 757.523 1 757.523 694.262 .000 .824
Opt_Pess 2.918 1 2.918 2.674 .104 .018
TASK_difficult_easy 33.781 1 33.781 30.959 .000 .173
Opt_Pess *
TASK_difficult_easy
.965 1 .965 .884 .349 .006
Error 161.486 148 1.091
Total 960.000 152
Corrected Total 199.474 151
a. R Squared = .190 (Adjusted R Squared = .174)
96.
Estimates
Dependent Variable: How_upset_are_you_about_performance_on_task
TASK_difficult_easy Mean Std. Error
95% Confidence Interval
Lower Bound Upper Bound
difficult 2.705 .120 2.468 2.942
easy 1.762 .120 1.525 1.998

OPTIMISM AND AUTONOMIC REACTIVITY 154
Self-Efficacy Ratings
97.
Tests of Between-Subjects Effects
Dependent Variable: Self_efficacy
Source
Type III Sum of
Squares df Mean Square F Sig.
Partial Eta
Squared
Corrected Model .090a 3 .030 .116 .951 .002
Intercept 1974.775 1 1974.775 7645.775 .000 .981
Opt_Pess .039 1 .039 .149 .700 .001
TASK_difficult_easy .025 1 .025 .097 .756 .001
Opt_Pess *
TASK_difficult_easy
.025 1 .025 .097 .756 .001
Error 38.226 148 .258
Total 2014.000 152
Corrected Total 38.316 151
a. R Squared = .002 (Adjusted R Squared = -.018)
Self-efficacy and digit-symbol predicting task score.
98. Difficult task
Coefficientsa,b
Model
Unstandardized Coefficients
Standardized
Coefficients
t Sig. B Std. Error Beta
1 (Constant) -.401 1.867 -.215 .830
Self_efficacy .416 .403 .119 1.033 .305
digitspan_score .021 .020 .124 1.076 .285
b. Dependent Variable: Stress_Task_score
99. Easy task
Coefficientsa,b
Model
Unstandardized Coefficients
Standardized
Coefficients
t Sig. B Std. Error Beta
1 (Constant) 8.613 1.360 6.336 .000
Self_efficacy .735 .282 .288 2.610 .011
digitspan_score -.026 .015 -.191 -1.730 .088
b. Dependent Variable: Stress_Task_score

OPTIMISM AND AUTONOMIC REACTIVITY 155
Analysis of Optimism and Pessimism Subscales
100. SBP
Coefficientsa
Model
Unstandardized Coefficients
Standardized
Coefficients
t Sig. B Std. Error Beta
1 (Constant) 19.085 6.345 3.008 .003
BMI .043 .121 .019 .357 .721
SysRest_AVER .887 .059 .803 15.074 .000
STAI_total .015 .088 .015 .166 .869
Negative_emotionality -.036 .100 -.032 -.358 .721
2 (Constant) 22.032 8.167 2.698 .008
BMI .089 .123 .039 .723 .471
SysRest_AVER .882 .059 .798 14.978 .000
STAI_total .005 .106 .006 .051 .959
Negative_emotionality -.069 .101 -.062 -.685 .494
TASK_difficult_easy .444 1.153 .019 .385 .700
LOTR_opt -.575 .301 -.153 -1.906 .059
LOTR_pes .357 .259 .110 1.379 .170
a. Dependent Variable: SysStress_AVER
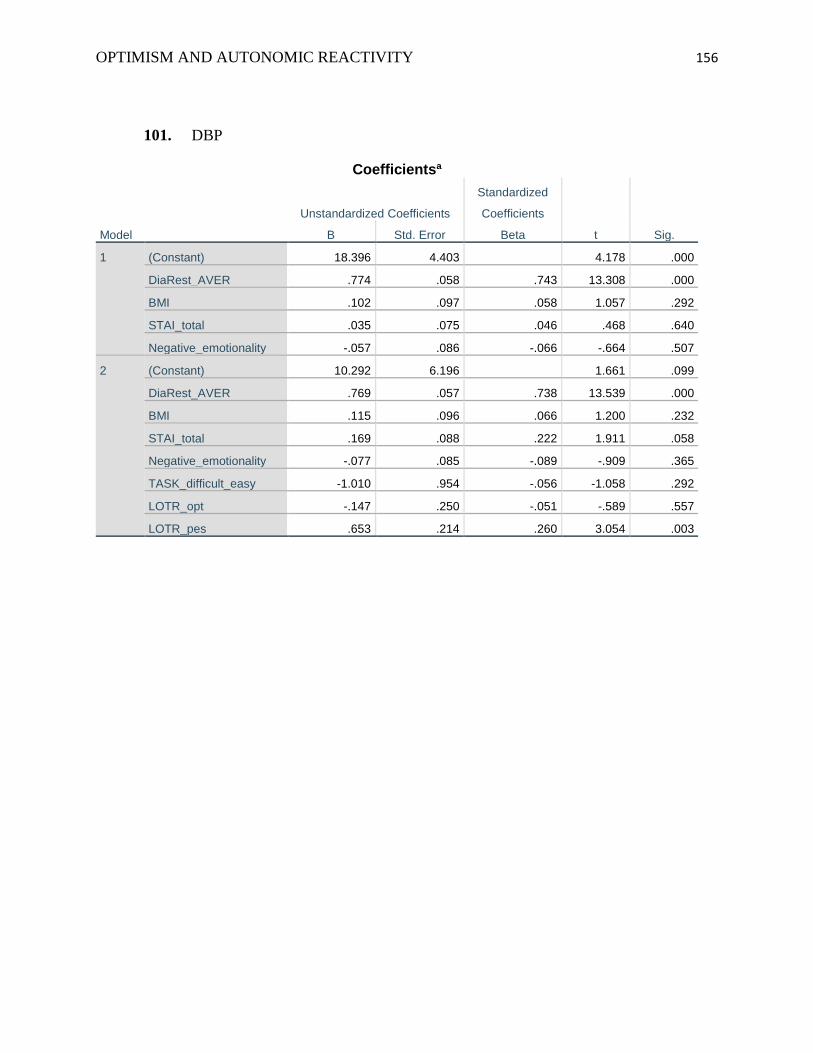
OPTIMISM AND AUTONOMIC REACTIVITY 156
101. DBP
Coefficientsa
Model
Unstandardized Coefficients
Standardized
Coefficients
t Sig. B Std. Error Beta
1 (Constant) 18.396 4.403 4.178 .000
DiaRest_AVER .774 .058 .743 13.308 .000
BMI .102 .097 .058 1.057 .292
STAI_total .035 .075 .046 .468 .640
Negative_emotionality -.057 .086 -.066 -.664 .507
2 (Constant) 10.292 6.196 1.661 .099
DiaRest_AVER .769 .057 .738 13.539 .000
BMI .115 .096 .066 1.200 .232
STAI_total .169 .088 .222 1.911 .058
Negative_emotionality -.077 .085 -.089 -.909 .365
TASK_difficult_easy -1.010 .954 -.056 -1.058 .292
LOTR_opt -.147 .250 -.051 -.589 .557
LOTR_pes .653 .214 .260 3.054 .003

OPTIMISM AND AUTONOMIC REACTIVITY 157
a. Dependent Variable: DiaStress_AVER
102. MAP
Coefficientsa
Model
Unstandardized Coefficients
Standardized
Coefficients
t Sig. B Std. Error Beta
1 (Constant) 18.954 4.746 3.993 .000
BMI .088 .089 .055 .996 .321
STAI_total .025 .066 .036 .379 .705
Negative_emotionality -.045 .075 -.056 -.599 .550
MAP_Rest_AVER .820 .059 .764 13.797 .000
2 (Constant) 14.960 6.049 2.473 .015
BMI .117 .089 .072 1.317 .190
STAI_total .114 .078 .163 1.462 .146
Negative_emotionality -.071 .075 -.089 -.951 .343
MAP_Rest_AVER .807 .058 .752 13.813 .000
TASK_difficult_easy -.559 .842 -.033 -.663 .508
LOTR_opt -.288 .221 -.108 -1.307 .193
LOTR_pes .561 .189 .242 2.967 .004

OPTIMISM AND AUTONOMIC REACTIVITY 158
103. HR
Coefficientsa
Model
Unstandardized Coefficients
Standardized
Coefficients
t Sig. B Std. Error Beta
1 (Constant) 16.059 4.122 3.896 .000
STAI_total -.054 .077 -.058 -.701 .485
Negative_emotionality .028 .088 .027 .321 .749
HRRest_AVER .860 .047 .838 18.495 .000
2 (Constant) 14.603 6.263 2.332 .021
STAI_total -.028 .093 -.030 -.296 .768
Negative_emotionality .006 .089 .006 .069 .945
HRRest_AVER .865 .047 .843 18.399 .000
TASK_difficult_easy .550 1.019 .025 .540 .590
LOTR_opt -.270 .264 -.076 -1.024 .307
LOTR_pes .293 .228 .095 1.283 .202
a. Dependent Variable: HRTask_AVER
104. HF-HRV
Coefficientsa
Model
Unstandardized Coefficients
Standardized
Coefficients
t Sig. B Std. Error Beta
1 (Constant) .744 .198 3.751 .000
STAI_total -.004 .004 -.092 -.864 .389
Negative_emotionality .010 .005 .207 1.950 .053
HFRest_transformed .645 .053 .708 12.162 .000
2 (Constant) .762 .344 2.214 .028
STAI_total -.006 .005 -.152 -1.195 .234
Negative_emotionality .010 .005 .219 2.041 .043
HFRest_transformed .635 .053 .697 11.923 .000
TASK_difficult_easy .098 .059 .099 1.671 .097
LOTR_opt .012 .015 .075 .793 .429
LOTR_pes -.019 .013 -.134 -1.421 .157
a. Dependent Variable: HFTask_transformed
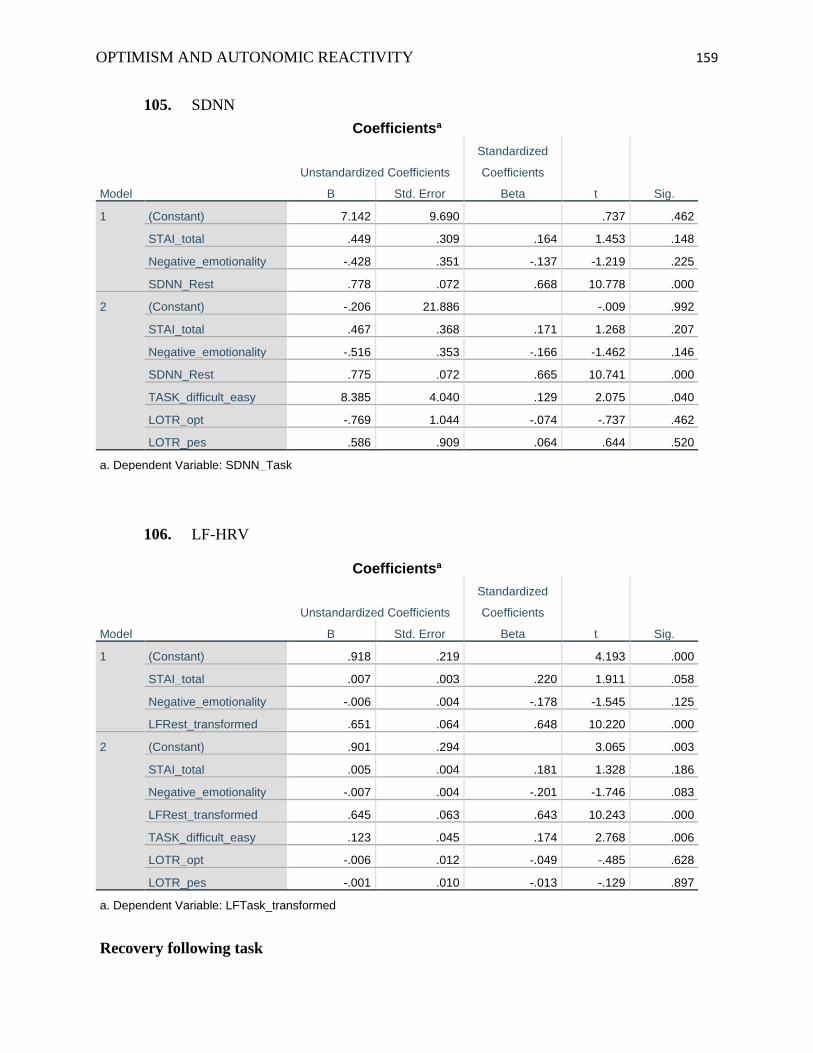
OPTIMISM AND AUTONOMIC REACTIVITY 159
105. SDNN
Coefficientsa
Model
Unstandardized Coefficients
Standardized
Coefficients
t Sig. B Std. Error Beta
1 (Constant) 7.142 9.690 .737 .462
STAI_total .449 .309 .164 1.453 .148
Negative_emotionality -.428 .351 -.137 -1.219 .225
SDNN_Rest .778 .072 .668 10.778 .000
2 (Constant) -.206 21.886 -.009 .992
STAI_total .467 .368 .171 1.268 .207
Negative_emotionality -.516 .353 -.166 -1.462 .146
SDNN_Rest .775 .072 .665 10.741 .000
TASK_difficult_easy 8.385 4.040 .129 2.075 .040
LOTR_opt -.769 1.044 -.074 -.737 .462
LOTR_pes .586 .909 .064 .644 .520
a. Dependent Variable: SDNN_Task
106. LF-HRV
Coefficientsa
Model
Unstandardized Coefficients
Standardized
Coefficients
t Sig. B Std. Error Beta
1 (Constant) .918 .219 4.193 .000
STAI_total .007 .003 .220 1.911 .058
Negative_emotionality -.006 .004 -.178 -1.545 .125
LFRest_transformed .651 .064 .648 10.220 .000
2 (Constant) .901 .294 3.065 .003
STAI_total .005 .004 .181 1.328 .186
Negative_emotionality -.007 .004 -.201 -1.746 .083
LFRest_transformed .645 .063 .643 10.243 .000
TASK_difficult_easy .123 .045 .174 2.768 .006
LOTR_opt -.006 .012 -.049 -.485 .628
LOTR_pes -.001 .010 -.013 -.129 .897
a. Dependent Variable: LFTask_transformed
Recovery following task

OPTIMISM AND AUTONOMIC REACTIVITY 160
107. SBP
Coefficientsa
Model
Unstandardized Coefficients
Standardized
Coefficients
t Sig. B Std. Error Beta
1 (Constant) 1456.140 1048.972 1.388 .167
BMI -46.019 32.066 -.117 -1.435 .153
STAI_total -9.174 25.524 -.054 -.359 .720
Negative_emotionality 15.819 29.009 .082 .545 .586
2 (Constant) 2230.456 1873.987 1.190 .236
BMI -33.370 32.306 -.085 -1.033 .303
STAI_total -20.396 30.490 -.120 -.669 .505
Negative_emotionality 6.478 29.096 .034 .223 .824
LOTR_opt -156.000 87.094 -.242 -1.791 .075
LOTR_pes 62.974 74.546 .112 .845 .400
TASK_difficult_easy 509.293 332.757 .126 1.531 .128
a. Dependent Variable: SYS_AUC
108. DBP
Coefficientsa
Model
Unstandardized Coefficients
Standardized
Coefficients
t Sig. B Std. Error Beta
1 (Constant) 1066.063 1084.549 .983 .327
BMI -32.957 33.153 -.082 -.994 .322
STAI_total 18.672 26.389 .107 .708 .480
Negative_emotionality -10.950 29.993 -.055 -.365 .716
2 (Constant) 11.111 1938.271 .006 .995
BMI -43.724 33.414 -.108 -1.309 .193
STAI_total 37.744 31.536 .216 1.197 .233
Negative_emotionality -3.744 30.094 -.019 -.124 .901
LOTR_opt 124.515 90.082 .188 1.382 .169
LOTR_pes -9.019 77.103 -.016 -.117 .907
TASK_difficult_easy -646.182 344.172 -.155 -1.877 .062
a. Dependent Variable: DIA_AUC
109. MAP

OPTIMISM AND AUTONOMIC REACTIVITY 161
Coefficientsa
Model
Unstandardized Coefficients
Standardized
Coefficients
t Sig. B Std. Error Beta
1 (Constant) 1196.089 851.483 1.405 .162
BMI -37.311 26.029 -.117 -1.433 .154
STAI_total 9.390 20.718 .068 .453 .651
Negative_emotionality -2.027 23.547 -.013 -.086 .932
2 (Constant) 750.893 1545.067 .486 .628
BMI -40.273 26.636 -.127 -1.512 .133
STAI_total 18.364 25.138 .134 .731 .466
Negative_emotionality -.336 23.989 -.002 -.014 .989
LOTR_opt 31.010 71.807 .059 .432 .666
LOTR_pes 14.978 61.462 .033 .244 .808
TASK_difficult_easy -261.024 274.352 -.080 -.951 .343
a. Dependent Variable: MAP_AUC

OPTIMISM AND AUTONOMIC REACTIVITY 162
110. HR
Coefficientsa
Model
Unstandardized Coefficients
Standardized
Coefficients
t Sig. B Std. Error Beta
1 (Constant) 416.626 374.847 1.111 .268
STAI_total -2.846 14.531 -.030 -.196 .845
Negative_emotionality 2.537 16.525 .023 .154 .878
2 (Constant) -1147.317 1004.742 -1.142 .255
STAI_total 8.992 17.423 .093 .516 .607
Negative_emotionality 2.780 16.734 .025 .166 .868
LOTR_opt 46.724 49.307 .128 .948 .345
LOTR_pes 18.176 42.826 .057 .424 .672
TASK_difficult_easy 258.346 190.932 .113 1.353 .178
a. Dependent Variable: HR_AUC
111. HF-HRV
Coefficientsa
Model
Unstandardized Coefficients
Standardized
Coefficients
t Sig. B Std. Error Beta
1 (Constant) .812 .175 4.642 .000
STAI_total .001 .004 .022 .231 .817
Negative_emotionality -.006 .005 -.128 -1.346 .180
HFTask_transformed .790 .052 .786 15.123 .000
2 (Constant) .918 .311 2.950 .004
STAI_total .001 .005 .016 .140 .889
Negative_emotionality -.006 .005 -.133 -1.373 .172
HFTask_transformed .800 .054 .795 14.906 .000
LOTR_opt -.007 .014 -.044 -.519 .605
LOTR_pes .004 .012 .025 .298 .766
TASK_difficult_easy -.048 .054 -.048 -.899 .370
a. Dependent Variable: HFRecov_transformed

OPTIMISM AND AUTONOMIC REACTIVITY 163
112. SDNN
Coefficientsa
Model
Unstandardized Coefficients
Standardized
Coefficients
t Sig. B Std. Error Beta
1 (Constant) 43.665 7.615 5.734 .000
STAI_total -.316 .262 -.145 -1.206 .230
Negative_emotionality .166 .299 .067 .555 .580
SDNN_Task .483 .053 .606 9.187 .000
2 (Constant) 43.814 18.445 2.375 .019
STAI_total -.373 .316 -.171 -1.183 .239
Negative_emotionality .253 .304 .102 .830 .408
SDNN_Task .489 .053 .614 9.153 .000
LOTR_opt 1.068 .892 .128 1.197 .233
LOTR_pes -.942 .775 -.130 -1.214 .227
TASK_difficult_easy -2.369 3.510 -.046 -.675 .501
a. Dependent Variable: SDNN_Recov
113. LF-HRV
Coefficientsa
Model
Unstandardized Coefficients
Standardized
Coefficients
t Sig. B Std. Error Beta
1 (Constant) 1.187 .214 5.552 .000
STAI_total -.004 .004 -.135 -1.167 .245
Negative_emotionality .002 .004 .053 .462 .645
LFTask_transformed .667 .065 .647 10.226 .000
2 (Constant) .967 .299 3.234 .002
STAI_total -.003 .004 -.083 -.608 .544
Negative_emotionality .004 .004 .104 .906 .366
LFTask_transformed .694 .065 .674 10.625 .000
LOTR_opt .022 .012 .187 1.848 .067
LOTR_pes -.007 .010 -.071 -.709 .480
TASK_difficult_easy -.104 .047 -.142 -2.220 .028
a. Dependent Variable: LFRecov_transformed

OPTIMISM AND AUTONOMIC REACTIVITY 164
Health behaviors and demographic differences between optimists and pessimists
114. Caffeine intake
Tests of Between-Subjects Effects
Dependent Variable: Caffeine_intake
Source
Type III Sum of
Squares df Mean Square F Sig.
Partial Eta
Squared
Corrected Model .785a 3 .262 .509 .676 .010
Intercept 499.785 1 499.785 972.539 .000 .868
Opt_Pess .759 1 .759 1.477 .226 .010
TASK_difficult_easy .026 1 .026 .051 .821 .000
Opt_Pess *
TASK_difficult_easy
1.824E-5 1 1.824E-5 .000 .995 .000
Error 76.057 148 .514
Total 578.000 152
Corrected Total 76.842 151
a. R Squared = .010 (Adjusted R Squared = -.010)
115. Alcohol intake
Tests of Between-Subjects Effects
Dependent Variable: Alcohol_intake
Source
Type III Sum of
Squares df Mean Square F Sig.
Partial Eta
Squared
Corrected Model 6.303a 3 2.101 1.623 .187 .032
Intercept 1287.559 1 1287.559 994.640 .000 .870
Opt_Pess 1.980 1 1.980 1.530 .218 .010
TASK_difficult_easy 4.158 1 4.158 3.212 .075 .021
Opt_Pess *
TASK_difficult_easy
.211 1 .211 .163 .687 .001
Error 191.586 148 1.294
Total 1489.000 152
Corrected Total 197.888 151
a. R Squared = .032 (Adjusted R Squared = .012)

OPTIMISM AND AUTONOMIC REACTIVITY 165
116. Exercise
Tests of Between-Subjects Effects
Dependent Variable: Exercise_total
Source
Type III Sum of
Squares df Mean Square F Sig.
Partial Eta
Squared
Corrected Model 73.390a 3 24.463 1.277 .284 .025
Intercept 10421.436 1 10421.436 544.046 .000 .786
Opt_Pess 10.068 1 10.068 .526 .470 .004
TASK_difficult_easy .138 1 .138 .007 .932 .000
Opt_Pess *
TASK_difficult_easy
63.296 1 63.296 3.304 .071 .022
Error 2835.005 148 19.155
Total 13320.000 152
Corrected Total 2908.395 151
a. R Squared = .025 (Adjusted R Squared = .005)
117. Perceived SES
Tests of Between-Subjects Effects
Dependent Variable: perceived_SES
Source
Type III Sum of
Squares df Mean Square F Sig.
Partial Eta
Squared
Corrected Model 10.533a 3 3.511 1.317 .271 .026
Intercept 5022.625 1 5022.625 1884.470 .000 .927
Opt_Pess 10.520 1 10.520 3.947 .049 .026
TASK_difficult_easy .007 1 .007 .003 .959 .000
Opt_Pess *
TASK_difficult_easy
.007 1 .007 .003 .959 .000
Error 394.460 148 2.665
Total 5419.000 152
Corrected Total 404.993 151
a. R Squared = .026 (Adjusted R Squared = .006)
118.
Estimates
Dependent Variable: perceived_SES
Opt_Pess Mean Std. Error
95% Confidence Interval
Lower Bound Upper Bound
1.00 6.014 .190 5.638 6.389
2.00 5.487 .185 5.122 5.852

OPTIMISM AND AUTONOMIC REACTIVITY 166
Chaos Theory
LOT-R score
119. SBP
Tests of Between-Subjects Effects
Dependent Variable: LOTR_tot
Source
Type III Sum of
Squares df Mean Square F Sig.
Partial Eta
Squared
Corrected Model 3699.871a 6 616.645 38.063 .000 .612
Intercept 12732.808 1 12732.808 785.935 .000 .844
STAI_total 964.851 1 964.851 59.556 .000 .291
Negative_emotionality 2.705 1 2.705 .167 .683 .001
chaos_SBP 47.022 4 11.755 .726 .576 .020
Error 2349.122 145 16.201
Total 60959.000 152
Corrected Total 6048.993 151
a. R Squared = .612 (Adjusted R Squared = .596)
120. DBP
Tests of Between-Subjects Effects
Dependent Variable: LOTR_tot
Source
Type III Sum of
Squares df Mean Square F Sig.
Partial Eta
Squared
Corrected Model 3891.267a 6 648.545 43.582 .000 .643
Intercept 12823.487 1 12823.487 861.743 .000 .856
STAI_total 966.014 1 966.014 64.916 .000 .309
Negative_emotionality .975 1 .975 .066 .798 .000
chaos_DBP 238.418 4 59.604 4.005 .004 .100
Error 2157.726 145 14.881
Total 60959.000 152
Corrected Total 6048.993 151
a. R Squared = .643 (Adjusted R Squared = .629)

OPTIMISM AND AUTONOMIC REACTIVITY 167
121.
Pairwise Comparisons
Dependent Variable: LOTR_tot
(I) chaos_DBP (J) chaos_DBP
Mean Difference
(I-J) Std. Error Sig.b
95% Confidence Interval for
Differenceb
Lower Bound Upper Bound
1.00 2.00 1.208 .884 1.000 -1.312 3.728
3.00 -.563 1.081 1.000 -3.644 2.517
4.00 2.561 1.313 .530 -1.181 6.302
5.00 3.686* 1.214 .028 .225 7.147
2.00 1.00 -1.208 .884 1.000 -3.728 1.312
3.00 -1.772 .900 .509 -4.338 .794
4.00 1.353 1.166 1.000 -1.972 4.677
5.00 2.478 1.080 .232 -.600 5.555
3.00 1.00 .563 1.081 1.000 -2.517 3.644
2.00 1.772 .900 .509 -.794 4.338
4.00 3.124 1.323 .195 -.647 6.896
5.00 4.249* 1.242 .008 .708 7.790
4.00 1.00 -2.561 1.313 .530 -6.302 1.181
2.00 -1.353 1.166 1.000 -4.677 1.972
3.00 -3.124 1.323 .195 -6.896 .647
5.00 1.125 1.454 1.000 -3.020 5.270
5.00 1.00 -3.686* 1.214 .028 -7.147 -.225
2.00 -2.478 1.080 .232 -5.555 .600
3.00 -4.249* 1.242 .008 -7.790 -.708
4.00 -1.125 1.454 1.000 -5.270 3.020
Based on estimated marginal means
*. The mean difference is significant at the .05 level.
b. Adjustment for multiple comparisons: Bonferroni.

OPTIMISM AND AUTONOMIC REACTIVITY 168
122.
Estimates
Dependent Variable: LOTR_tot
chaos_DBP Mean Std. Error
95% Confidence Interval
Lower Bound Upper Bound
1.00 20.077a .744 18.608 21.547
2.00 18.869a .464 17.953 19.785
3.00 20.641a .774 19.111 22.170
4.00 17.517a 1.074 15.394 19.639
5.00 16.391a .970 14.474 18.309
a. Covariates appearing in the model are evaluated at the following values:
STAI_total = 44.9868, Negative_emotionality = 37.3224.
123. MAP
Tests of Between-Subjects Effects
Dependent Variable: LOTR_tot
Source
Type III Sum of
Squares df Mean Square F Sig.
Partial Eta
Squared
Corrected Model 3789.765a 6 631.628 40.539 .000 .627
Intercept 11661.270 1 11661.270 748.434 .000 .838
STAI_total 997.321 1 997.321 64.009 .000 .306
Negative_emotionality .866 1 .866 .056 .814 .000
VAR00002 136.916 4 34.229 2.197 .072 .057
Error 2259.228 145 15.581
Total 60959.000 152
Corrected Total 6048.993 151
a. R Squared = .627 (Adjusted R Squared = .611)

OPTIMISM AND AUTONOMIC REACTIVITY 169
Task score
124. SBP
Tests of Between-Subjects Effects
Dependent Variable: Stress_Task_score
Source
Type III Sum of
Squares df Mean Square F Sig.
Partial Eta
Squared
Corrected Model 112.291a 6 18.715 1.246 .287 .049
Intercept 119.741 1 119.741 7.969 .005 .052
STAI_total 3.551 1 3.551 .236 .628 .002
Negative_emotionality 3.612 1 3.612 .240 .625 .002
chaos_SBP 71.843 4 17.961 1.195 .315 .032
Error 2178.650 145 15.025
Total 7799.000 152
Corrected Total 2290.941 151
a. R Squared = .049 (Adjusted R Squared = .010)
125. DBP
Tests of Between-Subjects Effects
Dependent Variable: Stress_Task_score
Source
Type III Sum of
Squares df Mean Square F Sig.
Partial Eta
Squared
Corrected Model 71.732a 6 11.955 .781 .586 .031
Intercept 164.542 1 164.542 10.751 .001 .069
STAI_total 7.727 1 7.727 .505 .479 .003
Negative_emotionality .211 1 .211 .014 .907 .000
chaos_DBP 31.285 4 7.821 .511 .728 .014
Error 2219.208 145 15.305
Total 7799.000 152
Corrected Total 2290.941 151
a. R Squared = .031 (Adjusted R Squared = -.009)

OPTIMISM AND AUTONOMIC REACTIVITY 170
126. MAP
Tests of Between-Subjects Effects
Dependent Variable: Stress_Task_score
Source
Type III Sum of
Squares df Mean Square F Sig.
Partial Eta
Squared
Corrected Model 58.040a 6 9.673 .628 .708 .025
Intercept 152.291 1 152.291 9.889 .002 .064
STAI_total 3.499 1 3.499 .227 .634 .002
Negative_emotionality 2.140 1 2.140 .139 .710 .001
VAR00002 17.592 4 4.398 .286 .887 .008
Error 2232.901 145 15.399
Total 7799.000 152
Corrected Total 2290.941 151
a. R Squared = .025 (Adjusted R Squared = -.015)