Embed Size (px)
Citation preview
Displaying associations, improving alignments
and gene sets at UCSC
Displaying associations, improving alignments
and gene sets at UCSC
Jim Kent and the UCSC Genome Bioinformatics Group

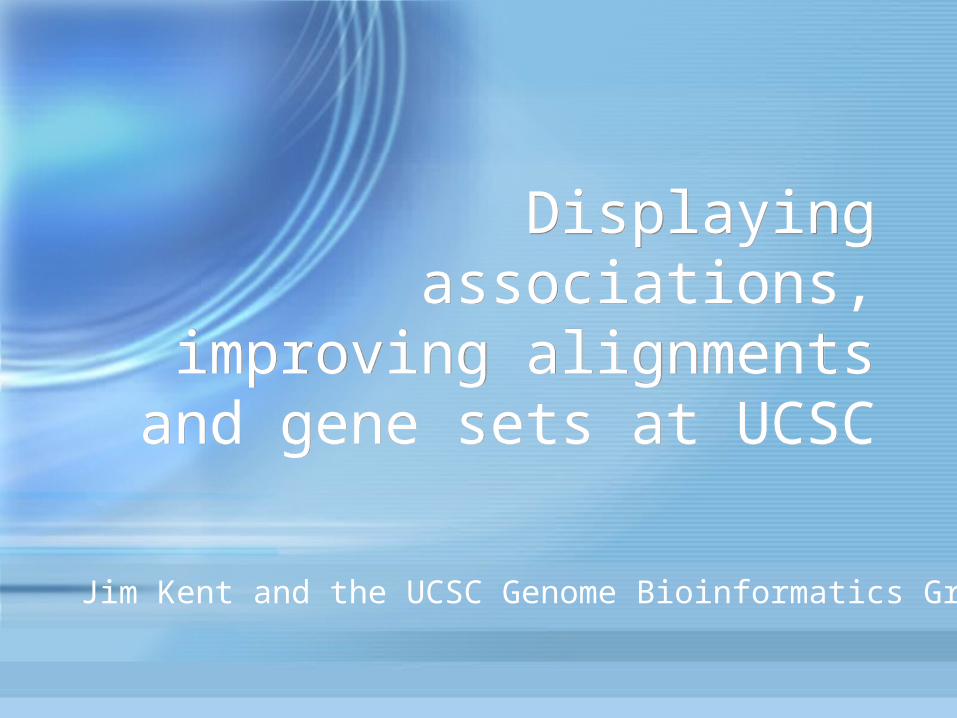
Wellcome Trust Case Control Consortium rheumatoid arthritis data

Wellcome Trust Case Control Consortium rheumatoid arthritis data

Sort Genes to see candidatesSort Genes to see candidates
Case control consortium rheumatoid arthritis data,type1 diabetes and bipolar disorder. National Instituteof Mental Health bipolar disorder in US and Germanpopulations (different scale).


In the long term we hope to import data from GAINand dbGAP and other sources as well.
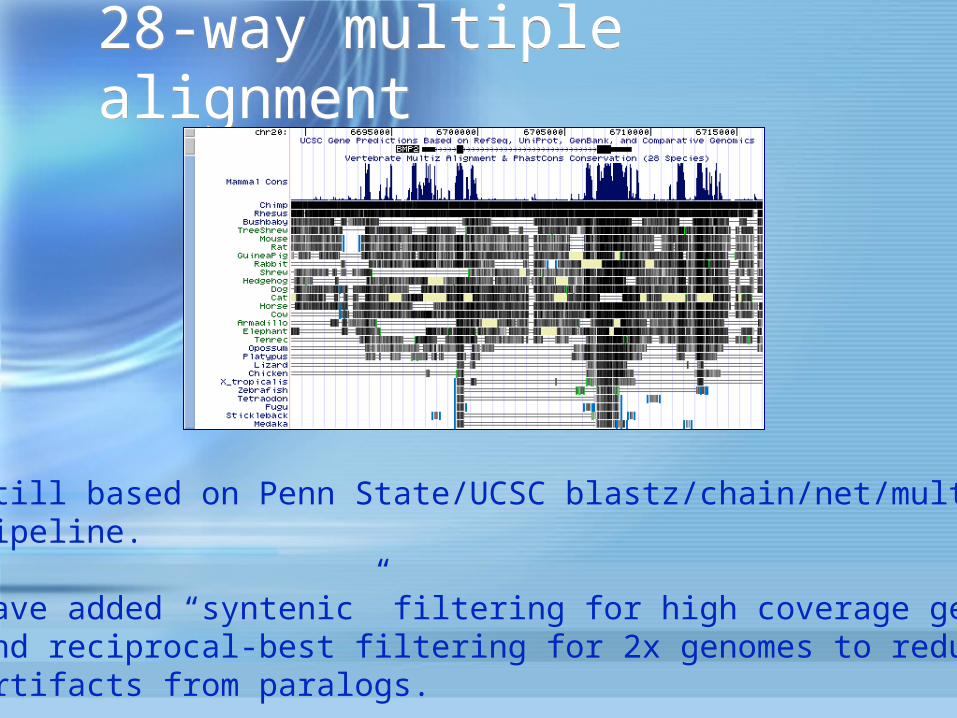
28-way multiple alignment28-way multiple alignment
Still based on Penn State/UCSC blastz/chain/net/multizpipeline.
Have added “syntenic” filtering for high coverage genomesand reciprocal-best filtering for 2x genomes to reduceartifacts from paralogs.

PhyloP vs. PhastConsPhyloP vs. PhastCons
Existing conservation track uses PhastCons algorithm,which computes probability that a region is conserved. Asmore species are added this converges to 0 or 1.
PhyloP track instead shows degree of conservation of a base

UCSC Genes GoalsUCSC Genes Goals• Include noncoding as well as coding
genes• Increase sensitivity of gene set in general.• Increase coverage of alternative splice
forms (but not too much).• Apply comparative genomics to protein
(CDS) prediction.• Create permanent accessions for
transcripts.
• Include noncoding as well as coding genes
• Increase sensitivity of gene set in general.• Increase coverage of alternative splice
forms (but not too much).• Apply comparative genomics to protein
(CDS) prediction.• Create permanent accessions for
transcripts.

Make graph
Snap soft ends to hard end within 6 bp

Extend soft ends to hard ends

Consensus of soft ends weighted 3/4 of way towards long

Weigh edges by number of transcripts that make them
3 233
31
12 41

Make graphs from various other sources:
4 354
53
25
63
3 233
31
12 41
exoniphyests
Mousesplicing
Merge in weights from other graphs:

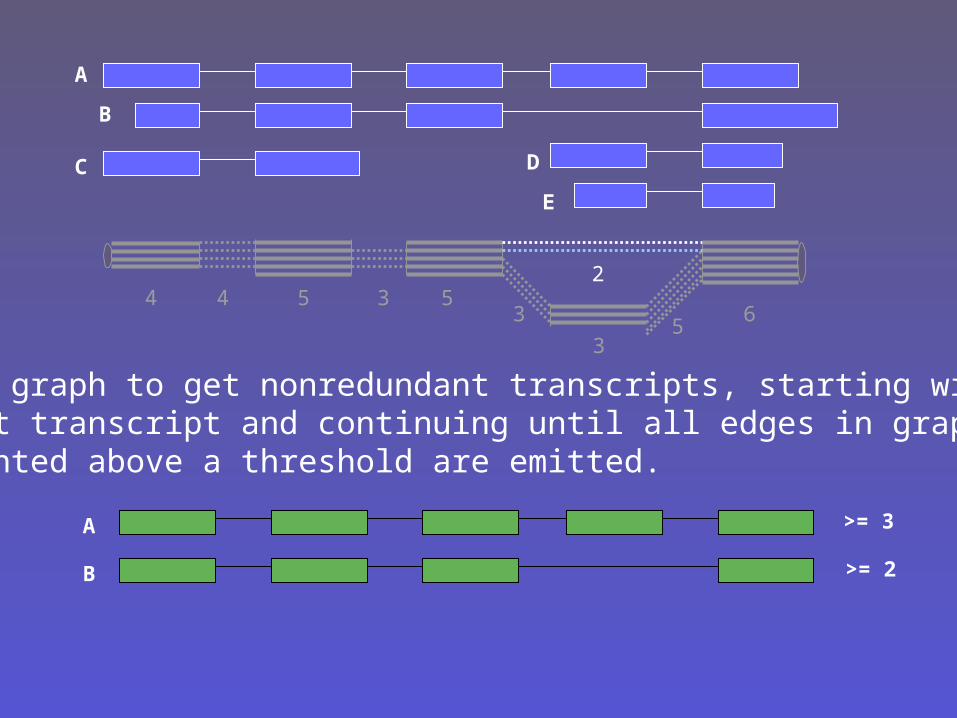
Walk graph to get nonredundant transcripts, starting withfirst transcript and continuing until all edges in graph of weight above a threshold are emitted.
4 3542
56
B
C D
E
A
A
3
35
Initial transcripts (ordered by exon count)

Walk graph to get nonredundant transcripts, starting withfirst transcript and continuing until all edges in graph of weight above a threshold are emitted.
4 3542
56
B
C D
E
A
A
35
3
Walk graph to get nonredundant transcripts, starting withfirst transcript and continuing until all edges in graph of weighted above a threshold are emitted.
4 3542
56
B
C D
E
A
A
35
B
>= 3
>= 2
3

Walk graph to get nonredundant transcripts, starting withfirst transcript and continuing until all edges in graph of weighted above a threshold are emitted.
4 354 56
B
C D
E
A
A
35
B
>= 3
>= 2
3
2
DONE

Evidence type and weightsEvidence type and weights
refSeq RNA 100
Other Genbank RNA 2
Genbank spliced EST graph edges from at least 2 ESTs
1
Orthologous splicing graph in mouse mapped to human
1
Exoniphy exon predictions 1
Minimum total weight of 3 for spliced transcripts, 4 for unspliced.Minimum total weight of 3 for spliced transcripts, 4 for unspliced.

Assigning Coding RegionsAssigning Coding Regions• Take top scoring ORF using a program,
txCdsPredict, that considers:– Length of ORF– Kozak consensus sequence– Nonsense mediated decay– Upstream open reading frames– Length of orthologous ORF in other species.
• txCdsPredict agrees with RefSeq reviewed ~96% of the time.
• Take top scoring ORF using a program, txCdsPredict, that considers:– Length of ORF– Kozak consensus sequence– Nonsense mediated decay– Upstream open reading frames– Length of orthologous ORF in other species.
• txCdsPredict agrees with RefSeq reviewed ~96% of the time.

Gene StatisticsGene Statisticsclass UCSC Ensemb
lRefSeq
coding 20433 22934 18992
antisense 643 109 19
noncoding 5228 9034 590
Transcript Statistics Transcript Statistics class UCSC Ensemb
lRefSeq
coding 45475 43569 25187
nearCoding 4469 112 14
antisense 731 109 19
noncoding 6047 9045 592

Non-codingCoding
Near-coding
• 38% of UCSC noncoding genes are < 200 bp transcripts primarily of known types such as snoRNAs, piRNAs, miRNAs etc.
• 62% are long, with a size distribution much like coding.
• (For Ensemble only 21% of noncoding are long)

Long noncoding genes have lower expression levelsLong noncoding genes have lower expression levels
Absolute expression values from Affymetrix human exon arrays
Coding
Non coding

Other characteristics of long noncodingOther characteristics of long noncoding• Long noncoding have lower tissue specificity.• Poor conservation. Average phastCons score is
0.09 for long noncoding vs 0.73 for coding.• BLAST analysis suggests 20% of long
noncoding may be transcribed pseudogenes.
• Conclusion - long noncoding but transcribed genes are slippery. Most are likely nonfunctional. – Xist is poorly conserved overall but has some peaks
and is reasonably well expressed.
• Long noncoding have lower tissue specificity.• Poor conservation. Average phastCons score is
0.09 for long noncoding vs 0.73 for coding.• BLAST analysis suggests 20% of long
noncoding may be transcribed pseudogenes.
• Conclusion - long noncoding but transcribed genes are slippery. Most are likely nonfunctional. – Xist is poorly conserved overall but has some peaks
and is reasonably well expressed.

AcknowledgementsAcknowledgements• Programming and analysis:
– Galt Barber - Genome Graphs extensions– Webb Miller Lab - Alignments– Adam Seipel - Evolutionary analysis– Dorota Retelska - UCSC noncoding genes
• Data:– Sanger, Wash U, Broad, JGI, NCBI, EBI, Affy– Contributors to scientific databases
worldwide
• Funding:– NHGRI, NCI, HHMI, State of California
• Programming and analysis:– Galt Barber - Genome Graphs extensions– Webb Miller Lab - Alignments– Adam Seipel - Evolutionary analysis– Dorota Retelska - UCSC noncoding genes
• Data:– Sanger, Wash U, Broad, JGI, NCBI, EBI, Affy– Contributors to scientific databases
worldwide
• Funding:– NHGRI, NCI, HHMI, State of California

The EndThe End

UCSC Genes Overall PipelineUCSC Genes Overall Pipeline• Start with genomic/RNA alignments• Remove antibody fragments• Clean alignments and project to genome• Cluster into splicing graph• Add EST, Exoniphy, OrthoSplice info.• Walk unique well supported transcripts out of
graph.• Assign coding regions (CDS) to transcripts.• Classify into coding, antisense, noncoding.• Assign accessions.
• Start with genomic/RNA alignments• Remove antibody fragments• Clean alignments and project to genome• Cluster into splicing graph• Add EST, Exoniphy, OrthoSplice info.• Walk unique well supported transcripts out of
graph.• Assign coding regions (CDS) to transcripts.• Classify into coding, antisense, noncoding.• Assign accessions.
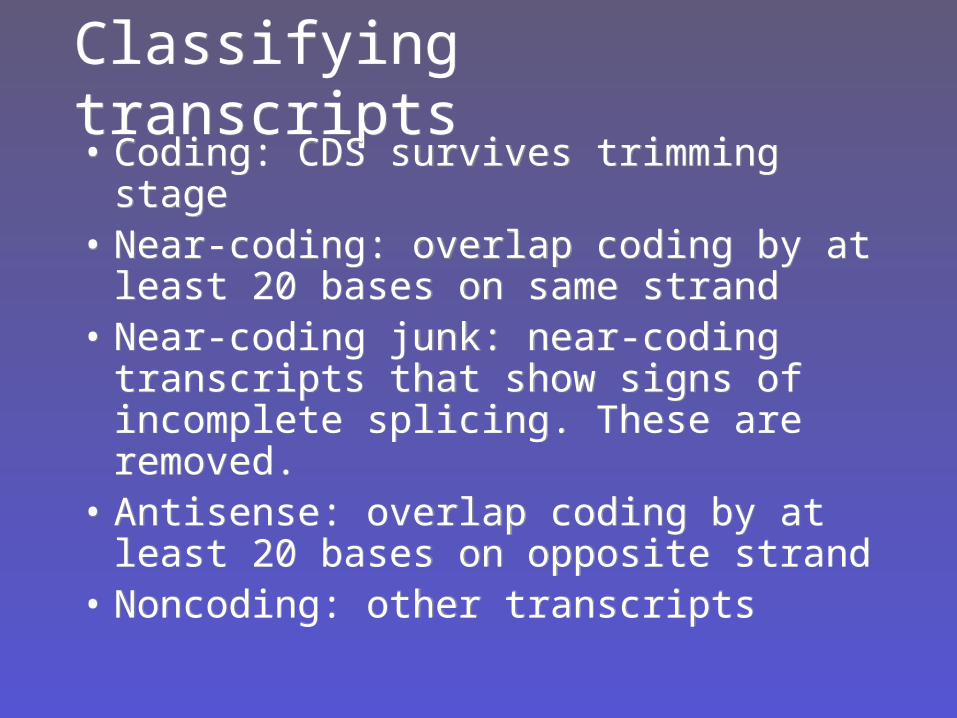
Classifying transcriptsClassifying transcripts• Coding: CDS survives trimming
stage• Near-coding: overlap coding by at
least 20 bases on same strand• Near-coding junk: near-coding
transcripts that show signs of incomplete splicing. These are removed.
• Antisense: overlap coding by at least 20 bases on opposite strand
• Noncoding: other transcripts
• Coding: CDS survives trimming stage
• Near-coding: overlap coding by at least 20 bases on same strand
• Near-coding junk: near-coding transcripts that show signs of incomplete splicing. These are removed.
• Antisense: overlap coding by at least 20 bases on opposite strand
• Noncoding: other transcripts