Embed Size (px)
Citation preview

Disparity Report
NYC Office of the Mayor | Bill de Blasio, Mayor
CIDI would like to thank our partners at various NYC agencies who provided data and insight for this report: the Young Men’s Initiative, the Department of Education, the Department of Health and Mental Hygiene, the Department of Correction, the Administration for Children’s Services, the Mayor’s Office of Criminal Justice, the Center for Economic Opportunity, the Human Resources Administration, and the Department of City Planning.
CIDI was informed and inspired by the report Reparable Harm: Assessing and Addressing Disparities Faced by Boys and Men of Color in California produced within the RAND Health Promotion and Disease Prevention Program and prepared for The California Endowment. We would like to acknowledge their contribution in the framing of the Disparity Report.
Acknowledgments
CIDI is a research/policy center located in the Office of the Mayor of the City of New York under the auspice of the Deputy Mayor for Health and Human Services. As part of the Office of the Mayor, CIDI conducts citywide interagency research to identify areas of service need in the City. The vision of CIDI is to make data come alive to inspire change. To learn more about CIDI, please visit www.nyc.gov/cidi.
About the Center for Innovation through Data Intelligence (CIDI)

Dear Reader,
The Center for Innovation through Data Intelligence (CIDI), a research and policy center for the Deputy Mayor for Health and Human Services, originally created this Disparity Report for the Young Men’s Initiative (YMI), a city-wide program designed specifically to enhance the wellbeing of young men of color. Since that time, we have realized that this report can and should serve a broader purpose: to provide a lens through which to describe the racial disparities between young men, as well as between young women, in four important areas: Education, Economic Security and Mobility, Health and Wellbeing, and Community and Personal Safety.
This report begins to quantify and understand the disparities in outcomes that result from the structural racism, poverty, residential segregation, and toxic stress experienced by young men and women of color. The complexity of each individual and his or her circumstances is not captured in these data; instead, indicators presented in this report represent the aggregate experiences of specific racial groups. These indicators were selected to be illustrative of the racial disparities that exist in several domains. We do not presume that these indicators are all that matter, but we do believe they are an important tool for government agencies and community partners who are committed to this work.
We would like to acknowledge the commitment of Mayor Bill de Blasio, Deputy Mayor Herminia Palacio, Deputy Mayor Richard Buery, and Counsel to the Mayor Maya Wiley to prioritize policies that promote equity throughout our City. In developing this report, we have benefited from the work of many stakeholders and staff, specifically CIDI staff including: Jessica Raithel, lead writer; Eileen Johns, Nebahat Noyan, Kathleen Reilly, and Andy Martens; and former staff and interns: Emily Kluver, Benjamin Charvat, and Oonagh Jordan. Thank you. Additionally, a special thanks to YMI Director W. Cyrus Garrett and his staff.
Sincerely,Maryanne SchretzmanExecutive Director, Center for Innovation through Data IntelligenceMarch 2016
Letter from the Executive Director

253 Broadway - 14th Floor • New York, NY 10007 • www.nyc.gov/youngmens • [email protected]
W. Cyrus Garrett
Executive Director
NYC Young Men’s
Initiative
253 Broadway
New York, NY 10007
April 1, 2016
On behalf of NYC’s Young Men’s Initiative (YMI), I am pleased to share with you
The Disparity Report. Commissioned by YMI and developed by the Center for
Innovation through Data Intelligence (CIDI), The Disparity Report provides a
snapshot of where young people of color stand in relation to their peers in the areas
of Education, Economic Security and Mobility, Health and Wellbeing, and
Community and Personal Safety.
In 2015, YMI became an official partner of President Barack Obama’s My Brother’s
Keeper (MBK), “a collaborative, multi-disciplinary approach to build ladders of
opportunity and unlock the full potential of our young people, including boys and
young men of color.” The MBK Task Force recommends that government make
available and encourage adoption of critical indicators of life outcomes for boys and
young men of color and their peers. Through The Disparity Report, YMI embraces
this recommendation and can better understand the disparities young men and
boys of color experience in New York City. The Disparity Report captures the results
of our research.
The data and information included in this report will help inform ongoing City
initiatives, with the goals of eliminating racial and ethnic disparities and ensuring
NYC is a place where all can prosper and thrive, regardless of their demographic
background.
The report found that, while there have been decreases in several disparities for
young men and women of color, disparities persist, warranting an in-depth
exploration of the underlying factors that account for these continued
discrepancies. Overall, positive outcome rates have increased over time for all
demographic groups. However, this trend has not affected all groups equally.
For most indicators, White and Asian young men and women have comparable
outcome rates, while Black and Hispanic young men and women fare worse.
Across all domains, the lowest racial and ethnic disparities were in the areas of
Education, and Economic Security and Mobility. Specifically, disparities among
racial and ethnic groups were relatively lower within high school graduation, ninth
grade credit accumulation, and rates of 16-24 year olds who are employed or in
school. The highest disparities were seen for Black young men and women within
several of the Community and Personal Safety disparity indicators, including
felony arrests for youth under age 16 and admissions to juvenile detention.

253 Broadway - 14th Floor • New York, NY 10007 • www.nyc.gov/youngmens • [email protected]
The City of New York has developed a number of initiatives to tackle persistent inequality and continues to
evaluate existing programs for increased efficiency and effectiveness, including:
NYC Young Men’s Initiative: In February 2015, Mayor Bill de Blasio revitalized the Young Men’s
Initiative by increasing the City’s investment and charging the team with decreasing disparities for
young men of color in four areas: 3rd Grade Reading Proficiency; Mentoring; Male Teachers of Color;
and Improving Police and Community Relations. In response, the YMI launched Read More Corps to
increase reading support for K-3rd graders; Mentor Corps to increase mentorship opportunities for high
school students; NYC Men Teach to recruit men of color to become teachers; and partnered with the
Mayor’s Office of Criminal Justice to support NYPD’s outreach to communities of color in NYC. In
addition, YMI has developed an Equity Committee comprised of City agencies tasked with creating
equity strategies aimed at addressing known disparities that are disproportionately impacting young
people of color.
NYC Children’s Cabinet: Created in 2014, the NYC Children’s Cabinet is a 24-agency initiative to
bolster communication among City agencies and develop strategies for a holistic approach to a child’s
safety and wellbeing. The focus of the NYC Children’s Cabinet is to align policies, coordinate across
agencies to maximize new and existing programs that support the safety and wellbeing of children and
families; and increase the use of, access to, and sharing of analytical tools, data and resources among
agencies to pinpoint the needs of children and families to inform policy development and evaluate
programs.
Leadership Team on School Climate and Discipline: This one-year task force was charged with
developing policy recommendations to enhance the well-being and safety of students and staff in the
City’s public schools, while minimizing the use of suspensions, arrests and summonses. The taskforce
developed 10 recommendations for maintaining school safety while decreasing the use of suspensions,
arrest and summonses. The recommendations called for establishing clear protocols; increasing
training and access to restorative supports; and implementing strategies for reducing disparities in
discipline outcomes.
Mayor’s Action Plan for Neighborhood Safety (MAP): MAP is an effort to comprehensively strengthen
neighborhoods in and around 15 New York City Housing Authority (NYCHA) developments that have
experienced some of the highest crime rates in the City. The MAP strategy recognizes the key
importance of good policing. This includes increases in patrols when necessary, but also the need to
change the way police interact with the neighborhoods. The MAP places an emphasis on increasing the
importance of the service elements of policing, such as performing wellness visits and having a role in
the local community centers.
Building Healthy Communities: Building Healthy Communities was developed to address higher-
poverty neighborhoods’ historical need for public investment in open spaces and playgrounds. The
initiative will work with local, public and private partners to address those inequities and improve
community health outcomes in 12 neighborhoods across all five boroughs by improving opportunities
for physical activity; increasing access to nutritious and affordable food; and promoting public safety.

253 Broadway - 14th Floor • New York, NY 10007 • www.nyc.gov/youngmens • [email protected]
ThriveNYC: Mental Health Roadmap for All that includes a more effective and holistic approach to
mental health services, especially in neighborhoods experiencing high levels of community violence
and other environmental triggers. ThriveNYC contains a wide array of initiatives to address mental
health conditions that afflict New Yorkers, including depression, anxiety, and alcohol and drug use,
with a particular focus on community partnerships for culturally competent solutions to decreasing
disparities by race, economic status and other demographic indicators.
ActionNYC: Rooted in immigrant community organizations and NYC Community Schools, ActionNYC
is a city-wide system that provides high-quality immigration counselling and legal support to
thousands of New Yorkers.
Broadband Initiative within NYCHA: An effort in partnership with ConnectHome, this bold new
initiative by President Obama brings together internet service providers, non-profits and the private
sector to offer broadband access, technical training, digital literacy programs, and devices for residents
in HUD-assisted housing units.
Center for Youth Employment (CYE): Launched in 2015, CYE aims to connect NYC’s young people to
career exploration and employment opportunities, quality skill-building programs, supportive mentors,
and guidance towards college and a career.
Gun Violence, Crisis Management System: The goal of the Crisis Management System is to implement
strategies that have been shown to reduce violence through violence interruption, intensive community
engagement, and changes in cultural norms around gun violence. In 2014, the City began to focus on
the 17 precincts that accounted for 55 percent of all shootings citywide. In these precincts, providers
identify and engage individuals most likely to be involved in retaliatory shootings and other forms of
gun violence. The focus is on interventions aimed at curbing violent behavior before it occurs. In each of
these precincts, there are extensive networks of service providers that provide job training, employment
opportunities, arts, mental health and legal services.
Mayor’s Task Force on Behavioral Health and the Criminal Justice System: In December 2014, the
City implemented the Mayor’s Task Force on Behavioral Health and the Criminal Justice System’s
Action Plan. The Plan is a comprehensive roadmap to reduce violent crime, improve jail conditions for
behavioral health needs, and ultimately reduce the number of people with behavioral health issues
cycling through the criminal justice system.
OneNYC: An urban planning vision released in 2015, OneNYC outlines how the City can be shaped to
address the range of evolving social, economic, and environmental issues. Part of accomplishing the
OneNYC vision includes the announcement of an Executive Order requiring regular compilation and
use of equity metrics – such as those found in this report.
The Young Women’s Initiative: Under the leadership of New York City Council Speaker Melissa Mark-
Viverito, the Young Women’s Initiative launched May 2015. It is the first City initiative in the nation
designed to invest specifically in the future of young women of color.
While not an exhaustive list of policies and programs that work to close racial and ethnic disparities across
NYC, the aforementioned programs highlight some of the ways the City has reaffirmed its commitment to
addressing disparities through data-driven, strategic action.
253 Broadway - 14th Floor • New York, NY 10007 • www.nyc.gov/youngmens • [email protected]
The report provides a tool for City agencies and their partners to better understand disparities that young men
and women of color face. YMI’s goal is to use this report to set a new baseline of understanding for City policy
makers, researchers, advocates, and community leaders in order to develop a roadmap for reducing disparate
outcomes for young people of color in New York City. YMI will continually measure our city’s progress from
where we are today – to where we can be through continually eliminating policies and practices that have or
can create barriers—instead of bridges—to equitable opportunities and access for all.
To learn more about The Disparity Report, please visit nyc.gov/cidi.
Best Regards,
W. Cyrus Garrett
Executive Director

The Disparity Report originally emerged as a way to visualize city-wide trends in disparities in the context of the work of New York City’s Young Men’s Initiative (YMI). Since then, the Center for Innovation through Data Intelligence (CIDI) has recognized the importance of expanding this work and developing a resource to understand racial disparities for both men and women across NYC over time. This framework conceptualizes a broader context of young adulthood and integrates data from multiple life stages and experiences into one tool for government agencies and community partners to address racial disparities.
This report approaches the data using a lens of racial equity. It is this focus that sets this report apart. All indicators are disaggregated by racial/ethnic group (White, Black, Hispanic, Asian) and by gender. This purposeful approach stresses the significant consequences of racism and discrimination that are too often ignored in aggregated measures of progress. It also describes outcomes across multiple domains: Education, Economic Security and Mobility, Health and Wellbeing, and Personal and Community Safety. The effects of racism are not limited to one area of life; instead, they permeate across multiple settings and throughout the life course. Although the indicators addressed in this report are not an exhaustive list of all potential indicators in which disparities exist, taken together, they represent many ways in which disparities can impact the lives of young men and women of color, focusing on their formative years (up to the age of 24 years).
This report aims to bring to light both the progress that has been made in improving outcomes for young men and women, as well as the significant disparities that continue to exist in outcomes between racial/ethnic groups. Disparities exist for all indicators – but some domains are more disparate than others. The Disparity Report serves as a framework for New York City to consciously and explicitly address the disparities that young men and women of color experience.
Methodology
Indicators were strategically selected to align with the work of the Young Men’s Initiative (YMI) based on the literature
on racial disparities and the availability of NYC agency data. They were divided into the broad domains of Education, Economic Security and Mobility, Health and Wellbeing, and Personal and Community Safety. Indicators were examined during the formative years of life. These indicators represent a range of years and experiences that, taken together, display the interactions among the various systems and outcomes that young men and women encounter in their early life.
CIDI used a standard method for comparing the data across groups and time, and measuring the racial disparities. This method involves calculating the rate of an event for young men and women of color compared with White young men and women, respectively. Indicators consist of two parts:
1. Rates of events (e.g., teen pregnancy, high school graduation, college/career readiness) by population.
2. Disparity indices between White individuals and individuals of other racial groups (Black, Hispanic, Asian).
Summary of Findings
Disparities among groups continue; several indicators have experienced significant decreases in disparity for young men and women of color. This warrants more in-depth exploration into the underlying factors that are allowing some disparities to shrink while others remain. Positive outcomes have generally increased over the available time frames for all groups. However, this trend has not affected all groups equally.
For most of the indicators, White and Asian young men and women have comparable rates of outcomes while Black and Hispanic young men and women fare worse. The smallest disparities across all domains and across races were in several of the indicators in the Education and Economic Security and Mobility domains, including high school graduation, ninth grade credit accumulation, and rates of 16-24 year olds who are employed or in school. The largest disparities were seen for Black young men and women in several of the indicators in the Community and Personal Safety domain, including felony arrests for youth under age 16 and admissions to juvenile detention.
Executive Summary

Table of Contents
Introduction 1
List of Indicators 3
Background 4
Methodology 7
Summary of Findings 9
Individual Indicators 11
Education 13
Economic Security and Mobility 37
Health and Wellbeing 47
Personal and Community Safety 51
References 73

1 DISPARITY REPORT
New York City is a complex city composed of many races and cultures. It is home to 8.3 million people of whom approximately 33% are White, 22% are Black, 29% are Hispanic or Latino, and 13% are Asian. New York City is the most populous city in the country and has the highest population density of any major U.S. city. New York City is home to over 200 languages. The City has the largest Chinese population outside of Asia and the largest Puerto Rican population of any city in the world (NYC Department of City Planning, 2013). This amazing diversity, while a definite source of the City’s vitality, also underscores the need to accurately assess the different outcomes among groups when measuring success.
The Disparity Report originally emerged as a way to visualize city-wide trends in disparities in the context of the work of New York City’s Young Men’s Initiative (YMI). Since that time, the Center for Innovation through Data Intelligence (CIDI) has recognized the importance of expanding this work and developing a resource to understand racial disparities for both men and women across NYC over time. This framework conceptualizes a broader context of young adulthood and integrates data from multiple life stages and experiences into one tool for government agencies and community partners to address racial disparities.
This report improves on existing compilations of indicators in several ways. First and most importantly, this report approaches the data using a lens of racial equity. It is this focus that sets this report apart. All indicators are disaggregated by racial/ethnic group (White, Black, Hispanic, Asian) and by gender. This purposeful approach stresses the significant consequences of structural racism and discrimination that are too often ignored in aggregated measures of progress. For this report, structural racism is defined as the normalization and legitimization of an array of dynamics—historical, cultural, institutional, and interpersonal—that
Introduction01.
NYC
8.3 million
33%
29%
22%
White
Black
Hispanic
Asian
New York City is home to
over 200 languages
13%

DISPARITY REPORT 2
Introduction
DOMAINS
Health and Wellbeing
Economic Security and Mobility
Personal and Community Safety
Education
routinely advantage Whites while producing cumulative and chronic adverse outcomes for people of color (in this case, Black, Hispanic, and Asian young men and women).
This report describes outcomes across multiple domains: Education, Economic Security and Mobility, Health and Wellbeing, and Personal and Community Safety. The effects of racism are not limited to one area of life; instead, they permeate across multiple settings and throughout the life course. Furthermore, many of the indicators are directly or indirectly related and the cumulative impact of these experiences creates even greater disparities in outcomes. Although the indicators addressed in this report are not an exhaustive list of all potential areas in which disparities exist, taken together, they represent the many ways in which disparities can impact the lives of young men and women of color, focusing on their formative years (up to the age of 24 years). The full list of indicators discussed in this report is presented at the end of this section.
Finally, although the primary focus of the Disparity Report is to identify areas where inequities are prevalent, it is important to do this in the context of the overall trend for each outcome. This is done through integrating the rates of an outcome for each racial/ethnic group with a comparative measure of the differences between the rate of the outcome for White individuals and each of the other racial/ethnic groups—Black, Hispanic, and Asian. (More information
can be found in the Methodology section.) Although the measures in this report describe overall differences between racial/ethnic groups, they do not describe the vast differences that also occur within racial/ethnic groups.
Rates and disparities are also tracked over time; depending on the indicator, trends are shown for up to 12 years. Contextualizing the disparities within the overall trends allows for a more complete picture of how these indicators have changed over time, including progress that may not be captured within the disparity measure. Similarly, within a given year, the disparity measure itself does not describe wellbeing. Therefore, an indicator with no disparity between White individuals and individuals of color does not necessarily signify overall wellbeing. It could in fact signify that both groups are doing equally poorly on that indicator. The overall progress in improving outcomes would be lost without the contextual elements of overall rates and changes in the rates and disparities over time.
This report aims to bring to light both the progress that has been made in improving outcomes for young men and women, as well as the significant disparities that continue to exist in outcomes between racial/ethnic groups. Disparities exist for all indicators—but some domains are more disparate than others. The Disparity Report serves as a framework for New York City to consciously and explicitly address the disparities that young men and women of color experience.

3 DISPARITY REPORT
Introduction
LIST OF INDICATORS
Education
Health and Wellbeing
Economic Security and Mobility
Personal and Community Safety
Students in Grades 3-8: Meeting or Exceeding English Standards
Students in Grades 3-8: Meeting or Exceeding Math Standards
Students in Grade 9: Accumulating More than 10 Credits
High School Students: Graduating in 4 Years
High School Students: Dropouts
High School Graduates: College/Career Ready
Students in Grades 6-8: Absent from School 20+ Days
Students in Grades 9-12: Absent from School 20+ Days
Students in Grades 6-8: Suspended Once (Principal and Superintendent)
Students in Grades 6-8: Suspended 2+ Times (Principal and Superintendent)
Students in Grades 9-12: Suspended Once (Principal and Superintendent)
Students in Grades 9-12: Suspended 2+ Times (Principal and Superintendent)
Females Aged 15-19: Teen Pregnancies
Females Aged 15-19: Live Births
Individuals Aged 15-24: Death Rates
Children Under Age 18: In Poverty (Official Poverty Measure)
Children Under Age 18: In Poverty (NYC Center for Economic Opportunity Measure)
Out-of-School Individuals Aged 16-24: Unemployed
Out-of-School Individuals Aged 16-24: Out of Labor Force
Out-of-School Individuals Aged 16-24: Employed
Individuals Aged 16-24: In School or Employed
Individuals Under Age 14: Substantiated Abuse/Neglect
Individuals Aged 14-17: Substantiated Abuse/Neglect
Individuals Under Age 16: Misdemeanor Arrests
Individuals Under Age 16: Felony Arrests
Individuals Under Age 16: Admissions to Juvenile Detention
Individuals Aged 16-24: Misdemeanor Arrests
Individuals Aged 16-24: Misdemeanor Convictions
Individuals Aged 16-24: Felony Arrests
Individuals Aged 16-24: Felony Convictions
Individuals Aged 16-24: Admissions to Jail
Individuals Aged 16-24: Readmission to Jail (Out of Unique Discharges)

DISPARITY REPORT 4
Background02.
The existence of racial and ethnic inequalities in Health and Human Service areas, including health, education, and income, has been well documented (Davis, Kilburn, & Scultz, 2009; Frieden, Jaffe, Stephens, Thacker, & Zaza, 2011; Randolph-Back, 2006). Often used interchangeably with “inequality,” the term “disparity” is primarily used in reference to access to health services or health outcomes. In the area of health, the U.S. Department of Health and Human Services (2012) lists as its second goal in the Healthy People 2020 initiative: “Achieve health equity, eliminate disparities, and improve the health of all groups.”
In order to understand and ultimately reduce disparities, it is crucial to examine the influence of racial biases, such as racial prejudice and discrimination, and other similar oppressive structural factors, on these outcomes. It is also essential to understand the relationships among these outcomes; they are often closely tied to each other and influence one another in complex ways.
Drawing from the research described below, it is clear that the outcomes examined in this report may have a cyclical pattern where disparities in one domain negatively impact another domain. Thus, problematic outcomes often impact later treatment and experiences, leading to a higher cumulative impact as individuals age. The impact of these outcomes is also often perpetuated across generations.
This research helps to contextualize the indicators reported in the following sections. It is important to consider the multiple pathways which lead to different outcomes for young men and women of color and their White peers. The root causes of these outcomes, such as discrimination, poverty, residential segregation, and toxic stress, are not measured here, but understanding their significant relationship to our indicators will help to frame policies to reduce racial disparities.

5 DISPARITY REPORT
Racial Biases
A large body of research shows that the outcomes examined in this report have resulted from and continue to result from racial biases. Historically, American society has systematically oppressed entire groups through slavery, segregation, internment camps, and other practices.
Further, existing racial biases—both at the individual level and through structural forces—limit the opportunities available to young men and women of color through differential treatment. For example, decisions about school suspensions have been found to be impacted by implicit racial bias. Black and Hispanic students are suspended more often (Costenbader & Markson, 1998; Fabelo, et al., 2011; Wallace, Goodkind, Wallace, & Bachman, 2008) and receive harsher punishments for similar behaviors than their White peers (Okonofua & Eberhardt, 2015; Skiba et al., 2011) across nationally representative samples, as well as in a variety of specific localities and states. Teachers were more likely to see a pattern of negative behavior and think the student was a “troublemaker” when disciplinary records were assumed to belong to a Black student (through the usage of stereotypically “Black” names—e.g. Darnell) and were more likely to recommend a harsher punishment for the Black student, even though the Black student’s record was identical to the White student’s (with a stereotypically “White” name, e.g. Greg) (Okonofua & Eberhardt, 2015).
A similar implicit bias mechanism was found to influence decisions of probation officers in the juvenile justice system in a study of three counties in a western state. Officers were more likely to attribute internal causes (the youth’s nature and personality) as the impetus for their crime to Black offenders, but would attribute external causes (the environment the youth lives in) as a driving force behind criminal behavior if the offender was White (Bridges & Steen, 1998). As internal causes are associated with recidivism, the officers would recommend harsher penalties to those offenders, who were disproportionately Black (Bridges & Steen, 1998).
The mere existence of negative stereotypes about a racial group can also diminish performance on stereotyped tasks, and thus contribute to racial disparities. For example, an experiment examined the performance of Black college students on an academic test. Just before taking the test, half of the students were subtly reminded that Black students are stereotyped as intellectually/academically inferior. The results showed that Black students who were reminded of this stereotype performed worse on the test than Black students who were not primed with this cultural stereotype (Steele & Aronson, 1995). This effect, replicated in hundreds of experiments, is termed “stereotype threat.”
Poverty
Poverty is closely linked in a variety of ways to other important outcomes discussed in this report and frequently shows severe racial disparities. For example, a recent study by Patten and Krogstad (2015) found that, while rates of children in poverty in the U.S. have fallen for other major racial groups (White, Asian, and Hispanic), the rate of child poverty has remained stable for Black children. The data also show that the number of Black children in poverty has surpassed the number of White children in poverty, despite the fact that there are more than three times the number of White children living in the U.S. as Black children.
A wealth of data describes a wide array of outcomes that poverty affects. For example, for children, the effect of growing up in poverty and related “concentrated disadvantage” found in high-poverty regions is comparable to missing a year of school (Sampson, Sharkey, & Raudenbush, 2008). Other research similarly shows that children who spend their childhoods in poverty have lower academic achievement and drop out of high school more than children who do not grow up in poverty (Wodtke, Harding, & Elwert, 2011; Harding, 2003). Moreover, children from poor neighborhoods are more likely to have “chronic absenteeism” in school (Romero & Lee, 2007). The impact of poverty and concentrated disadvantage on education may in part result from prolonged exposure to toxic stress that children experience in these areas. Early childhood adversity, such as living in poverty, has been found to alter brain development through frequent or persistent biological stress responses (Shonkoff et al., 2012).
Poverty and living in high-poverty areas has also been linked to elevated risk for a number of other negative outcomes. Children who spend their early years in poverty are more likely to earn less, live in poverty in their adult years, have poorer health outcomes, and have increased likelihood of becoming a teenage parent (Harding, 2003; Galster et al., 2007; Williams & Mohammed, 2009). Neighborhood poverty is associated with elevated rates of child maltreatment, and specifically child neglect (Drake & Pandey, 1996). Higher rates of local and family unemployment and poverty have also been found to be predictive of committing crimes, such as robbery, burglary, and theft (Mocan & Rees, 2005).
Education
Education is also linked to other important outcomes. Students who graduate in four years have higher annual earnings and are less likely to be unemployed than students who complete high school in more than four years, who pursue alternatives to graduation, or who do not complete
Background

DISPARITY REPORT 6
high school (Kienzl & Kena, 2006; Amos, 2008). Conversely, high school dropouts earn less, have higher rates of unemployment, increased risk of health problems and teenage parenthood, and are more likely to be incarcerated (Sum, Khatiwada, & McLaughlin, 2009; Amos, 2008).
Moreover, early educational factors are often predictive of later academic success. Third grade reading level can be used to predict eighth grade reading level, and being at or above desired reading level in the third grade correlates both with graduating high school and the pursuit of higher education (Lesnick, Goerge, Smithgall, & Gwynne, 2010). Achievement during fourth through eighth grade, and specifically for grades six through eight for math, has also been found to be predictive of ninth grade performance and on-time graduation (Kieffer, Marinell, & Stephenson, 2011). Similarly, a study of NYC student data found that the number of credits students earn in ninth grade is the best predictor of students graduating on time (Kieffer, Marinell, & Stephenson, 2011). Students who earned one-quarter or more of the credits required to graduate (11 or more) during ninth grade had a predicted graduation rate that was over four times higher than students earning eight credits or fewer (Kieffer, Marinell, & Stephenson, 2011). Thus, early disparities in education appear to reinforce themselves, making academic achievement more difficult in the future, which then likely exacerbates the effects of education on a host of other outcomes.
There is also work examining external factors that affect educational outcomes. For example, many absences in early years can negatively impact a child’s early education, which may in turn negatively affect their later education. Children with high levels of absenteeism in the sixth grade are less likely to graduate high school (Balfanz & Byrnes, 2012). Furthermore, a study of education data from NYC found that attendance rates in middle school are as important to student success in high school as test scores (Kieffer, Marinell, & Stephenson, 2011). Schooling can also be impacted by teenage pregnancy: On average, teenage mothers have two years less schooling than women who have their first child at age thirty (Basch, 2011). Teenage mothers are also less likely to complete high school or go to college (Basch, 2011). Abused and neglected children have been found to have lower academic achievement, including having lower standardized test scores and higher rates of grade retention, and poor socioemotional development (Kurtz, Gaudin, Howing, & Wodarski, 1993; Boden, Horwood, & Fergusson, 2007).
Disciplinary action in school also interferes with academic success. Across several studies, school suspension has been found to be related to later dropout and delinquency
Background
through several mechanisms. Students who are suspended are often already lower-performing students who display acting out behavior due to difficulties in school (McCord, Widom, & Crowell, 2001). Further, the disruption to normal school activities can make it difficult for these students to keep up with schoolwork (McCord, Widom, & Crowell, 2001). Children who have been suspended are more likely to drop out of high school and be involved in the juvenile justice system (Christle, Jolivette, & Nelson, 2007; Fabelo, et al., 2011).
Justice System Involvement
Justice system involvement also shows clear relationships to future outcomes. Youth who have been involved in the justice system are at a much higher risk for death by homicide. The mortality rate among justice-involved youth has been found to be more than four times higher than that of the general population, and for the females, the mortality rate was eight times higher than that of the general population. The majority of these deaths were by firearm (Teplin, McClelland, Abram, & Mileusnic, 2005).
In addition, students who are arrested or are involved in the juvenile justice system are at higher risk for dropping out of high school and are less likely to attend college than their peers (Kirk & Sampson, 2013; Sweeten, 2006; Chung, Mulvey, & Steinberg, 2011). Involvement in the justice system also has an impact on future employment: Ex-inmates are more likely to be unemployed and are less likely to have access to jobs with wage growth (Western, 2002).

7 DISPARITY REPORT
Indicators were strategically selected to align with the work of the Young Men’s Initiative (YMI) based on the literature on racial disparities and the availability of NYC agency data. They were divided into the broad domains of Education, Economic Security and Mobility, Health and Wellbeing, and Personal and Community Safety. Indicators were examined during the formative years of life (up to 24 years of age). These indicators represent a range of years and experiences that, taken together, display the interactions among the various systems and outcomes that young men and women encounter in their early life.
The Center for Innovation through Data Intelligence (CIDI) used a standard method for comparing the data across groups and time, and measuring the racial disparities (Shaw, Putnam-Hornstein, Magruder, & Needell, 2008). This method involved calculating the rate of an event for
young men and women of color and comparing it to White young men and women, respectively. In doing this, races were categorized to be mutually exclusive. Therefore, the White category only included Non-Hispanic White individuals, the Black category only included non-Hispanic Black individuals, and the Asian category only included the non-Hispanic Asian individuals. Similarly, individuals who are identified by a different race than those listed here or who reported two or more races are not included here.
White young men and women were used as the reference groups for all indicators to calculate disparity, even when they were not the groups with the best outcomes. This structure was chosen for theoretical purposes: White men and women represent the dominant racial group in terms of the development of cultural norms in U.S. society.
Methodology03.
1Rates of events (e.g., teen pregnancy, high school graduation, college/career readiness) by population
EXAMPLE:
# Teen pregnancies for Hispanic females 15-19 years old
Total # of Hispanic females 15-19 years old( ) X 1,000
2Disparity indices between White Individuals and Individuals of other racial groups (Black, Hispanic, Asian)
EXAMPLE:
Rate per 1,000 of teen pregnancy for Hispanic females
Rate per 1,000 of teen pregnancy for White females
INDICATORS CONSIST OF TWO PARTS

DISPARITY REPORT 8
To calculate the disparity index, the rate per 1,000 of an event occurring for young men or women of color (i.e., Black, Hispanic, and Asian young men or women) was divided by the rate per 1,000 of the event occurring for White young men or women. Using this method, White men and women always have a disparity index equal to one.
Disparity indices greater than one represent an increased rate for a group compared to White young men or women, while disparity indices less than one represent a decreased rate for a group. Whether increased or decreased rates for an event represent better outcomes depends on the indicator. Using the high school dropout rate as an example, Hispanic young men have a disparity index of 1.9 for dropping out of high school; this means that the dropout rate for Hispanic young men is 1.9 times higher than the dropout rate for White young men. On the other hand, for high school graduation, Black young men have a disparity index of 0.7; this means that the graduation rate for Black young men is 70% that of White young men. Therefore, the disparity index is a useful way to quantify the relative difference in rates between young men and women of color and White men and women concerning a specific event.
Disparity indices are reported for males and females separately, except in specific circumstances where data is unavailable (i.e., child poverty) or not directly applicable (i.e., pregnancy and birth rates). These disparity calculations contextualize the changes in rates on the selected indicators for all groups over time. Although improvements may occur across all groups for a particular indicator, the disparity index signifies how those improvements were distributed among the groups. For example, for the most part, outcomes among all racial/ethnic groups have improved over time (rates of bad outcomes have decreased while rates of good outcomes have increased); however, depending on the rate at which progress has been achieved for each group, disparities among groups may remain unchanged (if the progress is the same for all groups), decrease (if progress for individuals of color is being achieved more quickly than for White individuals), or increase (if progress for individuals of color is being achieved more slowly than for White individuals). Historical data collected by CIDI are also compared over available years to gauge trends over time and understand the impact of policies and programming across racial and ethnic groups. Trends of indicators within each category will be discussed in more detail in the following sections.
Methodology

9 DISPARITY REPORT
Disparities among groups continue; several indicators have experienced significant decreases in disparity for young men and women of color. This warrants in-depth exploration into the underlying factors that are allowing some disparities to shrink while others remain. Positive outcomes have generally increased over the available time frames for all groups. However, this trend has not affected all groups equally.
For most of the indicators, White and Asian young men and women have comparable rates of outcomes while Black and Hispanic young men and women fare worse. The smallest disparities across all domains and across races were in several of the indicators in the Education and Economic Security and Mobility domains, including high school graduation, ninth grade credit accumulation, and rates of 16-24 year olds who are employed or in school. The largest disparities were seen for Black young men and women in several of the indicators in the Community and Personal Safety domain, including felony arrests for youth aged under age 16 and admissions to juvenile detention. Below are more specific findings within each domain.
04.Summary of Findings
DISPARITY REPORT 10
Health and WellbeingTeenage pregnancies and live births to teens have decreased significantly over time. Large disparities still exist between teen pregnancy rates for White females and Black and Hispanic females, while Asian females have slightly lower pregnancy rates than White females. Death rates have varied over time, but show less disparity than other indicators.
Economic Security and MobilityOverall rates of employment have decreased, while rates of unemployment and leaving the labor force have increased. Similarly, poverty rates have increased for some groups, but are beginning to decrease for others. Disparities are high between rates of poverty according to the Center for Economic Opportunity (CEO) poverty measure for White children and all other groups. The lowest disparities in this domain were for the rates of young adults who are either in school or employed.
Personal and Community SafetyAlthough most rates in this domain have decreased, many of them still display large disparities for Black and Hispanic young men and women, while disparities for Asian young men and women vary by indicator. Readmission to jail is a notable indicator in the justice category as there is a much smaller difference in rates between racial/ethnic groups in comparison to the other justice indicators. The readmission rate is calculated from the population of unique discharges to the community (rather than the entire population); therefore, the rates show that once individuals, regardless of race or ethnicity, become involved in the criminal justice system, it is more likely that this will become a cyclical pattern for them.
Summary of Findings
EducationOverall, the data reflect significant and increasing improvements in educational outcomes over the period studied, including higher graduation rates, lower dropout rates, and decreased rates of chronic absenteeism. Disparities were lowest in this domain between White males and females and Black and Hispanic males and females for high school graduation; Asian students had similar graduation rates to White students. Disparities were highest between White students and Black and Hispanic students in rates of students with multiple suspensions. Asian students had lower suspension rates than White students.

11 DISPARITY REPORT
Individual Indicators05.
For each indicator, the rates of the outcome and the disparity indices are visualized in charts like the one below. Although the same formatting applies to every indicator, the scale of the Y-axis (i.e., where the rate per 1,000 is displayed) varies across indicators depending on the frequency of the outcome.
Title of Chart:
Lists the indicator, as well as the sex, and age group of the population. Legend:
Lists the race/ethnicities and corresponding chart colors.
Bars:
Represent the rate per 1,000 for each indicator by race. Each color represents a different race/ethnicity.
Y-axis:
Represents the rate per 1,000.
NOTE: Because the rates per 1,000 are very low for some indicators, the scale on the Y-axis varies for each indicator to display racial disparities. The axis scale should be taken into account when interpreting the charts.
Numbers below bars:
Represents the disparity rate, using White as the reference group. These are calculated by: (rate per 1,000 of race/ethnic group)/(rate per 1,000 of White).
X-axis:
Displays the years of data presented.
600
700
500
400
300
200
100
0
Rat
e pe
r 1,0
00
Sample Graph
Years 2002 2012
1.0
0.8
2.0
1.5
1.0
1.0
2.5
1.5 Disparity
Index
White
Asian
Black
Hispanic

DISPARITY REPORT 12
Individual Indicators
Disparity Index Calculations22002 2012
White individuals:
300 (rate for White individuals)300 (rate for White individuals)
= 1.0
Interpretation: White individuals will always have a disparity index of 1.0 because they are the reference group.
Asian individuals:
225 (rate for Asian individuals)300 (rate for White individuals)
= 0.8
Interpretation: Asian individuals had a rate that was 80% the rate of White individuals.
Black individuals:
600 (rate for Black individuals)300 (rate for White individuals)
= 2.0
Interpretation: Black individuals had a rate that was 2.0 times higher than the rate of White individuals.
Hispanic individuals:
450 (rate for Hispanic individuals)300 (rate for White individuals)
= 1.5
Interpretation: Hispanic individuals had a rate that was 1.5 times higher than the rate of White individuals.
White individuals:
200 (rate for White individuals)200 (rate for White individuals)
= 1.0
Interpretation: White individuals will always have a disparity index of 1.0 because they are the reference group.
Asian individuals:
200 (rate for Asian individuals)200 (rate for White individuals)
= 1.0
Interpretation: Asian individuals had a rate that was equal to the rate of White individuals.
Black individuals:
500 (rate for Black individuals)200 (rate for White individuals)
Interpretation: Black individuals had a rate that was 2.5 times higher than the rate of White individuals.
Hispanic individuals:
300 (rate for Hispanic individuals)200 (rate for White individuals)
= 1.5
Interpretation: Hispanic individuals had a rate that was 1.5 times higher than the rate of White individuals.
White individuals (grey bar): 300 per 1,000Asian individuals (red bar): 225 per 1,000Black individuals (yellow bar): 600 per 1,000Hispanic individuals (blue bar): 450 per 1,000
White individuals (grey bar): 200 per 1,000Asian individuals (red bar): 200 per 1,000Black individuals (yellow bar): 500 per 1,000Hispanic individuals (blue bar): 300 per 1,000
Outcome Rates (determined by height of bar)
HOW TO READ THE SAMPLE CHART
2002 20121
= 2.5

13 DISPARITY REPORT
Trends in disparities
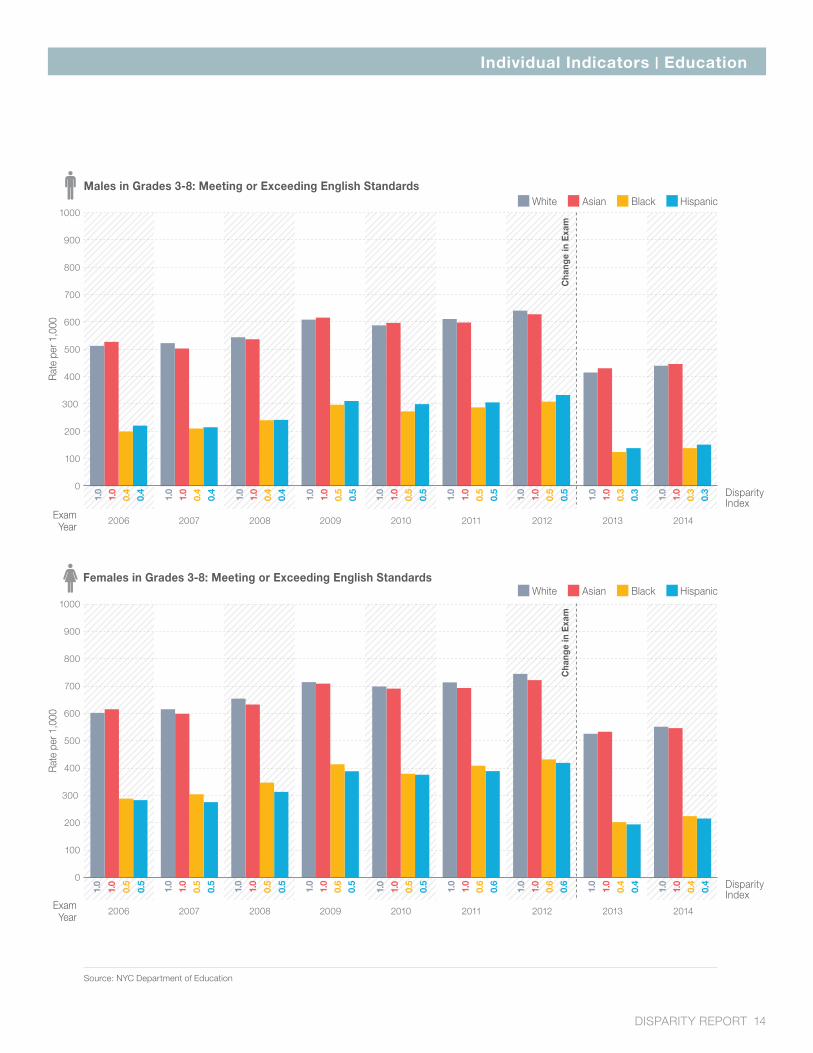
In 2014, Asian males performed about the same as White males on the tests, while Black and Hispanic met English standards at a rate that was 30% that of White males. Female students followed the same pattern in the disparity index, although all groups had higher rates than male students. White females had the highest English proficiency rate with 551 students meeting or exceeding English standards for every 1,000 who took the English exam. On the other hand, Black males had the lowest English proficiency rate with 139 students meeting or exceeding standards for every 1,000 who took the English exam.
Trends in outcome rates
Across all racial groups, females performed better on the English exams than males in the 2013-2014 school year. From the 2012-2013 school year to the 2013-2014 school year (the only years that have comparable tests), the English proficiency rate for White male students increased 6%, while the rate for Asian males increased 3%, the rate for Black males increased 11%, and the rate for Hispanic males increased 9%. For females, the rate of English proficiency increased 5% for White students, while the rate for Asian females increased 2%, and the rate for Black and Hispanic females increased 11%.
Students in Grades 3-8: Meeting or Exceeding English Standards
Indicator description
The indicator for English proficiency is defined as the number of students in grades 3 through 8 who met proficiency standards (meaning they scored a level three or higher on the yearly administered New York State standardized test) out of all students who took the exam. The content of the tests for English proficiency for students in grades 3 through 8 changed significantly in the 2012-2013 school year; this explains the large drop in students meeting or exceeding English standards in that year and 2013-2014. Therefore, data from earlier years are not comparable.
Additionally, in 2010, the New York State Education Department increased the scale score required to meet each of the proficiency levels; the rates and disparities reported for years 2005-2006 through 2010-2011 were recalculated to reflect the same standards as those required in the 2011-2012 school year.
Education
Individual Indicators | Education
DISPARITY REPORT 14
0100200300400500600700800900
1000
0100200300400500600700800900
1000
Individual Indicators | Education
800
900
1000
700
600
500
400
300
200
100
0
1.0
1.0
0.5
0.5
1.0
1.0
0.5
0.5
1.0
1.0
0.5
0.5
1.0
1.0
0.6
0.5
1.0
1.0
0.5
0.5
1.0
1.0
0.6
0.6
1.0
1.0
0.6
0.6
1.0
1.0
0.4
0.4
1.0
1.0
0.4
0.4
Rat
e pe
r 1,0
00
Disparity Index
2006 2007 2008 2009 2010 2011 2012 2013 2014Exam Year
Source: NYC Department of Education
Females in Grades 3-8: Meeting or Exceeding English StandardsWhite Asian Black Hispanic
Cha
nge
in E
xam
Males in Grades 3-8: Meeting or Exceeding English Standards
800
900
1000
700
600
500
400
300
200
100
0
Rat
e pe
r 1,0
00
Disparity Index1.
0
1.0
0.4
0.4
1.0
1.0
0.4
0.4
1.0
1.0
0.4
0.4
1.0
1.0
0.5
0.5
1.0
1.0
0.5
0.5
1.0
1.0
0.5
0.5
1.0
1.0
0.5
0.5
1.0
1.0
0.3
0.3
1.0
1.0
0.3
0.3
2006 2007 2008 2009 2010 2011 2012 2013 2014Exam Year
Cha
nge
in E
xam
White Asian Black Hispanic

15 DISPARITY REPORT
Individual Indicators | Education
Students in Grades 3-8: Meeting or Exceeding Math Standards
Trends in disparities
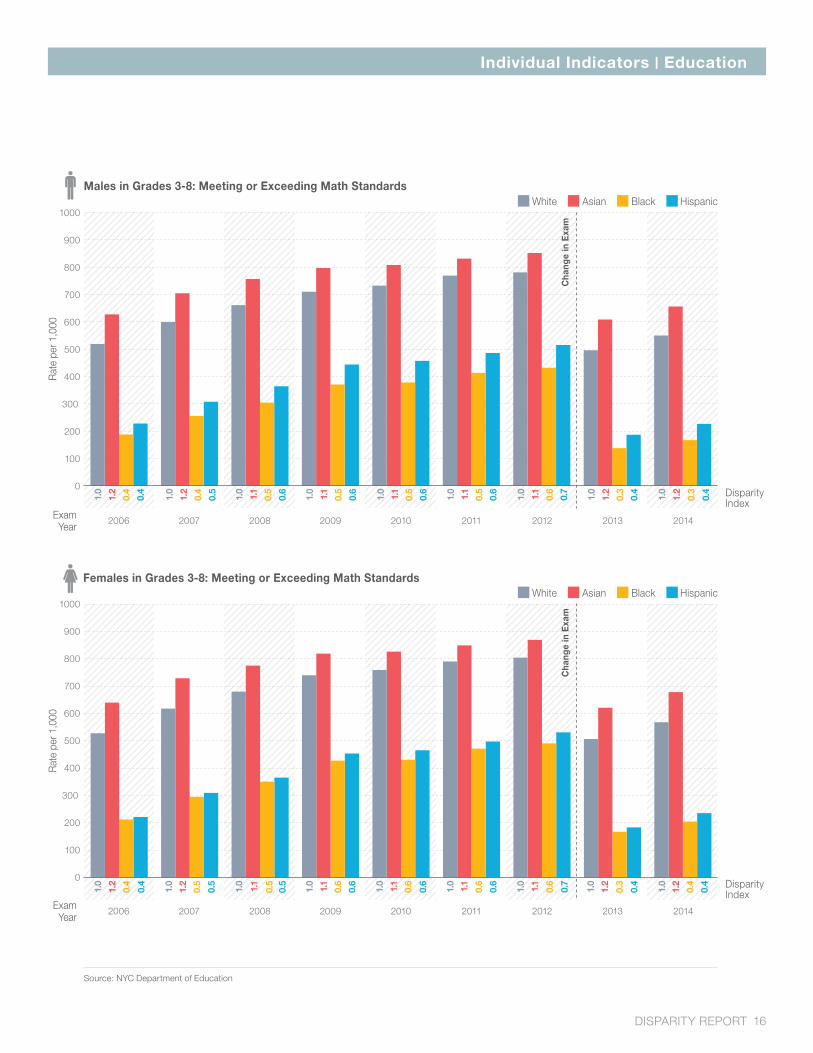
The patterns in disparity indices among racial groups are similar to those found in the English proficiency indicator, with both Black and Hispanic students across genders meeting math standards at a rate that was 30-40% the rate of their White peers in 2014. Asian students of both genders performed better than their White peers with a rate that was 1.2 times higher than the rate of their White peers. Asian females had the highest math proficiency rate with 678 students meeting or exceeding math standards for every 1,000 who took the math exam. Black males had the lowest math proficiency rate with 167 students meeting or exceeding standards for every 1,000 who took the math exam.
Trends in outcome rates
Across all racial groups, females performed slightly better than males. From the 2012-2013 school year to the 2013-2014 school year (the only years that have comparable tests), the math proficiency rate for White males increased 11%, while the rate for Asian males increased 8% and the rates for Black and Hispanic males increased 21%. For females, the rate of English proficiency increased 12%, while the rate for Asian females increased 9%, the rate for Black females increased 22%, and the rate for Hispanic females increased 28%.
Indicator description
The indicator for math proficiency is defined as the number of students in grades 3 through 8 who met proficiency standards (meaning they scored a level three or higher on the yearly administered New York State standardized test) out of all students who took the exam. Content of the tests for math proficiency for students in grades 3 through 8 changed significantly in the 2012-2013 school year; this explains the large drop in students meeting or exceeding English standards in that year and 2013-2014. Therefore, data from earlier years are not comparable.
Additionally, in 2010, the New York State Education Department increased the scale score required to meet each of the proficiency levels; the rates and disparities reported for years 2005-2006 through 2010-2011 were recalculated to reflect the same standards as those required in the 2011-2012 school year.
Education
DISPARITY REPORT 16
Individual Indicators | Education
0
200
400
600
800
1000
800
900
1000
700
600
500
400
300
200
100
0
Rat
e pe
r 1,0
00
1.0
1.2
0.4
0.4
1.0
1.2
0.4
0.5
1.0
1.1
0.5
0.6
1.0
1.1
0.5
0.6
1.0
1.1
0.5
0.6
1.0
1.1
0.5
0.6
1.0
1.1
0.6
0.7
1.0
1.2
0.3
0.4
1.0
1.2
0.3
0.4 Disparity
Index
0
200
400
600
800
1000
800
900
1000
700
600
500
400
300
200
100
0
Rat
e pe
r 1,0
00
Source: NYC Department of Education
1.0
1.2
0.4
0.4
1.0
1.2
0.5
0.5
1.0
1.1
0.5
0.5
1.0
1.1
0.6
0.6
1.0
1.1
0.6
0.6
1.0
1.1
0.6
0.6
1.0
1.1
0.6
0.7
1.0
1.2
0.3
0.4
1.0
1.2
0.4
0.4 Disparity
Index
2006 2007 2008 2009 2010 2011 2012 2013 2014Exam Year
2006 2007 2008 2009 2010 2011 2012 2013 2014Exam Year
Males in Grades 3-8: Meeting or Exceeding Math StandardsWhite Asian Black Hispanic
Females in Grades 3-8: Meeting or Exceeding Math StandardsWhite Asian Black Hispanic
Cha
nge
in E
xam
Cha
nge
in E
xam
17 DISPARITY REPORT
Students in Grade 9: Accumulating More than 10 Credits
Trends in disparities
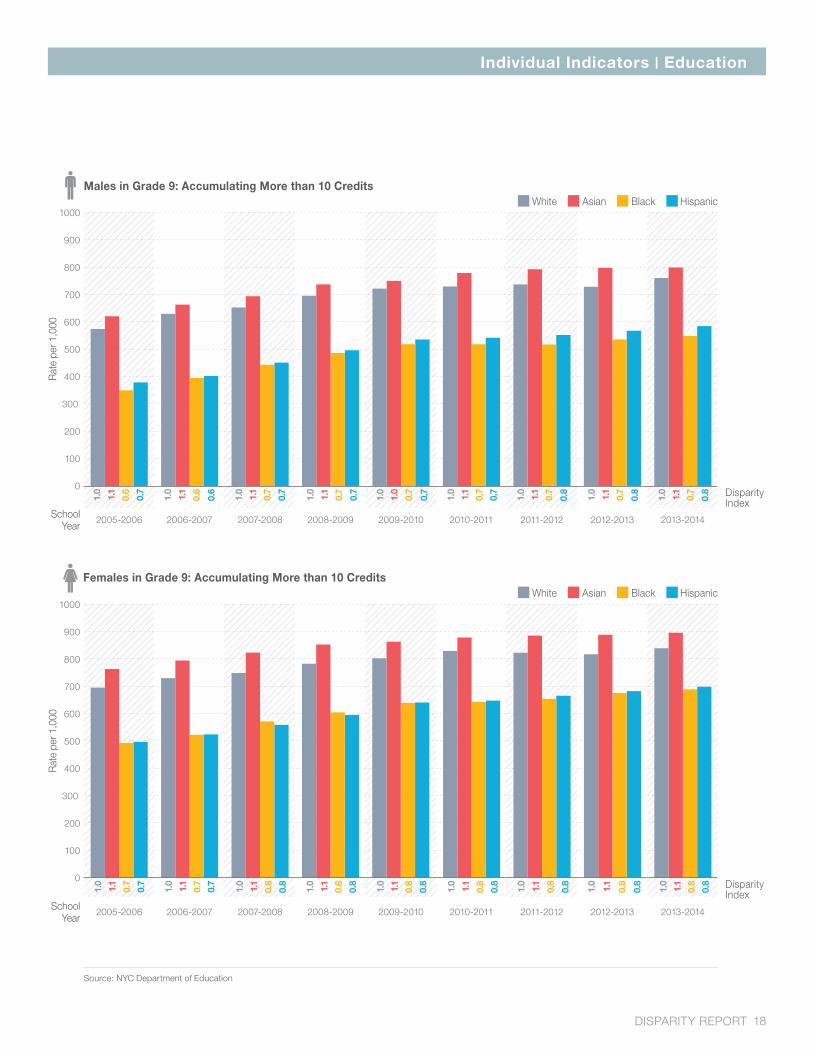
Disparities decreased slightly between White males and Black and Hispanic males. In 2013-2014, rates for Black and Hispanic males were 70%-80% that of their White peers. Asian males consistently had a rate that was 1.1 times higher than their White peers. Disparities between White females and all other race groups remained fairly consistent over time. Black and Hispanic females had rates that were 80% that of their White peers, while Asian females had rates that were 1.1 times higher than their White peers. Asian females had the highest rate of 9th grade students accumulating ten or more credits at 896 per 1,000; Black males had the lowest rate at 549 per 1,000.
Trends in outcome rates
Overall, rates of students in grade 9 who have accumulated more than ten credits increased since the 2005-2006 school year and females had higher rates across all races over the school years. The rate for White males increased 33% from 2005-2006 to 2013-2014, the rate for Asian males increased 29%, the rate for Black males increased 57%, and the rate for Hispanic males increased 54%. The rates for females also increased since 2005-2006; the rates increased 21% for White females, 17% for Asian females, 40% for Black females and 41% for Hispanic females.
Indicator description
The credit accumulation indicator is defined as 9th graders who passed at least 10 academic credits during the school year (through June) out of all 9th graders. In New York City, students must earn 44 credits (as well as pass five Regents Examinations) to graduate; therefore, students who consistently accumulate credits in the appropriate subjects are on track to graduate within four years.
Education
Individual Indicators | Education
DISPARITY REPORT 18
Individual Indicators | Education
0100200300400500600700800900
1000
800
900
1000
700
600
500
400
300
200
100
0
800
900
1000
700
600
500
400
300
200
100
0
Rat
e pe
r 1,0
00
Rat
e pe
r 1,0
00
2005-2006 2006-2007 2007-2008 2008-2009 2009-2010 2010-2011 2011-2012 2012-2013 2013-2014School Year
2005-2006 2006-2007 2007-2008 2008-2009 2009-2010 2010-2011 2011-2012 2012-2013 2013-2014School Year
1.0
1.1
0.6
0.7
1.0
1.1
0.6
0.6
1.0
1.1
0.7
0.7
1.0
1.1
0.7
0.7
1.0
1.0
0.7
0.7
1.0
1.1
0.7
0.7
1.0
1.1
0.7
0.8
1.0
1.1
0.7
0.8
1.0
1.1
0.7
0.8 Disparity
Index
0100200300400500600700800900
1000
1.0
1.1
0.7
0.7
1.0
1.1
0.7
0.7
1.0
1.1
0.8
0.8
1.0
1.1
0.8
0.8
1.0
1.1
0.8
0.8
1.0
1.1
0.8
0.8
1.0
1.1
0.8
0.8
1.0
1.1
0.8
0.8
1.0
1.1
0.8
0.8 Disparity
Index
Source: NYC Department of Education
Males in Grade 9: Accumulating More than 10 CreditsWhite Asian Black Hispanic
Females in Grade 9: Accumulating More than 10 CreditsWhite Asian Black Hispanic
19 DISPARITY REPORT
Trends in disparities
In 2014, Asian males and females graduated at about the same rate as their White peers and this remained fairly constant over time. The graduation rate for Black and Hispanic females and Black males was about 80% that of their White peers. This remained constant for the females since 2008, but was a decrease in disparity for Black males compared to previous years. The graduation rate for Hispanic males was about 70% of their White peers; this remained constant since 2008. Overall, Asian females had the highest graduation rate with 864 graduates for every 1,000 students in their graduation cohort. Hispanic males had the lowest graduation with 573 graduates for every 1,000 students in their graduation cohort.
Trends in outcome rates
Graduation rates for all students increased over time. Female students across all racial groups graduated at higher rates than male students. Since 2008 (the first year with comparable graduation rate calculations to 2014), graduation rates for White and Asian males increased 10%, while graduation rates for Black and Hispanic males increased 22%. The graduation rate for White females increased 6%, while the graduation rate for Asian females increased 3%, the graduation rate for Black females increased 9%, and the graduation rate for Hispanic females increased 11%.
High School Students: Graduating in 4 Years
Indicator description
The graduation indicator is defined as students who graduated within four years out of the grade cohorts determined by the New York State Education Department. Beginning with the graduation class of 2008, these data include August graduates, while earlier graduation years include only those who graduated by June.
Education
Individual Indicators | Education

DISPARITY REPORT 20
Individual Indicators | Education
0100200300400500600700800900
1000
800
900
1000
700
600
500
400
300
200
100
0
Rat
e pe
r 1,0
00
800
900
1000
700
600
500
400
300
200
100
0
Rat
e pe
r 1,0
00
2005 2006 2007 2008 2009 2010 2011 2012 2013 2014Graduation Class
2005 2006 2007 2008 2009 2010 2011 2012 2013 2014Graduation Class
1.0
1.0
0.8
0.7
1.0
1.0
0.7
0.7
1.0
1.1
0.7
0.7
1.0
1.1
0.7
0.7
1.0
1.0
0.7
0.7
1.0
1.1
0.7
0.7
1.0
1.0
0.7
0.7
1.0
1.0
0.6
0.6
1.0
1.0
0.6
0.6
1.0
1.0
0.5
0.5 Disparity
Index
1.0
1.1
0.8
0.8
1.0
1.1
0.8
0.8
1.0
1.0
0.8
0.8
1.0
1.0
0.8
0.8
1.0
1.1
0.8
0.8
1.0
1.1
0.8
0.8
1.0
1.1
0.7
0.7
1.0
1.1
0.8
0.8
1.0
1.0
0.7
0.7
1.0
1.0
0.7
0.6 Disparity
Index0
100200300400500600700800900
1000
Source: NYC Department of Education
High School Males: Graduating in 4 YearsWhite Asian Black Hispanic
High School Females: Graduating in 4 YearsWhite Asian Black Hispanic
21 DISPARITY REPORT
High School Student: Dropouts
Trends in disparities
In 2014, Asian males dropped out of high school at about the same rate as White males, while the dropout rate for Black males was 1.5 times higher than White males and the dropout rate for Hispanic males was 1.9 times higher. These disparities decreased since 2013, but are still higher than disparities in earlier years. The dropout rate for Asian females was 90% that of White females, while the dropout rate for Black females, was 1.7 times higher than White females, and the dropout rate for Hispanic females was 2.3 times higher. These disparities decreased in recent years. Asian females had the lowest dropout rate at 43 dropouts per 1,000 students, while Hispanic males had the highest dropout rate at 137 dropouts for every 1,000 students.
Trends in outcome rates
Dropout rates decreased over time and females consistently had lower dropout rates than their male peers. The dropout rate for White males decreased 42% since 2008 (the first year with comparable graduation rate calculations to 2014), while the dropout rate for Asian males decreased 27%, the dropout rate for Black males decreased 31%, and the dropout rate for Hispanic males decreased 32%. The dropout rate for White females decreased 31%, while the dropout rate for Asian females decreased 10%, the dropout rate for Black females decreased 21%, and the dropout rate for Hispanic females decreased 22%.
Indicator description
This indicator is defined as the number of students who have left the school system without enrolling in another education program that leads to a high school diploma or GED out of the grade cohorts determined by the New York State Education Department.
Education
Individual Indicators | Education

DISPARITY REPORT 22
Individual Indicators | Education
0
50
100
150
200
250
300
350
250
300
350
200
150
100
50
0
Rat
e pe
r 1,0
00
250
300
350
200
150
100
50
0
Rat
e pe
r 1,0
00
2005 2006 2007 2008 2009 2010 2011 2012 2013 2014Graduation Class
0
50
100
150
200
250
300
350
2005 2006 2007 2008 2009 2010 2011 2012 2013 2014Graduation Class
1.0
1.0
1.5
1.9
1.0
1.2
1.7
2.2
1.0
0.8
1.5
1.8
1.0
0.8
1.5
1.8
1.0
0.9
1.5
1.8
1.0
0.8
1.4
1.7
1.0
0.8
1.3
1.7
1.0
0.8
1.2
1.5
1.0
0.9
1.3
1.7
1.0
0.8
1.3
1.5 Disparity
Index
1.0
0.9
1.7
2.3
1.0
0.9
2.1
2.6
1.0
0.7
1.9
2.4
1.0
0.7
1.8
2.3
1.0
0.6
1.7
2.0
1.0
0.6
1.6
2.0
1.0
0.7
1.5
2.1
1.0
0.8
1.5
2.0
1.0
0.9
1.5
1.9
1.0
0.7
1.4
1.7 Disparity
Index
Source: NYC Department of Education
High School Males: DropoutsWhite Asian Black Hispanic
High School Females: DropoutsWhite Asian Black Hispanic

23 DISPARITY REPORT
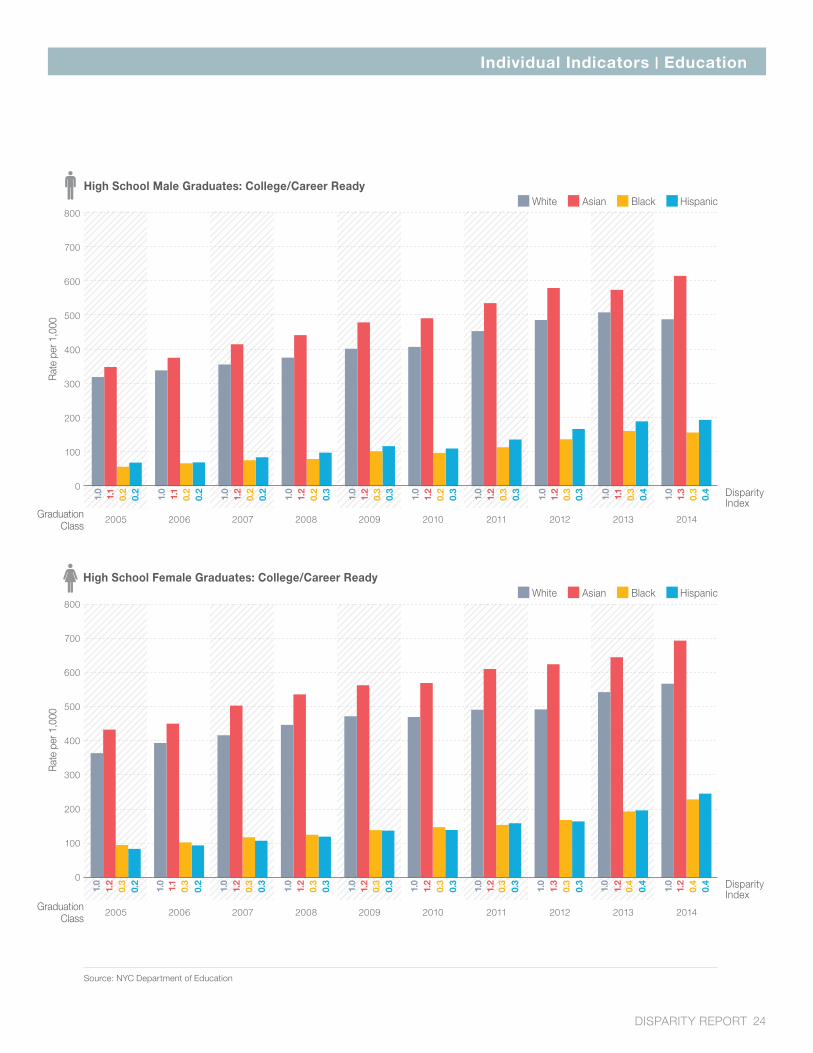
High School Graduates: College/Career Ready
Trends in disparities
The disparities between White students and Black and Hispanic students decreased over time for both genders. In 2014, the rates of college/career readiness for Hispanic males and Black and Hispanic females were about 40% the rate of their White peers, while the rate for Black males was about 30% the rate of their White peers. Asian students continued to have higher rates of college/career readiness compared to their White peers. Asian females had the highest rate of high school graduates who are college/career ready at 693 per 1,000, while Black males had the lowest rate at 156 per 1,000.
Trends in outcome rates
Rates of college/career readiness steadily increased since 2005 for all groups. The rate of college/career readiness increased 53% for White males from 2005 to 2014. The rate for Asian males increased 76%, the rate for Black males increased 177%, and the rate for Hispanic males increased 183%, although the rates for Black and Hispanic males remain low at under 200 students who are college/career ready for every 1,000 students in the cohort. The rate of college/career readiness for White females increased 56% from 2005 to 2014, while for Asian females it increased 60%, for Black females it increased 140%, and for Hispanic females it increased 192%.
Indicator description
This indicator is defined as students who meet the three standards for passing out of remedial coursework at the City University of New York (CUNY) [1. Graduated by August with a diploma; 2. Earned a 75+ on the English Regents or scored 480+ on the Critical Reading SAT or scored a 20+ on the ACT English or scored a 70+ on the CUNY Reading Assessment and a 56+ on the CUNY Writing Assessment; and 3. Scored an 80+ on a math Regents or 70+ on a Common Core Algebra Regents and completed coursework in Algebra II/Trigonometry or higher, or scored 480+ on the math SAT, or scored a 20+ on the ACT Math, or scored a 40+ on the CUNY Math Assessment, or scored an 80+ on the PBAT and completed required coursework]out of students in the 9th grade cohorts. August graduates are always included.
Education
Individual Indicators | Education
DISPARITY REPORT 24
Individual Indicators | Education
0100200300400500600700800
2005 2006 2007 2008 2009 2010 2011 2012 2013 2014Graduation Class
500
600
800
700
400
300
200
100
0
Rat
e pe
r 1,0
00
500
600
800
700
400
300
200
100
0
Rat
e pe
r 1,0
00
2005 2006 2007 2008 2009 2010 2011 2012 2013 2014Graduation Class
Source: NYC Department of Education
1.0
1.3
0.3
0.4
1.0
1.1
0.3
0.4
1.0
1.2
0.3
0.3
1.0
1.2
0.3
0.3
1.0
1.2
0.2
0.3
1.0
1.2
0.3
0.3
1.0
1.2
0.2
0.3
1.0
1.2
0.2
0.2
0.2
0.2
1.1
1.0
1.0
1.1
0.2
0.2 Disparity
Index
1.0
1.2
0.3
0.2
1.0
1.1
0.3
0.2
1.0
1.2
0.3
0.3
1.0
1.2
0.3
0.3
1.0
1.0
1.2
1.2
0.4
0.4
0.4
0.4
1.0
1.3
0.3
0.3
1.2
1.0
0.3
0.3
0.3
0.3
1.2
1.0
0.3
1.0
1.2
0.3 Disparity
Index
High School Male Graduates: College/Career ReadyWhite Asian Black Hispanic
High School Female Graduates: College/Career ReadyWhite Asian Black Hispanic

25 DISPARITY REPORT
Students in Grades 6-8: Absent from School 20+ Days
Trends in disparities
Disparities between White students and Black and Hispanic students increased over time for both males and females. In the 2013-2014 school year, the rate of chronic absenteeism for Black males was 1.8 times higher than for White males, while the rate for Hispanic males was 1.7 times higher than for White males. The rate of chronic absenteeism for Black females was 1.9 times higher than the rate for White females, while the rate for Hispanic females was 1.8 times higher than for White females. For both males and females, Asian students had lower rates of chronic absenteeism with rates that were 40% to 50% that of White students. Overall, Asian females had the lowest rate of chronic absenteeism at 52 per 1,000, while Black males had the highest rate at 243 per 1,000.
Trends in outcome rates
Rates of chronic absenteeism for students in grades 6 through 8 decreased for all groups since the 2005-2006 school year, but increased slightly in recent years. The rate of chronic absenteeism for White males decreased 39% since 2005-2006, while rates of chronic absenteeism for Asian, Black, and Hispanic males decreased 36%, 28%, and 31%, respectively. Similarly, the rate of chronic absenteeism for White and Asian females decreased 37%, while the rates for Black and Hispanic females decreased 26% and 28%, respectively.
Indicator description
This indicator is defined as the number of students who are absent 20 or more days of school in grades 6 through 8 out of the number of active students in grades 6 through 8. Missing 20 or more days is nationally recognized as the definition of “chronically absent.” The total number of school days in NYC varies each year and is about 180 days for grades K through 8.
Education
Individual Indicators | Education

DISPARITY REPORT 26
Individual Indicators | Education
400
350
300
250
200
150
100
50
0
Rat
e pe
r 1,0
00
400
350
300
250
200
150
100
50
0
Rat
e pe
r 1,0
00
2005-2006 2006-2007 2007-2008 2008-2009 2009-2010 2010-2011 2011-2012 2012-2013 2013-2014School Year
2005-2006 2006-2007 2007-2008 2008-2009 2009-2010 2010-2011 2011-2012 2012-2013 2013-2014School Year
1.0
0.5
1.6
1.5
1.0
0.5
1.6
1.6
1.0
0.5
1.5
1.6
1.0
0.5
1.6
1.6
1.0
0.4
1.7
1.6
1.0
0.5
1.8
1.7
1.0
1.8
0.5
1.8
1.0
0.5
1.8
1.7
1.0
0.5
1.8
1.7 Disparity
Index
1.0
0.4
1.6
1.6
1.0
0.4
1.5
1.6
1.0
0.4
1.5
1.6
1.0
0.5
1.6
1.7
1.0
0.4
1.8
1.8
1.0
0.5
1.8
1.8
1.0
1.9
0.4
1.9
1.0
0.4
1.8
1.8
1.0
0.4
1.9
1.8 Disparity
Index
Source: NYC Department of Education
Males in Grades 6-8: Absent from School 20+ DaysWhite Asian Black Hispanic
Females in Grades 6-8: Absent from School 20+ DaysWhite Asian Black Hispanic

27 DISPARITY REPORT
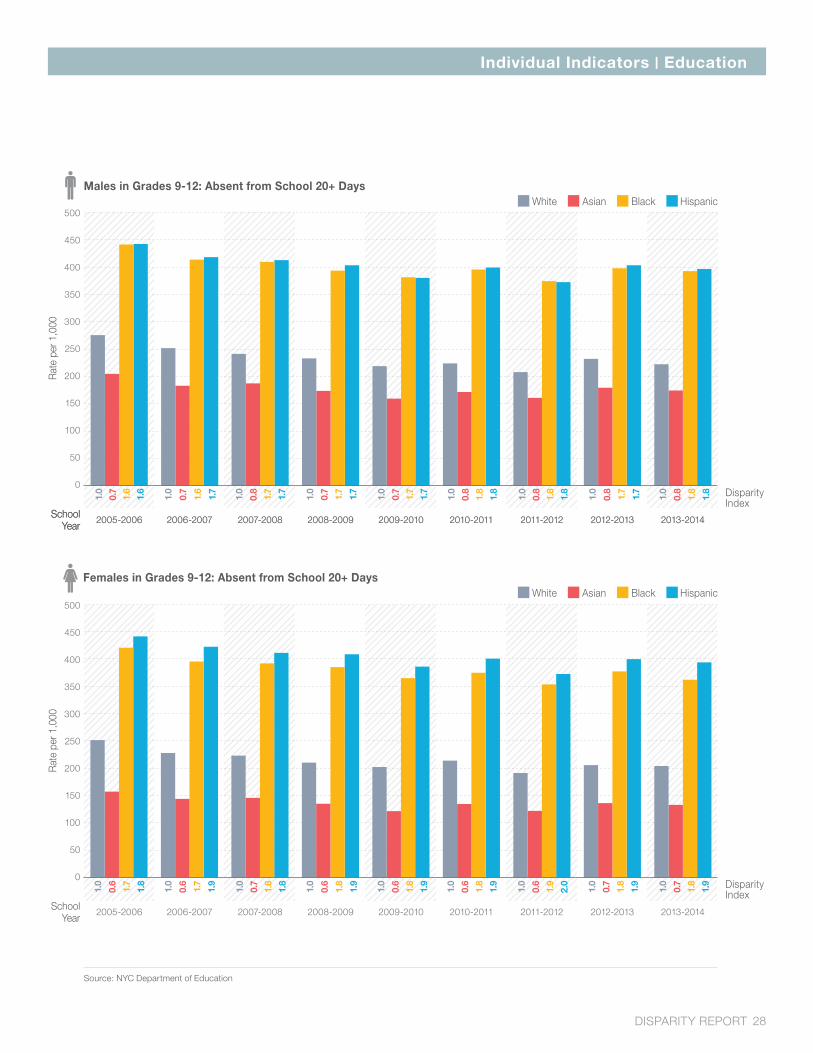
Trends in disparities
The disparities increased slightly for Black and Hispanic males and fluctuated only slightly for Black and Hispanic females. The rates of chronic absenteeism for Black females and males and Hispanic males were 1.8 times higher than the rates of their White peers in the 2013-2014 school year. The rate for Hispanic females was 1.9 times higher than the rate for White females. The disparities for Asian students fluctuated slightly over time; in the 2013-2014 school year, the rate of chronic absenteeism for Asian males was 80% that of White males, while the rate for Asian females was 70% that of White females. Overall, Asian females had the lowest rate of chronic absenteeism at 133 per 1,000, while Hispanic males had the highest rate at 397 per 1,000.
Trends in outcome rates
Rates of chronic absenteeism also decreased since 2005-2006 for students in grades 9 through 12, although to a lesser extent than in the middle school grades. The rate for White males decreased 19%, while the rate for Asian males decreased 15%. Rates for Black and Hispanic males decreased 11% and 10%, respectively. The rate for White females decreased 19%, while the rate for Asian females decreased 15%, the rate for Black females decreased 14%, and the rate for Hispanic females decreased 11%.
Students in Grades 9-12: Absent from School 20+ Days
Indicator description
This indicator is defined as the number of students who are absent 20 or more days of school in grades 9 through 12 out of the number of active students in grades 9 through 12. Missing 20 or more days is nationally recognized as the definition of “chronically absent.” The total number of school days in NYC varies each year and is about 170 days for grades 9 through 12.
Education
Individual Indicators | Education
DISPARITY REPORT 28
Individual Indicators | Education
2005-2006 2006-2007 2007-2008 2008-2009 2009-2010 2010-2011 2011-2012 2012-2013 2013-2014School Year
1.0
0.7
1.6
1.6
1.0
0.7
1.6
1.7
1.0
0.8
1.7
1.7
1.0
0.7
1.7
1.7
1.0
0.7
1.7
1.7
1.0
0.8
1.8
1.8
1.0
1.8
0.8
1.8
1.0
0.8
1.7
1.7
1.0
0.8
1.8
1.8 Disparity
Index
500
350
400
450
300
250
200
150
100
50
0
Rat
e pe
r 1,0
00
500
350
400
450
300
250
200
150
100
50
0
Rat
e pe
r 1,0
00
2005-2006 2006-2007 2007-2008 2008-2009 2009-2010 2010-2011 2011-2012 2012-2013 2013-2014School Year
2005-2006 2006-2007 2007-2008 2008-2009 2009-2010 2010-2011 2011-2012 2012-2013 2013-2014School Year
050
100150200250300350400450500
Source: NYC Department of Education
1.0
0.6
1.7
1.8
1.0
0.6
1.7
1.9
1.0
0.7
1.8
1.8
1.0
0.6
1.8
1.9
1.0
0.6
1.8
1.9
1.0
0.6
1.8
1.9
1.0
1.9
0.6
2.0
1.0
0.7
1.8
1.9
1.0
0.7
1.8
1.9 Disparity
Index
Males in Grades 9-12: Absent from School 20+ DaysWhite Asian Black Hispanic
Females in Grades 9-12: Absent from School 20+ DaysWhite Asian Black Hispanic

29 DISPARITY REPORT
Trends in disparities
The disparity between White males and Black males increased slightly since 2005-2006; the rate of Black males was 2.2 times higher than the rate for White males in the 2013-2014 school year. The disparity for Hispanic males has remained somewhat constant over time at 1.4 times higher than the rate of White males. The rate for Asian males was 60% that of White males. Disparities for Black and Hispanic females increased. The rate for Black females in the 2013-2014 school year was 5.8 times higher than the rate for White females and the rate for Hispanic females was 3.3 times higher. The rate for Asian females was still lower than the rate for White females, although the difference between them decreased over time. Black males had the highest rate of students who were suspended once in grades 6 through 8 at 75 per 1,000 and Asian females had the lowest rate at 5 per 1,000.
Trends in outcome rates
The rate of students in grades 6 through 8 with one suspension decreased from the 2005-2006 school year for White, Black, and Hispanic males, 14%, 4%, and 10%, respectively. The rate for Asian males increased 12%, although it was still the lowest rate among males. Rates of suspension for females are lower overall than those of males. Rates increased for all females except White females; the rate for Asian females increased 25%, the rate for Black females increased 20%, and the rate for Hispanic females increased 12%, while the rate for White females decreased 37%.
Students in Grades 6-8: Suspended Once (Principal and Superintendent)
Indicator description
This indicator is defined as the number of students in grades 6 through 8 who received either one principal or one superintendent suspension out of the number of active students in grades 6 through 8. The NYC Department of Education has two different kinds of suspensions—principal suspension and superintendent suspension. A principal suspension can last between one and five school days and is served in the student’s home school. A superintendent suspension can be served in an alternative educational setting and is between six days and one year.
Education
Individual Indicators | EducationIndividual Indicators | Education

DISPARITY REPORT 30
Individual Indicators | EducationIndividual Indicators | Education
100
70
80
90
60
50
40
30
20
10
0
Rat
e pe
r 1,0
00
100
70
80
90
60
50
40
30
20
10
0
Rat
e pe
r 1,0
00
2005-2006 2006-2007 2007-2008 2008-2009 2009-2010 2010-2011 2011-2012 2012-2013 2013-2014School Year
1.0
0.5
1.9
1.4
1.0
0.6
1.8
1.3
1.0
0.6
1.7
1.2
1.0
0.7
1.7
1.2
1.0
0.7
1.9
1.5
1.0
0.8
2.0
1.4
1.0
2.0
0.7
1.4
1.0
0.7
2.0
1.4
1.0
0.6
2.2
1.4 Disparity
Index
Source: NYC Department of Education
2005-2006 2006-2007 2007-2008 2008-2009 2009-2010 2010-2011 2011-2012 2012-2013 2013-2014School Year
1.0
0.3
3.0
1.8
1.0
0.5
3.4
2.1
1.0
0.5
3.1
2.1
1.0
0.4
3.2
2.1
1.0
0.5
3.6
2.4
1.0
0.5
3.5
2.2
1.0
4.5
0.5
2.7
1.0
0.7
5.6
3.2
1.0
0.7
5.8
3.3 Disparity
Index
Males in Grades 6-8: Suspended Once (Principal and Superintendent)White Asian Black Hispanic
Females in Grades 6-8: Suspended Once (Principal and Superintendent)White Asian Black Hispanic

31 DISPARITY REPORT
Individual Indicators | Education
Trends in disparities
The disparities between Black and Hispanic males and White males increased since 2005-2006. In 2013-2014, the rate for Black males was 3.4 times higher than the rate for White males and the rate for Hispanic males was 1.8 times higher. The disparity between White and Asian males decreased; the rate for Asian males was 40% that of White males. Disparities increased between White females and Black and Hispanic females. In 2013-2014, the rate for Black females was 7.9 times higher than the rate for White females and the rate for Hispanic females was 2.9 times higher than the rate for Hispanic females. Overall, Asian females had the lowest rate at 1 per 1,000 and Black males had the highest rate at 43 per 1,000.
Trends in outcome rates
Since 2005-2006, the rate of students in grades 6 through 8 who were suspended two or more times increased for Black, Hispanic, and Asian males, but decreased for White males. The rate for White males decreased 20%, while the rate for Black, Hispanic, and Asian males increased 25%, 7%, and 1%, respectively. However, rates for all males decreased compared to 2011-2012. The rate for White females decreased from 2005-2006 to 2013-2014, while rates for Black, Hispanic, and Asian females increased 69%, 19%, and 61%, respectively.
Students in Grades 6-8: Suspended 2+ Times (Principal and Superintendent)
Indicator description
This indicator is defined as the number of students in grades 6 through 8 who received multiple principal and/or superintendent suspensions out of the number of active students in grades 6 through 8. The NYC Department of Education has two different kinds of suspensions—principal suspension and superintendent suspension. A principal suspension can last between one and five school days and is served in the student’s home school. A superintendent suspension can be served in an alternative educational setting and is between six days and one year.
Education

DISPARITY REPORT 32
Individual Indicators | Education
100
70
80
90
60
50
40
30
20
10
0
Rat
e pe
r 1,0
00
2005-2006 2006-2007 2007-2008 2008-2009 2009-2010 2010-2011 2011-2012 2012-2013 2013-2014School Year
1.0
0.3
2.2
1.3
1.0
0.3
2.0
1.3
1.0
0.4
2.4
1.6
1.0
0.4
2.3
1.4
1.0
0.4
2.6
1.6
1.0
0.4
2.8
1.7
1.0
2.8
0.4
1.6
1.0
0.5
2.9
1.7
1.0
0.4
3.4
1.8 Disparity
Index
100
70
80
90
60
50
40
30
20
10
0
Rat
e pe
r 1,0
00
2005-2006 2006-2007 2007-2008 2008-2009 2009-2010 2010-2011 2011-2012 2012-2013 2013-2014School Year
1.0
0.2
4.2
2.2
1.0
0.2
3.2
1.6
1.0
0.2
5.3
2.6
1.0
0.2
3.4
1.8
1.0
0.2
4.5
2.1
1.0
0.4
6.6
3.4
1.0
6.8
0.3
3.2
1.0
0.4
10.9 4.7
1.0
0.4
7.9
2.9 Disparity
Index
Source: NYC Department of Education
Males in Grades 6-8: Suspended 2+ Times (Principal and Superintendent)White Asian Black Hispanic
Females in Grades 6-8: Suspended 2+ Times (Principal and Superintendent)White Asian Black Hispanic

33 DISPARITY REPORT
Individual Indicators | Education
Students in Grades 9-12: Suspended Once (Principal and Superintendent)
Trends in disparities
The disparity between White males and Black males increased slightly since 2005-2006, while the disparity between White males and Hispanic males decreased slightly over this time period. In the 2013-2014 school year, the rate for Black males was 2.4 times higher than the rate for White males. The rate for Hispanic males was 1.5 times higher than the rate for White males. The decrease in the rate for Asian males caused the disparity with White males to increase; their rate was 50% that of White males. The disparities between White females and Black and Hispanic females increased somewhat; in 2013-2014, the rates for Black females and Hispanic females were 4.5 and 2.4 times higher than the rate for White females. The rate for Asian females, 5 per 1,000, was the lowest of all groups at 40% the rate of White females. Black males had the highest rate at 80 per 1,000.
Trends in outcome rates
Overall, the rates of students in grades 9 through 12 with one suspension were lower for females than the rates for males. While the rates for Asian and Hispanic males decreased (18% and 11%, respectively) since 2005-2006, the rates for White and Black males increased 4% and 8%. The rate for Asian females decreased 33% from the 2005-2006 school year to the 2013-2014 school year and the rates for White, Black, and Hispanic females increased 1%, 18%, and 4%.
Indicator description
This indicator is defined as the number of students in grades 9 through 12 who received either one principal or one superintendent suspension out of the number of active students in grades 9 through 12. The NYC Department of Education has two different kinds of suspensions—principal suspension and superintendent suspension. A principal suspension can last between one and five school days and is served in the student’s home school. A superintendent suspension can be served in an alternative educational setting and is between six days and one year.
Education

DISPARITY REPORT 34
Individual Indicators | Education
100
70
80
90
60
50
40
30
20
10
0
Rat
e pe
r 1,0
00
2005-2006 2006-2007 2007-2008 2008-2009 2009-2010 2010-2011 2011-2012 2012-2013 2013-2014School Year
1.0
0.6
2.3
1.7
1.0
0.6
2.1
1.5
1.0
0.6
1.9
1.4
1.0
0.6
2.1
1.5
1.0
0.5
2.2
1.5
1.0
0.5
2.1
1.5
1.0
2.2
0.5
1.4
1.0
0.5
2.4
1.5
1.0
0.5
2.4
1.5 Disparity
Index
100
70
80
90
60
50
40
30
20
10
0
Rat
e pe
r 1,0
00
2005-2006 2006-2007 2007-2008 2008-2009 2009-2010 2010-2011 2011-2012 2012-2013 2013-2014School Year
1.0
0.6
3.9
2.3
1.0
0.4
3.3
1.9
1.0
0.5
3.2
1.4
1.0
0.6
3.6
2.0
1.0
0.4
3.2
1.7
1.0
0.4
3.5
2.1
1.0
3.3
0.4
1.8
1.0
0.4
4.1
2.1
1.0
0.4
4.5
2.4 Disparity
Index
Source: NYC Department of Education
Males in Grades 9-12: Suspended Once (Principal and Superintendent)White Asian Black Hispanic
Females in Grades 9-12: Suspended Once (Principal and Superintendent)White Asian Black Hispanic

35 DISPARITY REPORT
Individual Indicators | Education
Students in Grades 9-12: Suspended 2+ Times (Principal and Superintendent)
Trends in disparities
Disparities increased over time for Black and Hispanic males. In the 2013-2014 school year, the rate for Black males was 4.5 times higher than White males, while the rate for Hispanic males was 2.2 times higher. The disparity between White and Asian males decreased slightly; the rate for Asian males was 50% that of White males. Disparities also increased for Black females and stayed the same for Hispanic females; the rates for Black and Hispanic females were 6.6 and 2.5 times higher than the rates for White females. The rate for Asian females was the lowest of all groups at 1 per 1,000. Black males had the highest rate at 20 per 1,000.
Trends in outcome rates
For all races, the rate of students in grades 9 through 12 who were suspended two or more times increased for male students. The rate for White males increased 20%, while the rates for Asian, Black, and Hispanic students increased 48%, 44%, and 26%, respectively. For females, the rate increased for all races, except Asian females whose rate decreased 19%. The rate for White, Black, and Hispanic females increased 61%, 70%, and 64%, respectively.
Indicator description
This indicator is defined as the number of students in grades 9 through 12 who received multiple principal and/or superintendent suspensions out of the number of active students in grades 9 through 12. The NYC Department of Education has two different kinds of suspensions—principal suspension and superintendent suspension. A principal suspension can last between one and five school days and is served in the student’s home school. A superintendent suspension can be served in an alternative educational setting and is between six days and one year.
Education

DISPARITY REPORT 36
Individual Indicators | Education
100
70
80
90
60
50
40
30
20
10
0
Rat
e pe
r 1,0
00
2005-2006 2006-2007 2007-2008 2008-2009 2009-2010 2010-2011 2011-2012 2012-2013 2013-2014School Year
1.0
0.4
3.8
2.1
1.0
0.4
3.6
2.0
1.0
0.5
3.7
2.1
1.0
0.4
3.5
1.8
1.0
0.4
3.6
1.9
1.0
0.4
3.2
1.7
1.0
3.3
0.3
1.7
1.0
0.3
4.0
1.9
1.0
0.5
4.5
2.2 Disparity
Index
100
70
80
90
60
50
40
30
20
10
0
Rat
e pe
r 1,0
00
2005-2006 2006-2007 2007-2008 2008-2009 2009-2010 2010-2011 2011-2012 2012-2013 2013-2014School Year
1.0
0.4
6.3
2.5
1.0
0.3
5.1
2.1
1.0
0.3
5.3
2.1
1.0
0.4
6.4
2.4
1.0
0.3
5.5
1.8
1.0
0.3
4.8
2.0
1.0
6.0
0.2
2.5
1.0
0.3
9.5
3.6
1.0
0.2
6.6
2.5 Disparity
Index
Source: NYC Department of Education
Males in Grades 9-12: Suspended 2+ Times (Principal and Superintendent)White Asian Black Hispanic
Females in Grades 9-12: Suspended 2+ Times (Principal and Superintendent)White Asian Black Hispanic

37 DISPARITY REPORT
Individual Indicators | Economic Security and Mobility
Children Under Age 18: In Poverty (Official Measure)
Trends in disparities
Disparities between White children and Black and Hispanic children decreased since 2005; the rate for Black children was 1.5 times higher than the rate for White children in 2013, while the rate for Hispanic children was 1.7 times higher. The disparity index remained the same for Asian children with a rate that was 1.2 times higher than the rate for White children. Overall, White children had the lowest poverty rate with 223 children living in poverty for every 1,000 children, while Hispanic children had the highest poverty rate with 389 children living in poverty for every 1,000 children.
Trends in outcome rates
According to the official poverty measure, since 2005, rates for children in poverty increased for White, Asian, and Black children (19%, 15%, and 11%, respectively), but decreased slightly (1%) for Hispanic children.
Indicator description
This indicator is defined as the number of children (under age 18) whose family’s income was below the federal poverty line in the last 12 months out of the total number of children under the age of 18. In New York City, child poverty rates are calculated using two different measures, the official poverty measure and the CEO alternative measure. The official poverty rate is calculated using data from the Census Bureau, which bases its definition of poverty on a defined threshold of income accounting for number of children and family size.
Economic Security and Mobility
250
300
350
400
450
200
150
100
50
0
Rat
e pe
r 1,0
00
Year 2005 2006 2007 2008 2009 2010 201320122011
1.0
1.2
1.6
2.1
1.0
0.2
1.6
1.9
1.0
1.0
1.4
1.8
1.0
1.2
1.5
1.8
1.0
1.1
1.5
1.9
1.0
1.1
1.4
1.7
1.0
1.4
1.0
1.8
1.0
1.2
1.4
1.7
1.0
1.2
1.5
1.7 Disparity
Index
Children Under Age 18: In Poverty (Official Measure)White Asian Black Hispanic
Source: American Community Survey, Census Bureau’s American Factfinder, 2005-2013, as augmented by HRA and CIDI
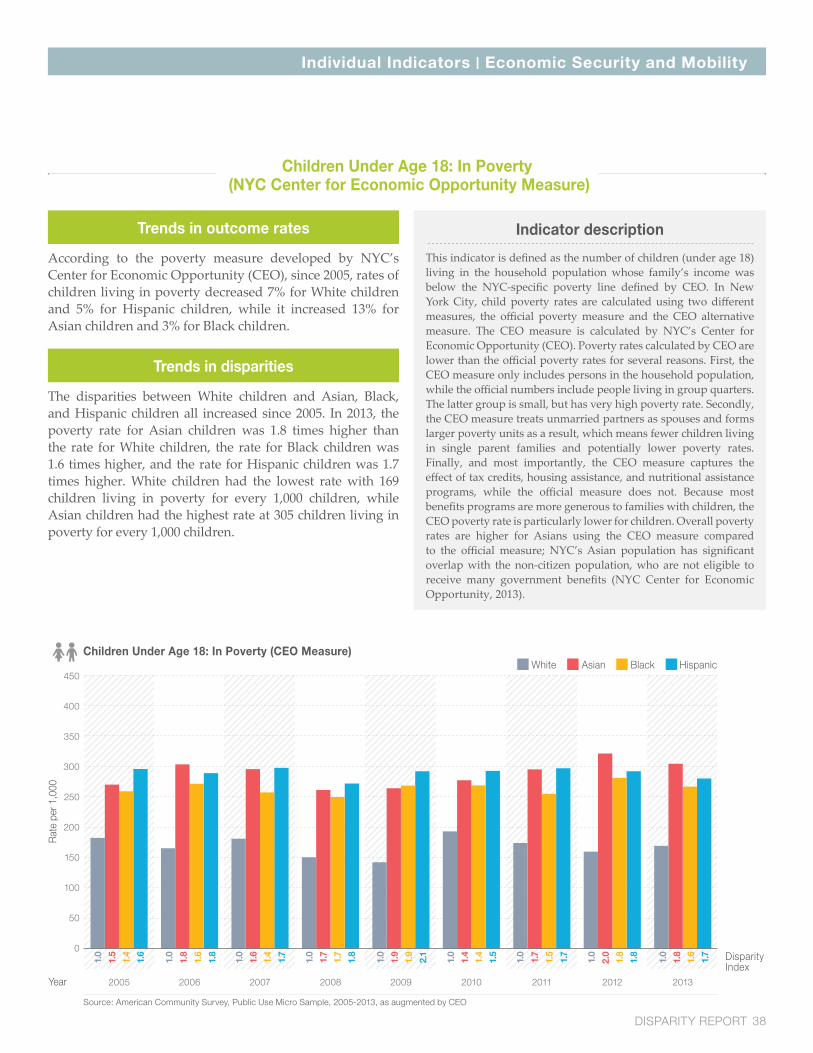
DISPARITY REPORT 38
Individual Indicators | Economic Security and Mobility
Trends in disparities
The disparities between White children and Asian, Black, and Hispanic children all increased since 2005. In 2013, the poverty rate for Asian children was 1.8 times higher than the rate for White children, the rate for Black children was 1.6 times higher, and the rate for Hispanic children was 1.7 times higher. White children had the lowest rate with 169 children living in poverty for every 1,000 children, while Asian children had the highest rate at 305 children living in poverty for every 1,000 children.
Trends in outcome rates
According to the poverty measure developed by NYC’s Center for Economic Opportunity (CEO), since 2005, rates of children living in poverty decreased 7% for White children and 5% for Hispanic children, while it increased 13% for Asian children and 3% for Black children.
Children Under Age 18: In Poverty (NYC Center for Economic Opportunity Measure)
Indicator description
This indicator is defined as the number of children (under age 18) living in the household population whose family’s income was below the NYC-specific poverty line defined by CEO. In New York City, child poverty rates are calculated using two different measures, the official poverty measure and the CEO alternative measure. The CEO measure is calculated by NYC’s Center for Economic Opportunity (CEO). Poverty rates calculated by CEO are lower than the official poverty rates for several reasons. First, the CEO measure only includes persons in the household population, while the official numbers include people living in group quarters. The latter group is small, but has very high poverty rate. Secondly, the CEO measure treats unmarried partners as spouses and forms larger poverty units as a result, which means fewer children living in single parent families and potentially lower poverty rates. Finally, and most importantly, the CEO measure captures the effect of tax credits, housing assistance, and nutritional assistance programs, while the official measure does not. Because most benefits programs are more generous to families with children, the CEO poverty rate is particularly lower for children. Overall poverty rates are higher for Asians using the CEO measure compared to the official measure; NYC’s Asian population has significant overlap with the non-citizen population, who are not eligible to receive many government benefits (NYC Center for Economic Opportunity, 2013).
Children Under Age 18: In Poverty (CEO Measure)White Asian Black Hispanic
Rat
e pe
r 1,0
00
250
300
350
400
450
200
150
100
50
0
1.0
1.5
1.4
1.6
1.0
1.8
1.6
1.8
1.0
1.6
1.4
1.7
1.0
1.7
1.7
1.8
1.0
1.9
1.9
2.1
1.0
1.4
1.4
1.5
1.0
1.5
1.7
1.7
1.0
2.0
1.8
1.8
1.0
1.8
1.6
1.7 Disparity
IndexYear 2005 2006 2007 2008 2009 2010 201320122011
Source: American Community Survey, Public Use Micro Sample, 2005-2013, as augmented by CEO
39 DISPARITY REPORT
Economic Security and Mobility
Out-of-School Individuals Aged 16-24: Unemployed
Trends in disparities
Disparities decreased from 2005-2007 to 2010-2012 for Black and Hispanic males and females and Asian females. Disparity increased for Asian males. In 2010-2012, Asian and Hispanic males were unemployed at a rate that was 1.1 times higher than the rate for White males and Black males were unemployed at a rate that was 1.6 times the rate of White males. Black and Hispanic females were unemployed at 2.3 and 2.0 times the rate of White females. Asian females were unemployed at a rate that was 90% the rate of White females. Black males had the highest rate of individuals who were out-of-school and unemployed at 226 per 1,000 while Asian females had the lowest rate at 72 per 1,000.
Trends in outcome rates
Rates of unemployment for individuals aged 16 to 24 years who were not in school increased for all groups from 2005-2007 to 2010-2012. The rates for White, Asian, Black, and Hispanic males increased 43%, 63%, 16%, and 31%, while the rates for White, Asian, Black, and Hispanic females increased 56%, 19%, 30%, and 26%.
Indicator description
This indicator is defined as individuals aged 16-24 years who are not currently attending school and are currently unemployed but looking for work out of all individuals aged 16-24 who are not in school. In order to conduct robust analyses of subgroups within the American Community Survey (ACS) sample, it is preferable to pool more than one year of data, which also discounts year-to-year fluctuations. Therefore, for employment indicators, CIDI utilized the ACS 3-year estimates. Because ACS data is collected via a survey, data are based on a sample and are subject to sampling variability and nonsampling error. Additionally, estimates from the 2000 Census data are included to extend the comparison time period.
Individual Indicators | Economic Security and Mobility

DISPARITY REPORT 40
Individual Indicators | Economic Security and Mobility
300
250
200
150
100
50
0
Rat
e pe
r 1,0
00
300
250
200
150
100
50
0
Rat
e pe
r 1,0
00
2000 2005-2007 2006-2008 2007-2009 2008-2010 2009-2011 2010-2012Years
1.0
1.0
2.5
1.7
1.0
1.0
2.0
1.2
1.0
0.8
2.1
1.4
1.0
0.9
2.2
1.8
1.0
1.2
1.8
1.4
1.0
1.0
1.5
1.2
1.0
1.6
1.1
1.1 Disparity
Index
2000 2005-2007 2006-2008 2007-2009 2008-2010 2009-2011 2010-2012Years
1.0
1.2
3.2
2.3
1.0
1.2
2.8
2.5
1.0
0.9
2.5
2.1
1.0
0.6
2.5
1.9
1.0
1.0
2.1
1.7
1.0
0.9
2.3
1.9
1.0
2.3
0.9
2.0 Disparity
Index
Source: American Community Survey via: Steven Ruggles, Katie Genadek, Ronald Goeken, Josiah Grover, and Matthew Sobek. Integrated Public Use Microdata Series: Version 6.0 [Machine-readable database]. Minneapolis: University of Minnesota, 2015
Out-of-School Males Aged 16-24: UnemployedWhite Asian Black Hispanic
Out-of-School Females Aged 16-24: UnemployedWhite Asian Black Hispanic

41 DISPARITY REPORT
Economic Security and Mobility
Trends in disparities
Disparities increased for females of all races since 2005-2007. In 2010-2012, the rate for Asian females was 1.5 times higher than the rate of White females, for Black females it was 1.9 times higher, and for Hispanic females it was 2.0 times higher. Disparities also increased for Hispanic males who had a rate that was 1.2 times higher than White males. Asian males had about the same rate as White males. The disparity for Black males decreased from 2005-2007, but was still 1.7 times higher than the rate of White males. White females had the lowest rate of out-of-school individuals who were not in the labor force at 187 per 1,000, while Black males had the highest rate at 378 per 1,000.
Trends in outcome rates
Overall, rates of individuals aged 16 to 24 years who were out of school and not in the labor force increased for males of all races. The rate for White males increased 21%, for Asian males increased 2%, for Black males increased 4%, and for Hispanic males increased 33%. Rates of females aged 16 to 24 who were not in school and not in the labor force decreased for White, Asian, and Hispanic females 12%, 9%, and 11%, respectively. The rate increased 1% for Black females.
Out-of-School Individuals Aged 16-24: Out of Labor Force
Indicator description
This indicator is defined as individuals aged 16-24 years who are not currently attending school and are no longer actively looking for work out of all individuals aged 16-24 who are not in school. In order to conduct robust analyses of subgroups within the American Community Survey (ACS) sample, it is preferable to pool more than one year of data, which also discounts year-to-year fluctuations. Therefore, for employment indicators, CIDI utilized the ACS 3-year estimates. Because ACS data is collected via a survey, data are based on a sample and are subject to sampling variability and nonsampling error. Additionally, estimates from the 2000 Census data are included to extend the comparison time period.
Individual Indicators | Economic Security and Mobility

DISPARITY REPORT 42
Individual Indicators | Economic Security and Mobility
500
350
400
450
300
250
200
150
100
50
0
Rat
e pe
r 1,0
00
500
350
400
450
300
250
200
150
100
50
0
Rat
e pe
r 1,0
00
2000 2005-2007 2006-2008 2007-2009 2008-2010 2009-2011 2010-2012Years
1.0
1.2
2.0
1.6
1.0
1.2
2.0
1.1
1.0
1.2
1.9
1.1
1.0
1.4
2.2
1.4
1.0
1.3
2.1
1.4
1.0
1.2
2.0
1.4
1.0
1.7
1.0
1.2 Disparity
Index
2000 2005-2007 2006-2008 2007-2009 2008-2010 2009-2011 2010-2012Years
1.0
1.6
1.4
1.7
1.0
1.4
1.7
1.9
1.0
1.6
1.7
1.9
1.0
1.7
1.8
2.1
1.0
2.0
2.0
2.4
1.0
1.8
1.9
2.2
1.0
1.9
1.5
2.0 Disparity
Index
Source: American Community Survey via: Steven Ruggles, Katie Genadek, Ronald Goeken, Josiah Grover, and Matthew Sobek. Integrated Public Use Microdata Series: Version 6.0 [Machine-readable database]. Minneapolis: University of Minnesota, 2015
Out-of-School Males Aged 16-24: Out of Labor ForceWhite Asian Black Hispanic
Out-of-School Females Aged 16-24: Out of Labor ForceWhite Asian Black Hispanic

43 DISPARITY REPORT
Economic Security and Mobility
Out-of-School Individuals Aged 16-24 Employed
Trends in disparities
Disparities for all groups stayed about the same over time. In 2010-2012, Asian males had about the same rate as White males, Hispanic males and Asian females had rates that were about 90% the rate of their White peers. Black males, and Black and Hispanic females had rates that were about 60% of their White peers. White females had the highest rate of individuals who were out of school and employed at 735 per 1,000 and Black males had the lowest rate at 396 per 1,000.
Trends in outcome rates
Rates of out-of-school individuals who were employed decreased for males of all races. For White males, the rate decreased 11%; for Asian and Black males, the rate decreased 10%; and for Hispanic males, the rate decreased 15%. The rate for White females stayed the same over time, while the rate for Asian and Hispanic females increased 2% and 3%, respectively, and the rate for Black females decreased 9%.
Indicator description
This indicator is defined as individuals aged 16-24 years who are not currently attending school and are currently employed out of all individuals aged 16-24 who are not in school. In order to conduct robust analyses of subgroups within the American Community Survey (ACS) sample, it is preferable to pool more than one year of data, which also discounts year-to-year fluctuations. Therefore, for employment indicators, CIDI utilized the ACS 3-year estimates. Because ACS data is collected via a survey, data are based on a sample and are subject to sampling variability and nonsampling error. Additionally, estimates from the 2000 Census data are included to extend the comparison time period.
Individual Indicators | Economic Security and Mobility

DISPARITY REPORT 44
Individual Indicators | Economic Security and Mobility
500
600
800
700
400
300
200
100
0
Rat
e pe
r 1,0
00
500
600
800
700
400
300
200
100
0
Rat
e pe
r 1,0
00
2000 2005-2007 2006-2008 2007-2009 2008-2010 2009-2011 2010-2012Years
1.0
1.0
0.6
0.8
1.0
0.9
0.6
0.9
1.0
1.0
0.6
0.9
1.0
0.9
0.6
0.8
1.0
0.9
0.6
0.8
1.0
0.9
0.6
0.9
1.0
0.6
1.0
0.9 Disparity
Index
2000 2005-2007 2006-2008 2007-2009 2008-2010 2009-2011 2010-2012Years
1.0
0.8
0.6
0.6
1.0
0.9
0.7
0.6
1.0
0.8
0.7
0.7
1.0
0.8
0.7
0.6
1.0
0.8
0.7
0.6
1.0
0.8
0.6
0.6
1.0
0.6
0.9
0.6 Disparity
Index
Source: American Community Survey via: Steven Ruggles, Katie Genadek, Ronald Goeken, Josiah Grover, and Matthew Sobek. Integrated Public Use Microdata Series: Version 6.0 [Machine-readable database]. Minneapolis: University of Minnesota, 2015
Out-of-School Males Aged 16-24: EmployedWhite Asian Black Hispanic
Out-of-School Females Aged 16-24: EmployedWhite Asian Black Hispanic
45 DISPARITY REPORT
Economic Security and Mobility
Individuals Aged 16-24: In School or Employed
Trends in disparities
Disparities stayed relatively constant over time. In 2010-2012, White and Asian males and females had similar rates and Black and Hispanic males and females were employed or in school at rates that were about 90% of their White peers. Asian females had the highest rate with 907 individuals who were employed or in school for every 1,000 individuals between 16 and 24 years old. Black males had the lowest rate at 746 per 1,000.
Trends in outcome rates
The rates of males aged 16 to 24 who are employed or in school decreased for all race groups. For White males, the rate decreased 4%; for Asian males, the rate decreased 1%; for Black males, the rate decreased 2%; and for Hispanic males, the rate decreased 5%. The rate remained unchanged for Asian females, increased 3% for Hispanic females, and decreased 2% and 4% for White and Black females.
Indicator description
This indicator is defined as individuals aged 16-24 years who are currently attending school or are employed (including those who are doing either activity as well as those who are doing both) out of all individuals aged 16-24. In order to conduct robust analyses of subgroups within the American Community Survey (ACS) sample, it is preferable to pool more than one year of data, which also discounts year-to-year fluctuations. Therefore, for employment indicators, CIDI utilized the ACS 3-year estimates. Because ACS data is collected via a survey, data are based on a sample and are subject to sampling variability and nonsampling error. Additionally, estimates from the 2000 Census data are included to extend the comparison time period.
Individual Indicators | Economic Security and Mobility

DISPARITY REPORT 46
Individual Indicators | Economic Security and Mobility
800
900
1000
700
600
500
400
300
200
100
0
Rat
e pe
r 1,0
00
800
900
1000
700
600
500
400
300
200
100
0
Rat
e pe
r 1,0
00
1.0
1.0
0.8
0.9
1.0
1.0
0.8
0.9
1.0
1.0
0.8
0.9
1.0
1.0
0.8
0.9
1.0
1.0
0.9
0.9
1.0
1.0
0.9
0.9
1.0
0.9
1.0
0.9 Disparity
Index
2000 2005-2007 2006-2008 2007-2009 2008-2010 2009-2011 2010-2012Years
1.0
1.0
0.9
0.8
1.0
1.0
0.9
0.8
1.0
1.0
0.9
0.9
1.0
1.0
0.9
0.9
1.0
1.0
0.9
0.9
1.0
1.0
0.9
0.9
1.0
0.9
1.0
0.9 Disparity
Index
2000 2005-2007 2006-2008 2007-2009 2008-2010 2009-2011 2010-2012Years
Source: American Community Survey via: Steven Ruggles, Katie Genadek, Ronald Goeken, Josiah Grover, and Matthew Sobek. Integrated Public Use Microdata Series: Version 6.0 [Machine-readable database]. Minneapolis: University of Minnesota, 2015
Males Aged 16-24: In School or EmployedWhite Asian Black Hispanic
Females Aged 16-24: In School or EmployedWhite Asian Black Hispanic
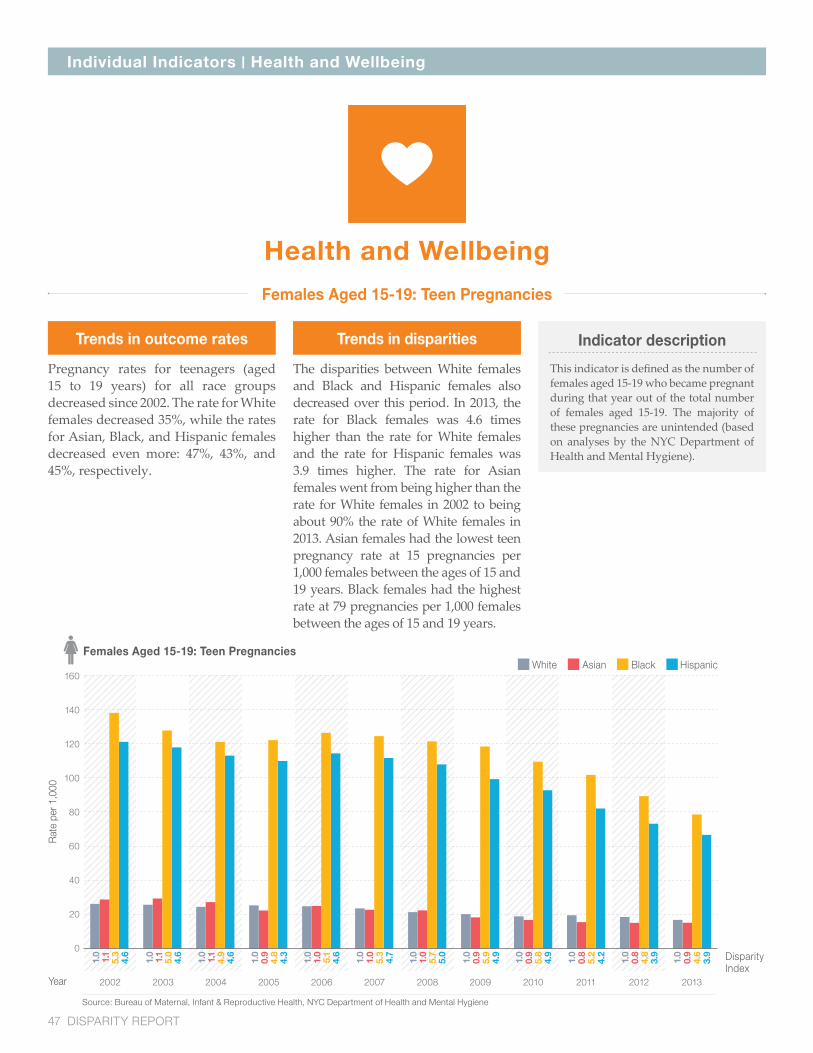
47 DISPARITY REPORT
Individual Indicators | Health and Wellbeing
Females Aged 15-19: Teen Pregnancies
Trends in disparities
The disparities between White females and Black and Hispanic females also decreased over this period. In 2013, the rate for Black females was 4.6 times higher than the rate for White females and the rate for Hispanic females was 3.9 times higher. The rate for Asian females went from being higher than the rate for White females in 2002 to being about 90% the rate of White females in 2013. Asian females had the lowest teen pregnancy rate at 15 pregnancies per 1,000 females between the ages of 15 and 19 years. Black females had the highest rate at 79 pregnancies per 1,000 females between the ages of 15 and 19 years.
Trends in outcome rates
Pregnancy rates for teenagers (aged 15 to 19 years) for all race groups decreased since 2002. The rate for White females decreased 35%, while the rates for Asian, Black, and Hispanic females decreased even more: 47%, 43%, and 45%, respectively.
Indicator description
This indicator is defined as the number of females aged 15-19 who became pregnant during that year out of the total number of females aged 15-19. The majority of these pregnancies are unintended (based on analyses by the NYC Department of Health and Mental Hygiene).
Health and Wellbeing
Year 2002 2003 2004 2005 2006 2007 2008 2009 2010 201320122011
100
120
140
160
80
60
40
20
0
Rat
e pe
r 1,0
00
Disparity Index
1.0
1.1
5.3
4.6
1.0
1.1
5.0
4.6
1.0
1.1
4.9
4.6
1.0
0.9
4.8
4.3
1.0
1.0
5.1
4.6
1.0
1.0
5.3
4.7
1.0
1.0
5.7
5.0
1.0
0.9
5.9
4.9
1.0
0.9
5.8
4.9
1.0
0.8
5.2
4.2
1.0
0.8
4.8
3.9
1.0
0.9
4.6
3.9
Females Aged 15-19: Teen PregnanciesWhite Asian Black Hispanic
Source: Bureau of Maternal, Infant & Reproductive Health, NYC Department of Health and Mental Hygiene

DISPARITY REPORT 48
Individual Indicators | Health and Wellbeing
Females Aged 15-19: Live Births
Trends in disparities
Disparities between White females and Black and Hispanic females decreased since 2002. The rates for Black and Hispanic females were 3.2 times higher and 4.7 times higher than White females in 2013. Asian females had a similar rate to White females in 2002, but in 2013 had a rate that was 80% that of White females. Asian females had the lowest rate overall with 6 live births for every 1,000 females between the ages of 15 and 19 years. Hispanic females had the highest rate at 33 live births for every 1,000 teenage females.
Trends in outcome rates
Rates for live births to teenagers (aged 15 to 19 years) decreased in a similar pattern to teen pregnancy rates. The rate for White females decreased 33%, while the rates for Asian, Black, and Hispanic females decreased 45%, 48%, and 41%, respectively.
Indicator description
This indicator is defined as the number of females aged 15-19 who gave birth to a live child during that year out of all females aged 15-19.
Year 2002 2003 2004 2005 2006 2007 2008 2009 2010 201320122011
Disparity Index
1.0
1.0
4.1
5.4
1.0
1.0
3.9
5.5
1.0
0.9
3.9
5.6
1.0
0.7
3.6
5.2
1.0
0.8
3.9
5.5
1.0
0.7
3.7
5.4
1.0
0.7
3.9
5.7
1.0
0.6
4.1
6.0
1.0
0.7
3.8
5.4
1.0
0.8
3.5
5.0
1.0
0.8
3.4
4.6
1.0
0.8
3.2
4.7
Source: Bureau of Maternal, Infant & Reproductive Health, NYC Department of Health and Mental Hygiene
Females Aged 15-19: Live BirthsWhite Asian Black Hispanic
50
60
40
30
20
10
0
Rat
e pe
r 1,0
00

49 DISPARITY REPORT
Individuals Aged 15-24: Death Rates
Trends in disparities
In 2013, the death rate for Black males was 1.5 times higher than the rate for White males. Asian and Hispanic males both had lower death rates than White males, although this difference was smaller in 2013 for both groups compared to 2002. The death rate for Asian males was about half the rate of White males, while the rate for Hispanic males was about 80% the rate of White males. Overall, Hispanic females had the lowest death rate in 2013 with 0.1 deaths per 1,000 individuals aged 15 to 24 years. Black males had the highest rate at 1.0 deaths per 1,000.
Trends in outcome rates
Death rates for individuals across all groups are low, and are even lower for females relative to males. Death rates for all race groups for males decreased since 2002: for White males, the rate decreased 30%; for Asian males, the rate decreased 13%; for Black males, the rate decreased 28%; and for Hispanic males, the rate decreased 6%. The rates for White females increased 23% from 2002 to 2013, while the rates for Asian, Black and Hispanic females decreased (52%, 20%, and 14%). However, the death rates for females are low for all groups, so slight fluctuations in the number of deaths or in the overall population can cause changes in the rates.
Indicator description
This indicator is defined as the number of individuals aged 15-24 who died out of the total number of individuals aged 15-24. The numerator for these rates is very small for this age group and therefore, small changes in counts can influence the disparity rates substantially, resulting in an unstable disparity rate. The leading causes of death for all males aged 15-24 in 2013 were: (1) Assault (Homicide), accounting for 15% of deaths for males in this age range; (2) Accidents Except Drug Poisoning, accounting for 5% of deaths; and (3) Intentional Self-harm (Suicide), accounting for 7% of deaths. For females, the leading causes were: (1) Accidents Except Drug Poisoning, accounting for 11% of deaths; (2) Malignant Neoplasms, accounting for 3% of deaths; and (3) Intentional Self-harm (Suicide), accounting for 2% of deaths (Zimmerman et al., 2015).
Health and Wellbeing
Individual Indicators | Health and Wellbeing

DISPARITY REPORT 50
Individual Indicators | Health and Wellbeing
1.0
1.2
1.4
1.6
1.8
2.0
0.8
0.6
0.4
0.2
0.0
Rat
e pe
r 1,0
00
1.0
1.2
1.4
1.6
1.8
2.0
0.8
0.6
0.4
0.2
0.0
Rat
e pe
r 1,0
00
Year 2002 2003 2004 2005 2006 2007 2008 2009 2010 201320122011
1.0
0.4
1.5
0.6
1.0
0.4
2.1
1.2
1.0
0.4
2.0
1.1
1.0
0.5
1.7
1.1
1.0
0.4
1.7
0.9
1.0
1.0
2.1
1.1
1.0
0.6
1.9
1.1
1.0
0.6
2.2
1.1
1.0
0.5
2.0
1.0
1.0
0.5
1.8
1.0
1.0
0.3
1.9
1.0
1.0
0.5
1.5
0.8 Disparity
Index
Year 2002 2003 2004 2005 2006 2007 2008 2009 2010 201320122011
1.0
1.0
1.8
1.0
1.0
0.1
1.6
0.9
1.0
0.7
0.9
0.7
1.0
0.8
1.4
0.7
1.0
0.4
0.9
0.7
1.0
0.8
1.4
1.0
1.0
1.5
1.6
0.9
1.0
1.2
1.2
0.9
1.0
0.9
2.2
1.3
1.0
0.4
1.4
0.6
1.0
0.9
1.3
0.8
1.0
0.4
1.2
0.7 Disparity
Index
Source: Bureau of Vital Statistics, Summary of Vital Statistics, NYC Department of Health and Mental Hygiene
Males Aged 15-24: Death RatesWhite Asian Black Hispanic
Females Aged 15-24: Death RatesWhite Asian Black Hispanic

51 DISPARITY REPORT
Individuals Under Age 14: Substantiated Abuse/Neglect
Trends in disparities
Disparities between White children and Black and Hispanic children increased for both males and females. In 2014, the rate for Black males and females were 8.5 and 8.7 times higher than their White peers, while the rates for Hispanic males and females were 5.1 and 5.5 times higher than their White peers. The rates for Asian children were lower than those for White children in 2002, but were about equal to White children in 2014 for both males and females. White females had the lowest rate of substantiated abuse/neglect at a rate of 4 per 1,000, while Black males had the highest rate at 37 per 1,000.
Trends in outcome rates
Rates of substantiated abuse/neglect for children under the age of 14 years increased for all groups from 2002 to 2014, with the most substantial increase occurring between 2005 and 2006. The rate for White males increased 12%, while the rates for Asian, Black, and Hispanic males increased 155%, 83%, and 78%. The rate for White females increased 12%, while rates for Asian, Black, and Hispanic females increased 139%, 93%, and 70%.
Indicator description
This indicator is defined as the number of youth under age 14 who were the subject of a substantiated report of abuse or neglect (as found by an ACS investigation) out of the total number of youth under the age of 14 years. There was a high-profile child fatality in 2006 which led to an increase in child abuse and neglect reporting.
Personal and Community Safety
Individual Indicators | Personal and Community Safety

DISPARITY REPORT 52
Individual Indicators | Personal and Community Safety
25
30
40
35
20
15
10
5
0
Rat
e pe
r 1,0
00
25
30
40
35
20
15
10
5
0
Rat
e pe
r 1,0
00
1.0
0.4
5.2
3.3
1.0
1.0
1.0
1.0
1.0
1.0
1.0
1.0
1.0
1.0
1.0
1.0
0.7
0.6
0.5
0.8
0.9
0.8
1.0
0.9
1.0
1.1
1.2
1.0
5.6
5.7
5.7
6.6
6.7
7.3
8.0
7.6
8.6
8.4
8.7
8.5
3.7
3.6
3.7
4.4
4.4
4.5
4.9
4.7
5.1
5.2
4.9
5.1 Disparity
Index2002 2003 2004 2005 2006 2007 2008 2009 2010 2014201320122011Year
1.0
0.5
5.1
3.6
1.0
1.0
1.0
1.0
1.0
1.0
1.0
1.0
1.0
1.0
1.0
0.6
0.7
0.7
0.8
0.8
0.7
0.9
0.8
0.9
1.0
1.0
5.3
5.3
5.7
6.9
6.3
6.5
7.7
7.3
8.0
8.8
8.7
3.7
3.6
4.0
4.8
4.5
4.4
5.1
4.8
5.0
1.0
1.0
8.5
5.4
5.3
5.5 Disparity
Index
2002 2003 2004 2005 2006 2007 2008 2009 2010 2014201320122011Year
Source: NYC Administration for Children’s Services & Bureau of Epidemiology Services, NYC Department of Health and Mental Hygiene
Males Under Age 14: Substantiated Abuse/NeglectWhite Asian Black Hispanic
Females Under Age 14: Substantiated Abuse/NeglectWhite Asian Black Hispanic
53 DISPARITY REPORT
Individuals Aged 14-17: Substantiated Abuse/Neglect
Trends in disparities
Disparities between White children and Black and Hispanic children increased over time; in 2014, the rates for Black males and females were 5.1 and 5.3 times higher than their White peers, while the rates for Hispanic males and females were 3.9 and 4.8 times higher than the rate of their White peers. The rates for Asian children increased to be more similar to their White peers. The rate for Asian males was 70% the rate of their White peers, while the rate for Asian females was 80% the rate of their White peers. Asian males had the lowest rate of substantiated abuse/neglect at 3 per 1,000, while Black females had the highest rate at 30 per 1,000.
Trends in outcome rates
Rates of substantiated abuse/neglect also increased for children aged 14 to 17 years, again with the most substantial increase occurring from 2005 to 2006. The rate for White males increased 29% from 2002 to 2014. The rates for Asian, Black, and Hispanic males increased much more substantially with 229%, 85%, and 80% increases. The rate for White females increased slightly (2%), while the rates for Asian, Black, and Hispanic females increased 170%, 71%, and 55%, respectively.
Indicator description
This indicator is defined as the number of youth aged 14 to 17 years who were the subject of a substantiated report of abuse or neglect (as found by an ACS investigation) out of the total number of youth between the ages of 14 and 17 years. There was a high-profile child fatality in 2006 which led to an increase in child abuse and neglect reporting.
Personal and Community Safety
Individual Indicators | Personal and Community Safety

DISPARITY REPORT 54
Individual Indicators | Personal and Community Safety
25
30
35
20
15
10
5
0
Rat
e pe
r 1,0
00
25
30
35
20
15
10
5
0
Rat
e pe
r 1,0
00
2002 2003 2004 2005 2006 2007 2008 2009 2010 2014201320122011Year
1.0
0.3
3.6
2.8
1.0
1.0
1.0
1.0
1.0
1.0
1.0
1.0
1.0
1.0
1.0
1.0
0.6
0.7
0.5
0.7
0.7
0.5
0.6
0.8
0.8
1.0
0.9
0.7
3.2
3.9
4.2
4.7
4.6
4.1
4.5
4.8
4.6
5.3
5.3
5.1
2.6
3.0
3.8
4.3
4.3
3.6
3.6
3.8
3.8
3.8
4.0
3.9 Disparity
Index
2002 2003 2004 2005 2006 2007 2008 2009 2010 2014201320122011Year
1.0
0.3
3.2
3.2
1.0
1.0
1.0
1.0
1.0
1.0
1.0
1.0
1.0
1.0
1.0
1.0
0.8
0.6
0.6
0.7
0.6
0.7
0.7
0.7
0.7
0.9
1.0
0.8
4.1
3.3
3.8
4.6
4.5
4.7
5.2
4.9
4.6
4.3
5.2
5.3
4.0
3.4
4.0
4.5
4.1
4.3
4.7
4.3
4.2
3.8
4.4
4.8 Disparity
Index
Source: NYC Administration for Children’s Services & Bureau of Epidemiology Services, NYC Department of Health and Mental Hygiene
Males Aged 14-17: Substantiated Abuse/NeglectWhite Asian Black Hispanic
Females Aged 14-17: Substantiated Abuse/NeglectWhite Asian Black Hispanic

55 DISPARITY REPORT
Individuals Under Age 16: Misdemeanor Arrests
Trends in disparities
Disparities increased between White males and Black and Hispanic males. In 2014, the misdemeanor arrest rate for males under age 16 for Black males was 17.3 times higher than White males and the rate was 6.0 times higher than White males for Hispanic males. Asian males had lower misdemeanor arrest rates than White males in 2004, but in 2014, their rate was 1.2 times higher than the rate for White males. The disparities for Black and Hispanic females also increased, but rates for females are all low which can cause fluctuations in the disparity indices. The rate for Black females was 20.5 times higher than the rate for White females in 2014, while the rate for Hispanic females was 6.1 times higher. The rate for Asian females remained lower than the rate for White females (80% the rate of White females). Asian females had the lowest rate overall at 0.1 misdemeanor arrests for every 1,000 females under age 16. Black males had the highest rate at 7 per 1,000.
Trends in outcome rates
Overall rates of misdemeanor arrests for adolescents under age 16 are much lower for females than males. Rates for White, Asian, and Hispanic males decreased 72%, 35%, and 10%, respectively from 2004 to 2014. The rate for Black males increased 36% over the same time period. However, for all race groups, there were significant decreases compared to 2012. The rate for White females decreased 50% from 2004 to 2014; the rate for Hispanic females also decreased slightly (2%). The rates for Asian and Black females increased 4% and 25%, respectively.
Indicator description
This indicator is defined as the number of individuals under 16 years who were arrested for a misdemeanor out of the entire population of individuals under 16 years.
Personal and Community Safety
Individual Indicators | Personal and Community Safety

DISPARITY REPORT 56
Individual Indicators | Personal and Community Safety
10
12
16
14
8
6
4
2
0
Rat
e pe
r 1,0
00
10
12
16
14
8
6
4
2
0
Rat
e pe
r 1,0
00
2004 2005 2006 2007 2008 2009 2010 2014201320122011Year
1.0
0.6
4.0
2.0
1.0
1.0
1.0
1.0
1.0
1.0
1.0
1.0
1.0
1.0
0.5
0.5
0.9
0.5
0.6
0.7
0.7
0.8
1.1
1.2
4.0
3.9
5.2
4.9
5.7
7.1
6.6
7.2
12.0
17.32.1
2.3
3.1
3.0
3.2
3.9
3.4
3.4
5.0
6.0 Disparity
Index
2004 2005 2006 2007 2008 2009 2010 2014201320122011Year
1.0
0.5
7.3
3.5
1.0
1.0
1.0
1.0
1.0
1.0
1.0
1.0
1.0
1.0
0.9
1.4
1.0
1.2
0.6
0.9
0.9
0.8
0.6
0.8
7.8
9.8
9.3
12.1 9.6
11.9
13.3
13.5
21.2
20.53.5
4.6
4.1
5.7
4.0
4.9
5.8
5.2
8.3
6.1 Disparity
Index
Source: NYC Criminal Justice Agency & Bureau of Epidemiology Services, NYC Department of Health and Mental Hygiene
Males Under Age 16: Misdemeanor ArrestsWhite Asian Black Hispanic
Females Under Age 16: Misdemeanor ArrestsWhite Asian Black Hispanic

57 DISPARITY REPORT
Individuals Under Age 16: Felony Arrests
Trends in disparities
Disparities for all groups except Asian females increased from 2004 to 2014. In 2014, the rates for Black males and females were 30.2 and 20.8 times higher than their White peers, while the rates for Hispanic males and females were 8.5 and 6.5 times higher than their White peers. The rate for Asian males was lower than the rate for White males in 2004, but was 2.0 times higher in 2014. The rate for Asian females was more similar to White females in 2014 than in 2004, at a rate that was 90% the rate of White females. Asian females had the lowest rate of felony arrests for individuals under age 16 at 0.1 arrests per 1,000 individuals, while Black males had the highest rate at 10 arrests per 1,000 individuals under age 16.
Trends in outcome rates
Rates of felony arrests for individuals under age 16 decreased for all groups between 2004 and 2014, and are much lower overall for females compared to males. The rate for White males decreased 74%, the rate for Asian males decreased 47%, the rate for Black males decreased 10%, and the rate for Hispanic males decreased 36%. The rate for White females decreased 62% and the rate for Asian females decreased 15%, while the rates for Black and Hispanic females decreased 1%.
Indicator description
This indicator is defined as the number of individuals under 16 years who were arrested for a felony out of the entire population of individuals under 16 years.
Personal and Community Safety
Individual Indicators | Personal and Community Safety

DISPARITY REPORT 58
Individual Indicators | Personal and Community Safety
10
12
18
16
14
8
6
4
2
0
Rat
e pe
r 1,0
00
10
12
18
16
14
8
6
4
2
0
Rat
e pe
r 1,0
00
Source: NYC Criminal Justice Agency & Bureau of Epidemiology Services, NYC Department of Health and Mental Hygiene
Males Under Age 16: Felony ArrestsWhite Asian Black Hispanic
Females Under Age 16: Felony ArrestsWhite Asian Black Hispanic
2004 2005 2006 2007 2008 2009 2010 2014201320122011Year
1.0
0.7
7.9
3.3
1.0
1.0
1.0
1.0
1.0
1.0
1.0
1.0
1.0
1.0
0.8
1.2
1.1
0.9
1.1
1.7
1.5
1.6
1.8
2.0
10.0
10.8
11.4
14.5
15.6
17.7
22.5
17.4
29.5
30.23.9
3.8
4.1
4.7
5.4
5.2
6.6
4.9
7.7
8.5 Disparity
Index
2004 2005 2006 2007 2008 2009 2010 2014201320122011Year
1.0
0.4
7.9
2.9
1.0
1.0
1.0
1.0
1.0
1.0
1.0
1.0
1.0
1.0
1.5
0.9
1.3
0.6
0.6
1.8
0.5
1.6
1.2
0.9
9.3
13.3
16.6
13.3
10.7
14.9
18.1
38.8
31.3
20.83.4
4.0
5.2
4.5
3.5
4.3
4.5
9.6
8.7
6.5 Disparity
Index

59 DISPARITY REPORT
Individuals Under Age 16: Admissions to Juvenile Detention
Trends in disparities
Disparities between White males and Black and Hispanic males increased from 2002 to 2014. In 2014, rates for Black and Hispanic males were 35.0 and 9.6 times than the rate for White males. Disparities also increased for Black and Hispanic females: Their rates were 15.6 and 4.1 times higher than the rate for White females. The rate for Asian females was 30% the rate of White females, while the rate for Asian males was 2.0 times higher than the rate of White males (but still very low). Overall, Asian females had the lowest detention admission rate at 0.03 per 1,000, while Black males had the highest detention admission rate at 4 per 1,000.
Trends in outcome rates
Overall, females had lower rates than males of admission to detention for individuals under age 16, although all rates were low in 2014 (under 4 per 1,000). The rates of admission for White, Black, and Hispanic adolescents (both female and male) decreased from 2002 to 2014. The rate for White males and females decreased 84% and 50%, respectively; the rates for Black males and females decreased 36% and 10%, respectively; and the rates for Hispanic males and females decreased 52% and 27%, respectively. The rates for Asian males and females increased, but were still very low overall.
Indicator description
This indicator is defined as the number of youth under age 16 who were admitted to detention (not placement) out of the total number of youth under age 16.
Personal and Community Safety
Individual Indicators | Personal and Community Safety

DISPARITY REPORT 60
Individual Indicators | Personal and Community Safety
5
7
6
10
9
8
4
3
2
1
0
Rat
e pe
r 1,0
00
5
7
6
10
9
8
4
3
2
1
0
Rat
e pe
r 1,0
00
1.0
0.2
8.9
3.3
1.0
1.0
1.0
1.0
1.0
1.0
1.0
1.0
1.0
1.0
1.0
1.0
0.6
0.5
0.6
0.6
0.8
0.5
0.6
0.9
1.2
2.4
1.9
2.0
9.8
11.4
11.0
10.9
13.3
14.2
16.1
23.1
25.7
34.0
35.7
35.04.0
4.4
4.1
3.8
4.9
4.6
5.3
7.3
8.3
11.8 9.6
9.6 Disparity
Index2002 2003 2004 2005 2006 2007 2008 2009 2010 2014201320122011Year
1.0
0.0
8.7
2.8
1.0
1.0
1.0
1.0
1.0
1.0
1.0
1.0
1.0
1.0
1.0
1.0
0.3
0.3
0.7
0.8
0.6
0.6
0.2
0.7
2.0
1.3
0.2
0.3
8.7
8.9
9.8
12.3
14.9
11.1
16.2
14.8
48.4
28.9
30.9
15.63.2
4.1
3.2
3.8
4.5
3.5
4.1
3.9
13.2 9.1
9.1
4.1 Disparity
Index
2002 2003 2004 2005 2006 2007 2008 2009 2010 2014201320122011Year
Source: Administration for Children’s Services, Department of Youth and Family Justice & Bureau of Epidemiology Services, NYC Department of Health and Mental Hygiene
Males Under Age 16: Admissions to Juvenile DetentionWhite Asian Black Hispanic
Females Under Age 16: Admissions to Juvenile DetentionWhite Asian Black Hispanic
61 DISPARITY REPORT
Personal and Community Safety
Individuals Aged 16-24: Misdemeanor Arrests
Trends in disparities
Disparities increased for Black and Hispanic males and females. In 2014, the rates for Black males and females were 4.3 and 4.6 times higher than the rate of their White peers; the rates for Hispanic males and females were 2.5 and 2.3 times higher than their White peers. Rates of misdemeanor arrests for 16 to 24 year olds were lower for Asian males and females: The rate for Asian males was 80% of the rate for White males and the rate for Asian females was 60% of the rate for White females. Asian females had the lowest rate overall at 8 misdemeanor arrests per 1,000 individuals aged 16 to 24. Black males had the highest rate at 230 per 1,000.
Trends in outcome rates
Overall, rates of misdemeanor arrests for individuals aged 16 to 24 increased since 2002; however, since 2011 these rates decreased. The rate for White males increased 1% from 2002 to 2014, while the rates for Asian, Black, and Hispanic males increased 53%, 14%, and 11%, respectively. The rate for White females increased 14%, while the rates for Asian, Black, and Hispanic females increased 44%, 40%, and 48%.
Indicator description
This indicator is defined as the number of individuals aged 16-24 who were arrested for a misdemeanor out of the entire population of individuals aged 16-24.
Individual Indicators | Personal and Community Safety

DISPARITY REPORT 62
Individual Indicators | Personal and Community Safety
Males Aged 16-24: Misdemeanor ArrestsWhite Asian Black Hispanic
300
250
200
150
100
50
0
Rat
e pe
r 1,0
00
300
250
200
150
100
50
0
Rat
e pe
r 1,0
00
1.0
0.5
3.8
2.3
1.0
0.5
4.7
2.5
1.0
0.6
4.9
3.0
1.0
0.7
5.3
3.1
1.0
0.6
5.7
3.0
1.0
0.7
5.0
3.0
1.0
0.6
4.8
2.6
1.0
0.6
4.6
2.4
1.0
0.6
4.0
2.2
1.0
0.7
4.3
2.3
1.0
0.8
4.2
2.5
1.0
0.8
4.3
2.5
1.0
0.6
4.5
2.6 Disparity
Index2002 2003 2004 2005 2006 2007 2008 2009 2010 2014201320122011Year
1.0
0.5
3.7
1.8
1.0
0.6
3.8
1.9
1.0
0.8
4.3
2.2
1.0
0.8
5.0
2.4
1.0
0.7
4.8
2.2
1.0
0.7
4.9
2.3
1.0
0.5
4.9
2.3
1.0
0.5
4.4
2.0
1.0
0.6
4.9
2.2
1.0
0.6
4.9
2.5
1.0
0.6
4.6
2.3
1.0
0.6
4.7
2.3
1.0
0.6
5.0
2.2 Disparity
Index
2002 2003 2004 2005 2006 2007 2008 2009 2010 2014201320122011Year
Females Aged 16-24: Misdemeanor ArrestsWhite Asian Black Hispanic
Source: NYS Division of Criminal Justice Services, Computerized Criminal History System & Bureau of Epidemiology Services, NYC Department of Health and Mental Hygiene
63 DISPARITY REPORT
Individuals Aged 16-24: Misdemeanor Convictions
Trends in disparities
Disparities for Black and Hispanic males and females decreased from 2002 to 2014. In 2014, the rates of misdemeanor convictions for Black males and females were 5.1 and 5.0 times higher than their White peers, while rates for Hispanic males and females were 2.2 and 1.7 times higher. The rates for Asian males and females remained lower than the rates of their White peers with Asian males at about half the rate of White males and Asian females at about 20% the rate of White females. Overall, Asian females had the lowest rate of misdemeanor convictions at 0.2 per 1,000; Black males had the highest rate at 32 per 1,000.
Trends in outcome rates
Misdemeanor convictions for individuals aged 16 to 24 years decreased for every group between 2002 and 2014, particularly in recent years. The rate for White males decreased 19%, the rate for Asian males decreased 25%, the rate for Black males decreased 37%, and the rate for Hispanic males decreased 51%. The rate for White females decreased 50%, the rate for Asian females decreased 69%, the rate for Black females decreased 54%, and the rate for Hispanic females decreased 55%.
Indicator description
This indicator is defined as the number of individuals aged 16-24 who were convicted of a misdemeanor out of the entire population of individuals aged 16-24.
Personal and Community Safety
Individual Indicators | Personal and Community Safety

DISPARITY REPORT 64
Individual Indicators | Personal and Community Safety
60
50
40
30
20
10
0
Rat
e pe
r 1,0
00
60
50
40
30
20
10
0
Rat
e pe
r 1,0
00
2002 2003 2004 2005 2006 2007 2008 2009 2010 2014201320122011Year
1.0
0.6
6.6
3.7
1.0
0.7
6.9
4.1
1.0
0.6
7.5
4.1
1.0
0.6
6.7
3.7
1.0
0.6
6.8
3.4
1.0
0.6
6.6
3.5
1.0
0.4
5.6
2.6
1.0
0.5
6.1
2.7
1.0
0.6
6.2
2.8
1.0
0.5
5.5
2.5
1.0
0.5
5.4
2.5
1.0
0.5
5.1
2.2
1.0
0.5
6.1
3.1 Disparity
Index
2002 2003 2004 2005 2006 2007 2008 2009 2010 2014201320122011Year
1.0
0.3
5.4
1.8
1.0
0.3
3.9
1.7
1.0
0.4
4.4
1.7
1.0
0.3
4.9
1.9
1.0
0.3
5.2
2.1
1.0
0.3
5.0
1.8
1.0
0.3
5.5
1.7
1.0
0.3
4.9
1.5
1.0
0.2
5.1
1.5
1.0
0.3
5.2
1.8
1.0
0.3
4.9
1.5
1.0
0.2
4.8
1.6
1.0
0.2
5.0
1.7 Disparity
Index
Source: NYS Division of Criminal Justice Services, Computerized Criminal History System & Bureau of Epidemiology Services, NYC Department of Health and Mental Hygiene
Males Aged 16-24: Misdemeanor ConvictionsWhite Asian Black Hispanic
Females Aged 16-24: Misdemeanor ConvictionsWhite Asian Black Hispanic

65 DISPARITY REPORT
Individuals Aged 16-24: Felony Arrests
Trends in disparities
Disparities decreased for Black and Hispanic males and females and remained the same for Asian males and females. In 2014, the rates for Black males and females were 6.5 and 6.7 times higher than the rate of their White peers; the rates for Hispanic males and females were 2.6 and 2.4 times higher than their White peers. Black males had the highest felony arrest rate at 111 felony arrests for every 1,000 individuals aged 16 to 24. Asian females had the lowest rate at 2 per 1,000.
Trends in outcome rates
Since 2002, felony arrest rates for individuals aged 16 to 24 years decreased for males, but their rates remain much higher than the rates for females. The rate for White males decreased 10%, the rate for Asian males decreased 5%, the rate for Black males decreased 18%, and the rate for Hispanic males decreased 39%. The rates of felony arrests increased for White, Asian, and Black females (11%, 10%, and 8%, respectively), but decreased 11% for Hispanic females.
Indicator description
This indicator is defined as the number of individuals aged 16-24 who were arrested for a felony out of the entire population of individuals aged 16-24.
Personal and Community Safety
Individual Indicators | Personal and Community Safety
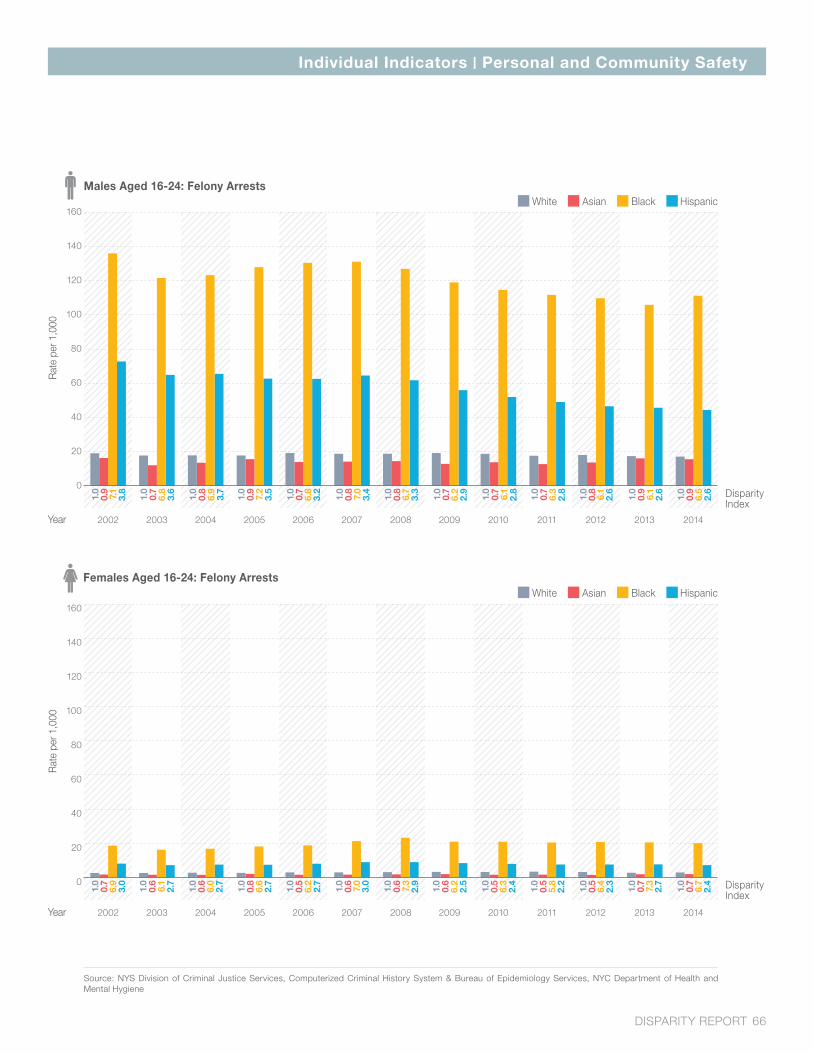
DISPARITY REPORT 66
160
140
120
100
80
60
40
20
0
Individual Indicators | Personal and Community Safety
Males Aged 16-24: Felony ArrestsWhite Asian Black Hispanic
160
140
120
100
80
60
40
20
0
Rat
e pe
r 1,0
00
Rat
e pe
r 1,0
00
2002 2003 2004 2005 2006 2007 2008 2009 2010 2014201320122011Year
1.0
0.9
7.1
3.8
1.0
0.7
6.8
3.6
1.0
0.8
6.9
3.7
1.0
0.9
7.2
3.5
1.0
0.7
6.8
3.2
1.0
0.8
7.0
3.4
1.0
0.7
6.2
2.9
1.0
0.7
6.1
2.8
1.0
0.7
6.3
2.8
1.0
0.8
6.1
2.6
1.0
0.9
6.1
2.6
1.0
0.9
6.5
2.6
1.0
0.8
6.7
3.3 Disparity
Index
2002 2003 2004 2005 2006 2007 2008 2009 2010 2014201320122011Year
1.0
1.0
0.7
6.9
3.0
1.0
0.6
6.1
2.7
1.0
0.6
6.0
2.7
1.0
0.8
6.6
2.7
1.0
0.5
6.2
2.7
1.0
0.6
7.0
3.0
1.0
0.6
7.3
2.9
1.0
0.6
6.2
2.5
1.0
0.5
6.3
2.4
1.0
0.5
5.8
2.2
1.0
0.5
6.4
2.3
0.7
7.3
2.7
1.0
0.7
6.7
2.4 Disparity
Index
Females Aged 16-24: Felony ArrestsWhite Asian Black Hispanic
Source: NYS Division of Criminal Justice Services, Computerized Criminal History System & Bureau of Epidemiology Services, NYC Department of Health and Mental Hygiene

67 DISPARITY REPORT
Personal and Community Safety
Individuals Aged 16-24: Felony Convictions
Trends in disparities
Disparities between White males and females and Black and Hispanic males and females decreased from 2002 to 2014. In 2014, the rate for Black males was 12.2 times higher than the rate of White males and the rate for Hispanic males was 4.7 times higher than the rate of White males. The rate for Black females was 6.8 times higher than the rate of White females and the rate for Hispanic females was 2.4 times higher than the rate of White females. The rate for Asian males was about the same as the rate of White males, while the rate for Asian females was 40% the rate of White females. Asian females had the lowest felony conviction rate at 0.1 per 1,000, while Black males had the highest rate at 21 per 1,000.
Trends in outcome rates
Felony conviction rates for individuals aged 16 to 24 decreased for all groups except White females and are much lower for females than males. The rates for White, Asian, Black, and Hispanic males decreased 40%, 18%, 42%, and 56%, respectively. The rate for White females increased 5% while the rate for Asian females decreased 4%, the rate for Black females decreased 16%, and the rate for Hispanic females decreased 37%.
Indicator description
This indicator is defined as the number of individuals aged 16-24 who were convicted of a felony out of the entire population of individuals aged 16-24.
Individual Indicators | Personal and Community Safety

DISPARITY REPORT 68
40
35
30
25
20
15
10
5
0
Individual Indicators | Personal and Community Safety
Males Aged 16-24: Felony ConvictionsWhite Asian Black Hispanic
Rat
e pe
r 1,0
00
40
35
30
25
20
15
10
5
0
Rat
e pe
r 1,0
00
2002 2003 2004 2005 2006 2007 2008 2009 2010 2014201320122011Year
1.0
0.7
12.5 6.4
1.0
1.0
12.3 6.4
1.0
1.2
13.7 6.8
1.0
1.0
13.8 6.5
1.0
0.9
14.0 6.4
1.0
1.1
14.3 6.1
1.0
0.9
12.8 5.1
1.0
1.0
11.0 4.5
1.0
1.0
11.2 4.6
1.0
0.9
11.4 4.5
1.0
0.7
12.9 4.6
1.0
1.0
12.2 4.7
1.0
1.0
12.7 5.8 Disparity
Index
2002 2003 2004 2005 2006 2007 2008 2009 2010 2014201320122011Year
1.0
0.4
8.5
4.0
1.0
0.6
7.3
3.9
1.0
0.6
9.5
5.4
1.0
0.5
5.8
2.8
1.0
0.5
9.8
4.4
1.0
0.7
14.7 6.7
1.0
0.7
10.9 4.1
1.0
0.2
12.5 4.2
1.0
0.3
7.5
2.8
1.0
0.3
5.9
2.1
1.0
0.6
11.2 3.4
1.0
0.5
7.2
2.5
1.0
0.4
6.8
2.4 Disparity
Index
Females Aged 16-24: Felony ConvictionsWhite Asian Black Hispanic
Source: NYS Division of Criminal Justice Services, Computerized Criminal History System & Bureau of Epidemiology Services, NYC Department of Health and Mental Hygiene

69 DISPARITY REPORT
Individuals Aged 16-24: Admissions to Jail
Trends in disparities
Disparities remained the same from 2002 to 2014 for Asian and Black females and decreased for all other groups. In 2014, the admission rates for Black males and females were 10.2 and 7.6 times higher than their White peers, while the rates for Hispanic males and females were 4.4 and 2.6 times higher than their White peers. Asian males and females had lower admission rates than their White peers. Black males had the highest admission rate at 53 per 1,000, while Asian females had the lowest admission rate at 0.2 per 1,000.
Trends in outcome rates
Rates of admission to jail for individuals aged 16 to 24 years decreased for all groups except Asian males and females (who had the lowest rates of any race group). Between 2002 and 2014, admission rates decreased 34% for White males, 44% for Black males, 51% for Hispanic males, and increased 10% for Asian males. Rates decreased 18% for White and Black females, 31% for Hispanic females, and increased 19% for Asian females.
Indicator description
This indicator is defined as the number of individuals aged 16-24 admitted to jail out of the entire population of individuals aged 16-24.
Personal and Community Safety
Individual Indicators | Personal and Community Safety

DISPARITY REPORT 70
Individual Indicators | Personal and Community Safety
Males Aged 16-24: Admissions to JailWhite Asian Black Hispanic
2002 2003 2004 2005 2006 2007 2008 2009 2010 2014201320122011Year
1.0
0.3
12.1
5.9
1.0
0.3
11.6 5.5
1.0
0.4
12.3 5.5
1.0
0.4
5.6
1.0
0.5
12.7 5.4
1.0
0.4
12.5 5.4
1.0
0.5
12.6 5.3
1.0
0.5
12.2 5.5
1.0
0.4
10.4 4.3
1.0
0.5
11.6 5.0
1.0
0.5
10.2 4.4
12.1 1.0
0.5
11.2 4.7
1.0
0.4
11.7 5.0 Disparity
Index
2002 2003 2004 2005 2006 2007 2008 2009 2010 2014201320122011Year
1.0
0.2
7.6
3.1
1.0
0.1
5.8
2.4
1.0
0.1
6.2
2.4
1.0
0.2
7.4
2.5
1.0
0.2
7.0
2.2
1.0
0.2
8.7
2.6
1.0
0.2
10.0 3.0
1.0
0.3
9.5
2.8
1.0
0.2
8.0
2.4
1.0
0.2
7.4
2.5
1.0
0.3
7.7
2.3
1.0
0.2
7.8
2.7
1.0
0.2
7.6
2.6 Disparity
Index
Rat
e pe
r 1,0
00
100
70
80
90
60
50
40
30
20
10
0
Rat
e pe
r 1,0
00
100
70
80
90
60
50
40
30
20
10
0
Females Aged 16-24: Admissions to JailWhite Asian Black Hispanic
Source: NYC Department of Correction & Bureau of Epidemiology Services, NYC Department of Health and Mental Hygiene

71 DISPARITY REPORT
Personal and Community Safety
Individuals Aged 16-24: Readmission to Jail (Out of Unique Discharges)
Trends in disparities
Disparities decreased or stayed the same for all groups. In 2013, Black males were readmitted at a similar rate to White males; Asian and Hispanic males and Black females were readmitted at a rate that was 90% the rate of their White peers; and Hispanic and Asian females were readmitted at a rate that was 60% the rate of their White peers. Hispanic females had the lowest readmission rate at 203 readmissions for every 1,000 discharges and Black males had the highest readmission rate at 454 readmissions for every 1,000 discharges.
Trends in outcome rates
Rates of readmission to jail (out of unique discharges) for individuals aged 16 to 24 years varied year by year. Readmission rates increased 49% for White males, 57% for Asian males, 3% for Black males, 9% for White females, and 11% for Black females. Readmission rates decreased 2% for Hispanic males, 4% for Asian females, and 26% for Hispanic females.
Indicator description
This indicator is defined as the number of individuals aged 16-24 who were readmitted to jail within one year of discharge out of the number of discharges within that year.
Individual Indicators | Personal and Community Safety

DISPARITY REPORT 72
Individual Indicators | Personal and Community Safety
Males Aged 16-24: Readmissions to Jail (Out of Unique Discharges)White Asian Black Hispanic
500
350
400
450
300
250
200
150
100
50
0
Rat
e pe
r 1,0
00
500
350
400
450
300
250
200
150
100
50
0
Rat
e pe
r 1,0
00
1.0
0.9
1.5
1.4
1.0
0.9
1.4
1.3
1.0
0.8
1.4
1.2
1.0
0.9
1.5
1.3
1.0
0.9
1.4
1.3
1.0
0.9
1.2
1.1
1.0
0.8
1.2
1.1
1.0
0.9
1.2
1.1
1.0
0.8
1.2
1.1
1.0
0.9
1.0
0.9
1.0
0.7
1.4
1.2
1.0
1.0
1.4
1.2 Disparity
Index
Year 2002 2003 2004 2005 2006 2007 2008 2009 2010 201320122011
1.0
0.7
0.9
0.9
1.0
0.4
0.9
0.8
1.0
1.2
1.0
1.0
1.0
0.3
0.9
0.9
1.0
0.4
0.8
0.7
1.0
0.0
0.9
0.9
1.0
0.3
0.8
0.8
1.0
0.3
0.7
0.6
1.0
1.0
0.9
1.0
1.0
0.7
0.9
0.8
1.0
0.6
0.9
0.6
1.0
0.3
0.8
0.8 Disparity
IndexYear 2002 2003 2004 2005 2006 2007 2008 2009 2010 201320122011
Females Aged 16-24: Readmissions to Jail (Out of Unique Discharges)White Asian Black Hispanic
Source: NYC Department of Correction

73 DISPARITY REPORT
Amos, J. (2008). Dropouts, diplomas, and dollars: US high schools and the nation’s economy. Alliance for Excellent Education.
Balfanz, R., & Byrnes, V. (2012). Chronic absenteeism: Summarizing what we know from nationally available data. Baltimore, MD: Johns Hopkins University Center for Social Organization of Schools.
Basch, C. E. (2011). Teen pregnancy and the achievement gap among urban minority youth. Journal of School Health, 81(10), 614-618.
Boden, J. M., Horwood, L. J., & Fergusson, D. M. (2007). Exposure to childhood sexual and physical abuse and subsequent educational achievement outcomes. Child Abuse & Neglect, 31(10), 1101-1114.
Bridges, G. S., & Steen, S. (1998). Racial disparities in official assessments of juvenile offenders: Attributional stereotypes as mediating mechanisms. American Sociological Review, 554-570.
Christle, C. A., Jolivette, K., & Nelson, C. M. (2007). School characteristics related to high school dropout rates. Remedial and Special Education, 28(6), 325-339.
Chung, H. L., Mulvey, E. P., & Steinberg, L. (2011). Understanding the school outcomes of juvenile offenders: An exploration of neighborhood influences and motivational resources. Journal of Youth and Adolescence, 40(8), 1025-1038.
Costenbader, V., & Markson, S. (1998). School suspension: A study with secondary school students. Journal of School Psychology, 36(1), 59-82.
Davis, L. M., Kilburn, M. R., & Scultz, D. (2009). Reparable harm: Assessing and addressing disparities faced by boys and men of color in California. Rand Corporation.
Drake, B., & Pandey, S. (1996). Understanding the relationship between neighborhood poverty and specific types of child maltreatment. Child Abuse & Neglect, 20(11), 1003-1018.
Fabelo, T., Thompson, M. D., Martha Plotkin, J. D., Carmichael, D., Marchbanks III, M. P., & Booth, E. A. (2011). Breaking schools’ rules: A statewide study of how school discipline relates to students’ success and juvenile justice involvement. Council of State Governments Justice Center and the Public Policy Research Institute at Texas A&M University.
References06.

Frieden, T., Jaffe, H., Stephens, J., Thacker, S., & Zaza, S. (2011). CDC health disparities and inequalities report–United States, 2011. MMWR Supplement, 60.
Galster, G., Marcotte, D. E., Mandell, M., Wolman, H., & Augustine, N. (2007). The influence of neighborhood poverty during childhood on fertility, education, and earnings outcomes. Housing Studies, 22(5), 723-751.
Harding, D. J. (2003). Counterfactual models of neighborhood effects: the effect of neighborhood poverty on dropping out and teenage pregnancy1. American Journal of Sociology, 109(3), 676-719.
Kieffer, M. J., Marinell, W. H., & Stephenson, N. S. (2011). The middle grades student transitions study. The Research Alliance for New York City Schools.
Kienzl, G., & Kena, G. (2006). Economic outcomes of high school completers and noncompleters 8 Years Later. Issue Brief. NCES 2007-019. National Center for Education Statistics.
Kirk, D. S., & Sampson, R. J. (2013). Juvenile arrest and collateral educational damage in the transition to adulthood. Sociology of Education, 86(1), 36-62.
Kurtz, P. D., Gaudin, J. M., Wodarski, J. S., & Howing, P. T. (1993). Maltreatment and the school-aged child: School performance consequences. Child Abuse & Neglect, 17(5), 581-589.
Lesnick, J., Goerge, R., Smithgall, C., & Gwynne, J. (2010). Reading on grade level in third grade: How is it related to high school performance and college enrollment. Chapin Hall at the University of Chicago.
McCord, J., Widom, C. S., & Crowell, N. A. (2001). Juvenile crime, juvenile justice. Panel on juvenile crime: Prevention, treatment, and control. National Academy Press, 2101 Constitution Avenue, NW, Washington, DC, 20418.
Mocan, H. N., & Rees, D. I. (2005). Economic conditions, deterrence and juvenile crime: Evidence from micro data. American Law and Economics Review, 7(2), 319-349.
NYC Department of City Planning. (2013). DP05: ACS demographic and housing estimates. Retrieved from http://www.nyc.gov/html/dcp/pdf/census/boro_demo_2013_acs.pdf
Okonofua, J. A., & Eberhardt, J. L. (2015). Two strikes: Race and the disciplining of young students. Psychological Science, 26(5), 617-624.
Patten, E. and Krogstad, J. (2015). Black child poverty rate holds steady, even as other groups see declines. Pew Research Center. http://www.pewresearch.org/fact-tank/2015/07/14/black-child-poverty-rate-holds-steady-even-as-other-groups-see-declines/
Randolph-Back, K. (2006b). State public education policy and life pathways for boys and young men of color The Dellums Commission. Washington, D.C.: Joint Center for Political and Economic Studies Health Policy Institute.
Romero, M., & Lee, Y. S. (2007). A national portrait of chronic absenteeism in the early grades. National Center for Children in Poverty.
Sampson, R. J., Sharkey, P., & Raudenbush, S. W. (2008). Durable effects of concentrated disadvantage on verbal ability among African-American children. Proceedings of the National Academy of Sciences, 105(3), 845-852.
Shaw, T. V., Putnam-Hornstein, E., Magruder, J., & Needell, B. (2008). Measuring racial disparity in child welfare. Child Welfare, 87(2), 23-36.
Skiba, R. J., Horner, R. H., Chung, C. G., Karega Rausch, M., May, S. L., & Tobin, T. (2011). Race is not neutral: A national investigation of African American and Latino disproportionality in school discipline. School Psychology Review, 40(1), 85.
Shonkoff, J. P., Garner, A. S., Siegel, B. S., Dobbins, M. I., Earls, M. F., McGuinn, L., ... & Wood, D. L. (2012). The lifelong effects of early childhood adversity and toxic stress. Pediatrics, 129(1), e232-e246.
Steele, C. M., & Aronson, J. (1995). Stereotype threat and the intellectual test performance of African Americans. Journal of personality and social psychology, 69(5), 797.
Sum, A., Khatiwada, I., & McLaughlin, J. (2009). The consequences of dropping out of high school: Joblessness and jailing for high school dropouts and the high cost for taxpayers. Center for Labor Market Studies Publications.
Sweeten, G. (2006). Who will graduate? Disruption of high school education by arrest and court involvement. Justice Quarterly, 23(4), 462-480.
Teplin, L. A., McClelland, G. M., Abram, K. M., & Mileusnic, D. (2005). Early violent death among delinquent youth: a prospective longitudinal study. Pediatrics, 115(6), 1586-1593.
U.S. Department of Health and Human Services. (2012). About healthy people 2020. Retrieved from http://www.healthypeople.gov/2020/about/default.aspx
Wallace Jr, J. M., Goodkind, S., Wallace, C. M., & Bachman, J. G. (2008). Racial, ethnic, and gender differences in school discipline among US high school students: 1991-2005. The Negro Educational Review, 59(1-2), 47.
Western, B. (2002). The impact of incarceration on wage mobility and inequality. American Sociological Review, 526-546.
Williams, D. R., & Mohammed, S. A. (2009). Discrimination and racial disparities in health: Evidence and needed research. Journal of Behavioral Medicine, 32(1), 20-47.
Wodtke, G. T., Harding, D. J., & Elwert, F. (2011). Neighborhood effects in temporal perspective the impact of long-term exposure to concentrated disadvantage on high school graduation. American Sociological Review, 76(5), 713-736.
Zimmerman R., Li W., Lee E., Lasner-Frater L., Van Wye G., Kelley D., Kennedy J., Maduro G., & Sun Y. (2015). Summary of Vital Statistics, 2013: Mortality. New York, NY: New York City Department of Health and Mental Hygiene, Office of Vital Statistics.
References
DISPARITY REPORT 74