Embed Size (px)
Citation preview
1
DISMT – Determination of Mixing Time through Color Changes
Lynn A Melton*, C.W. Lipp, R. W. Spradling, K.A. PaulsonEngineering Sciences, Fluid Mechanics and Mixing Group
Dow Chemical Company, B-1226Freeport, TX 77541
ABSTRACT
The DISMT (“Dual Indicator System for Mixing Time”) mixing time/distancediagnostic encodes semi-quantitative visualization of liquid/liquid mixing processes incolor changes. In DISMT, two liquids, one red and one blue, are mixed to produce ayellow liquid. Through appropriate choice of the acid-base indicators used, and the initialpH’s of the two solutions, the yellow liquid appears only in those regions where the mixingfraction is within a designated fractional deviation (say 5%) of the infinite time mixingfraction. Thus, the 95% mixing time/distance can be defined, for the whole volume of themixing system, as the time/distance for all of the liquid to become yellow.
This paper describes: (1) the principles underlying and choices involved in thedesign of DISMT systems, (2) protocols for carrying out DISMT-based experiments, and(3) examples of results obtained with DISMT.
Accepted for publication on Chemical Engineering Communications, (2001).
Keywords: colorimetry, diagnostic, fluid mechanics, imaging, instrumentation, mixing
*Corresponding Author: permanent address is Department of Chemistry, University ofTexas at Dallas, Box 830688, Richardson, TX, 75083-0688, fax: (972) 833-2925,[email protected].
2
I. Introduction
There are several classes or types of industrial mixing problems in which theapproach to the final homogeneous state is critical to the design engineer. The problemscan be as commonplace as the tank mix blend time for homogeneous blending operation oras specific as the design of a continuous reactor in which a static or dynamic mixer isrequired in order to minimize formation of undesired byproduct. Frequently, acharacteristic mixing time has been used to provide an (oversimplified) summary of themixing process. However, in those cases in which the development of the design permitsthe use of an optically accessible mixing system, a much more informative variety of fluidflow and mixing diagnostics may be applied. This paper describes one such diagnostic.
Mixing is fundamentally the evolution in time of spatially dependentconcentrations toward a final homogeneous state. In an ideal world, researchers studyingmixing processes would have access to concentration maps of the relevant species in theentire vessel as a function of time. In the current world, researchers have to deal with lessthan ideal data. Chemical sampling is intrusive and provides point-wise data at very lowsampling rates. Colorimetric probes are intrusive and provide point-wise data as acontinuous function of time. Planar laser induced fluorescence measurements are non-intrusive and provide 2-D concentration images, at typical sampling rates of only a fewhertz. Other useful techniques fall within these bounds. All fall considerably short of thegoal of quantitative concentrations measured non-intrusively for the whole volume of thevessel at arbitrary sampling times. The reaction-based colorimetric diagnostic methoddescribed in this report attempts to address part of these limitations; it provides semi-quantitative, but valuable, concentration information coupled with the possibility ofcomplete interrogation of the vessel volume and arbitrarily fast time sampling.
DISMT (“Double Indicator System for Mixing Time”) reduces the range ofconcentration information reported to the question “Have these two liquids mixed on amolecular level within a specified fraction (say 5%) of the mixing fraction which will beattained in the whole vessel at infinite time?”, and it encodes the answer in the colors of theevolving mixture. It is hoped that the simplicity of use and the directness of the mixinginformation reported will stimulate experiments that provide substantial “engineeringinsight” into the dynamics of mixing.
DISMT makes use of two standard acid-base indicators, methyl red (red to yellow,pK ~ 5) and thymol blue (yellow to blue, pK ~ 9). Both indicators are added to bothunmixed solutions. A red (acidic) solution is mixed with a blue (basic) solution, and inthose regions where the mixing fraction is within 5% of the mixing fraction at infinitetime, the solution is yellow. With a clear mixing vessel, an observer may see distinct redand blue regions as well as the later emergence of yellow regions. With DISMT, the 95%mixing time for the entire vessel may be defined as the time for the entire liquid volume tobecome yellow.
3
The following discussion of the role and utility of various mixing diagnosticsmakes substantial use of a review developed as part of a student thesis[1]. The examples areintended to be illustrative rather than exhaustive.
DISMT is a reaction-based diagnostic, and thus color changes occur only whenreactants have been mixed at the molecular level. Such reaction-based diagnostics avoidthe ambiguities associated with dilution diagnostics and the phenomena generally referredto as “micromixing”[2]. With dilution based diagnostics, in which for example, a non-reactive tracer dye is added to a mixing tank, the finite sampling volume of any detectionsystem may include elements of liquid which are much smaller than the detection volumebut which have not mixed on a molecular level. The detector will report only the overallmixing fraction and will not distinguish between dispersed and molecularly mixed fluids.
Many elegant reaction-based methods have been developed to characterize the ratesof mixing. These include the use of competitive parallel reactions [3-6], and fluorescence-based measurements of turbulent fluctuations[7-8]. The methods work well, but becausethey make use of point-wise sampling, they report results which provide little insight intothe dynamics of the mixing process.
Colorimetric methods include inert and reactive dye tracers[9] and discoloration ofcolored species by reactions[10]. When these methods are used in a volumetric – rather thanpoint-wise fashion, they can provide substantial information about the dynamics of mixing.However, because the mixing information is encoded in the intensity of the transmittedlight, these methods can give ambiguous results along the line of sight. The “oneindicator” methods cannot give information about a range, say +/- 5% of ideal, for themixing fractions.
Planar laser induced fluorescence methods provide excellent spatial resolution,without the ambiguities associated with viewing along the line of sight, for a selected planewithin the mixing vessel. A variety of mixing studies have made use of planar laserinduced fluorescence, with either simple dilution[11-14] or with acid-base reactions [15-22].Most of the acid-base fluorescence studies have used fluorescein, whose fluorescence turnson for pH>4. More recently, dual emission fluorescence systems have be described inwhich mixing information is encoded in changes in the emission spectra rather than inintensities[23]. A fluorescent diagnostic system in which the shift in the fluorescence of asolvatochromatic dye was used to image the mixing fraction in a decane/ethanol systemhas been described[1]. These last two systems, with their emphasis on spectra rather thanintensities, are analogous to the colorimetric DISMT system described in this work.
This paper describes: (1) the principles underlying and choices involved in thedesign of DISMT systems, (2) protocols for carrying out DISMT-based experiments, and(3) examples of results obtained with DISMT. Because the DISMT methods are cheap anddo not give fully quantitative information, it is expected that they will find their mostnatural use in visualization for “engineering design”, i.e., in the heuristic design and testingof mixing systems.
4
II. Design of DISMT Systems
The fundamental idea underlying the DISMT method is that two color changes areused to mark two acid-base mixing fractions, fl = (1-δ)*f∞ and fh = (1+δ)*f∞, where f∞ isthe acid mixing fraction at infinite time. By appropriate adjustment of the initial pH’s ofthe two liquids to be mixed, the pH’s at these two mixing fractions will be the pKa of thebasic indicator and the pKa of the acidic indicator, respectively. However, a variety ofissues such as properties of appropriate pH indicators, routine use, sensitivity to mixingfraction, and interpretation of the color changes must be addressed.
A. Acid-Base Chemistry
The chemistry underlying DISMT is that of a strong acid/strong base aqueoustitration in the presence of two weak acids, the pH indicators. The titration equation[24] is(Ricci, 1952):
H – OH = as – bs + (aα)1 +(aα)2 (1)
where H = molar concentration of H+;OH = molar concentration of OH-;as = molar concentration of strong acid;bs = molar concentration of strong base;ai = molar concentration of indicator i (in both acid and base forms, i=1,2);αi = fraction of indicator i in base form = Ai/(Ai +H), (i = 1,2);Ai = acid dissociation constant for indicator i, = 10-pKai, (i=1,2).
In acid solution OH results from the water equilibrium (and vice versa for basic solutions),and hence Equation 1 becomes, in fuller form,
H – W/H = H – W/OH = as –bs +a1A1/(A1+H) + a2A2/(A2+H) (2)
where W is the dissociation constant for water. In any element of the mixing liquids, as =f*aso and bs = (1-f)*bso, where aso is the concentration of strong acid in the initial, unmixed,acid solution, bso is the concentration of strong base in the initial, unmixed, basic solution,and f is the volumetric mixing fraction of the acid solution [= Va/(Va +Vb)]. Va and Vb arethe volumes of the acid solution and basic solution, respectively, in the element. The finalequation is as given in Equation 3:
H – W/H = f*aso – (1- f)*bso +a1A1/(A1+H) + a2A2/(A2+H) (3)
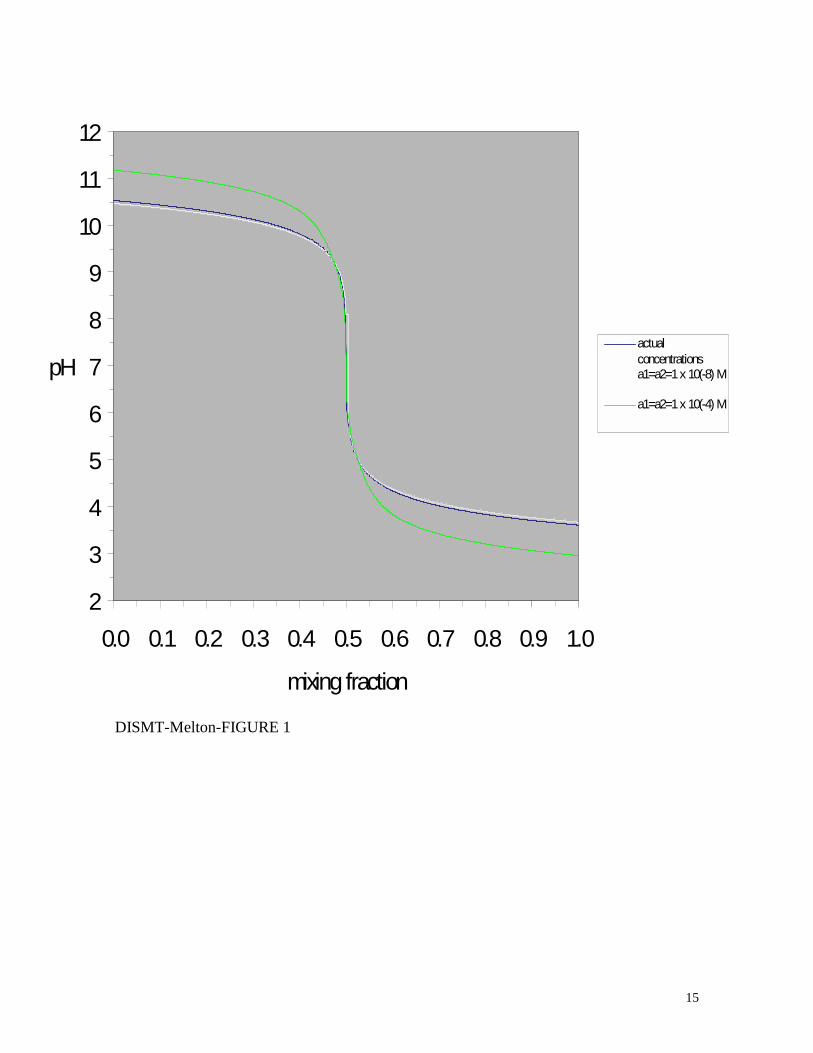
If a1 = a2 = 0, Equation 3 describes a strong acid/strong base titration, in which thepH changes strongly in the vicinity of log√W ≅ 7.00. Figure 1 shows the pH as a functionof the mixing fraction f, as calculated on the basis of Equation 3, for three such titrations:a1 = a2 = 1 x 10⁻⁸ M, a1= 5 x 10⁻⁶ M, a2 = 2.5 x 10⁻⁶ M (DISMT system used indemonstrations), and a1 = a2 =1 x 10⁻⁴ M. The first two curves are virtually identical. Thethird curve differs substantially, an effect that will be discussed in Section IV.C.
Figure 1

5
If expanded, Equation 3 yields a quartic polynomial, and direct solution is notfeasible. It must be solved by iterative methods.
B. Choice and Use of Indicators
The properties of an acid–base indicator which are most important are the colors orthe acid and base forms, the pKa at which the color changes, and the sensitivity toenvironmental (temperature and ionic strength) effects. The indicator should also becommercially available, be inexpensive, and have low toxicity.
1. Desired pKa
In designing acid-base titrations for quantitative analysis, it is generallyrecommended that a pH change of 1-2 units is necessary to cause a color change sufficientto define a sharp end point. In the design of DISMT, the sharpest change of pH withmixing fraction f occurs near pH = 7, and consequently acid-base indicators with pKa’sclose to 7 will show the sharpest color change with as a function of f. However, if thepKa’s are too close to 7, small errors due to impurities can have significant effects. Thecurrent DISMT system makes use of methyl red (pKa = 5.0) and thymol blue (pKa = 9.2) asa compromise between sensitivity to mixing fraction and insensitivity to impurities.
2. Colors and Concentrations
As the pH increases, methyl red turns from red [ε(λmax = 522 nm) = 1.74 x10⁴ L/(M-cm)] to yellow [ε(λmax = 428 nm) = 1.58 x 10⁴ L/(M-cm)] at about pH =5, andthymol blue turns from yellow [ε(λmax = 432 nm) = 1.27 x 10⁴ L/(M-cm)] to blue [ε(λmax =595 nm) = 2.84 x 10⁴ L/(M-cm)] at about pH = 9. Both indicators are yellow in the pHrange 5-9, the “mixed within tolerance” range, and thus the identification of yellow as“mixed within tolerance” does not depend on the concentrations of the indicators. Whenthe pH is equal to the pKa for methyl red (concentrations of the acid and base forms of theindicator are equal), the solution appears orange. When the pH is equal to the pKa forthymol blue the solution appears green.
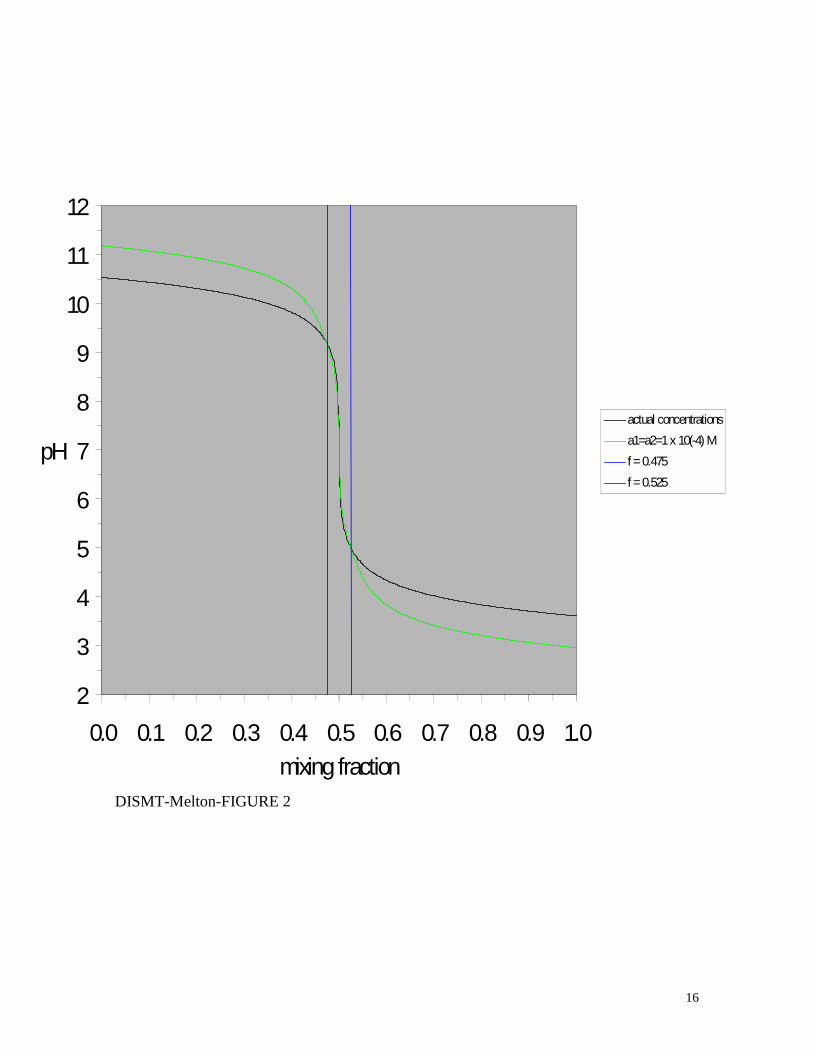
The DISMT method is designed so that pH(fl) = pKa(methyl red) and pH(fh) =pKa(thymol blue), where fl = (1-δ)*f∞ and fh = (1 + δ)*f∞. Figure 2 illustrates this effect;ideally, for f < fl the solution is blue, for fl < f < fh the solution is yellow, and for f >fh trhesolution is red. Based on the experience gained in developing and testing the DISMTmethod, it seems that most observers perceive the color change as sharpest for δ about afactor of 2-3 larger than the design value of δ. Thus if one wishes an observer to perceivethe zones in which the liquids are mixed within 5% of f∞, the DISMT calculations shouldbe based on a δ which is a factor of 2-3 smaller than 0.05. In deciding what value of δ touse, the user must judge what qualitative/semi-quantitative information is desired. [It isquite possible that videotaping of the mixing experiment and subsequent computer-basedhue sensitive analysis of the images can resolve this question of perception, but suchtechniques have not been pursued in this work. DISMT, as with any colorimetric method,
6
suffers from ambiguities along the line of sight, and the color of any particular portion ofthe mixture, viewed through liquid of a different color, may be distorted.]
Figure 2
The apparent color changes are sharper for higher concentrations (greater opticaldepth) of the indicators. Higher concentrations also result in sharper changes of pH with f,even though the indicators also act as buffers (see Section IV.C.). The concentrationsdescribed in this paper, 5 x 10⁻⁶ M and 2.5 x 10⁻⁶ M for methyl red and thymol blue,respectively, seem appropriate for a mixing tank 1 foot in diameter. Lower concentrationswould be appropriate for larger tanks, and vice versa.
For the jet mixing experiments which were part of the development of the DISMTmethod, the basic (blue) liquid was injected into initially quiescent acid (red) liquid. Thisorder was used because the blue liquid was perceived as more visible within the red liquid,rather than vice versa.
3. Sensitivity to Environmental Effects
For methyl red, pKa = 5.00 – 0.006*(t-20), for µ < 0.5, where t is thetemperature in degrees centigrade and µ is the ionic strength. For thymol blue, the pKa isindependent of temperature for t = 15-30 C, but depends significantly on the ionic strength(9.20, 9.01, 8.95, and 8.90, for µ = 0, 0.01, 0.05, and 0.10, respectively)[25] (Bishop, 1972).In addition the pKa for water is temperature dependent[26] (Lide, 1982).
4. Other
Both methyl red and thymol blue are commercially available from a variety ofsources. Users should consult the MSDS documents prior to use.
III. Experimental
A. Reagents and Chemical Apparatus
Methyl red, thymol blue and phenolphthalein were purchased from Aldrich.Approximately 0.100 N HCl and KOH were used to adjust the pH. De-ionized water wasused in all procedures. The pH meter and electrode (Orion 230A/9107 ATC triode) werecalibrated at 25 C with standard buffer solutions (pH = 7.00 and 10.00) purchased fromFisher. Ethanol was purchased from Fisher. All reagents were used as received.
Stock solutions of the indicators were prepared as follows: 202 mg of methyl redwas dissolved in 200 mL ethanol (denatured)and filtered to remove undissolved particles.10 mL of this solution in 7.5 L de-ionized water provided a concentration of 5E-6 M. 183mg of thymol blue was dissolved in 200 mL ethanol (denatured) and filtered to remove(numerous) particles. 10 mL of this solution in 7.5 L de-ionized water provided aconcentration of 2.5 x 10⁻⁶ M. The thymol blue solution appears to change color slightly
7
over the course of a few days, and it is recommended that it be prepared close to the timeof use.
B. Mixing Experiments and Apparatus
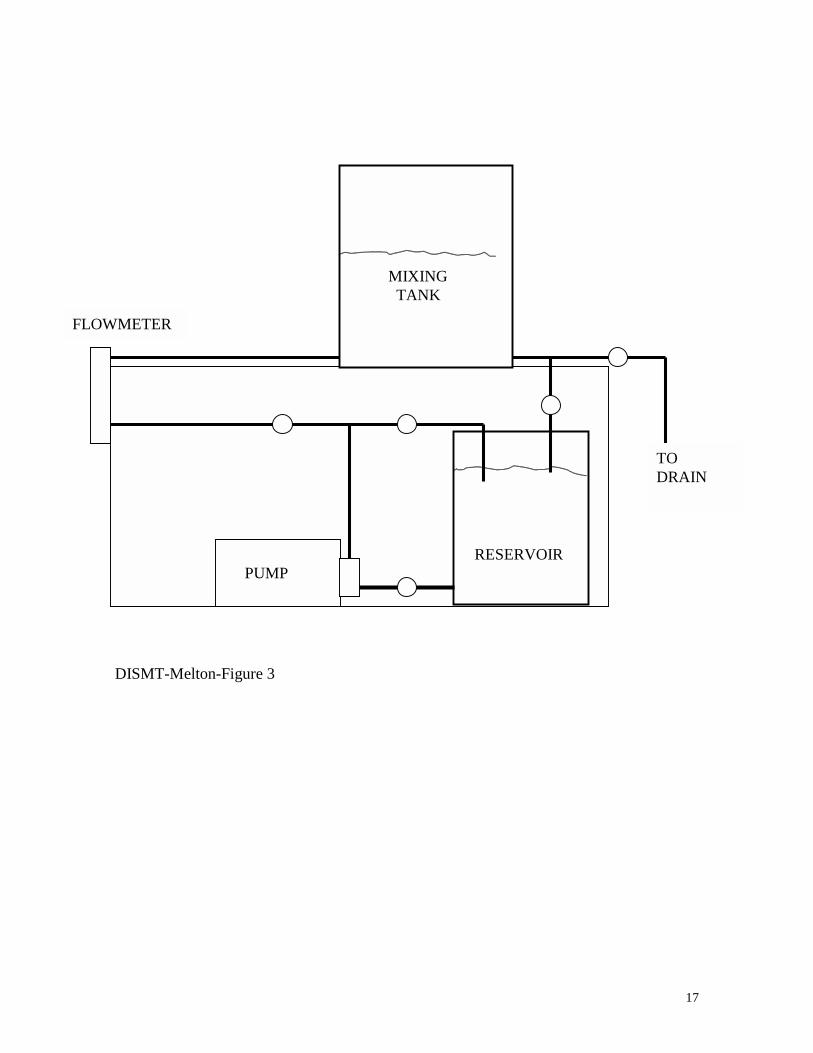
A simple jet mixing tank (30 cm inside diameter, 136 cm high, 1 cm ports 2.5 cm.from the bottom, 4 ports at 90 degrees) was used for developmental tests with the DISMTsystem. The pumping/mixing system consisted of two channels, each with a 2.2 galreservoir, pump, recycle loop and valve, and flow meter and valve. Flow rates up to 8L/min could be achieved. The mixed fluid in the tank could be drained back into thereservoirs for reuse. In a typical test, 6 L of the acidic (red) solution was pumped into themixing tank, and then 6L of the basic (blue) solution was pumped into the mixing tank.The entire procedure was videotaped in color from the side. Each video sequence includeda few seconds taping of a Color Checker® , a test pattern of 24 standard colors, to allowsubsequent standardization of video images[27] (Edmond, 1999). Figure 3 shows aschematic diagram of the mixing apparatus.
Figure 3
C. Preparation of Solutions to be Mixed
A program was prepared to accept input for a particular experiment (volumes to bemixed, δ, desired concentrations of indicators, temperature, ionic strengths, etc.), solveEquation 3 under various inputs, and provide output to the user. The program calculatesthe amounts of indicator solutions to be added, the initial pH’s, the amounts of strongacid/base to be added, and the composition of the test solutions. It also estimates theprecision with which a color change is associated with a particular δ.
The initial strategy was to use this program to calculate the desired initial pH’s,carefully, calibrate the pH meter and electrode, and to add acid (or base) dropwise to adjustthe pH within ± 0.02 pH units. However, it was found that many effects must beaccounted for in order to measure the pH to this accuracy and precision. (calibration curve,ionic strengths, sodium ion effects, temperature, etc), and reliable operation of the DISMTmethod could not be achieved. The effective strategy was to use a program to calculate theinitial pH’s and the amounts of strong acid/base needed to achieve them. A colorimetricprocedure, described in the following paragraph, was then used iteratively to set the pH ofthe base solution relative to that of the acid solution. Once this simple colorimetric setuptest was satisfied, satisfactory performance with the full scale mixing experiment wasreliably achieved.
In order to set up an experimental run, the calculated amounts of both indicatorswere added to both reservoirs. By dropwise addition of dilute HCl/KOH the pH in bothreservoirs was adjusted to 7.0±0.5. The calculated amounts of 0.100 N HCl (KOH) wereadded to the acid (base) reservoirs, respectively. Three 5.0 mL aliquots were pipetted into12 mL vials, and three calculated volumes (Vred, Vyellow, and Vgreen), corresponding tomixing fractions of f= (1-5*δ)*f∞, f∞, and (1+5*δ)*f∞, were added to the vials,respectively. If the relative pH’s were correct, the three vials showed balanced
8
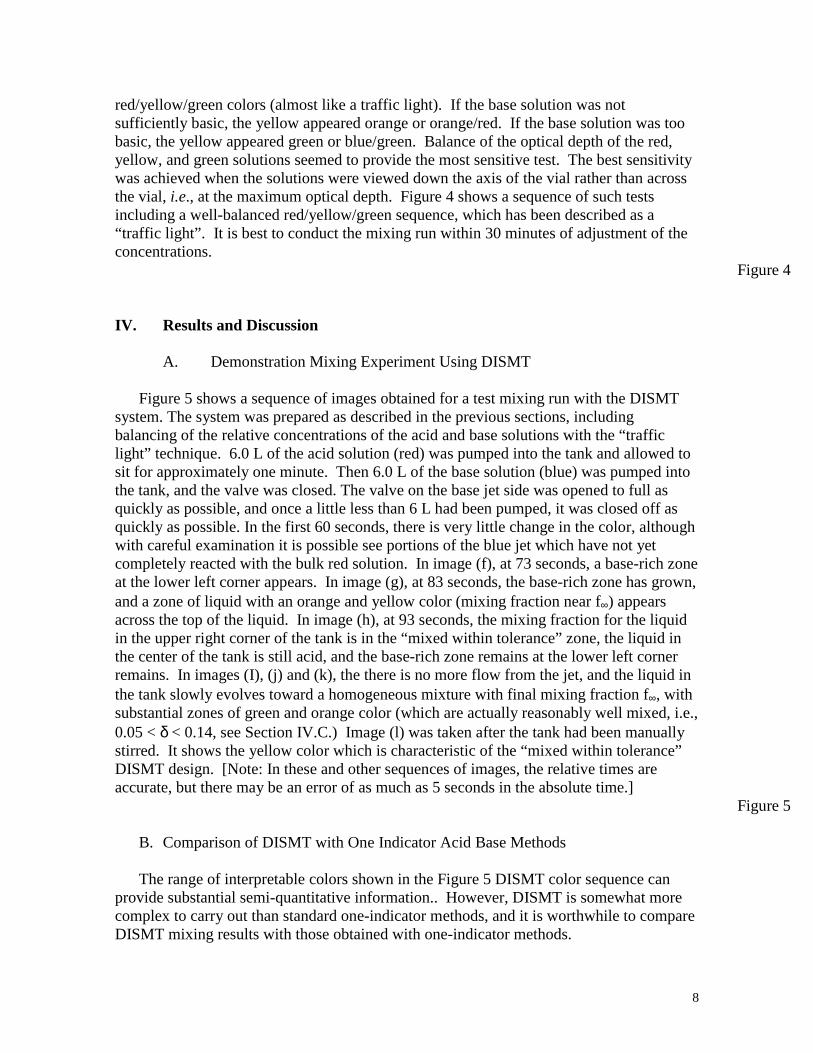
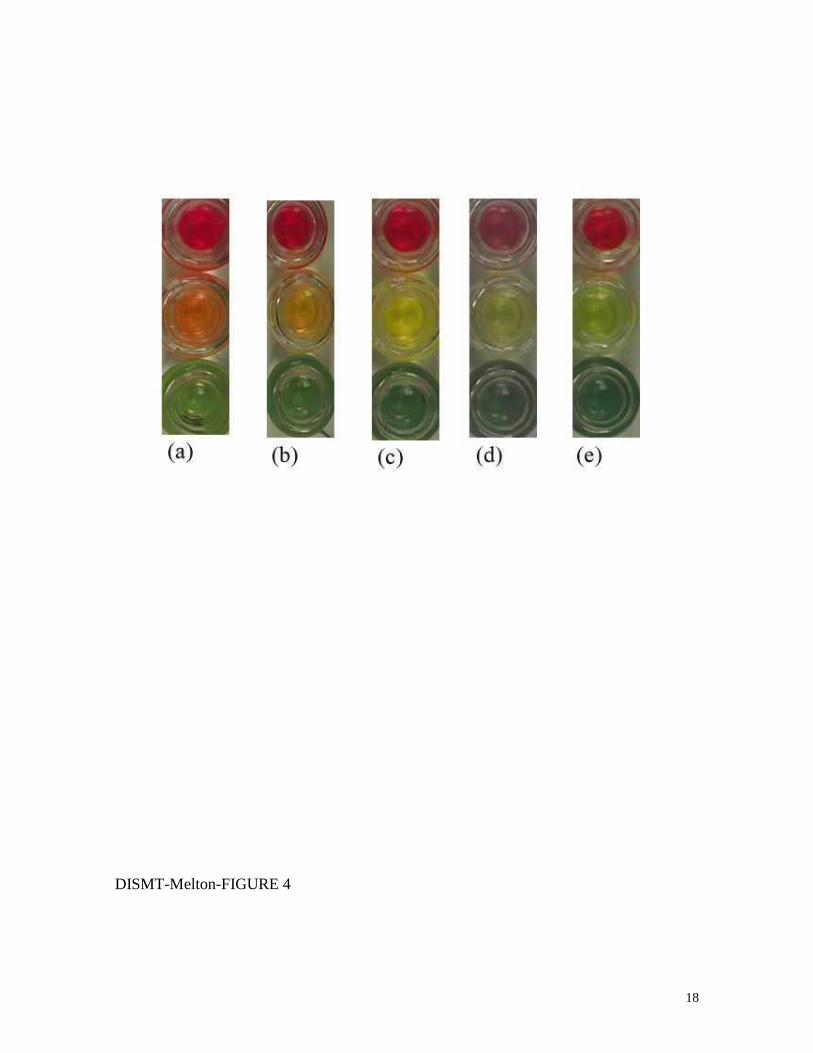
red/yellow/green colors (almost like a traffic light). If the base solution was notsufficiently basic, the yellow appeared orange or orange/red. If the base solution was toobasic, the yellow appeared green or blue/green. Balance of the optical depth of the red,yellow, and green solutions seemed to provide the most sensitive test. The best sensitivitywas achieved when the solutions were viewed down the axis of the vial rather than acrossthe vial, i.e., at the maximum optical depth. Figure 4 shows a sequence of such testsincluding a well-balanced red/yellow/green sequence, which has been described as a“traffic light”. It is best to conduct the mixing run within 30 minutes of adjustment of theconcentrations.
Figure 4
IV. Results and Discussion A. Demonstration Mixing Experiment Using DISMT
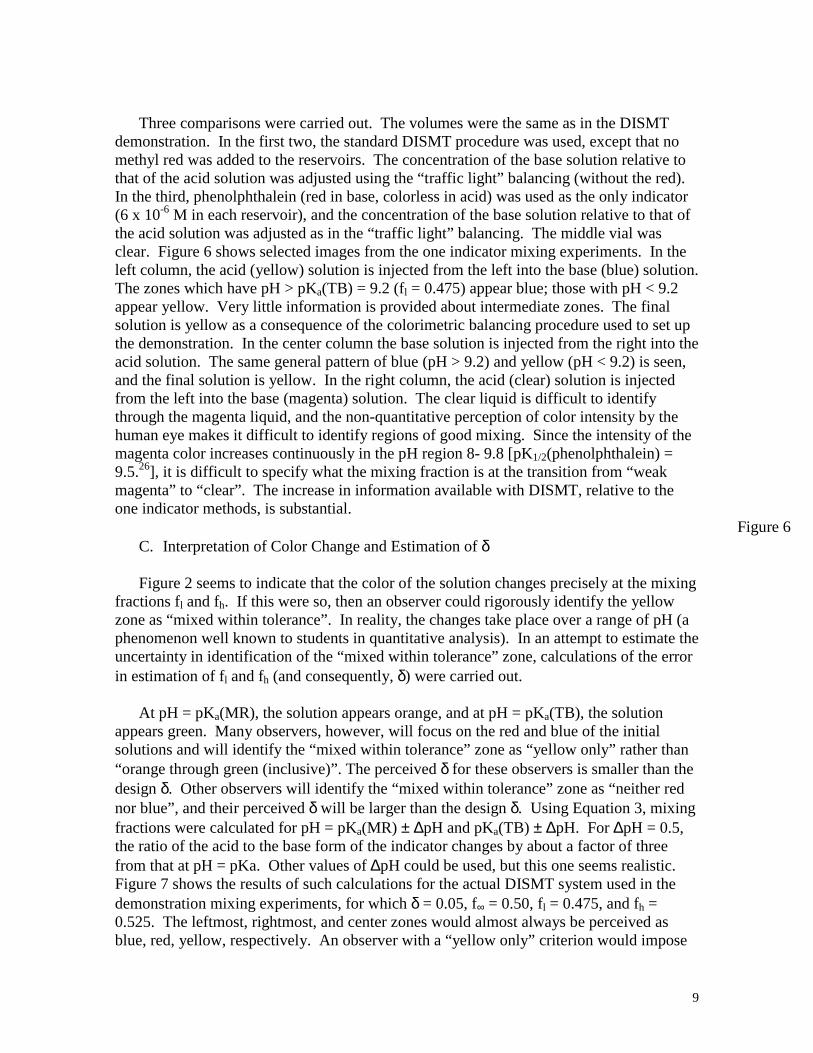
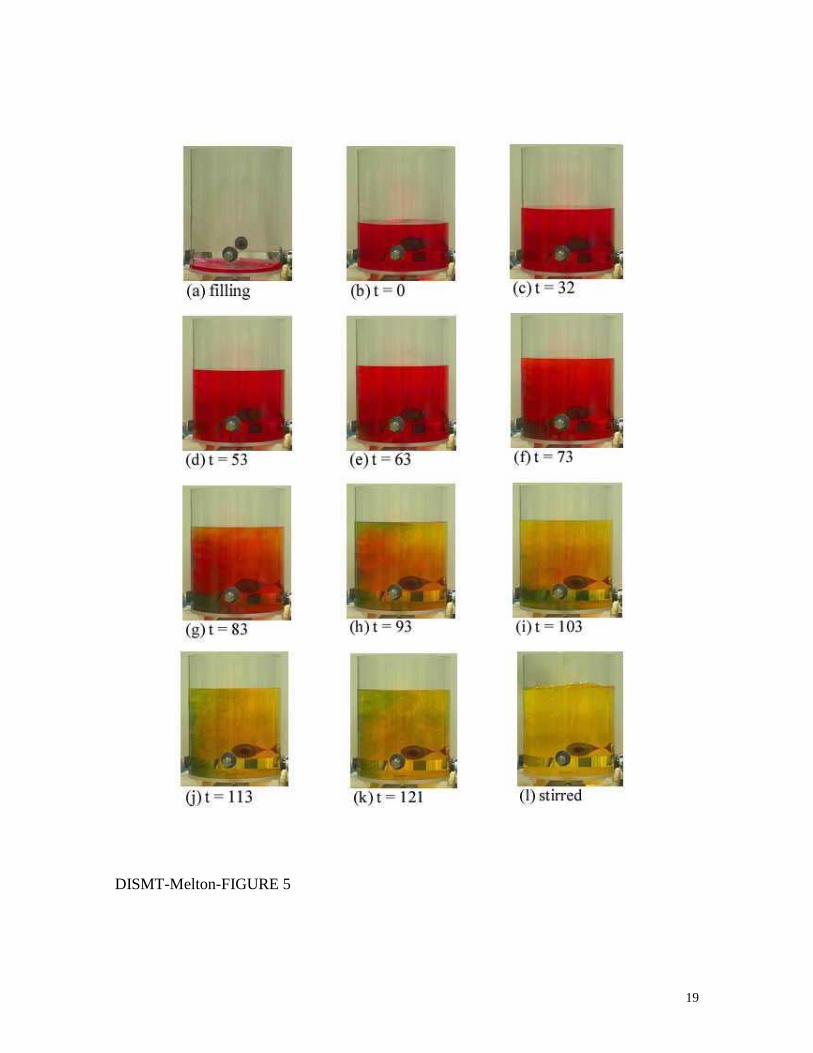
Figure 5 shows a sequence of images obtained for a test mixing run with the DISMTsystem. The system was prepared as described in the previous sections, includingbalancing of the relative concentrations of the acid and base solutions with the “trafficlight” technique. 6.0 L of the acid solution (red) was pumped into the tank and allowed tosit for approximately one minute. Then 6.0 L of the base solution (blue) was pumped intothe tank, and the valve was closed. The valve on the base jet side was opened to full asquickly as possible, and once a little less than 6 L had been pumped, it was closed off asquickly as possible. In the first 60 seconds, there is very little change in the color, althoughwith careful examination it is possible see portions of the blue jet which have not yetcompletely reacted with the bulk red solution. In image (f), at 73 seconds, a base-rich zoneat the lower left corner appears. In image (g), at 83 seconds, the base-rich zone has grown,and a zone of liquid with an orange and yellow color (mixing fraction near f∞) appearsacross the top of the liquid. In image (h), at 93 seconds, the mixing fraction for the liquidin the upper right corner of the tank is in the “mixed within tolerance” zone, the liquid inthe center of the tank is still acid, and the base-rich zone remains at the lower left cornerremains. In images (I), (j) and (k), the there is no more flow from the jet, and the liquid inthe tank slowly evolves toward a homogeneous mixture with final mixing fraction f∞, withsubstantial zones of green and orange color (which are actually reasonably well mixed, i.e.,0.05 < δ < 0.14, see Section IV.C.) Image (l) was taken after the tank had been manuallystirred. It shows the yellow color which is characteristic of the “mixed within tolerance”DISMT design. [Note: In these and other sequences of images, the relative times areaccurate, but there may be an error of as much as 5 seconds in the absolute time.]
Figure 5
B. Comparison of DISMT with One Indicator Acid Base Methods
The range of interpretable colors shown in the Figure 5 DISMT color sequence canprovide substantial semi-quantitative information.. However, DISMT is somewhat morecomplex to carry out than standard one-indicator methods, and it is worthwhile to compareDISMT mixing results with those obtained with one-indicator methods.
9
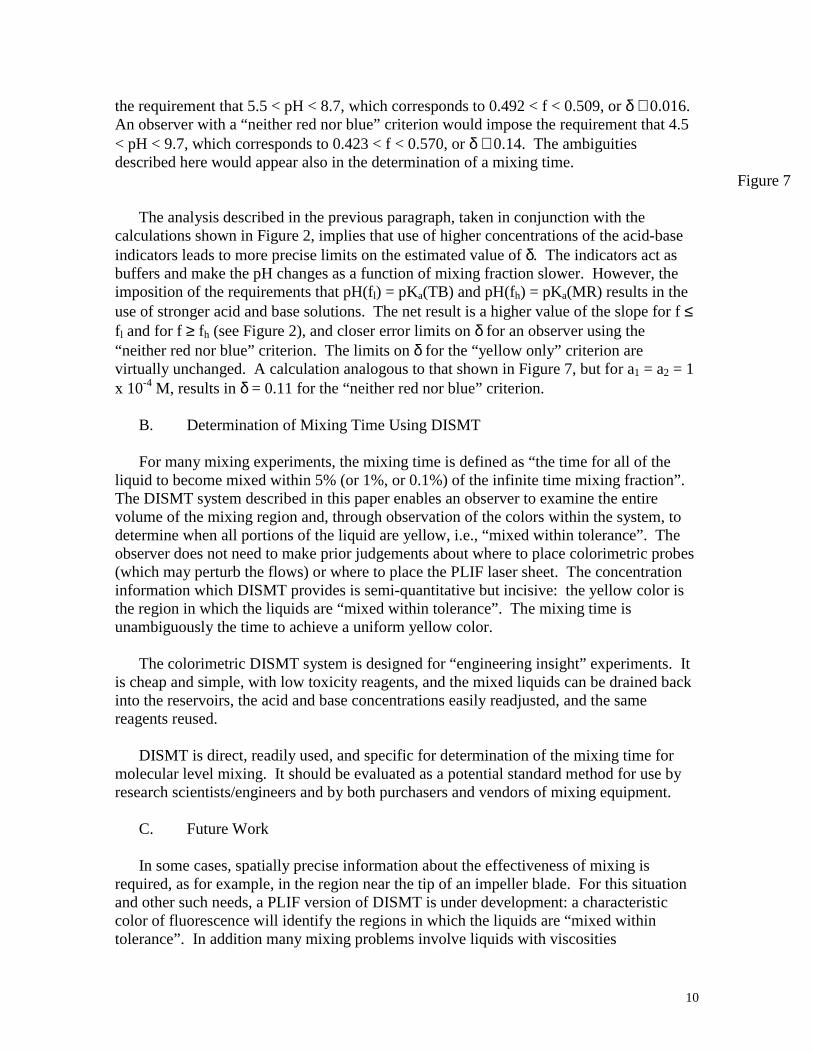
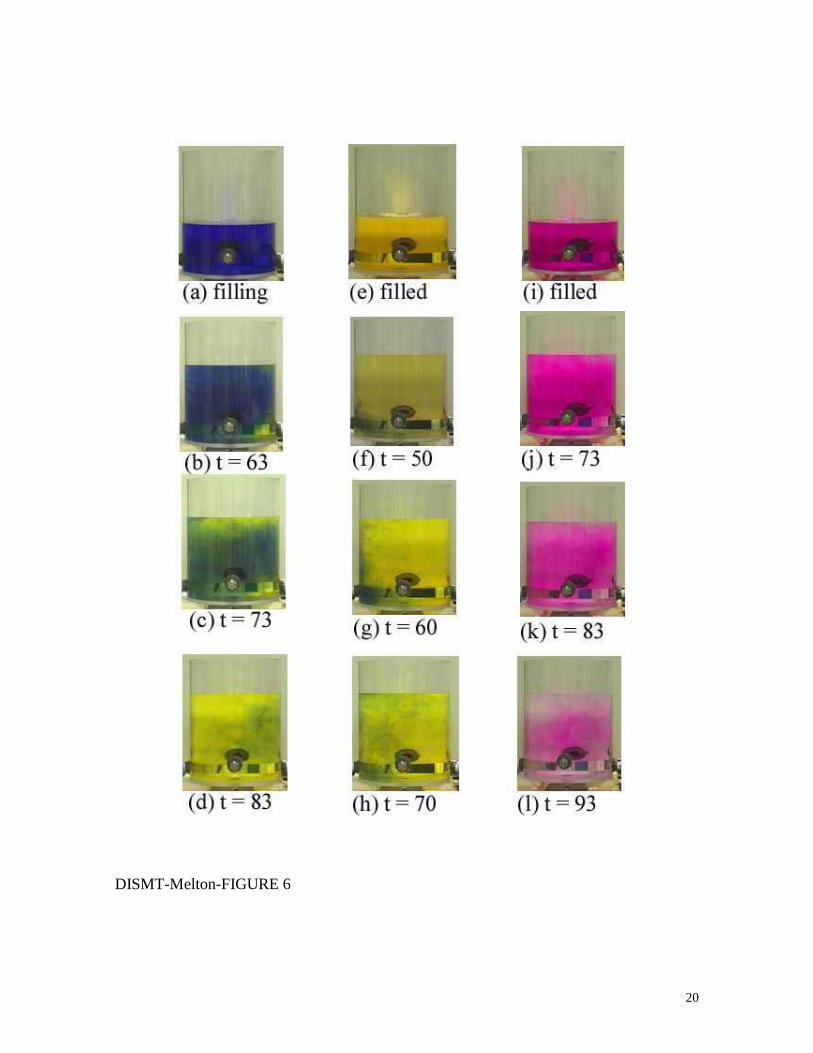
Three comparisons were carried out. The volumes were the same as in the DISMTdemonstration. In the first two, the standard DISMT procedure was used, except that nomethyl red was added to the reservoirs. The concentration of the base solution relative tothat of the acid solution was adjusted using the “traffic light” balancing (without the red).In the third, phenolphthalein (red in base, colorless in acid) was used as the only indicator(6 x 10⁻⁶ M in each reservoir), and the concentration of the base solution relative to that ofthe acid solution was adjusted as in the “traffic light” balancing. The middle vial wasclear. Figure 6 shows selected images from the one indicator mixing experiments. In theleft column, the acid (yellow) solution is injected from the left into the base (blue) solution.The zones which have pH > pKa(TB) = 9.2 (fl = 0.475) appear blue; those with pH < 9.2appear yellow. Very little information is provided about intermediate zones. The finalsolution is yellow as a consequence of the colorimetric balancing procedure used to set upthe demonstration. In the center column the base solution is injected from the right into theacid solution. The same general pattern of blue (pH > 9.2) and yellow (pH < 9.2) is seen,and the final solution is yellow. In the right column, the acid (clear) solution is injectedfrom the left into the base (magenta) solution. The clear liquid is difficult to identifythrough the magenta liquid, and the non-quantitative perception of color intensity by thehuman eye makes it difficult to identify regions of good mixing. Since the intensity of themagenta color increases continuously in the pH region 8- 9.8 [pK1/2(phenolphthalein) =9.5.26], it is difficult to specify what the mixing fraction is at the transition from “weakmagenta” to “clear”. The increase in information available with DISMT, relative to theone indicator methods, is substantial.
Figure 6C. Interpretation of Color Change and Estimation of δ
Figure 2 seems to indicate that the color of the solution changes precisely at the mixingfractions fl and fh. If this were so, then an observer could rigorously identify the yellowzone as “mixed within tolerance”. In reality, the changes take place over a range of pH (aphenomenon well known to students in quantitative analysis). In an attempt to estimate theuncertainty in identification of the “mixed within tolerance” zone, calculations of the errorin estimation of fl and fh (and consequently, δ) were carried out.
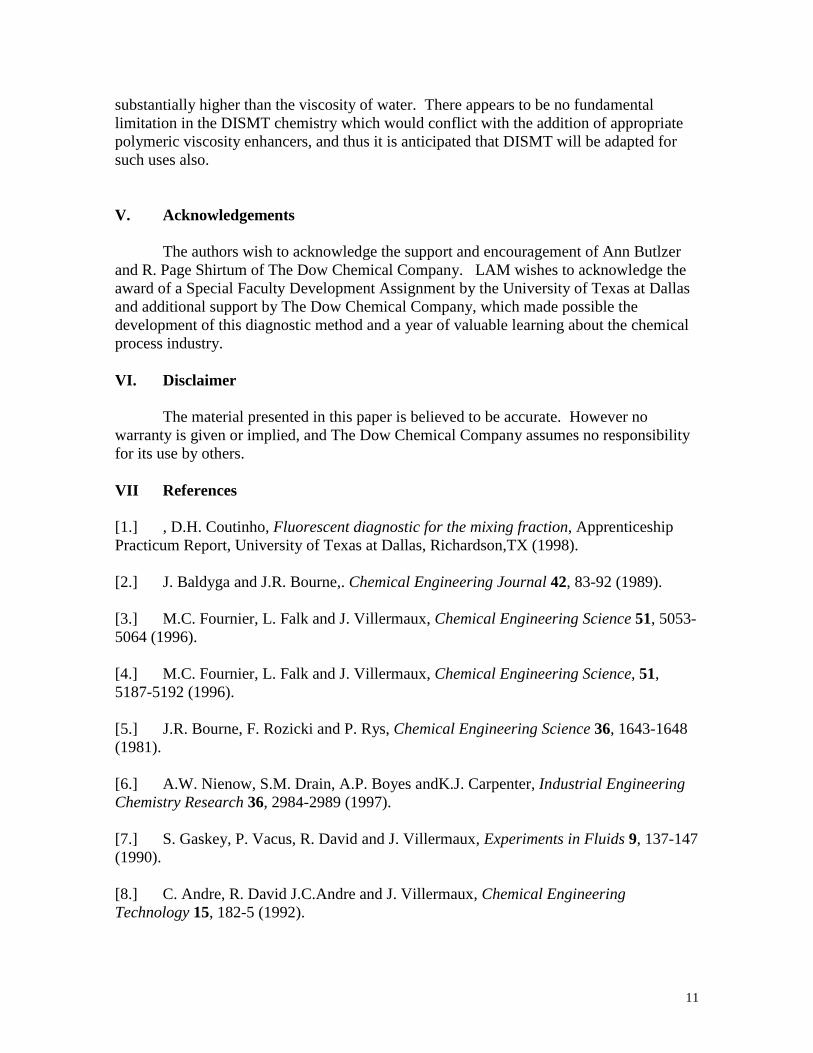
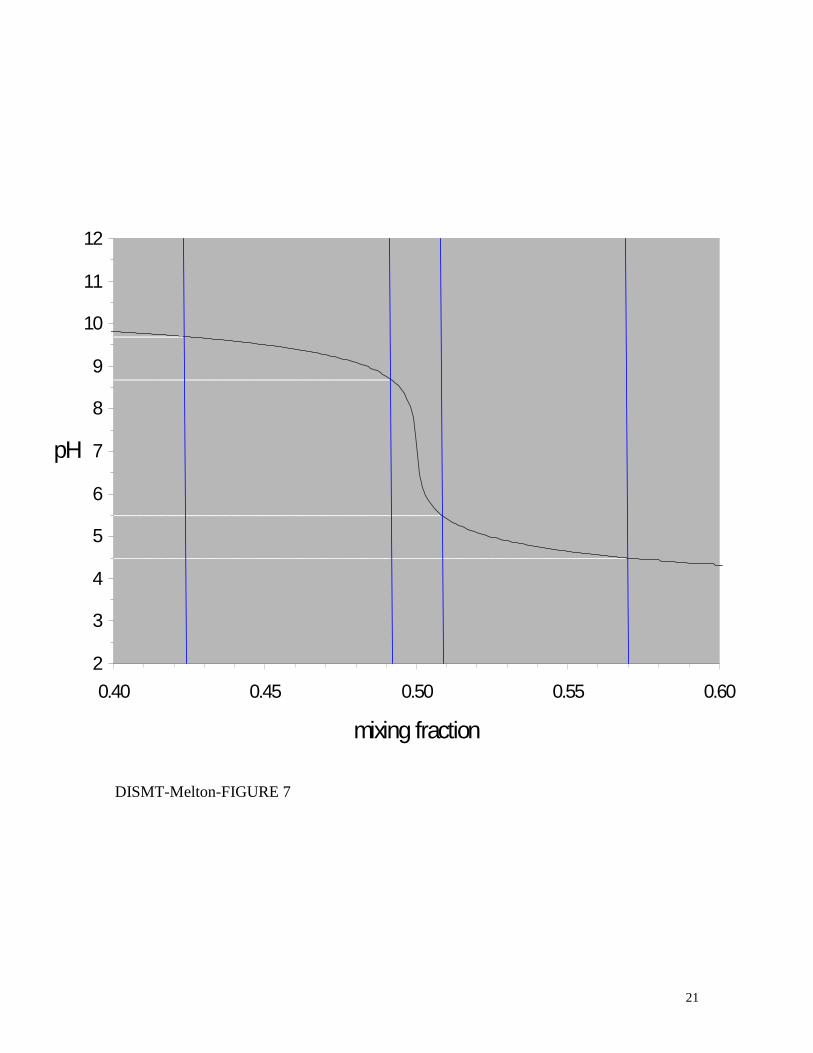
At pH = pKa(MR), the solution appears orange, and at pH = pKa(TB), the solutionappears green. Many observers, however, will focus on the red and blue of the initialsolutions and will identify the “mixed within tolerance” zone as “yellow only” rather than“orange through green (inclusive)”. The perceived δ for these observers is smaller than thedesign δ. Other observers will identify the “mixed within tolerance” zone as “neither rednor blue”, and their perceived δ will be larger than the design δ. Using Equation 3, mixingfractions were calculated for pH = pKa(MR) ± ∆pH and pKa(TB) ± ∆pH. For ∆pH = 0.5,the ratio of the acid to the base form of the indicator changes by about a factor of threefrom that at pH = pKa. Other values of ∆pH could be used, but this one seems realistic.Figure 7 shows the results of such calculations for the actual DISMT system used in thedemonstration mixing experiments, for which δ = 0.05, f∞ = 0.50, fl = 0.475, and fh =0.525. The leftmost, rightmost, and center zones would almost always be perceived asblue, red, yellow, respectively. An observer with a “yellow only” criterion would impose
10
the requirement that 5.5 < pH < 8.7, which corresponds to 0.492 < f < 0.509, or δ ≅ 0.016.An observer with a “neither red nor blue” criterion would impose the requirement that 4.5< pH < 9.7, which corresponds to 0.423 < f < 0.570, or δ ≅ 0.14. The ambiguitiesdescribed here would appear also in the determination of a mixing time.
Figure 7
The analysis described in the previous paragraph, taken in conjunction with thecalculations shown in Figure 2, implies that use of higher concentrations of the acid-baseindicators leads to more precise limits on the estimated value of δ. The indicators act asbuffers and make the pH changes as a function of mixing fraction slower. However, theimposition of the requirements that pH(fl) = pKa(TB) and pH(fh) = pKa(MR) results in theuse of stronger acid and base solutions. The net result is a higher value of the slope for f ≤fl and for f ≥ fh (see Figure 2), and closer error limits on δ for an observer using the“neither red nor blue” criterion. The limits on δ for the “yellow only” criterion arevirtually unchanged. A calculation analogous to that shown in Figure 7, but for a1 = a2 = 1x 10⁻⁴ M, results in δ = 0.11 for the “neither red nor blue” criterion.
B. Determination of Mixing Time Using DISMT
For many mixing experiments, the mixing time is defined as “the time for all of theliquid to become mixed within 5% (or 1%, or 0.1%) of the infinite time mixing fraction”.The DISMT system described in this paper enables an observer to examine the entirevolume of the mixing region and, through observation of the colors within the system, todetermine when all portions of the liquid are yellow, i.e., “mixed within tolerance”. Theobserver does not need to make prior judgements about where to place colorimetric probes(which may perturb the flows) or where to place the PLIF laser sheet. The concentrationinformation which DISMT provides is semi-quantitative but incisive: the yellow color isthe region in which the liquids are “mixed within tolerance”. The mixing time isunambiguously the time to achieve a uniform yellow color.
The colorimetric DISMT system is designed for “engineering insight” experiments. Itis cheap and simple, with low toxicity reagents, and the mixed liquids can be drained backinto the reservoirs, the acid and base concentrations easily readjusted, and the samereagents reused.
DISMT is direct, readily used, and specific for determination of the mixing time formolecular level mixing. It should be evaluated as a potential standard method for use byresearch scientists/engineers and by both purchasers and vendors of mixing equipment.
C. Future Work
In some cases, spatially precise information about the effectiveness of mixing isrequired, as for example, in the region near the tip of an impeller blade. For this situationand other such needs, a PLIF version of DISMT is under development: a characteristiccolor of fluorescence will identify the regions in which the liquids are “mixed withintolerance”. In addition many mixing problems involve liquids with viscosities
11
substantially higher than the viscosity of water. There appears to be no fundamentallimitation in the DISMT chemistry which would conflict with the addition of appropriatepolymeric viscosity enhancers, and thus it is anticipated that DISMT will be adapted forsuch uses also.
V. Acknowledgements
The authors wish to acknowledge the support and encouragement of Ann Butlzerand R. Page Shirtum of The Dow Chemical Company. LAM wishes to acknowledge theaward of a Special Faculty Development Assignment by the University of Texas at Dallasand additional support by The Dow Chemical Company, which made possible thedevelopment of this diagnostic method and a year of valuable learning about the chemicalprocess industry.
VI. Disclaimer
The material presented in this paper is believed to be accurate. However nowarranty is given or implied, and The Dow Chemical Company assumes no responsibilityfor its use by others.
VII References
[1.] , D.H. Coutinho, Fluorescent diagnostic for the mixing fraction, ApprenticeshipPracticum Report, University of Texas at Dallas, Richardson,TX (1998).
[2.] J. Baldyga and J.R. Bourne,. Chemical Engineering Journal 42, 83-92 (1989).
[3.] M.C. Fournier, L. Falk and J. Villermaux, Chemical Engineering Science 51, 5053-5064 (1996).
[4.] M.C. Fournier, L. Falk and J. Villermaux, Chemical Engineering Science, 51,5187-5192 (1996).
[5.] J.R. Bourne, F. Rozicki and P. Rys, Chemical Engineering Science 36, 1643-1648(1981).
[6.] A.W. Nienow, S.M. Drain, A.P. Boyes andK.J. Carpenter, Industrial EngineeringChemistry Research 36, 2984-2989 (1997).
[7.] S. Gaskey, P. Vacus, R. David and J. Villermaux, Experiments in Fluids 9, 137-147(1990).
[8.] C. Andre, R. David J.C.Andre and J. Villermaux, Chemical EngineeringTechnology 15, 182-5 (1992).

12
[9.] A. Togatorop, R. Mann and D.F. Schofield, D.F., AIChE Symposium Series 90(299), 19-32 (1994).
[10.] C. Baudou, C. Xuereb, and J. Bertrand, Canadian Journal of Chemical Engineering75, 653-663 (1997).
[11.] I. Houcine, B. Marcant, H. Vivier, E. Plasari, R. David, and J. Villermaux,ICHEME Symposium Series 136, 97-104 (1994).
[12.] Distelhoff, M.F.W., Marquis, A.J., Nouri, J.M, & Whitelaw, J.H. (1997). Scalarmixing measurements in batch operated stirred tanks. Canadian Journal of ChemicalEngineering, 641-652.
[13.] I. Houcine, H. Vivier, E. Plasari, R. David J. Villermaux, Experiments in Fluids 22,95-102 (1996).
[14.] H. Vivier, I. Houcine, E. Plasari, R. David, R. and J.Villermaux, Proceeding of the.4th International Conference on Fluid Control, Fluid Measurement and Visualization,Toulouse, 4, 1107-1113 (1994).
[15.] M.M. Koochefahani, P.E., Dimotakis, and J.E. Broadwell, AIAA Journal 23, 1191-1194 (1985).
[16.] M.M. Koochefahani and P.E. Dimotakis, P.E, Journal of Fluid Mechanics 170, 83-112 (1986).
[17.] H.J. Catarakis, and P.E. Dimotakis, Physical Review Letters 77, 3795-3798 (1996).
[18.] H.J. Catarakis, and P.E. Dimotakis, Journal of Fluid Mechanics 317, 369-406(1996).
[19.] W.J.A. Dahm and P.E. Dimotakis, Journal of Fluid Mechanics 217, 299-330(1990).
[20.] W.J.A. Dahm and P.E. Dimotakis, AIAA Journal 25, 1216-1223 (1990).
[21.] P.E. Dimotakis, R.C. Miake-Lye, and D.A. Papantoniou, Physics of Fluids 26,3185-3192 (1983).
[22.] P.L. Miller and P.E. Dimotakis, Journal of Fluid Mechanics 308, 129-146 (1996).
[23.] J. Coppeta and C. Rogers, Experiments in Fluids 25, 1-15 (1998).
[24] J.E. Ricci, Hydrogen Ion Concentration, Chapter 11. Princeton University Press,Princeton, NJ. (1952).
13
[25.] E. Bishop, Ed., International Series of Monographs in Analytical Chemistry,Volume 51, Indicators. pp 82-115. Pergamon Press, New York, NY. (1972)
[26.] D.R. Lide, Ed., Handbook of Chemistry and Physics, 62nd Edition. p D-145. CRCPress, Boca Raton, FL (1982).
[27.] Catalog, Edmund Scientific Company, Barrington, NJ, item #H37756 (1999).Color Checker® is a trade designation of the GreytagMacbeth™ Company.
14
Figure Captions
1. pH versus mixing fraction f
2. pH versus mixing fraction. Vertical lines are the values of fl and fh (pH = pKa). Ina ideal DISMT system, for f < fl, the solution is blue; for fl < f < fh, yellow; and forf > fh, red.
3. Schematic view of mixing apparatus (side view, only onereservoir/pump/flowmeter system is shown)
4. Colors obtained in colorimetric pH balance procedure (traffic light). (a) baseconcentration is significantly weak compared to the acid solution, column, (b) baseconcentration is modestly weak, (c), correct balance, (d), base concentration ismodestly strong, and (e) base concentration is significantly strong.
5. Jet mixing sequence obtained with DISMT method. Time is in seconds after thestart of the mixing flow (jet is from the right)
6. Jet mixing sequences obtained with one indicator methods. Time is in secondsafter the start of the mixing flow. For the mixing of acid (yellow) solution intobase (blue) [left column] and for the phenolphthalein mixing[right column], the jetis from the left; for the mixing of base (blue) into acid (yellow) [center column] thejet is from the right.
7. Estimation of δ for ∆pH = 0.5. a1 = 5.0 x 10⁻⁶ M; a2 = 2.5 x 10⁻⁶ M. Vertical linesare the values of the mixing fraction which correspond to pH = pKa ±∆pH.
15
DISMT-Melton-FIGURE 1
2
3
4
5
6
7
8
9
10
11
12
0.0 0.1 0.2 0.3 0.4 0.5 0.6 0.7 0.8 0.9 1.0
mixing fraction
pHactualconcentrationsa1=a2=1 x 10(-8) M
a1=a2=1 x 10(-4) M
16
DISMT-Melton-FIGURE 2
2
3
4
5
6
7
8
9
10
11
12
0.0 0.1 0.2 0.3 0.4 0.5 0.6 0.7 0.8 0.9 1.0
mixing fraction
pH
actual concentrations
a1=a2=1 x 10(-4) M
f = 0.475
f = 0.525
17
DISMT-Melton-Figure 3
PUMPRESERVOIR
MIXING TANK
TODRAIN
FLOWMETER
18
DISMT-Melton-FIGURE 4
19
DISMT-Melton-FIGURE 5
20
DISMT-Melton-FIGURE 6
21
DISMT-Melton-FIGURE 7
2
3
4
5
6
7
8
9
10
11
12
0.40 0.45 0.50 0.55 0.60
mixing fraction
pH