Embed Size (px)
Citation preview
Dish TV India LimitedInvestor Presentation
Some of the statements made in this presentation are forward‐looking statements and are based on the current beliefs,assumptions, expectations, estimates, objectives and projections of the directors and management of Dish TV India Limitedabout its business and the industry and markets in which it operates.
These forward‐looking statements include, without limitation, statements relating to revenues and earnings. The words“believe”, “anticipate”, “expect”, “estimate", "intend”, “project” and similar expressions are also intended to identify forwardlooking statements.
These statements are not guarantees of future performance and are subject to risks, uncertainties and other factors, some ofwhich are beyond the control of the Company and are difficult to predict. Consequently, actual results could differ materiallyfrom those expressed or forecast in the forward‐looking statements as a result of, among other factors, changes in economic andmarket conditions, changes in the regulatory environment and other business and operational risks. Dish TV India Limited doesnot undertake to update these forward‐looking statements to reflect events or circumstances that may arise after publication.
Disclaimer
2
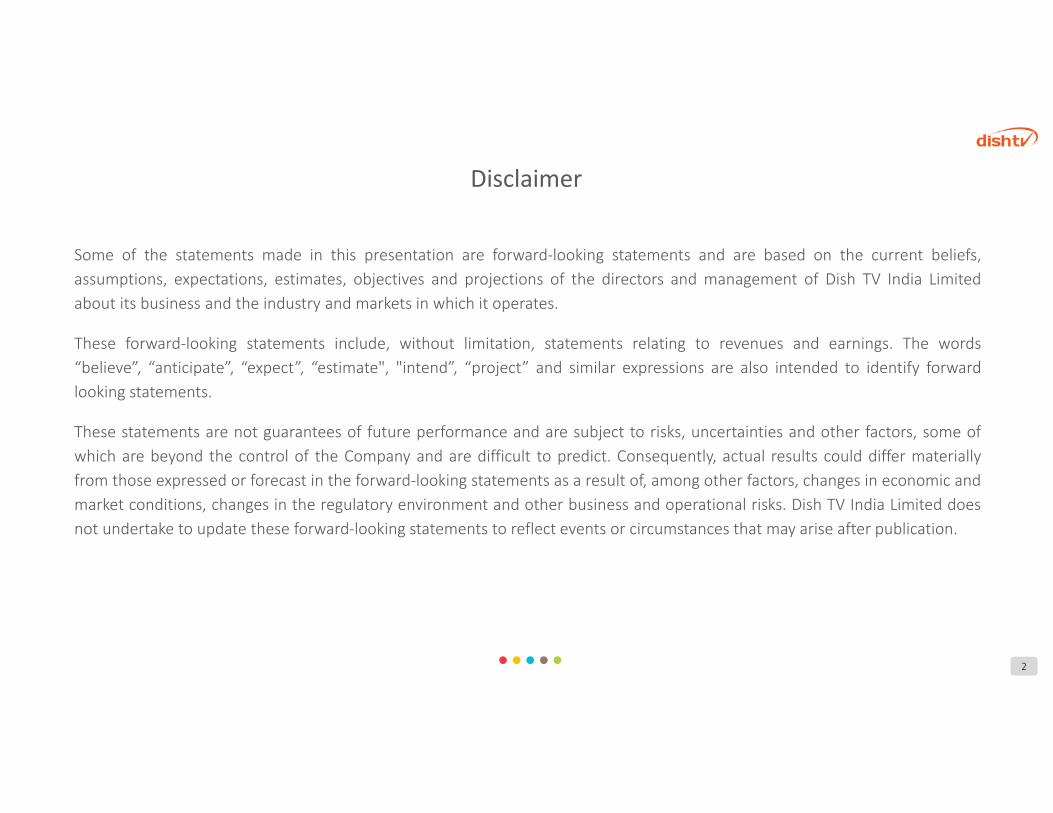
INR 771 Bn.TV subscription revenues
INR 426 Bn.TV subscription revenues
66%TV penetration (of total HHs) 64%
C&S penetration (of TV HHS)
Indian M&E Industry Snapshot
2017
2021
239 284 306
141 181 202
113 152 173
2010 2016P 2020PTotal HHs TV HHs C&S HHs
Indian television market statistics (HHs Mn.)
Source: TV industry size : FICCI‐KPMG 2017, Indian television market statistics & broadcasting and distribution industry : MPA Report 2016
2016 2020
Total households
84% 85%
CAGR of ~ 16% (2017‐2021P)
306 Mn.284 Mn.
Total TV households 202 Mn.181 Mn.
Distribution industry
DTH33%
Analog Cable38%
DigitalCable29%
Broadcasting industry
Multiple broadcastersproducing content in
15 languagesacross 7 genresbeaming
~880 channels
3
245
426
771
125
225
394
2012
2017P
2021P
TV industry size (INR Bn.)
Subscription revenues Advertising revenues
Distribution Industry
4
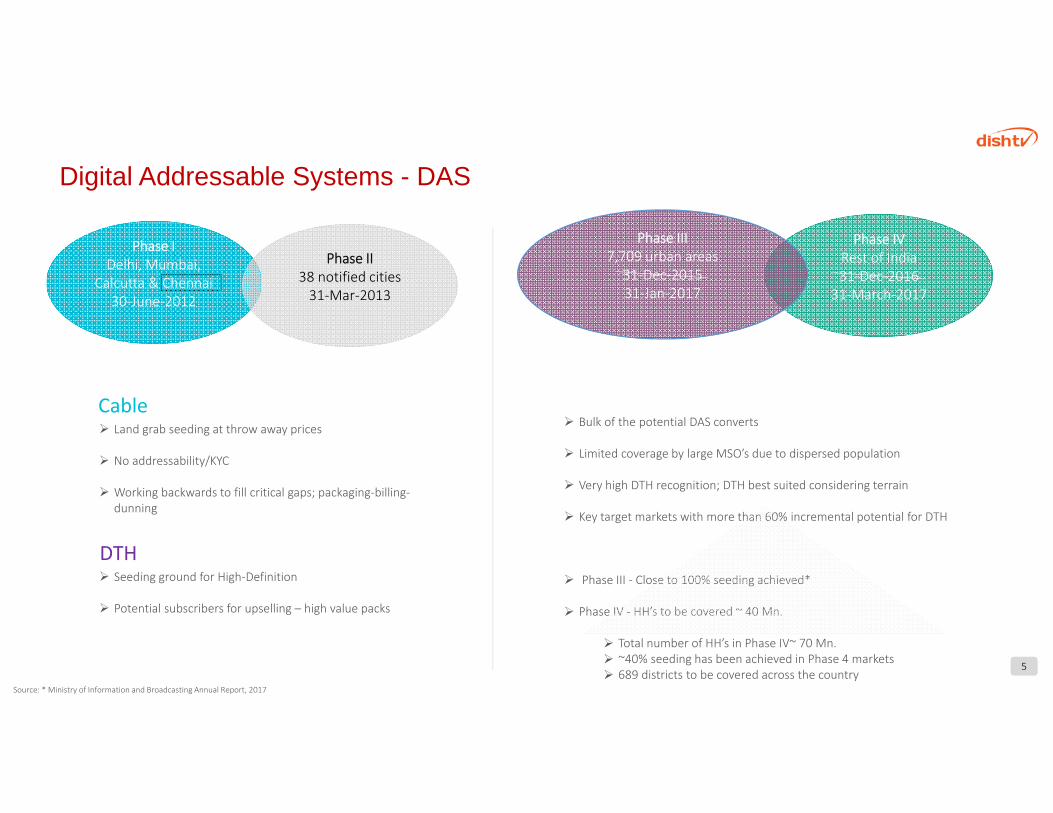
Digital Addressable Systems - DAS
Phase IDelhi, Mumbai,
Calcutta & Chennai30‐June‐2012
Phase II38 notified cities31‐Mar‐2013
Cable Land grab seeding at throw away prices
No addressability/KYC
Working backwards to fill critical gaps; packaging‐billing‐dunning
DTH Seeding ground for High‐Definition
Potential subscribers for upselling – high value packs
Bulk of the potential DAS converts
Limited coverage by large MSO’s due to dispersed population
Very high DTH recognition; DTH best suited considering terrain
Key target markets with more than 60% incremental potential for DTH
Phase III ‐ Close to 100% seeding achieved*
Phase IV ‐ HH’s to be covered ~ 40 Mn.
Total number of HH’s in Phase IV~ 70 Mn. ~40% seeding has been achieved in Phase 4 markets 689 districts to be covered across the country
5
Phase IVRest of India31‐Dec‐2016
31‐March‐2017
Phase III7,709 urban areas
31‐Dec‐2015 31‐Jan‐2017
Source: * Ministry of Information and Broadcasting Annual Report, 2017
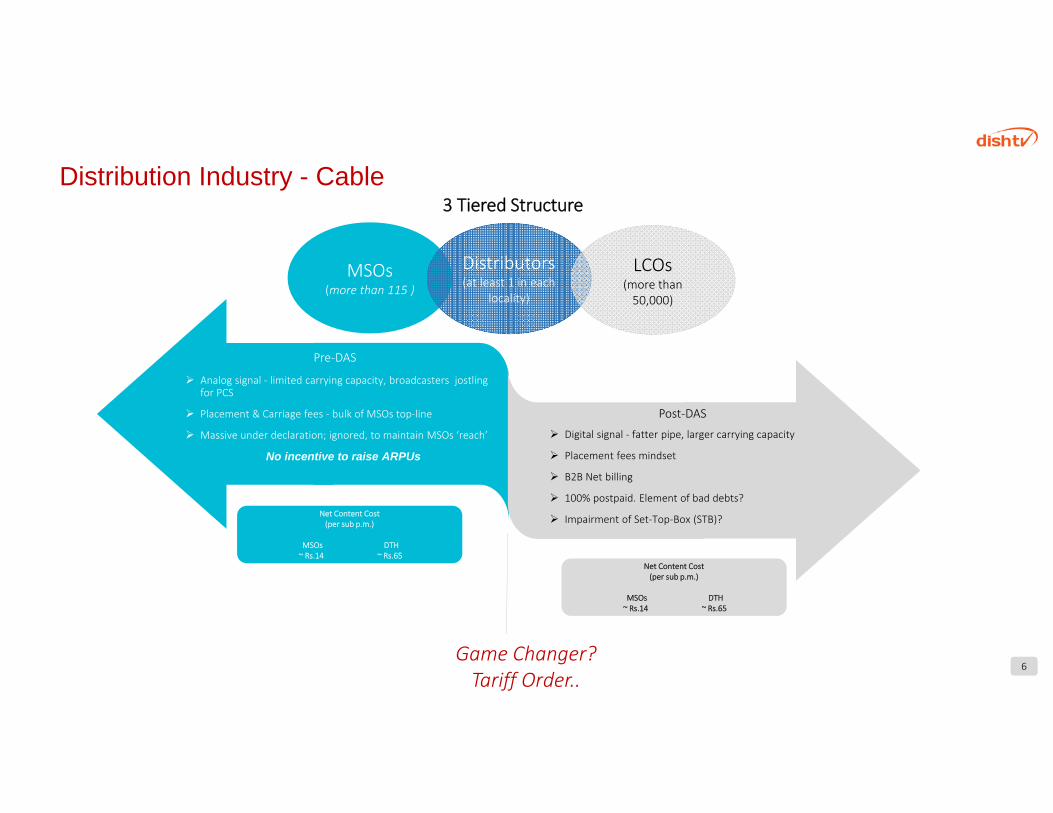
Distribution Industry - Cable 3 Tiered Structure
MSOs(more than 115 )
Distributors (at least 1 in each
locality)
LCOs (more than 50,000)
Pre‐DAS
Post‐DAS
6
Analog signal ‐ limited carrying capacity, broadcasters jostling for PCS
Placement & Carriage fees ‐ bulk of MSOs top‐line
Massive under declaration; ignored, to maintain MSOs ‘reach’
No incentive to raise ARPUs
Digital signal ‐ fatter pipe, larger carrying capacity
Placement fees mindset
B2B Net billing
100% postpaid. Element of bad debts?
Impairment of Set‐Top‐Box (STB)?
Game Changer? Tariff Order..
Net Content Cost (per sub p.m.)
MSOs DTH~ Rs.14 ~ Rs.65
Net Content Cost (per sub p.m.)
MSOs DTH~ Rs.14 ~ Rs.65
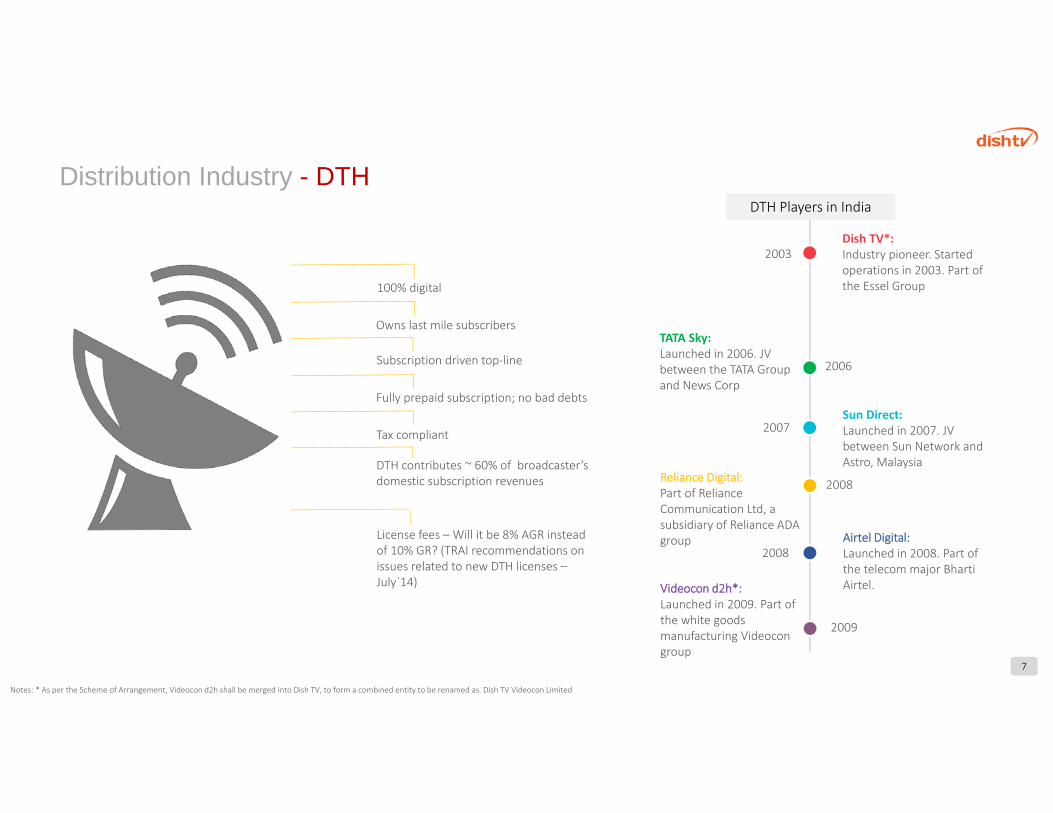
Dish TV*:Industry pioneer. Started operations in 2003. Part of the Essel Group
TATA Sky:Launched in 2006. JV between the TATA Group and News Corp
Sun Direct:Launched in 2007. JV between Sun Network and Astro, Malaysia
Reliance Digital:Part of Reliance Communication Ltd, a subsidiary of Reliance ADA group Airtel Digital:
Launched in 2008. Part of the telecom major Bharti Airtel.Videocon d2h*:
Launched in 2009. Part of the white goods manufacturing Videocon group
Distribution Industry - DTH
2003
2006
2007
2008
2009
100% digital
Owns last mile subscribers
Subscription driven top‐line
Fully prepaid subscription; no bad debts
DTH contributes ~ 60% of broadcaster’s domestic subscription revenues
License fees – Will it be 8% AGR instead of 10% GR? (TRAI recommendations on issues related to new DTH licenses –July`14)
Tax compliant
2008
7
DTH Players in India
Notes: * As per the Scheme of Arrangement, Videocon d2h shall be merged into Dish TV, to form a combined entity to be renamed as Dish TV Videocon Limited

8
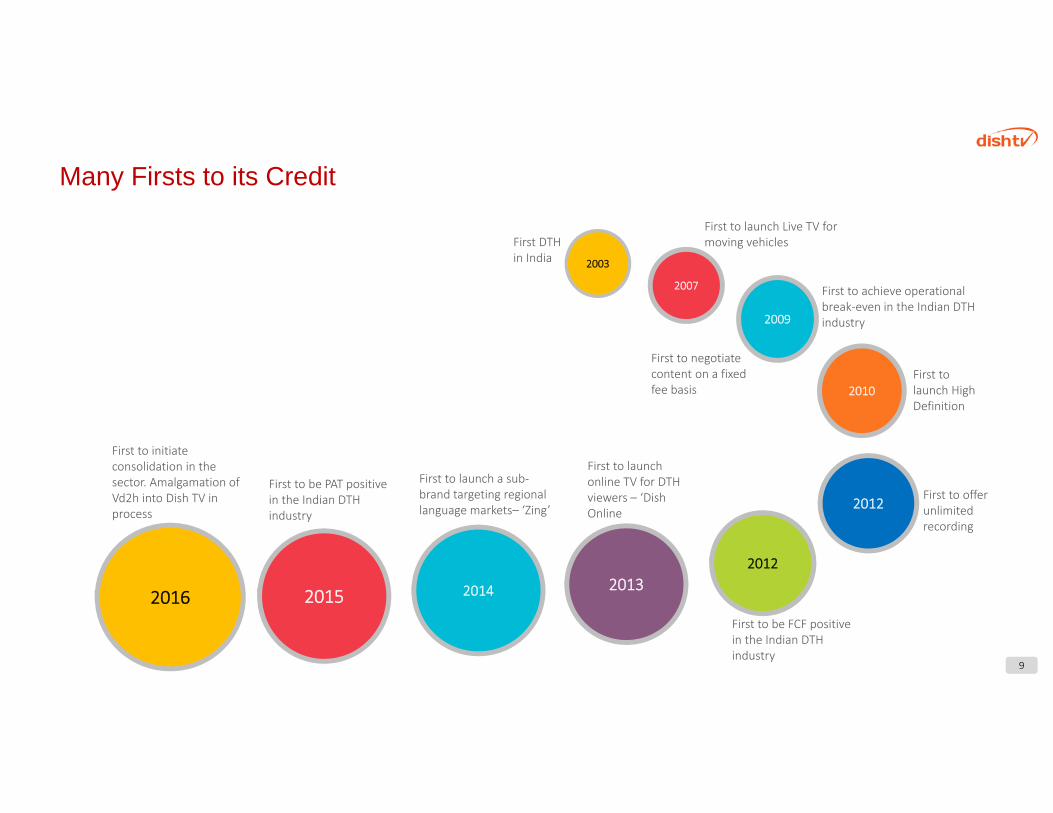
Many Firsts to its Credit
9
2007
2009
2010
2012
2012201320142015
2003
2016
First DTH in India
First to negotiate content on a fixed fee basis
First to launch Live TV for moving vehicles
First to achieve operational break‐even in the Indian DTH industry
First to launch High Definition
First to offer unlimited recording
First to be FCF positive in the Indian DTH industry
First to launch online TV for DTH viewers – ‘Dish Online
First to launch a sub‐brand targeting regional language markets– ‘Zing’
First to be PAT positive in the Indian DTH industry
First to initiate consolidation in the sector. Amalgamation of Vd2h into Dish TV in process
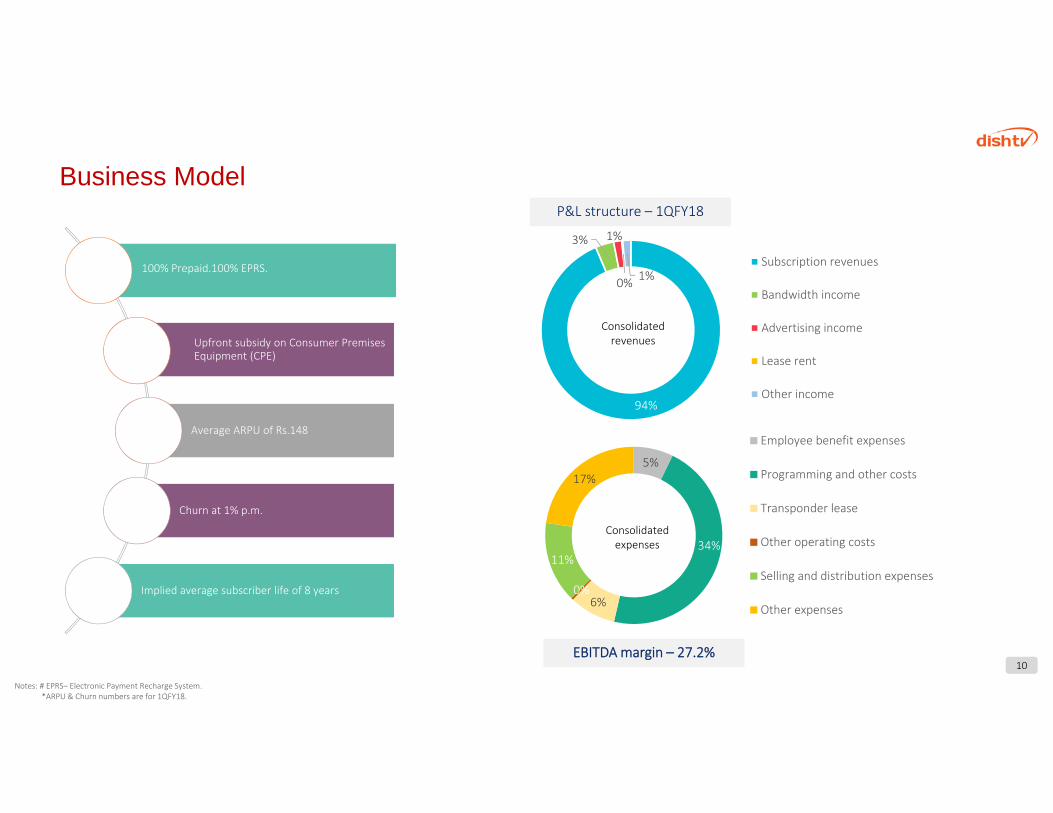
94%
3% 1%
0% 1%Subscription revenues
Bandwidth income
Advertising income
Lease rent
Other income
Consolidated revenues
5%
34%
6%0%
11%
17%
Employee benefit expenses
Programming and other costs
Transponder lease
Other operating costs
Selling and distribution expenses
Other expenses
Consolidated expenses
Dish TV India Limited
Business Model
10
P&L structure – 1QFY18
EBITDA margin – 27.2%
Notes: # EPRS– Electronic Payment Recharge System.*ARPU & Churn numbers are for 1QFY18.
100% Prepaid.100% EPRS.
Upfront subsidy on Consumer Premises Equipment (CPE)
Average ARPU of Rs.148
Churn at 1% p.m.
Implied average subscriber life of 8 years
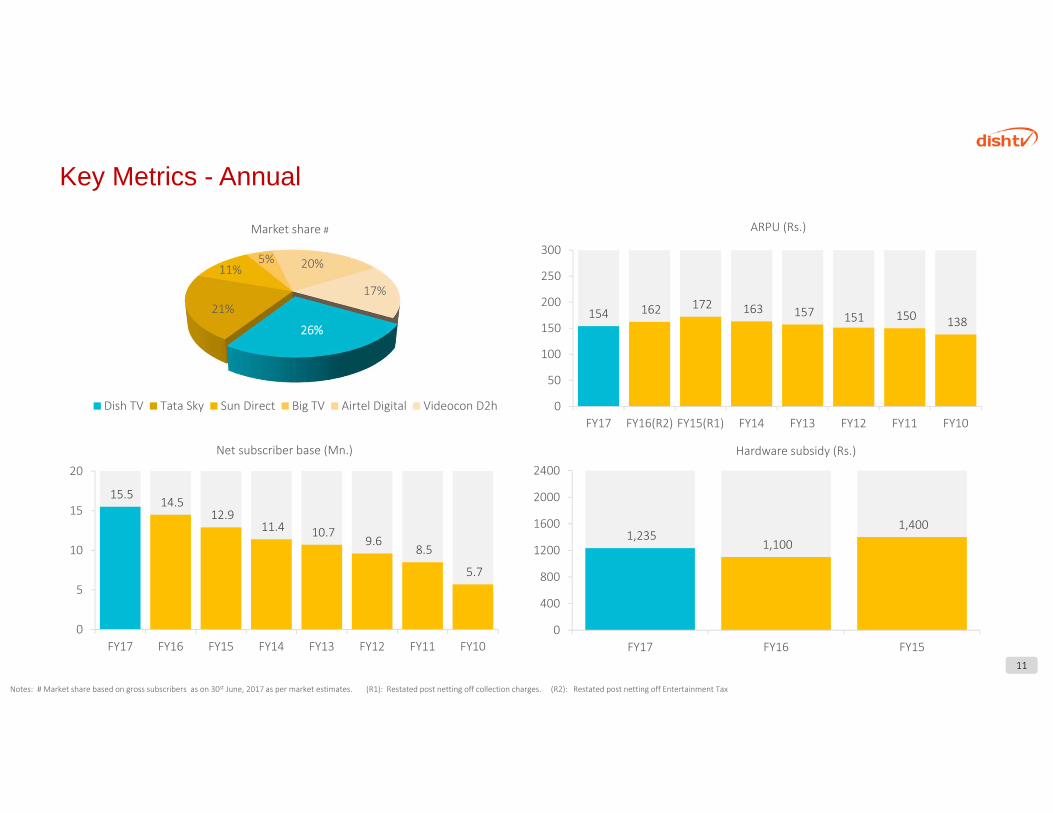
Key Metrics - Annual
Notes: # Market share based on gross subscribers as on 30st June, 2017 as per market estimates. (R1): Restated post netting off collection charges. (R2): Restated post netting off Entertainment Tax
154 162 172 163 157 151 150 138
0
50
100
150
200
250
300
FY17 FY16(R2) FY15(R1) FY14 FY13 FY12 FY11 FY10
ARPU (Rs.)
26%
21%
11%5% 20%
17%
Dish TV Tata Sky Sun Direct Big TV Airtel Digital Videocon D2h
Market share #
1,235 1,100
1,400
0
400
800
1200
1600
2000
2400
FY17 FY16 FY15
Hardware subsidy (Rs.)
15.5 14.5
12.9 11.4 10.7
9.6 8.5
5.7
0
5
10
15
20
FY17 FY16 FY15 FY14 FY13 FY12 FY11 FY10
Net subscriber base (Mn.)
11
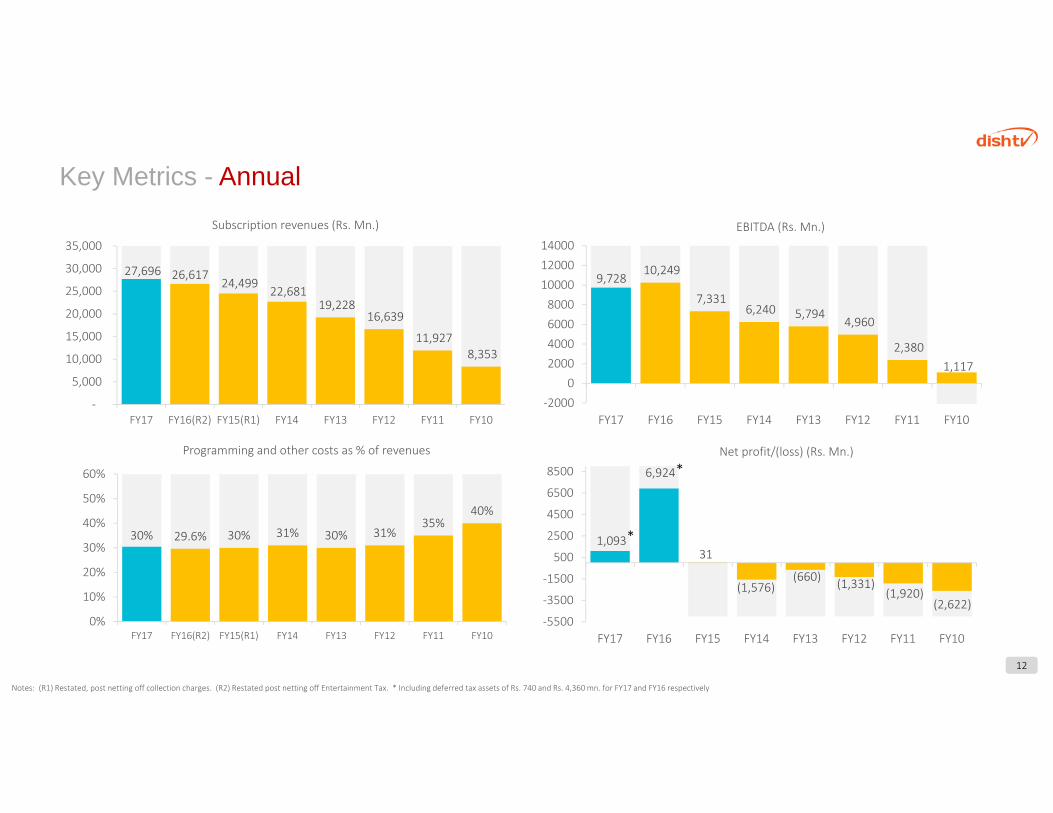
Key Metrics - Annual
Notes: (R1) Restated, post netting off collection charges. (R2) Restated post netting off Entertainment Tax. * Including deferred tax assets of Rs. 740 and Rs. 4,360 mn. for FY17 and FY16 respectively
9,728 10,249
7,331 6,240 5,794
4,960
2,380 1,117
‐20000
2000400060008000100001200014000
FY17 FY16 FY15 FY14 FY13 FY12 FY11 FY10
EBITDA (Rs. Mn.)
30% 29.6% 30% 31% 30% 31%35%
40%
0%
10%
20%
30%
40%
50%
60%
FY17 FY16(R2) FY15(R1) FY14 FY13 FY12 FY11 FY10
27,696 26,617 24,499
22,681 19,228
16,639
11,927 8,353
‐
5,000
10,000
15,000
20,000
25,000
30,000
35,000
FY17 FY16(R2) FY15(R1) FY14 FY13 FY12 FY11 FY10
Subscription revenues (Rs. Mn.)
Programming and other costs as % of revenues
1,093
6,924
31
(1,576)(660) (1,331)
(1,920)(2,622)
‐5500
‐3500
‐1500
500
2500
4500
6500
8500
FY17 FY16 FY15 FY14 FY13 FY12 FY11 FY10
Net profit/(loss) (Rs. Mn.)
12
*
*
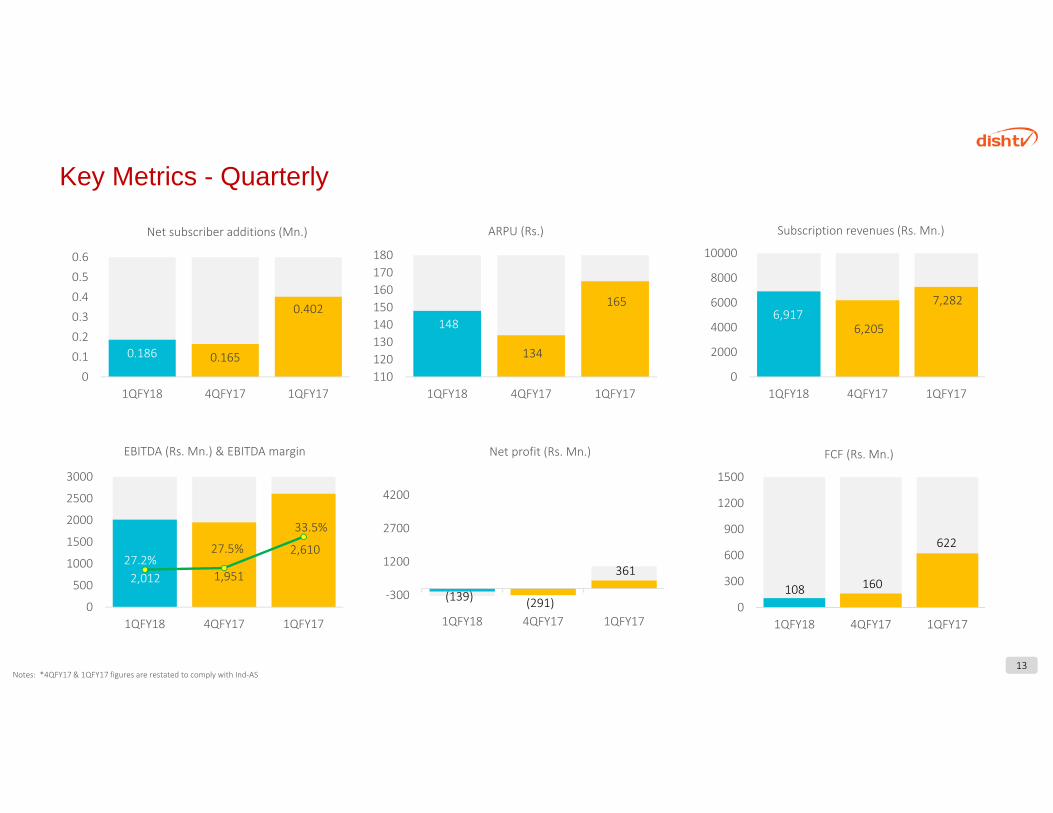
Key Metrics - Quarterly
0.186 0.165
0.402
00.10.20.30.40.50.6
1QFY18 4QFY17 1QFY17
Net subscriber additions (Mn.)
148
134
165
110120130140150160170180
1QFY18 4QFY17 1QFY17
ARPU (Rs.)
6,917 6,205
7,282
0
2000
4000
6000
8000
10000
1QFY18 4QFY17 1QFY17
Subscription revenues (Rs. Mn.)
2,012 1,951
2,610 27.2%
27.5%
33.5%
20.0%21.0%22.0%23.0%24.0%25.0%26.0%27.0%28.0%29.0%30.0%31.0%32.0%33.0%34.0%35.0%36.0%37.0%38.0%39.0%40.0%41.0%42.0%43.0%44.0%45.0%
0
500
1000
1500
2000
2500
3000
1QFY18 4QFY17 1QFY17
EBITDA (Rs. Mn.) & EBITDA margin
(139) (291)
361
‐300
1200
2700
4200
1QFY18 4QFY17 1QFY17
Net profit (Rs. Mn.)
108 160
622
0
300
600
900
1200
1500
1QFY18 4QFY17 1QFY17
FCF (Rs. Mn.)
13Notes: *4QFY17 & 1QFY17 figures are restated to comply with Ind‐AS
#
Strategy and Outlook
14
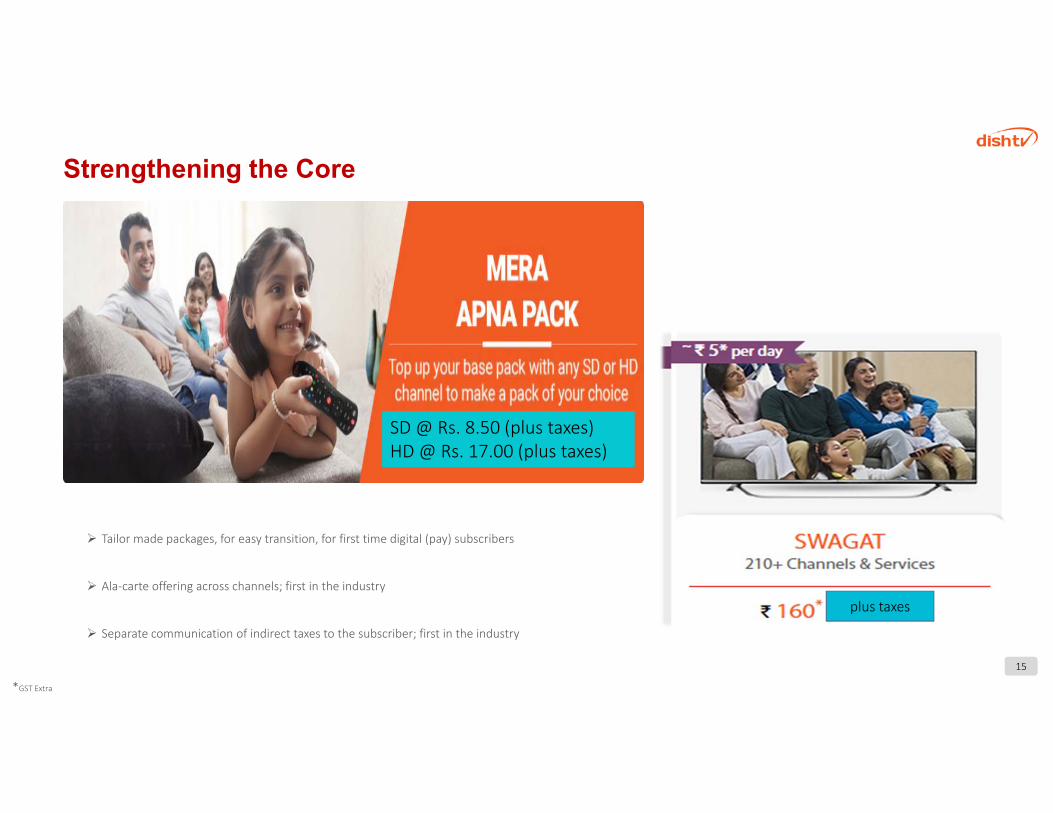
Strengthening the Core
15
Tailor made packages, for easy transition, for first time digital (pay) subscribers
Ala‐carte offering across channels; first in the industry
Separate communication of indirect taxes to the subscriber; first in the industry
*GST Extra
SD @ Rs. 8.50 (plus taxes)HD @ Rs. 17.00 (plus taxes)
plus taxes
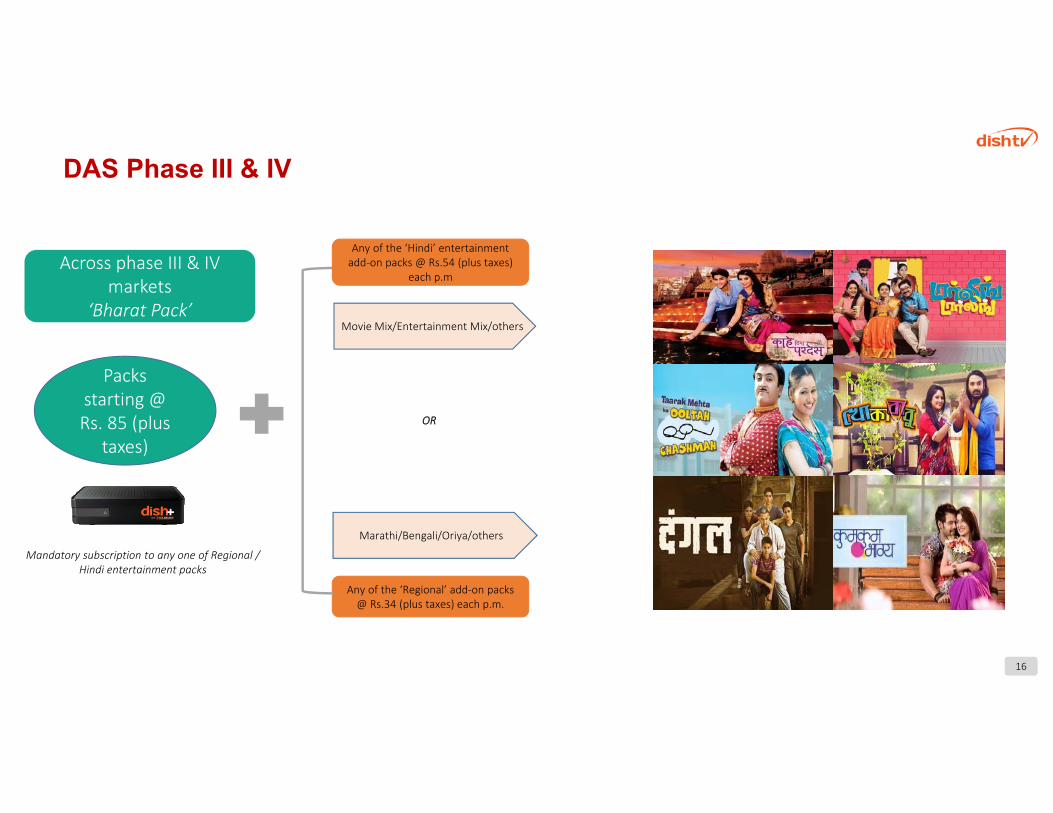
DAS Phase III & IV
16
Across phase III & IV markets
‘Bharat Pack’
Mandatory subscription to any one of Regional / Hindi entertainment packs
Any of the ‘Regional’ add‐on packs @ Rs.34 (plus taxes) each p.m.
OR
Movie Mix/Entertainment Mix/others
Marathi/Bengali/Oriya/others
Any of the ‘Hindi’ entertainment add‐on packs @ Rs.54 (plus taxes)
each p.m
Packs starting @ Rs. 85 (plus
taxes)
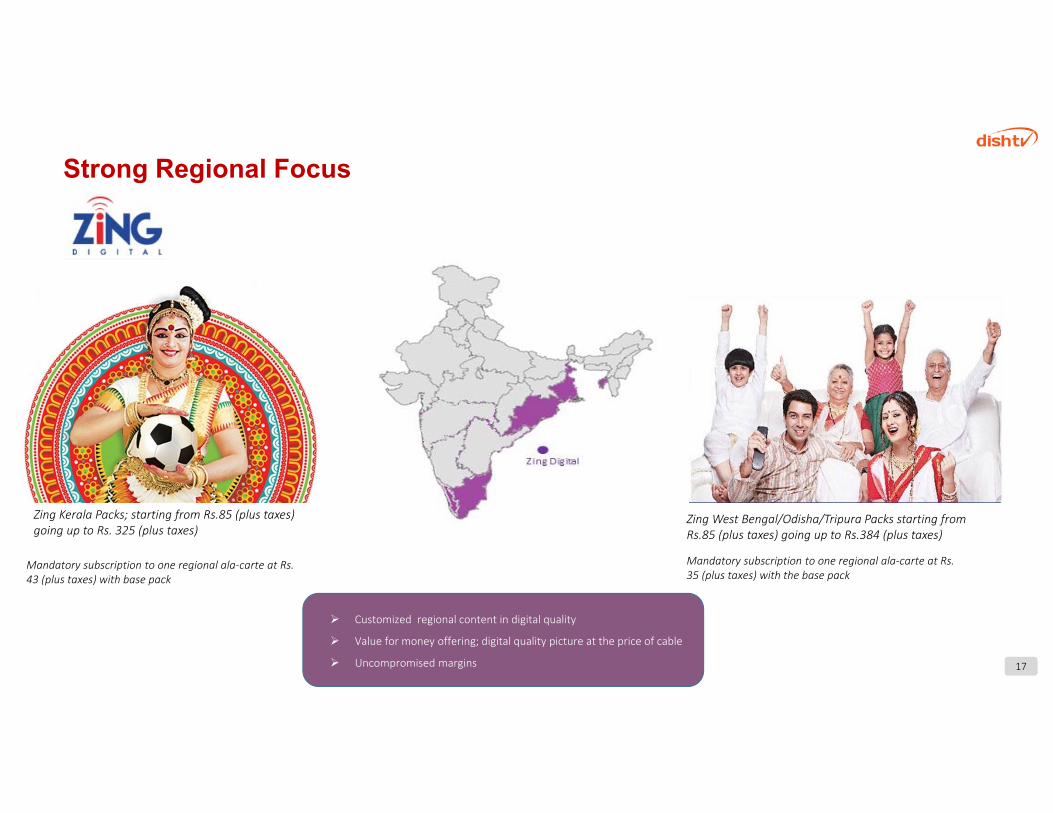
Strong Regional Focus
17
Customized regional content in digital quality
Value for money offering; digital quality picture at the price of cable
Uncompromised margins
Zing West Bengal/Odisha/Tripura Packs starting from Rs.85 (plus taxes) going up to Rs.384 (plus taxes)
Zing Kerala Packs; starting from Rs.85 (plus taxes) going up to Rs. 325 (plus taxes)
Mandatory subscription to one regional ala‐carte at Rs. 43 (plus taxes) with base pack
Mandatory subscription to one regional ala‐carte at Rs. 35 (plus taxes) with the base pack
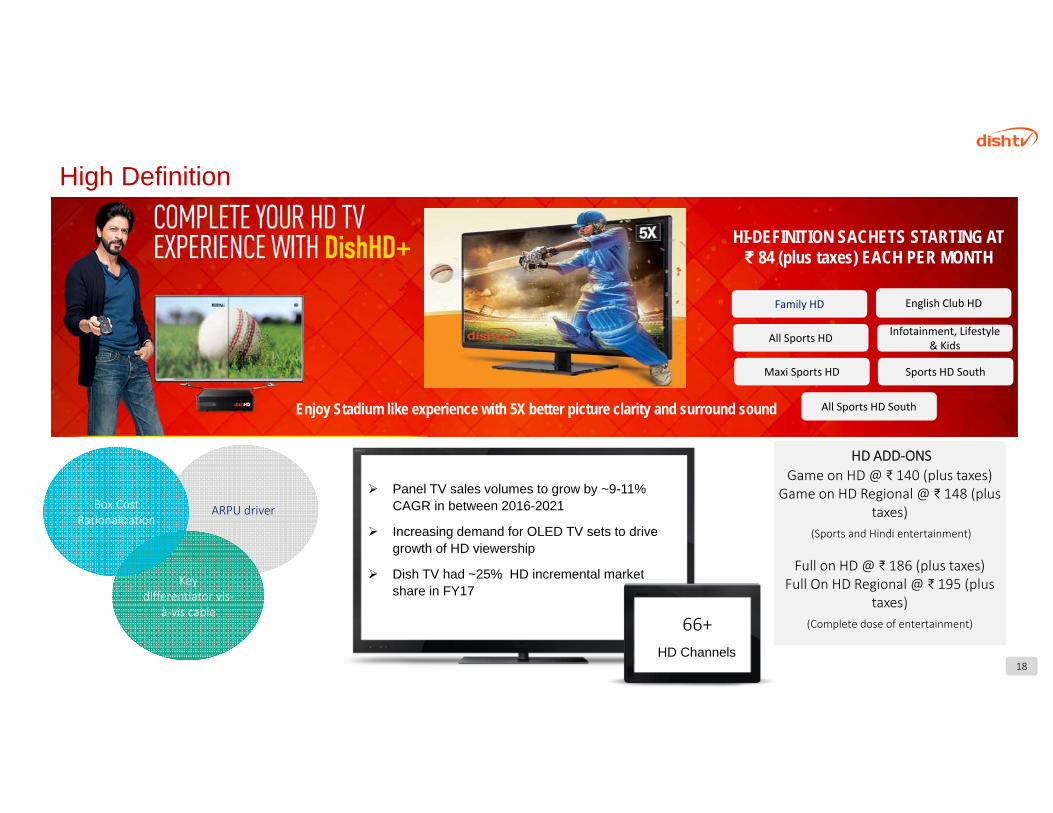
High Definition
18
Family HD English Club HD
All Sports HD Infotainment, Lifestyle & Kids
Maxi Sports HD Sports HD South
All Sports HD South
HI-DEFINITION SACHETS STARTING AT ₹ 84 (plus taxes) EACH PER MONTH
Enjoy Stadium like experience with 5X better picture clarity and surround sound
Panel TV sales volumes to grow by ~9-11% CAGR in between 2016-2021
Increasing demand for OLED TV sets to drive growth of HD viewership
Dish TV had ~25% HD incremental market share in FY17
HD Channels
66+
ARPU driver
Key differentiator vis‐
à‐vis cable
Box Cost Rationalization
HD ADD‐ONS Game on HD @ ₹ 140 (plus taxes)
Game on HD Regional @ ₹ 148 (plus taxes)
(Sports and Hindi entertainment)
Full on HD @ ₹ 186 (plus taxes)Full On HD Regional @ ₹ 195 (plus
taxes)(Complete dose of entertainment)
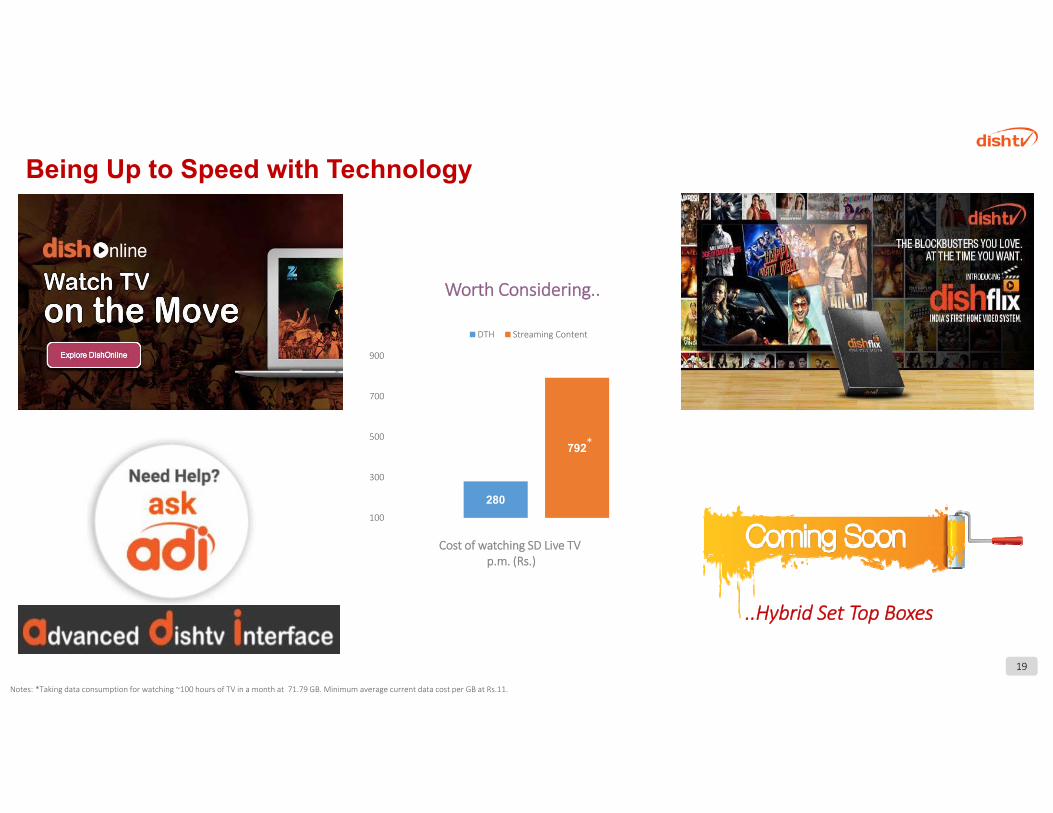
Being Up to Speed with Technology
Worth Considering..
280
792
100
300
500
700
900
DTH Streaming Content
*
Notes: *Taking data consumption for watching ~100 hours of TV in a month at 71.79 GB. Minimum average current data cost per GB at Rs.11.
..Hybrid Set Top Boxes
Cost of watching SD Live TV p.m. (Rs.)
19

Financials
20
Quarter ended
Quarter ended
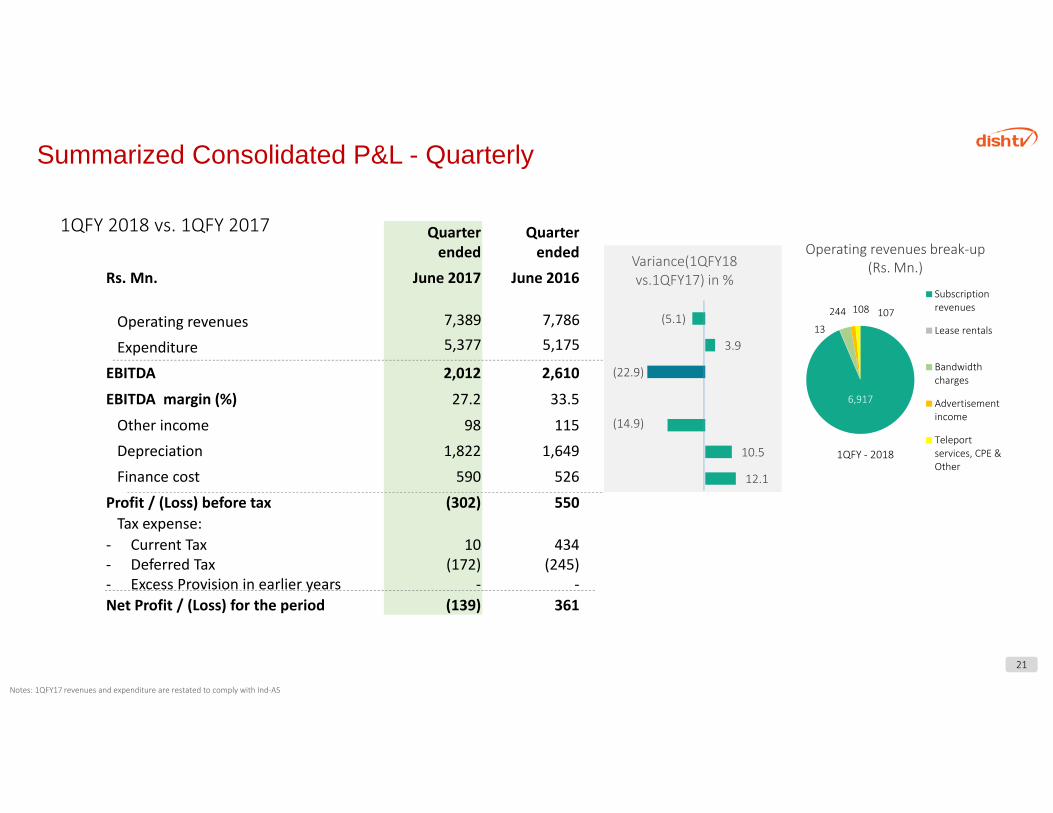
Rs. Mn. June 2017 June 2016
Operating revenues 7,389 7,786
Expenditure 5,377 5,175
EBITDA 2,012 2,610
EBITDA margin (%) 27.2 33.5
Other income 98 115
Depreciation 1,822 1,649
Finance cost 590 526
Profit / (Loss) before tax (302) 550Tax expense:
‐ Current Tax‐ Deferred Tax‐ Excess Provision in earlier years
10(172)
‐
434(245)
‐Net Profit / (Loss) for the period (139) 361
1QFY 2018 vs. 1QFY 2017Operating revenues break‐up
(Rs. Mn.)
1QFY ‐ 2018
Summarized Consolidated P&L - Quarterly
21
(5.1)
3.9
(22.9)
(14.9)
10.5
12.1
Variance(1QFY18 vs.1QFY17) in %
6,917
13
244 108 107
Subscriptionrevenues
Lease rentals
Bandwidthcharges
Advertisementincome
Teleportservices, CPE &Other
Notes: 1QFY17 revenues and expenditure are restated to comply with Ind‐AS
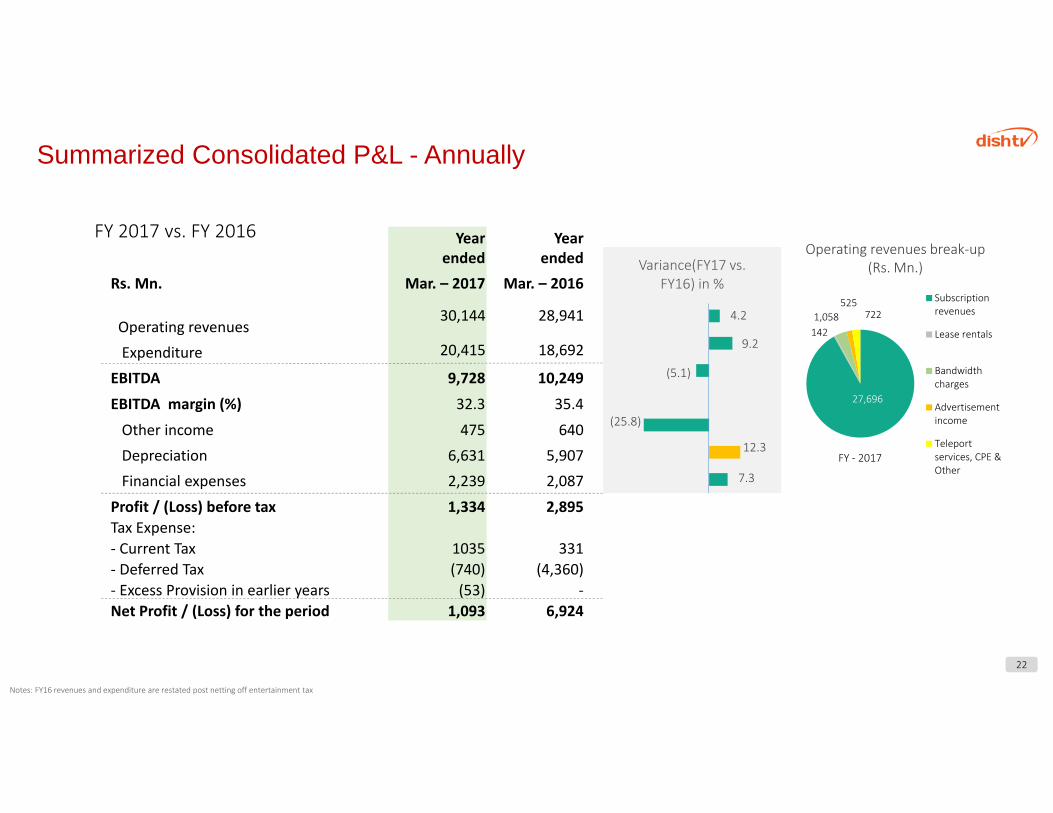
Yearended
Yearended
Rs. Mn. Mar. – 2017 Mar. – 2016
Operating revenues 30,144 28,941
Expenditure 20,415 18,692
EBITDA 9,728 10,249
EBITDA margin (%) 32.3 35.4
Other income 475 640Depreciation 6,631 5,907Financial expenses 2,239 2,087
Profit / (Loss) before tax 1,334 2,895Tax Expense:‐ Current Tax 1035 331‐ Deferred Tax (740) (4,360)‐ Excess Provision in earlier years (53) ‐Net Profit / (Loss) for the period 1,093 6,924
FY 2017 vs. FY 2016Operating revenues break‐up
(Rs. Mn.)
FY ‐ 2017
22
4.2
9.2
(5.1)
(25.8)
12.3
7.3
Variance(FY17 vs. FY16) in %
27,696
142 1,058
525 722
Subscriptionrevenues
Lease rentals
Bandwidthcharges
Advertisementincome
Teleportservices, CPE &Other
Notes: FY16 revenues and expenditure are restated post netting off entertainment tax
Summarized Consolidated P&L - Annually
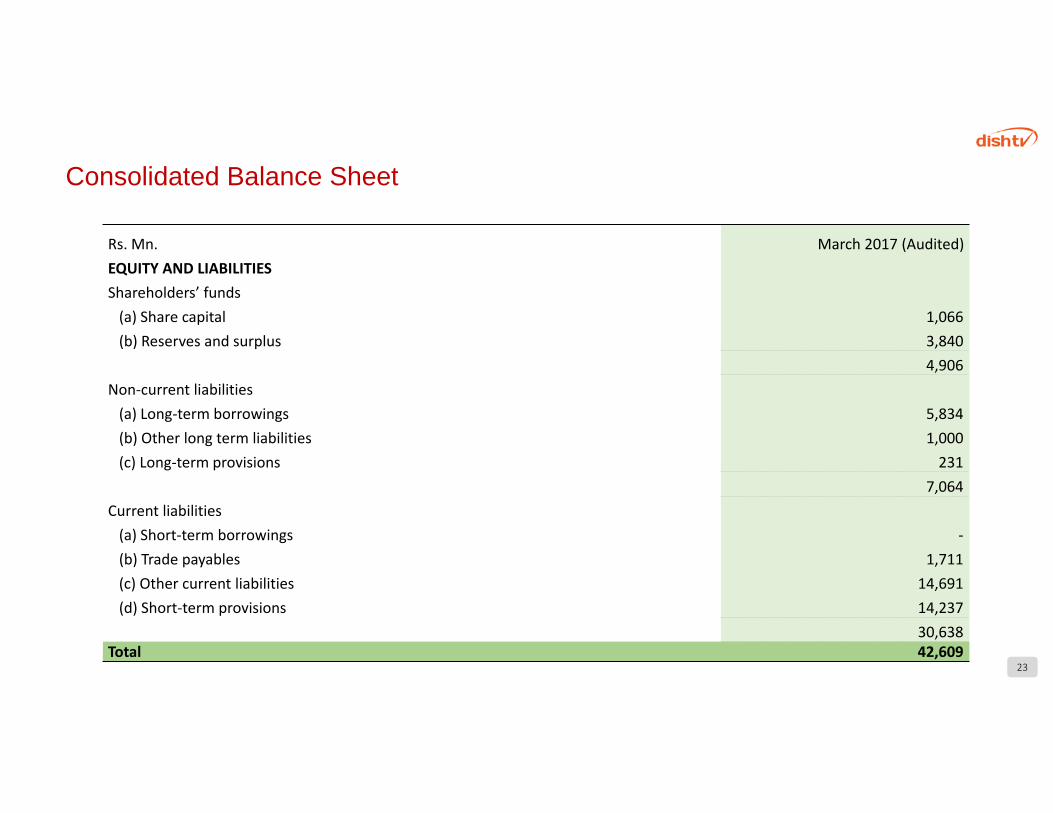
Rs. Mn. March 2017 (Audited)EQUITY AND LIABILITIESShareholders’ funds(a) Share capital 1,066(b) Reserves and surplus 3,840
4,906Non‐current liabilities(a) Long‐term borrowings 5,834(b) Other long term liabilities 1,000(c) Long‐term provisions 231
7,064Current liabilities(a) Short‐term borrowings ‐(b) Trade payables 1,711(c) Other current liabilities 14,691(d) Short‐term provisions 14,237
30,638Total 42,609
Consolidated Balance Sheet
23
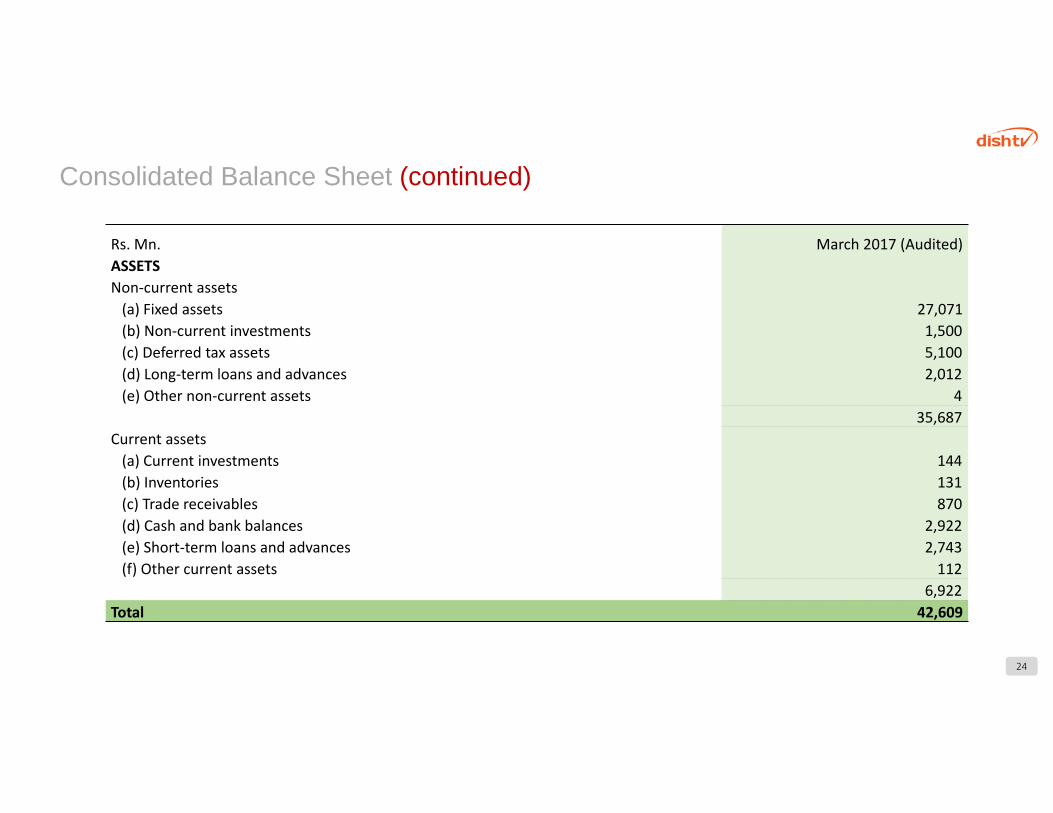
Rs. Mn. March 2017 (Audited)ASSETSNon‐current assets (a) Fixed assets 27,071(b) Non‐current investments 1,500(c) Deferred tax assets 5,100(d) Long‐term loans and advances 2,012(e) Other non‐current assets 4
35,687Current assets (a) Current investments 144(b) Inventories 131(c) Trade receivables 870(d) Cash and bank balances 2,922(e) Short‐term loans and advances 2,743(f) Other current assets 112
6,922Total 42,609
Consolidated Balance Sheet (continued)
24
Annexure
25
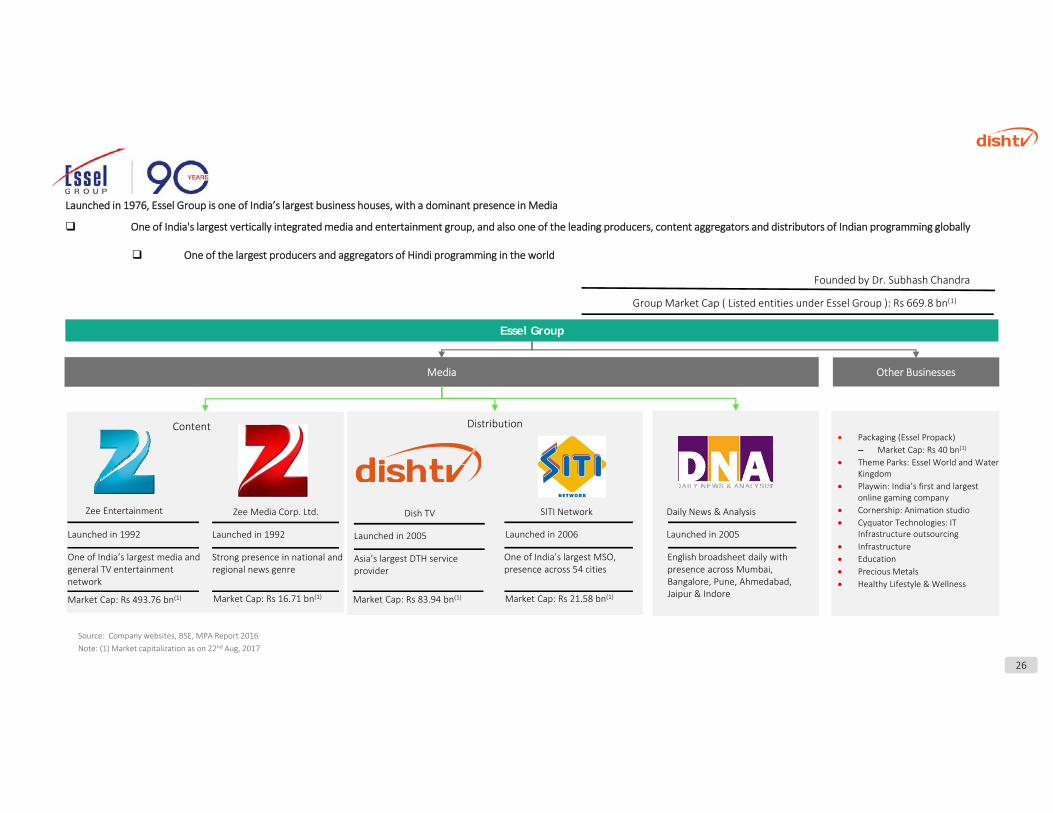
One of India's largest vertically integrated media and entertainment group, and also one of the leading producers, content aggregators and distributors of Indian programming globally
One of the largest producers and aggregators of Hindi programming in the world
Other Businesses
Essel Group
Media
Launched in 1992
One of India’s largest media and general TV entertainment network
Launched in 1992
Strong presence in national and regional news genre
Founded by Dr. Subhash Chandra
Group Market Cap ( Listed entities under Essel Group ): Rs 669.8 bn(1)
Source: Company websites, BSE, MPA Report 2016Note: (1) Market capitalization as on 22nd Aug, 2017
Market Cap: Rs 493.76 bn(1) Market Cap: Rs 16.71 bn(1)
Launched in 2005
Asia’s largest DTH service provider
Launched in 2006
One of India’s largest MSO, presence across 54 cities
Daily News & Analysis
Market Cap: Rs 83.94 bn(1) Market Cap: Rs 21.58 bn(1)
Launched in 2005
English broadsheet daily with presence across Mumbai, Bangalore, Pune, Ahmedabad, Jaipur & Indore
Content Distribution
Zee Entertainment Zee Media Corp. Ltd. Dish TV SITI Network
Packaging (Essel Propack)– Market Cap: Rs 40 bn(1)
Theme Parks: Essel World and Water Kingdom
Playwin: India’s first and largest online gaming company
Cornership: Animation studio Cyquator Technologies: IT
Infrastructure outsourcing Infrastructure Education Precious Metals Healthy Lifestyle & Wellness
26
Launched in 1976, Essel Group is one of India’s largest business houses, with a dominant presence in Media
Videocon D2H to Merge with Dish TV Creating A Leading Cable & Satellite
Distribution Platform
27
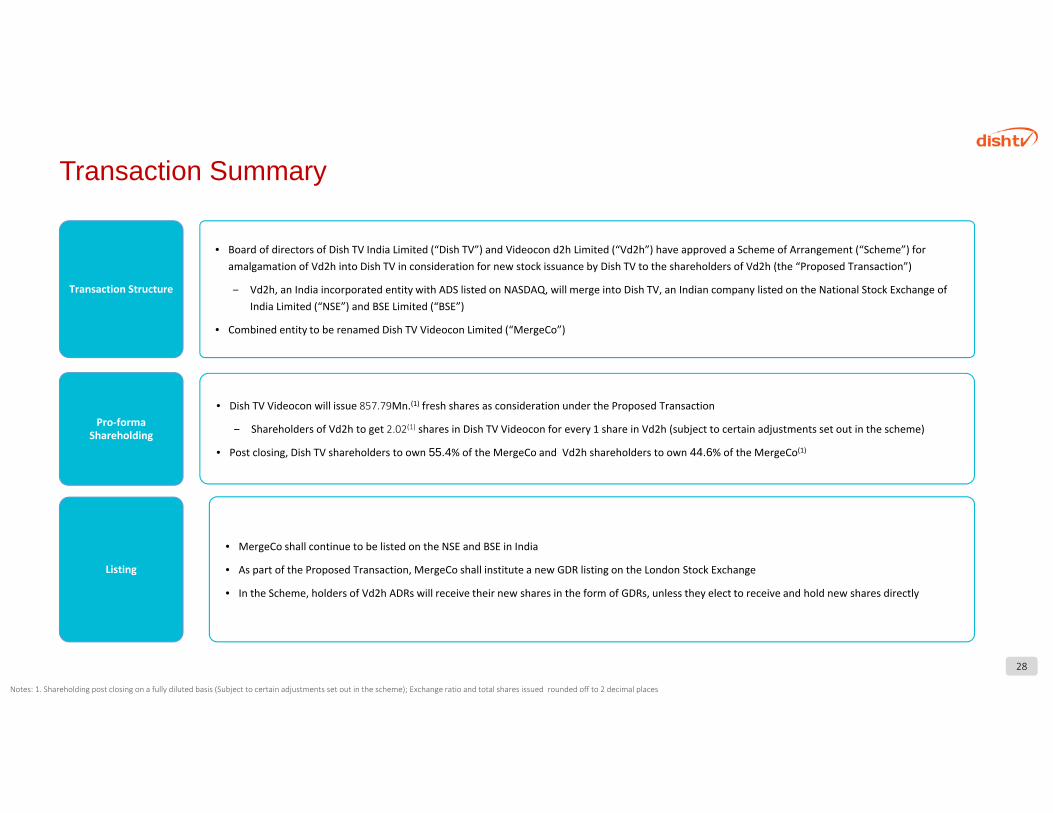
Transaction Summary
28
• Board of directors of Dish TV India Limited (“Dish TV”) and Videocon d2h Limited (“Vd2h”) have approved a Scheme of Arrangement (“Scheme”) for amalgamation of Vd2h into Dish TV in consideration for new stock issuance by Dish TV to the shareholders of Vd2h (the “Proposed Transaction”)
‒ Vd2h, an India incorporated entity with ADS listed on NASDAQ, will merge into Dish TV, an Indian company listed on the National Stock Exchange of India Limited (“NSE”) and BSE Limited (“BSE”)
• Combined entity to be renamed Dish TV Videocon Limited (“MergeCo”)
• MergeCo shall continue to be listed on the NSE and BSE in India
• As part of the Proposed Transaction, MergeCo shall institute a new GDR listing on the London Stock Exchange
• In the Scheme, holders of Vd2h ADRs will receive their new shares in the form of GDRs, unless they elect to receive and hold new shares directly
• Dish TV Videocon will issue 857.79Mn.(1) fresh shares as consideration under the Proposed Transaction
‒ Shareholders of Vd2h to get 2.02(1) shares in Dish TV Videocon for every 1 share in Vd2h (subject to certain adjustments set out in the scheme)
• Post closing, Dish TV shareholders to own 55.4% of the MergeCo and Vd2h shareholders to own 44.6% of the MergeCo(1)
Transaction Structure
Pro‐forma Shareholding
Listing
Notes: 1. Shareholding post closing on a fully diluted basis (Subject to certain adjustments set out in the scheme); Exchange ratio and total shares issued rounded off to 2 decimal places
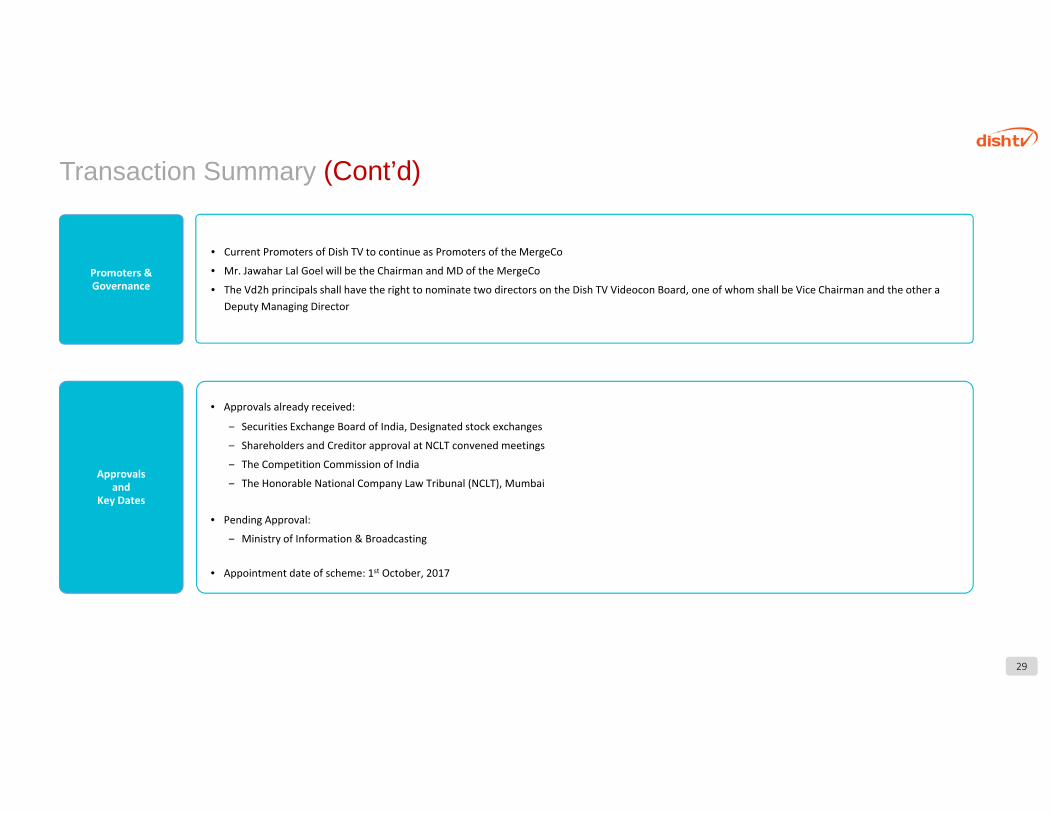
• Approvals already received:
‒ Securities Exchange Board of India, Designated stock exchanges
‒ Shareholders and Creditor approval at NCLT convened meetings
‒ The Competition Commission of India
‒ The Honorable National Company Law Tribunal (NCLT), Mumbai
• Pending Approval:
‒ Ministry of Information & Broadcasting
• Appointment date of scheme: 1st October, 2017
Approvals and
Key Dates
• Current Promoters of Dish TV to continue as Promoters of the MergeCo
• Mr. Jawahar Lal Goel will be the Chairman and MD of the MergeCo
• The Vd2h principals shall have the right to nominate two directors on the Dish TV Videocon Board, one of whom shall be Vice Chairman and the other a Deputy Managing Director
Promoters & Governance
Transaction Summary (Cont’d)
29
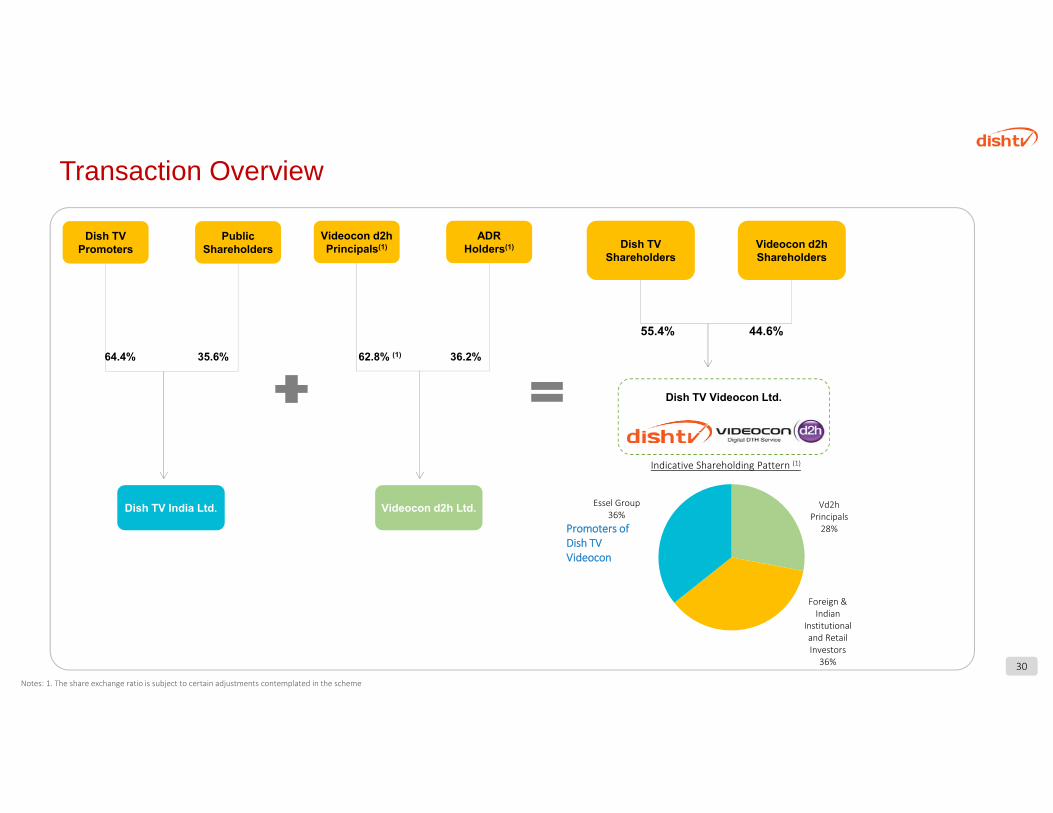
Transaction Overview
30
Vd2h Principals
28%
Foreign & Indian
Institutional and Retail Investors36%
Essel Group36%
Dish TV Promoters
Public Shareholders
Dish TV India Ltd.
64.4% 35.6%
Videocon d2h Principals(1)
ADRHolders(1)
Videocon d2h Ltd.
62.8% (1) 36.2%
Dish TV Shareholders
Videocon d2h Shareholders
Dish TV Videocon Ltd.
44.6%55.4%
Promoters of Dish TV Videocon
Indicative Shareholding Pattern (1)
Notes: 1. The share exchange ratio is subject to certain adjustments contemplated in the scheme
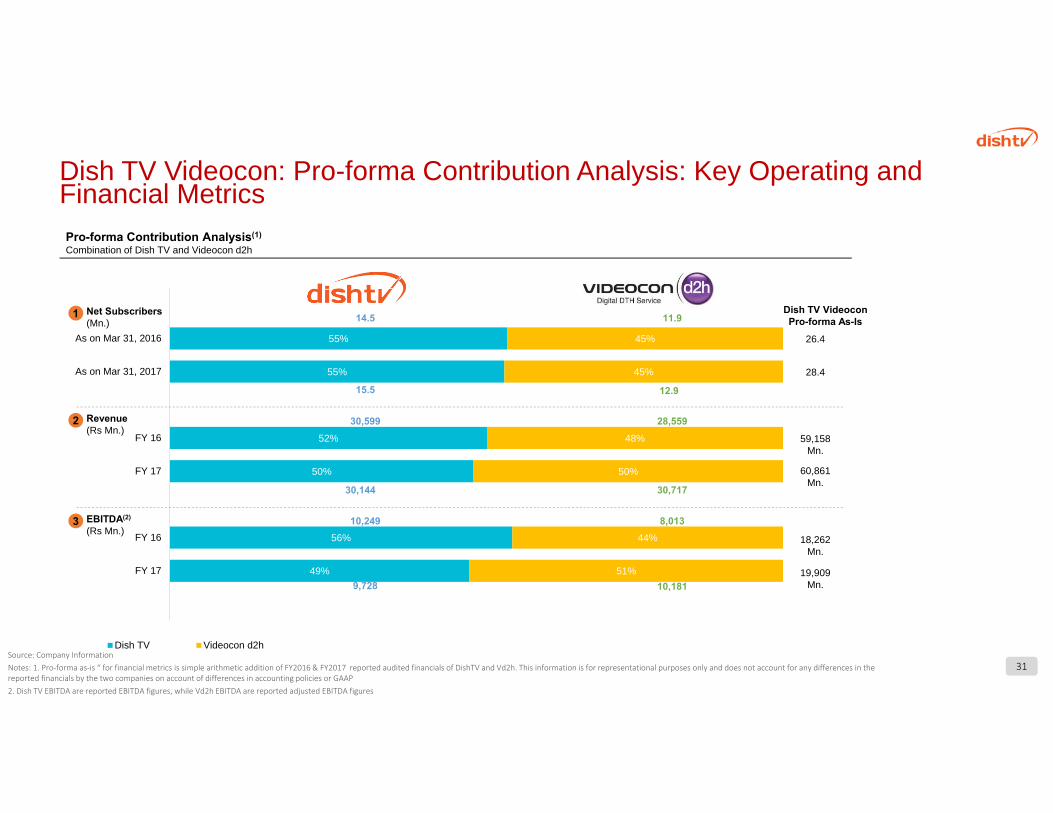
Dish TV Videocon: Pro-forma Contribution Analysis: Key Operating and Financial MetricsPro-forma Contribution Analysis(1)
Combination of Dish TV and Videocon d2h
55%
55%
52%
50%
56%
49%
45%
45%
48%
50%
44%
51%
As on Mar 31, 2016
As on Mar 31, 2017
FY 16
FY 17
FY 16
FY 17
Dish TV Videocon d2h
Net Subscribers(Mn.)
1 Dish TV VideoconPro-forma As-Is
26.4
28.4
14.5 11.9
15.5 12.9
Revenue(Rs Mn.)
2
EBITDA(2)
(Rs Mn.)3
59,158 Mn.
60,861 Mn.
18,262 Mn.
19,909 Mn.
30,599
30,144
10,249
28,559
30,717
8,013
9,728 10,181
Source: Company InformationNotes: 1. Pro‐forma as‐is “ for financial metrics is simple arithmetic addition of FY2016 & FY2017 reported audited financials of DishTV and Vd2h. This information is for representational purposes only and does not account for any differences in the reported financials by the two companies on account of differences in accounting policies or GAAP2. Dish TV EBITDA are reported EBITDA figures, while Vd2h EBITDA are reported adjusted EBITDA figures
31
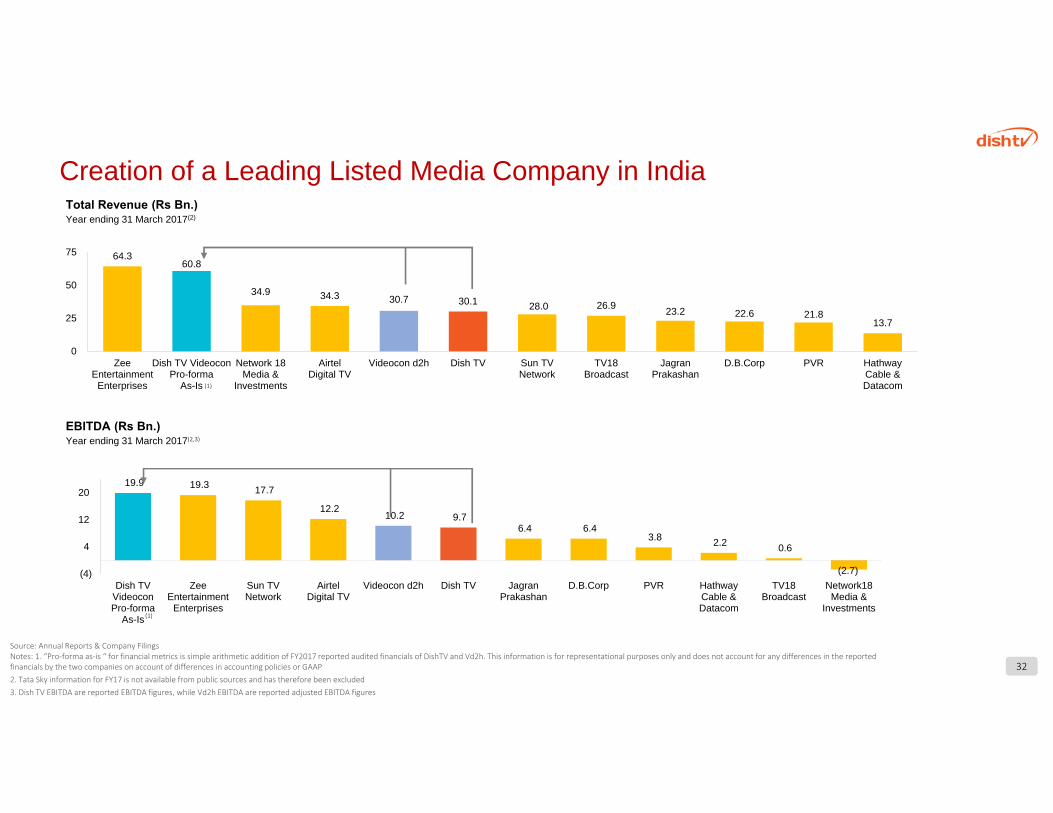
Creation of a Leading Listed Media Company in IndiaTotal Revenue (Rs Bn.)Year ending 31 March 2017(2)
64.360.8
34.9 34.3 30.7 30.1 28.0 26.9 23.2 22.6 21.813.7
0
25
50
75
ZeeEntertainment
Enterprises
Dish TV VideoconPro-forma
As-Is
Network 18Media &
Investments
AirtelDigital TV
Videocon d2h Dish TV Sun TVNetwork
TV18Broadcast
JagranPrakashan
D.B.Corp PVR HathwayCable &Datacom
EBITDA (Rs Bn.)Year ending 31 March 2017(2,3)
19.9 19.3 17.7
12.2 10.2 9.7
6.4 6.4 3.8 2.2 0.6
(2.7)(4)
4
12
20
Dish TVVideoconPro-forma
As-Is
ZeeEntertainment
Enterprises
Sun TVNetwork
AirtelDigital TV
Videocon d2h Dish TV JagranPrakashan
D.B.Corp PVR HathwayCable &Datacom
TV18Broadcast
Network18Media &
Investments(1)
32
Source: Annual Reports & Company FilingsNotes: 1. “Pro‐forma as‐is “ for financial metrics is simple arithmetic addition of FY2017 reported audited financials of DishTV and Vd2h. This information is for representational purposes only and does not account for any differences in the reported financials by the two companies on account of differences in accounting policies or GAAP2. Tata Sky information for FY17 is not available from public sources and has therefore been excluded3. Dish TV EBITDA are reported EBITDA figures, while Vd2h EBITDA are reported adjusted EBITDA figures
(1)
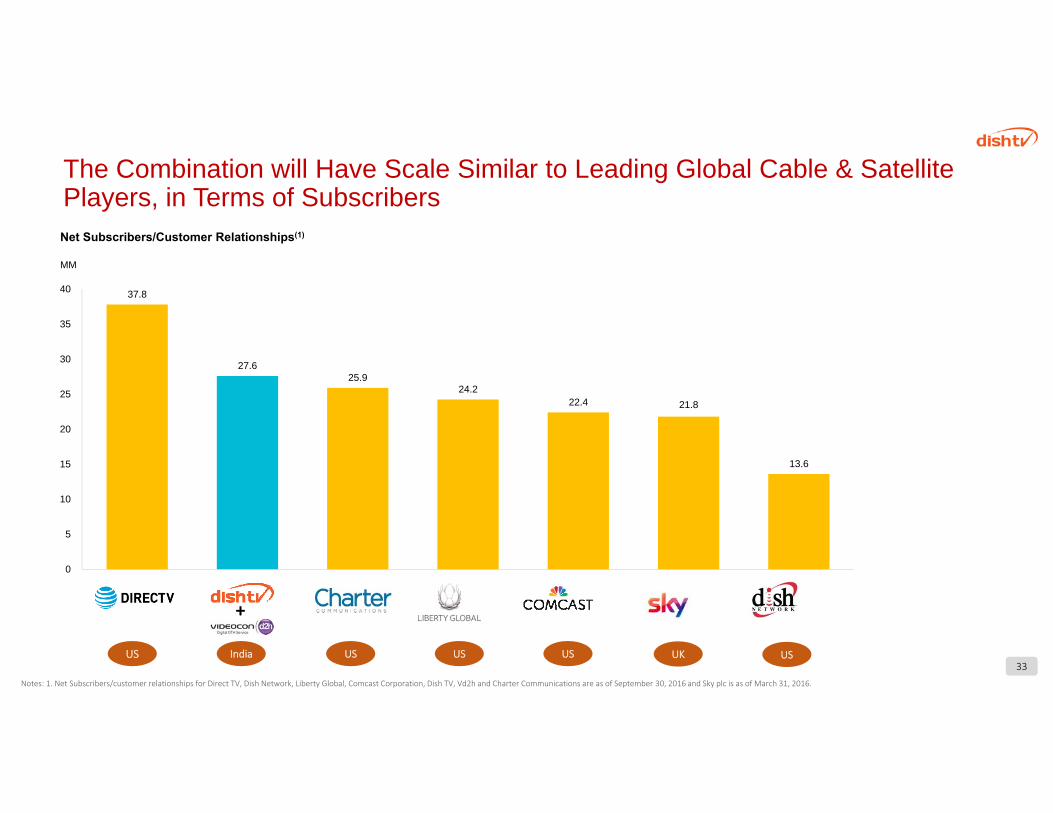
The Combination will Have Scale Similar to Leading Global Cable & Satellite Players, in Terms of SubscribersNet Subscribers/Customer Relationships(1)
MM
37.8
27.625.9
24.222.4 21.8
13.6
0
5
10
15
20
25
30
35
40
+
US India US US US UK US33
Notes: 1. Net Subscribers/customer relationships for Direct TV, Dish Network, Liberty Global, Comcast Corporation, Dish TV, Vd2h and Charter Communications are as of September 30, 2016 and Sky plc is as of March 31, 2016.
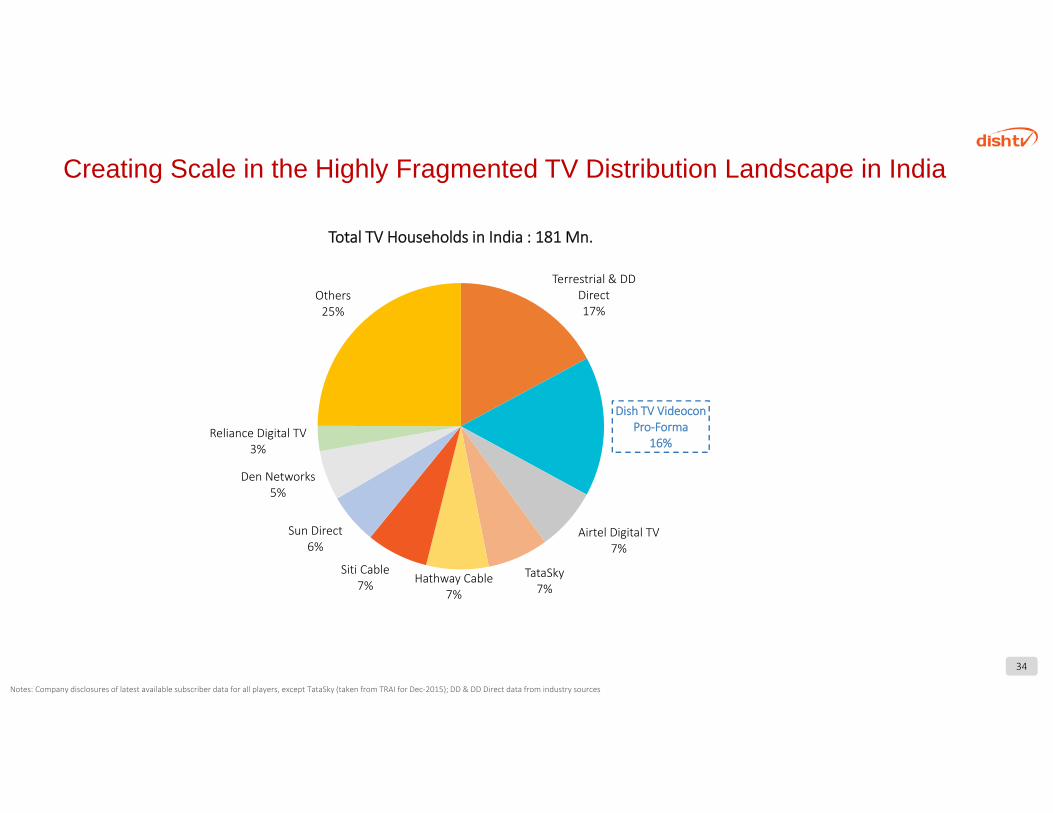
Creating Scale in the Highly Fragmented TV Distribution Landscape in India
Terrestrial & DD Direct17%
Dish TV Videocon Pro‐Forma
16%
Airtel Digital TV7%
TataSky7%
Hathway Cable7%
Siti Cable7%
Sun Direct6%
Den Networks5%
Reliance Digital TV3%
Others25%
Total TV Households in India : 181 Mn.
34
Notes: Company disclosures of latest available subscriber data for all players, except TataSky (taken from TRAI for Dec‐2015); DD & DD Direct data from industry sources
A Compelling and Transformational Combination
Creating a leading cable & satellite distribution platform, with room for growth1
Bringing together two well known brands in cable & satellite distribution2
Bouquet of offerings across the spectrum of subscribers3
Potential value creation from synergies generated through the combination4
Potential to offer new services to the large subscriber universe viz. broadband services etc. 5
Healthy financials535
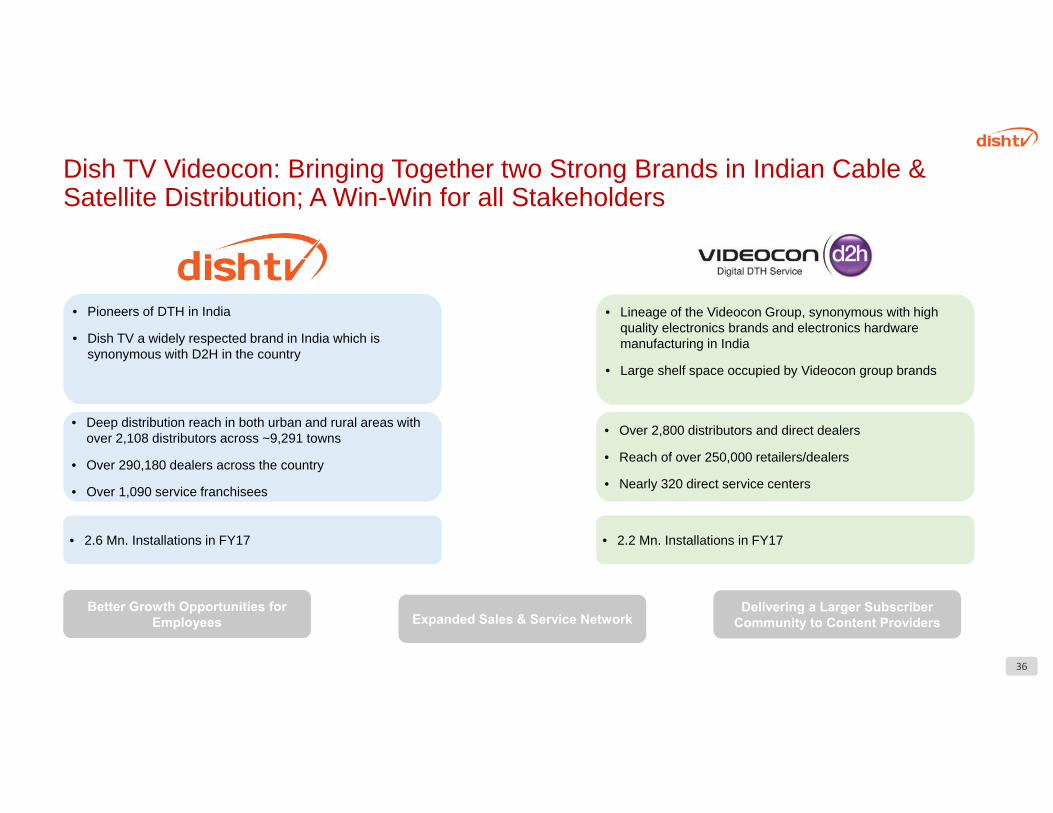
Dish TV Videocon: Bringing Together two Strong Brands in Indian Cable & Satellite Distribution; A Win-Win for all Stakeholders
• Pioneers of DTH in India
• Dish TV a widely respected brand in India which is synonymous with D2H in the country
• Lineage of the Videocon Group, synonymous with high quality electronics brands and electronics hardware manufacturing in India
• Large shelf space occupied by Videocon group brands
• Deep distribution reach in both urban and rural areas with over 2,108 distributors across ~9,291 towns
• Over 290,180 dealers across the country
• Over 1,090 service franchisees
• Over 2,800 distributors and direct dealers
• Reach of over 250,000 retailers/dealers
• Nearly 320 direct service centers
• 2.6 Mn. Installations in FY17 • 2.2 Mn. Installations in FY17
Better Growth Opportunities for Employees
Delivering a Larger Subscriber Community to Content ProvidersExpanded Sales & Service Network
36
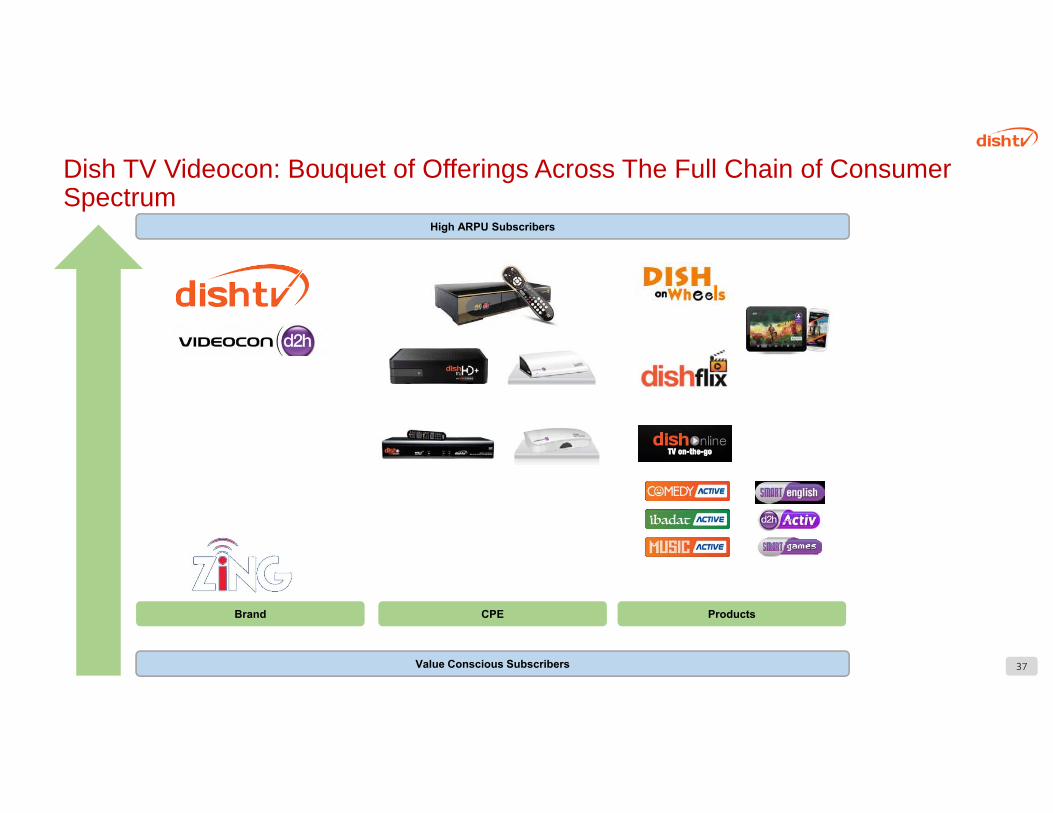
Dish TV Videocon: Bouquet of Offerings Across The Full Chain of Consumer Spectrum
Value Conscious Subscribers
Brand ProductsCPE
High ARPU Subscribers
37
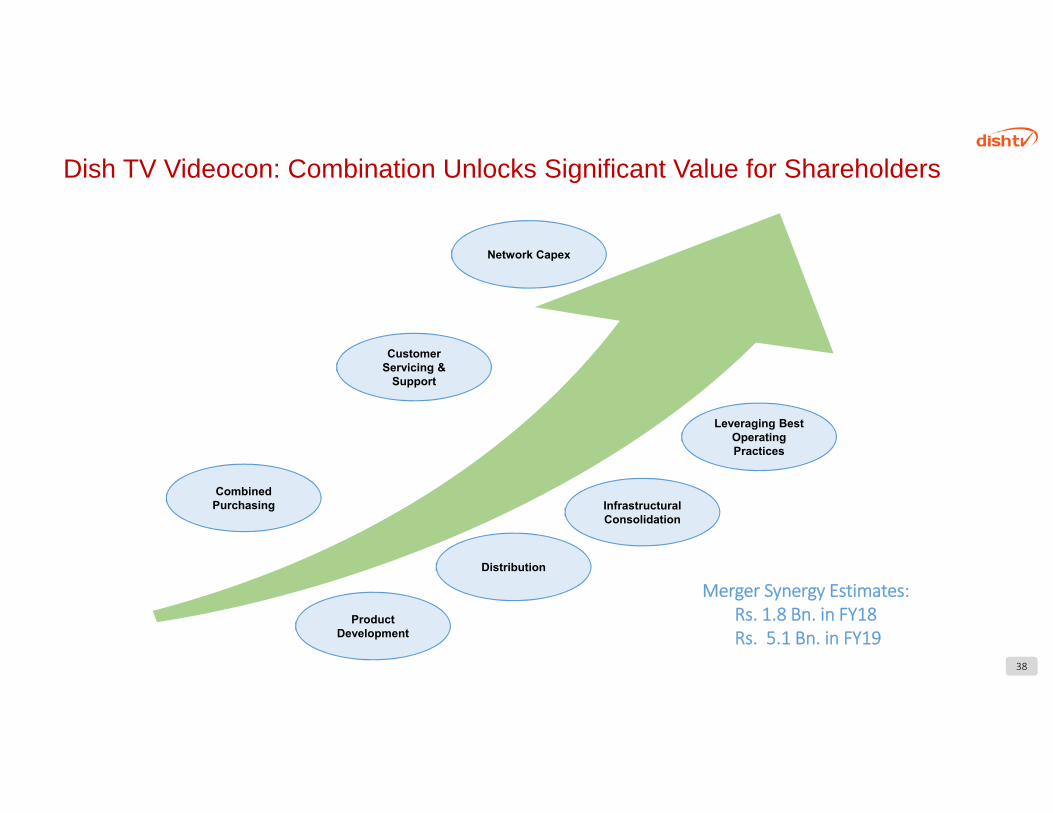
Dish TV Videocon: Combination Unlocks Significant Value for Shareholders
Customer Servicing &
Support
Leveraging Best Operating Practices
Infrastructural Consolidation
Combined Purchasing
Network Capex
Distribution
Product Development
Merger Synergy Estimates:Rs. 1.8 Bn. in FY18Rs. 5.1 Bn. in FY19
38

Thank you
39