Embed Size (px)
Citation preview
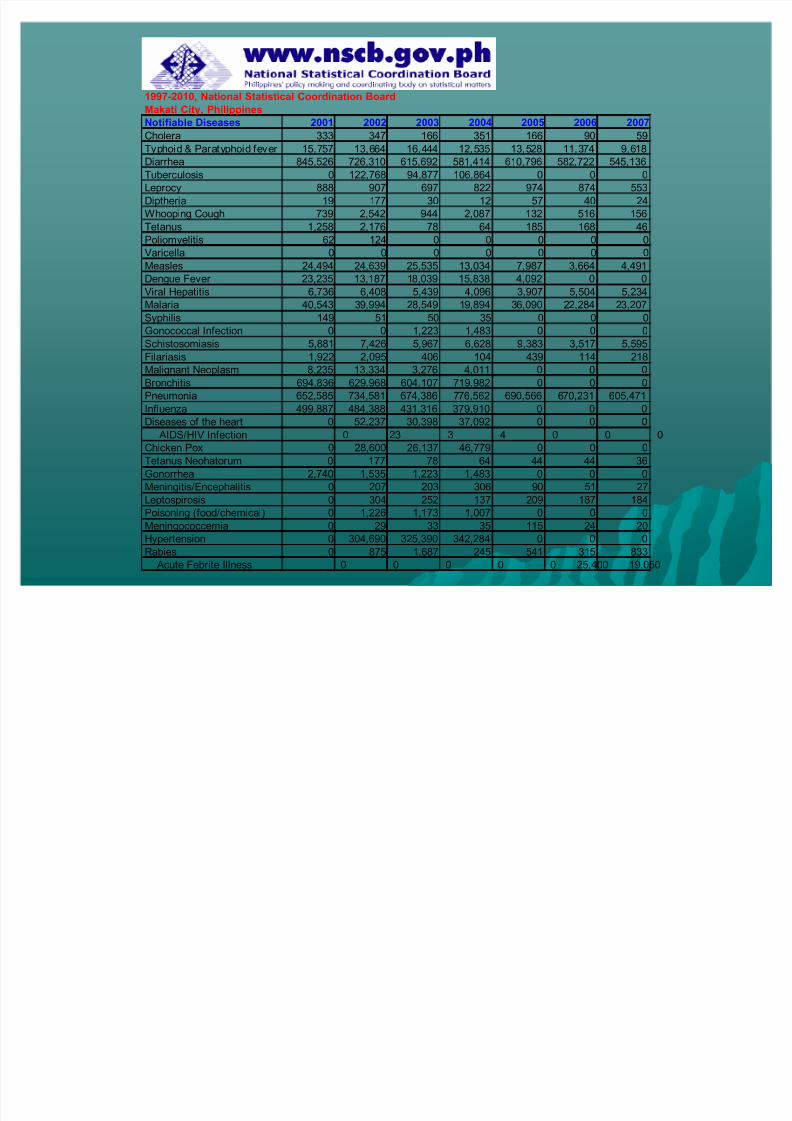
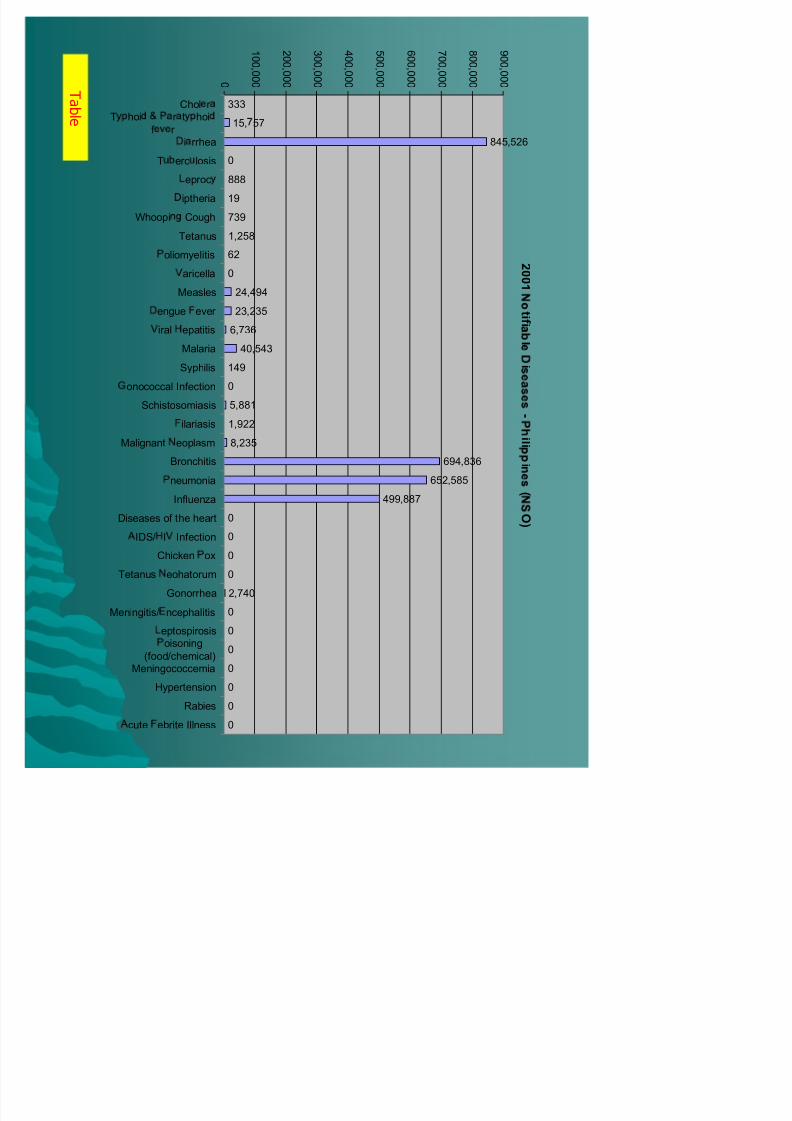
8/8/2019 Disease Statistics Chart
http://slidepdf.com/reader/full/disease-statistics-chart 1/13
8/8/2019 Disease Statistics Chart
http://slidepdf.com/reader/full/disease-statistics-chart 2/13
2
0 0 1
t i f i
l
i
-
i l i
i
(
O )
333
15, 57
845,526
0
888
19
739
1,258
62
024,494
23,235
6,736
40,543
149
0
5,881
1,922
8,235
694,836
652,585
499,887
0
0
0
0
2,740
0
0
1 0 0 , 0 0 0
2 0 0 , 0 0 0
3 0 0 , 0 0 0
4 0 0 , 0 0 0
5 0 0 , 0 0 0
6 0 0 , 0 0 0
7 0 0 , 0 0 0
8 0 0 , 0 0 0
9 0 0 , 0 0 0
Chol r T hoi r t hoi
f r i rr hea
T erc losis
epr oc
iptheria
Whoopi Cough
Tetanus
oliomyelitis
aricellaMeasles
engue ever
ir al epatitis
Malaria
Syphilis
onococcal Inf ection
Schistosomiasis
ilariasis
Malignant eoplasm
Br onchitis
neumonia
Influenza
Diseases of the heart
IDS/ I Inf ection
Chicken ox
Tetanus eohator um
Gonorr hea
/
T a b l e
8/8/2019 Disease Statistics Chart
http://slidepdf.com/reader/full/disease-statistics-chart 3/13
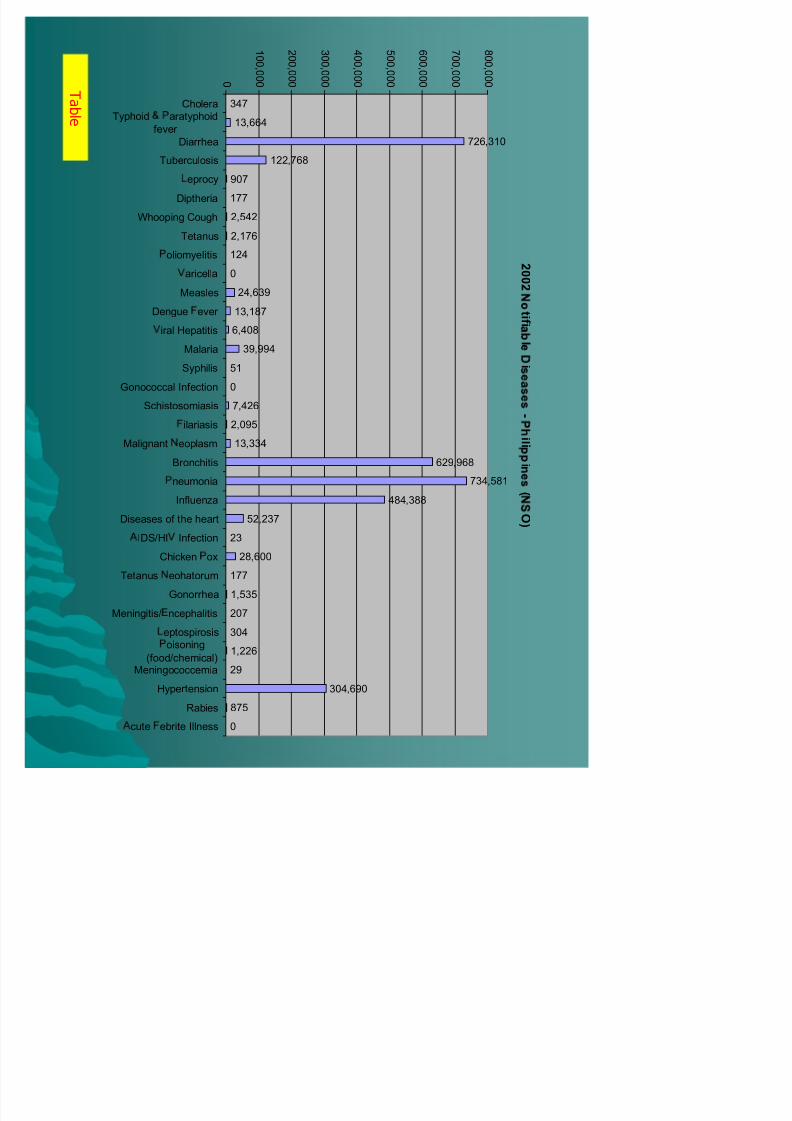
2
0 0 2
t i f i
l
i
-
i l i
i
(
O )
347
13,664
726,310
122,768
907
177
2,542
2,176
124
024,639
13,187
6,408
39,994
51
0
7,426
2,095
13,334
629,968
734,581
484,388
52,237
23
28,600
177
1,535
0
1 0 0 , 0 0 0
2 0 0 , 0 0 0
3 0 0 , 0 0 0
4 0 0 , 0 0 0
5 0 0 , 0 0 0
6 0 0 , 0 0 0
7 0 0 , 0 0 0
8 0 0 , 0 0 0
Choler a
Typhoid ar atyphoid
f ever
Diarr hea
Tuberculosis
epr ocy
Diptheria
Whooping Cough
Tetanus
oliomyelitis
aricella
Measles
Dengue ever
ir al Hepatitis
Malaria
Syphilis
Gonococcal Inf ection
Schistosomiasis
ilariasis
Malignant eoplasm
Br onchitis
neumonia
Influenza
Diseases of the heart
IDS/HI Inf ection
Chicken ox
Tetanus eohator um
Gonorr hea
T a b l e

8/8/2019 Disease Statistics Chart
http://slidepdf.com/reader/full/disease-statistics-chart 4/13
2
0 0 3
t i f i
l
i
-
i l i
i
(
O )
166
16,444
615,692
94,877
697
30
944
78
0
0
25,535
18,039
5,439
28,549
50
1,223
5,967
406
3,276
604,107
674,386
431,316
30,398
3
26,137
78
1,223
0
1 0 0 , 0 0 0
2 0 0 , 0 0 0
3 0 0 , 0 0 0
4 0 0 , 0 0 0
5 0 0 , 0 0 0
6 0 0 , 0 0 0
7 0 0 , 0 0 0
Choler aTyphoid ar atyphoid
f ever Diarr hea
Tuberculosis
epr ocy
Diptheria
Whooping Cough
Tetanus
oliomyelitis
aricella
Measles
Dengue ever
ir al Hepatitis
Malaria
Syphilis
Gonococcal Inf ection
Schistosomiasis
ilariasis
Malignant eoplasm
Br onchitis
neumonia
Influenza
Diseases of the heart
IDS/HI Inf ection
Chicken ox
Tetanus eohator um
Gonorr hea
T a b l e
8/8/2019 Disease Statistics Chart
http://slidepdf.com/reader/full/disease-statistics-chart 5/13
2
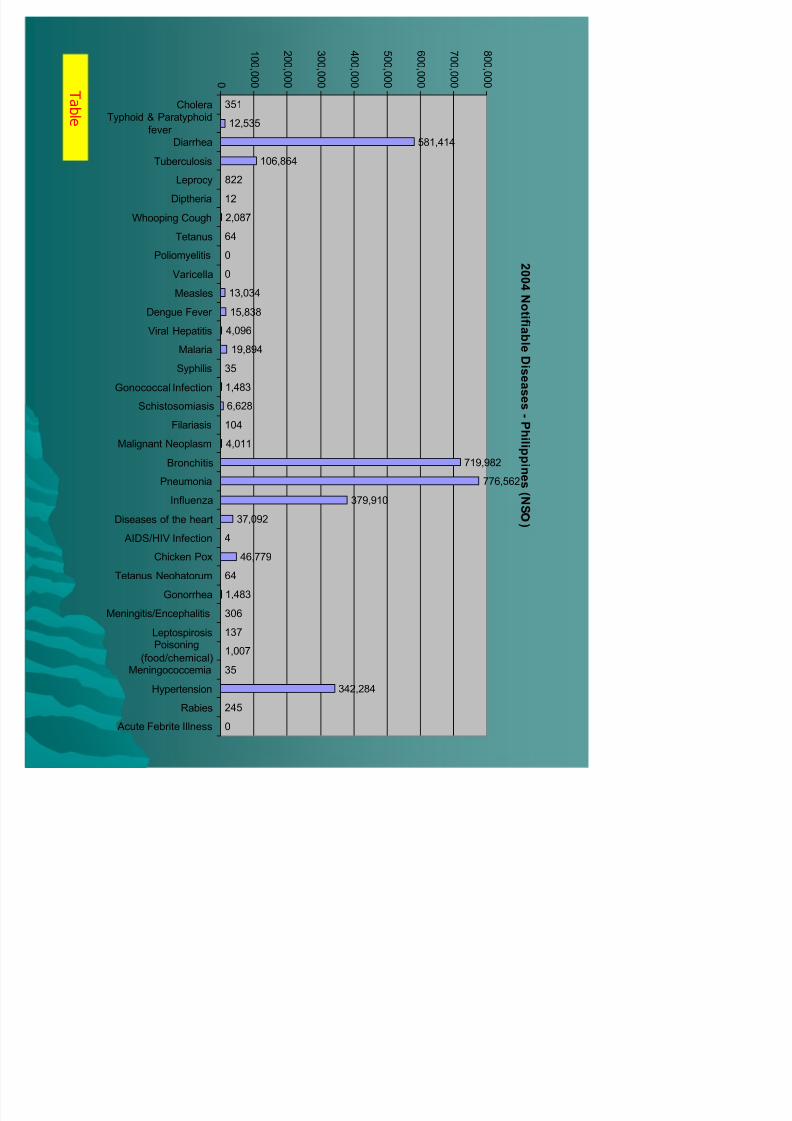
0 0 4 N o t i f i a b l eDi s e a s e s
-P h i l i p pi n e s ( N S
)
351
12,535
581,414
106,864
822
12
2,087
64
0
013,034
15,838
4,096
19,894
35
1,483
6,628
104
4,011
719,982
776,562
379,910
37,092
4
46,779
64
1,483
0
1 0 0 , 0 0 0
2 0 0 , 0 0 0
3 0 0 , 0 0 0
4 0 0 , 0 0 0
5 0 0 , 0 0 0
6 0 0 , 0 0 0
7 0 0 , 0 0 0
8 0 0 , 0 0 0
CholeraTyphoid & Paratyphoid
fever
Diarrhea
Tuberculosis
Leprocy
Diptheria
Whooping Cough
Tetanus
Poliomyelitis
Varicella
Measles
Dengue Fever
Viral Hepatitis
Malaria
Syphilis
Gonococcal Infection
Schistosomiasis
Filariasis
Malignant Neoplasm
Bronchitis
Pneumonia
Influenza
Diseases of the heart
AIDS/HIV Infection
Chicken Pox
Tetanus Neohatorum
Gonorrhea
T a b l e
8/8/2019 Disease Statistics Chart
http://slidepdf.com/reader/full/disease-statistics-chart 6/13
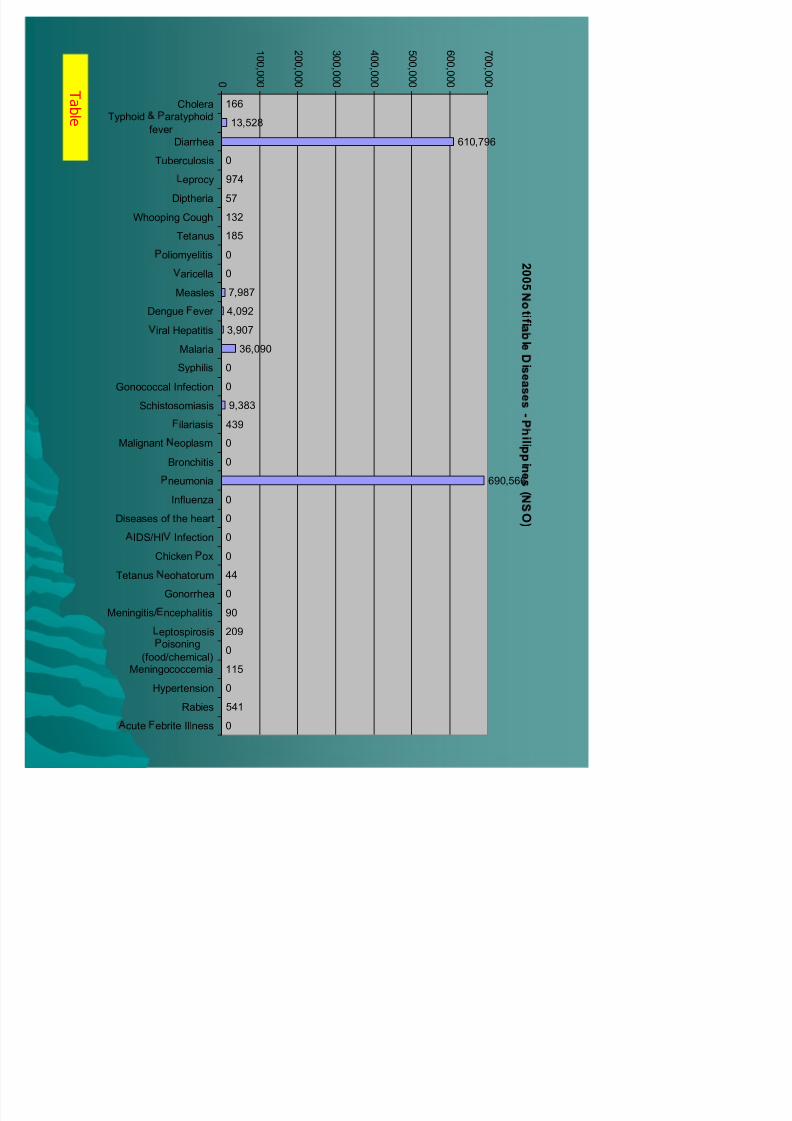
2 0 0 5
t i f i
l
i
-
i l i
i
(
O )
166
13,528
610,796
0
974
57
132
185
0
07,987
4,092
3,907
36,090
0
0
9,383
439
0
0
690,566
0
0
0
0
44
0
0
1 0 0 , 0 0 0
2 0 0 , 0 0 0
3 0 0 , 0 0 0
4 0 0 , 0 0 0
5 0 0 , 0 0 0
6 0 0 , 0 0 0
7 0 0 , 0 0 0
Choler aTyphoid ar atyphoid
f ever
Diarr hea
Tuberculosis
epr ocy
Diptheria
Whooping Cough
Tetanus
oliomyelitis
aricellaMeasles
Dengue ever
ir al Hepatitis
Malaria
Syphilis
Gonococcal Inf ection
Schistosomiasis
ilariasis
Malignant eoplasm
Br onchitis
neumonia
Influenza
Diseases of the heart
IDS/HI Inf ection
Chicken ox
Tetanus eohator um
Gonorr hea
T a b l e

8/8/2019 Disease Statistics Chart
http://slidepdf.com/reader/full/disease-statistics-chart 7/13
2 0 0 6
t i f i
l
i
-
i l i
i
(
O )
90
11,374
582,722
0
874
40
516
168
0
03,664
0
5,504
22,284
0
0
3,517
114
0
0
670,231
0
0
0
0
44
0
0
1 0 0 , 0 0 0
2 0 0 , 0 0 0
3 0 0 , 0 0 0
4 0 0 , 0 0 0
5 0 0 , 0 0 0
6 0 0 , 0 0 0
7 0 0 , 0 0 0
Choler aTyphoid ar atyphoid
f ever
Diarr hea
Tuberculosis
epr ocy
Diptheria
Whooping Cough
Tetanus
oliomyelitis
aricellaMeasles
Dengue ever
ir al Hepatitis
Malaria
Syphilis
Gonococcal Inf ection
Schistosomiasis
ilariasis
Malignant eoplasm
Br onchitis
neumonia
Influenza
Diseases of the heart
IDS/HI Inf ection
Chicken ox
Tetanus eohator um
Gonorr hea
T a b l e
8/8/2019 Disease Statistics Chart
http://slidepdf.com/reader/full/disease-statistics-chart 8/13
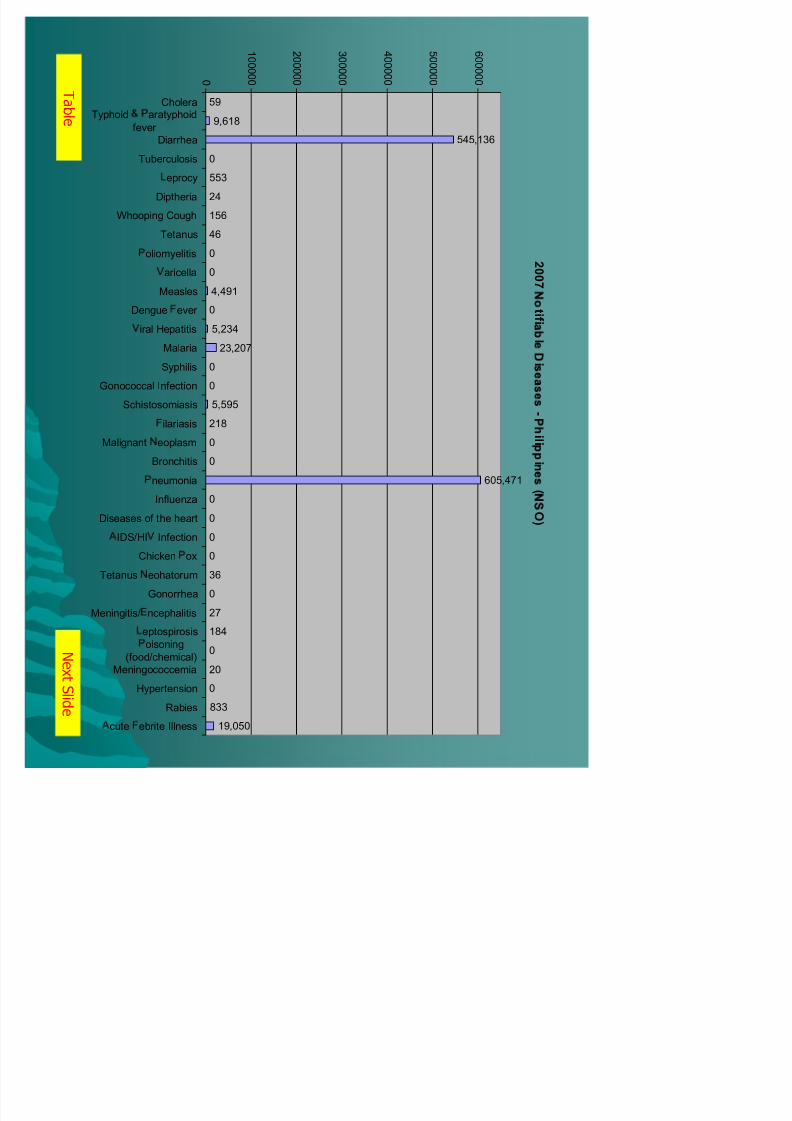
2 0
0 7
t i f i
l
i
-
i l i
i
(
O )
59
9,618
545,136
0
553
24
156
46
0
04,491
0
5,234
23,207
0
0
5,595
218
0
0
605,471
0
0
0
0
36
0
0
1 0 0 0 0 0
2 0 0 0 0 0
3 0 0 0 0 0
4 0 0 0 0 0
5 0 0 0 0 0
6 0 0 0 0 0
Choler aTyphoid ar atyphoid
f ever
Diarr hea
Tuberculosis
epr ocy
Diptheria
Whooping Cough
Tetanus
oliomyelitis
aricellaMeasles
Dengue ever
ir al Hepatitis
Malaria
Syphilis
Gonococcal Inf ection
Schistosomiasis
ilariasis
Malignant eoplasm
Br onchitis
neumonia
Influenza
Diseases of the heart
IDS/HI Inf ection
Chicken ox
Tetanus eohator um
Gonorr hea
T a b l e
8/8/2019 Disease Statistics Chart
http://slidepdf.com/reader/full/disease-statistics-chart 9/13
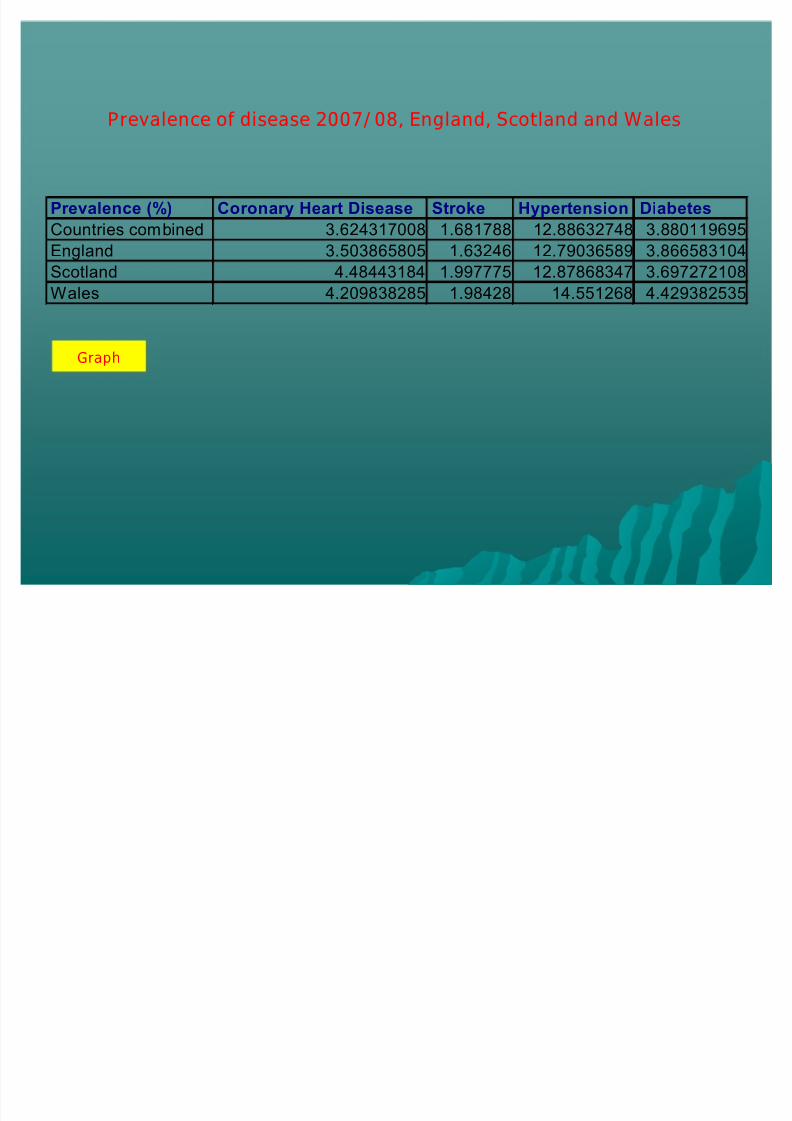
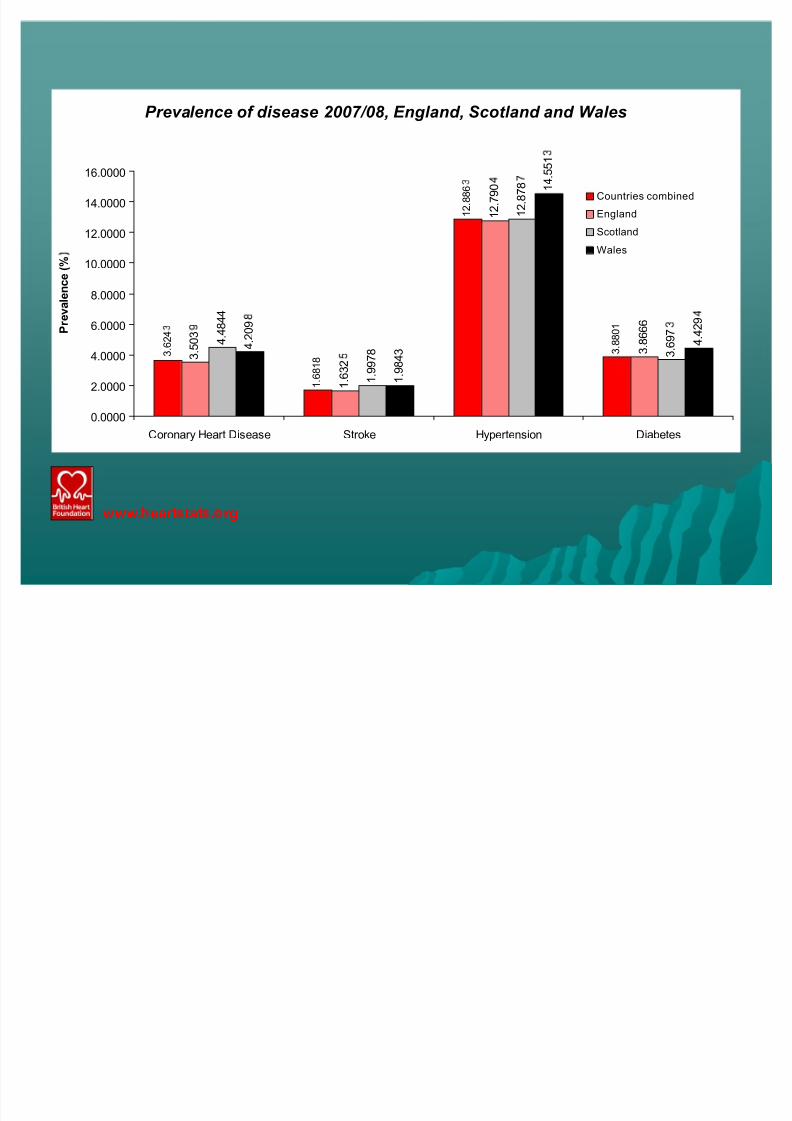
Prevalence (%) Coronary Heart Disease Stroke Hypertension Diabetes
Countries combined 3.624317008 1.681788 12.88632748 3.880119695
England 3.503865805 1.63246 12.79036589 3.866583104
Scotland 4.48443184 1.997775 12.87868347 3.697272108Wales 4.209838285 1.98428 14.551268 4.429382535
Prevalence of disease 2007/08, England, Scotland and Wales
Graph
8/8/2019 Disease Statistics Chart
http://slidepdf.com/reader/full/disease-statistics-chart 10/13
Prevalence of disease 2007/08, England, Scotland and Wales
1 .
6 8 1 8
1 2 .
8 8 6
3 .
8 8 0 1
3 .
5 0 3
1 . 6
3 2
1 2 .
7 9 0
3 .
8 6 6 6
4 .
4 8 4 4
1 .
9 9 7 8
1 2 .
8 7 8
3 . 6
9 7
4 . 2
0 9
1 .
9 8 4 3
1 4 .
5 5 1
4 . 4
2 9
3 .
6 2 4
0.0000
2.0000
4.0000
6.0000
8.0000
10.0000
12.0000
14.0000
16.0000
Coronary Heart Disease Stroke Hypertension Diabetes
P r e v a l e n c e
( %
Countries combined
England
Scotland
Wales
www. eart tat . rg
8/8/2019 Disease Statistics Chart
http://slidepdf.com/reader/full/disease-statistics-chart 11/13
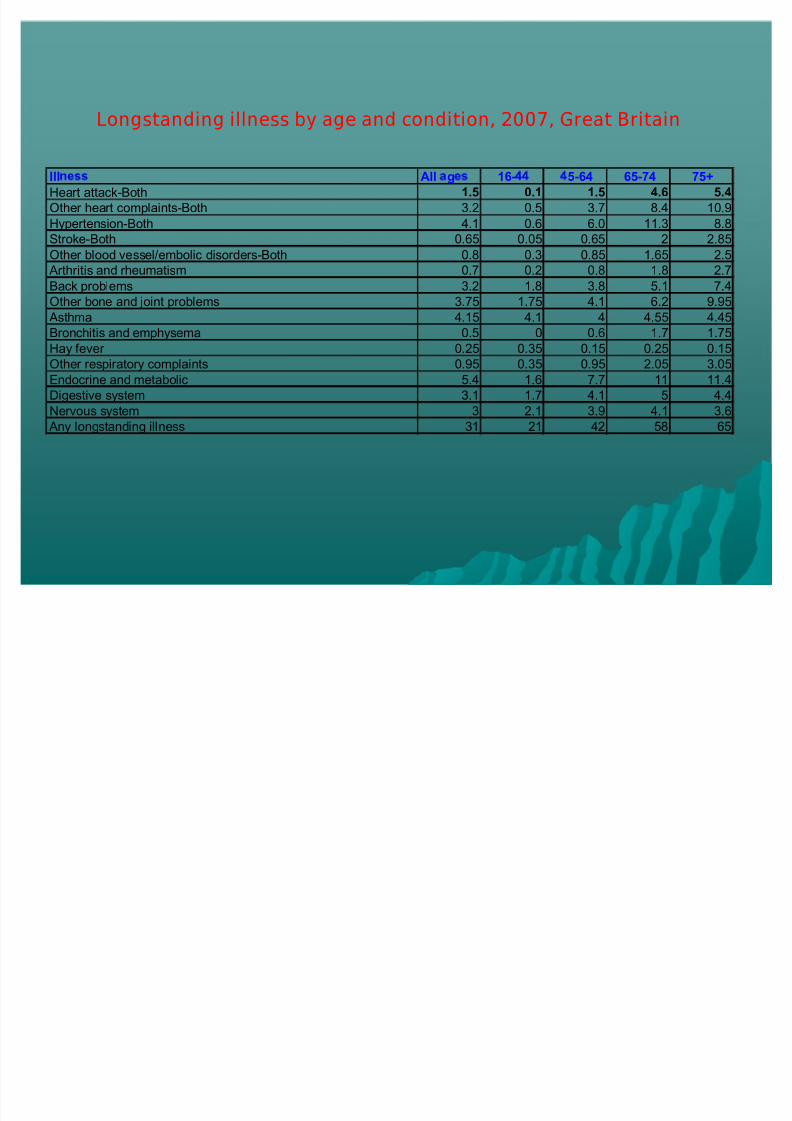
Ill All g 16- 5-64 65-74 75+
Heart attack-Both 1.5 0.1 1.5 4.6 5.4
Other heart complaints-Both 3.2 0.5 3.7 8.4 10.9
Hypertension-Both 4.1 0.6 6.0 11.3 8.8
Str oke-Both 0.65 0.05 0.65 2 2.85
Other blood vessel/embolic disor ders-Both 0.8 0.3 0.85 1.65 2.5
Arthritis and r heumatism 0.7 0.2 0.8 1.8 2.7
Back pr oblems 3.2 1.8 3.8 5.1 7.4
Other bone and joint pr oblems 3.75 1.75 4.1 6.2 9.95
Asthma 4.15 4.1 4 4.55 4.45
Br onchitis and emphysema 0.5 0 0.6 1.7 1.75
Hay f ever 0.25 0.35 0.15 0.25 0.15
Other r espir ator y complaints 0.95 0.35 0.95 2.05 3.05
Endocrine and metabolic 5.4 1.6 7.7 11 11.4
Digestive system 3.1 1.7 4.1 5 4.4
Ner vous system 3 2.1 3.9 4.1 3.6 Any longstanding illness 31 21 42 58 65
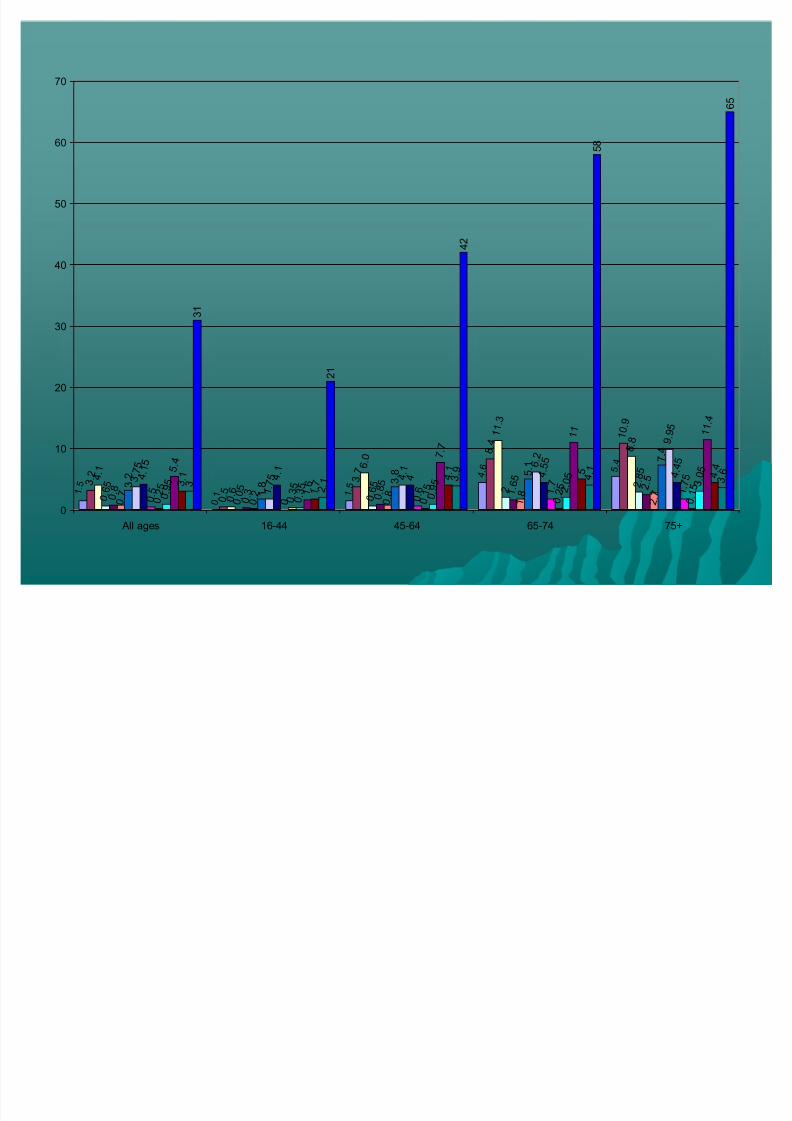
Longstanding illness by age and condition, 2007, Great Britain
8/8/2019 Disease Statistics Chart
http://slidepdf.com/reader/full/disease-statistics-chart 12/13
0 .
1 1 .
5
4 .
6 5 .
4
3 .
2
0 .
5
3 .
7
8 .
41
0 .
9
4 .
1
0 .
6
6 .
0
1 1
.
3
8 .
8
0 .
6 5
0 .
0 5
0 .
6 5
22 .
8 5
0 .
8
0 .
3 0
.
8 5
1 .
6 5
2 .
5
0 .
7 0
.
2 0
.
8 1
.
8 2
.
7
3 .
2
1 .
83 .
8 5 .
17 .
4
3 .
7 5
1 .
7 5 4
. 1
6 .
2
9 .
9 5
4 .
1 5
4 .
1
4 4 .
5 5
4 .
4 5
0 .
5
0 0 .
6 1 .
7 1
. 7 5
0 .
2 5
0 .
3 5
0 .
1 5
0 .
2 5
0 .
1 5
0 .
9 5
0 .
3 5
0 .
9 5
2 .
0 5
3 .
0 5 5
.
4
1 .
6
7 .
7
1 1 1
1 .
4
3 .
1
1 .
74 .
1 5 4
.
4
3 2
.
1 3 .
9 4
. 1
3 .
6
3 1
2 1
4 2
5 8
6 5
1 .
5
0
10
20
30
40
50
60
70
All ages 16-44 45-64 65-74 75+
8/8/2019 Disease Statistics Chart
http://slidepdf.com/reader/full/disease-statistics-chart 13/13
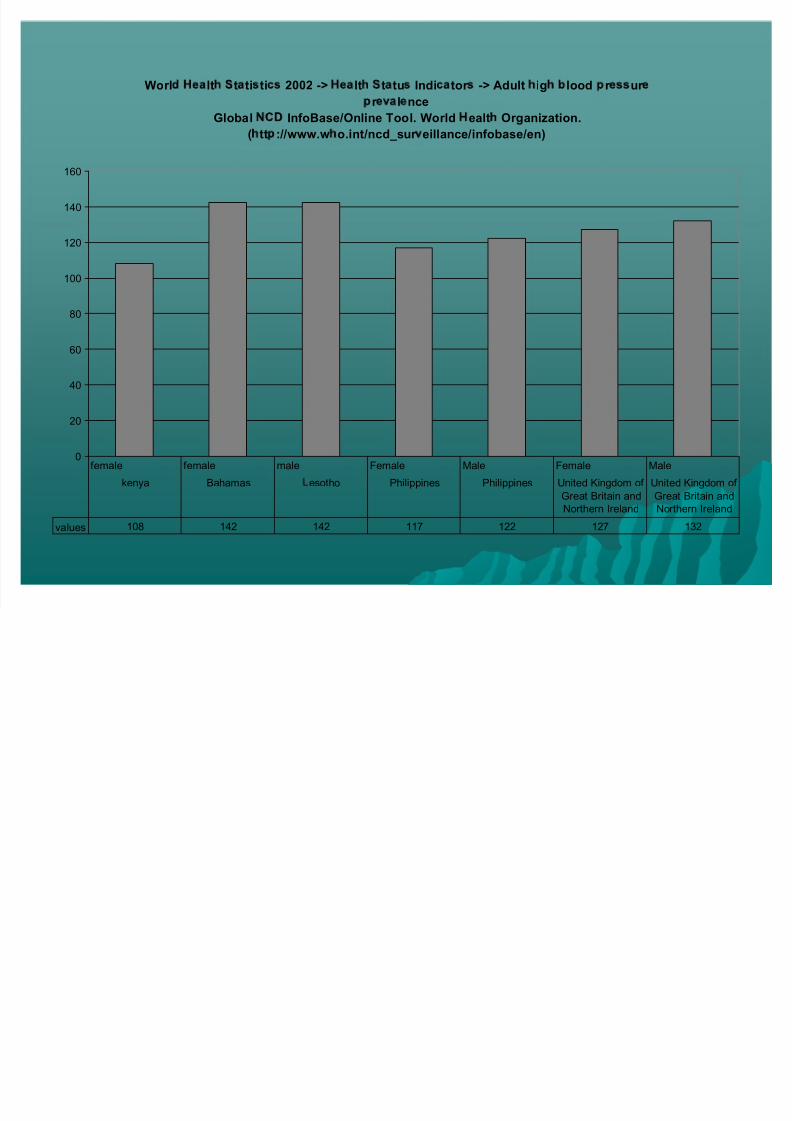
Worl lt t ti ti 2002 -> lt t tu Indi tor -> Adult ig lood r ur
r l nce
Global Inf oBase/Online Tool. World ealt Organization.
( tt : //www.w o.int /ncd_sur eillance/inf obase/en)
0
20
40
60
80
100
120
140
160
values 108 142 142 117 122 127 132
f emale f emale male Female Male Female Male
kenya Bahamas esotho Philippines Philippines United Kingdom of
Gr eat Britain and
Norther n Ir eland
United Kingdom of
Gr eat Britain and
Norther n Ir eland