Embed Size (px)
Citation preview
© 2017. Published by The Company of Biologists Ltd.
This is an Open Access article distributed under the terms of the Creative Commons Attribution License
(http://creativecommons.org/licenses/by/3.0), which permits unrestricted use, distribution and reproduction
in any medium provided that the original work is properly attributed.
Parallel imaging of Drosophila embryos
for quantitative analysis of genetic perturbations of the Ras pathway
Yogesh Goyala,b,1
, Thomas J. Levarioc,1
, Henry H. Mattinglya,b
, Susan Holmesd,
Stanislav Y. Shvartsmana,b,2
, and Hang Luc,2
aDepartment of Chemical and Biological Engineering, Princeton University, Princeton, NJ 08544
bLewis-Sigler Institute for Integrative Genomics, Princeton University, Princeton, NJ 08544
cSchool of Chemical and Biomolecular Engineering, Georgia Institute of Technology, Atlanta, GA
30332
dDepartment of Statistics, Stanford University, Stanford, CA 94305
1Y.G. and T.J.L. contributed equally to this work
2Correspondence: [email protected] or [email protected]
Keywords: Microfluidics; Ras; Mutations; Capicua; SVD
Dis
ease
Mo
dels
& M
echa
nism
s •
DM
M •
Adv
ance
art
icle
http://dmm.biologists.org/lookup/doi/10.1242/dmm.030163Access the most recent version at DMM Advance Online Articles. Posted 11 May 2017 as doi: 10.1242/dmm.030163http://dmm.biologists.org/lookup/doi/10.1242/dmm.030163Access the most recent version at
First posted online on 11 May 2017 as 10.1242/dmm.030163
Summary statement
Our work combines microfluidics, live imaging, and systems biology techniques to develop a
new approach for the functional analysis of sequence variants in the highly conserved Ras
signaling pathway.
Abstract
The Ras pathway patterns the poles of the Drosophila embryo by downregulating the levels
and activity of a DNA-binding transcriptional repressor Capicua (Cic). We demonstrate that
the spatiotemporal pattern of Cic during this signaling event can be harnessed for functional
studies of the Ras-pathway mutations from human diseases. Our approach relies on a new
microfluidic device that enables parallel imaging of Cic dynamics in dozens of live embryos.
We found that although the pattern of Cic in early embryos is complex, it can be accurately
approximated by a product of one spatial profile and one time-dependent amplitude.
Analysis of these functions of space and time alone reveals the differential effects of
mutations within the Ras pathway. Given the highly-conserved nature of Ras-dependent
control of Cic, our approach opens a new way for functional analysis of multiple sequence
variants from developmental abnormalities and cancers.
Dis
ease
Mo
dels
& M
echa
nism
s •
DM
M •
Adv
ance
art
icle
Introduction
The Ras signaling pathway is a highly conserved regulator of adult and developing animal
tissues. Studies in model organisms were essential in delineating this critical pathway via
genetic screens that relied on analyses of the morphological defects in specific Ras-
dependent structures, such as the insect eye or nematode vulva (Brunner et al., 1994;
Freeman, 1996; Han and Sternberg, 1990; Han et al., 1993; Kornfeld et al., 1995; O’Neill et
al., 1994; Schupbach and Wieschaus, 1986; Sternberg and Han, 1998). One of the main
advantages of these screens, which continue to reveal new components and interactions, is
their ability to examine large numbers of samples, providing the basis for follow-up studies at
molecular and cellular levels. With the advent of live imaging, it became possible to not only
analyze the ultimate morphological outcomes of genetic perturbations, but also to monitor
the dynamics of signaling (Haigo and Bilder, 2011; Levario et al., 2016a; Solon et al., 2009).
However, most of the live imaging studies are limited in the number of organisms that can be
examined at any given time, which is in contrast to the high-throughput nature of earlier work
in model genetic systems. Here we present an experimental and analytical strategy that
addresses this problem, providing new opportunities for the quantitative analysis of the Ras
pathway and its genetic perturbations.
Our strategy is based on parallel imaging of the early Drosophila embryo, a system that
combines low cost, simple anatomy, and amenability to a wide range of genetic
manipulations. We focus on Ras signaling during the time when the embryonic termini are
patterned by a locally activated receptor tyrosine kinase (RTK) Torso (Casanova and Struhl,
1989). Torso is active only at the poles, reflecting the localized processing of its secreted
ligand (Furriols and Casanova, 2003). Signaling through the Ras pathway, Torso induces the
dual phosphorylation and activation of the Extracellular Signal Regulated Kinase (ERK), an
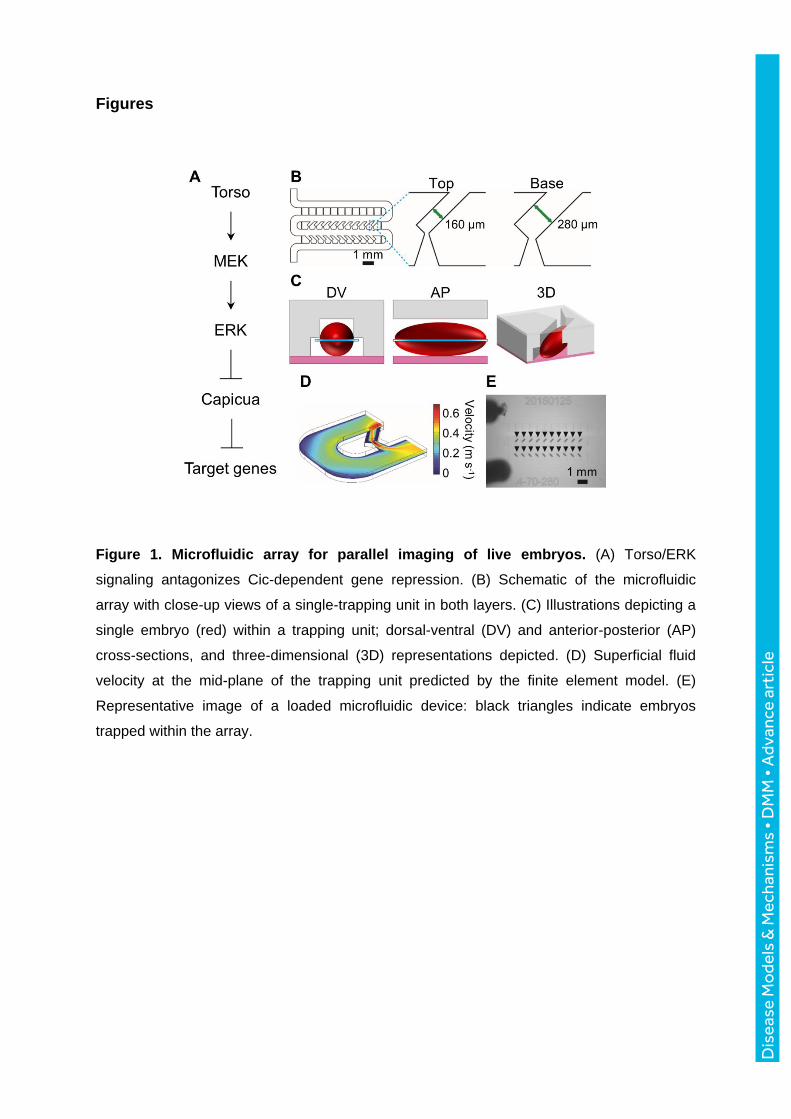
enzyme with multiple intracellular substrates (Fig. 1A) (Gabay et al., 1997). One of the main
substrates of ERK in the early embryo is a DNA-binding transcriptional repressor Capicua
(Cic), which acts as a common sensor of the Ras pathway in adult and developing tissues
(Futran et al., 2013; Jiménez et al., 2000; Lee et al., 2002; Liao et al., 2017; Okimoto et al.,
2016). In response to direct phosphorylation by ERK, Cic is exported from the nucleus and
degraded in the cytoplasm, enabling the expression of genes needed for the formation of
nonsegmented terminal structures in the future larva (Grimm et al., 2012; Johnson et al.,
2017; Lim et al., 2013).
The spatial pattern of Cic in the early embryo is very sensitive to Ras activation, suggesting
that it can be used to develop a strategy for quantitative comparison of mutations associated
with deregulated Ras signaling. However, this pattern is very dynamic, reflecting the fact that
Dis
ease
Mo
dels
& M
echa
nism
s •
DM
M •
Adv
ance
art
icle
Ras-dependent control of Cic coincides with nuclear divisions. Therefore, quantitative
comparison of Cic patterns requires live imaging. Until recently, live imaging of Cic has been
possible only in one embryo at a time (Grimm et al., 2012). We have designed a microfluidic
device with new features for parallel imaging of Cic dynamics in dozens of embryos and
demonstrate that this enables quantitative analysis of the differential effects of mutations
within the Ras pathway. Given the highly conserved nature of the signaling cascade that
leads from Torso activation to Cic downregulation, our approach can be used for functional
analysis of the rapidly-accumulating Ras pathway mutations from human diseases (Hanahan
and Weinberg, 2011; Jindal et al., 2015; Rauen, 2013).
Results
Microfluidic device for parallel imaging of Cic dynamics in embryos
The spatiotemporal pattern of Cic in the early embryo reflects combined effects of spatially
uniform translation of Cic from maternally deposited transcript, localized control of Cic
nuclear localization and degradation, and ongoing nuclear divisions. The Ras-dependent
ERK activation at the poles increases the rate of Cic nuclear export and decreases nuclear
import. At the same time, the levels of Cic are high and largely nuclear in the middle of the
embryo, where the Ras pathway is inactive. All of this happens when the embryo is still a
syncytium, where nuclei are dividing in a shared cytoplasm. At the onset of every interphase,
the nuclear levels of Cic are essentially zero, but they are rapidly re-established. A
combination of these processes results in a dynamic pattern where the levels of Cic remain
low at the poles, increase in the middle of the embryo, and are punctuated by nuclear
divisions (Grimm et al., 2012).
Given these complex dynamics, quantitative comparisons of the Cic patterns across mutant
backgrounds requires data from multiple embryos, ideally imaged under the same
conditions. We developed a microfluidic chip optimized for this specific purpose. As a
starting point, we used our earlier design of a microfluidic array that orients embryos in the
upright position (Chung et al., 2011; Levario et al., 2013; Levario et al., 2016a; Levario et al.,
2016b). Since the pattern of Cic in the early embryo is distributed along the anteroposterior
axis, we redesigned our array to laterally orient embryos (Fig. S1). The new design has a
two-step geometry with a wide base and a narrow top (Fig. 1B). The wide base enables
aberration-free imaging near the midsagittal section of the embryo (Fig. 1C, Fig. S2).
To optimize the embryo trapping efficiency in the array, we used finite element calculations
to tune the fluid resistances in the main flow manifold and trap channels. The trapping
Dis
ease
Mo
dels
& M
echa
nism
s •
DM
M •
Adv
ance
art
icle
efficiency in the new array is greater than 90%, which enables data collection from dozens of
embryos in a single imaging experiment (Fig. 1D,E). After confirming that the trapped
embryos develop normally in our microfluidic array, we used it to monitor Cic levels starting
from nuclear cycle 10 to gastrulation. Consistent with previously established results (Grimm
et al., 2012), we found Cic levels to be low at the poles and elevated toward the embryo mid-
body, wherein Cic levels are uniform throughout the central ~50% of the anterior-posterior
axis.
Low-dimensional approximation of spatiotemporal dynamics
To analyze the large amount of data acquired in these experiments, we developed a pipeline
for image processing and data representation. First, the raw live imaging data from the
midsagittal optical sections of individual embryos were converted into a two-dimensional
matrix, in which the columns are the anteroposterior profiles of Cic at consecutive time
points (Fig. 2). This matrix serves as a starting point for analyzing the spatiotemporal pattern
of Cic across the embryo. In addition, we used image segmentation to extract the temporal
dynamics of Cic levels from individual nuclei (Fig. S3). Thus, our approach provides access
to Cic dynamics on the scale of a single cell and the whole tissue.
As discussed above, the dynamic pattern of Cic arises as a combination of processes that
depend on time, such as the spatially uniform nuclear divisions in the blastoderm, and on
space, such as Ras signaling at the poles. We hypothesized that the spatiotemporal pattern
of Cic could be approximated by a separable function—that is, a product of two functions,
one of which depends only on time and the other depends only on space. To test this idea,
we used the singular value decomposition (SVD) to find rank-one approximations for the
matrices describing the spatiotemporal patterns of Cic extracted from live imaging data. This
approximation is given by the product of the left and right singular vectors corresponding to
the leading singular value. Fig. 3A shows that these functions reveal the spatial structure of
the Cic pattern—high in the middle of the embryo, low at the poles—and its temporal
dynamics—increasing levels, punctuated by sequential mitoses. We defined a measure of
the accuracy of the rank-one approximation based on the singular values that equals one
when the approximation is exact (see Materials and Methods). Our analysis of the Cic
space-time matrices revealed that the accuracy measures were greater than 0.96 for all
embryos, indicating the appropriateness of the rank-one approximations.
Finally, we tested whether this representation of Cic dynamics can also be used in multiple
genetic backgrounds. Towards this end, we collected ensembles of spatiotemporal data on
Cic dynamics from embryos with genetic perturbations of Ras signaling (see below). In all
cases, we found that rank one approximations were accurate (>0.95, based on the defined
Dis
ease
Mo
dels
& M
echa
nism
s •
DM
M •
Adv
ance
art
icle
measure). Representative examples are shown in Fig. 3B,C. Visual inspection of the leading
spatial profiles and their time-dependent amplitudes reveals that different backgrounds can
be compared based on the quantitative properties of these one-dimensional functions. This
is the basis for our statistical analysis in the next section.
Statistical comparison across genetic backgrounds
To test whether the presented approach can be used to quantitatively compare the effects of
genetic perturbations, we analyzed Cic dynamics in embryos from three different genetic
backgrounds. The first set of embryos carried a dominant mutation in the gene encoding
Torso. This mutation was discovered in a mutagenesis screen and results in ligand-
independent activation of Ras signaling, leading to major defects in embryo segmentation
(Klingler et al., 1988). Similar patterning defects (progressive loss of segments) can be
caused by misexpression of activating variants of Dsor1, a Drosophila ortholog of human
MEK1, a critical component of the Ras pathway (Goyal et al., 2017). Wild-type MEK1 (and
Dsor1) is activated only in response to extracellular ligands. However, MEK1 activity can
become ligand independent for several point mutations found in human diseases, including
developmental abnormalities and cancers (Goyal et al., 2017; Jindal et al., 2017). Here we
analyzed the effects of the MEK1 mutations F53S and E203K, which are associated with
Cardio-facio-cutaneous syndrome and melanoma, respectively (Bromberg-White et al.,
2012).
Since each of these genetic perturbations results in ligand-independent activation of ERK,
we expected to see a significant reduction of Cic levels in the middle of the embryo, where
the Ras pathway is normally inactive. Accordingly, we found that the maximal amplitude of
Cic at nuclear cycle 14 for mutants was significantly lower than that in the wild-type (Fig. 4).
Furthermore, recent studies in zebrafish suggest that the intrinsic strength of the F53S
mutation should be less than that of the E203K mutation (Jindal et al., 2017). No difference
in the amplitudes of the tissue-level profiles was detected (Fig. 4D). However, a difference
became clear when we analyzed the recovery rates of the nuclear Cic levels after each
mitosis (Fig. 5A-C, Fig. S4). Specifically, the recovery of nuclear Cic levels was slowed in
embryos expressing the E203K sequence variant of Dsor1 as compared to F53S (Fig. 5D).
Since nuclear import rates of Cic depend on the levels of ERK activation, this metric
suggests that E203K leads to stronger ERK activation than F53S.
Based on the low-dimensional approximation of the Cic pattern, it appeared that the spatial
profile of Ras signaling depends on the nature of the genetic perturbation. Specifically,
embryos expressing the activating variants of MEK1 had a graded Cic profile, as opposed to
the sharper pattern observed in embryos with constitutively active Torso (Fig. 6A-C). We
Dis
ease
Mo
dels
& M
echa
nism
s •
DM
M •
Adv
ance
art
icle
quantified this by fitting the anterior 40% of each of the first spatial modes with a Hill function
and compared the position of half-maximal accumulation of Cic, denoted 𝜆 (Fig. 6D).
Although the origins of these differences are unclear at this point, we speculate that they
reflect differences in the spatial localization of the affected components of the signaling
pathway. The Torso protein is confined to the membrane, where the rates of diffusion are
low, while Dsor1 is in the cytoplasm, where proteins have higher mobility. Taken together,
our approach can be used to compare differential strengths of multiple genetic perturbations
of Ras signaling.
Discussion
The highly conserved nature of the Ras pathway suggests that functional studies of
mutations from human diseases can be carried out in Drosophila, capitalizing on the
reproducible nature of several well-characterized Ras-dependent developmental signaling
transients. In our recent work, we have demonstrated that the terminal patterning system in
the Drosophila embryo provides a sensitive readout for the differential effects of activating
mutations in MEK, the enzyme that directly activates ERK (Goyal et al., 2017). These assays
were based on the spatial patterns of dually phosphorylated ERK in fixed embryos and
required estimation of the ages of different embryos, which is essential for quantitative
comparison of time-varying signals. Thus, each embryo provides only a single snapshot of a
complex signaling transient, which must be reconstructed in an elaborate way, relying on
independently-measured morphological features, such as the nuclear division cycles and the
extent of cellularization. These requirements present a significant experimental burden, do
not capture information on embryo-to-embryo variability, and do not allow comparison of
embryos of the same age. In contrast, the method of parallel imaging of Cic dynamics in live
embryos presented here opens the way for systematic comparison of mutations within or
across components of the Ras pathway, by directly addressing the above challenges.
Our data analysis approach relies on approximating the spatiotemporal pattern of Cic as a
product of one dominant spatial mode and one time-dependent amplitude, using data from
many embryos that do not have to have exact age-synchronization. Thus, complex signaling
transients in different mutants could be compared based on the differences of these
functions of space and time alone. We demonstrated that statistical analysis of these
functions can be used detect the quantitative differences between the effects of mutations at
different levels of the pathway. Based on this, we propose that our live-imaging framework
can be used to evaluate the functional consequences of many sequence variants identified
in human developmental abnormalities and cancers. Indeed, since most of the sequence
Dis
ease
Mo
dels
& M
echa
nism
s •
DM
M •
Adv
ance
art
icle
variants associated with human diseases occur in conserved positions of the signaling
proteins, their effects can be readily assessed in model organisms, such as Drosophila.
One of the first questions associated with evaluating the newly discovered sequence
variants is whether they cause ligand-independent pathway activation. The early Drosophila
embryo provides an ideal system for answering this question for the Ras pathway
components. Besides confirming via reduced Cic amplitude in mutant backgrounds that they
are indeed intrinsically active, our tissue-level and single-cell assays can differentiate
between their strengths and properties. Going forward, we note that while our results are
based on experiments in which the disease-related mutations were overexpressed, the
same data collection and analysis platform can be applied to embryos in which the candidate
mutations are introduced at the endogenous genomic location. Quantitative analysis of these
genetic perturbations should provide unique insights into systems level properties of the Ras
pathway in vivo.
Materials and methods
Fabrication of the two-layer anterior-posterior array
A previously developed method of rapid prototyping was employed in this study to fabricate
PDMS microfluidic devices. This method involved a combination of master mold
microfabrication, and PDMS replica molding described below.
Master mold fabrication and PDMS replica molding
Master mold fabrication involved a two-layer, photolithographic procedure to pattern two
distinct layers with two different photomasks. Two photomasks were designed in AutoCAD
(AutoDesk), and printed onto high resolution transparencies (CAD Art Services) in order to
be used during pattern transfer. Each photomask layer was designed to be 100 µm tall for a
total device height of 200 µm. To achieve the desired layer heights, we employed the thick
photoresist SU-8 2100 (MicroChem Corp.), and used a specifically tuned lithographic
process. Silicon wafers were dehydrated by baking at 150oC for 30 min. The wafer was
allowed to cool to room temperature after each bake step before proceeding to the next step.
A 100 µm thick layer of SU-8 2100 photoresist was deposited by a two-step spinning
protocol with the following parameters: step 1) 100 rpm s-1 acceleration, 500 rpm spin speed,
and 10 s spin duration, and step 2) 300 rpm s-1 acceleration, 3000 rpm spin speed, and 30 s
spin duration. The resist film was dried by baking at 65oC for 5 min and 95oC for 20 min.
The photoresist was patterned with the first layer photomask by exposing the film to 365 nm
Dis
ease
Mo
dels
& M
echa
nism
s •
DM
M •
Adv
ance
art
icle
wavelength light with an exposure energy of 240 mJ cm-2. Resist crosslinking was expedited
by baking at 65oC for 5 min and 95oC for 10 min. The previous steps, beginning at
photoresist deposition, were repeated in order to deposit the second layer of photoresist and
pattern with the second layer photomask. The uncross-linked resist was removed by soaking
it in an agitated bath of SU-8 developer (propylene glycol methyl ether acetate, Sigma
Aldrich). The mold was then rinsed with isopropyl alcohol, and allowed to air dry. Finally, the
mold was exposed to silane vapor ((tridecafluoro-1,1,2,2-tetrahydrooctyl)-1-trichlorosilane;
United Chemical Technologies) to facilitate casting ejection during subsequent replica mold
processing.
PDMS replica mold processing started by pouring and curing two distinct layers of PDMS
pre-polymer onto the master mold that was constructed in the previous paragraph. The first
layer of PDMS (Dow Corning) was mixed with a 15:1 monomer:cross-linker ratio, and poured
to ~1 mm thick onto the master mold surface. The first PDMS layer was partially cured for 30
min at 75 oC. A second layer of PDMS was mixed with a 7.5:1 monomer:cross-linker ratio,
poured to ~5 mm thick onto the partially cured first layer of PDMS, and placed back in the
oven at 75oC and allowed to cure for an additional 2 h. The softer base layer allowed the
array features to be more flexible, while the harder top layer makes the overall mold more
rigid for easy plasma bonding in the next steps. PDMS replica molds were ejected from SU-8
master molds, diced, and pierced with 19 g blunt tip needles to create fluidic access ports.
Finally, PDMS molds were treated with oxygen plasma and allowed to contact glass
coverslips to form fully enclosed microfluidic devices.
Embryo preparation for loading into the microfluidic array
Adult flies were placed on a fresh apple juice agar plate and allowed to deposit eggs for 1 h
and 15 min. Embryos were subsequently dechorionated by bathing embryos in a gently
agitated bleach solution of 2.5% sodium hypochlorite for 1.5 min. Eggs were rinsed with 10
mL of deionized water and suspended in 1 mL of 0.15% Triton X-100 surfactant in
phosphate buffered saline (PBST) in an Eppendorf tube. Embryos were rinsed three times
with filtered PBST solution to remove unwanted particulates from the egg suspension
including, partially dissolved chorion membranes. This step is especially important for
microfluidic arraying, because these particulates can also be trapped by the array and
introduce optical aberrations during imaging.
Three-dimensional finite element modeling of the trapping array
Finite element modeling was performed via COMSOL Multiphysics® 4.3b Modeling Software
(COMSOL, Inc.). For simplification, a single trapping unit was modeled consisting of an
embryo trap, resistance channel, and one turn of the main serpentine channel. The three-
Dis
ease
Mo
dels
& M
echa
nism
s •
DM
M •
Adv
ance
art
icle
dimensional (3D) steady-state incompressible Navier-Stokes equations were solved to
visualize flow through the traps. For boundary conditions, the inlet superficial velocity that
was experimentally estimated to be ~0.1 m/s, an assumed outlet condition of atmospheric
pressure, and no slip along channel surfaces.
Stocks and fly husbandry
Capicua-Venus homozygous (CicV/CicV) stocks used in (1) were crossed with OregonR to
generate heterozygous (CicV/+) embryos for analysis. Males from TorD4021/CyO were
crossed with females from CicV/CicV to generate TorD4021/CicV for analysis of maternal
effects. UAS-MEKF53S/CyO; CicV/Tm3, sb and UAS-MEKE203K/CyO; CicV/Tm3, sb were
made by crossing UAS-MEKF53S/CyO; Dr/Tm3,Sb and sp/CyO; CicV/CicV. P(matα-GAL-
VP16)mat67; P(matα-GAL-VP16)mat15 (Hunter and Wieschaus, 2000) was used to drive
expression of UAS constructs in the early embryo.
Arraying of embryos for time-lapse microscopy
The device was primed for embryo loading by filling the microchannels with a loading
solution of PBST. Air bubbles were removed by closing the device outlet and simultaneously
applying ~10 psi pressure to the device inlet for ~5 min or until all air bubbles were removed.
Embryos were gently delivered through the microfluidic array inlet by applying slight positive
pressure to the embryo and PBST suspension. Device loading continued until all or most of
the traps were occupied by a single embryo. The fluidic connections at the device inlet and
outlet were removed and the arrayed embryos were then imaged.
Time-lapse confocal imaging was done using Zeiss LSM 710 confocal microscope. A Zeiss
Plan-Apochromat 20x/0.8 M27 air objective was used for all experiments. A 514 nm argon
laser was used to excite CicV fluorescence while 514 nm transmission was used for
capturing transmitted light images simultaneously. Embryos were imaged in the AP plane at
the embryo midsection with a frequency of 30 s-1 for 3 h. The temperature was set to 25oC
and maintained via an environmental chamber during imaging.
Image processing analysis
Tissue-level analysis: Pre-processing steps were taken to prepare the raw imaging data for
subsequent custom-designed automated analysis. This includes processing raw data in
ImageJ and importing in MATLAB for further analysis. Single-cell analysis: Similar to the
tissue-level analysis, we used a combination of ImageJ and MATLAB based approaches to
extract nuclear traces of Cic during nuclear cycle 14. Codes for our custom-made image
processing pipeline are available on request.
Dis
ease
Mo
dels
& M
echa
nism
s •
DM
M •
Adv
ance
art
icle
Singular Value Decomposition of Cic dynamics
We applied the singular value decomposition (SVD) to individual movies of Cic dynamics in
early embryos, decomposing them into spatial and temporal components (Mardia et al.,
1979). All analyses were performed using the Cic signal on the dorsal side of each embryo
cross-section. We measured the accuracy of the rank-one approximations by calculating the
ratio
‖𝑋‖22
‖𝑋‖𝐹2 =
𝜎12
∑ 𝜎𝑖2
𝑖,
where 𝑋 is the matrix containing the movie of dorsal Cic dynamics, ‖𝑋‖2 and ‖𝑋‖𝐹 are the
induced matrix 2-norm and the Frobenius norm of 𝑋, and 𝜎𝑖 are the ordered singular values
of 𝑋 (i.e. 𝜎1 > 𝜎2 > ⋯ > 𝜎𝑛, where 𝑛 is the number of time points in the movie). This ratio
equals one when the rank of 𝑋 is one and is less than one otherwise. The average values of
these ratios for wild type, TorD4021, MEKF53S, and MEKE203K were as follows: 0.972±0.003,
0.977±0.002, 0.959±0.009, and 0.968±0.004 (errors are one standard deviation). Each
movie was projected onto its respective first spatial mode to produce time-varying
amplitudes. We aligned the time courses across embryos by shifting each time axis such
that the dip in signal at the 13th nuclear division occurred at the same time in all embryos.
With the amplitudes aligned in time, we could proceed with calculating point-wise means and
standard deviations of the amplitude across embryos.
Additional experimental procedures are in the Supplementary Experimental Methods.
They include a description of device fabrication and embryo preparation for loading.
Dis
ease
Mo
dels
& M
echa
nism
s •
DM
M •
Adv
ance
art
icle
Acknowledgements and funding
We thank members of the Shvartsman and Lu labs for helpful discussions during this
project. We thank Kei Yamaya for help with fly husbandry. Y.G., H.H.M., and S.Y.S. were
supported by the National Institutes of Health Grant R01 GM107103. T.J.L. was partially
supported by the National Institutes of Health (NIH) Fellowship F31 AA023160. S.Y.S. and
H.L. were partially supported by the National Science Foundation (NSF) Science and
Technology Center Emergent Behavior of Integrated Cellular Systems (EBICS) grant no.
CBET-0939511. S.H. was supported by NSF Grant DMS-1501767. H.L. was supported by
NIH R01 NS096581 and R01 GM088333.
Data availability
Fly strains will be made available upon request.
Author contributions
Y.G., T.J.L., S.Y.S., and H.L. conceived and designed the project; Y.G. and T.J.L. performed
experiments; H.H.M. performed statistical analysis of the data with inputs from S.H.; Y.G.,
T.J.L., S.Y.S., and H.L. wrote the manuscript with inputs from all authors.
Competing interests
No competing interests declared.
D
isea
se M
ode
ls &
Mec
hani
sms
• D
MM
• A
dvan
ce a
rtic
le
References
Bromberg-White, J. L., Andersen, N. J. and Duesbery, N. S. (2012). MEK genomics in
development and disease. Brief. Funct. Genomics 11, 300–10.
Brunner, D., Oellers, N., Szabad, J., Biggs, W. H., Zipursky, S. L. and Hafen, E. (1994). A gain-of-
function mutation in Drosophila MAP kinase activates multiple receptor tyrosine kinase signaling
pathways. Cell 76, 875–888.
Casanova, J. and Struhl, G. (1989). Localized surface activity of torso, a receptor tyrosine kinase,
specifies terminal body pattern in Drosophila. Genes Dev. 3, 2025–38.
Chung, K., Kim, Y., Kanodia, J. S., Gong, E., Shvartsman, S. Y. and Lu, H. (2011). A microfluidic
array for large-scale ordering and orientation of embryos. Nat. Methods 8, 171–176.
Freeman, M. (1996). Reiterative Use of the EGF Receptor Triggers Differentiation of All Cell Types in
the Drosophila Eye. Cell 87, 651–660.
Furriols, M. and Casanova, J. (2003). In and out of Torso RTK signalling. EMBO J. 22, 1947–52.
Futran, A. S., Link, A. J., Seger, R. and Shvartsman, S. Y. (2013). ERK as a model for systems
biology of enzyme kinetics in cells. Curr. Biol. 23, R972-9.
Gabay, L., Seger, R. and Shilo, B. Z. (1997). MAP kinase in situ activation atlas during Drosophila
embryogenesis. Development 124, 3535–41.
Goyal, Y., Jindal, G. A., Pelliccia, J. L., Yamaya, K., Yeung, E., Futran, A. S., Burdine, R. D.,
Schüpbach, T. and Shvartsman, S. Y. (2017). Divergent effects of intrinsically active MEK
variants on developmental Ras signaling. Nat. Genet.
Grimm, O., Sanchez Zini, V., Kim, Y., Casanova, J., Shvartsman, S. Y. and Wieschaus, E. (2012).
Torso RTK controls Capicua degradation by changing its subcellular localization. Development
139, 3962–8.
Haigo, S. L. and Bilder, D. (2011). Global Tissue Revolutions in a Morphogenetic Movement
Controlling Elongation. Science (80-. ). 331,.
Han, M. and Sternberg, P. W. (1990). let-60, a gene that specifies cell fates during C. elegans vulval
induction, encodes a ras protein. Cell 63, 921–931.
Han, M., Golden, A., Han, Y. and Sternberg, P. W. (1993). C. elegans lin-45 raf gene participates in
let-60 ras-stimulated vulval differentiation. Nature 363, 133–140.
Hanahan, D. and Weinberg, R. A. (2011). Hallmarks of cancer: the next generation. Cell 144, 646–
74.
Hunter, C. and Wieschaus, E. (2000). Regulated expression of nullo is required for the formation of
distinct apical and basal adherens junctions in the Drosophila blastoderm. J. Cell Biol. 150, 391–
Dis
ease
Mo
dels
& M
echa
nism
s •
DM
M •
Adv
ance
art
icle
401.
Jiménez, G., Guichet, A., Ephrussi, A. and Casanova, J. (2000). Relief of gene repression by torso
RTK signaling: role of capicua in Drosophila terminal and dorsoventral patterning. Genes Dev.
14, 224–31.
Jindal, G. A., Goyal, Y., Burdine, R. D., Rauen, K. A. and Shvartsman, S. Y. (2015). RASopathies:
unraveling mechanisms with animal models. Dis. Model. Mech. 8, 769–82.
Jindal, G. A., Goyal, Y., Yamaya, K., Futran, A. S., Kountouridis, I., Balgobin, C. A., Schüpbach,
T., Burdine, R. D. and Shvartsman, S. Y. (2017). In vivo severity ranking of Ras pathway
mutations associated with developmental disorders. Proc. Natl. Acad. Sci. U. S. A. 114, 510–
515.
Johnson, H. E., Goyal, Y., Pannucci, N. L., Schüpbach, T., Shvartsman, S. Y. and Toettcher, J.
E. (2017). The Spatiotemporal Limits of Developmental Erk Signaling.
Klingler, M., Erdélyi, M., Szabad, J. and Nüsslein-Volhard, C. (1988). Function of torso in
determining the terminal anlagen of the Drosophila embryo. Nature 335, 275–277.
Kornfeld, K., Hom, D. B. and Horvitz, H. R. (1995). The ksr-1 gene encodes a novel protein kinase
involved in Ras-mediated signaling in C. elegans. Cell 83, 903–913.
Lee, C.-J., Chan, W.-I., Cheung, M., Cheng, Y.-C., Appleby, V. J., Orme, A. T. and Scotting, P. J.
(2002). CIC, a member of a novel subfamily of the HMG-box superfamily, is transiently
expressed in developing granule neurons.
Levario, T. J., Zhan, M., Lim, B., Shvartsman, S. Y. and Lu, H. (2013). Microfluidic trap array for
massively parallel imaging of Drosophila embryos. Nat. Protoc. 8, 721–736.
Levario, T. J., Zhao, C., Rouse, T., Shvartsman, S. Y., Lu, H., McMahon, A., Supatto, W., Fraser,
S. E., Stathopoulos, A., Wang, Y. C., et al. (2016a). An integrated platform for large-scale data
collection and precise perturbation of live Drosophila embryos. Sci. Rep. 6, 21366.
Levario, T. J., Lim, B., Shvartsman, S. Y. and Lu, H. (2016b). Microfluidics for High-Throughput
Quantitative Studies of Early Development. Annu. Rev. Biomed. Eng. 18, 285–309.
Liao, S., Davoli, T., Leng, Y., Li, M. Z., Xu, Q. and Elledge, S. J. (2017). A genetic interaction
analysis identifies cancer drivers that modify EGFR dependency. Genes Dev. 31, 184–196.
Lim, B., Samper, N., Lu, H., Rushlow, C., Jiménez, G. and Shvartsman, S. Y. (2013). Kinetics of
gene derepression by ERK signaling. Proc. Natl. Acad. Sci. U. S. A. 110, 10330–5.
Mardia, K. V., Kent, J. T. and Bibby, J. M. (1979). Multivariate analysis. Academic Press.
O’Neill, E. M., Rebay, I., Tjian, R. and Rubin, G. M. (1994). The activities of two Ets-related
transcription factors required for drosophila eye development are modulated by the Ras/MAPK
pathway. Cell 78, 137–147.
Dis
ease
Mo
dels
& M
echa
nism
s •
DM
M •
Adv
ance
art
icle

Okimoto, R. A., Breitenbuecher, F., Olivas, V. R., Wu, W., Gini, B., Hofree, M., Asthana, S.,
Hrustanovic, G., Flanagan, J., Tulpule, A., et al. (2016). Inactivation of Capicua drives cancer
metastasis. Nat. Genet. 49, 87–96.
Rauen, K. A. (2013). The RASopathies. Annu. Rev. Genomics Hum. Genet. 14, 355–69.
Schupbach, T. and Wieschaus, E. (1986). Germline autonomy of maternal-effect mutations altering
the embryonic body pattern of Drosophila. Dev. Biol. 113, 443–448.
Solon, J., Kaya-Çopur, A., Colombelli, J. and Brunner, D. (2009). Pulsed Forces Timed by a
Ratchet-like Mechanism Drive Directed Tissue Movement during Dorsal Closure. Cell 137,
1331–1342.
Sternberg, P. W. and Han, M. (1998). Genetics of RAS signaling in C. elegans. Trends Genet. 14,
466–472.
Dis
ease
Mo
dels
& M
echa
nism
s •
DM
M •
Adv
ance
art
icle
Figures
Figure 1. Microfluidic array for parallel imaging of live embryos. (A) Torso/ERK
signaling antagonizes Cic-dependent gene repression. (B) Schematic of the microfluidic
array with close-up views of a single-trapping unit in both layers. (C) Illustrations depicting a
single embryo (red) within a trapping unit; dorsal-ventral (DV) and anterior-posterior (AP)
cross-sections, and three-dimensional (3D) representations depicted. (D) Superficial fluid
velocity at the mid-plane of the trapping unit predicted by the finite element model. (E)
Representative image of a loaded microfluidic device: black triangles indicate embryos
trapped within the array.
D
isea
se M
ode
ls &
Mec
hani
sms
• D
MM
• A
dvan
ce a
rtic
le
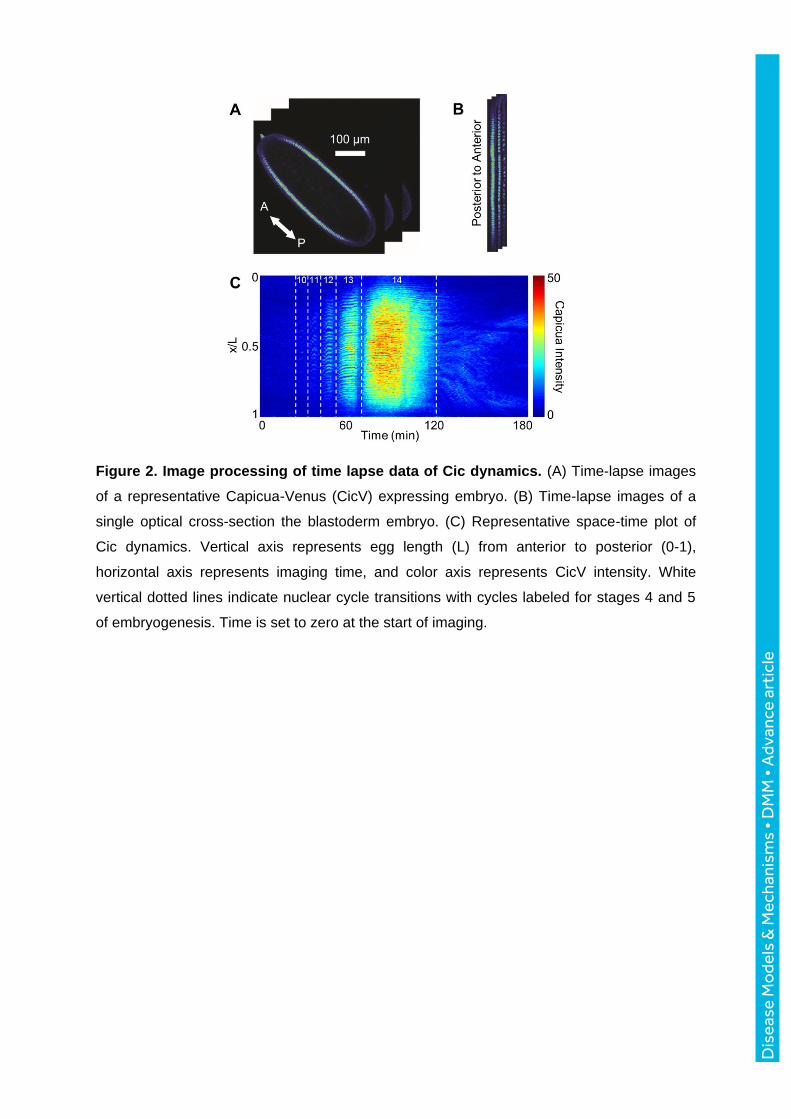
Figure 2. Image processing of time lapse data of Cic dynamics. (A) Time-lapse images
of a representative Capicua-Venus (CicV) expressing embryo. (B) Time-lapse images of a
single optical cross-section the blastoderm embryo. (C) Representative space-time plot of
Cic dynamics. Vertical axis represents egg length (L) from anterior to posterior (0-1),
horizontal axis represents imaging time, and color axis represents CicV intensity. White
vertical dotted lines indicate nuclear cycle transitions with cycles labeled for stages 4 and 5
of embryogenesis. Time is set to zero at the start of imaging.
Dis
ease
Mo
dels
& M
echa
nism
s •
DM
M •
Adv
ance
art
icle
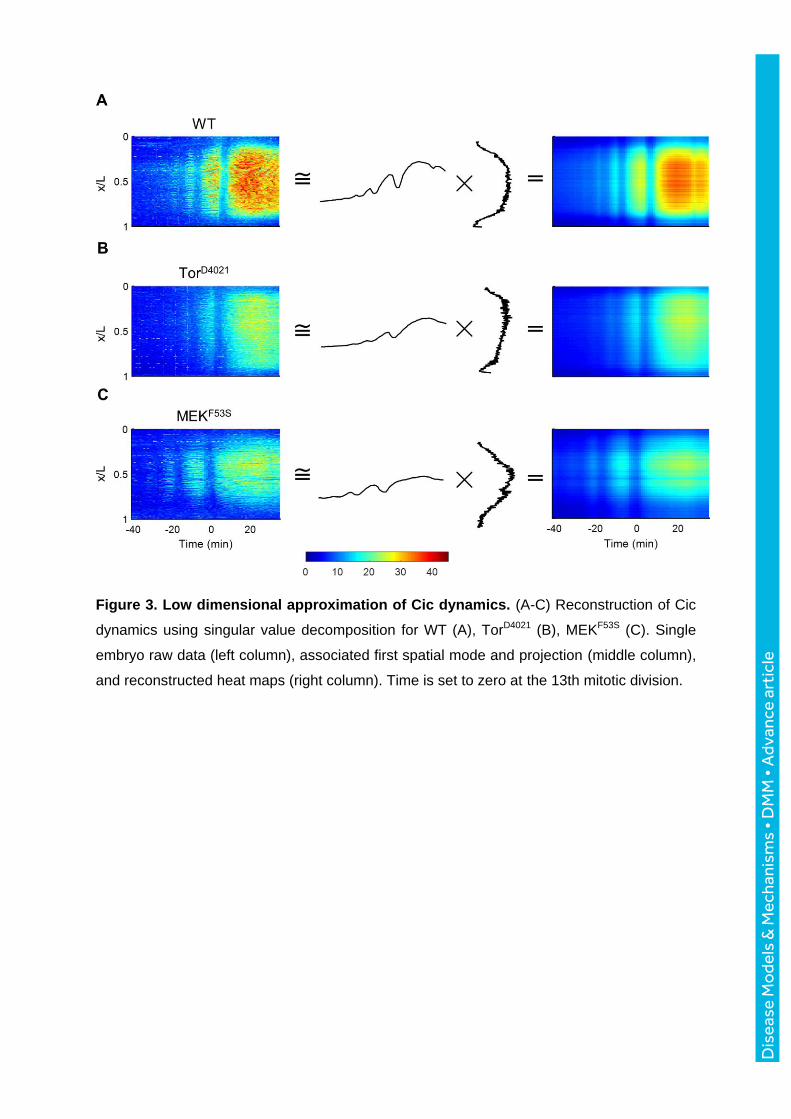
Figure 3. Low dimensional approximation of Cic dynamics. (A-C) Reconstruction of Cic
dynamics using singular value decomposition for WT (A), TorD4021 (B), MEKF53S (C). Single
embryo raw data (left column), associated first spatial mode and projection (middle column),
and reconstructed heat maps (right column). Time is set to zero at the 13th mitotic division.
Dis
ease
Mo
dels
& M
echa
nism
s •
DM
M •
Adv
ance
art
icle
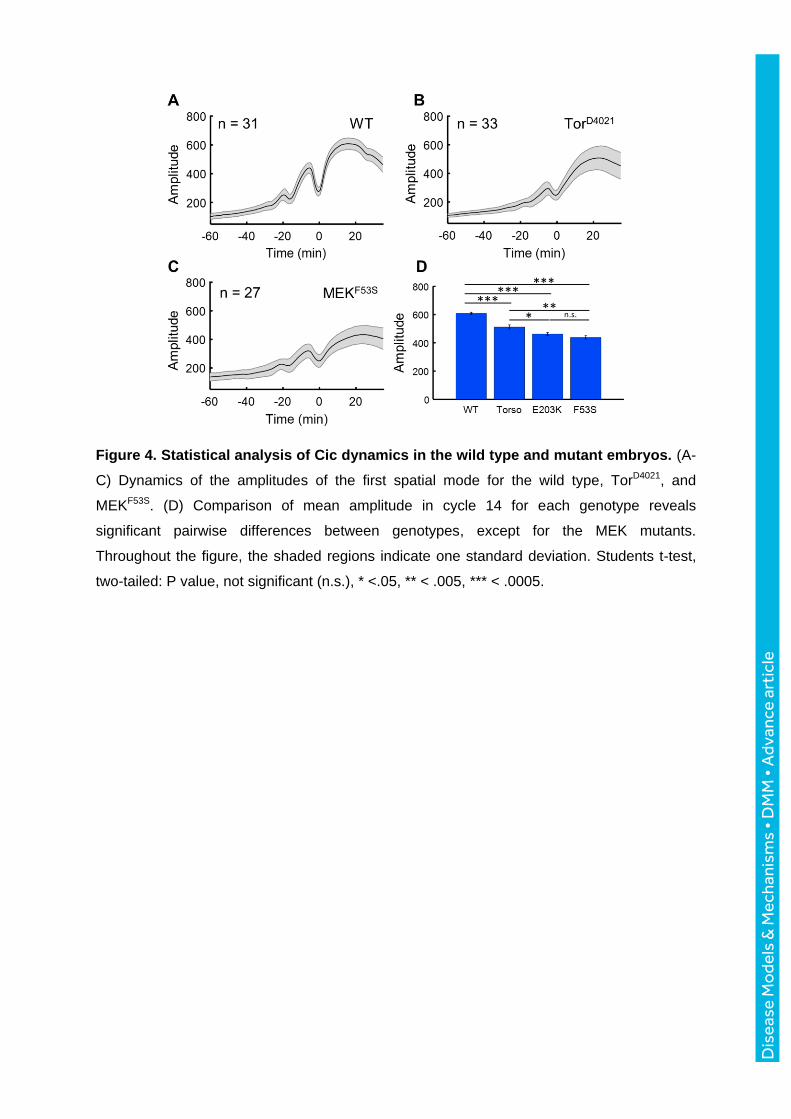
Figure 4. Statistical analysis of Cic dynamics in the wild type and mutant embryos. (A-
C) Dynamics of the amplitudes of the first spatial mode for the wild type, TorD4021, and
MEKF53S. (D) Comparison of mean amplitude in cycle 14 for each genotype reveals
significant pairwise differences between genotypes, except for the MEK mutants.
Throughout the figure, the shaded regions indicate one standard deviation. Students t-test,
two-tailed: P value, not significant (n.s.), * <.05, ** < .005, *** < .0005.
Dis
ease
Mo
dels
& M
echa
nism
s •
DM
M •
Adv
ance
art
icle
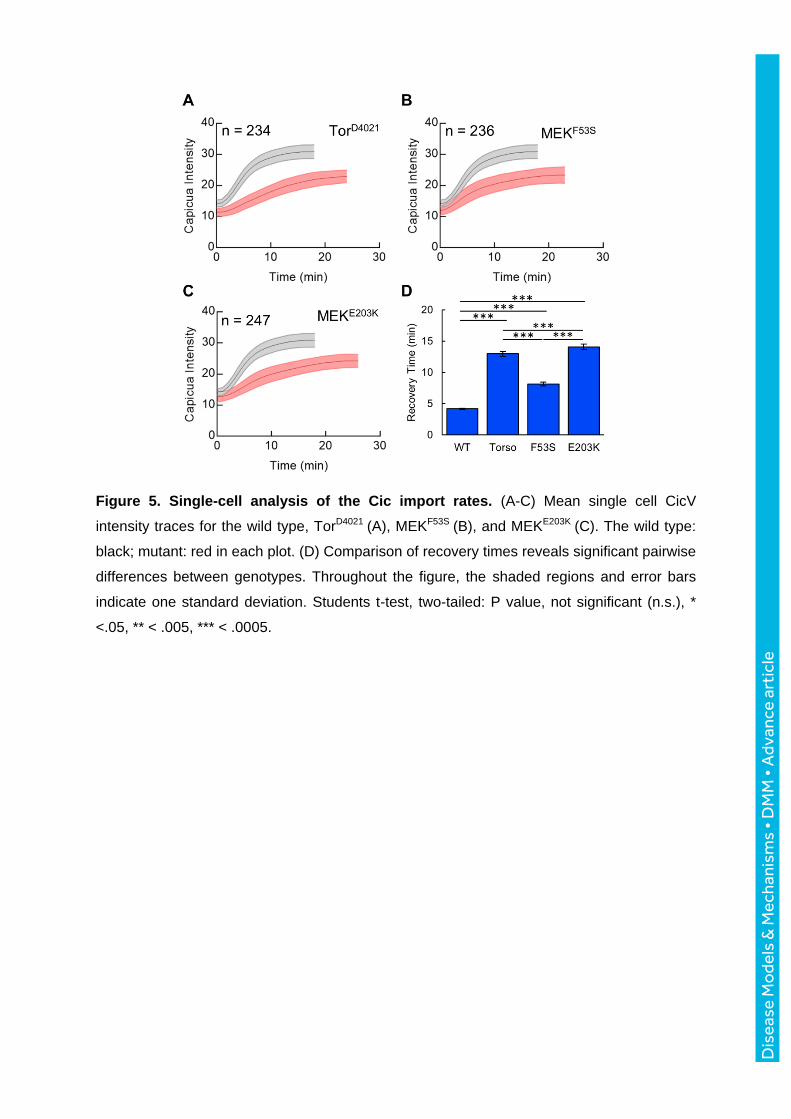
Figure 5. Single-cell analysis of the Cic import rates. (A-C) Mean single cell CicV
intensity traces for the wild type, TorD4021 (A), MEKF53S (B), and MEKE203K (C). The wild type:
black; mutant: red in each plot. (D) Comparison of recovery times reveals significant pairwise
differences between genotypes. Throughout the figure, the shaded regions and error bars
indicate one standard deviation. Students t-test, two-tailed: P value, not significant (n.s.), *
<.05, ** < .005, *** < .0005.
Dis
ease
Mo
dels
& M
echa
nism
s •
DM
M •
Adv
ance
art
icle
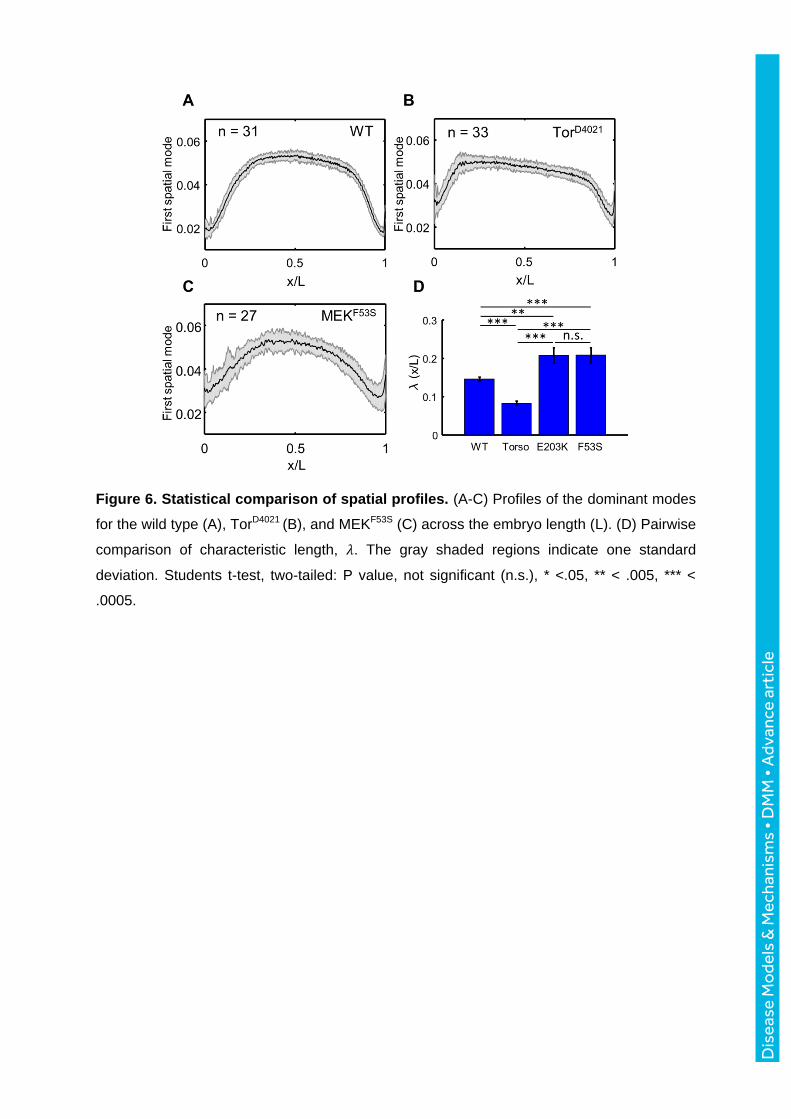
Figure 6. Statistical comparison of spatial profiles. (A-C) Profiles of the dominant modes
for the wild type (A), TorD4021 (B), and MEKF53S (C) across the embryo length (L). (D) Pairwise
comparison of characteristic length, 𝜆. The gray shaded regions indicate one standard
deviation. Students t-test, two-tailed: P value, not significant (n.s.), * <.05, ** < .005, *** <
.0005.
Dis
ease
Mo
dels
& M
echa
nism
s •
DM
M •
Adv
ance
art
icle
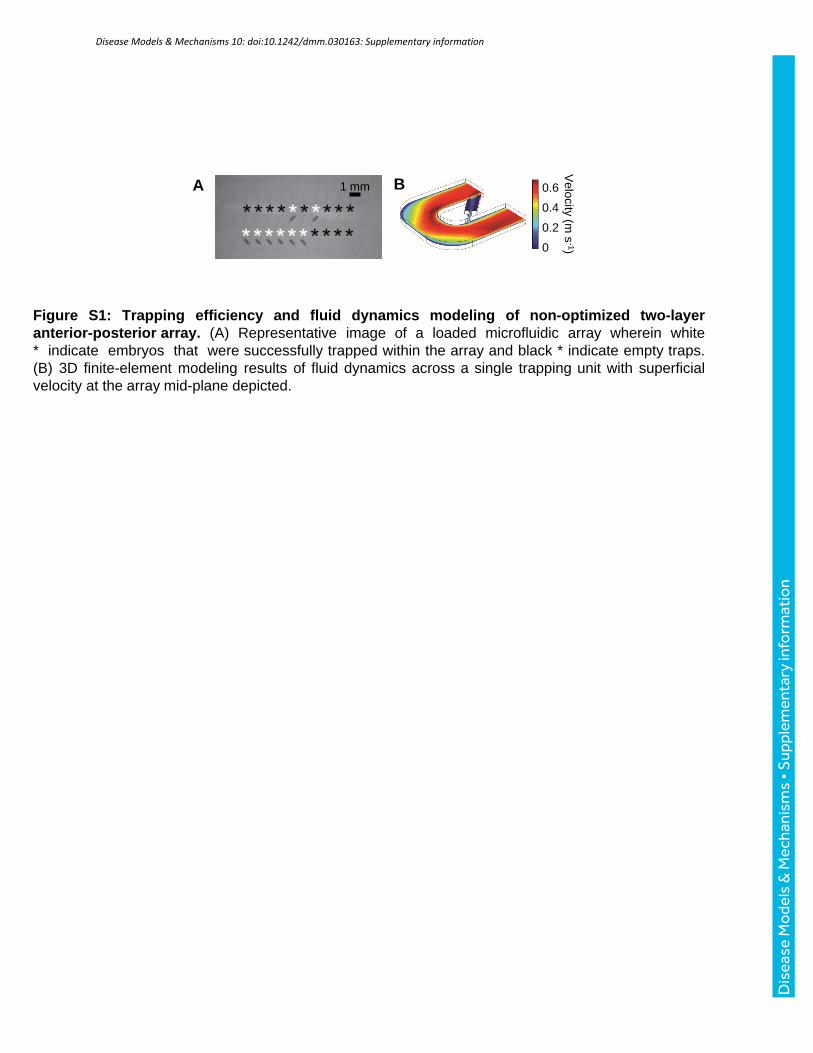
Figure S1: Trapping efficiency and fluid dynamics modeling of non-optimized two-layer anterior-posterior array. (A) Representative image of a loaded microfluidic array wherein white * indicate embryos that were successfully trapped within the array and black * indicate empty traps. (B) 3D finite-element modeling results of fluid dynamics across a single trapping unit with superficial velocity at the array mid-plane depicted.
A B
Ve
locity
(m s
-1)
0.6
0.4
0.2
0
1 mm
Disease Models & Mechanisms 10: doi:10.1242/dmm.030163: Supplementary information
Dis
ease
Mo
dels
& M
echa
nism
s •
Sup
plem
enta
ry in
form
atio
n
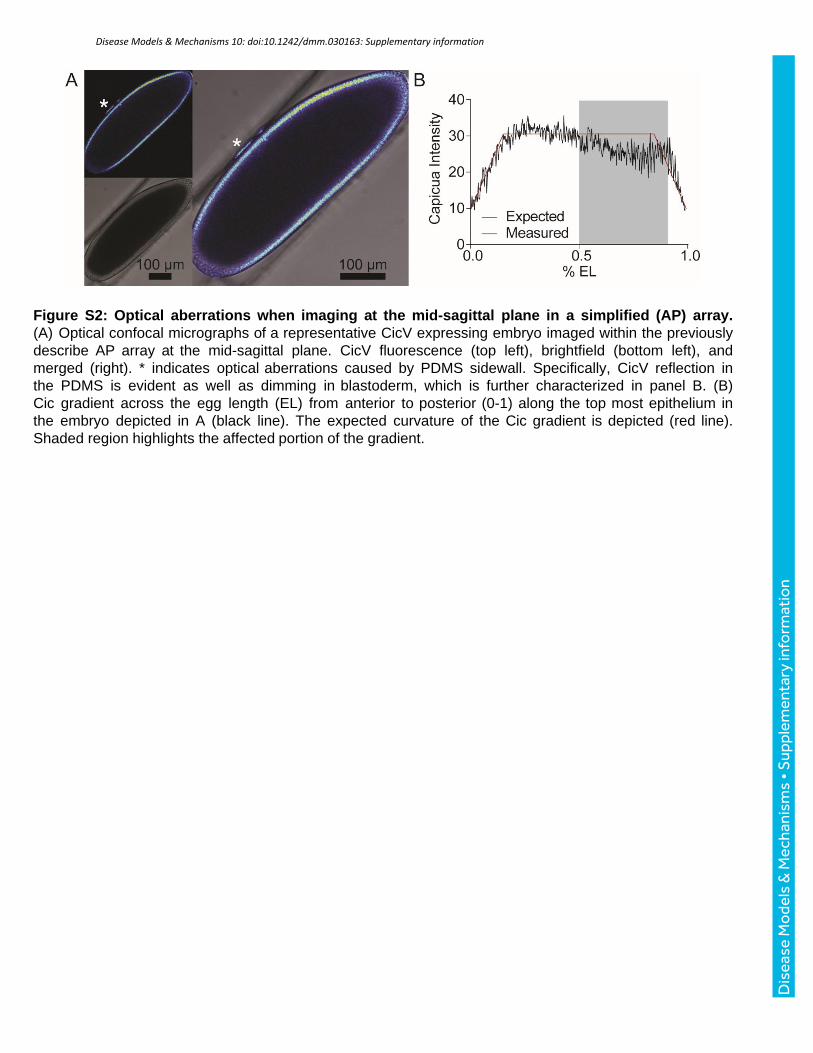
Figure S2: Optical aberrations when imaging at the mid-sagittal plane in a simplified (AP) array. (A) Optical confocal micrographs of a representative CicV expressing embryo imaged within the previously describe AP array at the mid-sagittal plane. CicV fluorescence (top left), brightfield (bottom left), and merged (right). * indicates optical aberrations caused by PDMS sidewall. Specifically, CicV reflection in the PDMS is evident as well as dimming in blastoderm, which is further characterized in panel B. (B) Cic gradient across the egg length (EL) from anterior to posterior (0-1) along the top most epithelium in the embryo depicted in A (black line). The expected curvature of the Cic gradient is depicted (red line). Shaded region highlights the affected portion of the gradient.
Disease Models & Mechanisms 10: doi:10.1242/dmm.030163: Supplementary information
Dis
ease
Mo
dels
& M
echa
nism
s •
Sup
plem
enta
ry in
form
atio
n
A G
Crop Segment Filter Skeleton Extend Merge
B C D E F
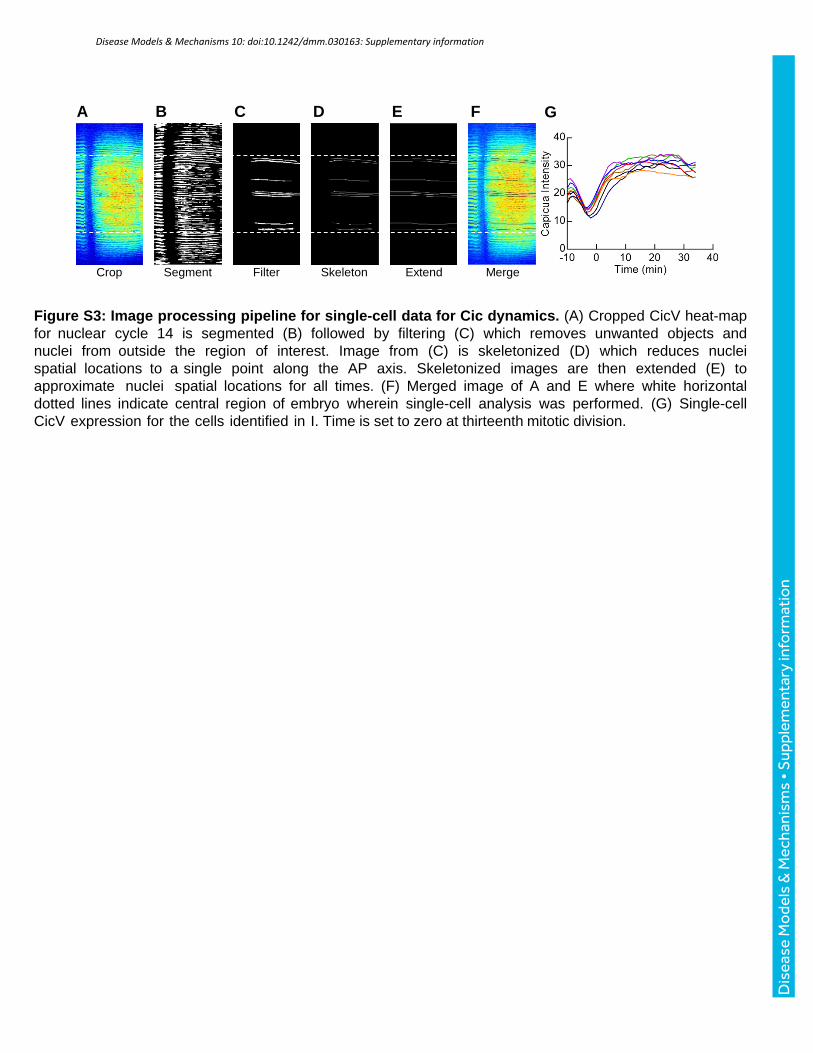
Figure S3: Image processing pipeline for single-cell data for Cic dynamics. (A) Cropped CicV heat-map for nuclear cycle 14 is segmented (B) followed by filtering (C) which removes unwanted objects and nuclei from outside the region of interest. Image from (C) is skeletonized (D) which reduces nuclei spatial locations to a single point along the AP axis. Skeletonized images are then extended (E) to approximate nuclei spatial locations for all times. (F) Merged image of A and E where white horizontal dotted lines indicate central region of embryo wherein single-cell analysis was performed. (G) Single-cell CicV expression for the cells identified in I. Time is set to zero at thirteenth mitotic division.
Disease Models & Mechanisms 10: doi:10.1242/dmm.030163: Supplementary information
Dis
ease
Mo
dels
& M
echa
nism
s •
Sup
plem
enta
ry in
form
atio
n
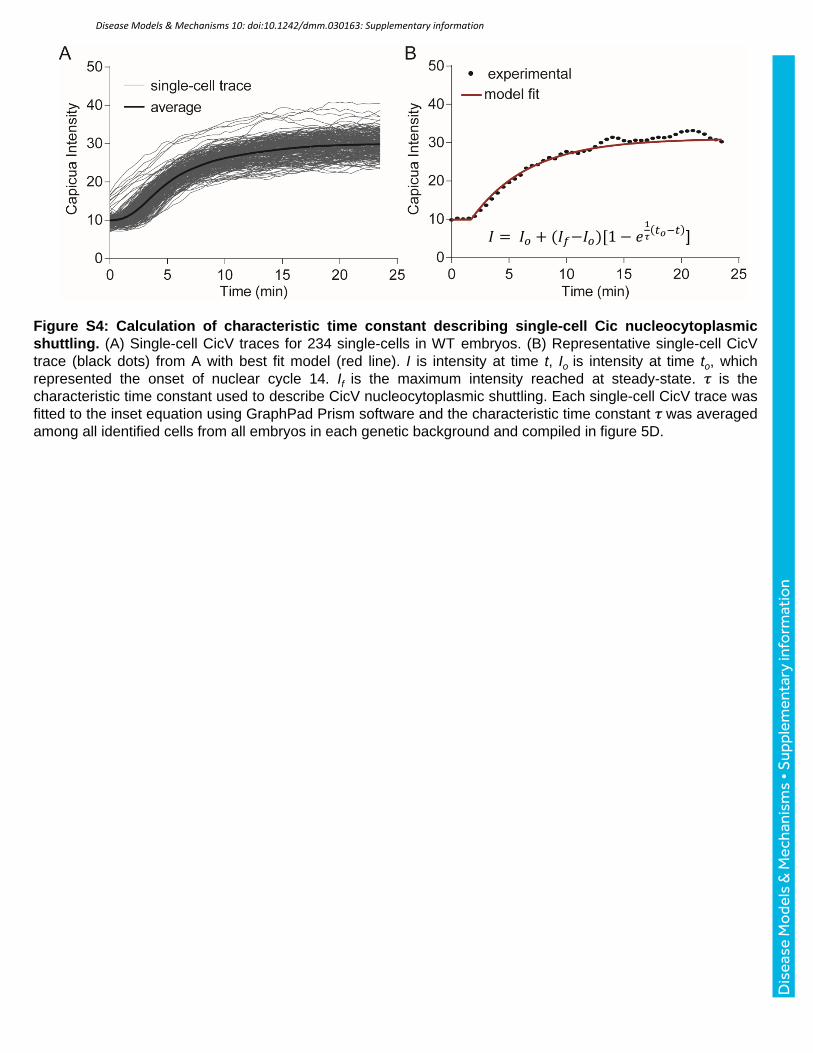
Figure S4: Calculation of characteristic time constant describing single-cell Cic nucleocytoplasmic shuttling. (A) Single-cell CicV traces for 234 single-cells in WT embryos. (B) Representative single-cell CicV trace (black dots) from A with best fit model (red line). I is intensity at time t, Io is intensity at time to, which represented the onset of nuclear cycle 14. If is the maximum intensity reached at steady-state. 𝜏 is the characteristic time constant used to describe CicV nucleocytoplasmic shuttling. Each single-cell CicV trace was fitted to the inset equation using GraphPad Prism software and the characteristic time constant 𝜏 was averaged among all identified cells from all embryos in each genetic background and compiled in figure 5D.
𝐼 = 𝐼𝑜 + (𝐼𝑓−𝐼𝑜)[1 − 𝑒1
𝜏𝑡𝑜−𝑡 ]
Disease Models & Mechanisms 10: doi:10.1242/dmm.030163: Supplementary information
Dis
ease
Mo
dels
& M
echa
nism
s •
Sup
plem
enta
ry in
form
atio
n