Embed Size (px)
Citation preview

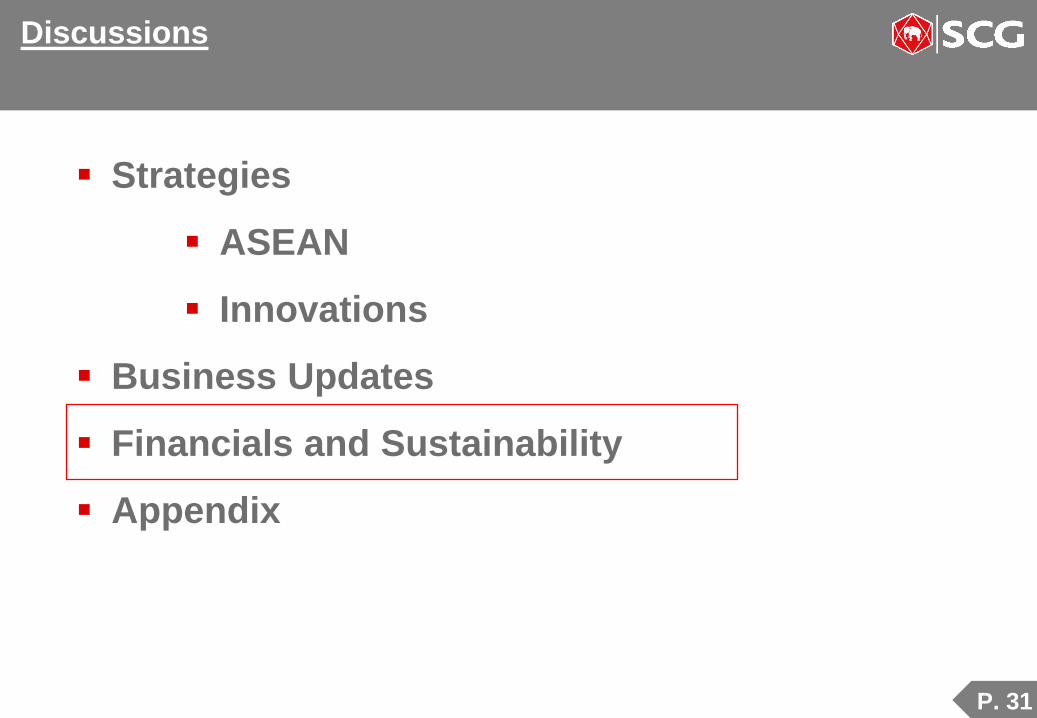
Discussions:1. Strategies
2. Business Updates
3. Financials and Sustainability
4. Appendix
Asian Investment Conference
Hong KongMarch 19 - 20, 2018

P. 2
Strategies
ASEAN
Innovations
Business Updates
Financials and Sustainability
Appendix
Discussions

P. 3
SCG Presence Across ASEAN
Major Operations
Minor Operations

P. 4
FY2017 Assets573,412 MB
THAILAND75%
INDONESIA9%
VIETNAM8%
CAMBODIA2%
MYANMAR2%
LAOS2%
PHILIPPINES1%
Others1%
FY2017 Sales450,921 MB
FY2017 Segmented Assets and Sales
Cement-
Building Materials
36%
Packaging
18%
Chemicals
46%

P. 5
LSP site
$5.4 billion total project cost.
1st chemicals complex in Vietnam.
Vietnam’s total consumption of PE/PP
needs approx. two large complexes.
LSP is competitive with…
Economies of scale
Flexible feedstocks
Downstream integration
Vietnamese government support
70% capacity growth in PE / PP for SCG.
Upon start-up:
Vietnam: Long Son Petrochemicals (LSP) project

P. 6
Vietnam: Cement acquisition
SCG’s plants
15,400 MB ($440 mill) investment for 3.1MT
of integrated cement, at $140/ton (EV based
and includes upgrades budget).
River access for operational competitiveness.
(2017) Capacity Demand
North 72 MT 23 MT
Central 17 MT 13 MT
South 9 MT 22 MT

P. 7
Cement – Building Materials:
Ceramic tiles (Prime Group)
Packaging:
Box Plant
Cement – Building Materials:
Cement Plant
Ceramic tiles (Prime Group)
Presence in Vietnam:
Assets of 48,693 MB ($1.5 Bill), and +8,300 staffs
Cement – Building Materials:
White Cement (Buu Long)
RMC (Ready-mixed concrete) Concrete Products
Chemicals:
Long Son Petrochemicals
PVC (TPC Vina)
PVC pipe & fiting (Binh Minh)
Packaging:
Packaging paper (VKPC)
Box plants
Flexible packaging plant

P. 8
Cement – Building Materials:
Cement plant
RMC (Ready-mixed concrete)
Ceramic tiles (KIA)
Lightweight concrete block
Chemicals:
Chandra Asri (30% stake)
Packaging:
Box Plants
Chemicals:
TPC Indo (PVC)
Nationwide Total
RMC (Ready-mixed concrete) 52 plants
Distribution: Kokoh 19 DC
Presence in Indonesia:
Assets of 49,420 MB MB ($1.5 Bill), and +6,600 staffs

P. 9
Key efforts during the past 5 years…
Chemicals Indonesia: Chandra Asri (30% stake) operations turn around.
Norway: Norner Group (Technology R&D related) acquisition.
Cement - Building Materials Across ASEAN: 4 greenfield plants constructed.
Indonesia: Jaya Mix (ready mixed concrete) integration.
Vietnam: Cement plant (central Vietnam) acquisition.
Vietnam: Prime Group Ceramics acquisition.
Packaging
Across ASEAN: Box plant acquisitions.
Flexible Packaging: Increased scope towards the end customer.
Thailand and Vietnam: Packaging paper plant expansions.

P. 10
Roadmap to Growth
Chemicals Globally competitive, with ASEAN focus.
Vietnam: LSP Complex ($5.4 billion).
Indonesia: Chandra Asri’s #2 cracker study.
Thailand: Moving up the value chain with HVA.
Cement - Building Materials ASEAN: Defendable positions via the integrated RMC business model.
Indonesia and CLMV: High growth markets, with decreased oversupply, and
enhanced pricing.
Asset light focused: Launched in Thailand are logistics for e-commerce,
installation services, and home living products retails stores.
Packaging Geographical growth in ASEAN through acquisition.
Growth of products and offerings through acquisition.
Applications & Solutions: Food and E-commerce packaging.

P. 11
R&D & Innovation Spending
2018 Beyond
Digital + Innovations
FY2017 HVA % of Sales: 39%
R&D Spending on Sales (%): 0.9%
R&D and Product Design Team: 1,645
(116 PhD)
R&D Spending & Innovation Segments
(FY2017)
40370
720 880 921 1,1111,430
2,068
2,710
3,510
4,350 4,178
0
1,000
2,000
3,000
4,000
5,000
2004 2007 2008 2009 2010 2011 2012 2013 2014 2015 2016 2017
MB

P. 12
Chemicals
Corporate
Global innovation network
Corporate Technology Office
Global R&D Network
• +38 Universities
• +33 Research Inst.• +140 Industry partners
R&D Across the Business Units
Cement-Building Materials
SCG Experience
Joining Global cement &
concrete consortium
Habitat & living solutions
The NEST
Packaging Co-creation with customers E-Commerce Packaging
Food Safety Packaging

P. 13
Discussions
Strategies
ASEAN
Innovations
Business Updates
Financials and Sustainability
Appendix

P. 14
0
100
200
300
400
500
600
700
800
900
1,000
1994 1996 1998 2000 2002 2004 2006 2008 2010 2012 2014 2016 2018 2020 2022
Chemicals: extended peak cycle
$/ton
troughAsian crisis
US crisis
trough
“peak” driven by
tight global utilization
HDPE – Naphtha margin
extended peak
extended peak to 2022
673
767
(YTD)734747

P. 15
Visibility for Chemicals Business Extends to 2022Extended peak
85%
90%
95%
2017 2018 2019 2020 2021 2022
Operating Rates - World Ethylene
0
1
2
3
4
5
6
2017 2018 2019 2020 2021 2022
Supply Growth - World Ethylene…vs 3-4% demand growth
5-6 MT shale cracker starts
80%
85%
90%
95%
2017 2018 2019 2020 2021 2022
World Propylene Operating Rates %
0
1
2
3
4
5
6
2017 2018 2019 2020 2021 2022
World Propylene Supply Growth…vs demand growth avg of 4-5 %%
Supply Growth – World Propylene…vs 4-5% demand growth
Operating Rates – World Propylene
%
%
%
%
%
%
%
%
%
%
Extended peak
2017 to 2022
Extended peak
2017 to 2022

P. 16
Chemicals: HDPE – Naphtha price gap
Note: Prices refer to SEA regional prices

P. 17
Chemicals: SCG’s Existing Core Products
PE
PP
PVC
Commodity HVA
HDPE Pipe:
Thinner but withstand
higher pressure
Flexible Packaging:
High clarity, superior seal,
longer shelf-life
Rigid packaging:
High clarity, high impact
resistance, microwaveable
Electrical Appliances:
Light, high impact &
temperature resistance
Medical Tools:
Hygienic, light weight,
high chemical resistant

P. 18
Chemicals: Collaborations platform
South Africa- Datachem
USA- Massachusetts Institute of
Technology
- Houston Technology Center
North Asia- Beijing University of
Chemicals Technology
- Beijing Forestry University
- Tokyo Institute of
Technology
- Tokyo University
- IP Bridge
Europe- Oxford University
- Durham University
- Imperial Collage London
- Process System Enterprise
- Cambridge Nanosystem
South East Asia- Chulalongkorn University
- Chiang Mai University
- Suranaree Institute
- National Science and Technology
Development Agency
- Petromat
- Synchrotron
- National University of Singapore
- Nanyang Technological University
- A*Star (Institute of Materials Research
and Engineering)

P. 19
Chemicals: 1) SCG-Oxford Centre of Excellence, UK
2) Norner Group, Norway
UK
Norway
Co-develop nano-materials and catalyst products.
“SENFI UK LIMITED” …established by SCG in 2017 to enhance efforts towards applied research and products commercialization.
Best in class R&D provider

P. 20
EasyProcessing
HighStrength
ProductAppearance
Chemicals: Example 1 …to be commercialized HVA
“New” PE… - patented production technology- developed from in-house technical capabilities
Market Trend: Lighter and thinner, with higher strength.
Existing technology
“New” PE technology
Performance Comparison

P. 21
Chemicals: Example 2 …to be commercialized HVA
“CIERRA™” - functional materials that modifies molecular structure
- produced and developed with global lead customers
- various applications, and +100 patents filed
Market Trend: Consumers’ demands for higher performance material
Barrier Film - Packaging barrier against oxygen and moisture & mold.
Flame Retardant - Retardant efficiency, with 5x less material used.
Catalyst - Increase catalyst reaction by 15-20%.
“SENFI SWISS GMBH” …marketing channel for “CIERRA™” and other products
Applications:

P. 22
0%
5%
10%
15%
20%
25%
30%
0% 5% 10% 15% 20% 25% 30% 35% 40%
EB
ITD
A o
n A
sset
EBITDA Margin
Chemicals: Peers Comparison
Mitsubishi Chemical
Formosa Petrochem
SCG Chemicals
Lotte Chemical
Dow DuPont
BASF
PTTGC
2017
2016
Source: Public information
Sabic
Petronas
Chemicals
Formosa Chemicals & Fibre
LG Chem
Formosa Plastic
Reliance

P. 23
Cement: ASEAN cement markets 2017
Demand Growth
FY2017 - +8% -3% -5% +8% -2%*
FY2016 +2% +14% +2% -2% 0% +9%
Ex-factory price (Q4/17)
US$ / ton** $50-$55 $61-$76 $50-$56 $50-$52 $43-$50 $50-$64
Note: Indonesia’s grey cement demand is based on the data from Indonesian cement association (ASI).
* Vietnam’s grey cement demand volume and growth in FY2017 included only Jan-Nov.
Export
MT
Export
6560
8
3
Bag Bulk
Thailand 35% 65%
Indonesia 80% 20%
Vietnam 80% 20%
SCG 23
Siam City 16
TPIPL 13
Others 8
Semen Indonesia 36
Indocement 26
Lafarge Holcim 16
Others 25
- Demand 2017
- Capacity 2017
0
10
20
30
40
50
60
70
80
90
100
Laos Cambodia Myanmar Thailand Indonesia Vietnam
57
10 in 20187 in 2018
4
13
18 in 2018
100 in 2018103 in 2018
10098
58*
77*
37.5
48.8

P. 24
Cement: SCG’s ASEAN capacity growth
THAILAND: 23 MT
Locations of SCG’s plants
North Thai plant
Central Thai plant
South Thai plant
MawlamyinePlant
330 km to Yangon
KhammouanPlant
55 km to Thai border
KampotPlant
130 km to Phnom Penh
SukabumiPlant
Central Vietnam Plant
ASEAN (ex-Thai): 10.5 MT
Vietnam 3.1 MT Q1/17 M&A
Laos 1.8 MT Q1/17 start
Myanmar 1.8 MT Q1/17 start
Indonesia 1.8 MT H1/15 start
Cambodia 1 & 2 2.0 MT H1/15 start
Total 33.5 MT

P. 25
Cement: Thailand’s domestic market segments
Note: * Estimated volume market distribution

P. 26
Ceramics: SCG’s restructuring
5 companies 1 company
Thai Ceramics
(TCC) – 35 M.sqm. Thai-German Ceramic Industry
(TGCI) – 24 M.sqm.
The Siam Ceramic Group
Industry (SGI) 25 M sqm
Sosuco and Group (2008)
(SSG) – 18 M.sqm.
Ceramics Cementhai
Gemago (GMG)
New Company
• Independently operated
• Oversupplied Thai market
• Competition from imports
• Integrate business functions
• Streamline operations
• Improve competitiveness
• Enhance customer experience
Pro Forma 9M/17…as per IM
- Total Revenue 10,294 MB - Total Asset 13,363 MB
- EBITDA 1,068 MB - Total Liability 4,554 MB
- Net Profit 412 MB - Total Equity 8,091 MB

P. 27
SCG Cement-Building Materials: SCG Logistics
Small Parcel Express Delivery
JV with Yamato Asia (‘Black Cat’) for small parcel
home delivery.
Cold Chain
JV with Nichirei Logistics for Temperature-
controlled logistics.
The 10,500 square meters warehouse is strategically located at
Teparak Rd (km.22,), with proximity to the Inland Container
Depot and is 103 km. from the Laemchabang sea port. 20182017
Nationwide

P. 28
Packaging businessFocused towards the total packaging solutions
Upstream
(Substrate)
Downstream
(Solutions)Display Packaging Logistics Packaging
Total Packaging Solutions
Plastic Packaging
- Flexible
- Rigid
Fiber Packaging:
- Food packaging
- Pulp mold
Primary Packaging Solutions
- Micro flute packaging
- Folding carton
- Corrugated box
- Logistics material
- E-Commerce packaging
Pulp / Paper
(Food grade)
Film
Packaging Paper

P. 29
Packaging: Segments and Materials of primary packaging
Flexible FilmSemi-Rigid/
ThermoformPulp/ Paper
Healthcare/ Medical
Food & Beverage
Consumer & Others
Anti-microbial
film MATS/HPP
Odor lock
Rigid Plastics

P. 30Note: Based on published regional prices
0
150
300
450
600
750
$/Ton
Packaging Paper
Recovered Paper (AOCC)
Jan/18
240-250
555-565
Q1/15 Q2/15 Q3/15 Q4/15 Q1/16
450
170
Q2/16
450
170
Q3/16
450
190
Q4/16
460
210
Q1/17
465
250
485
265
Q2/17
520
255
Q3/17 Q4/17
550
225
Packaging: Regional prices.
2015 2016 2017
P. 31
Discussions
Strategies
ASEAN
Innovations
Business Updates
Financials and Sustainability
Appendix

P. 32
FY2017 Financials Results
0
100,000
200,000
300,000
400,000
500,000
FY2016 FY2017
MB
423,442450,921
Revenue from Sales
87,68785,636
10,129 16,444
0
20,000
40,000
60,000
80,000
100,000
120,000
FY2016 FY2017
Dividend
EBITDA
from
Operations
MB
EBITDA97,816
102,080
EBITDA 21% 19%
Margin:
EBITDA
38,15136,829
17,93318,212
0
10,000
20,000
30,000
40,000
50,000
60,000
FY2016 FY2017
MB
EPS: 46.7 45.9
Profit for the Period
55,04156,084
Sub.
Eq Inc.Eq Inc.
Sub.

P. 33
Financials: Net debt and Leverage
• 1.4x Net Debt / EBITDA
• 0.5x Net Debt / Equity
• 64,129 MB cash on hand
• 98% Thai Baht
• 90% fixed rate
• 3.5% avg. interest cost
2.5x internal
leverage ceiling
91% retail debenture

P. 34
Financials: CAPEX and Investments
- CAPEX includes debottlenecking, expansion projects, and major turnaround.- Investments are acquisitions and purchase of shares.
EBITDA (BB): 45.7 61.3 66.5 82.7 97.8 102.1

P. 35
0.01.0
3.0
6.0
15.0 15.0 15.0 15.0
7.58.5
12.5 12.5
11.0
15.5
12.5
16.0
19.0 19.0
0.0
2.0
4.0
6.0
8.0
10.0
12.0
14.0
16.0
18.0
20.0
2000 2001 2002 2003 2004 2005 2006 2007 2008 2009 2010 2011 2012 2013 2014 2015 2016 2017
Financials: Dividend policy
Note: Dividend policy established in 2008
100 yr
special
dividend
Baht / Share
% of 0% 16% 25% 36% 49% 56% 61% 59% 54% 42% 40% 55% 56% 51% 45% 42% 41% 41%
Net Profit
40% to 50%
Payout Policy

P. 36
SCG’s Past 15 Years

P. 37
Sustainability: DJSI Global Recognition
2004 - 2017 : Member of the DJSI.
2011 - 2015 : Ranked Industry Leader (Construction Materials)

P. 38
Strategies
ASEAN
Innovations
Business Updates
Financials and Sustainability
Appendix

P. 39
SCG’s Shareholders
Local 70%– Institution / Retail 40%
– CPB 30%
Foreign 30%– Foreign Board 23%
– NVDR 7%
Feb/18
- CPB (Crown Property Bureau ) = Asset management arm of monarchy
Foreign 30%
Foreign Board
23%
NVDR
7%
Thai
(Institution / Retail)
40%
Thai
(CPB)
30%
~70% free float

P. 40
SCG’s external learning programs
Note: as of Jan/18
Programs Current Since ClassesSCG
Participants
AMP – Advanced Management Program
Harvard
Wharton
IMD
LBS
1982
2007
2015
2017
35
8
2
1
103
15
2
1
EDP – Executive Development ProgramColumbia
IMD
2007
2014
4
1
177
45
MAP – Management Acceleration Program Duke CE 2015 4 176
MDP – Management Development ProgramWharton
Duke CE
1980
2011
36
6
1,531
327
Marketing Excellence Program Kellogg 2006 9 615
P. 41
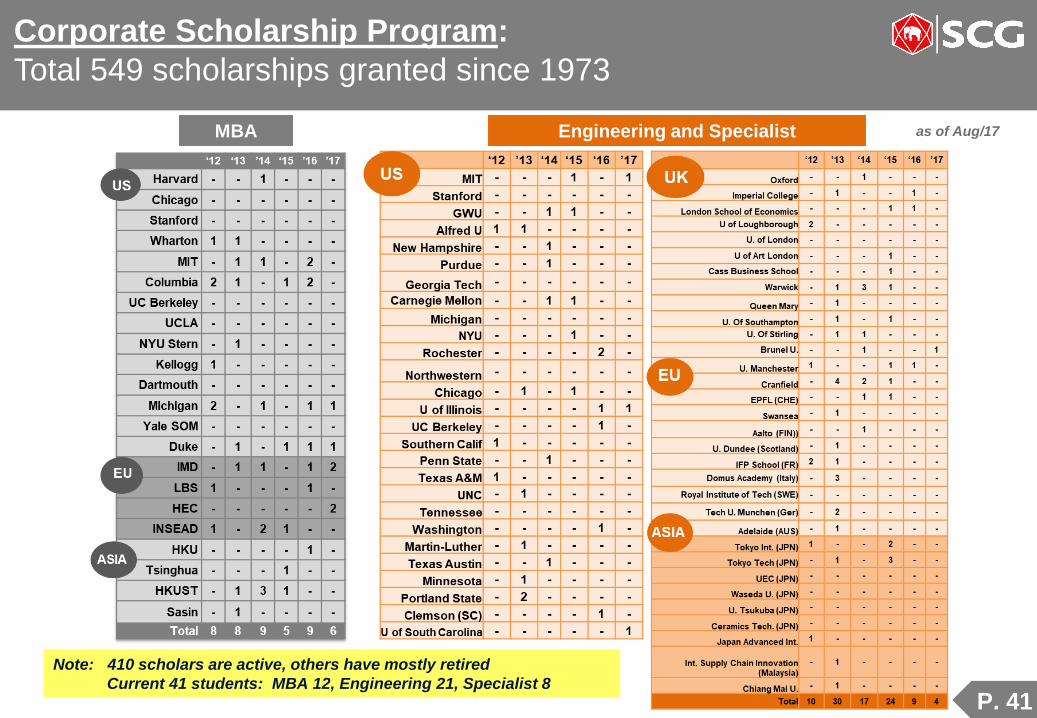
Corporate Scholarship Program:
Total 549 scholarships granted since 1973
MBA Engineering and Specialist as of Aug/17
Note: 410 scholars are active, others have mostly retired
Current 41 students: MBA 12, Engineering 21, Specialist 8

P. 42
Consolidated Segments
Other = Mainly SCG Investment and Corporate
Revenue from Sales
Profit for the Period

P. 43
Consolidated Sales Segments
Total Sales Segments (market based) Thai Export Segments
Note: Thai domestic sales are market based.
Thai exports are recognized as sales at the destination markets.
* ASEAN (ex-Thailand) = Local ASEAN production + Export from Thailand
61% 59%
23% 24%
16% 17%
FY2016 FY2017Export as
% of Sales27% 27%
Thailand
(domestic)
ASEAN (ex-Thailand)
Others
450,921 MB423,442 MB
ASEAN41%
ASEAN36%
China/HK22% China/HK
26%
S. Asia10%
S. Asia13%
N. Asia7%
N. Asia9%
Others20%
Others16%
FY2016 FY2017
112,549 MB 123,027 MB

P. 44
Consolidated Equity Income
1,2892,167
3,772 3,313 3,094 3,713
5,485
(606)
2,7742,795
7,199
14,220
-1,000
1,000
3,000
5,000
7,000
9,000
11,000
13,000
15,000
17,000
19,000
2011 2012 2013 2014 2015 2016
MB
6,774
1,561
6,5466,108
10,293
17,933
Non-Chemicals associates(includes Global House, Kubota
and Others)
Chemicals associates
55% Dow Chemicals JV
15% C4-chain JV30% Others (mainly CAP)

P. 45
Chemicals: SCG’s ASEAN portfolio
Flex-products (metathesis)
Thailand Vietnam
Crackers (SCG 2/3, DOW 1/3)
ROC (1999)
Rayong Olefins
1.35 MT C2 + C3
MOC (2010)
Map Ta Phut
Olefins
1.7MT C2 + C3
Downstream
Subsidiaries Associates
PE
PP
PVC
Others
Dow
Mitsui
Chemicals
Mitsubishi
Rayon
BST
Indonesia
Cracker (SCG 30%)
CAP (1995)
Chandra Asri
0.9 MT C2 + C3
De-bottleneck40% debot in 2015
1.3 MT C2 + C3
Cracker
Long Son Petrochemicals(LSP)
1.5 MT C2 + C3
Downstream
Subsidiaries Associates
PE
PP
SM
BD
Michelin SSBR (Q2/2018 start)
Project Details
Downstream: 1.35 MT
HDPE 450,000 tons
LLDPE 500,000 tons
PP 400,000 tons
Flexible-feed cracker

P. 46
Chemicals
Note: as of Sept/17
World ethylene supply growth
updated
previous
%
0
1
2
3
4
5
6
7
8
9
10
2004 2005 2006 2007 2008 2009 2010 2011 2012 2013 2014 2015 2016 2017 2018 2019 2020 2021 2022
3%
8%
5%
1%2%
2%
3%
4% 4% 4% 4%
3%
3%
4% 4%4% 4%3-4%
3%
5% 5%
3% 3% 2-3%3%
Incremental supply growth (MT):
2.8 4.4 4.6 4.7 4.7 3.5 10.5 6.9 2.0 5.0 3.4 5.0 2.8 8.5 ~8.0 ~6.0 ~6.0 ~6.0 ~5.0
Based on construction globally

P. 47
29%
6%
6%
59%
15%
42%
28%
13%
2%
Chemicals: Ethylene world capacity
Ethylene world capacity
200 MT in 2022
New capacity by region
(2018 - 2022)
Naphtha
Conventional
Gas
New shale
gas crackers
MTO/ CTO
& Others
S/E Asia
/India
H2/17 2018 2019-2021
DOW 1.5 MT Chevron 1.5 MT others
OXY 0.6 MT Exxon 1.5 MT
Mongolia coal reserves location.
2.5 time higher investment cost than conventional.
deleted from China’s investment tax promotion.
Middle East
North
America
Others
N/E Asia

P. 48
0
1
2
3
4
5
6
7
8
9
10
2004 2005 2006 2007 2008 2009 2010 2011 2012 2013 2014 2015 2016 2017 2018 2019 2020 2021 2022
3%
7%
4%
2%
5%
4%
6%
3%
5%
6%
3%
4%
6%
3% 3%
4%3-4%
2-3%
5%
Chemicals
Note: as of Sept/17
Propylene world supply growth
PP spread < PE spread
%
Incremental supply growth (MT):
1.8 2.4 3.3 4.1 4.8 2.8 5.9 4.1 2.1 4.4 3.8 6.2 5.4 4.8 ~4.0 ~4.0 ~5.0 ~5.0 ~4.0

P. 49
7%
14%
60%
17%
2%
29%
12%
15%
44%
Chemicals: Propylene world capacity
Propylene world capacity
143 MT in 2022
Naphtha
CTO & MTO
& others
Refinery
PDH
New capacity by region
(2018 – 2022)
North Asia
(mainly PDH)
Middle
East
North
America
South East
Asia
Others

P. 50
Chemicals: PP – Naphtha price gap
Note: Prices refer to SEA regional prices

P. 51
Chemicals: Benzene & Toluene
Note: Prices refer to SEA regional prices

P. 52
Chemicals: PVC
Note: Prices refer to FE regional prices

P. 53
Chemicals: Price Gaps of Associates
Note: BD and MMA prices refer to SEA regional prices, PTA prices refer to Asian regional prices

P. 54
46%
15%
12%
27%
Cement – Building Materials: Thai sales segments
FY2017 Domestic Thai Sales112,248 MB ($3.3 Billion)
SCG Logistics and Others
JV with Yamato Asia and,
Nichirei Logistics
Floor and Wall Tiles,
Sanitary Ware, Fittings
Roofing products, Board & Wood
substitute, and Home improvement
Structural Products:
Thai cement plants
(North, Central, South)
RMC nationwide network
of +400 batching plants
Others: Mortar, White
Cement, Q-ConCeramics
Structural
Products
Housing
Products
Logistic
& Others
Note: Structural Products: Grey cement, RMC, Others (mortar, white cement, and lightweight concrete blocks).
Housing Products: Roofing products, Board & Wood sub, and Home improvement.
Ceramics: includes Sanitary ware and Fittings. Note: Thai domestic sales are market based.
Thai exports are recognized as sales at the destination markets.

P. 55
SCG’s HVA progress
HVA’s Revenue from Sales
HVA attributes: 5-10% higher margin Performance Solutions provider
Service & Design Branding
Business 2013 2014 2015 2016 2017
Cement-Building Materials 41% 42% 41% 41% 43%
Chemicals 27% 27% 31% 31% 30%
Chemicals (Includes associates) 50% 50% 53% 54% 54%
Packaging 38% 39% 39% 43% 47%

P. 56
SCG’s capacity (2017)
Chemicals - Naphtha Cracker (consolidated) Chemicals - Associates (equity accounting)
Ethylene 1,800,000 tons Dow Chemicals JV (50%)
Propylene 1,250,000 tons - LLDPE 650,000 tons
Chemicals - Downstream (consolidated) - Propylene Oxide 390,000 tons
HDPE 920,000 tons - Specialty Elastomer 220,000 tons
LDPE + LLDPE 220,000 tons - PS 140,000 tons
PP 720,000 tons - SM 300,000 tons
PVC (Thai, Indo, Viet) 886,000 tons - Synthetic Latex 18,000 tons
Mitsui Chemicals JV (20% - 50%)
Cement - Building Materials (consolidated) - PTA (50%) 1,440,000 tons
Grey Cement (Thai, Cam, Myan, Indo, Laos, Viet) 33.5 million tons - PET (20%) 133,000 tons
Ready-Mixed Concrete 550 batching plants - PP Compound (46%) 168,000 tons
(Thai, Cam, Myan, Indo, Laos, Viet) - LLDPE Cast Film (45%) 15,000 tons
White Cement (Thai, Viet) 0.4 million tons Mitsubishi Rayon JV (47%) Ceramic Tiles (Thai, Indo, Phil, Viet) 225 M sqm - MMA 175,000 tons
Roofing Tiles (Thai, Cam, Phil, Viet) 89 M sqm - Cast Sheets 20,000 tons
Ceiling & Wall Products 100 M sqm Chandra Asri JV(30%)
Lightweight concrete (Thai, Indo) 30 M sqm - Ethylene 860,000 tons
- Propylene 470,000 tons
Packaging (consolidated) - HDPE / LLDPE 336,000 tons
Packaging Paper (Thai, Phil, Viet) 2,549,000 tons - PP 480,000 tons
Box (Thai, Malay, Sing, Viet, Indo) 1,045,000 tons - SM 340,000 tons
Printing & Writing Paper 495,000 tons Bangkok Synthetic (49%)
Machine Glazed Paper (Nippon Paper JV) 43,000 tons - Butadiene 140,000 tons
Flexible Packaging (Thai, Viet) 590,000 M sqm - SSBR

P. 57
Incremental capacity
-
2011 2012 2013 2014 2015 2016 2017 2011 2012 2013 2014 2015 2016 2017
Chemicals Upstream (Cracker) - ('000 tons) Packaging - ('000 tons)
Ethylene (subsidary) 1,700 1,700 1,700 1,700 1,700 1,700 1,800 Printing & Writing Paper 570 570 570 570 570 495 495
Propylene (subsidary) 1,200 1,200 1,200 1,200 1,200 1,200 1,250 Packaging Paper 1,880 1,880 1,956 2,306 2,306 2,306 2,549
Chandra Asri (30% stake) Box 795 855 1,013 1,013 1,013 1,013 1,045
Ethylene 600 600 600 600 600 860 860 - - - 43 43 43 43
Propylene 320 320 320 320 320 470 470
Flexible Packaging (Million sqm.) - - - 290 590 590 590
(Thai + Vietnam)
Chemicals Downstream - ('000 tons) Cement - (MT)
HDPE (subsidiary) 920 920 920 920 920 920 920 Grey Cement (TH, KH, MM, ID, LA, VN) 24 24 24 24 27 29 34
PP (subsidiary) 720 720 720 720 720 720 720 White Cement (TH, VN) 0.2 0.4 0.4 0.4 0.4 0.4 0.4
PVC (90% stake in TPC) 886 886 886 886 886 886 886 Mortar 2.1 2.1 2.1 3.2 4.1 6.6 6.6
Chemicals Downstream (JV) - ('000 tons) Building Products - (M sqm)
LLDPE (Dow JV) 650 650 650 650 650 650 650 Ceramic Tiles 149 149 225 225 225 225 225
Specialty Elastomers (Dow JV) 220 220 220 220 220 220 220 Ceiling & Wall product (TH) 60 68 86 99 99 100 100
Propylene Oxide (Dow JV) 390 390 390 390 390 390 390 Lightweight concrete (TH, ID) 15 15 21 27 27 30 30
SSBR (BST JV) - - 50 50 50 100 100 Modular Home (Sekisui Heim JV) 200 200 1,000 1,000 1,000 1,000 1,000
- - - 15 15 15 15
MMA (Mitsubishi Rayon JV) 175 175 175 175 175 175 175
20 20 20 20 20 20 20
HDPE / LLDPE (CAP JV) 336 336 336 336 336 336 336
PP (CAP JV) 480 480 480 480 480 480 480
SM (CAP JV) 340 340 340 340 340 340 340
Machine Glazed Paper
(Nippon Paper JV)
LLDPE cast sheet film
(Mitsui Tohcello JV)
Capacity at year endTotal Capacity
Capacity at year endTotal Capacity
Cast Sheets
(Mitsubishi Rayon JV)

P. 58
Segmented Financials
Sales & Assets (MB):
Sales (MB) 2001 2002 2003 2004 2005 2006 2007 2008 2009 2010 2011 2012 2013 2014 2015 2016 2017
Consolidated 120,353 128,201 148,865 192,395 218,265 258,175 267,737 293,230 238,664 301,323 368,579 407,601 434,251 487,545 439,614 423,442 450,921
Cement 24,183 27,269 30,552 36,658 41,630 44,123 44,087 49,999 46,661 48,954 54,249 67,558
Building Materials 13,046 16,129 18,147 20,542 22,227 22,745 21,281 23,351 26,873 30,719 34,171 41,340 174,642 185,423 178,988 170,944 175,255
Distribution 53,326 52,191 56,551 68,558 76,070 81,519 86,440 102,672 86,641 96,898 111,920 126,690
Chemicals 38,152 42,394 50,767 75,185 86,084 122,645 130,223 136,527 101,115 144,317 192,929 203,539 209,997 248,118 200,433 188,163 206,280
Packaging 26,995 29,305 33,564 38,265 40,306 42,645 43,890 47,110 42,729 51,714 54,839 57,430 59,135 64,614 70,907 74,542 81,455
Assets (MB) 2001 2002 2003 2004 2005 2006 2007 2008 2009 2010 2011 2012 2013 2014 2015 2016 2017
Consolidated 174,804 167,388 176,566 191,081 199,370 226,264 248,256 285,776 315,992 359,219 373,789 395,573 440,633 465,823 509,981 539,688 573,412
Cement 59,618 60,624 56,315 54,801 55,953 57,791 60,132 60,770 60,681 61,018 60,115 66,808
Building Materials 16,023 15,338 15,771 18,068 20,259 20,595 19,863 22,654 22,991 24,796 35,845 43,512 155,458 168,662 187,976 203,068 213,134
Distribution 7,813 6,864 6,631 7,765 8,560 10,610 11,143 10,903 10,110 12,177 16,234 24,463
Chemicals 54,284 57,762 67,254 75,186 78,656 109,391 123,205 138,504 165,964 165,087 176,036 176,837 192,063 183,884 185,583 193,465 193,183
Packaging 25,844 28,720 32,813 39,128 38,575 40,734 46,454 51,089 47,942 50,127 52,463 58,439 65,169 73,987 83,218 85,369 91,312

P. 59
EBITDA & Profit for the Period (MB):
Segmented Financials
EBITDA (MB) 2001 2002 2003 2004 2005 2006 2007 2008 2009 2010 2,011.00 2012 2013 2014 2015 2016 2017
Consolidated 28,884 30,418 37,188 54,626 53,507 57,151 50,008 38,783 47,116 45,949 46,253 45,716 61,265 66,493 82,690 97,816 102,080
Cement 7,615 7,917 11,581 13,175 13,235 12,200 10,198 11,272 11,616 10,810 12,781 14,824
Building Materials 3,140 3,605 4,382 5,307 5,387 4,856 3,928 4,085 4,907 5,489 5,060 6,661 26,274 26,683 24,395 23,639 22,319
Distribution 1,268 1,214 602 1,541 1,546 1,498 1,576 1,739 1,581 1,440 1,532 1,564
Chemicals 6,443 6,452 9,851 23,642 19,653 26,199 22,611 12,598 19,482 16,024 14,394 8,628 20,342 26,142 42,900 60,713 64,461
Packaging 8,205 9,536 9,819 9,840 9,496 9,634 7,943 6,660 7,901 9,129 8,811 8,844 9,473 9,718 10,831 10,884 12,431
Profit for the Period (MB) 2001 2002 2003 2004 2005 2006 2007 2008 2009 2010 2011 2012 2013 2014 2015 2016 2017
Consolidated 7,634 14,604 19,954 36,483 32,236 29,451 30,352 16,771 24,346 37,382 27,281 23,580 36,522 33,615 45,400 56,084 55,041
Cement 859 2,006 5,313 6,582 7,916 6,652 5,463 6,006 6,214 6,014 7,288 9,163
Building Materials 410 1,521 2,253 2,700 3,071 1,939 950 778 1,617 1,872 1,476 2,949 16,092 13,180 10,250 8,492 7,230
Distribution 680 586 251 968 1,079 1,021 939 1,211 1,077 1,061 1,075 1,035
Chemicals 2,611 5,285 7,777 20,523 16,656 17,574 16,982 6,136 12,556 22,609 11,190 2,690 11,292 12,461 28,488 42,084 42,007
Packaging 3,272 4,079 4,424 4,122 3,689 3,574 2,353 1,658 2,286 3,490 3,331 3,560 3,587 3,448 3,463 3,565 4,719

P. 60
Thank You
For further details, please contact [email protected]
Updated Pages Updated details from previous presentation
16, 49-52 Updated chemicals prices