Embed Size (px)
Citation preview
INTRA-INDUSTRY TRADE IN AGRICULTURAL AND FOOD PRODUCTS: THE CASE OF UKRAINE
OKSANA LUKA, INNA LEVKOVYCH
DISCUSSION PAPER NO. 78 2004
DISCUSSION PAPER
Institute of Agricultural Development in Central and Eastern Europe
Theodor-Lieser-Straße 2, 06120 Halle (Saale), Germany Phone: +49-345-2928 110 Fax: +49-345-2928 199
E-mail: [email protected] Internet: http://www.iamo.de
Dr. Oksana Luka is an assistant in the State Regulation Department of the National Agricultural Uni-versity, Kiev, Ukraine. Her research focuses on agricultural trade and trade policy analysis.
Mailing address: National Agricultural University Heroyiv Oborony str. 15 03041 Kiev Ukraine
Phone: +38-044-267-86-48 Fax: +38-044-267-30-06 E-mail: [email protected] Internet: http://www.nauu.kiev.ua
Inna Levkovych is a research assistant at the Institute of Agricultural Development in Central and Eastern Europe (IAMO), Department of Agricultural Markets, Marketing and World Agricultural Trade, in Halle, Germany. Her research focuses on agricultural trade analysis, trade policy and WTO accession issues.
Mailing address: Institute of Agricultural Development in Central and Eastern Europe (IAMO) Theodor-Lieser-Straße 2 06120 Halle/Saale Germany
Phone: +49-345-29 28 238 Fax: +49-345-29 28 299 E-mail: [email protected] Internet: http://www.iamo.de
Discussion Papers are interim reports on work of the Institute of Agricultural Development in Central and Eastern Europe (IAMO) and have received only limited reviews. Views or opinions expressed in them do not necessarily represent those of IAMO. Comments are welcome and should be addressed directly to the author(s).
The series Discussion Papers is edited by:
Prof. Dr. Alfons Balmann (IAMO) PD Dr. Heinrich Hockmann (IAMO) Dr. Peter Weingarten (IAMO)
ISSN 1438-2172
Intra-industry trade in agricultural and food products: The case of Ukraine
3
ABSTRACT The process of economic transformation in Ukraine is characterized by, among other things, a change in agricultural and food product trading patterns. Ukraine has remained a net exporter of agro-food products, but the total volume and worth, as well as the geographical structure of trade flows, has altered significantly, and further adjustments can be expected to take place in upcoming years. This paper examines Ukrainian agro-food trade, particularly focusing on different aspects of intra-industry trade (IIT), which is usually associated with low adjustment costs. To examine the development of IIT in agro-food products between Ukraine and its trading partners, two approaches are adopted. The Grubel-Lloyd Index is used to calculate the intensity of IIT and thus to determine its relative importance compared to inter-industry trade. IIT values estimated across separate product groups and for selected trading partners differ significantly and exhibit high variability over time, but generally the level of IIT is very low. The results show that the major part of agro-food trade is of the inter-industry type, and thus a product of underlying comparative advantages. Secondly, the paper examines changes in trade flows over time. For this purpose, different measures of marginal intra-industry trade are applied. Marginal IIT appears to be low, therefore, the structure of the change in agro-food trade flows between Ukraine and its trading partners during the analyzed period (1996-2002) is shown to be predominantly inter-industry, which implies potentially high adjustment costs.
JEL: Q17, F14 Keywords: Intra-industry trade, marginal intra-industry trade, agro-food products, Ukraine.
ZUSAMMENFASSUNG INTRASEKTORALER HANDEL IM LANDWIRTSCHAFTLICHEN UND NAHRUNGSMITTELSEKTOR:
DAS BEISPIEL DER UKRAINE
Der Transformationsprozess in der Ukraine ist unter anderem durch Änderungen der Handels-struktur von landwirtschaftlichen und Nahrungsmittelprodukten charakterisiert. So haben sich das Gesamthandelsvolumen, die Warenstruktur sowie die geografische Struktur der Handels-ströme bedeutsam geändert. Weitere Änderungen sind demnächst zu erwarten. Dennoch bleibt die Ukraine Netto-Exporteur von landwirtschaftlichen und Nahrungsmittelprodukten.
Das Ziel von diesem Papier ist, die Landwirtschaft und den Nahrungsmittelhandel der Ukraine detailliert zu untersuchen. Hauptaugenmerk liegt dabei auf verschiedenen Aspekten des intra-sektoralen Handels, welcher gewöhnlich mit niedrigen Anpassungskosten verbunden ist. Um dessen Entwicklung zu untersuchen, wurden zwei Ansätze verwendet. Zunächst nutzen wir den Grubel-Lloyd Index für die Bewertung der Intensität des intrasektoralen Handels. Herausgestellt werden soll die Bedeutung des intrasektoralen im Vergleich zu zwischensektoralem Handel. Das Niveau des intrasektoralen Handels, welches für Produktgruppen sowie für ausgewählte Handelspartner berechnet wurde, unterscheidet sich wesentlich und weist große Schwankungen im Zeitablauf auf. Insgesamt ist das Niveau aber sehr gering. Die Ergebnisse zeigen, dass der intersektorale Handel überwiegt. Dies wird durch komparative Vorteile verursacht. Danach un-tersucht die Arbeit außerdem die Änderungen der Handelsströme im Zeitablauf. Dafür wurden verschiedene Maße des marginalen intrasektoralen Handels angewendet. Die marginalen Indizes sind niedrig, was bedeutet, dass die Änderungen in den Handelsströmen zwischen
Luka, O., Levkovych, I. 4
Ukraine und ihren Handelspartnern während der untersuchten Periode (1996-2002) intersek-toralen Charakter haben, und somit potenzielle höhere Anpassungskosten mit einschließt.
JEL: Q17, F14 Schlüsselwörter: Intrasektoraler Handel, marginaler intrasektoraler Handel, landwirtschaftliche
und Nahrungsmittelproduktion, Ukraine.
РЕЗЮМЕ ВНУТРИОТРАСЛЕВАЯ ТОРГОВЛЯ СЕЛЬСКОХОЗЯЙСВЕННОЙ ПРОДУКЦИЕЙ И
ПРОДОВОЛЬСТВИЕМ: НА ПРИМЕРЕ УКРАИНЫ
Изменение структруры внешней торговли сельскохозяйственной продукцией и продо-вольствием, среди прочего, является одной из важных характеристик процесса транс-формации экономики Украины. Украина остается нетто-экпортером агропродовольст-венной продукции, однако общий объем торговли, а также ее товарная и географическая структура существенно изменились, и ожидается, что в ближайшем будущем будут происходить дальнейшие ее изменения. Целью данной работы является детальное изу-чение украинской агропродовольственной торговли с акцентом на исследовании раз-личных аспектов внутриотраслевой торговли, наличие которой обычно подразумевает меньшие затраты, связанные с трансформацией внешней торговли в процессе ее либе-рализации. Для анализа развития внутриотраслевой торговли между Украиной и ее тор-говыми партнерами использованы два подхода. Индекс Грубеля-Ллойда определяет ин-тенсивность внутриотраслевой торговли и ее весомость по сравнению с межотраслевой. Значения индекса существенно варьируют по товарным группам, торговым партнерам и годам, однако его уровень в целом очень низкий. Полученные результаты свидетельст-вуют, что торговля агропродовольственной продукцией в основном является межотрас-левой, что обусловлено сравнительными преимуществами страны. Кроме того, в работе анализируются изменения торговых потоков на протяжении 1996-2002 гг. с использова-нием различных показателей маржинальной внутриотраслевой торговли. Поскольку уро-вень маржинальной внутриотраслевой торговли достаточно низкий, изменения потоков агропродовольственной продукции между Украиной и ее торговыми партнерами на про-тяжении анализируемого периода являются межотраслевыми, что подразумевает потен-циально высокие затраты в связи структурными изменениями в отрасли.
JEL: Q17, F14 Ключевые слова: Внутриотраслевая торговля, маржинальная внутриотраслевая
торговля, агро-продовольственная продукция, Украина.
Intra-industry trade in agricultural and food products: The case of Ukraine
5
CONTENTS
Abstract .............................................................................................................................. 3
Zusammenfassung ............................................................................................................. 3
Резюме................................................................................................................................ 3 List of Tables............................................................................................................................... 6 List of Figures ............................................................................................................................. 6 List of Abbreviations................................................................................................................... 6
1 Introduction ................................................................................................................... 7
2 Theoretical framework of intra-industry trade measurement.................................. 8 2.1 Standard measure of intra-industry trade: The Grubel-Lloyd Index ..................................... 8 2.2 The measures of marginal intra-industry trade...................................................................... 10
3 The general pattern of Ukrainian agro-food trade..................................................... 12
4 Ukrainian intra-industry trade in agro-food products: Empirical results .............. 16 4.1 The traditional measure of IIT .............................................................................................. 16 4.2 Marginal intra-industry trade ................................................................................................ 19
5 Conclusions..................................................................................................................... 22
References .......................................................................................................................... 23
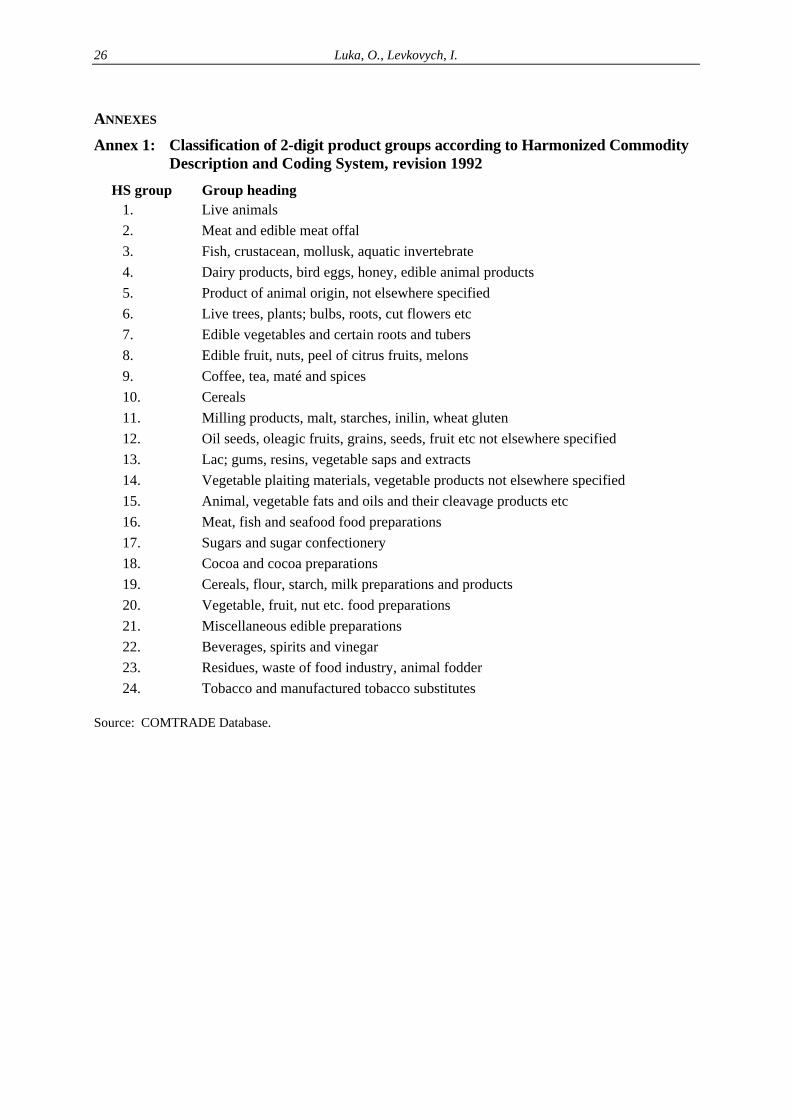
Annexes............................................................................................................................... 26 Annex 1: Classification of 2-digit product groups according to Harmonized Commodity
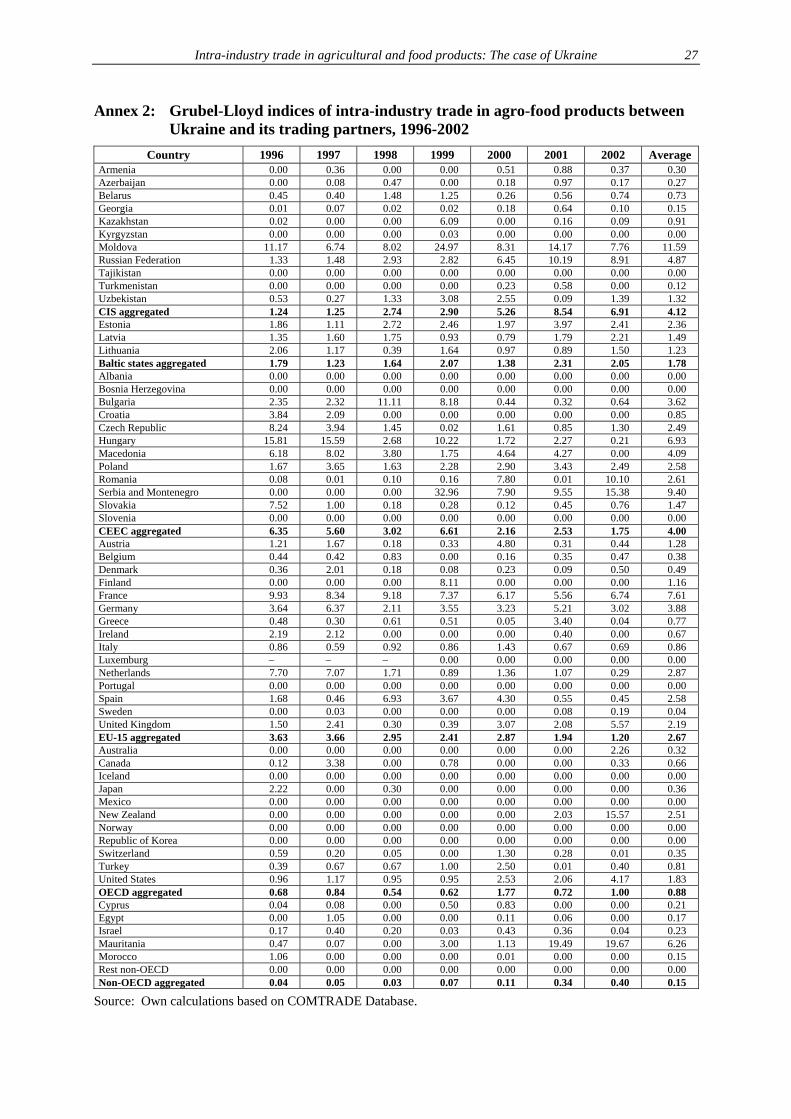
Description and Coding System, revision 1992............................................................. 26 Annex 2: Grubel-Lloyd indices of intra-industry trade in agro-food products between
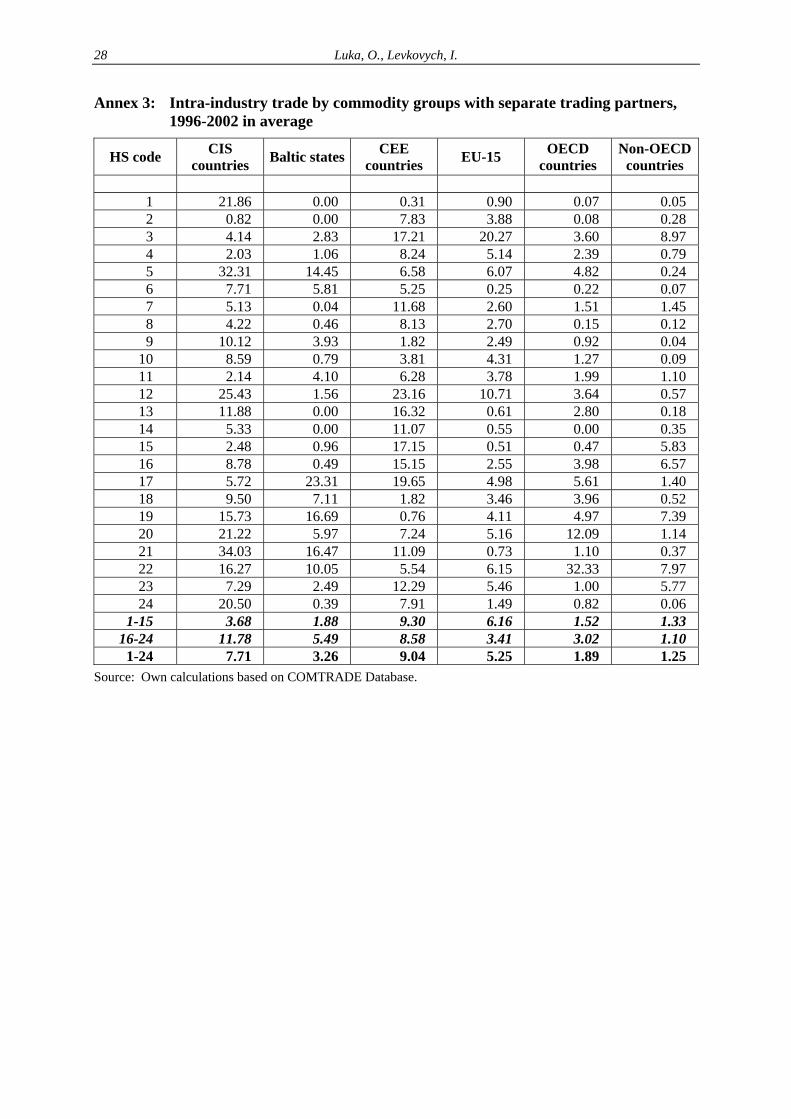
Ukraine and its trading partners, 1996-2002.................................................................. 27 Annex 3: Intra-industry trade by commodity groups with separate trading partners, 1996-2002
in average ....................................................................................................................... 28 Annex 4: Marginal intra-industry trade in agro-food products in Ukraine by industry,
1996-2002 (A indices).................................................................................................... 29 Annex 5: Ukrainian agro-food trade performance by industry, 1996-2002 ratios of positive
to negative (B indices).................................................................................................... 30
Luka, O., Levkovych, I. 6
LIST OF TABLES Table 1: Grubel-Lloyd indices of intra-industry trade in agro-food products
between Ukraine and its trading partners, 1996-2002...................................... 17 Table 2: Intra-industry trade by commodity groups between Ukraine and all
trading partners (the world), 1996-2002........................................................... 18 Table 3: Marginal intra-industry trade in agro-food products in Ukraine by trade
partners, 1996-2002 (A indices) ....................................................................... 19 Table 4: Allocation of B index of marginal IIT for Ukrainian agro-food trade by
trade partners, 1996-2002................................................................................. 20
LIST OF FIGURES Figure 1: Ukrainian agro-food trade, 1995-2002 ............................................................. 13 Figure 2: Commodity composition of Ukrainian agro-food exports, 2000-2002 ............ 14 Figure 3: Commodity composition of Ukrainian agro-food imports, 2000-2002............ 14 Figure 4: Geographic structure of Ukrainian agro-food export, 1996-2002.................... 15 Figure 5: Geographic structure of Ukrainian agro-food imports, 1996-2002.................. 15 Figure 6: Ukrainian agro-food trade performance, 1996-2002........................................ 21
LIST OF ABBREVIATIONS CEE Central and Eastern Europe
CEEC Central and Eastern European countries
CIS Commonwealth of Independent States
COMTRADE United Nations Commodity Trade Statistics Database
EU European Union
GDP Gross domestic product
GL Grubel and Lloyd
GLIIT Grubel-Lloyd index of intra-industry trade
HS Harmonized System (Harmonized Commodity Description and Coding System)
IIT Intra-industry trade
MIIT Marginal intra-industry trade
OECD Organization of Economic Cooperation and Development
WTO World Trade Organization
Intra-industry trade in agricultural and food products: The case of Ukraine
7
1 INTRODUCTION The emergence and growth of intra-industry trade (IIT), defined as the simultaneous export and import of goods within the same industry, has been one of the most important trends in world trade over the past few decades and has gained increasing attention in the economic literature.
A number of questions concerning IIT has been discussed: From causes, significance, deter-minates of IIT, link to trade liberalization to conceptual and statistical problems involved in trying to measure IITTPF
1FPT. The studies of RUFFIN (1999), GREENAWAY and MILNER (2003) em-
phasize that with IIT there exists an additional potential source of gain – increased variety, the exchange the scale economies and pro-competition effects. Intra-industry trade reduces the demands for protection because in any industry there are both exports and imports, making it difficult to achieve unanimity among those demanding protection (RUFFIN, 1999). It is generally argued that industries with high levels of IIT undergo less structural change – and less adjust-ment costs – in response to trade liberalization than industries with low levels of IIT. The rea-son for this is that it is easier to transfer and adapt resources within firms or industries than to switch them from one industry to anotherTPF
2FPT (KANDOGAN, 2003a; KÖSEKAHYAOGLÜ, 2001).
Nowadays, there is an increasing number of studies of IIT between Western Europe and tran-sition countries, generally between the EU and CEE countriesTPF
3FPT. The core reason of these in-
vestigations has been to examine the effects of trade liberalization on trade flows for the CEE countries that signed the Association Agreement with the EU. All authors reported significant increases in the level of intra-industry trade between the EU and examined CEE countries. At the same time, these studies focus mainly on the trade of manufactured goods and tend to neglect agro-food trade.
The relative importance of intra-versus inter-industry trade in agro-food products for the CEE countries is difficult to predict ex ante. Some of the countries involved are well-endowed with natural resources; many are also relatively well-endowed with human and physical capital. Real wage costs are significantly lower than in Western Europe. Such factors will result in trade pat-terns predicted by the standard Heckscher-Ohlin theory, with countries exporting goods that use relatively abundant production factors. The study of FERTÖ and HUBBARD (2001) confirm this hypothesis. They reported a slight growth in IIT in agro-food sector between Hungary and EU countries, but its level is low for the majority of countries and product groups. They also pointed out that the structure of the change in agro-food trade between these countries during 1992-1998 was predominantly intra-industry. Analyzing Slovenian trade flows BOJNEC and HARTMANN (2004) conclude that the relevance of IIT in Slovenian agricultural and food trade is fairly low, but varies among the different sub-sectors and trade partners. In addition, most of the change in trade over time has been of the inter-industry type.
This paper investigates Ukrainian agricultural and food trade, particularly focusing on different aspects of intra-industry trade (IIT). Our interest in this topic could be explained by the fol-lowing reasons. First, agriculture and agricultural trade play a significant role in the Ukrainian economy. The share of agriculture in GDP is currently close to 15 percent. About 24 percent
TP
1PT BALASSA (1963); GRUBEL and LLOYD (1975); AQUINO (1978); RUFFIN (1999); GREENAWAY and MILNER
(2003) etc. TP
2PT KRUGMAN (1981) has formally shown that when countries have sufficiently similar factor endowments, both
partners tend to gain from trade liberalisation and the consequent IIT poses fewer adjustment problems than in the standard case.
TP
3PT Some recent studies are DJANKOW and HOEKMAN (1996); BRENTON and GROSS (1997); ATURUPANE et al.
(1999); GABRISH and SEGNANA (2002) and KANDOGAN (2003b).
Luka, O., Levkovych, I. 8
of population are economically active in this sector. Agricultural products and food have ac-counted, on average, for 13.2 per cent of the country’s total exports (IER, 2003). Second, the necessary step in the economic development of Ukraine is trade liberalization. It presumes the possibility of a Free Trade Agreement implementation with three CIS countries and most im-portant the expected WTO accessionTPF
4FPT. Trade theory suggests that the removal of trade barriers
can have a considerable impact on a country’s production structure and income distribution. As mentioned above adoption of international competition occurs with more adjustment – and higher adjustment costs – in industries characterized by inter-industry rather than intra-industry trade.
Therefore the aim of this paper is to examine the trend and extent of the intra-industry trade in the agro-food sector of Ukraine over 1996-2001. This analysis of the nature of trade provides an insight into the potential consequences of further trade liberalization for the agro-food sec-tor, namely expected structural adjustment. We apply recent developments in the theoretical literature to identify those measures of IIT considered the most appropriate for studying a general pattern of IIT in agro-food products, possible differences according to single products and countries, and changes in trade flows over time.
The remaining chapters of the paper are organized as follows. Section 2 considers the theo-retical framework of intra-industry trade measurement. We present the traditional measure of IIT, the Grubel-Lloyd index, as well as the more recent concept of marginal IIT. General pat-terns of Ukrainian agro-food trade and its developments over the concerned period are ana-lyzed in section 3. In section 4, we apply various measures of IIT on a Ukrainian trade data set and discuss the derived empirical results. Conclusions and possible directions for further work in this field follow in the last section.
2 THEORETICAL FRAMEWORK OF INTRA-INDUSTRY TRADE MEASUREMENT
2.1 Standard measure of intra-industry trade: The Grubel-Lloyd Index There are various indices for measuring intra-industry tradeTPF
5FPT, but the most widely used is the
GRUBEL-LLOYD (1975) index. In this index, IIT for an industry i is:
( )( ) ,100×
+
−−+=
iii MX
MiXiMiXiGLIIT or ,1001 ×⎟⎟
⎠
⎞⎜⎜⎝
⎛
+
−−=
ii
iii MX
MXGLIIT (1)
where GLIITBi B is the Grubel-Lloyd index of IIT in industry i, and XBi B and MBi B are, respectively, the values of exports and imports in industry i.
The value of GLIITBi B ranges from 0 to 100. If there is no IIT (i.e., either XBi B or M Bi B is zero) GLIIT Bi B takes the value of 0. If all trade is IIT (i.e., XBi B = MBi B), GLIITBi B takes the value of 100. Grubel and Lloyd (1975) also suggested the following formula, which is a weighted average of the pro-duct indices in (1) for the individual product P
iP, with the weights being based on the share of the
TP
4PT In 2003 President of Ukraine signed an Agreement on the Formation of a Single Economic Space between
Belarus, Kazakhstan, Russia and Ukraine, which foresees implementation of a Free Trade Agreement and eventually transformation towards a Customs Union.
TP
5PT In this paper we will not discuss all indices of measuring IIT. For detailed information see GULLSRAND "Does
the Measurement of Intra-Industry Trade Matter?".
Intra-industry trade in agricultural and food products: The case of Ukraine
9
specific product i in total trade j:
100*))(
1(∑∑
+
−−=
iii
iii
j MX
MXGLIIT (2)
The GLIIT index, as defined in equations (1) for the individual product i and (2) for the weighted aggregate j, provides information on the composition of trade flows for each year. More specifically, it presents the percentage of exports and imports of a similar product as an indication of the degree of external integration.
However, GREENAWAY and MILNER (2003) pointed out that the Grubel-Lloyd index is far from uncontroversial. Two main points of contention are aggregation and adjustment for aggre-gate payment imbalance. The latter refers to the argument stating that when aggregate goods trade is unbalanced, IIT indices may be biased downwards. GRUBEL and LLOYD (1975) sug-gested a ‘correction’ for aggregate trade imbalance, as have AQUINO (1978) and BERGSTRAND (1983). Quite apart from the technical shortcomings of particular corrections, GREENAWAY and MILNER (1981; 2003) pointed out that there were no strong a priori arguments for ad-justment, since we have no ex ante knowledge of what constitutes a particular set of ‘equilib-rium’ transactions. Moreover, VONA (1991) argues that the correction argument is theoreti-cally unsound and leads to an unreliable adjustment procedure. His example suggests that more plausible values are generated by the unadjusted Grubel-Lloyd index. For these reasons, in our study we employ an unadjusted Grubel-Lloyd index to compute the extent of IIT.
The aggregation problem has two dimensions: Geographical and industrial. The geographical dimension underscores the problem of a multilateral approach, since the IIT measure may be upward-biased at a multilateral level due to export of a product to one trade partner, and im-port from another trade partner of the same product. If we seek to minimize the biases due to geographical aggregation, bilateral trade flows are preferred over multilateral trade flows (FONTAGNÉ and FREUDENBERG, 1997; GULLSTRAND, 2002). In recent empirical studies both approaches are usedTPF
6FPT.
The industrial dimension of the aggregation problem underscores the importance of calculating IIT at a rather low aggregation level. If we aggregate two sub-industries with opposite trade-imbalance signs at each sub-level, IIT becomes upward-biased. If these imbalances are due to inter-industry specialization, a part of IIT consists of trade that could be explained by tradi-tional trade theory and comparative advantages. FINGER (1975) argued that the classification of trade statistics lump together products of different factor intensity. That is, IIT may just be a statistical phenomenon due to the mis-categorization of products. However, GRAY (1979) and GREENAWAY and MILNER (1983) find that intra-industry trade is not simply derived from aggregation. Though some exaggeration of the importance of IIT obviously exists, it retains its status as a phenomenon of significance. And nowadays we still find rather large volumes of IIT at very low aggregation levels, which implies that IIT is not just a statistical phenome-non. Besides the aggregation of final goods with various factor intensities, another source of the industrial aggregation problem stems from the increased fragmentation of production processes. An industry consists of both final and intermediate products, and measuring IIT at
TP
6PT TFor instance, TBLANEST and TMARTINT (2000) calculate IIIT at Tthe Tcountry level and aggregated to OECD and non-
OECD countries; TCHIARLONET (2000) use bilateral data for Italian trade with the EU; TFERTÖT and THUBBARDT (2001; 2002) estimate IIT Tbased Ton bilateral trade flows between Hungary and EU members. On the other hand, many studies use multilateral trade flows to calculate IIT (e.g., TBOJNEC T and THARTMANN, T 2004 T; T TKANDOGAN, T 2003T;T MORAT, T 2002T;T TTHOMT and TMCDOWELL, T 1999).
Luka, O., Levkovych, I. 10
a high aggregation level may imply that we measure an exchange between final products and intermediates.
There are two ways to solve the industrial dimension of the aggregation problem, thus allowing our IIT indices to preclude flows that could be explained by comparative advantages. One is to reclassify trade statistics, and the other is to calculate a weighted average IIT index based on disaggregated data (GREENAWAY and MILNER, 1983; 1986). The practical problem and the lack of a common reclassification standard of the former approach lead us to the latter, which is the trade-weighted average of sub-industry IIT levels. This will minimize the aggregation problem, since it does not cancel out the opposite trade-imbalance signs at a sub-industry level.
In order to minimize the aggregation problem, we use a 6-digit level of the Harmonized Sys-tem nomenclatureTPF
7FPT and then calculate the weighted average of sub-industry IIT levels across
product groups for separate trading partners, countries’ groups and the world as a whole over the observed period.
2.2 The measures of marginal intra-industry trade It is generally assumed that adjustment costs associated with trade liberalization may differ depending upon whether emerging trade can be classified as inter- or intra-industry. Whereas the former implies a reallocation between industries, the latter implies a reallocation within industries and, to the extent that industries are defined in terms of the production space within which factor substitution can be classified as a relatively low cost, has a greater potential for lower adjustment costs.
The limitations of using changes in the standard GL index to capture the dynamics of changes in IIT are widely recognized. Adjustment process should be analyzed using indicators based on marginal trade flows, because adjustment is a strictly dynamic process; knowledge of changes in trade flows is required in order to infer reliable conclusions. By way of contrast, it would be inappropriate to compare static measures at different points in time. For instance, an increase in the IIT measures by the GL index at two points in time might suggest an intra-industry adjustment, although this could be due to an increase in the export of an import-oriented industry.
The first attempt to construct an index of marginal intra-industry trade was made by HAMILTON and KNIEST (1991), who argued that for the purpose of evaluating the adjustment conse-quences of trade expansion it was important to focus on how IIT changes at the margin. They offered an index which effectively calculated the proportion of the changes in exports or im-ports. There are a range of shortcomings associated with the Hamilton-Kniest index, as set out in GREENAWAY et al. (1994) and BRÜLHART (1994) (both of which offer alternatives). At the same time, their fundamental insight is an important one – if we are interested in adjustment, appropriate measures of MIIT are essential.
Some simple and now widely-used measures of MIIT were developed by BRÜLHART (1994). The Brülhart A index is a transposition of GL index to trade changes:
( ) ( ),1
nttntt
nttntt
MMXXMMXX
AMIIT−−
−−
−+−−−−
−== (3)
TP
7 PT TThis approach is similar to TATURUPANET et al. (1997T;T 1999) and TGULLSTRANDT (2002), while TGREENAWAYT et al.
(1994 T; T 1995 T; T 1999) and TCHIARLONE T (2000) useTd T a 5-digit level of SITS, TFONTAGNÉ T et al. (1998) useTd T an T T8-digit level of the Combined Nomenclature, TBLANES T and TMARTIN T (2000) and TMORAT (2002) use the 6-digit level of Combined Nomenclature.
Intra-industry trade in agricultural and food products: The case of Ukraine
11
where n stands for the number of years constituting the relevant adjustment periodTPF
8FPT. This is
also written as:
.1MXMX
AΔ+Δ
Δ−Δ−= (4)
The A index, like the GL index, varies between 0 and 100, where 0 indicates marginal trade in the particular industry to be completely of the inter-industry type, and 100 represents marginal trade to be entirely of the inter-industry type. The A index shares most of the statistical proper-ties of the GL index, a comprehensive description of which is provided in GREENAWAY and MILNER (1986) TPF
9FPT.
When a country’s exports and imports in a particular industry grow or shrink at a similar ab-solute rate (high A), trade-induced adjustment is likely to occur at the intra-industry level, while the overall performance of the industry is determined by factors which tend to affect all countries symmetrically, such as global demand or technology changes. The A index therefore captures the degree of cross-country symmetry in trade changes. Conversely, where a coun-try’s exports and imports in a particular industry show diverging trends (low A), both the trade-induced asymmetrical forces for the geographical inter-industry adjustment and the exoge-nous factors determining the fate of the industry across all countries are likely to be relevant.
A can be summed, as can the GL index, across industries having the same level of statistical disaggregation by applying the following formula for a weighted average:
∑−
=k
iiitot AwA
1, (5)
where ( ).1∑ Δ+Δ
Δ+Δ=
= iiki
iii MX
MXw (6)
Thus, Brülhart’s dynamic index, A, rather than the standard Grubel-Lloyd, is the appropriate indicator of the role played by intra-industry trade during the type of adjustment process evoked by trade liberalization.
The A index (like the GL index) can provide results which are relevant for multilateral studies by relating to overall adjustment pressures. Yet it does not contain any information as to the relative trade performance of industries in particular countries. In terms of net exports, inter-industry adjustment can reflect trade specialization into or out of particular industries. Hence, BRÜLHART (1994) suggested the following index:
,MXMXBΔ+ΔΔ−Δ
= (7)
TP
8 PT TThere existTs T no consensus on the appropriate choice of n. TOLIVERAs T and TTERRAT (1997) have shown that there
is no general relationship between the A index in Ta Tcertain period and the corresponding indices of the constiT-Ttuent sub-periods. An intuitive case could be made for a medium-term interval of, say, two to five years, which is likely to be a realistic time span for inter- and intra-sectoral re-employment of redundant workers.
T9 T OLIVERAS T and TTERRAT (1997) pointed out that two properties ofT theT A index differ from those of Tthe TGL in-dex. First, as was mentioned above, the values of A indices for the sub-periods do not have an unequivocal relationship to the index value for the overall period. Second, there is no general relationship between the A index of a certain industry and the corresponding indices of its sub-industries. ThereforeT, T TOLIVERAS T and TTERRAT recommended that the MIIT be measured for different levels of aggregation and a sensitivity analysis with varying levels of aggregation should be carried out where possible.
Luka, O., Levkovych, I. 12
where .1 AB −=
This coefficient can take values ranging between –100 and 100. It is two-dimensional, contai-ning information about both the proportion of MIIT and country-specific sectoral performance. First, the closer B is to zero, the higher is MIIT, whereas at both –100 and 100 it represents marginal trade as being entirely of the inter-industry type. Second, sectoral performance is defined as the change in exports and imports in relation to each other. When B > 0, ΔX was > ΔM. The opposite holds for B < 0.
Unlike the A index, B cannot be meaningfully aggregated across industries. Therefore, B can-not be used for summary statistics resulting from calculations on a disaggregated level. Its applicability is thus confined to the industry-by-industry assessment of MIIT and performance.
Trade performance is particularly relevant where MIIT is low, that is, where inter-industry change dominates. We say that the marginal intra-industry trade measured using B index can reflect a country’s specialization "into" or "out of" a particular industry. If, in a certain industry, exports expand faster (or contract more slowly) than imports, this means that the country spe-cializes in this particular activity. Accordingly, a country specializes in other industries when the opposite composition of trade exists (BRÜLHART, 1999).
More recent studies attempt to measure changes in marginal intra-industry trade. THOM and MCDOWELL (1999) suggest an alternative method of classifying marginal trade flows conside-ring the existence of differences among traded goods. AZHAR and ELLIOTT (2003) confirm adjustment pressure in accordance with the theoretical underpinning of the smooth adjustment hypothesisTPF
10FPT, and develop a tool that allows the visual representation of changes in trade pat-
ters for any period and at any level of aggregation.
Thus, measures of MIIT are designed to complement the GL index in analyses of trade change and adjustment. A priori reasoning suggests that MIIT relates more directly to structural ad-justment than IIT, since high MIIT entails relatively low factor re-allocation between industries.
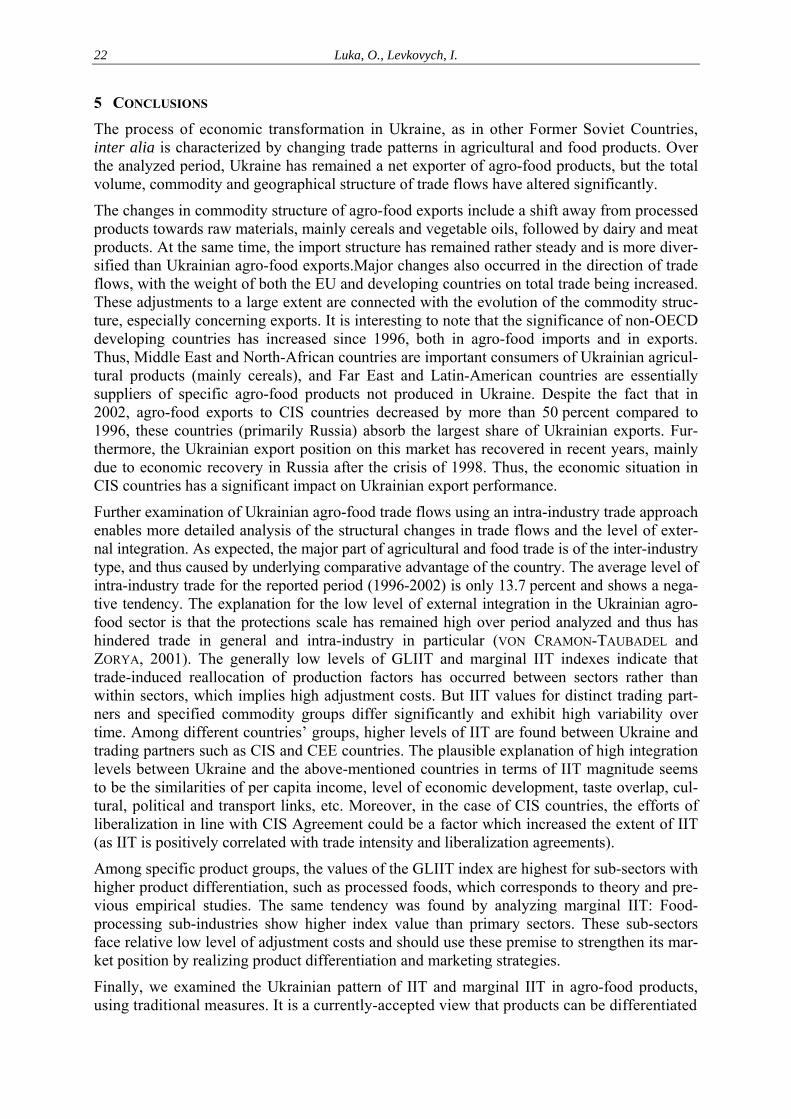
3 THE GENERAL PATTERN OF UKRAINIAN AGRO-FOOD TRADE Agro-food products hold a significant share of Ukraine’s total merchandise export. During the past eight years, agricultural products and foodstuffs have accounted, on average, for 13.2 percent of the country’s total exports. The only exported commodity group that is larger is base metals and their products. However, the share of agro-food products in total mer-chandise export has fluctuated from 21,2 percent in 1996 to only 9.5 percent in 2000 (Figure 1).
PT
10T
PBALASSA T (1966) was the first to mention the smooth adjustment hypothesis (SAH) directly. Over the follo-wing three decadesT, T the SAH has becToTme firmly established. For further discussionT, T see TBRÜLHARTT (1999).
Intra-industry trade in agricultural and food products: The case of Ukraine
13
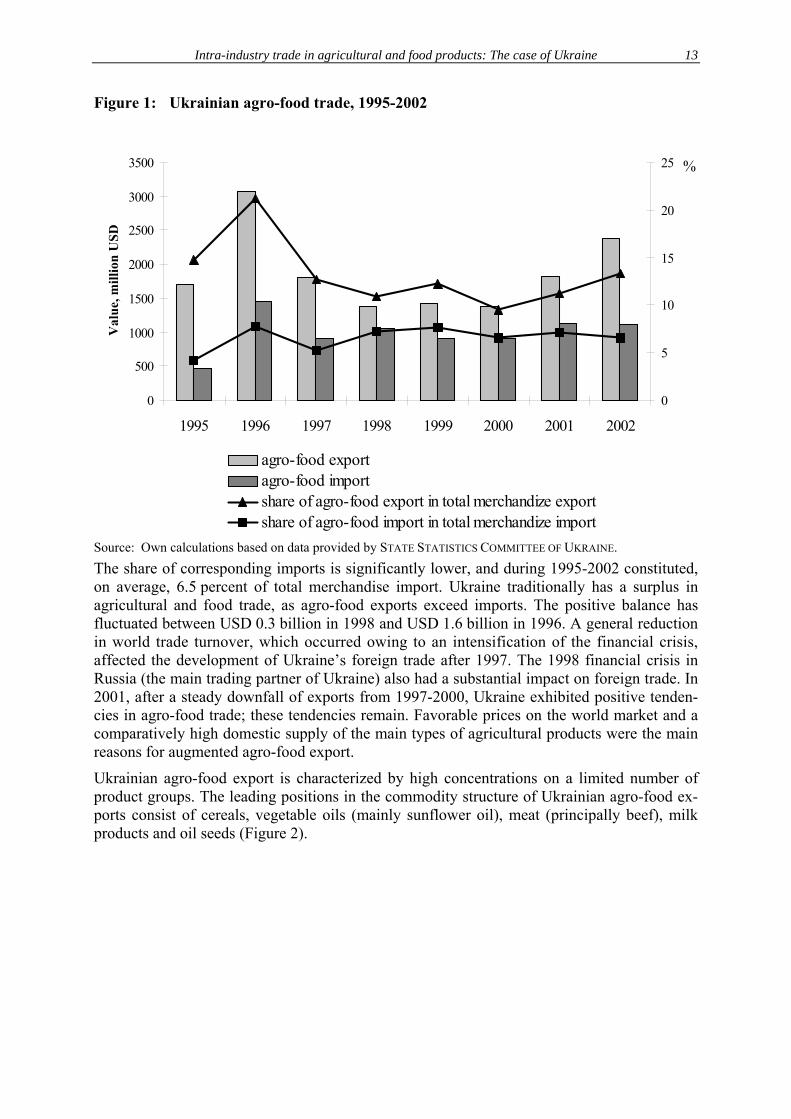
Figure 1: Ukrainian agro-food trade, 1995-2002
Source: Own calculations based on data provided by STATE STATISTICS COMMITTEE OF UKRAINE. The share of corresponding imports is significantly lower, and during 1995-2002 constituted, on average, 6.5 percent of total merchandise import. Ukraine traditionally has a surplus in agricultural and food trade, as agro-food exports exceed imports. The positive balance has fluctuated between USD 0.3 billion in 1998 and USD 1.6 billion in 1996. A general reduction in world trade turnover, which occurred owing to an intensification of the financial crisis, affected the development of Ukraine’s foreign trade after 1997. The 1998 financial crisis in Russia (the main trading partner of Ukraine) also had a substantial impact on foreign trade. In 2001, after a steady downfall of exports from 1997-2000, Ukraine exhibited positive tenden-cies in agro-food trade; these tendencies remain. Favorable prices on the world market and a comparatively high domestic supply of the main types of agricultural products were the main reasons for augmented agro-food export.
Ukrainian agro-food export is characterized by high concentrations on a limited number of product groups. The leading positions in the commodity structure of Ukrainian agro-food ex-ports consist of cereals, vegetable oils (mainly sunflower oil), meat (principally beef), milk products and oil seeds (Figure 2).
0
500
1000
1500
2000
2500
3000
3500
1995 1996 1997 1998 1999 2000 2001 2002
Val
ue, m
illio
n U
SD
0
5
10
15
20
25 %
agro-food exportagro-food importshare of agro-food export in total merchandize exportshare of agro-food import in total merchandize import
Luka, O., Levkovych, I. 14
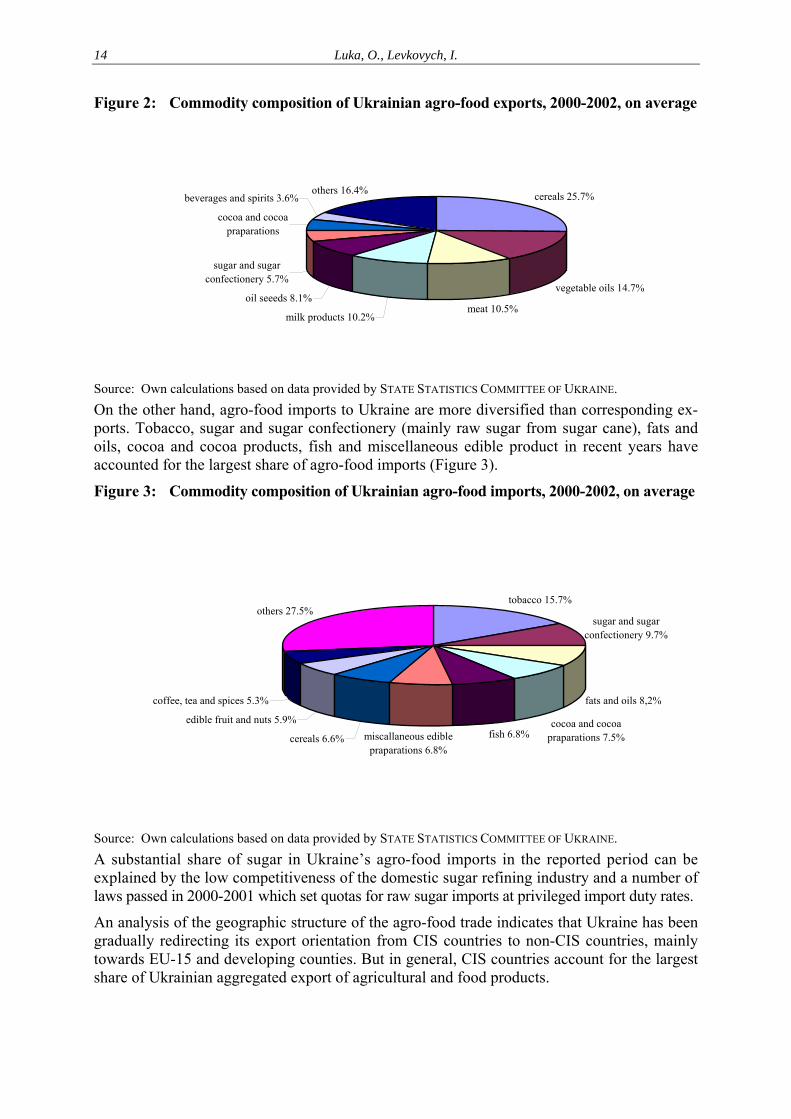
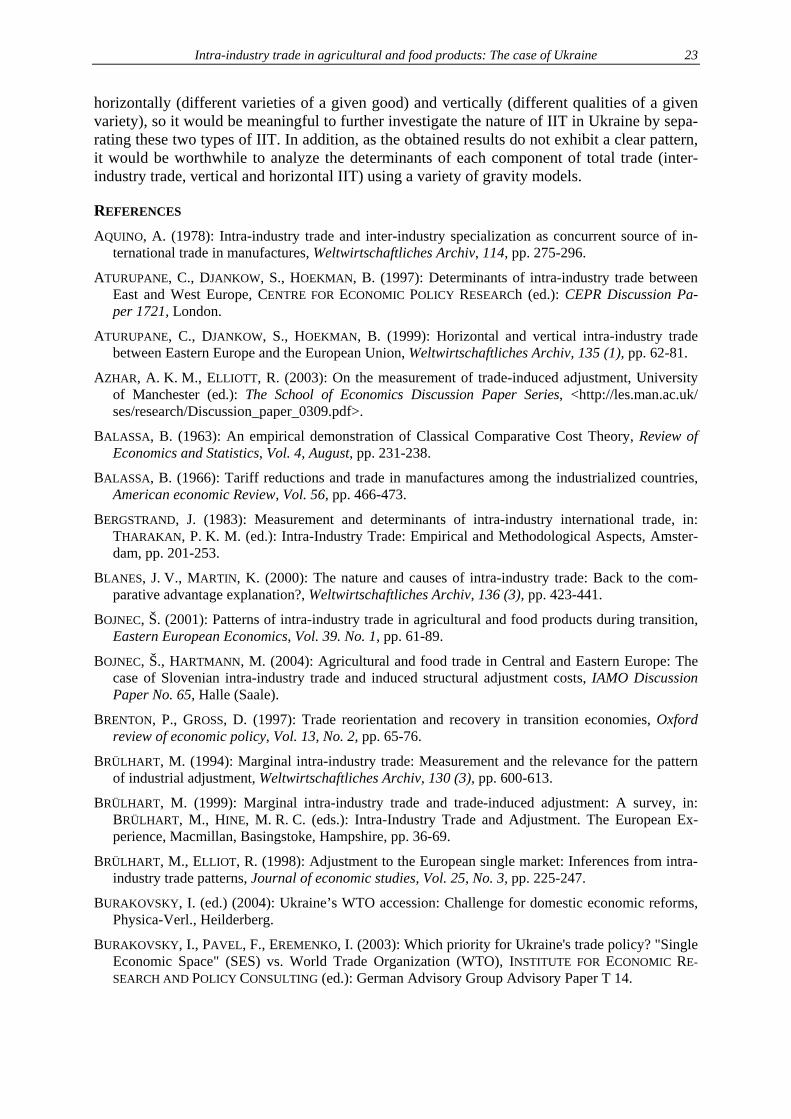
Figure 2: Commodity composition of Ukrainian agro-food exports, 2000-2002, on average
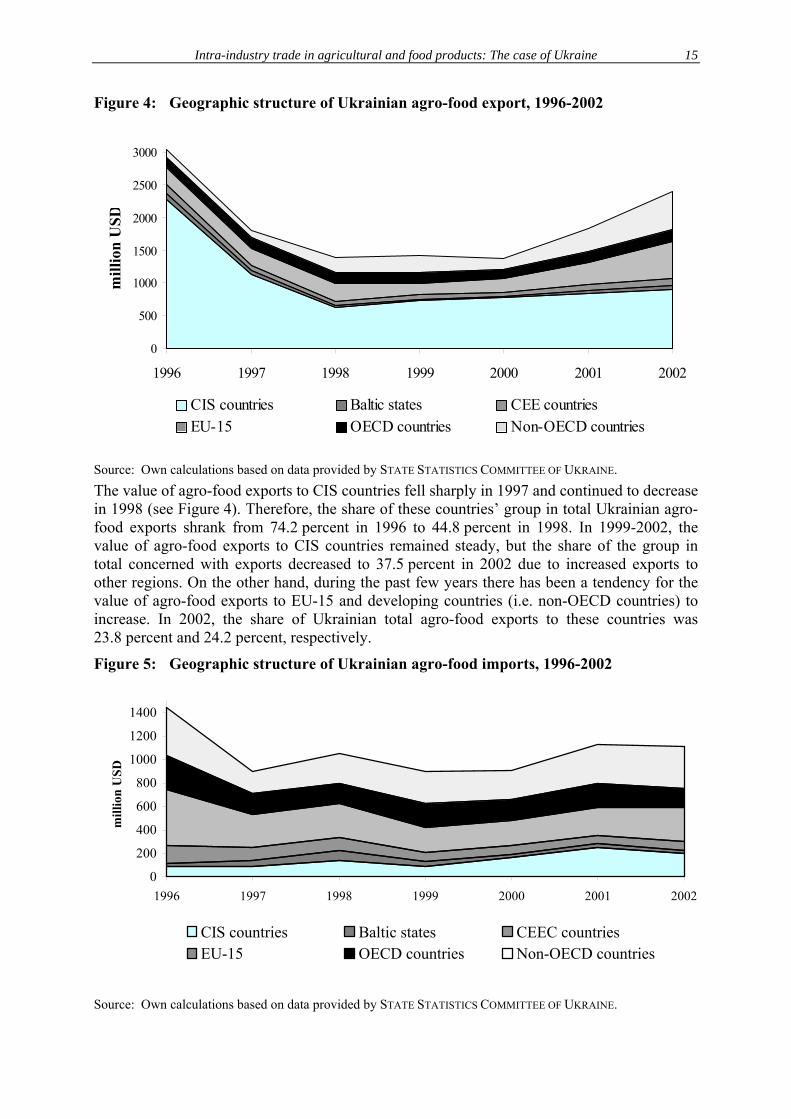
Source: Own calculations based on data provided by STATE STATISTICS COMMITTEE OF UKRAINE. On the other hand, agro-food imports to Ukraine are more diversified than corresponding ex-ports. Tobacco, sugar and sugar confectionery (mainly raw sugar from sugar cane), fats and oils, cocoa and cocoa products, fish and miscellaneous edible product in recent years have accounted for the largest share of agro-food imports (Figure 3).
Figure 3: Commodity composition of Ukrainian agro-food imports, 2000-2002, on average
tobacco 15.7%
sugar and sugar confectionery 9.7%
fats and oils 8,2%
cocoa and cocoa praparations 7.5%fish 6.8%miscallaneous edible
praparations 6.8%cereals 6.6%
edible fruit and nuts 5.9%
coffee, tea and spices 5.3%
others 27.5%
Source: Own calculations based on data provided by STATE STATISTICS COMMITTEE OF UKRAINE. A substantial share of sugar in Ukraine’s agro-food imports in the reported period can be explained by the low competitiveness of the domestic sugar refining industry and a number of laws passed in 2000-2001 which set quotas for raw sugar imports at privileged import duty rates.
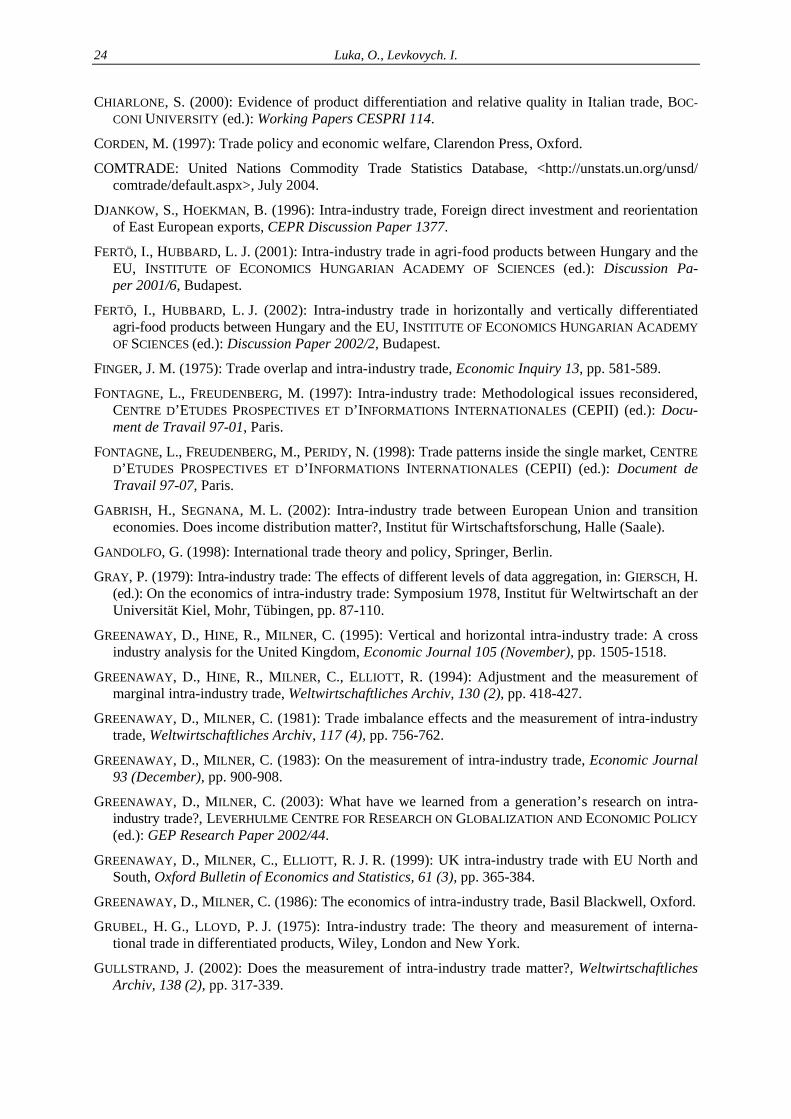
An analysis of the geographic structure of the agro-food trade indicates that Ukraine has been gradually redirecting its export orientation from CIS countries to non-CIS countries, mainly towards EU-15 and developing counties. But in general, CIS countries account for the largest share of Ukrainian aggregated export of agricultural and food products.
cereals 25.7%
vegetable oils 14.7%
meat 10.5%milk products 10.2%
oil seeeds 8.1%
sugar and sugar confectionery 5.7%
cocoa and cocoa praparations
beverages and spirits 3.6%others 16.4%
Intra-industry trade in agricultural and food products: The case of Ukraine
15
0
500
1000
1500
2000
2500
3000
1996 1997 1998 1999 2000 2001 2002
mill
ion
USD
CIS countries Baltic states CEE countriesEU-15 OECD countries Non-OECD countries
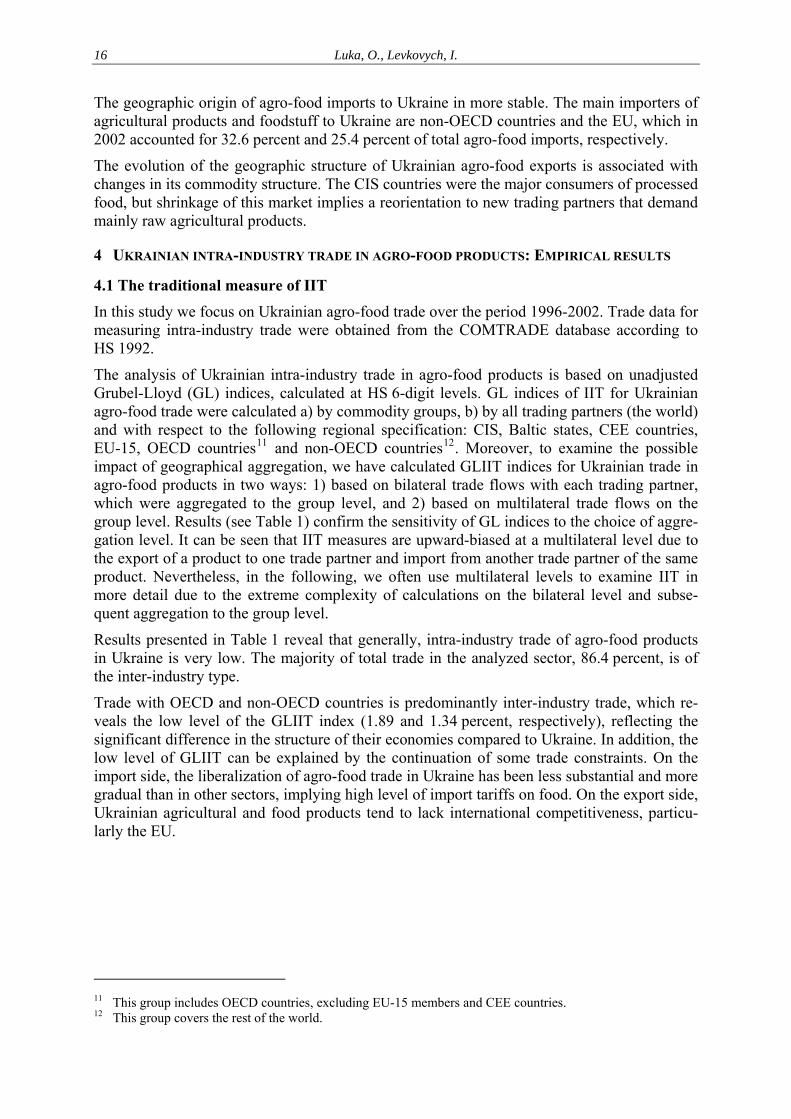
Figure 4: Geographic structure of Ukrainian agro-food export, 1996-2002
Source: Own calculations based on data provided by STATE STATISTICS COMMITTEE OF UKRAINE. The value of agro-food exports to CIS countries fell sharply in 1997 and continued to decrease in 1998 (see Figure 4). Therefore, the share of these countries’ group in total Ukrainian agro-food exports shrank from 74.2 percent in 1996 to 44.8 percent in 1998. In 1999-2002, the value of agro-food exports to CIS countries remained steady, but the share of the group in total concerned with exports decreased to 37.5 percent in 2002 due to increased exports to other regions. On the other hand, during the past few years there has been a tendency for the value of agro-food exports to EU-15 and developing countries (i.e. non-OECD countries) to increase. In 2002, the share of Ukrainian total agro-food exports to these countries was 23.8 percent and 24.2 percent, respectively.
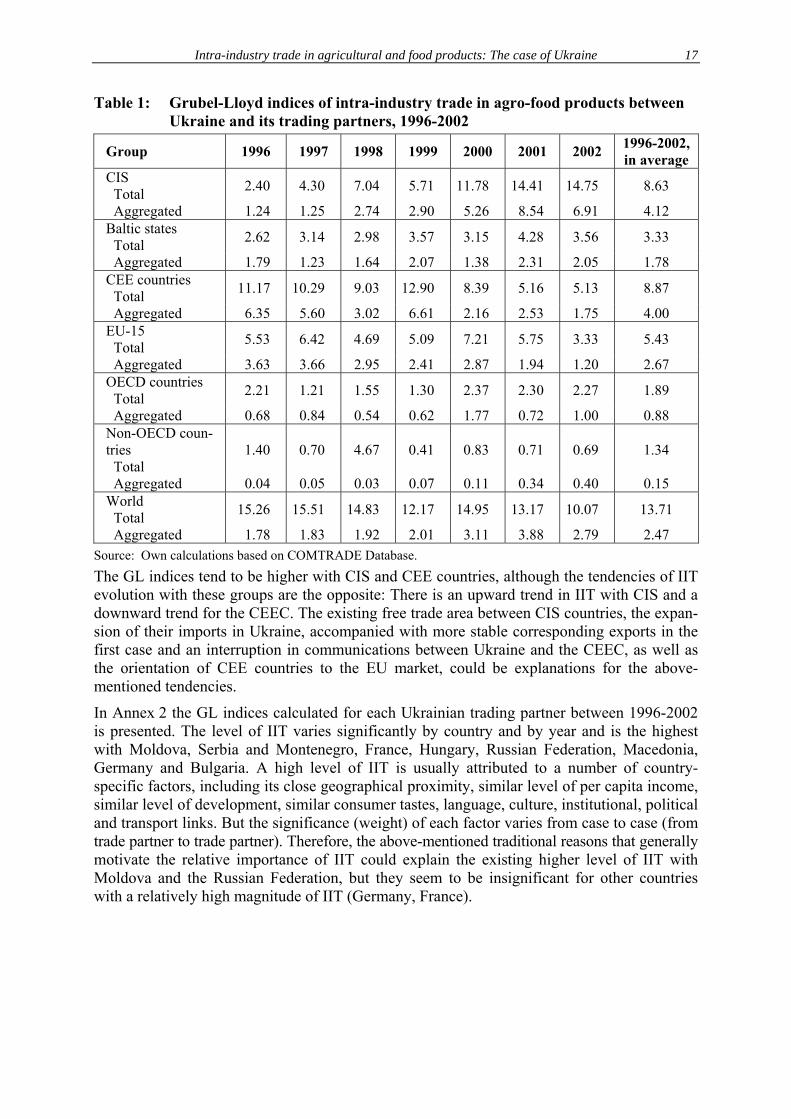
Figure 5: Geographic structure of Ukrainian agro-food imports, 1996-2002
Source: Own calculations based on data provided by STATE STATISTICS COMMITTEE OF UKRAINE.
0
200
400
600
800
1000
1200
1400
1996 1997 1998 1999 2000 2001 2002
mill
ion
USD
CIS countries Baltic states CEEC countriesEU-15 OECD countries Non-OECD countries
Luka, O., Levkovych, I. 16
The geographic origin of agro-food imports to Ukraine in more stable. The main importers of agricultural products and foodstuff to Ukraine are non-OECD countries and the EU, which in 2002 accounted for 32.6 percent and 25.4 percent of total agro-food imports, respectively.
The evolution of the geographic structure of Ukrainian agro-food exports is associated with changes in its commodity structure. The CIS countries were the major consumers of processed food, but shrinkage of this market implies a reorientation to new trading partners that demand mainly raw agricultural products.
4 UKRAINIAN INTRA-INDUSTRY TRADE IN AGRO-FOOD PRODUCTS: EMPIRICAL RESULTS
4.1 The traditional measure of IIT In this study we focus on Ukrainian agro-food trade over the period 1996-2002. Trade data for measuring intra-industry trade were obtained from the COMTRADE database according to HS 1992.
The analysis of Ukrainian intra-industry trade in agro-food products is based on unadjusted Grubel-Lloyd (GL) indices, calculated at HS 6-digit levels. GL indices of IIT for Ukrainian agro-food trade were calculated a) by commodity groups, b) by all trading partners (the world) and with respect to the following regional specification: CIS, Baltic states, CEE countries, EU-15, OECD countriesTPF
11FPT and non-OECD countriesTPF
12FPT. Moreover, to examine the possible
impact of geographical aggregation, we have calculated GLIIT indices for Ukrainian trade in agro-food products in two ways: 1) based on bilateral trade flows with each trading partner, which were aggregated to the group level, and 2) based on multilateral trade flows on the group level. Results (see Table 1) confirm the sensitivity of GL indices to the choice of aggre-gation level. It can be seen that IIT measures are upward-biased at a multilateral level due to the export of a product to one trade partner and import from another trade partner of the same product. Nevertheless, in the following, we often use multilateral levels to examine IIT in more detail due to the extreme complexity of calculations on the bilateral level and subse-quent aggregation to the group level.
Results presented in Table 1 reveal that generally, intra-industry trade of agro-food products in Ukraine is very low. The majority of total trade in the analyzed sector, 86.4 percent, is of the inter-industry type.
Trade with OECD and non-OECD countries is predominantly inter-industry trade, which re-veals the low level of the GLIIT index (1.89 and 1.34 percent, respectively), reflecting the significant difference in the structure of their economies compared to Ukraine. In addition, the low level of GLIIT can be explained by the continuation of some trade constraints. On the import side, the liberalization of agro-food trade in Ukraine has been less substantial and more gradual than in other sectors, implying high level of import tariffs on food. On the export side, Ukrainian agricultural and food products tend to lack international competitiveness, particu-larly the EU.
TP
11PT This group includes OECD countries, excluding EU-15 members and CEE countries.
TP
12PT This group covers the rest of the world.
Intra-industry trade in agricultural and food products: The case of Ukraine
17
Table 1: Grubel-Lloyd indices of intra-industry trade in agro-food products between Ukraine and its trading partners, 1996-2002
Group 1996 1997 1998 1999 2000 2001 2002 1996-2002, in average
CIS Total 2.40 4.30 7.04 5.71 11.78 14.41 14.75 8.63
Aggregated 1.24 1.25 2.74 2.90 5.26 8.54 6.91 4.12 Baltic states
Total 2.62 3.14 2.98 3.57 3.15 4.28 3.56 3.33
Aggregated 1.79 1.23 1.64 2.07 1.38 2.31 2.05 1.78 CEE countries
Total 11.17 10.29 9.03 12.90 8.39 5.16 5.13 8.87
Aggregated 6.35 5.60 3.02 6.61 2.16 2.53 1.75 4.00 EU-15
Total 5.53 6.42 4.69 5.09 7.21 5.75 3.33 5.43
Aggregated 3.63 3.66 2.95 2.41 2.87 1.94 1.20 2.67 OECD countries
Total 2.21 1.21 1.55 1.30 2.37 2.30 2.27 1.89
Aggregated 0.68 0.84 0.54 0.62 1.77 0.72 1.00 0.88 Non-OECD coun-tries
Total 1.40 0.70 4.67 0.41 0.83 0.71 0.69 1.34
Aggregated 0.04 0.05 0.03 0.07 0.11 0.34 0.40 0.15 World
Total 15.26 15.51 14.83 12.17 14.95 13.17 10.07 13.71
Aggregated 1.78 1.83 1.92 2.01 3.11 3.88 2.79 2.47 Source: Own calculations based on COMTRADE Database. The GL indices tend to be higher with CIS and CEE countries, although the tendencies of IIT evolution with these groups are the opposite: There is an upward trend in IIT with CIS and a downward trend for the CEEC. The existing free trade area between CIS countries, the expan-sion of their imports in Ukraine, accompanied with more stable corresponding exports in the first case and an interruption in communications between Ukraine and the CEEC, as well as the orientation of CEE countries to the EU market, could be explanations for the above-mentioned tendencies.
In Annex 2 the GL indices calculated for each Ukrainian trading partner between 1996-2002 is presented. The level of IIT varies significantly by country and by year and is the highest with Moldova, Serbia and Montenegro, France, Hungary, Russian Federation, Macedonia, Germany and Bulgaria. A high level of IIT is usually attributed to a number of country-specific factors, including its close geographical proximity, similar level of per capita income, similar level of development, similar consumer tastes, language, culture, institutional, political and transport links. But the significance (weight) of each factor varies from case to case (from trade partner to trade partner). Therefore, the above-mentioned traditional reasons that generally motivate the relative importance of IIT could explain the existing higher level of IIT with Moldova and the Russian Federation, but they seem to be insignificant for other countries with a relatively high magnitude of IIT (Germany, France).
Luka, O., Levkovych, I. 18
Table 2: Intra-industry trade by commodity groups between Ukraine and all trading partners (the world), 1996-2002
Average HS code 1996 1997 1998 1999 2000 2001 2002 simple weighted01-Live animals 0.54 1.99 3.98 9.55 5.79 11.02 11.16 6.29 3.6402-Meat and edible meat offal 1.97 3.82 4.13 7.18 3.55 3.82 3.82 4.04 3.8503-Fish and fish products TPF
13FPT 34.79 37.84 19.69 9.79 37.15 27.11 26.07 27.49 27.57
04-Dairy, eggs, honey etc. 9.95 17.80 13.20 26.19 6.21 4.11 4.95 11.77 9.3805-Product of animal origin 35.79 45.10 28.73 48.58 20.45 11.93 10.75 28.76 27.3706-Live trees, cut flowers etc. 18.10 8.39 13.13 5.47 4.90 5.50 3.87 8.48 7.0507-Edible vegetables etc. 11.42 4.74 5.33 10.60 9.43 10.56 6.77 8.41 8.2208-Edible fruits, nuts etc. 8.35 3.49 2.61 2.20 1.93 2.36 4.03 3.57 3.7709-Coffee, tee, mate etc. 9.18 8.92 5.24 2.11 2.23 1.88 2.94 4.64 4.1210-Cereals 5.34 3.87 1.09 1.73 32.89 12.19 0.99 8.30 6.0711-Milling products, malt, starches 7.01 7.86 6.22 3.52 5.78 3.90 9.35 6.23 6.5212-Oil seeds, seeds etc. 13.09 13.05 12.62 14.96 11.70 11.47 39.29 16.60 14.0213-Lac, gums, resins etc. 22.68 15.73 16.40 14.66 13.00 8.09 3.97 13.50 14.7214-Vegetable plaiting materials 7.39 3.16 8.39 16.73 29.02 14.04 3.12 11.69 8.8315-Animal or vegetable fats etc. 9.09 10.00 17.51 7.06 0.80 1.22 1.50 6.74 5.4716-Preparations of meat, of fish 14.64 7.38 24.41 27.29 18.12 57.69 49.72 28.46 21.2417-Sugars and sugar confectionery 16.51 8.77 17.82 8.63 14.20 11.08 24.61 14.52 14.9218-Cacao and cacao preparations 26.05 12.62 16.51 12.82 12.77 13.97 7.90 14.66 13.3019-Preparations of cereals, flour 51.23 42.03 30.28 30.06 23.86 28.77 29.03 33.61 36.4520-Preparations of vegetables etc. 41.92 32.85 28.17 25.18 21.40 24.28 21.01 27.83 28.4421-Miscellaneous edible preparation 16.81 18.20 11.38 8.51 10.69 21.36 18.06 15.00 15.9622-Beverages, spirits and vinegar 19.07 35.20 32.71 23.39 25.57 40.64 31.62 29.74 26.8523-Residues from food industry etc. 15.41 43.32 33.06 38.88 17.05 10.57 10.48 24.11 17.9224-Tobacco etc. 39.56 27.77 25.69 38.51 31.62 32.92 26.79 31.84 31.5801-15 Total agricultural products 9.44 11.34 9.53 6.96 11.67 7.82 4.28 8.72 8.4316-24 Total food products 21.06 20.81 24.10 23.04 20.57 22.98 21.38 21.99 21.7801-24 Total agro-food products 15.26 15.51 14.83 12.17 14.95 13.17 10.07 13.71 13.68
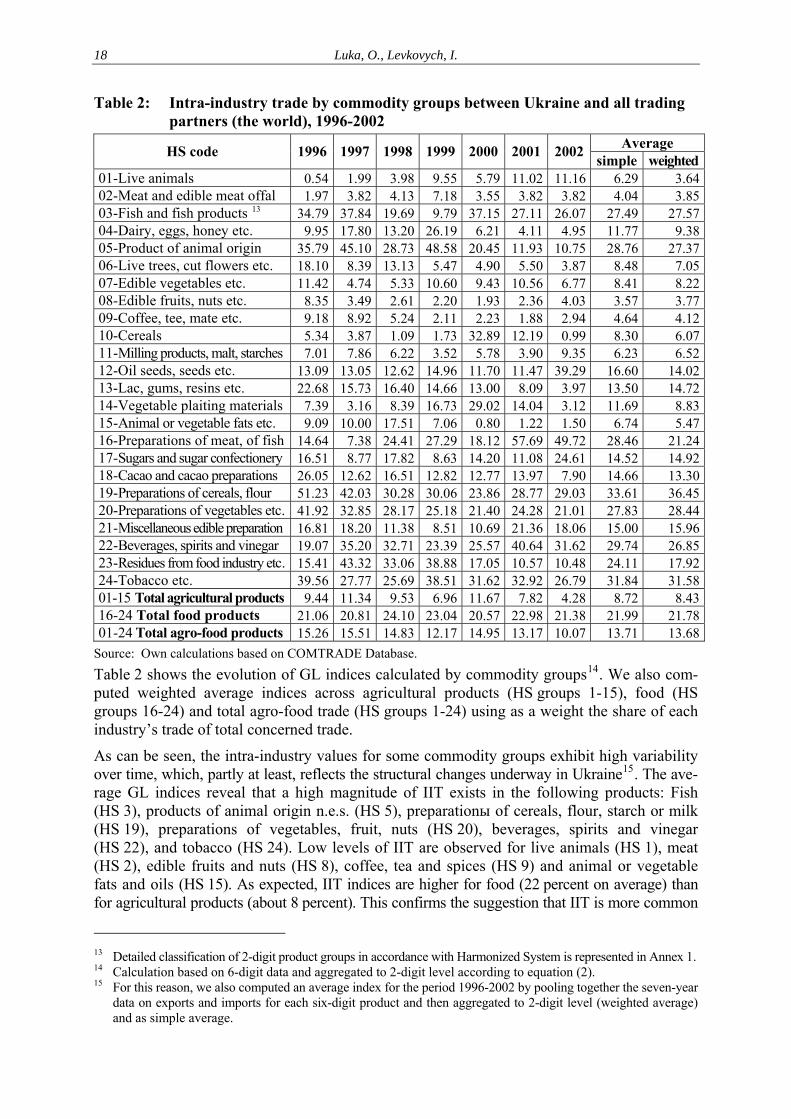
Source: Own calculations based on COMTRADE Database. Table 2 shows the evolution of GL indices calculated by commodity groupsTPF
14FPT. We also com-
puted weighted average indices across agricultural products (HS groups 1-15), food (HS groups 16-24) and total agro-food trade (HS groups 1-24) using as a weight the share of each industry’s trade of total concerned trade.
As can be seen, the intra-industry values for some commodity groups exhibit high variability over time, which, partly at least, reflects the structural changes underway in UkraineTPF
15FPT. The ave-
rage GL indices reveal that a high magnitude of IIT exists in the following products: Fish (HS 3), products of animal origin n.e.s. (HS 5), preparationы of cereals, flour, starch or milk (HS 19), preparations of vegetables, fruit, nuts (HS 20), beverages, spirits and vinegar (HS 22), and tobacco (HS 24). Low levels of IIT are observed for live animals (HS 1), meat (HS 2), edible fruits and nuts (HS 8), coffee, tea and spices (HS 9) and animal or vegetable fats and oils (HS 15). As expected, IIT indices are higher for food (22 percent on average) than for agricultural products (about 8 percent). This confirms the suggestion that IIT is more common
TP
13PT Detailed classification of 2-digit product groups in accordance with Harmonized System is represented in Annex 1.
TP
14PT Calculation based on 6-digit data and aggregated to 2-digit level according to equation (2).
TP
15PT For this reason, we also computed an average index for the period 1996-2002 by pooling together the seven-year
data on exports and imports for each six-digit product and then aggregated to 2-digit level (weighted average) and as simple average.
Intra-industry trade in agricultural and food products: The case of Ukraine
19
in sectors with significant production differentiation, and is insignificant in sectors with stan-dardized products, such as natural resources and agricultural products, where most trade is inter-industry (KANDOGAN, 2003b). It is also important to note that during the reported period, average indices of IIT for food were rather stable, while at the same time, indices for agricultural products fluctuated significantly, from 4.28 percent in 2002 to 11.67 percent in 2000. These results correspond to the commodity structure of Ukrainian trade in agricultural products. As mentioned above, Ukraine has a high concentration of agro-food exports on a limited number of products, with a prevailing share of cereals, trade in which is caused by the country’s comparative advan-tage. In 2002, the share of cereals in Ukrainian agro-food exports was the highest compared to other examined years (41.8 percent of total agro-food exports). Consequently, the level of IIT was the lowest. In 2000, the situation was the opposite: Ukraine had the lowest level of grain exports (with significant corresponding imports) and, as a result, the highest level of IIT in agri-cultural products.
Altogether, IIT indices for agro-food products were low and fluctuated from 10.07 in 2002 to 15.51 in 1997. Thus, there is no strict trend in the IIT evolution, although GL indices tend to be lower in recent years than in the first sample years. This is contrary to the development of agro-food trade in CEE countries, where there is a distinct upward trend in IIT (BOJNEC, 2001; FERTÖ and HUBBARD, 2001; 2002; BOJNEC and HARTMANN, 2004).
We also calculated GL indices by commodity group based on multilateral trade flows on the specified groups’ level (Annex 3). It is interesting that IIT with CIS countries, Baltic States and OECD countries corresponds to the overall tendency to a higher level of GL indices for food, but agro-food trade with the EU-15 is characterized by higher IIT in agricultural products. IIT trade in agricultural and food products with CEE countries is more or less equal, and it is insignificant with non-OECD countries.
4.2 Marginal intra-industry trade The analysis has so far been based on indices which measure the extent of IIT as a proportion of total trade at a given point of time. But changes in the GL index may not capture potential adjustment costs, and measures of marginal intra-industry trade (MIIT) can, therefore, be used to complement traditional IIT analysis. MIIT was quantified in this study according to BRÜLHALT’s (1994) A and B indices.
We have calculated A indices for agro-food products from HS 6-digit trade figures over the periods 1996-1999 and 1999-2002 based on multilateral trade flows at the specified groups’ level (Table 3). The highest share of marginal IIT is revealed for CIS countries over the period 1999-2002. For other trade partners was the level of marginal IIT less relevant over both pe-riod (excepting CEE countries over period 1996-1999). The generally low level of A indices (close to zero) indicates that most of change occurring in trade flows has been inter-industry by nature and therefore very likely have induced high adjustment costs.
Table 3: Marginal intra-industry trade in agro-food products in Ukraine, by trade partners, 1996-2002 (A indices)
Countries’ group 1996-1999 1999-2002 CIS countries 1.7 9.9 Baltic states 0.4 0.9 CEE countries 7.5 4.5 EU-15 4.7 1.7 OECD countries 2.0 1.4 Non-OECD countries 3.8 0.9 World total 9.6 7.6
Source: Own calculations based on COMTRADE Database.
Luka, O., Levkovych, I. 20
If we look at average A indices across HS 2-digit sectors, we find that MIIT patterns resemble those of IIT in so far as food-processing industries exhibit consistently higher average index value than primary sectors (Annex 4). The highest levels of MIIT for the period 1996-1999 are found in HS sections 3 (fish), 20 (preparations of vegetables, fruits and nuts) and 19 (preparations of cereals, flour, starch or milk); for the period 1999-2002 the highest A levels are for the HS 17 (sugars and sugars confectionery), HS 24 (tobacco) and HS 19 (preparations of cereals, flour, starch or milk) sections.
The BRÜLHALT’S (1994) B index is used as a measure of sectoral trade performance and MIIT. As was mentioned above, one of the main shortcomings of B index is that it cannot be meaningfully aggregated across products. Possible way to overcome this problem and obtain the summary statistic results from the calculations on the disaggregated product i level is to sum up separately the number of products with different categories of B indices. In Table 4 we classify 6-digit sectors of Ukrainian agricultural and food processing industries into four groups according to the size and the sign of this index. The first groupTPF
16FPT includes products
where –100 ≤ B < –50 and refers to products with bad performance, where marginal trade is mainly of inter-industry type. The second group (–50 ≤ B < 0) includes products where mar-ginal IIT dominates, and the negative sign of B index indicates a weak performance of these products. The third (0 ≤ B < 50) and forth (50 ≤ B < 100) groups cover those products that reflect a good trade performance, however, while the third group characterizes products where marginal IIT prevails, the vise versa holds for the forth group.
The grouped analysis of marginal IIT applying B measure is performed for Ukrainian agro-food trade with CIS, Baltic states, CEEC, EU, OECD and non-OECD countries, and with all countries (world total). As can be seen from the Table 4, the majority of products display B indices close to –100 or 100, hence low MIIT. This applies to the trade relations with the world and all trading partners.
Looking at the trade performance measured by B indices, we find that the majority of products displayed negative B values vis-à-vis the Former Soviet Union countries over the both examined periods indicating that there have been more agricultural and food products with a weak per-formance. In the trade with European and OECD countries, however, a narrow majority of industries displayed positive B indices. These results document declining trade competitive-ness in traditional markets (CIS countries and Baltic states) and a reorientation of Ukrainian agro-food export towards new trading partners.
Table 4: Allocation of B indeces of marginal IIT for Ukrainian agro-food trade by trade partners, 1996-2002
1996-1999 1999-2002 Group I II III IV I II III IV CIS 302 16 13 147 214 20 16 199 Baltic states 180 3 6 116 107 3 6 154 CEE countries 169 7 11 276 177 11 14 198 EU-15 189 8 12 321 235 10 8 244 OECD countries 163 4 3 266 180 8 15 204 Non-OECD countries 268 15 11 251 248 2 14 268 World total 280 38 39 285 311 26 29 262
Source: Own calculations based on COMTRADE Database.
TP
16PT Groups are defined as I,II, III, IV in Table 4.
Intra-industry trade in agricultural and food products: The case of Ukraine
21
00.20.40.60.8
11.21.41.61.8
CIS Baltic states CEEC EU-15 OECD Non-OECDcountries
World total
B r
atio
1996-1999 1999-2002
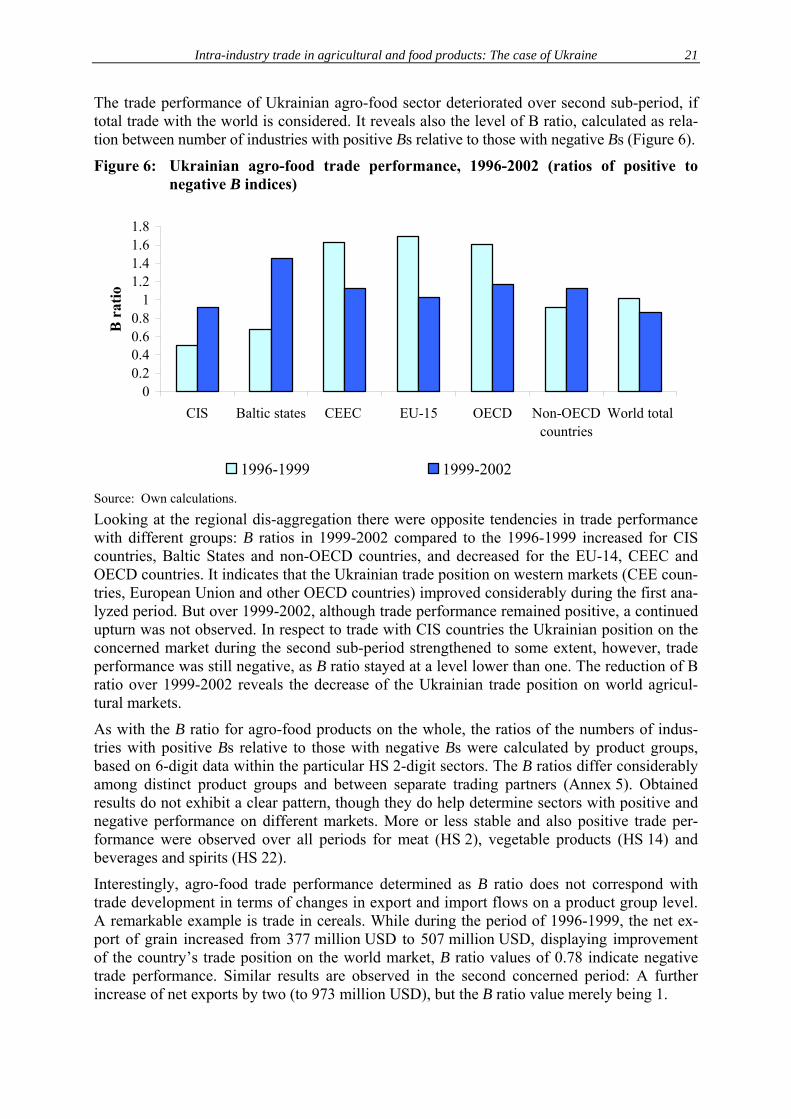
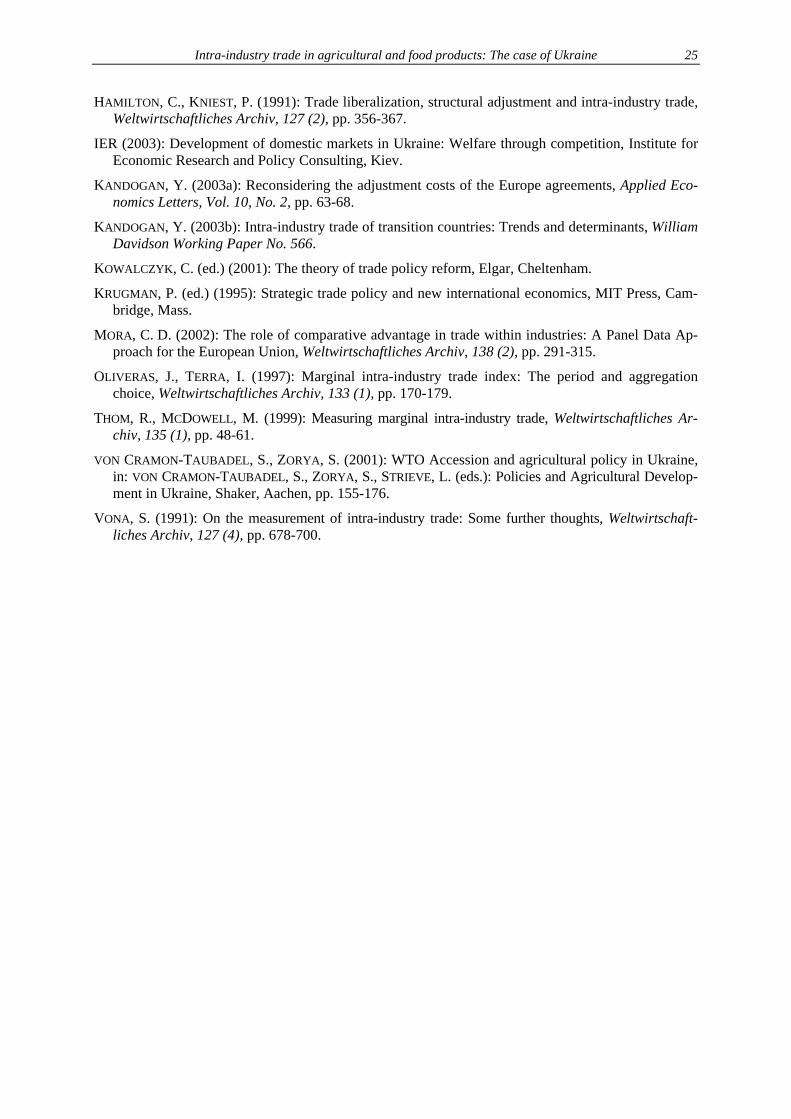
The trade performance of Ukrainian agro-food sector deteriorated over second sub-period, if total trade with the world is considered. It reveals also the level of B ratio, calculated as rela-tion between number of industries with positive Bs relative to those with negative Bs (Figure 6).
Figure 6: Ukrainian agro-food trade performance, 1996-2002 (ratios of positive to negative B indices)
Source: Own calculations. Looking at the regional dis-aggregation there were opposite tendencies in trade performance with different groups: B ratios in 1999-2002 compared to the 1996-1999 increased for CIS countries, Baltic States and non-OECD countries, and decreased for the EU-14, CEEC and OECD countries. It indicates that the Ukrainian trade position on western markets (CEE coun-tries, European Union and other OECD countries) improved considerably during the first ana-lyzed period. But over 1999-2002, although trade performance remained positive, a continued upturn was not observed. In respect to trade with CIS countries the Ukrainian position on the concerned market during the second sub-period strengthened to some extent, however, trade performance was still negative, as B ratio stayed at a level lower than one. The reduction of B ratio over 1999-2002 reveals the decrease of the Ukrainian trade position on world agricul-tural markets.
As with the B ratio for agro-food products on the whole, the ratios of the numbers of indus-tries with positive Bs relative to those with negative Bs were calculated by product groups, based on 6-digit data within the particular HS 2-digit sectors. The B ratios differ considerably among distinct product groups and between separate trading partners (Annex 5). Obtained results do not exhibit a clear pattern, though they do help determine sectors with positive and negative performance on different markets. More or less stable and also positive trade per-formance were observed over all periods for meat (HS 2), vegetable products (HS 14) and beverages and spirits (HS 22).
Interestingly, agro-food trade performance determined as B ratio does not correspond with trade development in terms of changes in export and import flows on a product group level. A remarkable example is trade in cereals. While during the period of 1996-1999, the net ex-port of grain increased from 377 million USD to 507 million USD, displaying improvement of the country’s trade position on the world market, B ratio values of 0.78 indicate negative trade performance. Similar results are observed in the second concerned period: A further increase of net exports by two (to 973 million USD), but the B ratio value merely being 1.
Luka, O., Levkovych, I. 22
5 CONCLUSIONS The process of economic transformation in Ukraine, as in other Former Soviet Countries, inter alia is characterized by changing trade patterns in agricultural and food products. Over the analyzed period, Ukraine has remained a net exporter of agro-food products, but the total volume, commodity and geographical structure of trade flows have altered significantly.
The changes in commodity structure of agro-food exports include a shift away from processed products towards raw materials, mainly cereals and vegetable oils, followed by dairy and meat products. At the same time, the import structure has remained rather steady and is more diver-sified than Ukrainian agro-food exports.Major changes also occurred in the direction of trade flows, with the weight of both the EU and developing countries on total trade being increased. These adjustments to a large extent are connected with the evolution of the commodity struc-ture, especially concerning exports. It is interesting to note that the significance of non-OECD developing countries has increased since 1996, both in agro-food imports and in exports. Thus, Middle East and North-African countries are important consumers of Ukrainian agricul-tural products (mainly cereals), and Far East and Latin-American countries are essentially suppliers of specific agro-food products not produced in Ukraine. Despite the fact that in 2002, agro-food exports to CIS countries decreased by more than 50 percent compared to 1996, these countries (primarily Russia) absorb the largest share of Ukrainian exports. Fur-thermore, the Ukrainian export position on this market has recovered in recent years, mainly due to economic recovery in Russia after the crisis of 1998. Thus, the economic situation in CIS countries has a significant impact on Ukrainian export performance.
Further examination of Ukrainian agro-food trade flows using an intra-industry trade approach enables more detailed analysis of the structural changes in trade flows and the level of exter-nal integration. As expected, the major part of agricultural and food trade is of the inter-industry type, and thus caused by underlying comparative advantage of the country. The average level of intra-industry trade for the reported period (1996-2002) is only 13.7 percent and shows a nega-tive tendency. The explanation for the low level of external integration in the Ukrainian agro-food sector is that the protections scale has remained high over period analyzed and thus has hindered trade in general and intra-industry in particular (VON CRAMON-TAUBADEL and ZORYA, 2001). The generally low levels of GLIIT and marginal IIT indexes indicate that trade-induced reallocation of production factors has occurred between sectors rather than within sectors, which implies high adjustment costs. But IIT values for distinct trading part-ners and specified commodity groups differ significantly and exhibit high variability over time. Among different countries’ groups, higher levels of IIT are found between Ukraine and trading partners such as CIS and CEE countries. The plausible explanation of high integration levels between Ukraine and the above-mentioned countries in terms of IIT magnitude seems to be the similarities of per capita income, level of economic development, taste overlap, cul-tural, political and transport links, etc. Moreover, in the case of CIS countries, the efforts of liberalization in line with CIS Agreement could be a factor which increased the extent of IIT (as IIT is positively correlated with trade intensity and liberalization agreements).
Among specific product groups, the values of the GLIIT index are highest for sub-sectors with higher product differentiation, such as processed foods, which corresponds to theory and pre-vious empirical studies. The same tendency was found by analyzing marginal IIT: Food-processing sub-industries show higher index value than primary sectors. These sub-sectors face relative low level of adjustment costs and should use these premise to strengthen its mar-ket position by realizing product differentiation and marketing strategies.
Finally, we examined the Ukrainian pattern of IIT and marginal IIT in agro-food products, using traditional measures. It is a currently-accepted view that products can be differentiated
Intra-industry trade in agricultural and food products: The case of Ukraine 23
horizontally (different varieties of a given good) and vertically (different qualities of a given variety), so it would be meaningful to further investigate the nature of IIT in Ukraine by sepa-rating these two types of IIT. In addition, as the obtained results do not exhibit a clear pattern, it would be worthwhile to analyze the determinants of each component of total trade (inter-industry trade, vertical and horizontal IIT) using a variety of gravity models.
REFERENCES AQUINO, A. (1978): Intra-industry trade and inter-industry specialization as concurrent source of in-
ternational trade in manufactures, Weltwirtschaftliches Archiv, 114, pp. 275-296.
ATURUPANE, C., DJANKOW, S., HOEKMAN, B. (1997): Determinants of intra-industry trade between East and West Europe, CENTRE FOR ECONOMIC POLICY RESEARCh (ed.): CEPR Discussion Pa-per 1721, London.
ATURUPANE, C., DJANKOW, S., HOEKMAN, B. (1999): Horizontal and vertical intra-industry trade between Eastern Europe and the European Union, Weltwirtschaftliches Archiv, 135 (1), pp. 62-81.
AZHAR, A. K. M., ELLIOTT, R. (2003): On the measurement of trade-induced adjustment, University of Manchester (ed.): The School of Economics Discussion Paper Series, <http://les.man.ac.uk/ ses/research/Discussion_paper_0309.pdf>.
BALASSA, B. (1963): An empirical demonstration of Classical Comparative Cost Theory, Review of Economics and Statistics, Vol. 4, August, pp. 231-238.
BALASSA, B. (1966): Tariff reductions and trade in manufactures among the industrialized countries, American economic Review, Vol. 56, pp. 466-473.
BERGSTRAND, J. (1983): Measurement and determinants of intra-industry international trade, in: THARAKAN, P. K. M. (ed.): Intra-Industry Trade: Empirical and Methodological Aspects, Amster-dam, pp. 201-253.
BLANES, J. V., MARTIN, K. (2000): The nature and causes of intra-industry trade: Back to the com-parative advantage explanation?, Weltwirtschaftliches Archiv, 136 (3), pp. 423-441.
BOJNEC, Š. (2001): Patterns of intra-industry trade in agricultural and food products during transition, Eastern European Economics, Vol. 39. No. 1, pp. 61-89.
BOJNEC, Š., HARTMANN, M. (2004): Agricultural and food trade in Central and Eastern Europe: The case of Slovenian intra-industry trade and induced structural adjustment costs, IAMO Discussion Paper No. 65, Halle (Saale).
BRENTON, P., GROSS, D. (1997): Trade reorientation and recovery in transition economies, Oxford review of economic policy, Vol. 13, No. 2, pp. 65-76.
BRÜLHART, M. (1994): Marginal intra-industry trade: Measurement and the relevance for the pattern of industrial adjustment, Weltwirtschaftliches Archiv, 130 (3), pp. 600-613.
BRÜLHART, M. (1999): Marginal intra-industry trade and trade-induced adjustment: A survey, in: BRÜLHART, M., HINE, M. R. C. (eds.): Intra-Industry Trade and Adjustment. The European Ex-perience, Macmillan, Basingstoke, Hampshire, pp. 36-69.
BRÜLHART, M., ELLIOT, R. (1998): Adjustment to the European single market: Inferences from intra-industry trade patterns, Journal of economic studies, Vol. 25, No. 3, pp. 225-247.
BURAKOVSKY, I. (ed.) (2004): Ukraine’s WTO accession: Challenge for domestic economic reforms, Physica-Verl., Heilderberg.
BURAKOVSKY, I., PAVEL, F., EREMENKO, I. (2003): Which priority for Ukraine's trade policy? "Single Economic Space" (SES) vs. World Trade Organization (WTO), INSTITUTE FOR ECONOMIC RE-SEARCH AND POLICY CONSULTING (ed.): German Advisory Group Advisory Paper T 14.
Luka, O., Levkovych. I. 24
CHIARLONE, S. (2000): Evidence of product differentiation and relative quality in Italian trade, BOC-CONI UNIVERSITY (ed.): Working Papers CESPRI 114.
CORDEN, M. (1997): Trade policy and economic welfare, Clarendon Press, Oxford.
COMTRADE: United Nations Commodity Trade Statistics Database, <http://unstats.un.org/unsd/ comtrade/default.aspx>, July 2004.
DJANKOW, S., HOEKMAN, B. (1996): Intra-industry trade, Foreign direct investment and reorientation of East European exports, CEPR Discussion Paper 1377.
FERTÖ, I., HUBBARD, L. J. (2001): Intra-industry trade in agri-food products between Hungary and the EU, INSTITUTE OF ECONOMICS HUNGARIAN ACADEMY OF SCIENCES (ed.): Discussion Pa-per 2001/6, Budapest.
FERTÖ, I., HUBBARD, L. J. (2002): Intra-industry trade in horizontally and vertically differentiated agri-food products between Hungary and the EU, INSTITUTE OF ECONOMICS HUNGARIAN ACADEMY OF SCIENCES (ed.): Discussion Paper 2002/2, Budapest.
FINGER, J. M. (1975): Trade overlap and intra-industry trade, Economic Inquiry 13, pp. 581-589.
FONTAGNE, L., FREUDENBERG, M. (1997): Intra-industry trade: Methodological issues reconsidered, CENTRE D’ETUDES PROSPECTIVES ET D’INFORMATIONS INTERNATIONALES (CEPII) (ed.): Docu-ment de Travail 97-01, Paris.
FONTAGNE, L., FREUDENBERG, M., PERIDY, N. (1998): Trade patterns inside the single market, CENTRE D’ETUDES PROSPECTIVES ET D’INFORMATIONS INTERNATIONALES (CEPII) (ed.): Document de Travail 97-07, Paris.
GABRISH, H., SEGNANA, M. L. (2002): Intra-industry trade between European Union and transition economies. Does income distribution matter?, Institut für Wirtschaftsforschung, Halle (Saale).
GANDOLFO, G. (1998): International trade theory and policy, Springer, Berlin.
GRAY, P. (1979): Intra-industry trade: The effects of different levels of data aggregation, in: GIERSCH, H. (ed.): On the economics of intra-industry trade: Symposium 1978, Institut für Weltwirtschaft an der Universität Kiel, Mohr, Tübingen, pp. 87-110.
GREENAWAY, D., HINE, R., MILNER, C. (1995): Vertical and horizontal intra-industry trade: A cross industry analysis for the United Kingdom, Economic Journal 105 (November), pp. 1505-1518.
GREENAWAY, D., HINE, R., MILNER, C., ELLIOTT, R. (1994): Adjustment and the measurement of marginal intra-industry trade, Weltwirtschaftliches Archiv, 130 (2), pp. 418-427.
GREENAWAY, D., MILNER, C. (1981): Trade imbalance effects and the measurement of intra-industry trade, Weltwirtschaftliches Archiv, 117 (4), pp. 756-762.
GREENAWAY, D., MILNER, C. (1983): On the measurement of intra-industry trade, Economic Journal 93 (December), pp. 900-908.
GREENAWAY, D., MILNER, C. (2003): What have we learned from a generation’s research on intra-industry trade?, LEVERHULME CENTRE FOR RESEARCH ON GLOBALIZATION AND ECONOMIC POLICY (ed.): GEP Research Paper 2002/44.
GREENAWAY, D., MILNER, C., ELLIOTT, R. J. R. (1999): UK intra-industry trade with EU North and South, Oxford Bulletin of Economics and Statistics, 61 (3), pp. 365-384.
GREENAWAY, D., MILNER, C. (1986): The economics of intra-industry trade, Basil Blackwell, Oxford.
GRUBEL, H. G., LLOYD, P. J. (1975): Intra-industry trade: The theory and measurement of interna-tional trade in differentiated products, Wiley, London and New York.
GULLSTRAND, J. (2002): Does the measurement of intra-industry trade matter?, Weltwirtschaftliches Archiv, 138 (2), pp. 317-339.
Intra-industry trade in agricultural and food products: The case of Ukraine 25
HAMILTON, C., KNIEST, P. (1991): Trade liberalization, structural adjustment and intra-industry trade, Weltwirtschaftliches Archiv, 127 (2), pp. 356-367.
IER (2003): Development of domestic markets in Ukraine: Welfare through competition, Institute for Economic Research and Policy Consulting, Kiev.
KANDOGAN, Y. (2003a): Reconsidering the adjustment costs of the Europe agreements, Applied Eco-nomics Letters, Vol. 10, No. 2, pp. 63-68.
KANDOGAN, Y. (2003b): Intra-industry trade of transition countries: Trends and determinants, William Davidson Working Paper No. 566.
KOWALCZYK, C. (ed.) (2001): The theory of trade policy reform, Elgar, Cheltenham.
KRUGMAN, P. (ed.) (1995): Strategic trade policy and new international economics, MIT Press, Cam-bridge, Mass.
MORA, C. D. (2002): The role of comparative advantage in trade within industries: A Panel Data Ap-proach for the European Union, Weltwirtschaftliches Archiv, 138 (2), pp. 291-315.
OLIVERAS, J., TERRA, I. (1997): Marginal intra-industry trade index: The period and aggregation choice, Weltwirtschaftliches Archiv, 133 (1), pp. 170-179.
THOM, R., MCDOWELL, M. (1999): Measuring marginal intra-industry trade, Weltwirtschaftliches Ar-chiv, 135 (1), pp. 48-61.
VON CRAMON-TAUBADEL, S., ZORYA, S. (2001): WTO Accession and agricultural policy in Ukraine, in: VON CRAMON-TAUBADEL, S., ZORYA, S., STRIEVE, L. (eds.): Policies and Agricultural Develop-ment in Ukraine, Shaker, Aachen, pp. 155-176.
VONA, S. (1991): On the measurement of intra-industry trade: Some further thoughts, Weltwirtschaft-liches Archiv, 127 (4), pp. 678-700.
Luka, O., Levkovych, I. 26
ANNEXES
Annex 1: Classification of 2-digit product groups according to Harmonized Commodity Description and Coding System, revision 1992
HS group Group heading 1. Live animals 2. Meat and edible meat offal 3. Fish, crustacean, mollusk, aquatic invertebrate 4. Dairy products, bird eggs, honey, edible animal products 5. Product of animal origin, not elsewhere specified 6. Live trees, plants; bulbs, roots, cut flowers etc 7. Edible vegetables and certain roots and tubers 8. Edible fruit, nuts, peel of citrus fruits, melons 9. Coffee, tea, maté and spices 10. Cereals 11. Milling products, malt, starches, inilin, wheat gluten 12. Oil seeds, oleagic fruits, grains, seeds, fruit etc not elsewhere specified 13. Lac; gums, resins, vegetable saps and extracts 14. Vegetable plaiting materials, vegetable products not elsewhere specified 15. Animal, vegetable fats and oils and their cleavage products etc 16. Meat, fish and seafood food preparations 17. Sugars and sugar confectionery 18. Cocoa and cocoa preparations 19. Cereals, flour, starch, milk preparations and products 20. Vegetable, fruit, nut etc. food preparations 21. Miscellaneous edible preparations 22. Beverages, spirits and vinegar 23. Residues, waste of food industry, animal fodder 24. Tobacco and manufactured tobacco substitutes
Source: COMTRADE Database.
Intra-industry trade in agricultural and food products: The case of Ukraine 27
Annex 2: Grubel-Lloyd indices of intra-industry trade in agro-food products between Ukraine and its trading partners, 1996-2002
Country 1996 1997 1998 1999 2000 2001 2002 Average Armenia 0.00 0.36 0.00 0.00 0.51 0.88 0.37 0.30 Azerbaijan 0.00 0.08 0.47 0.00 0.18 0.97 0.17 0.27 Belarus 0.45 0.40 1.48 1.25 0.26 0.56 0.74 0.73 Georgia 0.01 0.07 0.02 0.02 0.18 0.64 0.10 0.15 Kazakhstan 0.02 0.00 0.00 6.09 0.00 0.16 0.09 0.91 Kyrgyzstan 0.00 0.00 0.00 0.03 0.00 0.00 0.00 0.00 Moldova 11.17 6.74 8.02 24.97 8.31 14.17 7.76 11.59 Russian Federation 1.33 1.48 2.93 2.82 6.45 10.19 8.91 4.87 Tajikistan 0.00 0.00 0.00 0.00 0.00 0.00 0.00 0.00 Turkmenistan 0.00 0.00 0.00 0.00 0.23 0.58 0.00 0.12 Uzbekistan 0.53 0.27 1.33 3.08 2.55 0.09 1.39 1.32 CIS aggregated 1.24 1.25 2.74 2.90 5.26 8.54 6.91 4.12 Estonia 1.86 1.11 2.72 2.46 1.97 3.97 2.41 2.36 Latvia 1.35 1.60 1.75 0.93 0.79 1.79 2.21 1.49 Lithuania 2.06 1.17 0.39 1.64 0.97 0.89 1.50 1.23 Baltic states aggregated 1.79 1.23 1.64 2.07 1.38 2.31 2.05 1.78 Albania 0.00 0.00 0.00 0.00 0.00 0.00 0.00 0.00 Bosnia Herzegovina 0.00 0.00 0.00 0.00 0.00 0.00 0.00 0.00 Bulgaria 2.35 2.32 11.11 8.18 0.44 0.32 0.64 3.62 Croatia 3.84 2.09 0.00 0.00 0.00 0.00 0.00 0.85 Czech Republic 8.24 3.94 1.45 0.02 1.61 0.85 1.30 2.49 Hungary 15.81 15.59 2.68 10.22 1.72 2.27 0.21 6.93 Macedonia 6.18 8.02 3.80 1.75 4.64 4.27 0.00 4.09 Poland 1.67 3.65 1.63 2.28 2.90 3.43 2.49 2.58 Romania 0.08 0.01 0.10 0.16 7.80 0.01 10.10 2.61 Serbia and Montenegro 0.00 0.00 0.00 32.96 7.90 9.55 15.38 9.40 Slovakia 7.52 1.00 0.18 0.28 0.12 0.45 0.76 1.47 Slovenia 0.00 0.00 0.00 0.00 0.00 0.00 0.00 0.00 CEEC aggregated 6.35 5.60 3.02 6.61 2.16 2.53 1.75 4.00 Austria 1.21 1.67 0.18 0.33 4.80 0.31 0.44 1.28 Belgium 0.44 0.42 0.83 0.00 0.16 0.35 0.47 0.38 Denmark 0.36 2.01 0.18 0.08 0.23 0.09 0.50 0.49 Finland 0.00 0.00 0.00 8.11 0.00 0.00 0.00 1.16 France 9.93 8.34 9.18 7.37 6.17 5.56 6.74 7.61 Germany 3.64 6.37 2.11 3.55 3.23 5.21 3.02 3.88 Greece 0.48 0.30 0.61 0.51 0.05 3.40 0.04 0.77 Ireland 2.19 2.12 0.00 0.00 0.00 0.40 0.00 0.67 Italy 0.86 0.59 0.92 0.86 1.43 0.67 0.69 0.86 Luxemburg – – – 0.00 0.00 0.00 0.00 0.00 Netherlands 7.70 7.07 1.71 0.89 1.36 1.07 0.29 2.87 Portugal 0.00 0.00 0.00 0.00 0.00 0.00 0.00 0.00 Spain 1.68 0.46 6.93 3.67 4.30 0.55 0.45 2.58 Sweden 0.00 0.03 0.00 0.00 0.00 0.08 0.19 0.04 United Kingdom 1.50 2.41 0.30 0.39 3.07 2.08 5.57 2.19 EU-15 aggregated 3.63 3.66 2.95 2.41 2.87 1.94 1.20 2.67 Australia 0.00 0.00 0.00 0.00 0.00 0.00 2.26 0.32 Canada 0.12 3.38 0.00 0.78 0.00 0.00 0.33 0.66 Iceland 0.00 0.00 0.00 0.00 0.00 0.00 0.00 0.00 Japan 2.22 0.00 0.30 0.00 0.00 0.00 0.00 0.36 Mexico 0.00 0.00 0.00 0.00 0.00 0.00 0.00 0.00 New Zealand 0.00 0.00 0.00 0.00 0.00 2.03 15.57 2.51 Norway 0.00 0.00 0.00 0.00 0.00 0.00 0.00 0.00 Republic of Korea 0.00 0.00 0.00 0.00 0.00 0.00 0.00 0.00 Switzerland 0.59 0.20 0.05 0.00 1.30 0.28 0.01 0.35 Turkey 0.39 0.67 0.67 1.00 2.50 0.01 0.40 0.81 United States 0.96 1.17 0.95 0.95 2.53 2.06 4.17 1.83 OECD aggregated 0.68 0.84 0.54 0.62 1.77 0.72 1.00 0.88 Cyprus 0.04 0.08 0.00 0.50 0.83 0.00 0.00 0.21 Egypt 0.00 1.05 0.00 0.00 0.11 0.06 0.00 0.17 Israel 0.17 0.40 0.20 0.03 0.43 0.36 0.04 0.23 Mauritania 0.47 0.07 0.00 3.00 1.13 19.49 19.67 6.26 Morocco 1.06 0.00 0.00 0.00 0.01 0.00 0.00 0.15 Rest non-OECD 0.00 0.00 0.00 0.00 0.00 0.00 0.00 0.00 Non-OECD aggregated 0.04 0.05 0.03 0.07 0.11 0.34 0.40 0.15
Source: Own calculations based on COMTRADE Database.
Luka, O., Levkovych, I. 28
Annex 3: Intra-industry trade by commodity groups with separate trading partners, 1996-2002 in average
HS code CIS countries Baltic states CEE
countries EU-15 OECD countries
Non-OECD countries
1 21.86 0.00 0.31 0.90 0.07 0.05 2 0.82 0.00 7.83 3.88 0.08 0.28 3 4.14 2.83 17.21 20.27 3.60 8.97 4 2.03 1.06 8.24 5.14 2.39 0.79 5 32.31 14.45 6.58 6.07 4.82 0.24 6 7.71 5.81 5.25 0.25 0.22 0.07 7 5.13 0.04 11.68 2.60 1.51 1.45 8 4.22 0.46 8.13 2.70 0.15 0.12 9 10.12 3.93 1.82 2.49 0.92 0.04
10 8.59 0.79 3.81 4.31 1.27 0.09 11 2.14 4.10 6.28 3.78 1.99 1.10 12 25.43 1.56 23.16 10.71 3.64 0.57 13 11.88 0.00 16.32 0.61 2.80 0.18 14 5.33 0.00 11.07 0.55 0.00 0.35 15 2.48 0.96 17.15 0.51 0.47 5.83 16 8.78 0.49 15.15 2.55 3.98 6.57 17 5.72 23.31 19.65 4.98 5.61 1.40 18 9.50 7.11 1.82 3.46 3.96 0.52 19 15.73 16.69 0.76 4.11 4.97 7.39 20 21.22 5.97 7.24 5.16 12.09 1.14 21 34.03 16.47 11.09 0.73 1.10 0.37 22 16.27 10.05 5.54 6.15 32.33 7.97 23 7.29 2.49 12.29 5.46 1.00 5.77 24 20.50 0.39 7.91 1.49 0.82 0.06
1-15 3.68 1.88 9.30 6.16 1.52 1.33 16-24 11.78 5.49 8.58 3.41 3.02 1.10
1-24 7.71 3.26 9.04 5.25 1.89 1.25 Source: Own calculations based on COMTRADE Database.
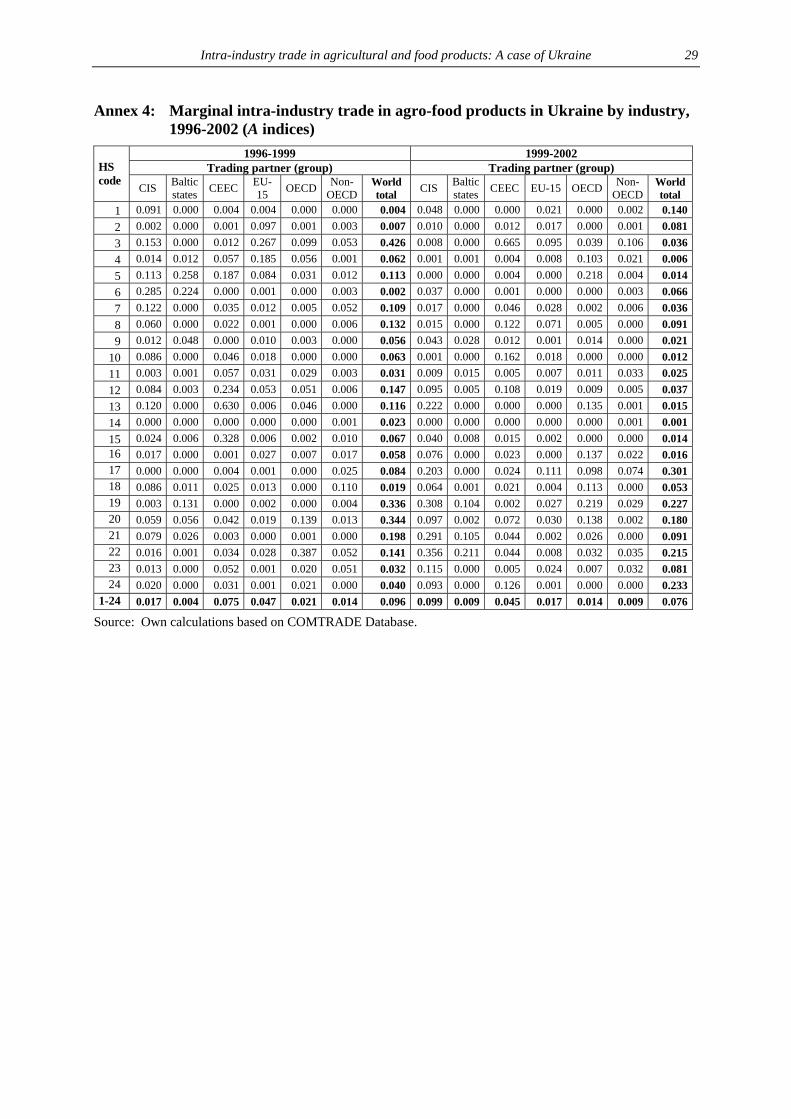
Intra-industry trade in agricultural and food products: A case of Ukraine 29
Annex 4: Marginal intra-industry trade in agro-food products in Ukraine by industry, 1996-2002 (A indices)
1996-1999 1999-2002 Trading partner (group) Trading partner (group) HS
code CIS Baltic states CEEC EU-
15 OECD Non-OECD
World total CIS Baltic
states CEEC EU-15 OECD Non-OECD
World total
1 0.091 0.000 0.004 0.004 0.000 0.000 0.004 0.048 0.000 0.000 0.021 0.000 0.002 0.1402 0.002 0.000 0.001 0.097 0.001 0.003 0.007 0.010 0.000 0.012 0.017 0.000 0.001 0.0813 0.153 0.000 0.012 0.267 0.099 0.053 0.426 0.008 0.000 0.665 0.095 0.039 0.106 0.0364 0.014 0.012 0.057 0.185 0.056 0.001 0.062 0.001 0.001 0.004 0.008 0.103 0.021 0.0065 0.113 0.258 0.187 0.084 0.031 0.012 0.113 0.000 0.000 0.004 0.000 0.218 0.004 0.0146 0.285 0.224 0.000 0.001 0.000 0.003 0.002 0.037 0.000 0.001 0.000 0.000 0.003 0.0667 0.122 0.000 0.035 0.012 0.005 0.052 0.109 0.017 0.000 0.046 0.028 0.002 0.006 0.0368 0.060 0.000 0.022 0.001 0.000 0.006 0.132 0.015 0.000 0.122 0.071 0.005 0.000 0.0919 0.012 0.048 0.000 0.010 0.003 0.000 0.056 0.043 0.028 0.012 0.001 0.014 0.000 0.021
10 0.086 0.000 0.046 0.018 0.000 0.000 0.063 0.001 0.000 0.162 0.018 0.000 0.000 0.01211 0.003 0.001 0.057 0.031 0.029 0.003 0.031 0.009 0.015 0.005 0.007 0.011 0.033 0.02512 0.084 0.003 0.234 0.053 0.051 0.006 0.147 0.095 0.005 0.108 0.019 0.009 0.005 0.03713 0.120 0.000 0.630 0.006 0.046 0.000 0.116 0.222 0.000 0.000 0.000 0.135 0.001 0.01514 0.000 0.000 0.000 0.000 0.000 0.001 0.023 0.000 0.000 0.000 0.000 0.000 0.001 0.00115 0.024 0.006 0.328 0.006 0.002 0.010 0.067 0.040 0.008 0.015 0.002 0.000 0.000 0.01416 0.017 0.000 0.001 0.027 0.007 0.017 0.058 0.076 0.000 0.023 0.000 0.137 0.022 0.01617 0.000 0.000 0.004 0.001 0.000 0.025 0.084 0.203 0.000 0.024 0.111 0.098 0.074 0.30118 0.086 0.011 0.025 0.013 0.000 0.110 0.019 0.064 0.001 0.021 0.004 0.113 0.000 0.05319 0.003 0.131 0.000 0.002 0.000 0.004 0.336 0.308 0.104 0.002 0.027 0.219 0.029 0.22720 0.059 0.056 0.042 0.019 0.139 0.013 0.344 0.097 0.002 0.072 0.030 0.138 0.002 0.18021 0.079 0.026 0.003 0.000 0.001 0.000 0.198 0.291 0.105 0.044 0.002 0.026 0.000 0.09122 0.016 0.001 0.034 0.028 0.387 0.052 0.141 0.356 0.211 0.044 0.008 0.032 0.035 0.21523 0.013 0.000 0.052 0.001 0.020 0.051 0.032 0.115 0.000 0.005 0.024 0.007 0.032 0.08124 0.020 0.000 0.031 0.001 0.021 0.000 0.040 0.093 0.000 0.126 0.001 0.000 0.000 0.233
1-24 0.017 0.004 0.075 0.047 0.021 0.014 0.096 0.099 0.009 0.045 0.017 0.014 0.009 0.076
Source: Own calculations based on COMTRADE Database.
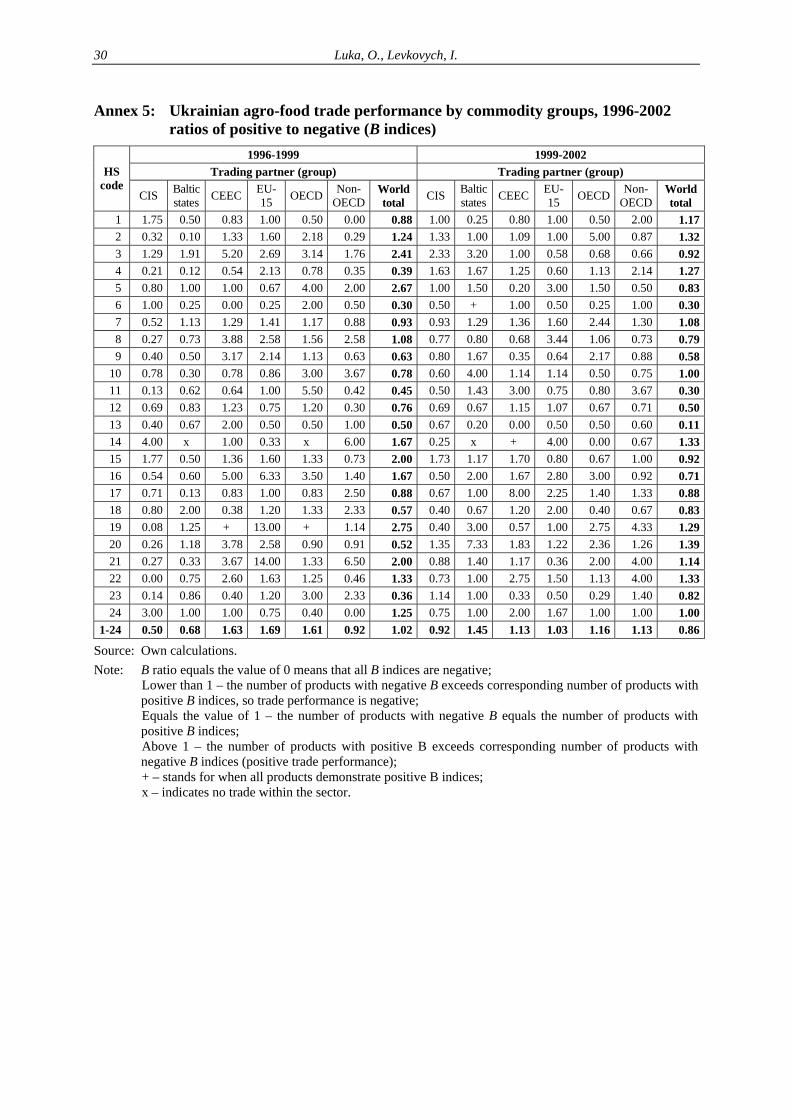
Luka, O., Levkovych, I. 30
Annex 5: Ukrainian agro-food trade performance by commodity groups, 1996-2002 ratios of positive to negative (B indices)
1996-1999 1999-2002 Trading partner (group) Trading partner (group) HS
code CIS Baltic
states CEEC EU-15 OECD Non-
OECDWorld total CIS Baltic
states CEEC EU-15 OECD Non-
OECD World total
1 1.75 0.50 0.83 1.00 0.50 0.00 0.88 1.00 0.25 0.80 1.00 0.50 2.00 1.172 0.32 0.10 1.33 1.60 2.18 0.29 1.24 1.33 1.00 1.09 1.00 5.00 0.87 1.323 1.29 1.91 5.20 2.69 3.14 1.76 2.41 2.33 3.20 1.00 0.58 0.68 0.66 0.924 0.21 0.12 0.54 2.13 0.78 0.35 0.39 1.63 1.67 1.25 0.60 1.13 2.14 1.275 0.80 1.00 1.00 0.67 4.00 2.00 2.67 1.00 1.50 0.20 3.00 1.50 0.50 0.836 1.00 0.25 0.00 0.25 2.00 0.50 0.30 0.50 + 1.00 0.50 0.25 1.00 0.307 0.52 1.13 1.29 1.41 1.17 0.88 0.93 0.93 1.29 1.36 1.60 2.44 1.30 1.088 0.27 0.73 3.88 2.58 1.56 2.58 1.08 0.77 0.80 0.68 3.44 1.06 0.73 0.799 0.40 0.50 3.17 2.14 1.13 0.63 0.63 0.80 1.67 0.35 0.64 2.17 0.88 0.58
10 0.78 0.30 0.78 0.86 3.00 3.67 0.78 0.60 4.00 1.14 1.14 0.50 0.75 1.0011 0.13 0.62 0.64 1.00 5.50 0.42 0.45 0.50 1.43 3.00 0.75 0.80 3.67 0.3012 0.69 0.83 1.23 0.75 1.20 0.30 0.76 0.69 0.67 1.15 1.07 0.67 0.71 0.5013 0.40 0.67 2.00 0.50 0.50 1.00 0.50 0.67 0.20 0.00 0.50 0.50 0.60 0.1114 4.00 x 1.00 0.33 x 6.00 1.67 0.25 x + 4.00 0.00 0.67 1.3315 1.77 0.50 1.36 1.60 1.33 0.73 2.00 1.73 1.17 1.70 0.80 0.67 1.00 0.9216 0.54 0.60 5.00 6.33 3.50 1.40 1.67 0.50 2.00 1.67 2.80 3.00 0.92 0.7117 0.71 0.13 0.83 1.00 0.83 2.50 0.88 0.67 1.00 8.00 2.25 1.40 1.33 0.8818 0.80 2.00 0.38 1.20 1.33 2.33 0.57 0.40 0.67 1.20 2.00 0.40 0.67 0.8319 0.08 1.25 + 13.00 + 1.14 2.75 0.40 3.00 0.57 1.00 2.75 4.33 1.2920 0.26 1.18 3.78 2.58 0.90 0.91 0.52 1.35 7.33 1.83 1.22 2.36 1.26 1.3921 0.27 0.33 3.67 14.00 1.33 6.50 2.00 0.88 1.40 1.17 0.36 2.00 4.00 1.1422 0.00 0.75 2.60 1.63 1.25 0.46 1.33 0.73 1.00 2.75 1.50 1.13 4.00 1.3323 0.14 0.86 0.40 1.20 3.00 2.33 0.36 1.14 1.00 0.33 0.50 0.29 1.40 0.8224 3.00 1.00 1.00 0.75 0.40 0.00 1.25 0.75 1.00 2.00 1.67 1.00 1.00 1.00
1-24 0.50 0.68 1.63 1.69 1.61 0.92 1.02 0.92 1.45 1.13 1.03 1.16 1.13 0.86
Source: Own calculations. Note: B ratio equals the value of 0 means that all B indices are negative;
Lower than 1 – the number of products with negative B exceeds corresponding number of products with positive B indices, so trade performance is negative; Equals the value of 1 – the number of products with negative B equals the number of products with positive B indices; Above 1 – the number of products with positive B exceeds corresponding number of products with negative B indices (positive trade performance); + – stands for when all products demonstrate positive B indices; x – indicates no trade within the sector.
DISCUSSION PAPERS DES INSTITUTS FÜR AGRARENTWICKLUNG
IN MITTEL- UND OSTEUROPA (IAMO)
DISCUSSION PAPERS OF THE INSTITUTE OF AGRICULTURAL DEVELOPMENT
IN CENTRAL AND EASTERN EUROPE (IAMO)
No. 1 FROHBERG, K., HARTMANN, M. (1997): Promoting CEA Agricultural Exports through Association Agreements with the EU – Why is it not working?
No. 2 FROHBERG, K., HARTMANN, M. (1997): Comparing Measures of Competitiveness: Examples for Agriculture in the Central European Associates
No. 3 POGANIETZ, W. R., GLAUCH, L. (1997): Migration durch EU-Integration? Folgen für den ländlichen Raum
No. 4 WEINGARTEN, P. (1997): Agri-Environmental Policy in Germany – Soil and Water Conversation –
No. 5 KOPSIDIS, M. (1997): Marktintegration und landwirtschaftliche Entwicklung: Lehren aus der Wirtschafts-geschichte und Entwicklungsökonomie für den russischen Getreidemarkt im Trans-formationsprozeß
No. 6 PIENIADZ, A. (1997): Der Transformationsprozeß in der polnischen Ernährungsindustrie von 1989 bis 1995
No. 7 POGANIETZ, W. R. (1997): Vermindern Transferzahlungen den Konflikt zwischen Gewinnern und Verlierern in einer sich transformierenden Volkswirtschaft?
No. 8 EPSTEIN, D. B., SIEMER, J. (1998): Difficulties in the Privatization and Reorganization of the Agricultural Enterprises in Russia
No. 9 GIRGZDIENE, V., HARTMANN, M., KUODYS, A., RUDOLPH, D., VAIKUTIS, V., WANDEL, J. (1998): Restructuring the Lithuanian Food Industry: Problems and Perspectives
No. 10 JASJKO, D., HARTMANN, M., KOPSIDIS, M., MIGLAVS, A., WANDEL, J. (1998): Restructuring the Latvian Food Industry: Problems and Perspectives
No. 11 SCHULZE, E., NETZBAND, C. (1998): Ergebnisse eines Vergleichs von Rechtsformen landwirtschaftlicher Unternehmen in Mittel- und Osteuropa
No. 12 BERGSCHMIDT, A., HARTMANN, M. (1998): Agricultural Trade Policies and Trade Relations in Transition Economies
No. 13 ELSNER, K., HARTMANN, M. (1998): Convergence of Food Consumption Patterns between Eastern and Western Europe
No. 14 FOCK, A., VON LEDEBUR, O. (1998): Struktur und Potentiale des Agraraußenhandels Mittel- und Osteuropas
No. 15 ADLER, J. (1998): Analyse der ökonomischen Situation von Milchproduktionsunternehmen im Oblast Burgas, Bulgarien
No. 16 PIENIADZ, A., RUDOLPH, D. W., WANDEL, J. (1998): Analyse der Wettbewerbsprozesse in der polnischen Fleischindustrie seit Transformationsbeginn
No. 17 SHVYTOV, I. (1998): Agriculturally Induced Environmental Problems in Russia
No. 18 SCHULZE, E., TILLACK, P., DOLUD, O., BUKIN, S. (1999): Eigentumsverhältnisse landwirtschaftlicher Betriebe und Unternehmen in Rußland und in der Ukraine – Befragungsergebnisse aus den Regionen Nowosibirsk und Shitomir
No. 19 PANAYOTOVA, M., ADLER, J. (1999): Development and Future Perspectives for Bulgarian Raw Milk Production towards EU Quality Standards
No. 20 WILDERMUTH, A. (1999): What Kind of Crop Insurance for Russia?
No. 21 GIRGZDIENE, V., HARTMANN, M., KUODYS, A., VAIKUTIS, V., WANDEL, J. (1999): Industrial Organisation of the Food Industry in Lithuania: Results of an Expert Survey in the Dairy and Sugar Branch
No. 22 JASJKO, D., HARTMANN, M., MIGLAVS, A., WANDEL, J. (1999): Industrial Organisation of the Food Industry in Latvia: Results of an Expert Survey in the Dairy and Milling Branches
No. 23 ELSNER, K. (1999): Analysing Russian Food Expenditure Using Micro-Data
No. 24 PETRICK, M., DITGES, C. M. (2000): Risk in Agriculture as Impediment to Rural Lending – The Case of North-western Kazakhstan
No. 25 POGANIETZ, W. R. (2000): Russian Agri-Food Sector: 16 Months After the Breakdown of the Monetary System
No. 26 WEBER, G., WAHL, O., MEINLSCHMIDT, E. (2000): Auswirkungen einer EU-Osterweiterung im Bereich der Agrarpolitik auf den EU-Haushalt (steht nicht mehr zur Verfügung – aktualisierte Version DP 42)
No. 27 WAHL, O., WEBER, G., FROHBERG, K. (2000): Documentation of the Central and Eastern European Countries Agricultural Simulation Model (CEEC-ASIM Version 1.0)
No. 28 PETRICK, M. (2000): Land Reform in Moldova: How Viable are Emerging Peasant Farms? An assessment referring to a recent World Bank study
No. 29 WEINGARTEN, P. (2000): Buchbesprechung: BECKMANN, V. (2000): Transaktionskosten und institutionelle Wahl in der Landwirtschaft: Zwischen Markt, Hierarchie und Kooperation
No. 30 BROSIG, S. (2000): A Model of Household Type Specific Food Demand Behaviour in Hungary
No. 31 UVAROVSKY, V., VOIGT, P. (2000): Russia’s Agriculture: Eight Years in Transition – Convergence or Divergence of Regional Efficiency
No. 32 SCHULZE, E., TILLACK, P., GERASIN, S. (2001): Eigentumsverhältnisse, Rentabilität und Schulden landwirtschaftlicher Großbetriebe im Gebiet Wolgograd
No. 33 KIELYTE, J. (2001): Strukturwandel im baltischen Lebensmittelhandel
No. 34 ШУЛЬЦЕ, Э., ТИЛЛАК, П., ГЕРАСИН, С. (2001): Отношения собственности, рентабельность и долги крупных сельскохозяйственных предприятий в Волгоградской области
No. 35 FROHBERG, K., HARTMANN, M. (2002): Konsequenzen der Integration im Agrar- und Ernährungssektor zwischen Beitrittsländern und EU-15
No. 36 PETRICK, M. (2001): Documentation of the Poland farm survey 2000
No. 37 PETRICK, M., SPYCHALSKI, G., ŚWITŁYK, M., TYRAN, E. (2001): Poland's Agriculture: Serious Competitor or Europe's Poorhouse? Survey results on farm performance in selected Polish voivodships and a comparison with German farms
No. 38 HOCKMANN, H., KASHTANOVA, E., KOWSCHIK, S. (2002): Lage und Entwicklungsprobleme der weißrussischen Fleischwirtschaft
No. 39 SCHULZE, E., TILLACK, P., PATLASSOV, O. (2002): Einflussfaktoren auf Gewinn und Rentabilität landwirtschaftlicher Großbetriebe im Gebiet Omsk, Russland
No. 40 ШУЛЬЦЕ, Э., ТИЛЛАК, П., ПАТЛАССОВ, О. (2002): Факторы, влияющие на прибыль и рентабельность крупных сельскохозяйственных предприятий в Омской области в России
No. 41 BAVOROVÁ, M. (2002): Entwicklung des tschechischen Zuckersektors seit 1989
No. 42 FROHBERG, K., WEBER, G. (2002): Auswirkungen der EU-Osterweiterung im Agrarbereich
No. 43 PETRICK, M. (2002): Farm investment, credit rationing, and public credit policy in Poland – A microeconometric analysis –
No. 44 KEDAITIENE, A., HOCKMANN, H. (2002): Milk and milk processing industry in Lithuania: An analysis of horizontal and vertical integration
No. 45 PETRICK, M. (2003): Empirical measurement of credit rationing in agriculture: A methodological survey
No. 46 PETRICK, M., LATRUFFE, L. (2003): Credit access and borrowing costs in Poland’s agricultural credit market: A hedonic pricing approach
No. 47 PETRICK, M., BALMANN, A., LISSITSA, A. (2003): Beiträge des Doktorandenworkshops zur Agrarentwicklung in Mittel- und Osteuropa 2003
No. 48 SCHULZE, E., TILLACK, P., MOSASHWILI, N. (2003): Zur wirtschaftlichen Situation georgischer Landwirtschaftsbetriebe
No. 49 ЛИССИТСА, А., БАБИЧЕВА, Т. (2003): Теоретические основы анализа продуктивности и эффективности cельскохозяйственных предприятий
No. 50 ЛИССИТСА, А., БАБИЧЕВА, Т. (2003): Aнализ Оболочки Данных (DEA) – Современная методика определения эффективности производства
No. 51 ЛИССИТСА, А., ОДЕНИНГ, М., БАБИЧЕВА, Т. (2003): 10 лет экономических преобразований в сельском хозяйстве Украины – Анализ эффективности и продуктивности предприятий
No. 52 LISSITSA, A., STANGE, H. (2003): Russischer Agrarsektor im Aufschwung? Eine Analyse der technischen und Skalen-Effizienz der Agrarunternehmen
No. 53 VALENTINOV, V. (2003): Social capital, transition in agriculture, and economic organisation: A theoretical perspective
No. 54 BORKOWSKI, A. (2003): Machtverteilung im Ministerrat nach dem Vertrag von Nizza und den Konventsvorschlägen in einer erweiterten Europäischen Union
No. 55 KISS, P., WEINGARTEN, P. (2003): Cost of compliance with the acquis communautaire in the Hungarian dairy sector
No. 56 WEINGARTEN, P., FROHBERG, K., WINTER, E., SCHREIBER, C. (2003): Quantitative Analysis of the Impacts of Croatia’s Agricultural Trade Policy on the Agri-food Sector
No. 57 БОКУШЕВА, Р., ХАЙДЕЛЬБАХ, О. (2004): Актуальные аспекты страхования в сельском хозяйстве
No. 58 DERLITZKI, R., SCHULZE, E. (2004): Georg Max Ludwig Derlitzki (1889-1958)
No. 59 VŐNEKI, E. (2004): Zur Bewertung des Ungarischen SAPARD-Programms unter besonderer Berücksichtigung der Investitionen im Milchsektor
No. 60 ЧИМПОЕШ, Д., ШУЛЬЦЕ, Э. (2004): Основные экономические проблемы сельского хозяйства Молдовы
No. 61 BAUM, S., WEINGARTEN, P. (2004): Interregionale Disparitäten und Entwicklung ländlicher Räume als regionalpolitische Herausforderung für die neuen EU-Mitgliedstaaten
No. 62 PETRICK, M. (2004): Can econometric analysis make (agricultural) economics a hard science? Critical remarks and implications for economic methodology
No. 63 SAUER, J. (2004): Rural Water Suppliers and Efficiency – Empirical Evidence from East and West Germany
No. 64 PETRICK, M., BALMANN, A. (2004): Beiträge des 2. Doktorandenworkshops zur Agrarentwicklung in Mittel- und Osteuropa 2004
No. 65 BOJNEC, S., HARTMANN, M. (2004): Agricultural and Food Trade in Central and Eastern Europe: The Case of Slovenian Intra-Industry Trade
No. 66 GLITSCH, K., EERITS, A. (2004): Der slowakische Markt für Milch und Milchprodukte – Vom Beginn der Transformation bis zum EU-Beitritt
No. 67 FISCHER, C. (2004): Assessing Kosovo's horticultural potential – The market for fruit and vegetables on the balkans
No. 68 PETRICK, M., SCHREIBER, C., WEINGARTEN, P. (2004): Competitiveness of milk and wine production and processing in Albania
No. 69 ШТАНГЕ, Г., ЛИССИТСА, А. (2004): Аграрный сектор России на подъеме?! Анализ технической эффективности аграрных предприятий
No. 70 SAUER, J. (2004): Die Ökonomie der (Ländlichen) Wasserversorgung
No. 71 HAPPE, K., BALMANN, A., KELLERMANN, K. (2004): The Agricultural Policy Simulator (Agripolis) – An agent-based model to study structural change in agriculture (Version 1.0)
No. 72 BAUM, S., TRAPP, CH., WEINGARTEN, P. (2004): Typology of rural areas in the Central and Eastern European EU new Member States
No. 73 PETRICK, M. (2004): Governing structural change and externalities in agriculture: Toward a normative institutional economics of rural development
No. 74 RODIONOVA, O., SCHULZE, E., UERKOV, E., KARPOVA, G. (2004): Zur Besteuerung von Agrarholdings in Russland
No. 75 HEIDELBACH, O., BOKUSHEVA, R., KUSSAYINOV, T. (2004): Which type of crop insurance for Kazakhstan? – Empirical results
No. 76 BOKUSHEVA, R. (2004): Crop insurance in transition: A qualitative and quantitative assessment of insurance products
No. 77 RAMANOVICH, M., LAJTOS, I. (2004): Milchproduktion und -verarbeitung in Weißrussland: Eine Analyse der Wettbewerbsfähigkeit
No. 78 LUKA, O., LEVKOVYCH, I. (2004): Intra-industry trade in agricultural and food products: The case of Ukraine
Die Discussion Papers sind erhältlich beim Institut für Agrarentwicklung in Mittel- und Ost-europa (IAMO) oder im Internet unter http://www.iamo.de. The Discussion Papers can be ordered from the Institute of Agricultural Development in Central and Eastern Europe (IAMO). Use our download facility at http://www.iamo.de.