Embed Size (px)
Citation preview
1
Discussion paper
Gearing
February 2018

2
© Commonwealth of Australia 2018
This work is copyright. In addition to any use permitted under the Copyright Act 1968,
all material contained within this work is provided under a Creative Commons
Attributions 3.0 Australia licence, with the exception of:
the Commonwealth Coat of Arms
the ACCC and AER logos
any illustration, diagram, photograph or graphic over which the Australian
Competition and Consumer Commission does not hold copyright, but which may
be part of or contained within this publication. The details of the relevant licence
conditions are available on the Creative Commons website, as is the full legal code
for the CC BY 3.0 AU licence.
Requests and inquiries concerning reproduction and rights should be addressed to the:
Director, Corporate Communications
Australian Competition and Consumer Commission
GPO Box 4141, Canberra ACT 2601
Inquiries about this publication should be addressed to:
Australian Energy Regulator
GPO Box 520
Melbourne Vic 3001
Tel: (03) 9290 1444
Fax: (03) 9290 1457
Email: [email protected]
3
Shortened forms Shortened form Extended form
ABS Australian Bureau of Statistics
AEMC Australian Energy Market Commission
AER Australian Energy Regulator
ATO Australian Tax Office
CCP Consumer Challenge Panel
COAG the Council of Australian Governments
DGM dividend growth model
energy networks electricity and gas network service providers
the Guideline the allowed rate of return guideline
MRP market risk premium
NEL national electricity law
NEO national electricity objective
NER national electricity rules
NGL national gas law
NGO national gas objective
NGR national gas rules
RBA the Reserve Bank of Australia
regulatory period
an access arrangement period for gas network service
providers and/or a regulatory control period for electricity
network service providers
the rules collectively, the NER and NGR
4
Contents
Shortened forms ............................................................................................. 3
1 Introduction ............................................................................................... 5
2 Background ............................................................................................... 7
2.1 Introduction to gearing ...................................................................... 7
2.2 Previous considerations ................................................................... 8
2.3 Submissions .................................................................................... 10
2.4 Independent expert views ............................................................... 11
2.4.1 Allen Consulting Group ................................................................ 11
2.4.2 Incenta Economic Consulting ....................................................... 13
3 Updated gearing estimates .................................................................... 15
3.1 Estimates based on market values ................................................ 15
3.2 Estimates based on book values.................................................... 15
4 Estimation method used in our 2013 and 2009 rate of return guidelines
17
4.1 Measures of value: market, book, or RAB ..................................... 17
4.1.1 Implications of RAB multiples greater than one ............................ 18
4.2 Comparator businesses .................................................................. 19
4.3 Debt structuring (double leveraging) ............................................. 20
4.4 Gross or net debt ............................................................................. 20
4.5 Hybrid securities .............................................................................. 21
4.6 Borrowings and other accounting liabilities ................................. 26
4.7 Data sources .................................................................................... 27
4.8 Sample period and frequency ......................................................... 27
5 Current approach and questions for discussion ................................. 29
5.1 Questions for discussion ................................................................ 29
6 Bibliography ............................................................................................ 31
5
1 Introduction
The Rate of Return Guideline (Guideline) outlines our approach to setting the allowed
rate of return for regulated gas and electricity network services. We are currently
reviewing the Guideline.
The purposes of this discussion paper are to:
summarise submissions received from stakeholders on the regulatory gearing ratio
outline background material relevant to further consideration of the issue
set out our current approach as a starting point for discussion at the concurrent
expert evidence sessions; and
set out questions to frame that discussion.
In summary, our current approach for estimating a benchmark gearing ratio is
predominately based on the estimation methods used in our 2013 rate of return
guideline and 2009 review of WACC parameters. The benchmark gearing of 60 per
cent that was determined in our 2013 Guideline remains in line with the updated
market value based estimates of the overall gearing of comparator firms we have
examined.
Our current approach is based on the following principles:
The estimation of a benchmark gearing ratio should, subject to practical data
limitations, be consistent with the estimation of other rate of return parameters.
We should consider gearing estimates based on both market and book values.
Due to the limitations of calculating the market value of debt, the book value of
gearing is likely to be a valid proxy for the market value of gearing.
It is inappropriate to use net debt, as cash could be funded by debt and/or equity.
The book value of loan notes should be removed from the book value of total debt.
It is not clear whether or not adjusting for double leveraging is more representative
of the level of gearing and, in the absence of further evidence, both will be
considered.
Gearing data of an annual frequency is likely to be sufficient, and an average of
gearing outcomes over a period of time reduces the likelihood that any recent
events may distort recorded gearing outcomes.
We note that a key purpose of the concurrent evidence sessions is to determine if the
current approaches of the AER remain appropriate, or if the evidence (theoretical
and/or empirical) support changes. This discussion paper is prepared for these
sessions to assist with this purpose. We also note that the discussion papers and
questions for the topics, including those contained in this discussion paper, cover a
broad range of material that stakeholders wish to have considered in the Guideline
review. This material should not be taken to imply the AER has yet formed views on

6
the appropriate approaches to apply, or numerical values to take, in the 2018 Guideline
in determining the allowed rate of return.
7
2 Background
In this discussion paper we consider the methods for estimating a regulatory gearing
ratio, and whether the ratio set out in the current (2013) rate of return guidelines is
likely to continue producing outcomes which promote the objectives of the regulatory
framework.
This section sets out:
An introduction to gearing
Our previous considerations of regulatory gearing ratios
Submissions received in response to our issues paper
Summary of previous independent expert views on gearing
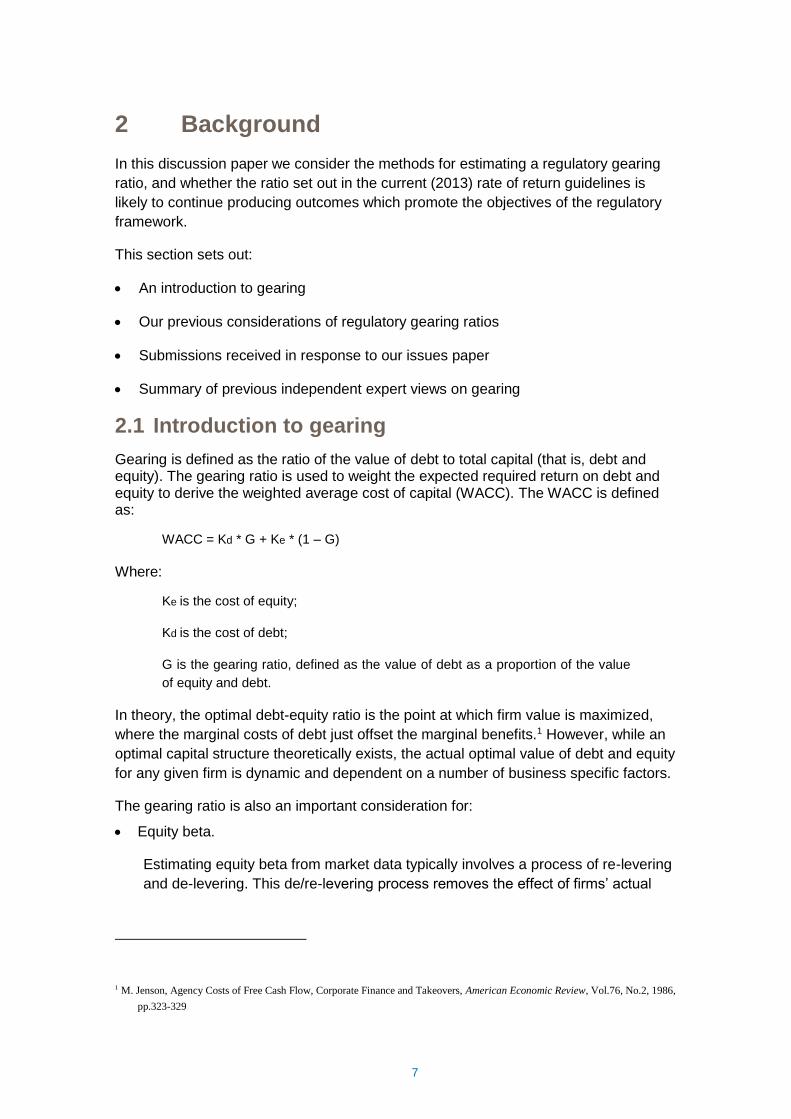
2.1 Introduction to gearing
Gearing is defined as the ratio of the value of debt to total capital (that is, debt and equity). The gearing ratio is used to weight the expected required return on debt and equity to derive the weighted average cost of capital (WACC). The WACC is defined as:
WACC = Kd * G + Ke * (1 – G)
Where:
Ke is the cost of equity;
Kd is the cost of debt;
G is the gearing ratio, defined as the value of debt as a proportion of the value
of equity and debt.
In theory, the optimal debt-equity ratio is the point at which firm value is maximized,
where the marginal costs of debt just offset the marginal benefits.1 However, while an
optimal capital structure theoretically exists, the actual optimal value of debt and equity
for any given firm is dynamic and dependent on a number of business specific factors.
The gearing ratio is also an important consideration for:
Equity beta.
Estimating equity beta from market data typically involves a process of re-levering
and de-levering. This de/re-levering process removes the effect of firms’ actual
1 M. Jenson, Agency Costs of Free Cash Flow, Corporate Finance and Takeovers, American Economic Review, Vol.76, No.2, 1986,
pp.323-329
8
gearing on their observed equity betas and adjusts for our benchmark level of
gearing.
Credit rating.
Ratings agencies typically take gearing into account when issuing a credit rating.
The proportion of debt used to fund a business’ activities may have an impact on
the level of interest payments. This would then have an impact on the business’
ability to meet financial obligations and affect the credit rating in turn. Benchmark
credit rating is a factor in determining the allowed return on debt.
Taxation.
Interest is a tax expense and reduces taxable income. Our benchmark gearing
ratio is currently used in our Post-Tax Revenue Model (PTRM) to calculate
projected deductible interest expenses and tax expenses (the allowed tax revenue
building block). Under the current PTRM a higher gearing ratio will result in greater
deductible projected interest expense and lower allowed revenue for the tax
building block (all else equal). We note that the gearing estimate used for the
purpose of calculating projected tax expenses is set in the PTRM, and whether
this gearing estimate could or should be different to the gearing estimate used to
calculate a weighted average cost of capital, is outside the scope of our review of
the rate of return guidelines. This issue may be examined in a review of our
regulatory treatment of tax.
2.2 Previous considerations
The benchmark gearing ratio applied in energy network regulation has been stable
over time.
In earlier versions of the National Electricity Rules the gearing ratio to be used in
regulatory determinations for electricity transmission service providers was prescribed
in the rules as 60:40 (debt:equity).
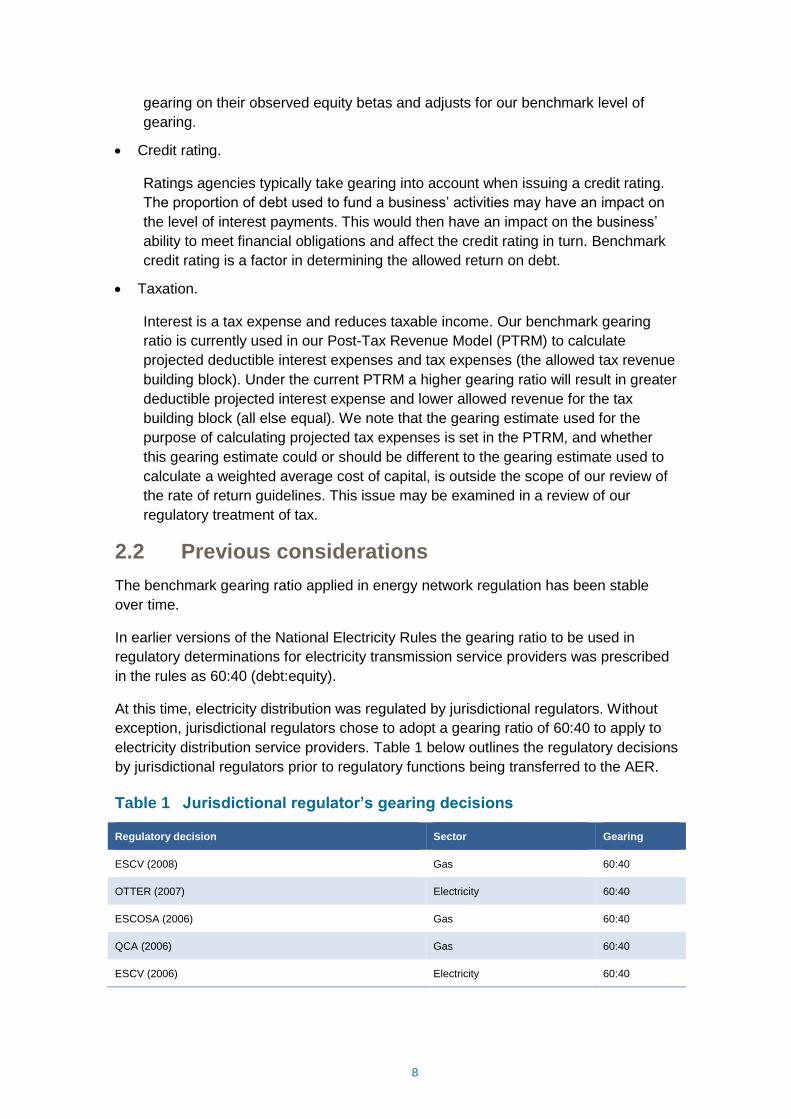
At this time, electricity distribution was regulated by jurisdictional regulators. Without
exception, jurisdictional regulators chose to adopt a gearing ratio of 60:40 to apply to
electricity distribution service providers. Table 1 below outlines the regulatory decisions
by jurisdictional regulators prior to regulatory functions being transferred to the AER.
Table 1 Jurisdictional regulator’s gearing decisions
Regulatory decision Sector Gearing
ESCV (2008) Gas 60:40
OTTER (2007) Electricity 60:40
ESCOSA (2006) Gas 60:40
QCA (2006) Gas 60:40
ESCV (2006) Electricity 60:40
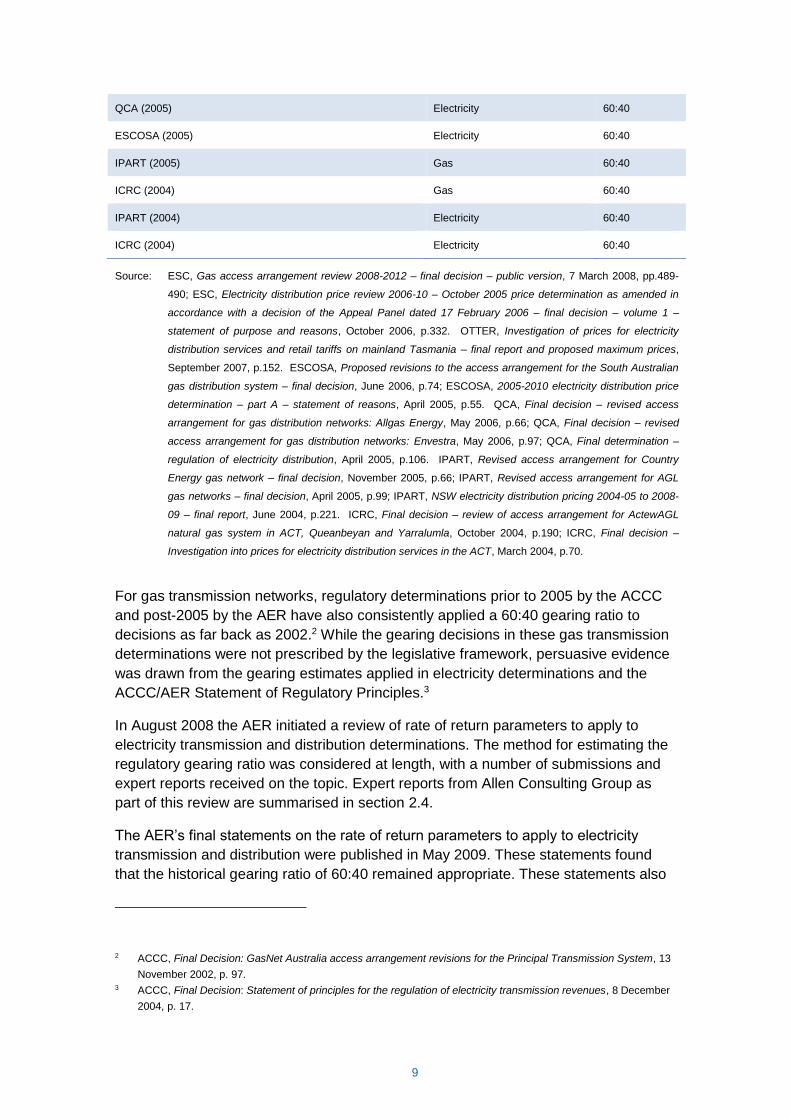
9
QCA (2005) Electricity 60:40
ESCOSA (2005) Electricity 60:40
IPART (2005) Gas 60:40
ICRC (2004) Gas 60:40
IPART (2004) Electricity 60:40
ICRC (2004) Electricity 60:40
Source: ESC, Gas access arrangement review 2008-2012 – final decision – public version, 7 March 2008, pp.489-
490; ESC, Electricity distribution price review 2006-10 – October 2005 price determination as amended in
accordance with a decision of the Appeal Panel dated 17 February 2006 – final decision – volume 1 –
statement of purpose and reasons, October 2006, p.332. OTTER, Investigation of prices for electricity
distribution services and retail tariffs on mainland Tasmania – final report and proposed maximum prices,
September 2007, p.152. ESCOSA, Proposed revisions to the access arrangement for the South Australian
gas distribution system – final decision, June 2006, p.74; ESCOSA, 2005-2010 electricity distribution price
determination – part A – statement of reasons, April 2005, p.55. QCA, Final decision – revised access
arrangement for gas distribution networks: Allgas Energy, May 2006, p.66; QCA, Final decision – revised
access arrangement for gas distribution networks: Envestra, May 2006, p.97; QCA, Final determination –
regulation of electricity distribution, April 2005, p.106. IPART, Revised access arrangement for Country
Energy gas network – final decision, November 2005, p.66; IPART, Revised access arrangement for AGL
gas networks – final decision, April 2005, p.99; IPART, NSW electricity distribution pricing 2004-05 to 2008-
09 – final report, June 2004, p.221. ICRC, Final decision – review of access arrangement for ActewAGL
natural gas system in ACT, Queanbeyan and Yarralumla, October 2004, p.190; ICRC, Final decision –
Investigation into prices for electricity distribution services in the ACT, March 2004, p.70.
For gas transmission networks, regulatory determinations prior to 2005 by the ACCC
and post-2005 by the AER have also consistently applied a 60:40 gearing ratio to
decisions as far back as 2002.2 While the gearing decisions in these gas transmission
determinations were not prescribed by the legislative framework, persuasive evidence
was drawn from the gearing estimates applied in electricity determinations and the
ACCC/AER Statement of Regulatory Principles.3
In August 2008 the AER initiated a review of rate of return parameters to apply to
electricity transmission and distribution determinations. The method for estimating the
regulatory gearing ratio was considered at length, with a number of submissions and
expert reports received on the topic. Expert reports from Allen Consulting Group as
part of this review are summarised in section 2.4.
The AER’s final statements on the rate of return parameters to apply to electricity
transmission and distribution were published in May 2009. These statements found
that the historical gearing ratio of 60:40 remained appropriate. These statements also
2 ACCC, Final Decision: GasNet Australia access arrangement revisions for the Principal Transmission System, 13
November 2002, p. 97. 3 ACCC, Final Decision: Statement of principles for the regulation of electricity transmission revenues, 8 December
2004, p. 17.
10
set out the AER’s views on the methods for estimating a regulatory gearing ratio for
energy networks through empirical analysis, and discussed a number of key issues
involved in this estimation.
In December 2013 the AER made rate of return guidelines that would apply to both
electricity and gas, and both distribution and transmission. Gearing estimates were re-
considered as part of the development of these guidelines. There was broad
agreement from stakeholders at the time that the estimation method set out in the 2009
review remained appropriate.4 The AER updated its empirical gearing estimates using
the established method, and the gearing ratio of 60:40 continued to be supported by
the empirical evidence.
The estimation method discussed in the AER’s 2009 review and updated in the AER’s
2013 review is discussed in greater detail in section 4. Updated empirical estimates of
gearing based on this method are set out in section 3.
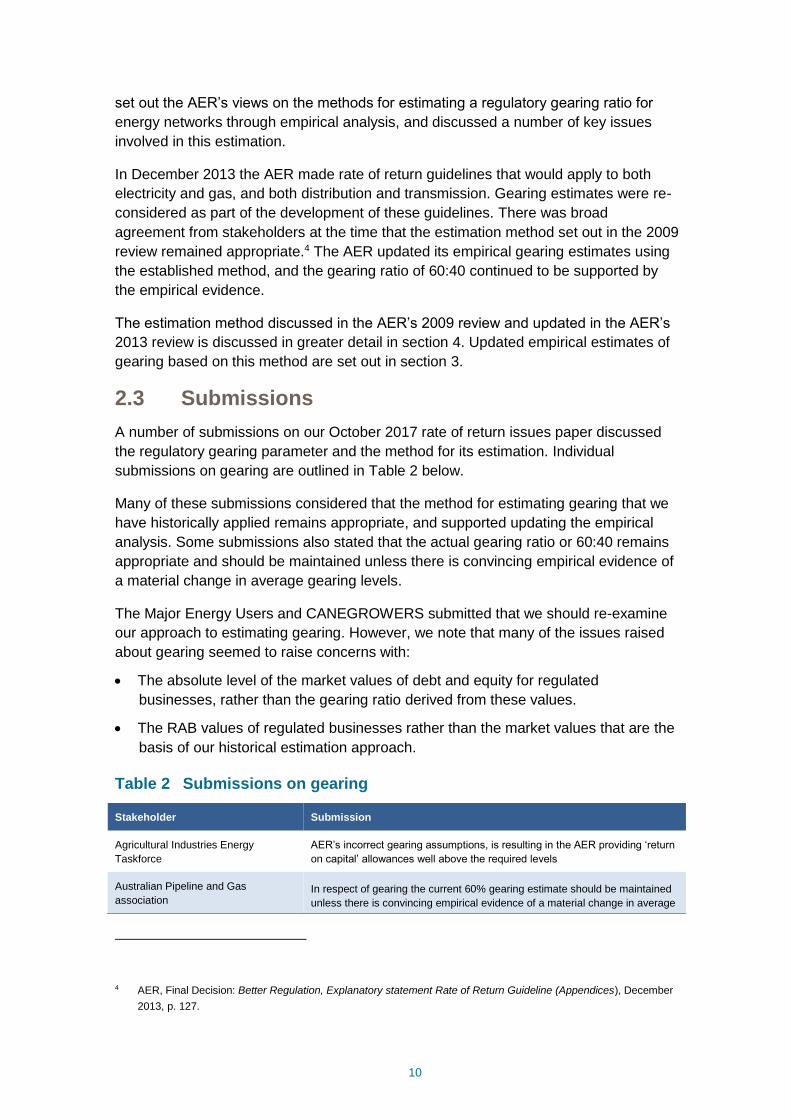
2.3 Submissions
A number of submissions on our October 2017 rate of return issues paper discussed
the regulatory gearing parameter and the method for its estimation. Individual
submissions on gearing are outlined in Table 2 below.
Many of these submissions considered that the method for estimating gearing that we
have historically applied remains appropriate, and supported updating the empirical
analysis. Some submissions also stated that the actual gearing ratio or 60:40 remains
appropriate and should be maintained unless there is convincing empirical evidence of
a material change in average gearing levels.
The Major Energy Users and CANEGROWERS submitted that we should re-examine
our approach to estimating gearing. However, we note that many of the issues raised
about gearing seemed to raise concerns with:
The absolute level of the market values of debt and equity for regulated
businesses, rather than the gearing ratio derived from these values.
The RAB values of regulated businesses rather than the market values that are the
basis of our historical estimation approach.
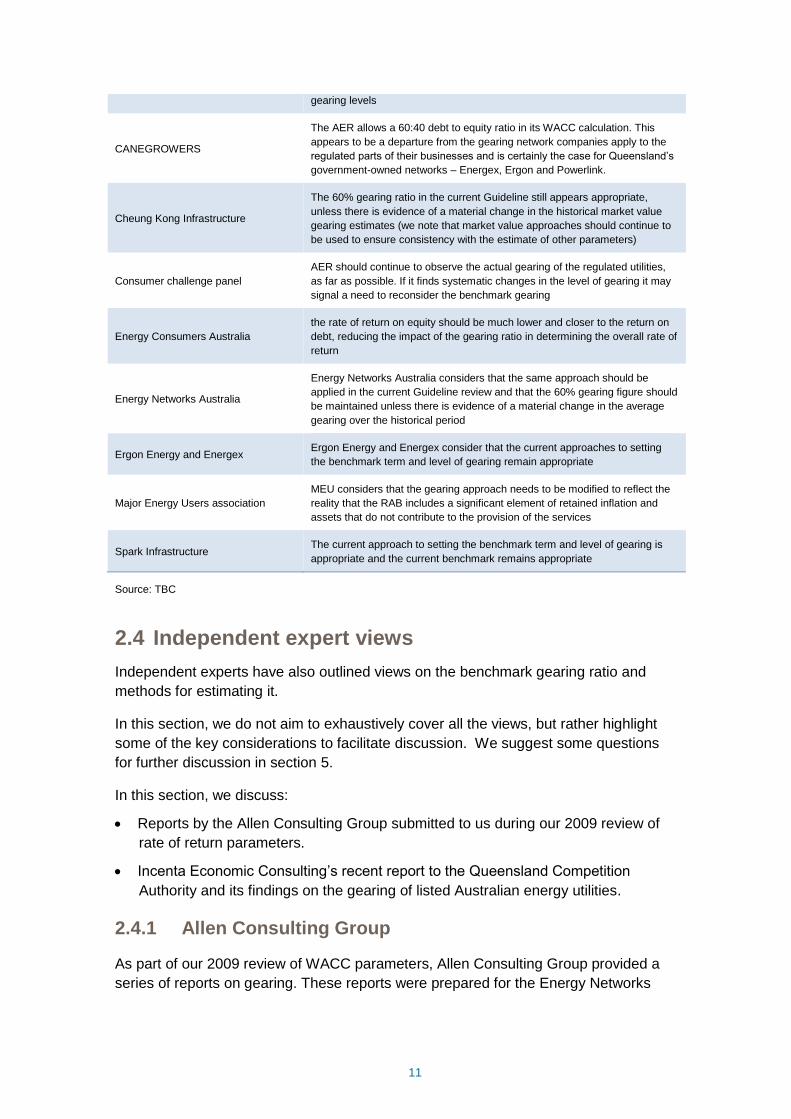
Table 2 Submissions on gearing
Stakeholder Submission
Agricultural Industries Energy
Taskforce
AER’s incorrect gearing assumptions, is resulting in the AER providing ‘return
on capital’ allowances well above the required levels
Australian Pipeline and Gas
association In respect of gearing the current 60% gearing estimate should be maintained
unless there is convincing empirical evidence of a material change in average
4 AER, Final Decision: Better Regulation, Explanatory statement Rate of Return Guideline (Appendices), December
2013, p. 127.
11
gearing levels
CANEGROWERS
The AER allows a 60:40 debt to equity ratio in its WACC calculation. This
appears to be a departure from the gearing network companies apply to the
regulated parts of their businesses and is certainly the case for Queensland’s
government-owned networks – Energex, Ergon and Powerlink.
Cheung Kong Infrastructure
The 60% gearing ratio in the current Guideline still appears appropriate,
unless there is evidence of a material change in the historical market value
gearing estimates (we note that market value approaches should continue to
be used to ensure consistency with the estimate of other parameters)
Consumer challenge panel
AER should continue to observe the actual gearing of the regulated utilities,
as far as possible. If it finds systematic changes in the level of gearing it may
signal a need to reconsider the benchmark gearing
Energy Consumers Australia
the rate of return on equity should be much lower and closer to the return on
debt, reducing the impact of the gearing ratio in determining the overall rate of
return
Energy Networks Australia
Energy Networks Australia considers that the same approach should be
applied in the current Guideline review and that the 60% gearing figure should
be maintained unless there is evidence of a material change in the average
gearing over the historical period
Ergon Energy and Energex Ergon Energy and Energex consider that the current approaches to setting
the benchmark term and level of gearing remain appropriate
Major Energy Users association
MEU considers that the gearing approach needs to be modified to reflect the
reality that the RAB includes a significant element of retained inflation and
assets that do not contribute to the provision of the services
Spark Infrastructure The current approach to setting the benchmark term and level of gearing is
appropriate and the current benchmark remains appropriate
Source: TBC
2.4 Independent expert views
Independent experts have also outlined views on the benchmark gearing ratio and
methods for estimating it.
In this section, we do not aim to exhaustively cover all the views, but rather highlight
some of the key considerations to facilitate discussion. We suggest some questions
for further discussion in section 5.
In this section, we discuss:
Reports by the Allen Consulting Group submitted to us during our 2009 review of
rate of return parameters.
Incenta Economic Consulting’s recent report to the Queensland Competition
Authority and its findings on the gearing of listed Australian energy utilities.
2.4.1 Allen Consulting Group
As part of our 2009 review of WACC parameters, Allen Consulting Group provided a
series of reports on gearing. These reports were prepared for the Energy Networks
12
Association, Grid Australia, and the Australian Pipeline Industry Association
(collectively referred to as the Joint Industry Associations or JIA).
In September 2008 Allen Consulting Group (ACG) provided advice on gearing to the
JIA in response to our August 2008 issues paper. In January 2009 ACG provided
advice on gearing to the JIA in response to our December 2008 draft guideline.
The following is a summary of the submissions made by ACG in these reports.
Benchmark vs actual gearing
ACG submitted that using a benchmark gearing ratio, rather than a business’ actual
gearing, has the advantages of providing an incentive for regulated businesses to
adopt efficient gearing structures and of not exposing consumers to the vagaries of
gearing levels adopted by individual businesses. ACG noted the underlying
assumption of benchmarking that observed levels of gearing in the market will tend
towards efficient levels.
ACG noted that there has been a high degree of consistency in Australia in setting the
regulatory gearing level at 60 percent.
Measures of gearing (market, book, and RAB)
ACG submitted that as market values of gearing (or book values as a second-best
alternative) are available, and since the enterprise value of regulated businesses
exceeds the Regulatory Asset Base (RAB), it is not appropriate to apply the Debt/RAB
ratio of gearing. ACG submitted that in commercial practice this measure is only used
as a secondary metric indicating ability to meet debt commitments.
ACG submitted that care should be exercised in the analysis of a period in which there
has been a large and rapid increase in interest rates, as there had been around 2007-
08. ACG submitted that under these conditions it is likely that the common gearing
measure using the market value of equity and book value of debt will overstate the
level of market gearing, since the book value of debt will overstate the market value of
debt.
Selection of the comparator group
ACG submitted that it is advisable to take care in selecting an appropriate group of
comparable businesses. In particular, it may be necessary to take account of non-
regulated activities of some comparable businesses and the effect that those activities
might have on the observed levels of gearing. ACG also submitted that since the
number of Australian comparators is small, it may be necessary to examine
appropriate international comparators.
Debt structures (hybrid securities and double leverage)
ACG submitted that hybrid securities such as convertible debt should be classified as
debt until converted, and that shareholder loans need to be subtracted from the value
13
of debt when they are stapled (and therefore the value of the equity will reflect their
economic value) and classified as equity.
Double leverage refers to situations involving a vertical structure, where an amount of
debt is carried by an operating subsidiary, while an additional amount of debt is carried
at the holding company level. ACG submitted that double leverage should be taken
into account to estimate the level of gearing appropriate to the regulated asset.
Estimates of gearing
Examining the available information for Australian regulated energy businesses ACG
found that:
Standard & Poor’s measures the Total Debt / RAB at approximately 95 per cent;
Standard and Poor’s measures the book value of Total Debt / Total Capital at
approximately 60 per cent, although there was a considerable range around these
values and not all these businesses could be considered appropriate comparators;
ACG measured the average ‘market gearing’ (Net Debt / Net Debt plus Market
Capitalisation of Equity) of five comparable businesses to be almost precisely 60
per cent over the period from 2003 to 2008.
Market gearing tended to reduce slightly over the 5 years from 2003 to 2008, with a
small increase in the last year (2007). ACG submitted that this was due to rapidly
rising interest rates (and falling equity values) emerging from the credit crunch.
ACG concluded that there was no persuasive evidence to cause the regulatory gearing
level to be moved from the prevailing level of 60 percent proposed by the AER. Based
on available evidence, ACG submitted that 60 percent debt gearing is a good
representation of the optimal gearing level.
2.4.2 Incenta Economic Consulting
Incenta Economic Consulting (Incenta) provided advice on gearing to the Queensland
Competition Authority (QCA) in November 2017. The advice was for the purposes of
the QCA’s recommendations to the Queensland Treasurer and Minister for Trade and
Investment regarding Seqwater’s bulk water prices for the period 1 July 2018 to 30
June 2021. Seqwater provides bulk water services to 11 council areas in south east
Queensland.
The QCA engaged Incenta Economic Consulting (Incenta) to advise on certain firm-
specific weighted average cost of capital (WACC) parameters for Seqwater’s Weighted
Average Cost of Capital (WACC).
As part of its investigation, Incenta reviewed recent evidence for the gearing for listed
Australian energy utilities and found it to indicate gearing of approximately 60 per cent
14
over the last 10 years.5 Incenta did not provide further detail on how it reviewed recent
gearing evidence of listed Australian energy utilities, but stated:
We reviewed the empirical evidence on regulated Australian energy businesses
that lies behind the adoption of a benchmark gearing level of 60 per cent. We
also reviewed more recent evidence for the gearing of the remaining listed
Australian energy utilities and found it to indicate gearing of approximately 60
per cent over the last 10 years.
5 Incenta, Estimating Seqwater’s firm-specific WACC parameters for the 2018-21 bulk water price investigation,
November 2017, p.6
15
3 Updated gearing estimates
The gearing estimates presented in this section are predominately based on the
methods used in our 2013 rate of return guideline and 2009 review of WACC
parameters. Further detail on the estimation methods underlying these estimates is set
out in section 4.
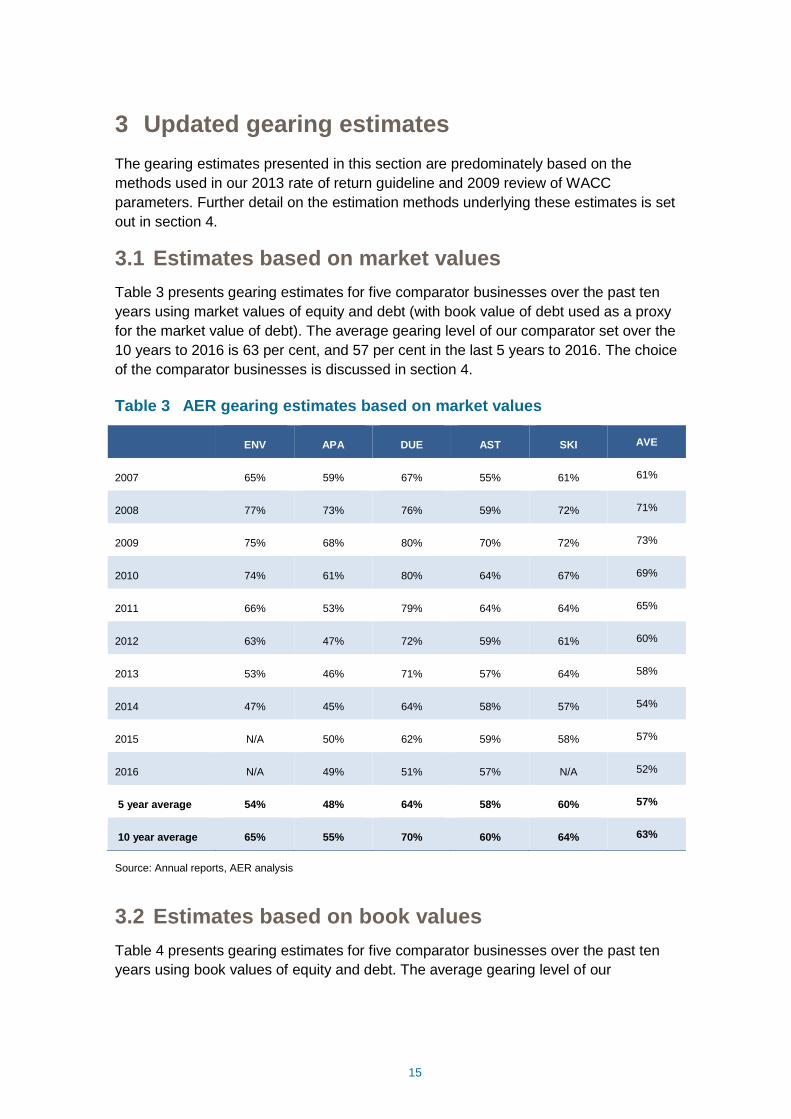
3.1 Estimates based on market values
Table 3 presents gearing estimates for five comparator businesses over the past ten
years using market values of equity and debt (with book value of debt used as a proxy
for the market value of debt). The average gearing level of our comparator set over the
10 years to 2016 is 63 per cent, and 57 per cent in the last 5 years to 2016. The choice
of the comparator businesses is discussed in section 4.
Table 3 AER gearing estimates based on market values
ENV APA DUE AST SKI AVE
2007 65% 59% 67% 55% 61% 61%
2008 77% 73% 76% 59% 72% 71%
2009 75% 68% 80% 70% 72% 73%
2010 74% 61% 80% 64% 67% 69%
2011 66% 53% 79% 64% 64% 65%
2012 63% 47% 72% 59% 61% 60%
2013 53% 46% 71% 57% 64% 58%
2014 47% 45% 64% 58% 57% 54%
2015 N/A 50% 62% 59% 58% 57%
2016 N/A 49% 51% 57% N/A 52%
5 year average 54% 48% 64% 58% 60% 57%
10 year average 65% 55% 70% 60% 64% 63%
Source: Annual reports, AER analysis
3.2 Estimates based on book values
Table 4 presents gearing estimates for five comparator businesses over the past ten
years using book values of equity and debt. The average gearing level of our
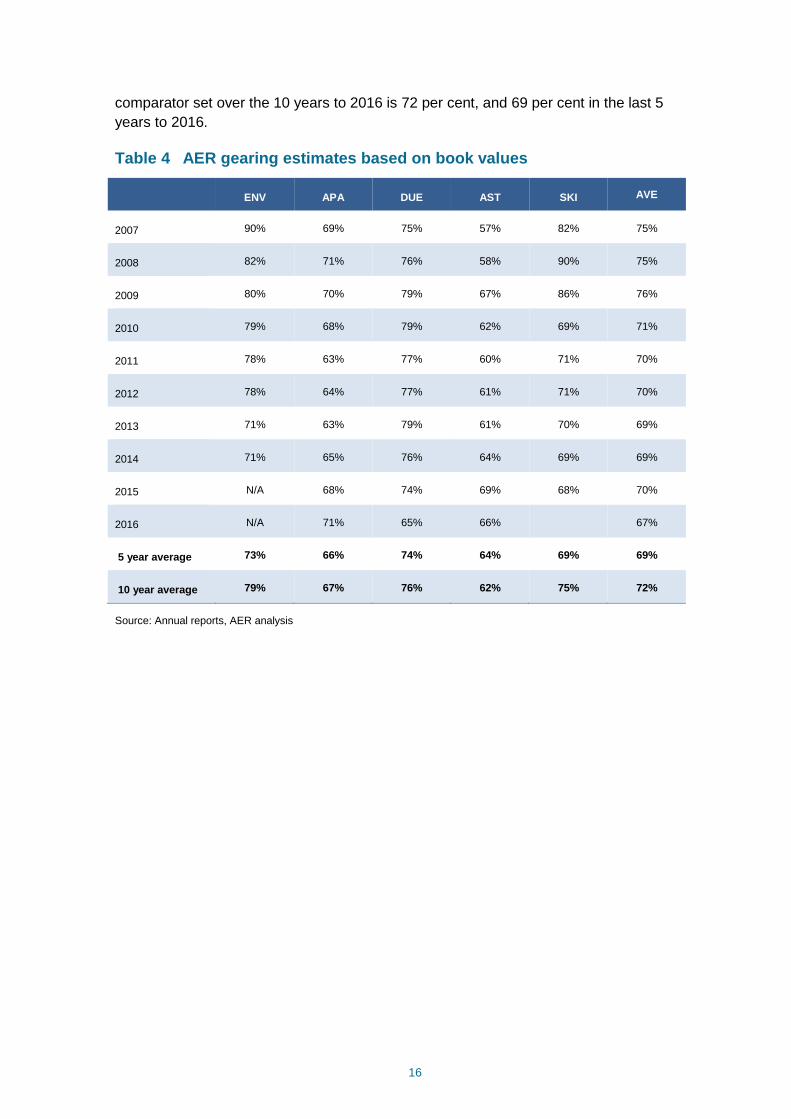
16
comparator set over the 10 years to 2016 is 72 per cent, and 69 per cent in the last 5
years to 2016.
Table 4 AER gearing estimates based on book values
ENV APA DUE AST SKI AVE
2007 90% 69% 75% 57% 82% 75%
2008 82% 71% 76% 58% 90% 75%
2009 80% 70% 79% 67% 86% 76%
2010 79% 68% 79% 62% 69% 71%
2011 78% 63% 77% 60% 71% 70%
2012 78% 64% 77% 61% 71% 70%
2013 71% 63% 79% 61% 70% 69%
2014 71% 65% 76% 64% 69% 69%
2015 N/A 68% 74% 69% 68% 70%
2016 N/A 71% 65% 66% 67%
5 year average 73% 66% 74% 64% 69% 69%
10 year average 79% 67% 76% 62% 75% 72%
Source: Annual reports, AER analysis
17
4 Estimation method used in our 2013 and 2009
rate of return guidelines
Our gearing estimates in section 3 are predominately based on the estimation methods
used in our 2013 rate of return guideline and 2009 review of WACC parameters. The
main features of this method and the considerations involved are outlined in the
sections below.
4.1 Measures of value: market, book, or RAB
A gearing ratio requires estimates of the value of a business’ debt and equity. These
values can be obtained from a business’ books (financial statements) or from market
prices of traded debt and equity securities.
In principle both the debt and equity values should be obtained from the same
information source (either book or market data). For example, if a market measure of
gearing is desired, then both the value of debt and equity should be sourced from
market data.
However, there may be liquidity issues with the market data for the debt securities of
the comparator businesses in our sample (that is, these securities may be traded
infrequently). To address this issue, book value of debt is typically used as a proxy for
the market value of debt. This is a generally accepted proxy, especially in the case of
regulated energy networks, for which the RAB anchors the asset value.
Therefore, in most cases, the choice between market and book values refers to a
choice about the value of equity.
Each of the valuation approaches has some limitations. In particular, market valuations
are restricted to listed businesses and therefore do not facilitate analysis of
government owned or private businesses. Similarly, market values may diverge from
book values during periods of interest rate volatility. On the other hand, while book
valuations may address these issues they are an historical measure, and as such may
not be representative of forward looking values.
In our 2009 and 2013 rate of return guidelines we considered that a number of
approaches covering market values and book values of gearing should be adopted to
inform the gearing level of an efficient NSP. In our 2013 guideline, the Bloomberg
market value approach was one method used and Standard and Poor’s book value
measure of gearing was another.6 The AER has also had regard to the ACG’s adjusted
measure of Bloomberg’s ‘market valuation’ approach, but only when applied to total
debt values.
6 No further reports with regard to this was published by S&P
18
Another measure that may be used to calculate a gearing estimate is the regulatory
asset base (RAB) value. RAB value is a measure of the value of the assets used to
provide regulated energy network services. It has the advantage of not including any
assets that are not used for providing the regulated energy network services. However,
it is a type of book value, so it may not be representative of forward looking values.
Further, there is no corresponding regulatory debt value that can be used to estimate
gearing on a consistent basis (as debt levels are simply derived from the RAB and the
gearing estimate – creating a circularity problem). Therefore, book value of debt from
financial statements would need to be applied to the RAB value to come to a gearing
estimate. In doing this, adjustments to the observed level of debt may be required to
remove any debt that does not relate to a business’ regulated activities in order for the
debt to RAB ratio to be a useful measure.
4.1.1 Implications of RAB multiples greater than one
Some stakeholders have submitted concern about the impact on gearing estimates
from RAB multiples greater than one.
A RAB multiple is the market value of the firm (its enterprise value) divided by its
regulatory asset base (RAB). RAB multiples are discussed in greater detail in our
discussion paper on financial performance measures.
Subject to satisfying several conditions, A RAB multiple of 1 indicates that the present
(market) value of the future stream of expected cash-flows of the business is just equal
to the regulatory asset base. A RAB multiple greater than one indicates that the market
expects future cash flows of the business to exceed the RAB (in present value terms).
If future cash flows are greater, then the business can maintain a higher (absolute)
level of borrowings while maintaining the same gearing ratio.
For example, consider a business that has $60 million in debt, $40 million in market
value of equity, and a RAB value of $80 million. Under a market value approach, it has
an enterprise value of $100 million and a gearing estimate of 60 per cent. Under a RAB
value approach, its enterprise value is $80 million and its gearing estimate is 75 per
cent.
However, it is the market value gearing estimate that is calculated on a consistent
basis, using market values for both debt and equity. As such, it may better reflect the
leverage risks involved in taking on debt to fund the provision of regulated energy
network services (and investment in the RAB). Conversely, the RAB value gearing
estimate combines a business’ actual debt value with regulatory enterprise value.
However, actual debt is secured against all expected cash flow (e.g. including cash
flows from incentive schemes), not just against the RAB value and associated ex ante
return on capital cash flows projected in our regulatory determinations.
To understand if the gearing estimate is appropriate, it may be necessary to examine
the reasons why the market enterprise value is greater than RAB. This is discussed
further in our discussion paper on financial performance measures.
19
4.2 Comparator businesses
As outlined in our discussion paper on risk, it is important that our regulatory gearing
estimate contributes to an overall rate of return that reflects efficient financing costs
given the risks involved in providing regulated energy network services. We use data
for businesses that are likely to have a degree of risk that is as similar as possible to
the risk of providing regulated energy network services. In assessing whether a
business is likely to have this degree of risk, we look at a few key characteristics,
namely that the business provides (at least in combination with other services):
energy network services,
within Australia, and
that are subject to price or revenue cap regulation.
We note that the comparator businesses included in the sample meet these
characteristics to varying degrees. Some businesses have greater cash flow from non-
energy network services than other businesses. Some businesses have more
unregulated energy network services than other businesses. The composition of the
sample, and the extent to which the sample as a whole reflects the aforementioned key
characteristics, may also change over time.
Another consideration for the sample of businesses is the availability of relevant data.
Businesses that are not listed must necessarily be excluded from market-based
gearing estimates because observed market values of equity are not available.
Unlisted businesses may be used to estimate book value-based or RAB value-based
gearing estimates. However, caution should be exercised when comparing market
value gearing estimates against book value or RAB value gearing estimates if the
sample compositions are different.
The AER’s sample of comparator businesses used to calculate the gearing estimates
in section 3 include the APA Group; Diversified Utility and Energy Trusts (DUET);
Envestra; AusNet Services (formerly SP AusNet); and Spark Infrastructure. These are
the Australian businesses that own regulated gas and/or electricity energy networks
and that are, or have been, listed on the ASX within the last five years.
This sample has changed over time. These changes have been driven by the
listing/delisting of relevant firms, but the principles underpinning the selection of
comparator businesses has not changed. In our 2013 rate of return guideline our
sample included the businesses listed above as well as AGL, Alinta, GasNet, and
Hastings Diversified Utilities Fund. These businesses were all delisted or divested their
energy network assets more than 5 years ago (three of the four businesses were
20
delisted more than 10 years ago),7 and so no longer fall within our sample period (see
section 4.8).
4.3 Debt structuring (double leveraging)
The term ‘double leveraging’ refers to businesses with a vertical structure, where an
amount of debt is held by a particular business, while an additional amount of debt is
held by a holding company that has an investment in that business. Spark
Infrastructure (Spark) is the only businesses selected in the current comparator sample
with multiple layers of debt. Spark has investments in several firms that also carry debt.
However, as Spark holds less than 50% of the equity in the firms it invest in the debt of
these firms is not reflected on its balance sheet.
Adjusting for double leverage involves taking account of the short and long-term debt
of the lower level businesses that the higher level business has an investment in. The
higher level business’ ownership of the lower level business (expressed as a
percentage) is then multiplied by the total debt amounts from lower level business (or
debt at the investment asset level) to obtain the levels of debt that apply (or is
attributed) to the higher level business (or holding company). Finally, the higher level
business’ own debt is added to the calculated levels of debt based upon the higher
level business’ investment share of the lower level business and once these totals
have been derived, the different gearing ratios for the higher level business (or holding
company) are calculated.
In our 2009 and 2013 rate of return guidelines we stated that it is not clear whether or
not adjusting for double leveraging is more representative of the level of gearing and,
in the absence of further evidence, both will be considered. We note that the estimates
presented in section have been adjusted to account for debt held by the energy
network businesses in which Spark Infrastructure has a minority stake (SA Power
Networks and Victoria Power Networks).
4.4 Gross or net debt
Gearing estimates may be calculated using debt values measured as either gross debt
or net debt. Net debt is gross debt less cash (or cash and marketable securities).
We examined gearing based on both the net debt and gross debt approach and noted
that the difference was insignificant as the sample of comparator firms held a very
small level of cash. Gearing estimates set out in section 3 are based on gross debt
measures.
In our 2009 and 2013 guidelines we considered the use of net debt to estimate gearing
was inappropriate.8 The use of net debt in estimating gearing levels requires the total
7 AGL Ltd divested its energy network assets in October 2006. GasNet was delisted in December 2006. Alinta Ltd
(AAN) was delisted in September 2007. Hastings Diversified Utilities Fund was delisted in December 2012. 8 AER, Review of the weighted average cost of capital (WACC) parameters, op.cit., December 2008, p.69
21
amount of cash and cash equivalents to be subtracted from total debt on the grounds
that cash can be used to retire debt. However, if a business’ cash is used to retire a
portion of its debt then not only would the value of the debt liability be reduced, but the
value of the cash assets would also no longer be available. It is not clear how this
would result in a material impact on estimated gearing. Further, an efficient energy
network business may have some level of cash as part of its asset mix, and it is not
clear why we would consider this cash to be funded entirely by debt or equity. In the
absence of other evidence, we have considered that cash should be treated the same
as any other asset, and assumed to be funded through debt and/or equity at
benchmarked gearing ratios (calculated using gross debt measures).
In reports submitted to our 2009 guideline review, ACG initially proposed the use of net
debt to estimate gearing. In response to our draft guideline, ACG agreed that gross
debt was more appropriate for estimating a benchmark gearing level, but submitted
that the concept of net debt should be applied when measuring equity betas.
4.5 Hybrid securities
Hybrid securities are securities that have characteristics of both debt and equity. As
explained by the ASX:9
Hybrid securities typically promise to pay a rate of return (fixed or floating) until
a certain date, in the same way debt securities do. However, they also have
equity-like features that can mean they may provide a higher rate of return than
regular debt securities. This is due to the higher inherent risk of these equity-
like features. These features may include reduced certainty as to the timing and
amount of income generated from holding the security, the potential for the
security to be converted into equity or early terminated at a time not beneficial
to the holder, and the holder being subordinate to other creditors in the event of
insolvency.
…
Hybrid securities include a very broad array of different products that have
markedly different terms and conditions. They range from relatively simple
convertible debt securities to some very complex financial instruments.
There are three broad categories of hybrid security that are traded on the ASX:
Convertible bonds
A convertible debt security is one that gives either the investor or the issuer the
option to convert it into another type of security at a specified date in the future.
Often this will be ordinary shares in the issuer.
Preference shares
9 ASX, Understanding hybrid securities, July 2017, pp. 2, 6.
22
A preference share is given that name because holders of a preference share rank
ahead of holders of ordinary shares for the payment of dividends and recovery of
capital. Unlike ordinary shares, which pay a variable dividend rate as determined
by the directors of the company, preference shares usually carry a specified
dividend rate. It may be a fixed rate or a floating rate. They also usually carry a
right to be redeemed for cash at maturity, much like a bond. The holders of
preference shares generally do not have voting rights.
Capital notes
Capital notes are debt securities that have equity-like features attached. Examples
include:
perpetual debt securities that have no fixed maturity date;
subordinated debt securities whose rights with respect to payment of interest and
repayment of principal rank behind (are subordinated to) another class or classes of
debt; and
knock-out debt securities that give the issuer or a third party (such as a prudential
regulator like the Australian Prudential Regulation Authority) a right to extinguish them
under certain conditions.
Hybrid securities are markedly more heterogeneous than typical debt securities, which
makes adjusting for hybrid securities difficult. In order to adjust for hybrid securities in
gearing estimates, it is important to understand the terms and conditions of each
security.
For one type of relatively simple hybrid security – convertible bonds – the security may
be considered to include a debt security (bond) and an option to convert to equity.
Pricing of the option component may allow for the debt component of the hybrid
security to be isolated and included in our gearing estimates. Further, whilst the option
is well ‘out of the money’, the market price of the convertible bond can be expected to
perform similarly to a simple bond paying an equivalent return. However, as the option
gets closer to being ‘in the money’, or the hybrid security has more complex terms and
conditions, adjusting for hybrid securities in our gearing estimation is likely to be
substantially more difficult.
In 2008 ACG submitted to our review of rate of return parameters that convertible
securities are excluded from equity by Standard & Poor’s and have been excluded
from equity by US regulators until they have been converted to equity.10
The subsections below detail other hybrid securities that apply to Envestra, Spark
Infrastructure, and AusNet Services. We are not currently aware of any other hybrid
securities issued by the comparator businesses listed in section 4.2 or their
subsidiaries.
10 ACG, Review of gearing issues raised in AER Issues Paper, 21 September 2008, p. 21.
23
Envestra’s shareholder loan notes
Envestra’s prospectus provides the following description of its loan notes:11
The loan notes are unsecured subordinated debts of Envestra. The Condition
of Issue provides that, in a liquidation of Envestra, the rights of Noteholders to
recover any moneys owing to them are subordinated or postponed to all other
creditors in Envestra while Envestra has any Finance debt. This means that all
debts and moneys owing by Envestra to all other creditors of Envestra are
required to be paid or satisfied before moneys owing to Noteholders can be
paid.
The principal amount of the Loan Note must be repaid by 2047. However,
repayments of principal on the Loan Notes can be made at any time if the
terms and conditions of Envestra’s Finance Debt permit.
Interest rate on the Notes are capped at certain levels but it is only payable to
the extent to which there is available cash for the relevant Interest Period and
the payment of interest would not cause Envestra to breach its obligations
under any Finance Debt arrangements. Where there is insufficient or no
available cash for an interest period to make an interest payment up to the
amount of the capped interest rates, investors will receive a lower rate of
interest or no interest payment at all. A shortfall in any interest period will not be
carried forward for payment later as investors have no entitlement to receive
payment of interest shortfalls.
ACG submitted that Envestra Shareholder Loan Notes were included as debt for
accounting purposes but had characteristics of equity:
they were stapled to each Envestra share, with no separate existence without the
share,
they were subordinate to all other creditors in Envestra; and
returns on the notes were not guaranteed and only payable to the extent to which
there is available cash.
In our 2009 review of WACC parameters ACG submitted,12 and we agreed,13 that
these loan notes should be treated as equity. As such, the value of these loan notes
should be removed from the value of debt when estimating gearing from market
values, and transferred from debt to equity when estimating gearing from book
values.14
11 ACG, Review of gearing issues raised in AER Issues Paper, 21 September 2008, p. 32. 12 ACG, Review of gearing issues raised in AER Issues Paper, 21 September 2008, p. 22. 13 AER, Final Decision, Review of the WACC parameters, May 2009, p. 119. 14 In effect, the loan note is treated as equity and so must be transferred from debt to equity when using book
gearing. However, market values of Envestra shares are likely to already have priced the treatment of loan notes
as equity, and so only the book value of debt (used to proxy the market value of debt) needs to be adjusted when
using market gearing.
24
Over time the balance of the Loan Notes declined as the capital value of the notes
were distributed to security holders. We obtained information on the Loan Note
balance over time from Envestra annual reports, but where this was not available
information was obtained from Envestra’s website.
Spark Infrastructure’s shareholder loan notes
Spark Infrastructure’s prospectus provides the following description of its loan notes:15
The units in Spark Infrastructure Trust, the shares and CDIs in the Stapled
Companies and the Loan Notes are stapled together and cannot be traded
independently…They are subordinated to all secured and unsecured creditors
of the Spark Infrastructure Trust for all amounts.
…
The term of the Loan Notes is 100 years after the date of the 14.3.7 Note Trust
Deed, unless ended earlier in certain circumstances. On expiry of the term, the
Loan Notes will be redeemed by the Responsible Entity, and the then
outstanding principal amount will be repaid, together with accrued and unpaid
interest.
The Responsible Entity can also redeem the Loan Notes early in certain
circumstances, including:
– on a reset date (see above) by prior notice to Holders;
– if certain tax or regulatory events occur as specified in the Note Trust Deed;
or
– if the Noteholder holds less than a minimum holding or holds a small holding
of Loan Notes.
The Responsible Entity has the right to repay in part some of the principal
amount of all (but not some) of the Loan Notes.
Upon redemption of the Loan Notes in full, the Holders are entitled to be repaid
the then face value of the Loan Notes plus any outstanding interest, except if
the Loan Notes have been redeemed as a result of a tax or regulatory event as
specified in the Note Trust Deed. In those circumstances, the Responsible
Entity may apply the face value of the Loan Notes payable at that time as
consideration for the issue of a New Attached Security to the Noteholders.
…
The Loan Notes are a debt product with a 100 year non-amortising term which
will be required to be refinanced at maturity.
15 Spark Infrastructure, Prospectus and product disclosure statement, 18 November 2005, pp. 4, 31, 86, 140.
25
Holders will receive interest on principal outstanding on the Loan Notes which
is cumulative. The interest rate payable on principal outstanding on the Loan
Note is:
• for the period to 30 November 2010, 10.85% per annum; and
• after 30 November 2010, a market based rate comprising the prevailing five
year swap rate and a credit margin, which is reset every five years until 2105.
Interest on the Loan Notes may only be paid to the extent that Spark
Infrastructure has available cash. The Responsible Entity may defer payment of
interest on the Loan Notes at any time and in the event that interest on the
Loan Notes is deferred, the interest will accrue until such time as Spark
Infrastructure is able to pay the accrued interest.
…
$1,262.8 million under the Offer will be allocated to Spark Infrastructure as
Loan Notes which will be used to subscribe for Subordinated Debt in CHEDHA
and Preferred Partnership Capital in ETSA [Spark Infrastructure owns a 49 per
cent stake in both CHEDHA and ETSA].
Spark Infrastructure’s loan notes are denoted as a debt product but have
characteristics of equity:
The notes are stapled to shares in Spark Infrastructure and cannot be traded
independently,
The notes are subordinate to all secured and unsecured creditors, and
Interest on the notes is only payable to the extent that there is available cash.
In our 2009 review of WACC parameters ACG submitted,16 and we agreed,17 that
these loan notes should be treated as equity. As such, the value of these loan notes
should be removed from the value of debt when estimating gearing from market
values, and transferred from debt to equity when estimating gearing from book
values.18
AusNet Services’ non-convertible subordinated notes
16 ACG, Review of gearing issues raised in AER Issues Paper, 21 September 2008, p. 22. 17 AER, Final Decision, Review of the WACC parameters, May 2009, p. 119. 18 In effect, the loan note is treated as equity and so must be transferred from debt to equity when using book
gearing. However, market values of Envestra shares are likely to already have priced the treatment of loan notes
as equity, and so only the book value of debt (used to proxy the market value of debt) needs to be adjusted when
using market gearing.
26
More recently, AusNet Services’ states that it has successfully priced two hybrid
security issues in the form of non-convertible subordinated notes.19 AusNet Services’
2017 annual report states the face value of AusNet Services’ hybrid securities as at 31
March 2017 was $705.3 million, compared to a face value of its other current and non-
current borrowings of $5,977.4 million.20
Our preliminary updated gearing estimates set out in section 3 do not make any
adjustment for AusNet Services’ hybrid securities – these securities are treated as debt
in AusNet Services’ financial statements and we have included the value of these
securities in our gearing estimates as debt without adjustment. Given the relative size
of AusNet Services’ current level of debt and hybrid securities, we note that adjusting
for these hybrid securities is unlikely to have a material impact on the overall gearing
estimates.
We welcome stakeholder views on whether any adjustments to account for AusNet
Services’ hybrid securities would better achieve the national gas and electricity
objectives, and how any adjustments may be implemented.
4.6 Borrowings and other accounting liabilities
As noted in section 4.1, in calculating the gearing estimates in section 3 we have used
the book value of debt as a proxy for the market value of debt. We have taken book
value of debt as the sum of current and non-current borrowings from the annual reports
and financial statements of the comparator businesses.
Other liabilities listed in financial statements include payables and deferred tax
liabilities. We have not included these in estimated debt values for the purposes of
section 3.
Payables refer to amounts that the business owes to its vendors, and are effectively a
type of short-term debt. Payables are off-set by receivables, which refer to amounts
owed to the business by its customers. The net position of payables/receivables is
typically relatively small and is unlikely to have a material impact on our gearing
estimates.
Deferred tax liabilities arise when there are differences in the expenses that a business
can claim for tax and accounting purposes. A common source of deferred tax liability is
depreciation expense. Accounting depreciation often follows a straight-line method
while accelerated depreciation is typically allowed for tax purposes. Although deferred
tax liabilities may represent amounts that may eventually need to be paid to the tax
office, they are not a typical debt obligation but rather an accounting entry to recognise
the different path of tax expenses. Deferred tax liabilities differ from typical debt
19 AusNet Services, AusNet Services Successfully Prices SGD200M Hybrid Offer, ASX and SGX-ST release, 1
March 2016, p.1; AusNet Services, AusNet Services successfully prices USD 375M hybrid offer, ASX and SGX-ST
release, 10 March 2016, p.1. 20 AusNet Services, Annual Report 2017, 16 June 2017, p. 91.
27
obligations in important ways: there are no associated interest payments and the
liability is not paid out or given priority in event of bankruptcy.
4.7 Data sources
In our 2013 guideline we used two independent data sources (namely Bloomberg and
Standard & Poor’s). We are not aware of any recent reports published by Standard &
Poor’s on its estimation for gearing. For the 2018 guideline we propose to augment our
information by using data from company financial reports along with the data provided
from Bloomberg to calculate the gearing estimates in section 3. We note that the data
from Bloomberg is broadly consistent with information from company financial
statements.
4.8 Sample period and frequency
When estimating gearing we need to consider:
The time period over which we will observe gearing estimates.
The frequency of observations within the specified time period – that is, whether we
observe gearing estimates on an annual, semi-annual, or other frequency.
When examining the appropriate period and frequency to use when obtaining an
average level of gearing we recognise the need to consider:
the period and frequency used for other rate of return parameters (especially the
equity beta which is re-levered using gearing)
the trade-off between examining relevant data and obtaining a statistically reliable
estimate which may smooth out transitory shocks that may occur,
the extent to which it may take time for observed gearing levels to change towards
target levels while market values of equity can move significantly and relatively
quickly, and
the availability of data (e.g. financial reports, publicly available data sets).
We have generally considered that it is desirable to have a consistent approach to
estimating rate of return parameters and have therefore tended to adopt a consistent
period and frequency across all rate of return parameters.
On frequency, gearing estimates set out in section 3 are based on annual data from
financial statements. We note that the frequency of observations is limited to quarterly,
annual or semi-annual observations consistent with when listed businesses release
financial reports. Most financial data services such as Bloomberg and Standard &
Poor’s provide gearing estimates on an annual or semi-annual basis.
28
Submissions to previous AER reviews have suggested that increasing the frequency of
the observations to greater than semi-annual is unlikely to have a material impact on
the average gearing ratio.21
On sample period, the gearing estimates in section 3 are shown for periods of both five
and ten years. Given annual data, sample periods of at least 5 years may be needed to
retain a sufficient number of observations for each comparator business.
We note that the gearing estimates in section 3 have been calculated using evidence
from market data over a period that is broadly consistent with the calculation of equity
betas.22
21 AER, Final Decision, Review of the WACC parameters, May 2009, p. 114 22 AER, Initiation, Information paper, Staff study on Equity Beta, June 2017.
29
5 Current approach and questions for
discussion
Our current approach is based on the following principles:
The estimation of a benchmark gearing ratio should, subject to practical data
limitations, be consistent with the estimation of other rate of return parameters.
We should consider gearing estimates based on both market and book values.
Due to the limitations of calculating the market value of debt, the book value of debt
is likely to be a valid proxy for the market value of debt.
It is inappropriate to use net debt, as cash could be funded by debt and/or equity.
The book value of loan notes should be removed from the book value of total debt.
It is not clear whether or not adjusting for double leveraging is more representative
of the level of gearing and, in the absence of further evidence, both will be
considered.
Gearing data of an annual frequency is likely to be sufficient, and an average of
gearing outcomes over a period of time reduces the likelihood that any recent
events may distort recorded gearing outcomes.
5.1 Questions for discussion
For the purposes of the concurrent expert evidence session discussion of gearing, we
recommend the following questions would be useful:
1. Should we use market, book, or RAB, values for determining the gearing level?
2. Is it preferable to directly use annual reports / financial statements as a source of
data as opposed to relying on Bloomberg?
3. What timeframe should gearing be measured over?
4. What gearing comparators are appropriate? Is our current list appropriate?
5. Are our current approaches appropriate (e.g. use of market values, use of gross
debt, inclusion of asset level debt when calculating the gearing of holding
companies like Spark, and current treatment of loan notes)?
6. How should we treat the hybrid securities issued by AusNet Services?
7. In the absence of sufficient market data about gearing, how should the AER
determine efficient gearing?
8. How should data relating to privately owned / non-listed entities debt be accounted
for in calculating gearing? Should overseas ownership, and parent companies’
30
financing acquisitions of network equity entirely from parent-company debt, be
accounted for in determining gearing and how?
9. Is the relationship between equity beta and gearing a ‘vicious/virtuous’ feedback
loop if gearing is based on market value/enterprise value of the entity?
10. Should the business obtain a rate of return on equity or on debt for retained
earnings, revaluation values?
11. If a business has regulated and unregulated assets, how much of the debt should
be assigned to each?
12. What do the current measures of gearing indicate over different time frames?
13. Is there sufficient relevant market data to determine an estimate for gearing for an
efficient network business?
31
6 Bibliography
M. Jenson, Agency Costs of Free Cash Flow, Corporate Finance and Takeovers, American
Economic Review, Vol.76, No.2, 1986.
ACCC, Final Decision: GasNet Australia access arrangement revisions for the Principal
Transmission System, 13 November 2002.
ACCC, Final Decision: Statement of principles for the regulation of electricity transmission
revenues, 8 December 2004.
AER, Final Decision: Better Regulation, Explanatory statement Rate of Return Guideline
(Appendices), December 2013.
Incenta, Estimating Seqwater’s firm-specific WACC parameters for the 2018-21 bulk water
price investigation, November 2017.
AER, Review of the weighted average cost of capital (WACC) parameters, December 2008.
ASX, Understanding hybrid securities, July 2017.
ACG, Review of gearing issues raised in AER Issues Paper, 21 September 2008.
Spark Infrastructure, Prospectus and product disclosure statement, 18 November 2005.
ACG, Review of gearing issues raised in AER Issues Paper, 21 September 2008.
AER, Final Decision, Review of the WACC parameters, May 2009.
AusNet Services, AusNet Services Successfully Prices SGD200M Hybrid Offer, ASX and
SGX-ST release, 1 March 2016.
AusNet Services, AusNet Services successfully prices USD 375M hybrid offer, ASX and SGX-
ST release, 10 March 2016.
AusNet Services, Annual Report 2017.
AER, Initiation, Information paper, Staff study on Equity Beta, June 2017