Embed Size (px)
DESCRIPTION
Discussion Panel: EURASIAN HYDROCARBON TRANSPORT CORRIDOR: DIVERSIFICATION STRATEGIES MYKHAILO GONCHAR NOMOS UKRAINE GDANSK, 29 NOV 2011. LNG can be winner in a pipeline race…. World deposits of shale gas, trln. cub. m. Norway: 1,98. Canada : 9,23. Ukraine : 1,0. Poland: 4,45. - PowerPoint PPT Presentation
Citation preview
Discussion Panel:EURASIAN HYDROCARBON TRANSPORT
CORRIDOR: DIVERSIFICATION STRATEGIES
MYKHAILO GONCHAR NOMOS UKRAINE
GDANSK, 29 NOV 2011
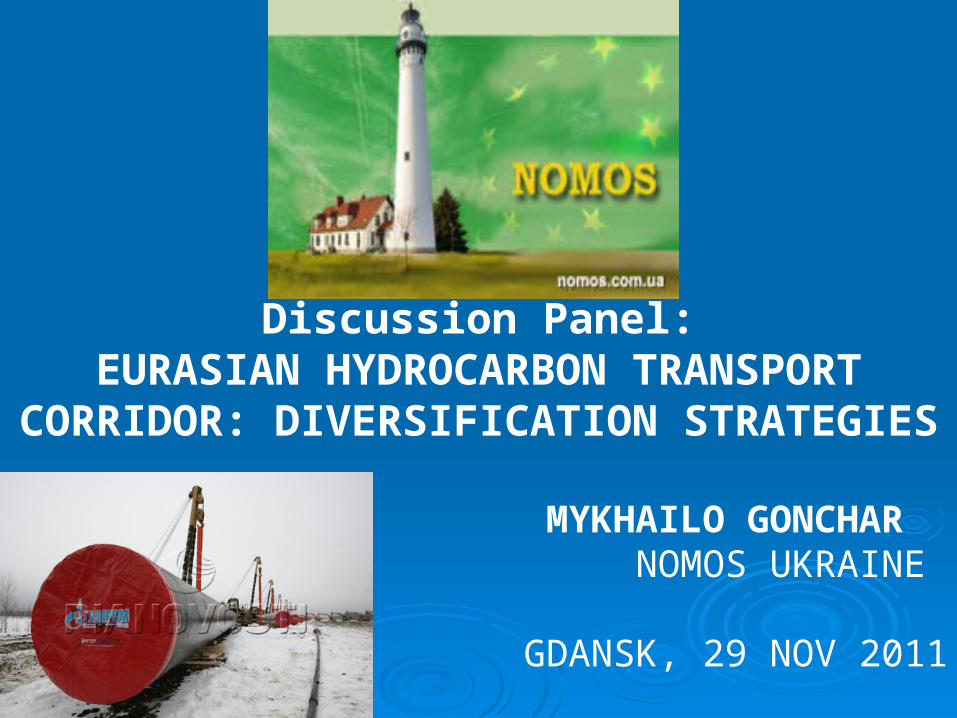
LNG can be winner in a pipeline race…
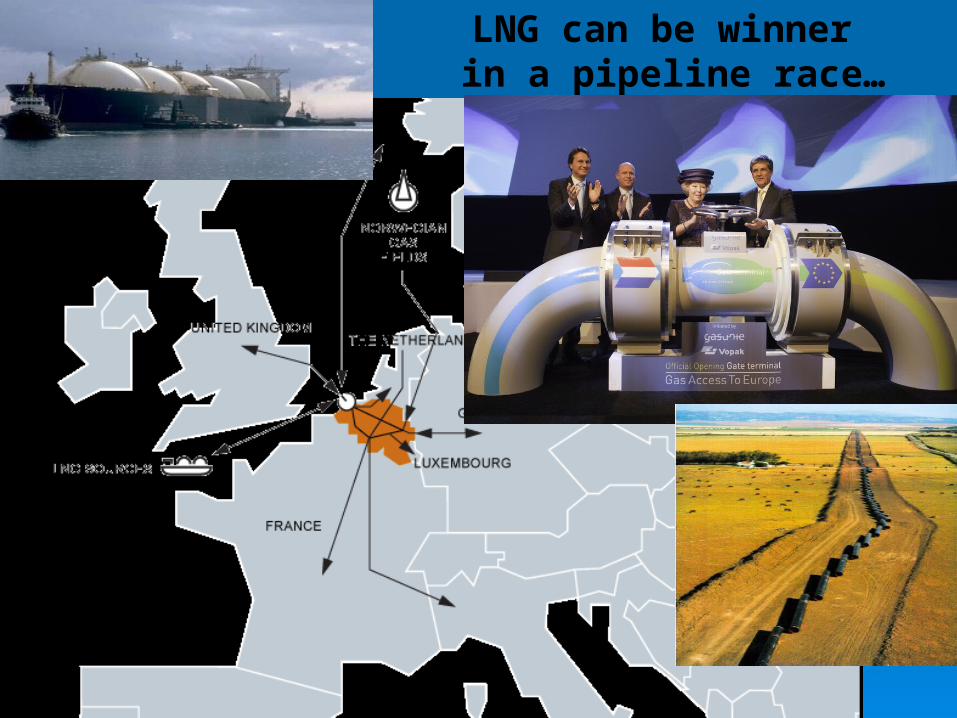
World deposits of shale gas, World deposits of shale gas, trln. cub. m.trln. cub. m.
Ukraine:1,0
USA: 20,52
China:30,34
Poland: 4,45
Libia:6,90
France: 4,28
Norway: 1,98
Australia:9,42
Argentina:18,42
Mexico:16,20
Canada: 9,23
S.Africa:11,54
Algeria:5,50
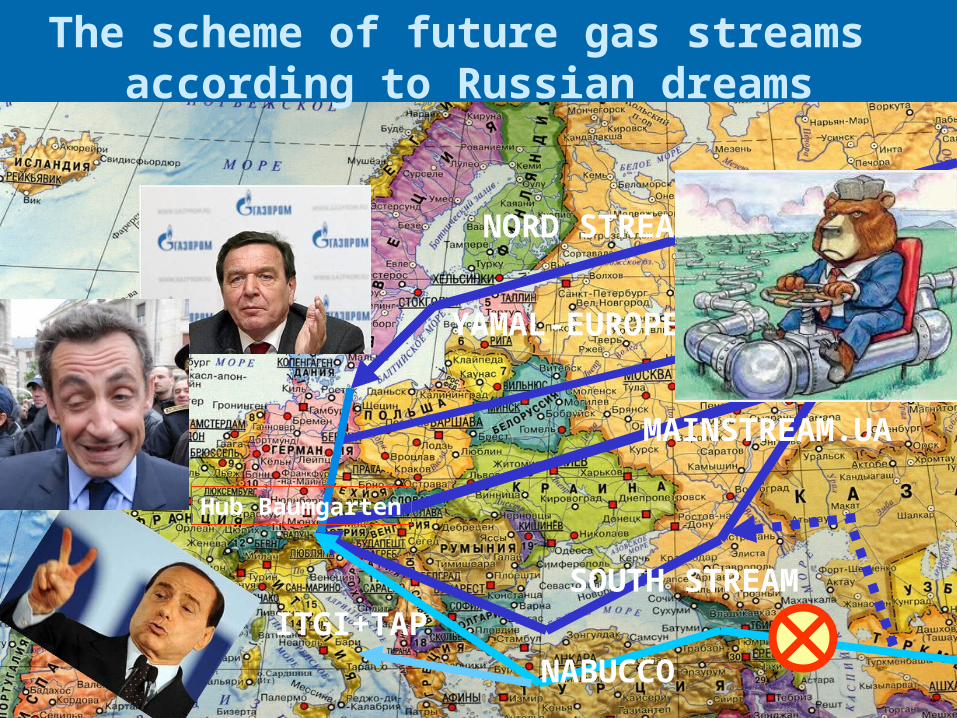
The scheme of future gas streams according to Russian dreams
NORD STREAM
SOUTH STREAM
YAMAL-EUROPE
MAINSTREAM.UA
NABUCCOITGI+TAP
Hub Baumgarten
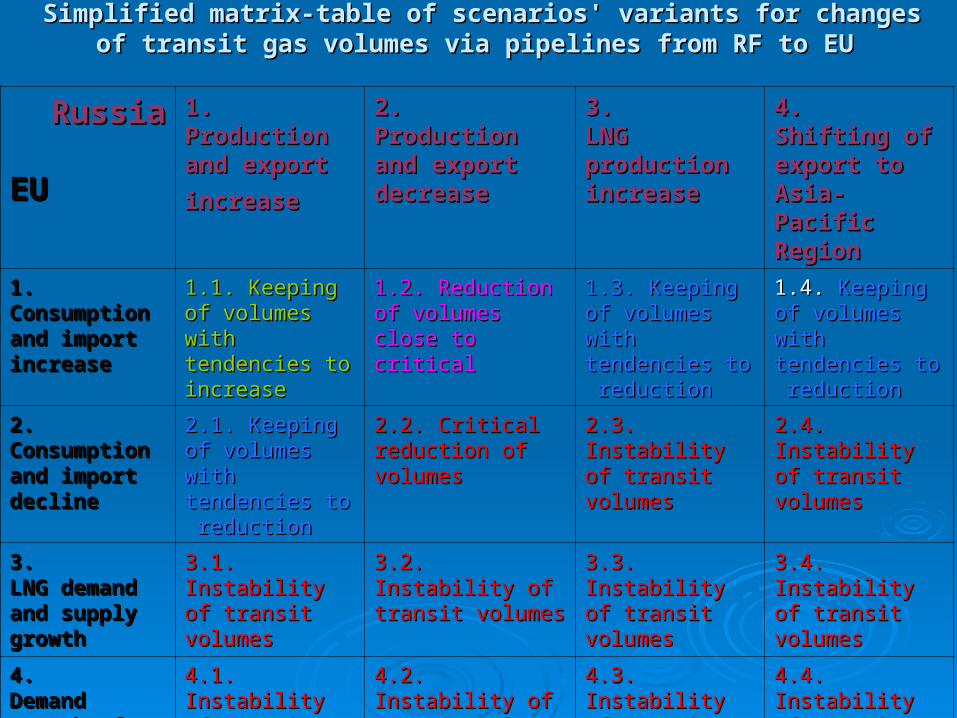
Simplified matrix-table of scenarios' variants for changesSimplified matrix-table of scenarios' variants for changes of transit gas volumes via pipelines from RF to EU of transit gas volumes via pipelines from RF to EU
RussiaRussia
EUEU
1. Production 1. Production and export and export
increaseincrease
2. 2. Production and Production and export decreaseexport decrease
3. 3. LNG LNG production production increaseincrease
4. 4. Shifting of Shifting of export to Asia-export to Asia-Pacific RegionPacific Region
1. 1. Consumption Consumption and import and import increaseincrease
1.1. Keeping of 1.1. Keeping of volumes with volumes with tendencies to tendencies to increaseincrease
1.2. Reduction of 1.2. Reduction of volumes close to volumes close to criticalcritical
1.3. Keeping of 1.3. Keeping of volumes with volumes with tendencies to tendencies to reductionreduction
1.4. 1.4. Keeping of Keeping of volumes with volumes with tendencies to tendencies to reductionreduction
2. 2. Consumption Consumption and import and import declinedecline
2.1. Keeping of 2.1. Keeping of volumes with volumes with tendencies to tendencies to reductionreduction
2.2. Critical 2.2. Critical reduction of reduction of volumes volumes
2.3. Instability of 2.3. Instability of transit volumes transit volumes
2.4. Instability of 2.4. Instability of transit volumestransit volumes
3. 3. LNG demand LNG demand and supply and supply growthgrowth
3.1. Instability of 3.1. Instability of transit volumestransit volumes
3.2. Instability of 3.2. Instability of transit volumestransit volumes
3.3. Instability of 3.3. Instability of transit volumestransit volumes
3.4. Instability of 3.4. Instability of transit volumestransit volumes
4. 4. Demand Demand growth from growth from non-RF non-RF sourcessources
4.1. Instability of 4.1. Instability of transit volumestransit volumes
4.2. Instability of 4.2. Instability of transit volumestransit volumes
4.3. Instability of 4.3. Instability of transit volumestransit volumes
4.4. Instability of 4.4. Instability of transit volumestransit volumes

Thank you for Thank you for your attention!your attention!
NOMOSNOMOS
www.nomos.com.uawww.nomos.com.ua
[email protected]@ukr.net