Embed Size (px)
Citation preview

Discrimination of Partial Discharge Sources in the UHF Domain
Steven D. Mitchell
School of Electrical and Computer Engineering, University of Newcastle,
Callaghan, N.S.W 2308, Australia
Martin Siegel, Michael Beltle and Stefan Tenbohlen Institute of Power Transmission and High Voltage Technology
University of Stuttgart 70569 Stuttgart, Germany
ABSTRACT
Partial discharges (PD) are a significant contributor to insulation failure within power transformers, and as such, the localizing of a PD source can be of critical importance when it comes to a transformer’s assessment and repair. One PD localization technique which is acquiring increased attention is the application of an ultra high frequency (UHF) sensor to trigger an acoustic array. This hybrid approach helps to overcome the poor signal to noise sensitivity issues commonly associated with externally mounted acoustic sensors by leveraging the benefits offered by an internally mounted UHF sensor to trigger PD events. The internally mounted UHF sensor is insensitive to external corona discharges which typically are the largest disturbance source associated with conventional measurements. A problem with this hybrid methodology is when there are multiple PD. The research presented in this paper demonstrates that UHF PD signals are primarily independent of the type of PD source. The research also demonstrates that UHF PD signals inherit signal characteristics which are particular to their location within a transformer structure, and inherit distortion characteristics which are particular to their journey from source to destination. As a result it is proposed that the correlation of UHF PD signatures can be used for discrimination purposes in order to identify individual PD sources within a transformer using a single UHF sensor. This could then be used in conjunction with acoustic measurement techniques to sequentially localize multiple PD within a power transformer which formerly has proven to be a technical challenge.
Index Terms — Power transformer, partial discharge, ultra high frequency, localization, correlation, diagnostics.
1 INTRODUCTION
THERE are a number of different approaches to PD monitoring including Dissolved Gas Analysis (DGA) and signal detection techniques based on radio frequency (RF), acoustic and electrical signals [1]. DGA, which is now commonly used for the online detection of a range of different fault conditions, can detect PD activity including its type and severity, but does not provide any insight into the PD location [2]. The RF approach cannot quantify the true PD severity but can theoretically derive PD location through the triangulation of RF signals recorded from multiple sensors. In practice however, the limited number of oil drain valves which are used to fit the RF sensors, and the short delay periods between
signal arrivals, can restrict this type of application [3]. Like RF measurements, acoustic PD detection cannot quantify true PD severity but can be used for PD location through the triangulation of signals recorded from multiple sensors. Unlike the RF approach, the acoustic sensors are fitted to the outside tank wall and are therefore not limited in number and can provide practical PD location. However, they are highly susceptible to noise and typically experience very poor signal to noise ratios [4]. Electrical measurement is the most common approach and when calibrated can provide an indicative measure of the apparent charge, however there can be no direct correlation of the apparent charge against the true PD severity since the PD is dependent upon the PD location [5, 6]. In addition, outside of a laboratory environment the electrical method’s potential to facilitate accurate PD location remains largely unfulfilled [7]. This is largely due to the
Manuscript received on 15 October 2014, in final form 22 October 2015, accepted 9 November 2015.
DOI: 10.1109/TDEI.2015.005015
1068 S. D. Mitchell et al: Discrimination of Partial Discharge Sources in the UHF Domain

effects of severe external interference from corona and other equipment making PD discrimination difficult [8, 9].
Each of the PD detection techniques described offers a range of advantages and disadvantages. The latest research development is to implement a combination of the described PD detection techniques in order to leverage the strengths offered by each technology. One example is combining the information gained from both RF and electrical means in order to improve the characterization of the PD source [10]. Another example is to leverage the noise immunity offered by RF sensors to trigger a windowed acoustic measurement to facilitate improved PD location [3, 4].
For the latter example which triggers acoustic measurements from RF signals, difficulties can arise when there are more than one PD [11]. The problem in this scenario is that the triangulation calculation will not be possible without focusing upon one individual PD source at a time. To achieve this, a methodology is required which will distinguish the PD signature of one source relative to another.
There are a range of techniques which can be used to identify different PD sources. One common technique is pattern recognition analysis of cluster patterns in STAR diagrams using electrical signals collected from each phase [11]. Another technique is recording the time difference between the signal acquisitions of two RF sensors. If there are two or more repeatable time differences there is a high probability of multiple PD sources [2]. Each of the aforementioned techniques require multiple sensors to isolate the PD.
There is also a growing body of research which aims to discriminate between different PD sources via the comparison of RF PD signal characteristics. Examples are the application of a wavelet similarity function [12] and the analysis of the PD signal envelope [13, 14]. The research presented in this paper adds to the research area by examining the rationale behind the unique identification of a PD source and proposing an alternative methodology for its practical implementation. The associated background for this approach is as follows.
Electromagnetic waves with a frequency ranging between 300 MHz and 2 GHz will have wavelengths when transmitted in oil of between 100 and 700 mm. For optimal sensitivity, an antenna’s minimum size should be half the wavelength of interest. In this case this would correspond to 50 to 350 mm which is dimensionally much larger than a typical PD source. Leveraging this theory Markalous [15], and later expanded upon by Coenen [5], demonstrated how the high frequency currents that are initiated at the PD source excite high voltage (HV) structures to behave as an antenna and emit the corresponding ultra-high frequency (UHF) PD. Their conclusion was that the initial radiation behavior of UHF PD is dependent upon the structure between the HV energy source and the PD source, not the source itself. The subtle impact of this observation is that the UHF signals generated by a PD can be considered relatively independent of the type of PD including any physical change at the discharge site over time, but since it is dependent upon the current flow through the
surrounding structure, it will inherit signal characteristics unique to its location within the transformer topography. Based on this premise, the research presented in this paper proposes using a single UHF sensor to uniquely and accurately identify individual PD sources. It is proposed that the technique’s ability to identify signals unique to an individual PD source will improve acoustic PD location in the case of multiple PD sources.
This paper is structured in the following manner. Section 2 details the derivation of the maximum correlation coefficient which is used to compare the degree of similarity between UHF PD signals. Section 3 divides the research into five propositions and describes the experimental setup which will be used to test the veracity of each proposition. Section 4 details each of the experiments and presents the results. Concluding remarks are then given in Section 5.
2 THEORY The premise raised in the previous section was that UHF
PD emissions will have characteristics unique to the discharge site. By extension, as these emissions propagate through the various media within the transformer tank they will also inherit distortion characteristics relative to their journey [16]. The outcome will be a signal which is uniquely colored by both the location of the discharge and the UHF sensor position. As a result it is proposed that normalized PD signals from the same source location recorded from a single sensor in a fixed location should be highly correlated. This correlation should diminish rapidly with any change to either the location of the PD source or the UHF sensor.
In order to statistically compare the degree of similarity between any two of the UHF PD signals, this paper proposes the application of sampled cross correlation [17]. This approach has the advantage of accommodating sample ‘lags’ between any two datasets and will therefore be tolerant of variations in data acquisition signal triggering. It also facilitates a convenient figure of merit as will be shown towards the end of this section.
Given two separately sampled signals 'f and 'g , the first step is to independently normalize each of the signals. Given N is the number of samples captured for each signal and 1 i N ,
'
'maxi
i
ff
f (1)
'
'maxi
i
gg
g (2)
where f and g are the normalized signals.
An estimate of ( )fgc k , the signals’ cross-covariance
coefficient at lag k , is given by,
1
1
1( )( ) 0, 1, 2,...
( )1
( )( ) 0, 1, 2,...
N k
n n kn
fg N k
n n kn
f f g g kN
c k
g g f f kN
(3)
IEEE Transactions on Dielectrics and Electrical Insulation Vol. 23, No. 2; April 2016 1069

where f and g are the respective sample means. The
standard deviation of both signals is found by utilizing (3) as an auto-covariance with 0k [17]. That is, for f ,
(0)f ffc (4)
and for g
(0)g ggc (5)
An estimate of the sampled cross-correlation coefficient at lag k can then be found from equations (3), (4) and (5),
( )( ) fg
fgf g
c kr k
(6)
The absolute value of the maximum cross-correlation coefficient provides a convenient figure of merit with which to assess the degree of similarity between two PD signals. In this article it will be referred to as the maximum correlation and it is assigned the symbol where,
max fgr (7)
For example, with a value approaching 1 signifies a very
strong correlation between two PD signals whereas with a
value approaching 0 is indicative of no correlation.
3 EXPERIMENTAL METHOD The research has proposed that a single UHF sensor can be
used to uniquely and accurately identify individual PD sources. For this approach to be viable the post signal processed PD signatures must be inherently independent of the PD type and size, and have an inherent dependence upon the structural topology ‘antenna’, PD transmission pathway and the detector position. These requirements are divided into five formal propositions:
Proposition 1 PD UHF emissions are predominantly independent of the source PD signal amplitude after normalization.
Proposition 2 PD UHF emissions are predominantly independent of the type of PD source.
Proposition 3 PD UHF emissions inherit distortion characteristics particular to their journey from PD source to UHF sensor.
Proposition 4 The received UHF signals are dependent upon the UHF probe orientation.
Proposition 5 PD UHF emissions inherit signal characteristics particular to their location within the structural topography.
A series of experiments will be conducted in order to validate each of these five propositions. The experimental setup consists of a high voltage supply connected by a bus to one of three different PD sources. The three PD sources are localized in close proximity within an acrylic glass tank filled with
mineral oil (Figure 1). The source types are Point to Sphere discharge (PS), Surface Discharge (SD) and Floating Potential discharge (FP), and they are illustrated in Figure 2.
The Point to Sphere discharge source, Figure 2a, consists of pressboard insulation sandwiched between a high voltage (HV) electrode point and an earthed spherical electrode. The Surface Discharge source, Figure 2b, consists of a HV electrode with a long edge separated from the earthed electrode. The Floating Potential discharge source, Figure 2c, consists of a HV electrode point separated by a pressboard and oil insulation gap to a floating potential cylindrical conductor. On the opposing side of the conductor separated by an oil gap is an earthed electrode plate.
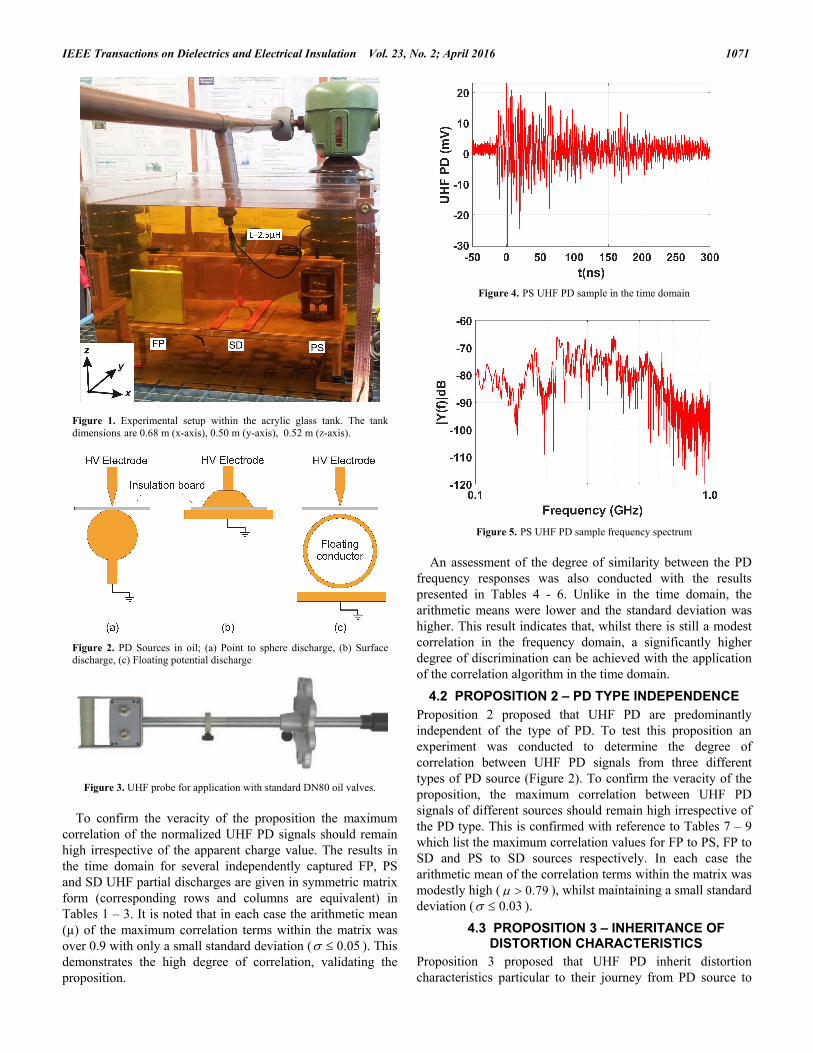
The UHF PD emissions are detected using a UHF drain valve probe (Figure 3) which has a frequency range of 300 MHz to 3 GHz. The probe is designed for standard DN80 oil valves and facilitates variable insertion depth depending upon application. The methodology used in this research is not critically dependent upon the probe characteristics since the intent is to differentiate between PD signature variations and the probe’s influence will remain consistent over time. For further details on the UHF probe please refer to [5]. For this experimental setup, the probe is in air at regulated distances from the exterior of the test tank. The nominal reference location for the UHF probe relative to the PS discharge source with respect to the axes as given in Figure 1, is x = -1140 mm and z = -1100 mm. The nominal 0° probe orientation is along the x axis. The probe is connected to a 3 GHz LeCroy Wavepro 7300 oscilloscope and will utilize a 10 GS/s sample rate. An example of a PS discharge in both the time and frequency domains is given in Figures 4 and 5 respectively. The FFT upper bound of 1 GHz was derived from a 10 GS/s capture over a PD triggered period of 1 µs. The 1 µs capture period was based on the signal to noise relationship between the PD and the ambient noise floor in the time domain.
The experimental setup will also include PD electrical measurements based on IEC60270 using an Omicron MPD system which is calibrated by injecting 500 pC into the top of the decoupling capacitor. These measurements will facilitate the monitoring of apparent charge to facilitate a PD size reference.
4 RESULTS In order to validate each of the propositions set forth in
Section 3, several experiments were conducted and each of the experiments and corresponding results are described in this section.
4.1 PROPOSITION 1 – PD SIZE INDEPENDENCE
Proposition 1 proposed that captured UHF PD signals are predominantly independent of the initiating PD size after signal normalization. To test this proposition, UHF PD were stochastically captured for all three PD sources whilst the background apparent charge values were monitored electrically through the application of IEC60270. The apparent charge range for PS discharge samples was between 50 pC and 500 pC. The apparent charge range for FP and SD discharge samples was between 700 pC and 10000 pC.
1070 S. D. Mitchell et al: Discrimination of Partial Discharge Sources in the UHF Domain
To confirm the veracity of the proposition the maximum correlation of the normalized UHF PD signals should remain high irrespective of the apparent charge value. The results in the time domain for several independently captured FP, PS and SD UHF partial discharges are given in symmetric matrix form (corresponding rows and columns are equivalent) in Tables 1 – 3. It is noted that in each case the arithmetic mean (µ) of the maximum correlation terms within the matrix was over 0.9 with only a small standard deviation ( 0.05 ). This demonstrates the high degree of correlation, validating the proposition.
An assessment of the degree of similarity between the PD frequency responses was also conducted with the results presented in Tables 4 - 6. Unlike in the time domain, the arithmetic means were lower and the standard deviation was higher. This result indicates that, whilst there is still a modest correlation in the frequency domain, a significantly higher degree of discrimination can be achieved with the application of the correlation algorithm in the time domain.
4.2 PROPOSITION 2 – PD TYPE INDEPENDENCE Proposition 2 proposed that UHF PD are predominantly independent of the type of PD. To test this proposition an experiment was conducted to determine the degree of correlation between UHF PD signals from three different types of PD source (Figure 2). To confirm the veracity of the proposition, the maximum correlation between UHF PD signals of different sources should remain high irrespective of the PD type. This is confirmed with reference to Tables 7 – 9 which list the maximum correlation values for FP to PS, FP to SD and PS to SD sources respectively. In each case the arithmetic mean of the correlation terms within the matrix was modestly high ( 0.79 ), whilst maintaining a small standard deviation ( 0.03 ).
4.3 PROPOSITION 3 – INHERITANCE OF DISTORTION CHARACTERISTICS
Proposition 3 proposed that UHF PD inherit distortion characteristics particular to their journey from PD source to
Figure 1. Experimental setup within the acrylic glass tank. The tank dimensions are 0.68 m (x-axis), 0.50 m (y-axis), 0.52 m (z-axis).
Figure 2. PD Sources in oil; (a) Point to sphere discharge, (b) Surface discharge, (c) Floating potential discharge
Figure 3. UHF probe for application with standard DN80 oil valves.
Figure 4. PS UHF PD sample in the time domain
Figure 5. PS UHF PD sample frequency spectrum
IEEE Transactions on Dielectrics and Electrical Insulation Vol. 23, No. 2; April 2016 1071

the UHF sensor. On this basis it is expected that the correlation between any two PD signals will be highly dependent upon their point of measurement. To test this proposition the PS discharge source (Figure 2a) is used to generate UHF PD emissions which are measured by the UHF probe at eleven different locations. The UHF probe measurement locations are an integral number of 0.2 m steps along the y axis with respect to the base reference location (described in Section 3). The offset distances are -1 m, -0.8 m, -0.6 m, -0.4 m, -0.2 m, 0 m (Reference), +0.2 m, +0.4 m, +0.6 m, 0.8 m, +1 m.
Table 1. Maximum correlation values for FP UHF PD samples in the time domain. µ = 0.904, σ = 0.050.
FP / FP 1 2 3 4 5
1 1.000 0.870 0.867 0.872 0.872 2 - 1.000 0.888 0.885 0.887 3 - - 1.000 0.884 0.886 4 5
- -
- -
- -
1.000 0.886 - 1.000
Table 2. Maximum correlation values for PS UHF PD samples in the time domain. µ = 0.913, σ = 0.048.
PS / PS 1 2 3 4 5
1 1.000 0.885 0.887 0.869 0.882 2 - 1.000 0.951 0.889 0.890 3 - - 1.000 0.891 0.885 4 5
- -
- -
- -
1.000 0.888 - 1.000
Table 3. Maximum correlation values for SD UHF PD samples in the time domain. µ = 0.905 σ = 0.049.
SD / SD 1 2 3 4 5
1 1.000 0.883 0.880 0.879 0.890 2 - 1.000 0.887 0.883 0.875 3 - - 1.000 0.887 0.876 4 5
- -
- -
- -
1.000 0.876 - 1.000
Table 4. Maximum correlation values for FP UHF PD samples in the frequency domain. µ = 0.878, σ = 0.067.
FP / FP 1 2 3 4 5
1 1.000 0.816 0.867 0.869 0.812 2 - 1.000 0.831 0.840 0.887 3 - - 1.000 0.884 0.828 4 5
- -
- -
- -
1.000 0.836 - 1.000
Table 5. Maximum correlation values for PS UHF PD samples in the frequency domain. µ = 0.667, σ = 0.254.
PS / PS 1 2 3 4 5
1 1.000 0.743 0.282 0.416 0.861 2 - 1.000 0.494 0.486 0.848 3 - - 1.000 0.840 0.390 4 5
- -
- -
- -
1.000 0.478 - 1.000
Table 6. Maximum correlation values for SD UHF PD samples in the frequency domain. µ = 0.695, σ = 0.252.
SD / SD 1 2 3 4 5
1 1.000 0.882 0.819 0.739 0.375 2 - 1.000 0.763 0.675 0.335 3 - - 1.000 0.864 0.370 4 5
- -
- -
- -
1.000 0.367 - 1.000
Table 7. Maximum correlation values between FP and PS UHF PD samples in the time domain. µ = 0.796, σ = 0.016.
FP / PS 1 2 3 4 5
1 0.788 0.814 0.812 0.775 0.783 2 0.782 0.820 0.812 0.784 0.790 3 0.775 0.817 0.808 0.781 0.787 4 5
0.779 0.779
0.816 0.820
0.806 0.810
0.785 0.788
0.790 0.794
Table 8. Maximum correlation values between FP and SD UHF PD samples in the time domain. µ = 0.792, σ = 0.007.
FP / SD 1 2 3 4 5
1 0.785 0.803 0.803 0.801 0.788 2 0.789 0.793 0.789 0.801 0.790 3 0.783 0.791 0.783 0.796 0.792 4 5
0.780 0.785
0.792 0.797
0.781 0.787
0.803 0.802
0.791 0.793
Table 9. Maximum correlation values between PS and SD UHF PD samples in the time domain. µ = 0.855 σ = 0.022.
PS / SD 1 2 3 4 5
1 0.835 0.845 0.845 0.834 0.834 2 0.879 0.887 0.877 0.890 0.880 3 0.870 0.884 0.879 0.873 0.883 4 5
0.828 0.834
0.834 0.836
0.835 0.840
0.844 0.852
0.846 0.835
The results are based on eight UHF PD samples being recorded at each probe location. The samples from each location are then compared in order to derive an arithmetic mean of the maximum correlation between any two locations. The results are given in Table 10 (in symmetric matrix form) and also shown in graphical form in Figure 6. To verify the proposition, the correlation value between any two UHF PD signals should be inversely correlative with respect to the spatial distance between their measurement locations, i.e as the distance between measurement locations increases it is expected that the maximum correlation value should decrease, though not in a linear fashion. The non-linear response is due to the Pythagorean change in distance between the source and probe as the probe is shifted along the y-axis. This in turn will accelerate the effects associated with the changing UHF transmission path. These results are clearly demonstrated in both Figure 6 and Table 10.
4.4 PROPOSITION 4 – PROBE ORIENTATION DEPENDENCE
Proposition 4 proposed that there is a dependence upon the UHF probe orientation. To test this proposition the PS
1072 S. D. Mitchell et al: Discrimination of Partial Discharge Sources in the UHF Domain

discharge source was used to generate UHF PD which was recorded whilst varying the UHF probe orientation between 0° and 90° (changing the probe orientation from along the x axis to along the y axis). To confirm the veracity of this proposition there should be a significant reduction in the maximum correlation when comparing UHF PD signals recorded with different probe orientations, relative to those with the same orientation. This is confirmed with reference to Tables 11 – 13. For samples recorded with the same probe orientation, 0° probe orientation in Table 11 and 90° probe orientation in Table 12, there are high values in maximum correlation (µ ≥
0.889). However when samples of different probe orientation are compared, 0° versus 90° probe orientation in Table 13, there is a significant reduction in the maximum correlation values relative to those in Tables 11 and 12 (µ = 0.477).
4.5 PROPOSITION 5 – INHERITANCE OF PD LOCATION CHARACTERISTICS
Proposition 5 proposed that UHF PD inherit signal characteristics particular to their location within the structural topography. To test this proposition, changes were made to the source impedance through the introduction of discrete increments in inductance at a location just prior to the PD source. The rationale behind this approach is that given the significant inductive and capacitive influences throughout a transformer structure, if the modest inclusion of a few µH of inductance can have an observable effect then changing the PD location will have a much more significant effect.
The added inductance was derived through the addition of integral numbers of 60 mm diameter turns of insulated wire, resulting in five test cases with between 0.5 µH and 2.5 µH of additional inductance. Figure 1 shows the 5 turn inductive loop (2.5 µH) directly connected to the PS source. UHF PD emissions from the PS discharge source were then recorded for each test case and Table 14 lists the arithmetic mean of the maximum correlation relative to each test.
To verify the proposition, the maximum correlation between any two UHF PD signals should be inversely correlative with respect to the source inductance difference between the respective test cases, i.e as the source inductance difference between samples increases, it is expected that their maximum correlation will decrease (though not necessarily in a linear fashion). With reference to Table 14 and the results in graphical form in Figure 7, it is observed that this is primarily the case.
Table 11. Maximum correlation for 0° degree probe orientation for PS UHF PD samples in the time domain. µ = 0.945, σ = 0.030.
PS / PS 1 2 3 4 5
1 1.000 0.954 0.930 0.931 0.934 2 - 1.000 0.941 0.933 0.941 3 - - 1.000 0.912 0.921 4 5
- -
- -
- -
1.000 0.915 - 1.000
Table 12. Maximum correlation for 90° degree probe orientation for PS UHF PD samples in the time domain. µ = 0.889, σ = 0.066.
PS / PS 1 2 3 4 5
1 1.000 0.819 0.841 0.809 0.895 2 - 1.000 0.863 0.831 0.903 3 - - 1.000 0.841 0.918 4 5
- -
- -
- -
1.000 0.892 - 1.000
Table 13. Maximum correlation between 0° and 90° degree probe orientations for PS UHF PD samples. µ = 0.477, σ = 0.015.
PS / PS 1 2 3 4 5
1 0.472 0.467 0.478 0.469 0.505 2 0.480 0.479 0.487 0.473 0.514 3 0.465 0.464 0.473 0.460 0.500 4 5
0.462 0.470
0.464 0.469
0.474 0.475
0.463 0.460
0.498 0.501
Table 10. Maximum correlation versus distance from for PS UHF PD samples in the time domain.
DISTANCE -1 -0.8 -0.6 -0.4 -0.2 0 0.2 0.4 0.6 0.8 1 -1 0.93 0.70 0.23 0.27 0.36 0.33 0.25 0.30 0.33 0.28 0.22
-0.8 - 0.93 0.48 0.26 0.26 0.33 0.26 0.29 0.33 0.22 0.23 -0.6 - - 0.86 0.55 0.32 0.29 0.22 0.26 0.26 0.24 0.19 -0.4 - - - 0.90 0.69 0.34 0.25 0.25 0.35 0.31 0.23 -0.2 - - - - 0.90 0.64 0.30 0.24 0.30 0.32 0.24
0 - - - - - 0.87 0.38 0.25 0.27 0.26 0.24 0.2 - - - - - - 0.91 0.60 0.34 0.24 0.21 0.4 - - - - - - - 0.94 0.69 0.38 0.23 0.6 - - - - - - - - 0.93 0.64 0.24 0.8 - - - - - - - - - 0.85 0.41 1 - - - - - - - - - - 0.75
Figure 6. Maximum correlation versus distance for PS UHF PD.
IEEE Transactions on Dielectrics and Electrical Insulation Vol. 23, No. 2; April 2016 1073

Table 14. Maximum correlation with additional source inductance.
(µH) 0.5 1.0 1.5 2.0 2.5
0.5 0.961 0.566 0.631 0.649 0.526 1.0 - 0.980 0.696 0.688 0.618 1.5 - - 0.958 0.745 0.508 2.0 2.5
- -
- -
- -
0.956 0.607 - 0.954
Figure 7. Maximum correlation with additional source inductance for PS UHF PD samples.
5 CONCLUSION The research presented in this paper has proposed that a
single UHF sensor, in conjunction with appropriate signal processing techniques, can be used to uniquely and accurately identify individual sources of PD within a power transformer. In order to validate this proposal several experiments were conducted which showed that UHF emissions due to PD activity were primarily independent of the type of PD, and inherited signal characteristics particular to both their location within a transformer’s structure as well as their journey from PD source to UHF sensor. It is proposed that the technique’s ability to identify signals unique to an individual PD source will improve on existing UHF/acoustic PD location technologies where, historically, multiple PD sources have created technical challenges.
ACKNOWLEDGMENT The first author would like to acknowledge the invaluable
support provided by all at the Institute of Power Transmission and High Voltage Technology at the University of Stuttgart.
REFERENCES [1] M. Hikita, S. Okabe, H. Murase, and H. Okubo, "Cross-equipment
evaluation of partial discharge measurement and diagnosis techniques in electric power apparatus for transmission and distribution," IEEE Trans. Dielectr. Electr. Insul., Vol. 15, pp. 505-518, 2008.
[2] M. Judd, L. Yang, and I. Hunter, "Partial Discharge Monitoring of Power Transformers using UHF Sensors. Part I: Sensors and Signal Interpretation," IEEE Electr. Insul. Mag., Vol. 21, pp. 5-14, 2005.
[3] S. Coenen and S. Tenbohlen, "Location of PD Sources in Power Transformers by UHF and Acoustic Measurements," IEEE Trans. Dielectr. Electr. Insul., Vol. 19, pp. 1934-1940 , 2012.
[4] M. Siegel, H. O. Kristiansen, and S. Tenbohlen, "New Methods for Multisource PD Localization on Power Transformers by an Acoustic Sensor Array," 18th Int'l. Sympos. High Voltage Eng., pp. 1833-1838, 2013.
[5] S. Coenen, Measurement of Partial Discharges in Power Transformers using Electromagnetic Signals, PhD thesis, Institute of Power Transmission and High Voltage Technology, Universitat Stuttgart, Stuttgart, 2012.
[6] E. Lemke, S. Berlijn, E. Gulski, and M. Muhr, "Guide for Electrical Partial Discharge Measurements in compliance to IEC 60270," Electra Technical Brochure 366 WG D1.33, pp. 61-67, 2008.
[7] A. Akbari, P. Werle, H. Borsi, and E. Gockenbach, "A continuous parameter high frequency model based on travelling waves for transformer diagnostic purposes," IEEE Int'l. Sympos. Electr. Insul., pp. 154-157, 2002.
[8] A. Kraetge, K. Rethmeier, M. Kruger, and P. Winter, "Synchronous multi-channel PD measurements and the benefits for PD analyses," IEEE PES Transmission and Distribution Conf. Exposition, pp. 1 - 6 , 2010.
[9] "Omicron MPD600 - High-End Measurement and Analysis System for Partial Discharges (PD)," ed.
[10] A. Reid, M. Judd, R. Fouracre, B. Stewart, and D. Hepburn, "Simultaneous measurement of partial discharges using IEC60270 and radio-frequency techniques," IEEE Trans. Dielectr. Electr. Insul., Vol. 18, pp. 444 - 455 , 2011.
[11] S. Tenbohlen, A. Pfeffer, and S. Coenen, "On-site Experiences with Multi-Terminal IEC PD Measurements, UHF PD Measurements and Acoustic PD Localisation," IEEE Int'l. Sympos. Electr. Insul., pp. 1 - 5, 2010.
[12] L. Yang and M. D. Judd, "Recognising multiple partial discharge sources in power transformers by wavelet analysis of UHF signals," Proc. IEE Sci., Measurement Techn., Vol. 150, pp. 119-127, 2003.
[13] T. Pinpart and M. D. Judd, "Differentiating between partial discharge sources using envelope comparison of ultra-high-frequency signals," IET Sci., Measurement Techn., Vol. 4, pp. 256-267, 2010.
[14] T. Pinpart, J. E. Fletcher, and M. D. Judd, "Methods for distinguishing between partial discharges based on the UHF detection technique," Int'l. Conf. Condition Monitoring and Diagnosis, (CMD), pp. 1060-1064, 2008.
[15] S. M. Markalous, Detection and Location of Partial Discharges in Power Transformer using Acoustic and Electromagnetic Signals, PhD, Universität Stuttgart, 2006.
[16] H. H. Sinaga, B. T. Phung, and T. R. Blackburn, "Partial discharge localization in transformers using UHF detection method," IEEE Trans. Dielectr. Electr. Insul., Vol. 19, pp. 1891-1900, 2012.
[17] G. E. P. Box, G. M. Jenkins, and G. C. Reinsel, Time Series Analysis, Forecasting and Control, 3rd ed.: Prentice Hall, 1994.
Steven D. Mitchell (M’07) received his B.E degree (Hons) in electrical engineering in 1996 and his Ph.D. degree in 2011 (both from the University of Newcastle, Callaghan, NSW Australia). His Ph.D. thesis focused on power transformer modelling for frequency response analysis. He is currently Engineering Manager at Ampcontrol CSM and a Conjoint Senior Lecturer at the School of Electrical Engineering and Computer Science at the University of Newcastle. Dr Mitchell has worked as a Lecturer and Senior Researcher at the University of
Newcastle, and in industry as a Design Engineer in heavy manufacturing and underground mine control/protection equipment design.
Martin Siegel received the Dipl.-Ing. degree in electrical engineering from the University of Stuttgart, Germany, in 2010. In his diploma thesis he worked on the integration of electric vehicles in a grid with a high proportion of renewable energies. In 2011 he started working at the Institute of Power Transmission and High Voltage Technology, University of Stuttgart as academic researcher. He operates in the field of power transformer diagnostics and monitoring. Focus of his work lies on the applicability of unconventional partial
discharge measurement methods for on-line monitoring and localization at power transformers. He is member of the German Power Engineering Society VDE-ETG.
1074 S. D. Mitchell et al: Discrimination of Partial Discharge Sources in the UHF Domain

Michael Beltle received the Dipl.-Ing. degree in electrical engineering from the University of Stuttgart, Germany, in 2009. In his diploma thesis he was determining the degrading effects of electrostatic discharges on microcontrollers ins automotive applications. After his graduation he started working at the Institute of Power Transmission and High Voltage Technology, University of Stuttgart as academic researcher. He mainly operates in the field of power transformer diagnostics and determines the long-term
development of partial discharges and investigates the mechanical vibrations of active parts of transformers. He is member of CIGRE and the German Power Engineering Society VDE-ETG.
Stefan Tenbohlen (M’04-S’14) received his Diploma and Dr.-Ing. degrees from the Technical University of Aachen, Germany, in 1992 and 1997, respectively. In 1997 he joined ALSTOM Schorch Transformatoren GmbH, Mönchengladbach, Germany, where he was responsible for basic research and product development. From 2002 to 2004 he was the head of the electrical and mechanical design department. In 2004 he was appointed to a professorship and head of the institute of Power Transmission and High Voltage
Technology of the University of Stuttgart, Germany. In this position his main research fields are high voltage technique, power transmission and different aspects of electromagnetic compatibility (EMC). Prof. Tenbohlen holds several patents and published more than 300 papers. He is member of CIGRE SC A2 (Power Transformers), german committees of A2, D1 (Emerging Technologies), C4 (System Technical Performance), several international working groups and the chairman of german Power Engineering Society VDE-ETG FB Q2 (Materials, Electrical Insulations and Diagnostics).
IEEE Transactions on Dielectrics and Electrical Insulation Vol. 23, No. 2; April 2016 1075