Embed Size (px)
Citation preview
~ 766 ~
Journal of Entomology and Zoology Studies 2016; 4(5): 766-782
E-ISSN: 2320-7078
P-ISSN: 2349-6800
JEZS 2016; 4(5): 766-782
© 2016 JEZS
Received: 16-07-2016
Accepted: 17-08-2016
S Umamaheswari
Department of Zoology
Bharathiar University
Coimbatore – 641046 (TN)
India
Dr. P Saravana Bhavan
Department of Zoology
Bharathiar University
Coimbatore – 641046 (TN)
India
R. Udayasuriyan
Department of Zoology
Bharathiar University
Coimbatore – 641046 (TN)
India
C. Vadivalagan
Department of Zoology
Bharathiar University
Coimbatore – 641046 (TN)
India
R. Kalpana
Department of Zoology
Bharathiar University
Coimbatore – 641046 (TN)
India
Correspondence
Dr. P. Saravana Bhavan
Department of Zoology
Bharathiar University
Coimbatore – 641046 (TN)
India
Email: [email protected]
Discrimination of four marine crabs and one
freshwater crab through mt-COI gene
S Umamaheswari, P Saravana Bhavan, R Udayasuriyan, C Vadivalagan
and R Kalpana
Abstract This study dealt with DNA barcoding of five species of Brachyuran crabs, of which four marine species
(Portunus sanguinolentus, Charybdis natator, Portunus pelagicus and Portunus trituberculatus, and one
freshwater species, Travancoriana napaea, served as an out group. The amplified DNA sequences
against the universal primers, LCO1490 and HCO2198 for mt-COI gene revealed ~700 bp in each
species, and they showed 89-98% similarity. The phylogenetic information revealed that nucleotide
substitutions occurred at different levels than that of nucleotide saturation. All the subjected marine crab
species were aligned in one cluster along with retrieved species. And some other retrieved marine crab
species were aligned in two separate clusters. T. napaea was alone aligned in an independent cluster at
the base of the phylogenetic tree. Therefore, these sequences are conserved and less subjected to
evolutionary forces and thus these species are genetically distinct, but closely related. Hence, all the
subjected crab species have originated from a common ancestor. T. napaea was also subjected to
phylogenetic divergence with six retrieved freshwater crab species and showed 89% similarity. The
phylogenetic information revealed that the retrieved freshwater crab species were aligned in one cluster,
and the subjected T. napaea was alone sat in a separate cluster as in the previous case. Hence, all the
freshwater crab species have originated from a very close and common ancestor.
Keywords: Portunus sanguinolentus, Charybdis natator, Portunus pelagicus, Portunus trituberculatus,
Travancoriana napaea, mt-COI gene, Divergence, Phylogeny
1. Introduction In India crabs are an important exportable fishery items and hidden resources [1]. Out of about
640 species of marine crabs so far recorded from Indian waters only 15 species are commercial
importance, which are inhabit the coastal waters and adjoining brackish water environments,
support a fairly good fisheries [2-4]. The Indo-Burma hotspot hosts 182 known species of
freshwater crabs in 55 genera belonging to two families, the Gecarcinucidae (45 species,
and10 genera) and the Potamidae (136 species, and 45 genera) [5-7]. These crabs are highly
endemic, which accounts for 76% of the Gecarcinucid species and 92% of the Potamid species [6, 7]. The taxonomic diversity of crabs inhabiting in marine and freshwater ecosystems have
increased considerably [6-17].
Species identification by morphological characters is difficult because of various reasons
behind in phenotypical expression, such as genetic variation, sexual dimorphism, geographical
variation and mimicry etc. Morphological features are sometime useless and misleading when
trying to determine the species and identity of various larval stages. Based on morphology the
larval stages of some species groups often cannot be assigned to the correct species [18]. During
handling some animals may get damaged so there is a chance for fish fraud. The
morphological identification is more complicated when the species were damaged [19].
Morphological identification of crustacean is difficult, time-consuming and very often requires
highly trained taxonomists. A technique that combines DNA sequencing and phylogenetic
analysis is used to identify samples based on informative nucleotide sequences. The concept of
forensically informative nucleotide sequencing (FINS) was first proposed by Bartlett and
Davidson [20] to identify the origin of animal food products and has since been extensively
applied in forensic investigations. The ideal DNA-based identification system that employed
with a single gene and found suitable for any organism in the taxonomic hierarchy are 12S
rRNA and 16S rRNA [21], Cyt c and Cyt b [22] and 18S rRNA [23]. Therefore, DNA barcoding
was found to be a useful tool for species identification [24, 25]. Morphologically cryptic species
~ 767 ~
Journal of Entomology and Zoology Studies
have been increasingly revealed by this technique [26]. Folmer
et al. [27] designed a universal primer for the mitochondrial
cytochrome oxidase subunit I (mt-COI) gene, which
subsequently became a popular marker to study invertebrates.
Latter, Tautz et al. [26], Hebert et al. [28], Blaxter [29], Lefebure
et al. [30] and Costa et al. [25] suggested that the COI gene
appeared as an appropriate molecular marker on several
taxonomic scales, particularly at the species level. This
statement has also been proved by us with crabs, prawns and
planktons of freshwater and marine species [31-34].
In this study, DNA barcoding of five species of Brachyuran
crabs, including four marine species (Portunus
sanguinolentus, Charybdis natator, Portunus pelagicus and
Portunus trituberculatus inhabiting in the Coromandel coastal
region of Tamil Nadu, India, and one freshwater species,
Travancoriana napaea inhabiting in the Kallar River,
Mettupalayam, Tamil Nadu, India, which served as an out
group was studied. These crabs were first morphologically
identified/ discriminated and then subjected to molecular
identification based on mitochondrial cytochrome C oxidase
subunit-I gene (mt-COI gene). Molecular analyses, such as
sequence similarity, amino acids residues, base composition,
sequence divergence, and phylogenetic information like
synonymous and non-synonymous substitutions, transitional
and transvertional substitutions, and saturations were
calculated. Finally the phylogenetic tree was constructed and
based on the phylogenetic tree topology the evolutionary
significance was analyzed.
2. Materials and Methods
2.1. Sample collection and species identification
Along the small portion of the Coromandel Coastal region of
Tamil Nadu, India, the marine crabs, P. sanguinolentus and C.
natator were collected from Rameswaram (9.28o N’ 79.30o
E’) during March, 2015, P. pelagicus was collected from
Mandabam (9.27o N’ 79.12o E’) during January, 2015 and P.
trituberculatus was collected from Kattumavadi (10.20o N’
79.23o E’) during June, 2015. One freshwater crab, T. napaea
was collected from the Kallar River, Mettupalayam (11.30o N’
76.95 o E’), Tamil Nadu, India, during March, 2014, was
served as an out group. The crab samples were collected by
trawl and hoop net. Triplicate samples of each species were
collected from each place depending upon their availability.
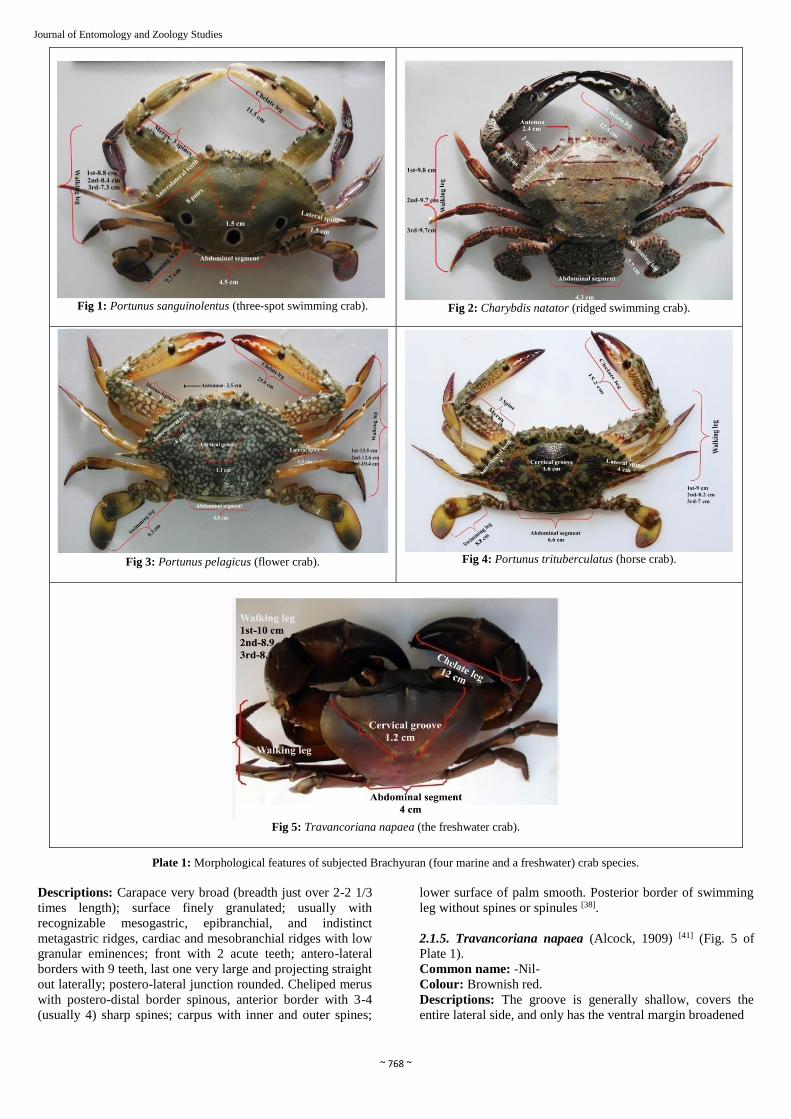
They were first morphologically identified/ discriminated
based on the body color, size, shape, carapace length and
width, length of the chelate leg, walking leg, swimming leg,
antenna, cervical groove, abdominal segments and lateral
spines, and numbers of antero-lateral teeth [ 35-42] (Figs. 1-5 of
Plate 1; Table 1). These crabs species were authenticated by
Dr. M. Kathirvel, Former Principal Scientist, Central Institute
of Brackish water Aquaculture, ICAR, Chennai, India.
2.1.1. Portunus sanguinolentus (Herbst, 1783) [35] (Fig. 1 of
Plate 1)
Common name: Three-spot swimming crab
Colour: Olive to dark green, with 3 prominent maroon to red
spot on posterior 1/3 of carapace.
Genera: Carapace broad, much broader than long. Antero-
lateral teeth not alternately large and small; last one much
larger than the others......…………………………... Portunus.
Species: No spine on posterior margin of merus of chelipeds.
Carapace marked with 3 large blood red
Spots...…………………………………...... P. sanguinolentus.
Descriptions: Carapace finely granulose, region just
discernible; 9 teeth on each antero-lateral margin, the last is 2
to 3 times larger than preceding teeth. Chelae elongated in
males; larger chela with conical tooth at base of fingers; polex
ridged [36].
2.1.2. Charybdis natator (Herbst, 1789) [37] (Fig. 2 of Plate 1).
Common name: Ridged swimming crab.
Colour: Orangish red overall, with ridges on carapace and
legs dark reddish brown.
Genera: Antero-lateral margin of carapace divided into 6
teeth, of which at least 5 are large.......………… Charybdis.
Species: Carapace with distinct ridges or granular patches
behind level of last pair of antero-lateral teeth.…. C. natator.
Descriptions: Carapace densely pubescent, granulate in
postfrontal area and in the vicinity of the antero-lateral
borders; transverse granular lines on protogastric and
mesogastric regions, epibranchial line interrupted at the
cervical groove and across midline, cardiac region with one,
each mesobranchial region with 3 such lines; front with six
teeth, medians and sub-medians truncate, laterals triangular
with rounded tips; antero-lateral borders with 6 teeth, first
truncate, second and third with rounded lateral borders and
tips, fourth and fifth acute; postero-lateral junctions rounded.
Antennal flagellum excluded from orbit. Chelipeds covered
with large granules and/or squamiform markings; merus with
3 strong spines and numerous granules on anterior border,
posterior border granulate; carpus with a strong internal spine,
outer border with 3 spinules; palm with 4 spines on upper
border, lower border longitudinally sulcate. Merus of
swimming leg with a sub-distal posterior spine, propodus with
a variable number of denticles on posterior border [38].
2.1.3. Portunus pelagicus (Linnaeus, 1758) [39] (Fig. 3 of Plate
1).
Common name: Flower crab.
Colour: Males with blue marking, females dull
green/greenish brown.
Genera: Carapace broad, much broader than long. Antero-
lateral teeth not alternately large and small; last one much
larger than the others..……………………………... Portunus.
Species: Carapace covered with scattered, coarse granules,
and meshwork pattern. Front cut into 4 teeth, besides the teeth
of dorsal orbital margins.………………………. P. pelagicus.
Descriptions: Carapace rough to granulose, front with 4
acutely triangular teeth; 9 teeth on each antero-lateral margin,
the last tooth 2 to 4 times larger than preceding teeth. Chelae
elongate in males; larger chela with conical tooth at base of
fingers [36].
2.1.4. Portunus trituberculatus (Miers, 1876) [40] (Fig. 4 of
Plate 1).
Common name: Horse crab
Colour: Greenish-brown.
Genera: Carapace broad, much broader than long. Antero-
lateral teeth not alternately large and small; last one much
larger than the others..……………………………... Portunus.
Species: Carapace covered with much smaller granules,
without any meshwork pattern. Front cut into 2 teeth, besides
the teeth of dorsal orbital margins ………... P. trituberculatus.
~ 768 ~
Journal of Entomology and Zoology Studies
Fig 1: Portunus sanguinolentus (three-spot swimming crab).
Fig 2: Charybdis natator (ridged swimming crab).
Fig 3: Portunus pelagicus (flower crab).
Fig 4: Portunus trituberculatus (horse crab).
Fig 5: Travancoriana napaea (the freshwater crab).
Plate 1: Morphological features of subjected Brachyuran (four marine and a freshwater) crab species.
Descriptions: Carapace very broad (breadth just over 2-2 1/3
times length); surface finely granulated; usually with
recognizable mesogastric, epibranchial, and indistinct
metagastric ridges, cardiac and mesobranchial ridges with low
granular eminences; front with 2 acute teeth; antero-lateral
borders with 9 teeth, last one very large and projecting straight
out laterally; postero-lateral junction rounded. Cheliped merus
with postero-distal border spinous, anterior border with 3-4
(usually 4) sharp spines; carpus with inner and outer spines;
lower surface of palm smooth. Posterior border of swimming
leg without spines or spinules [38].
2.1.5. Travancoriana napaea (Alcock, 1909) [41] (Fig. 5 of
Plate 1).
Common name: -Nil-
Colour: Brownish red.
Descriptions: The groove is generally shallow, covers the
entire lateral side, and only has the ventral margin broadened
~ 769 ~
Journal of Entomology and Zoology Studies
Table 1: Morphometric characteristics of four subjected marine and a freshwater crab species
Characters Marine crabs
Freshwater
crab
P. sanguinolentus C. natator P. pelagicus P. trituberculatus T. napaea
Colour Olive to dark
green Orange red
males with blue
marking,
females dull
green/ greenish
brown
Greenish brown Brownish
red
Shape
Carapace
very broad with 3
red spots in
posterior half
Carapace
densely
pubescent,
granulate in
postfrontal
area
Carapace very
broad, surface
coarsely
granulated
Carapace very
broad, covered
with fine granules
Carapace
hard
Weight (g) 74.0 78.0 120.0 98.0 70.0
Length (cm) 17.0 11.0 15.5 12.2 10.0
I-Antenna (cm) 1.5 2.4 2.3 1.6 --
II-Antenna (cm) 1.5 1.5 1.4 1.5 --
Cervical groove (cm) 1.5 -- 1.0 1.6 1.2
Anterolateral teeth (Nos.) 8.0 6.0 8.0 9.0 --
Lateral spine (cm) 1.5 -- 4.5 4.0 --
Chelated leg (cm) 11.5 12.5 20.6 15.2 12.0
Walking leg -1 (cm) 8.8 9.8 13.5 9.0 10.0
Walking leg -2 (cm) 8.4 9.7 12.6 8.2 8.9
Walking leg -3 (cm) 7.3 9.7 10.4 7.0 8.1
Swimming leg (cm) 7.0 7.7 9.3 8.8 --
Abdominal segment (cm) 4.1 4.3 4.5 6.2 4.0
Whereas, the dorsal margin remains smooth and indistinct. Its
ventral margin and the gonopod itself forming a continuous,
leaf like distal part (Travancoriana sp.) [42]. This species is
known only from its type locality in India (1909). Data
pertaining to its extent of occurrence, ecological requirements,
population size, population trends, and long-term threats are
not available. Bott [43] included this species in the subfamily
Liotelphusinae of the Gecarcinucidae. According to
Cumberlidge [44] T. napaea is placed in the IUCN Red List of
Threatened Species.
2.2. Molecular analysis
Genomic DNA was isolated from the adductor muscle by
using Qiagen Dneasy Blood and Tissue Kit (Germany) and
1% Agarose Gel Electrophoresis was performed to resolve the
genomic DNA, which was detected under a Gel
documentation system (Medicare, India). DNA amplification
of mt-COI gene was carried out with universal primers,
LCO1490 and HCO2198 [27] of forward and reverse in nature
respectively using ABI Thermo Cycler. These primer sets
were worked well for crabs and prawns and other crustaceans [31-34]. Amplification was performed in a total volume of 50 μl
containing 4 μl of DNA template, 20 p.mol of each primer
(forward primer, 0.30 µl; reverse primer, 0.30 µl), 36 µl of 2X
polymerase chain reaction (PCR) master mix (MBI
Fermantas) containing 0.05 units/ μl Taq DNA polymerase in
reaction buffer, 4 mM MgCl2, 0.4 mM dATP, 0.4 mM dGTP,
0.4 mM dTTP and 0.4 mM dCTP, and 9.4 µl of DNase -
RNase free water. The thermo cycler condition was as
follows: pre-running for 5 min at 95 °C; denaturation of 35
cycles of 30 s each at 95 °C; annealing for 45 s at 57 °C;
extension for 90 s at 72 °C; final extension for 10 min at 72
°C. The amplified product was resolved with 2% Agarose Gel
Electrophoresis. Sequencing was performed with a total
volume of 20 μl reaction mixture containing 3 μl of Template
DNA, 3.2 pM/ μl of primers (forward, 0.50 μl and reverse,
0.50 μl), 2 μl of 5X BigDye sequencing buffer and 4 μl of
2.5X Ready Reaction Premix (Tris-HCL, pH 9.0 and MgCl2)
and 10 µl of DNase - RNase free water. The PCR Sequencing
cycling condition was as follows, 30 cycles of 20 s each at 95
°C for denaturation, followed by 30 cycles of 20 s each at 50
ºC for annealing and 30 cycles of 4 min each at 60 ºC for
extension. After completion of the PCR program, the sample
was processed for ethanolic precipitation. From the PCR
tubes, the samples were transferred to 96 well microlitre plates
and 5 µl of 125 mM EDTA was added to each well. 60 µl of
ice cold 100% ethanol (stored at -20 ºC) was added to each
reaction, the plate was sealed and mixed by vortexing for 20-
30 seconds and incubated at room temperature for 15 minutes.
The sample plate was spined at 3,000 × g for 30 min at 4ºC.
The supernatant was carefully removed by inverting the plate
and spined up to 180 × g for 1 min then removed from the
centrifuge. The pellet was rinsed once with 60 µl of ice cold
70% ethanol (stored at -20 ºC) by centrifugation at 1650 × g
for 15 min at 4 ºC. Again the plate was inverted and spined up
to 180 × g for 1 minute, and then removed from the
centrifuge. The sample was re-suspended in 10 µl of Hi-Di
formamide and incubated for 15 min at room temperature. The
re-suspended samples were transferred to the appropriate
wells of the sample plate. Ensured each sample was positioned
at the bottom of its tube or well. The samples were denatured
at 95ºC for 5 min with snap chill and the plate was loaded into
Sequencer, after completion of run the data was analyzed
(ABI 3500 XL Genetic Analyzer, Chromous Biotech,
Bangalore, India).
The forward and reverse sequences were aligned pair wise by
using CAP3. BLAST was performed for sequence similarity
identification and removal of internal stop codons. The
~ 770 ~
Journal of Entomology and Zoology Studies
reading frame shift was deducted by open reading frame
(ORF) finder. The trimmed sequence was authenticated with
GenBank. The multiple sequence alignment (MSA) was done
by using T-Coffee and the aligned sequence was highlighted
with multiple align show (MAS) as identical, similar and
variable sites of amino acids. The nucleotide composition (AT
and GC biases), nucleotide divergence (K2P model [45]) and
some phylogenetic information were calculated by using
MEGA v.6.01.Assessment of species-wise synonymous (Ks)
and non-synonymous (Ka) substitutions for 3rd codon
positions were calculated by using Li93 method of DAMBE [46]. Similarly, the overall site-wise inferred synonymous (dS)
and inferred non-synonymous (dN) substitutions for 3rd codon
positions were predicted by using Muse-Gaut model [47]. The
transitional (Ts) and transvertional (Tv) substitutions were
determined by using Felsenstein model [48]. Analysis of
sequence saturation, index of substitutional saturation (Iss)
and critical value of index of substitutional saturation (Iss.c)
was done by using Xia method of DAMBE [49]. Finally the
phylogenetic tree was reconstructed by Maximum Likelihood
model [50].
3. Results and Discussion
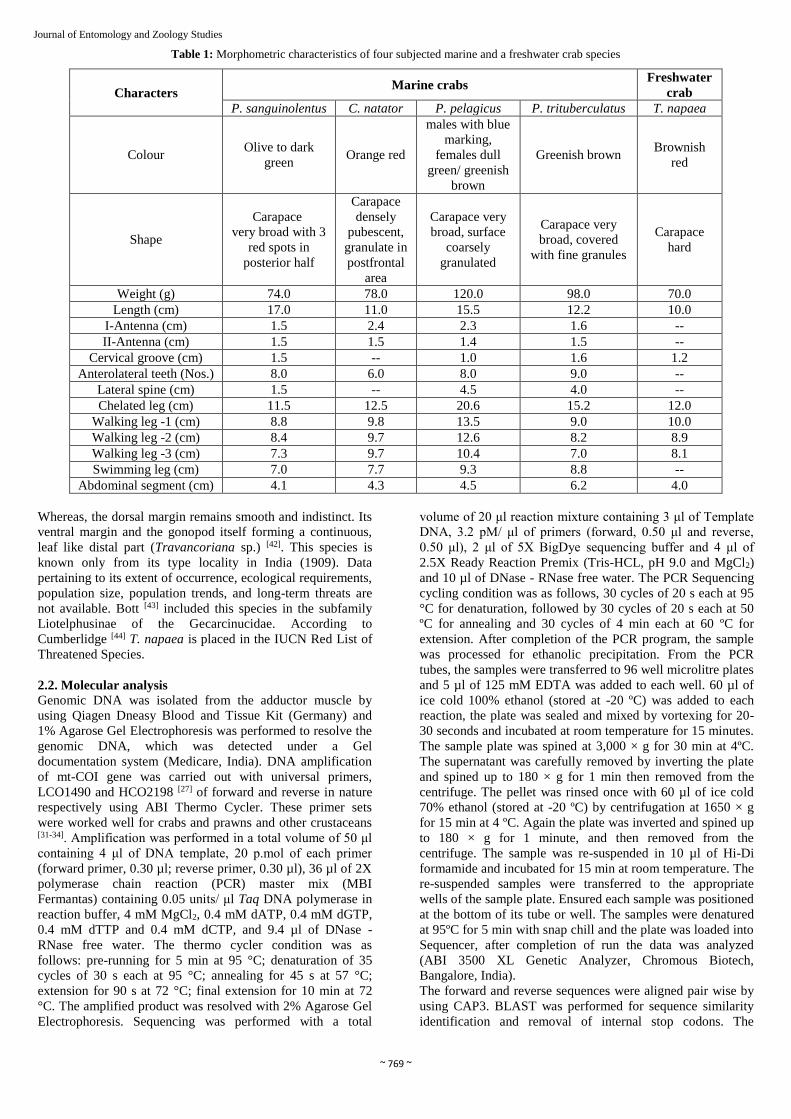
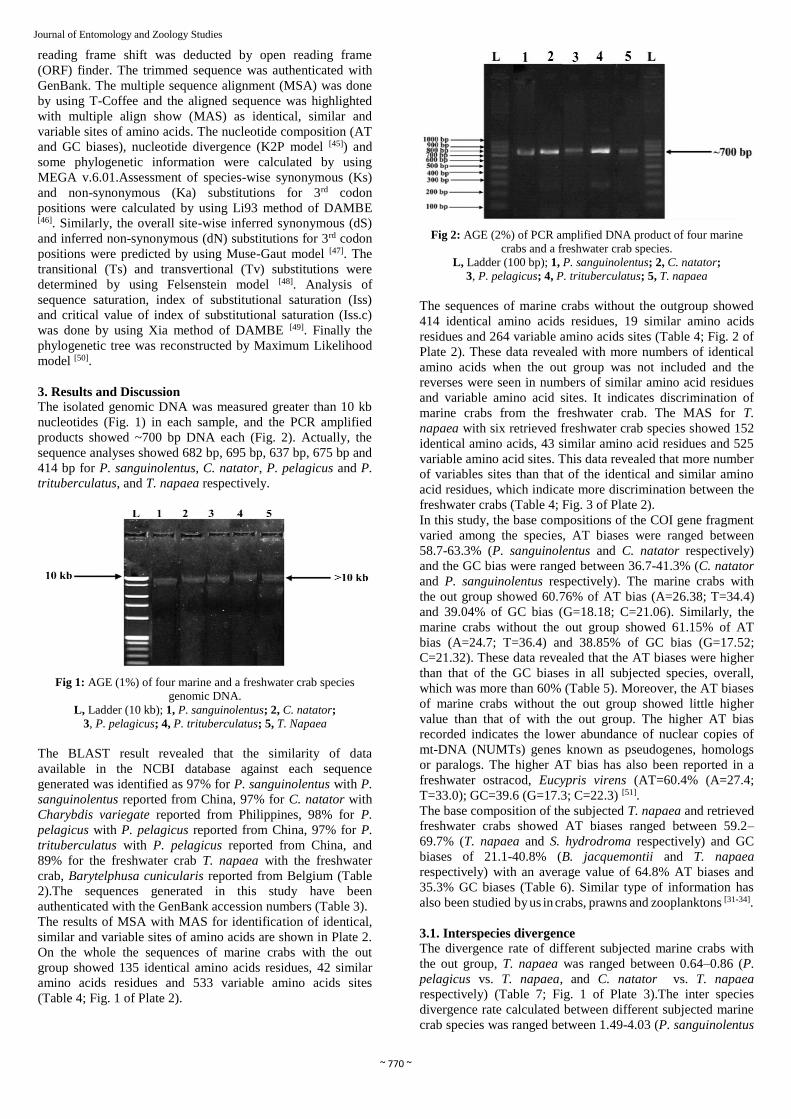
The isolated genomic DNA was measured greater than 10 kb
nucleotides (Fig. 1) in each sample, and the PCR amplified
products showed ~700 bp DNA each (Fig. 2). Actually, the
sequence analyses showed 682 bp, 695 bp, 637 bp, 675 bp and
414 bp for P. sanguinolentus, C. natator, P. pelagicus and P.
trituberculatus, and T. napaea respectively.
Fig 1: AGE (1%) of four marine and a freshwater crab species
genomic DNA.
L, Ladder (10 kb); 1, P. sanguinolentus; 2, C. natator;
3, P. pelagicus; 4, P. trituberculatus; 5, T. Napaea
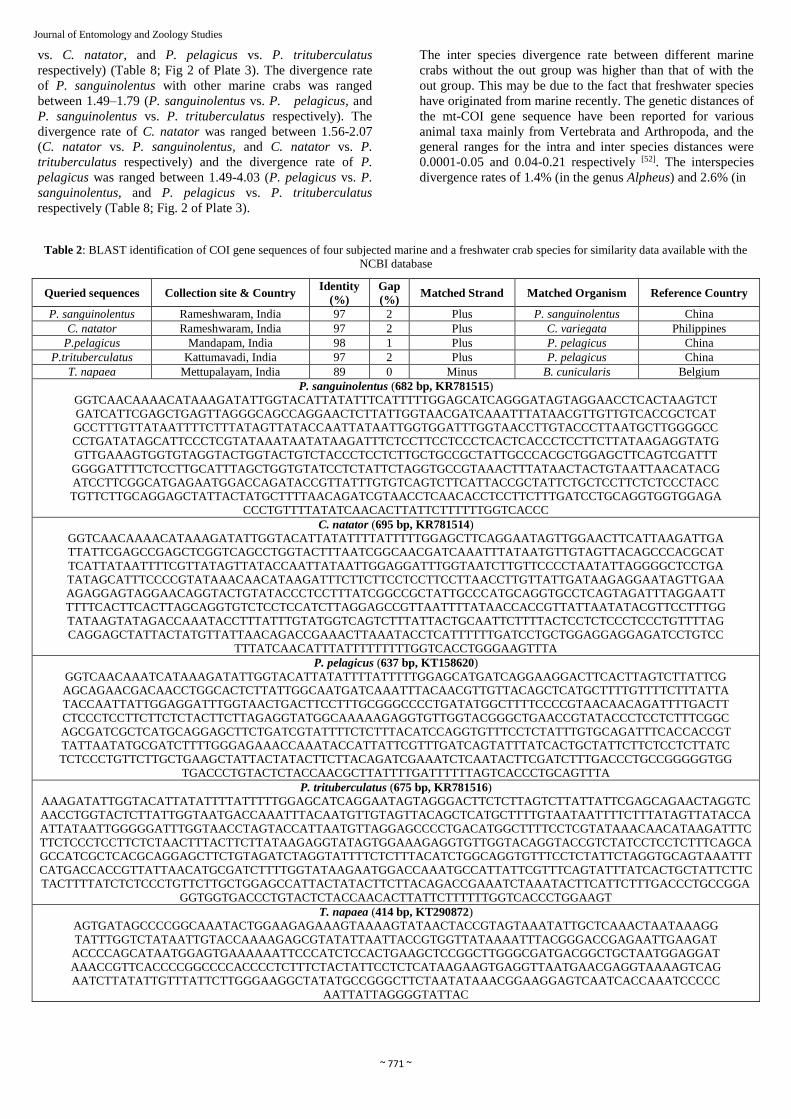
The BLAST result revealed that the similarity of data
available in the NCBI database against each sequence
generated was identified as 97% for P. sanguinolentus with P.
sanguinolentus reported from China, 97% for C. natator with
Charybdis variegate reported from Philippines, 98% for P.
pelagicus with P. pelagicus reported from China, 97% for P.
trituberculatus with P. pelagicus reported from China, and
89% for the freshwater crab T. napaea with the freshwater
crab, Barytelphusa cunicularis reported from Belgium (Table
2).The sequences generated in this study have been
authenticated with the GenBank accession numbers (Table 3).
The results of MSA with MAS for identification of identical,
similar and variable sites of amino acids are shown in Plate 2.
On the whole the sequences of marine crabs with the out
group showed 135 identical amino acids residues, 42 similar
amino acids residues and 533 variable amino acids sites
(Table 4; Fig. 1 of Plate 2).
Fig 2: AGE (2%) of PCR amplified DNA product of four marine
crabs and a freshwater crab species.
L, Ladder (100 bp); 1, P. sanguinolentus; 2, C. natator;
3, P. pelagicus; 4, P. trituberculatus; 5, T. napaea
The sequences of marine crabs without the outgroup showed
414 identical amino acids residues, 19 similar amino acids
residues and 264 variable amino acids sites (Table 4; Fig. 2 of
Plate 2). These data revealed with more numbers of identical
amino acids when the out group was not included and the
reverses were seen in numbers of similar amino acid residues
and variable amino acid sites. It indicates discrimination of
marine crabs from the freshwater crab. The MAS for T.
napaea with six retrieved freshwater crab species showed 152
identical amino acids, 43 similar amino acid residues and 525
variable amino acid sites. This data revealed that more number
of variables sites than that of the identical and similar amino
acid residues, which indicate more discrimination between the
freshwater crabs (Table 4; Fig. 3 of Plate 2).
In this study, the base compositions of the COI gene fragment
varied among the species, AT biases were ranged between
58.7-63.3% (P. sanguinolentus and C. natator respectively)
and the GC bias were ranged between 36.7-41.3% (C. natator
and P. sanguinolentus respectively). The marine crabs with
the out group showed 60.76% of AT bias (A=26.38; T=34.4)
and 39.04% of GC bias (G=18.18; C=21.06). Similarly, the
marine crabs without the out group showed 61.15% of AT
bias (A=24.7; T=36.4) and 38.85% of GC bias (G=17.52;
C=21.32). These data revealed that the AT biases were higher
than that of the GC biases in all subjected species, overall,
which was more than 60% (Table 5). Moreover, the AT biases
of marine crabs without the out group showed little higher
value than that of with the out group. The higher AT bias
recorded indicates the lower abundance of nuclear copies of
mt-DNA (NUMTs) genes known as pseudogenes, homologs
or paralogs. The higher AT bias has also been reported in a
freshwater ostracod, Eucypris virens (AT=60.4% (A=27.4;
T=33.0); GC=39.6 (G=17.3; C=22.3) [51].
The base composition of the subjected T. napaea and retrieved
freshwater crabs showed AT biases ranged between 59.2–
69.7% (T. napaea and S. hydrodroma respectively) and GC
biases of 21.1-40.8% (B. jacquemontii and T. napaea
respectively) with an average value of 64.8% AT biases and
35.3% GC biases (Table 6). Similar type of information has
also been studied by us in crabs, prawns and zooplanktons [31-34].
3.1. Interspecies divergence
The divergence rate of different subjected marine crabs with
the out group, T. napaea was ranged between 0.64–0.86 (P.
pelagicus vs. T. napaea, and C. natator vs. T. napaea
respectively) (Table 7; Fig. 1 of Plate 3).The inter species
divergence rate calculated between different subjected marine
crab species was ranged between 1.49-4.03 (P. sanguinolentus
~ 771 ~
Journal of Entomology and Zoology Studies
vs. C. natator, and P. pelagicus vs. P. trituberculatus
respectively) (Table 8; Fig 2 of Plate 3). The divergence rate
of P. sanguinolentus with other marine crabs was ranged
between 1.49–1.79 (P. sanguinolentus vs. P. pelagicus, and
P. sanguinolentus vs. P. trituberculatus respectively). The
divergence rate of C. natator was ranged between 1.56-2.07
(C. natator vs. P. sanguinolentus, and C. natator vs. P.
trituberculatus respectively) and the divergence rate of P.
pelagicus was ranged between 1.49-4.03 (P. pelagicus vs. P.
sanguinolentus, and P. pelagicus vs. P. trituberculatus
respectively (Table 8; Fig. 2 of Plate 3).
The inter species divergence rate between different marine
crabs without the out group was higher than that of with the
out group. This may be due to the fact that freshwater species
have originated from marine recently. The genetic distances of
the mt-COI gene sequence have been reported for various
animal taxa mainly from Vertebrata and Arthropoda, and the
general ranges for the intra and inter species distances were
0.0001-0.05 and 0.04-0.21 respectively [52]. The interspecies
divergence rates of 1.4% (in the genus Alpheus) and 2.6% (in
Table 2: BLAST identification of COI gene sequences of four subjected marine and a freshwater crab species for similarity data available with the
NCBI database
Queried sequences Collection site & Country Identity
(%)
Gap
(%) Matched Strand Matched Organism Reference Country
P. sanguinolentus Rameshwaram, India 97 2 Plus P. sanguinolentus China
C. natator Rameshwaram, India 97 2 Plus C. variegata Philippines
P.pelagicus Mandapam, India 98 1 Plus P. pelagicus China
P.trituberculatus Kattumavadi, India 97 2 Plus P. pelagicus China
T. napaea Mettupalayam, India 89 0 Minus B. cunicularis Belgium
P. sanguinolentus (682 bp, KR781515)
GGTCAACAAAACATAAAGATATTGGTACATTATATTTCATTTTTGGAGCATCAGGGATAGTAGGAACCTCACTAAGTCT
GATCATTCGAGCTGAGTTAGGGCAGCCAGGAACTCTTATTGGTAACGATCAAATTTATAACGTTGTTGTCACCGCTCAT
GCCTTTGTTATAATTTTCTTTATAGTTATACCAATTATAATTGGTGGATTTGGTAACCTTGTACCCTTAATGCTTGGGGCC
CCTGATATAGCATTCCCTCGTATAAATAATATAAGATTTCTCCTTCCTCCCTCACTCACCCTCCTTCTTATAAGAGGTATG
GTTGAAAGTGGTGTAGGTACTGGTACTGTCTACCCTCCTCTTGCTGCCGCTATTGCCCACGCTGGAGCTTCAGTCGATTT
GGGGATTTTCTCCTTGCATTTAGCTGGTGTATCCTCTATTCTAGGTGCCGTAAACTTTATAACTACTGTAATTAACATACG
ATCCTTCGGCATGAGAATGGACCAGATACCGTTATTTGTGTCAGTCTTCATTACCGCTATTCTGCTCCTTCTCTCCCTACC
TGTTCTTGCAGGAGCTATTACTATGCTTTTAACAGATCGTAACCTCAACACCTCCTTCTTTGATCCTGCAGGTGGTGGAGA
CCCTGTTTTATATCAACACTTATTCTTTTTTGGTCACCC
C. natator (695 bp, KR781514)
GGTCAACAAAACATAAAGATATTGGTACATTATATTTTATTTTTGGAGCTTCAGGAATAGTTGGAACTTCATTAAGATTGA
TTATTCGAGCCGAGCTCGGTCAGCCTGGTACTTTAATCGGCAACGATCAAATTTATAATGTTGTAGTTACAGCCCACGCAT
TCATTATAATTTTCGTTATAGTTATACCAATTATAATTGGAGGATTTGGTAATCTTGTTCCCCTAATATTAGGGGCTCCTGA
TATAGCATTTCCCCGTATAAACAACATAAGATTTCTTCTTCCTCCTTCCTTAACCTTGTTATTGATAAGAGGAATAGTTGAA
AGAGGAGTAGGAACAGGTACTGTATACCCTCCTTTATCGGCCGCTATTGCCCATGCAGGTGCCTCAGTAGATTTAGGAATT
TTTTCACTTCACTTAGCAGGTGTCTCCTCCATCTTAGGAGCCGTTAATTTTATAACCACCGTTATTAATATACGTTCCTTTGG
TATAAGTATAGACCAAATACCTTTATTTGTATGGTCAGTCTTTATTACTGCAATTCTTTTACTCCTCTCCCTCCCTGTTTTAG
CAGGAGCTATTACTATGTTATTAACAGACCGAAACTTAAATACCTCATTTTTTGATCCTGCTGGAGGAGGAGATCCTGTCC
TTTATCAACATTTATTTTTTTTTGGTCACCTGGGAAGTTTA
P. pelagicus (637 bp, KT158620)
GGTCAACAAATCATAAAGATATTGGTACATTATATTTTATTTTTGGAGCATGATCAGGAAGGACTTCACTTAGTCTTATTCG
AGCAGAACGACAACCTGGCACTCTTATTGGCAATGATCAAATTTACAACGTTGTTACAGCTCATGCTTTTGTTTTCTTTATTA
TACCAATTATTGGAGGATTTGGTAACTGACTTCCTTTGCGGGCCCCTGATATGGCTTTTCCCCGTAACAACAGATTTTGACTT
CTCCCTCCTTCTTCTCTACTTCTTAGAGGTATGGCAAAAAGAGGTGTTGGTACGGGCTGAACCGTATACCCTCCTCTTTCGGC
AGCGATCGCTCATGCAGGAGCTTCTGATCGTATTTTCTCTTTACATCCAGGTGTTTCCTCTATTTGTGCAGATTTCACCACCGT
TATTAATATGCGATCTTTTGGGAGAAACCAAATACCATTATTCGTTTGATCAGTATTTATCACTGCTATTCTTCTCCTCTTATC
TCTCCCTGTTCTTGCTGAAGCTATTACTATACTTCTTACAGATCGAAATCTCAATACTTCGATCTTTGACCCTGCCGGGGGTGG
TGACCCTGTACTCTACCAACGCTTATTTTGATTTTTTAGTCACCCTGCAGTTTA
P. trituberculatus (675 bp, KR781516)
AAAGATATTGGTACATTATATTTTATTTTTGGAGCATCAGGAATAGTAGGGACTTCTCTTAGTCTTATTATTCGAGCAGAACTAGGTC
AACCTGGTACTCTTATTGGTAATGACCAAATTTACAATGTTGTAGTTACAGCTCATGCTTTTGTAATAATTTTCTTTATAGTTATACCA
ATTATAATTGGGGGATTTGGTAACCTAGTACCATTAATGTTAGGAGCCCCTGACATGGCTTTTCCTCGTATAAACAACATAAGATTTC
TTCTCCCTCCTTCTCTAACTTTACTTCTTATAAGAGGTATAGTGGAAAGAGGTGTTGGTACAGGTACCGTCTATCCTCCTCTTTCAGCA
GCCATCGCTCACGCAGGAGCTTCTGTAGATCTAGGTATTTTCTCTTTACATCTGGCAGGTGTTTCCTCTATTCTAGGTGCAGTAAATTT
CATGACCACCGTTATTAACATGCGATCTTTTGGTATAAGAATGGACCAAATGCCATTATTCGTTTCAGTATTTATCACTGCTATTCTTC
TACTTTTATCTCTCCCTGTTCTTGCTGGAGCCATTACTATACTTCTTACAGACCGAAATCTAAATACTTCATTCTTTGACCCTGCCGGA
GGTGGTGACCCTGTACTCTACCAACACTTATTCTTTTTTGGTCACCCTGGAAGT
T. napaea (414 bp, KT290872)
AGTGATAGCCCCGGCAAATACTGGAAGAGAAAGTAAAAGTATAACTACCGTAGTAAATATTGCTCAAACTAATAAAGG
TATTTGGTCTATAATTGTACCAAAAGAGCGTATATTAATTACCGTGGTTATAAAATTTACGGGACCGAGAATTGAAGAT
ACCCCAGCATAATGGAGTGAAAAAATTCCCATCTCCACTGAAGCTCCGGCTTGGGCGATGACGGCTGCTAATGGAGGAT
AAACCGTTCACCCCGGCCCCACCCCTCTTTCTACTATTCCTCTCATAAGAAGTGAGGTTAATGAACGAGGTAAAAGTCAG
AATCTTATATTGTTTATTCTTGGGAAGGCTATATGCCGGGCTTCTAATATAAACGGAAGGAGTCAATCACCAAATCCCCC
AATTATTAGGGGTATTAC
~ 772 ~
Journal of Entomology and Zoology Studies
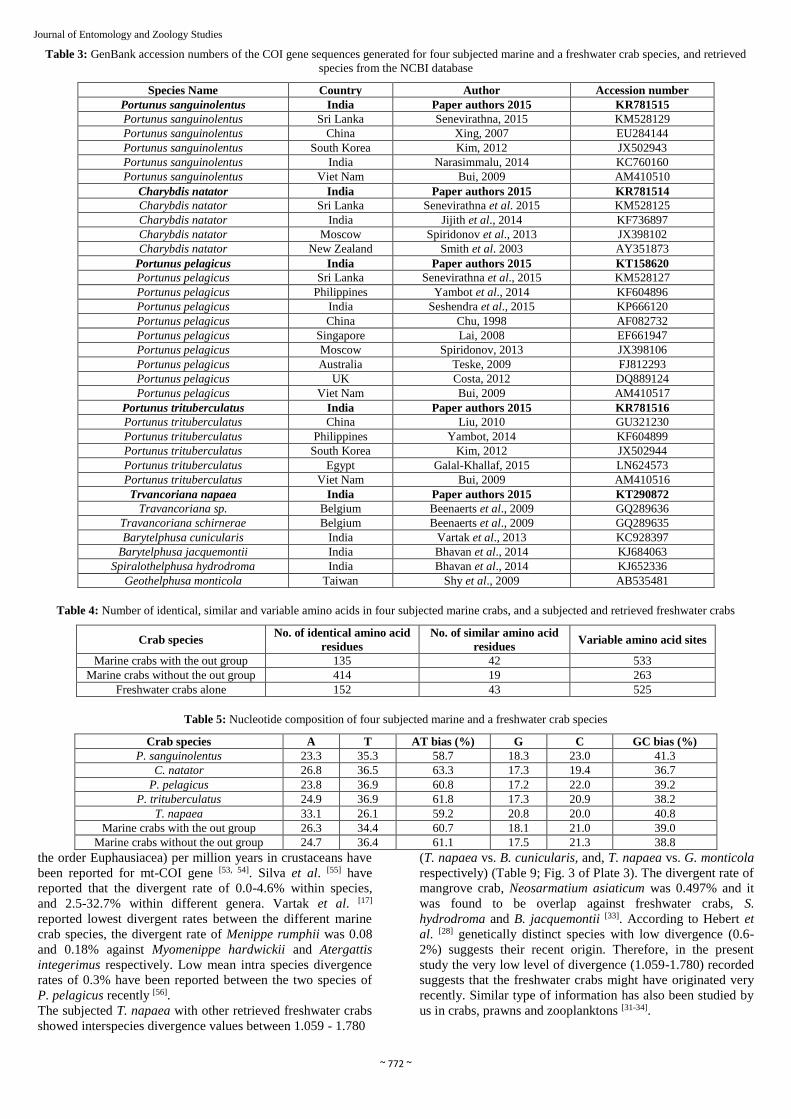
Table 3: GenBank accession numbers of the COI gene sequences generated for four subjected marine and a freshwater crab species, and retrieved
species from the NCBI database
Species Name Country Author Accession number
Portunus sanguinolentus India Paper authors 2015 KR781515
Portunus sanguinolentus Sri Lanka Senevirathna, 2015 KM528129
Portunus sanguinolentus China Xing, 2007 EU284144
Portunus sanguinolentus South Korea Kim, 2012 JX502943
Portunus sanguinolentus India Narasimmalu, 2014 KC760160
Portunus sanguinolentus Viet Nam Bui, 2009 AM410510
Charybdis natator India Paper authors 2015 KR781514
Charybdis natator Sri Lanka Senevirathna et al. 2015 KM528125
Charybdis natator India Jijith et al., 2014 KF736897
Charybdis natator Moscow Spiridonov et al., 2013 JX398102
Charybdis natator New Zealand Smith et al. 2003 AY351873
Portunus pelagicus India Paper authors 2015 KT158620
Portunus pelagicus Sri Lanka Senevirathna et al., 2015 KM528127
Portunus pelagicus Philippines Yambot et al., 2014 KF604896
Portunus pelagicus India Seshendra et al., 2015 KP666120
Portunus pelagicus China Chu, 1998 AF082732
Portunus pelagicus Singapore Lai, 2008 EF661947
Portunus pelagicus Moscow Spiridonov, 2013 JX398106
Portunus pelagicus Australia Teske, 2009 FJ812293
Portunus pelagicus UK Costa, 2012 DQ889124
Portunus pelagicus Viet Nam Bui, 2009 AM410517
Portunus trituberculatus India Paper authors 2015 KR781516
Portunus trituberculatus China Liu, 2010 GU321230
Portunus trituberculatus Philippines Yambot, 2014 KF604899
Portunus trituberculatus South Korea Kim, 2012 JX502944
Portunus trituberculatus Egypt Galal-Khallaf, 2015 LN624573
Portunus trituberculatus Viet Nam Bui, 2009 AM410516
Trvancoriana napaea India Paper authors 2015 KT290872
Travancoriana sp. Belgium Beenaerts et al., 2009 GQ289636
Travancoriana schirnerae Belgium Beenaerts et al., 2009 GQ289635
Barytelphusa cunicularis India Vartak et al., 2013 KC928397
Barytelphusa jacquemontii India Bhavan et al., 2014 KJ684063
Spiralothelphusa hydrodroma India Bhavan et al., 2014 KJ652336
Geothelphusa monticola Taiwan Shy et al., 2009 AB535481
Table 4: Number of identical, similar and variable amino acids in four subjected marine crabs, and a subjected and retrieved freshwater crabs
Crab species No. of identical amino acid
residues
No. of similar amino acid
residues Variable amino acid sites
Marine crabs with the out group 135 42 533
Marine crabs without the out group 414 19 263
Freshwater crabs alone 152 43 525
Table 5: Nucleotide composition of four subjected marine and a freshwater crab species
Crab species A T AT bias (%) G C GC bias (%)
P. sanguinolentus 23.3 35.3 58.7 18.3 23.0 41.3
C. natator 26.8 36.5 63.3 17.3 19.4 36.7
P. pelagicus 23.8 36.9 60.8 17.2 22.0 39.2
P. trituberculatus 24.9 36.9 61.8 17.3 20.9 38.2
T. napaea 33.1 26.1 59.2 20.8 20.0 40.8
Marine crabs with the out group 26.3 34.4 60.7 18.1 21.0 39.0
Marine crabs without the out group 24.7 36.4 61.1 17.5 21.3 38.8
the order Euphausiacea) per million years in crustaceans have
been reported for mt-COI gene [53, 54]. Silva et al. [55] have
reported that the divergent rate of 0.0-4.6% within species,
and 2.5-32.7% within different genera. Vartak et al. [17]
reported lowest divergent rates between the different marine
crab species, the divergent rate of Menippe rumphii was 0.08
and 0.18% against Myomenippe hardwickii and Atergattis
integerimus respectively. Low mean intra species divergence
rates of 0.3% have been reported between the two species of
P. pelagicus recently [56].
The subjected T. napaea with other retrieved freshwater crabs
showed interspecies divergence values between 1.059 - 1.780
(T. napaea vs. B. cunicularis, and, T. napaea vs. G. monticola
respectively) (Table 9; Fig. 3 of Plate 3). The divergent rate of
mangrove crab, Neosarmatium asiaticum was 0.497% and it
was found to be overlap against freshwater crabs, S.
hydrodroma and B. jacquemontii [33]. According to Hebert et
al. [28] genetically distinct species with low divergence (0.6-
2%) suggests their recent origin. Therefore, in the present
study the very low level of divergence (1.059-1.780) recorded
suggests that the freshwater crabs might have originated very
recently. Similar type of information has also been studied by
us in crabs, prawns and zooplanktons [31-34].
~ 773 ~
Journal of Entomology and Zoology Studies
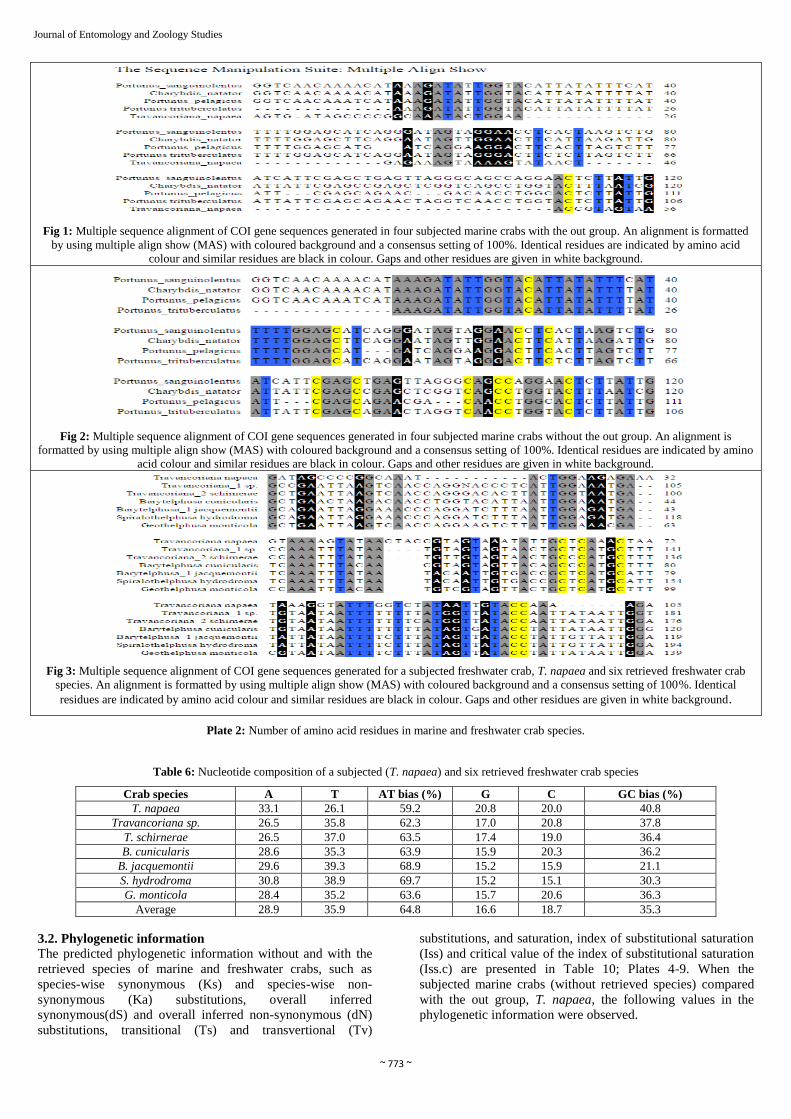
Fig 1: Multiple sequence alignment of COI gene sequences generated in four subjected marine crabs with the out group. An alignment is formatted
by using multiple align show (MAS) with coloured background and a consensus setting of 100%. Identical residues are indicated by amino acid
colour and similar residues are black in colour. Gaps and other residues are given in white background.
Fig 2: Multiple sequence alignment of COI gene sequences generated in four subjected marine crabs without the out group. An alignment is
formatted by using multiple align show (MAS) with coloured background and a consensus setting of 100%. Identical residues are indicated by amino
acid colour and similar residues are black in colour. Gaps and other residues are given in white background.
Fig 3: Multiple sequence alignment of COI gene sequences generated for a subjected freshwater crab, T. napaea and six retrieved freshwater crab
species. An alignment is formatted by using multiple align show (MAS) with coloured background and a consensus setting of 100%. Identical
residues are indicated by amino acid colour and similar residues are black in colour. Gaps and other residues are given in white background.
Plate 2: Number of amino acid residues in marine and freshwater crab species.
Table 6: Nucleotide composition of a subjected (T. napaea) and six retrieved freshwater crab species
Crab species A T AT bias (%) G C GC bias (%)
T. napaea 33.1 26.1 59.2 20.8 20.0 40.8
Travancoriana sp. 26.5 35.8 62.3 17.0 20.8 37.8
T. schirnerae 26.5 37.0 63.5 17.4 19.0 36.4
B. cunicularis 28.6 35.3 63.9 15.9 20.3 36.2
B. jacquemontii 29.6 39.3 68.9 15.2 15.9 21.1
S. hydrodroma 30.8 38.9 69.7 15.2 15.1 30.3
G. monticola 28.4 35.2 63.6 15.7 20.6 36.3
Average 28.9 35.9 64.8 16.6 18.7 35.3
3.2. Phylogenetic information The predicted phylogenetic information without and with the
retrieved species of marine and freshwater crabs, such as
species-wise synonymous (Ks) and species-wise non-
synonymous (Ka) substitutions, overall inferred
synonymous(dS) and overall inferred non-synonymous (dN)
substitutions, transitional (Ts) and transvertional (Tv)
substitutions, and saturation, index of substitutional saturation
(Iss) and critical value of the index of substitutional saturation
(Iss.c) are presented in Table 10; Plates 4-9. When the
subjected marine crabs (without retrieved species) compared
with the out group, T. napaea, the following values in the
phylogenetic information were observed.
~ 774 ~
Journal of Entomology and Zoology Studies
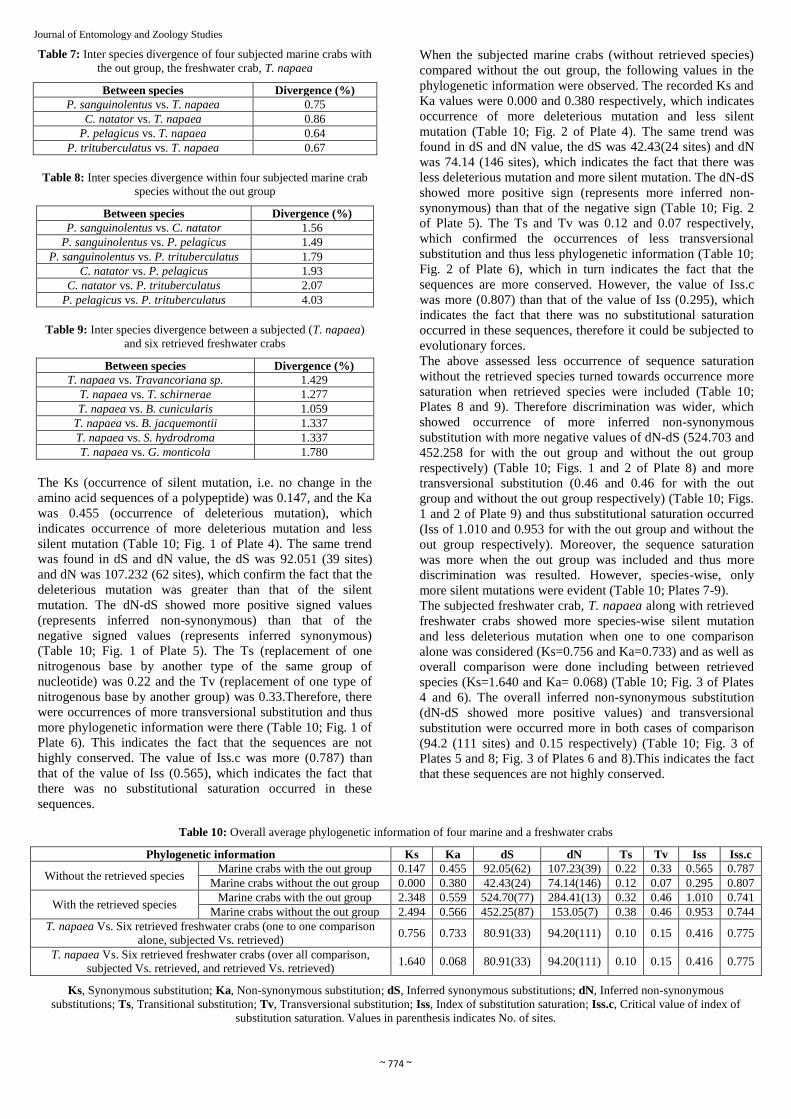
Table 7: Inter species divergence of four subjected marine crabs with
the out group, the freshwater crab, T. napaea
Between species Divergence (%)
P. sanguinolentus vs. T. napaea 0.75
C. natator vs. T. napaea 0.86
P. pelagicus vs. T. napaea 0.64
P. trituberculatus vs. T. napaea 0.67
Table 8: Inter species divergence within four subjected marine crab
species without the out group
Between species Divergence (%)
P. sanguinolentus vs. C. natator 1.56
P. sanguinolentus vs. P. pelagicus 1.49
P. sanguinolentus vs. P. trituberculatus 1.79
C. natator vs. P. pelagicus 1.93
C. natator vs. P. trituberculatus 2.07
P. pelagicus vs. P. trituberculatus 4.03
Table 9: Inter species divergence between a subjected (T. napaea)
and six retrieved freshwater crabs
Between species Divergence (%)
T. napaea vs. Travancoriana sp. 1.429
T. napaea vs. T. schirnerae 1.277
T. napaea vs. B. cunicularis 1.059
T. napaea vs. B. jacquemontii 1.337
T. napaea vs. S. hydrodroma 1.337
T. napaea vs. G. monticola 1.780
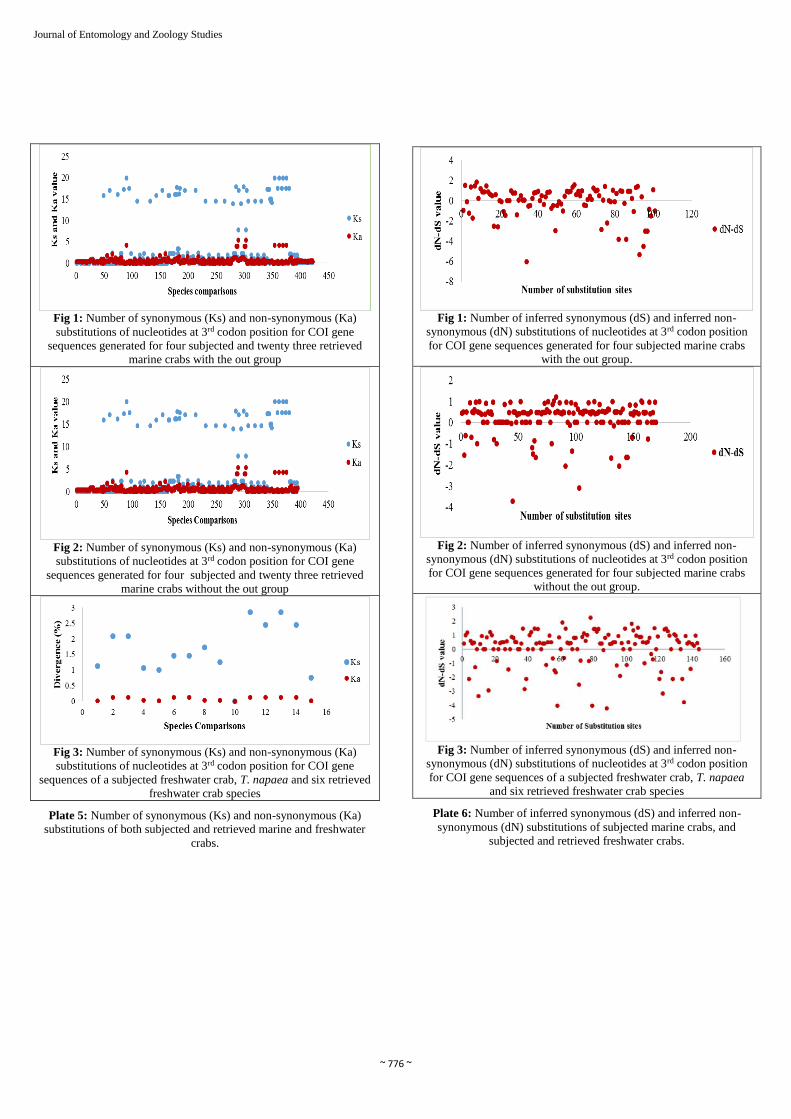
The Ks (occurrence of silent mutation, i.e. no change in the
amino acid sequences of a polypeptide) was 0.147, and the Ka
was 0.455 (occurrence of deleterious mutation), which
indicates occurrence of more deleterious mutation and less
silent mutation (Table 10; Fig. 1 of Plate 4). The same trend
was found in dS and dN value, the dS was 92.051 (39 sites)
and dN was 107.232 (62 sites), which confirm the fact that the
deleterious mutation was greater than that of the silent
mutation. The dN-dS showed more positive signed values
(represents inferred non-synonymous) than that of the
negative signed values (represents inferred synonymous)
(Table 10; Fig. 1 of Plate 5). The Ts (replacement of one
nitrogenous base by another type of the same group of
nucleotide) was 0.22 and the Tv (replacement of one type of
nitrogenous base by another group) was 0.33.Therefore, there
were occurrences of more transversional substitution and thus
more phylogenetic information were there (Table 10; Fig. 1 of
Plate 6). This indicates the fact that the sequences are not
highly conserved. The value of Iss.c was more (0.787) than
that of the value of Iss (0.565), which indicates the fact that
there was no substitutional saturation occurred in these
sequences.
When the subjected marine crabs (without retrieved species)
compared without the out group, the following values in the
phylogenetic information were observed. The recorded Ks and
Ka values were 0.000 and 0.380 respectively, which indicates
occurrence of more deleterious mutation and less silent
mutation (Table 10; Fig. 2 of Plate 4). The same trend was
found in dS and dN value, the dS was 42.43(24 sites) and dN
was 74.14 (146 sites), which indicates the fact that there was
less deleterious mutation and more silent mutation. The dN-dS
showed more positive sign (represents more inferred non-
synonymous) than that of the negative sign (Table 10; Fig. 2
of Plate 5). The Ts and Tv was 0.12 and 0.07 respectively,
which confirmed the occurrences of less transversional
substitution and thus less phylogenetic information (Table 10;
Fig. 2 of Plate 6), which in turn indicates the fact that the
sequences are more conserved. However, the value of Iss.c
was more (0.807) than that of the value of Iss (0.295), which
indicates the fact that there was no substitutional saturation
occurred in these sequences, therefore it could be subjected to
evolutionary forces.
The above assessed less occurrence of sequence saturation
without the retrieved species turned towards occurrence more
saturation when retrieved species were included (Table 10;
Plates 8 and 9). Therefore discrimination was wider, which
showed occurrence of more inferred non-synonymous
substitution with more negative values of dN-dS (524.703 and
452.258 for with the out group and without the out group
respectively) (Table 10; Figs. 1 and 2 of Plate 8) and more
transversional substitution (0.46 and 0.46 for with the out
group and without the out group respectively) (Table 10; Figs.
1 and 2 of Plate 9) and thus substitutional saturation occurred
(Iss of 1.010 and 0.953 for with the out group and without the
out group respectively). Moreover, the sequence saturation
was more when the out group was included and thus more
discrimination was resulted. However, species-wise, only
more silent mutations were evident (Table 10; Plates 7-9).
The subjected freshwater crab, T. napaea along with retrieved
freshwater crabs showed more species-wise silent mutation
and less deleterious mutation when one to one comparison
alone was considered (Ks=0.756 and Ka=0.733) and as well as
overall comparison were done including between retrieved
species (Ks=1.640 and Ka= 0.068) (Table 10; Fig. 3 of Plates
4 and 6). The overall inferred non-synonymous substitution
(dN-dS showed more positive values) and transversional
substitution were occurred more in both cases of comparison
(94.2 (111 sites) and 0.15 respectively) (Table 10; Fig. 3 of
Plates 5 and 8; Fig. 3 of Plates 6 and 8).This indicates the fact
that these sequences are not highly conserved.
Table 10: Overall average phylogenetic information of four marine and a freshwater crabs
Phylogenetic information Ks Ka dS dN Ts Tv Iss Iss.c
Without the retrieved species Marine crabs with the out group 0.147 0.455 92.05(62) 107.23(39) 0.22 0.33 0.565 0.787
Marine crabs without the out group 0.000 0.380 42.43(24) 74.14(146) 0.12 0.07 0.295 0.807
With the retrieved species Marine crabs with the out group 2.348 0.559 524.70(77) 284.41(13) 0.32 0.46 1.010 0.741
Marine crabs without the out group 2.494 0.566 452.25(87) 153.05(7) 0.38 0.46 0.953 0.744
T. napaea Vs. Six retrieved freshwater crabs (one to one comparison
alone, subjected Vs. retrieved) 0.756 0.733 80.91(33) 94.20(111) 0.10 0.15 0.416 0.775
T. napaea Vs. Six retrieved freshwater crabs (over all comparison,
subjected Vs. retrieved, and retrieved Vs. retrieved) 1.640 0.068 80.91(33) 94.20(111) 0.10 0.15 0.416 0.775
Ks, Synonymous substitution; Ka, Non-synonymous substitution; dS, Inferred synonymous substitutions; dN, Inferred non-synonymous
substitutions; Ts, Transitional substitution; Tv, Transversional substitution; Iss, Index of substitution saturation; Iss.c, Critical value of index of
substitution saturation. Values in parenthesis indicates No. of sites.
~ 775 ~
Journal of Entomology and Zoology Studies
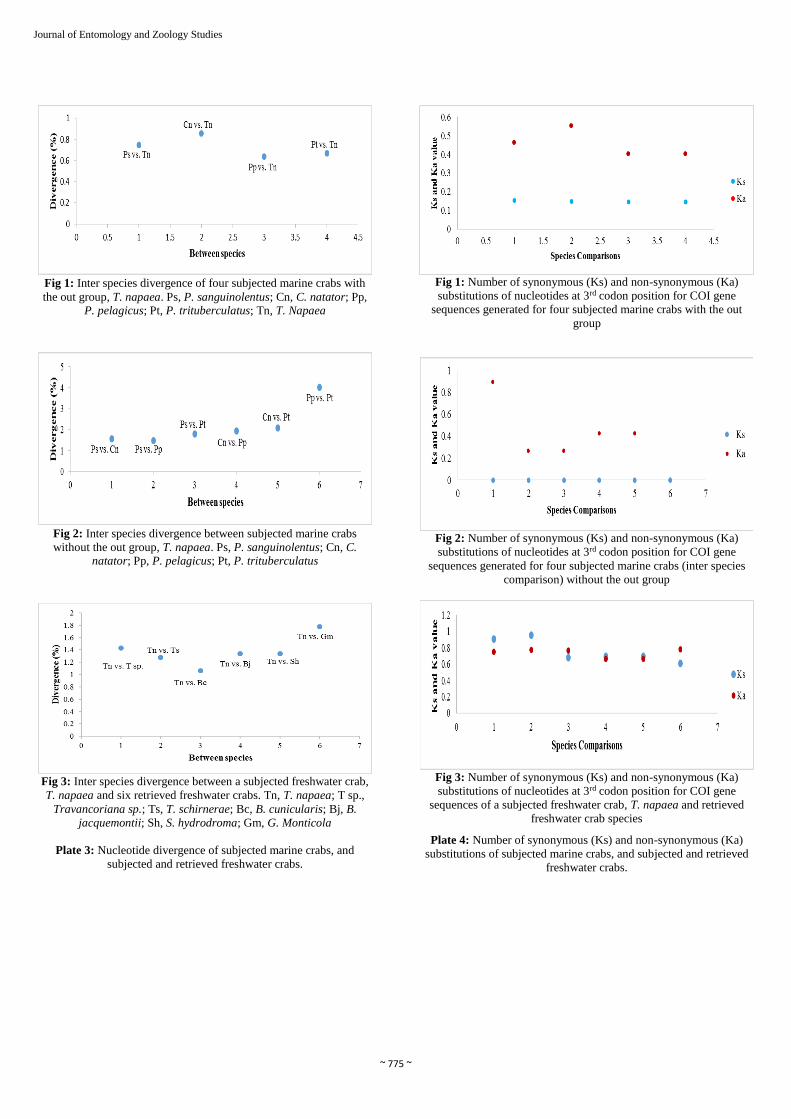
Fig 1: Inter species divergence of four subjected marine crabs with
the out group, T. napaea. Ps, P. sanguinolentus; Cn, C. natator; Pp, P. pelagicus; Pt, P. trituberculatus; Tn, T. Napaea
Fig 2: Inter species divergence between subjected marine crabs
without the out group, T. napaea. Ps, P. sanguinolentus; Cn, C. natator; Pp, P. pelagicus; Pt, P. trituberculatus
Fig 3: Inter species divergence between a subjected freshwater crab,
T. napaea and six retrieved freshwater crabs. Tn, T. napaea; T sp.,
Travancoriana sp.; Ts, T. schirnerae; Bc, B. cunicularis; Bj, B.
jacquemontii; Sh, S. hydrodroma; Gm, G. Monticola
Plate 3: Nucleotide divergence of subjected marine crabs, and
subjected and retrieved freshwater crabs.
Fig 1: Number of synonymous (Ks) and non-synonymous (Ka)
substitutions of nucleotides at 3rd codon position for COI gene
sequences generated for four subjected marine crabs with the out
group
Fig 2: Number of synonymous (Ks) and non-synonymous (Ka)
substitutions of nucleotides at 3rd codon position for COI gene
sequences generated for four subjected marine crabs (inter species
comparison) without the out group
Fig 3: Number of synonymous (Ks) and non-synonymous (Ka)
substitutions of nucleotides at 3rd codon position for COI gene
sequences of a subjected freshwater crab, T. napaea and retrieved
freshwater crab species
Plate 4: Number of synonymous (Ks) and non-synonymous (Ka)
substitutions of subjected marine crabs, and subjected and retrieved
freshwater crabs.
~ 776 ~
Journal of Entomology and Zoology Studies
Fig 1: Number of synonymous (Ks) and non-synonymous (Ka)
substitutions of nucleotides at 3rd codon position for COI gene
sequences generated for four subjected and twenty three retrieved
marine crabs with the out group
Fig 2: Number of synonymous (Ks) and non-synonymous (Ka)
substitutions of nucleotides at 3rd codon position for COI gene
sequences generated for four subjected and twenty three retrieved
marine crabs without the out group
Fig 3: Number of synonymous (Ks) and non-synonymous (Ka)
substitutions of nucleotides at 3rd codon position for COI gene
sequences of a subjected freshwater crab, T. napaea and six retrieved
freshwater crab species
Plate 5: Number of synonymous (Ks) and non-synonymous (Ka)
substitutions of both subjected and retrieved marine and freshwater
crabs.
Fig 1: Number of inferred synonymous (dS) and inferred non-
synonymous (dN) substitutions of nucleotides at 3rd codon position
for COI gene sequences generated for four subjected marine crabs
with the out group.
Fig 2: Number of inferred synonymous (dS) and inferred non-
synonymous (dN) substitutions of nucleotides at 3rd codon position
for COI gene sequences generated for four subjected marine crabs
without the out group.
Fig 3: Number of inferred synonymous (dS) and inferred non-
synonymous (dN) substitutions of nucleotides at 3rd codon position
for COI gene sequences of a subjected freshwater crab, T. napaea
and six retrieved freshwater crab species
Plate 6: Number of inferred synonymous (dS) and inferred non-
synonymous (dN) substitutions of subjected marine crabs, and
subjected and retrieved freshwater crabs.
~ 777 ~
Journal of Entomology and Zoology Studies
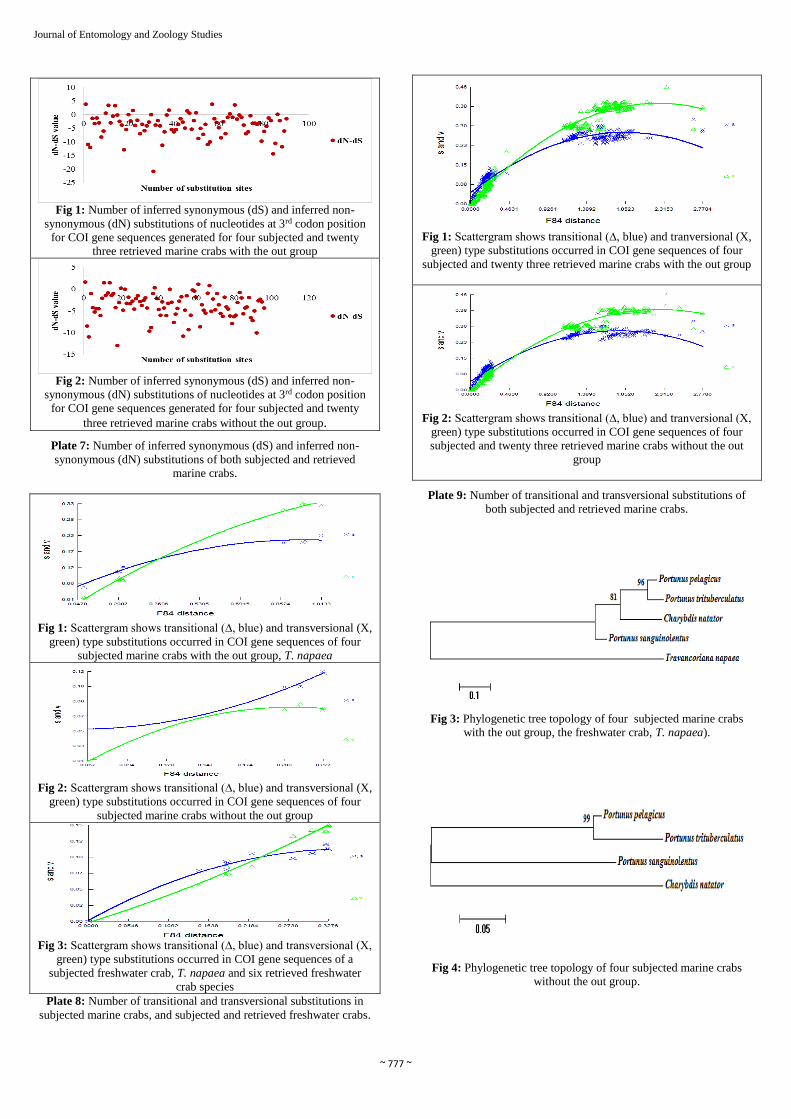
Fig 1: Number of inferred synonymous (dS) and inferred non-
synonymous (dN) substitutions of nucleotides at 3rd codon position
for COI gene sequences generated for four subjected and twenty
three retrieved marine crabs with the out group
Fig 2: Number of inferred synonymous (dS) and inferred non-
synonymous (dN) substitutions of nucleotides at 3rd codon position
for COI gene sequences generated for four subjected and twenty
three retrieved marine crabs without the out group.
Plate 7: Number of inferred synonymous (dS) and inferred non-
synonymous (dN) substitutions of both subjected and retrieved
marine crabs.
Fig 1: Scattergram shows transitional (∆, blue) and transversional (X,
green) type substitutions occurred in COI gene sequences of four
subjected marine crabs with the out group, T. napaea
Fig 2: Scattergram shows transitional (∆, blue) and transversional (X,
green) type substitutions occurred in COI gene sequences of four
subjected marine crabs without the out group
Fig 3: Scattergram shows transitional (∆, blue) and transversional (X,
green) type substitutions occurred in COI gene sequences of a
subjected freshwater crab, T. napaea and six retrieved freshwater
crab species
Plate 8: Number of transitional and transversional substitutions in
subjected marine crabs, and subjected and retrieved freshwater crabs.
Fig 1: Scattergram shows transitional (∆, blue) and tranversional (X,
green) type substitutions occurred in COI gene sequences of four
subjected and twenty three retrieved marine crabs with the out group
Fig 2: Scattergram shows transitional (∆, blue) and tranversional (X,
green) type substitutions occurred in COI gene sequences of four
subjected and twenty three retrieved marine crabs without the out
group
Plate 9: Number of transitional and transversional substitutions of
both subjected and retrieved marine crabs.
Fig 3: Phylogenetic tree topology of four subjected marine crabs
with the out group, the freshwater crab, T. napaea).
Fig 4: Phylogenetic tree topology of four subjected marine crabs
without the out group.
~ 778 ~
Journal of Entomology and Zoology Studies
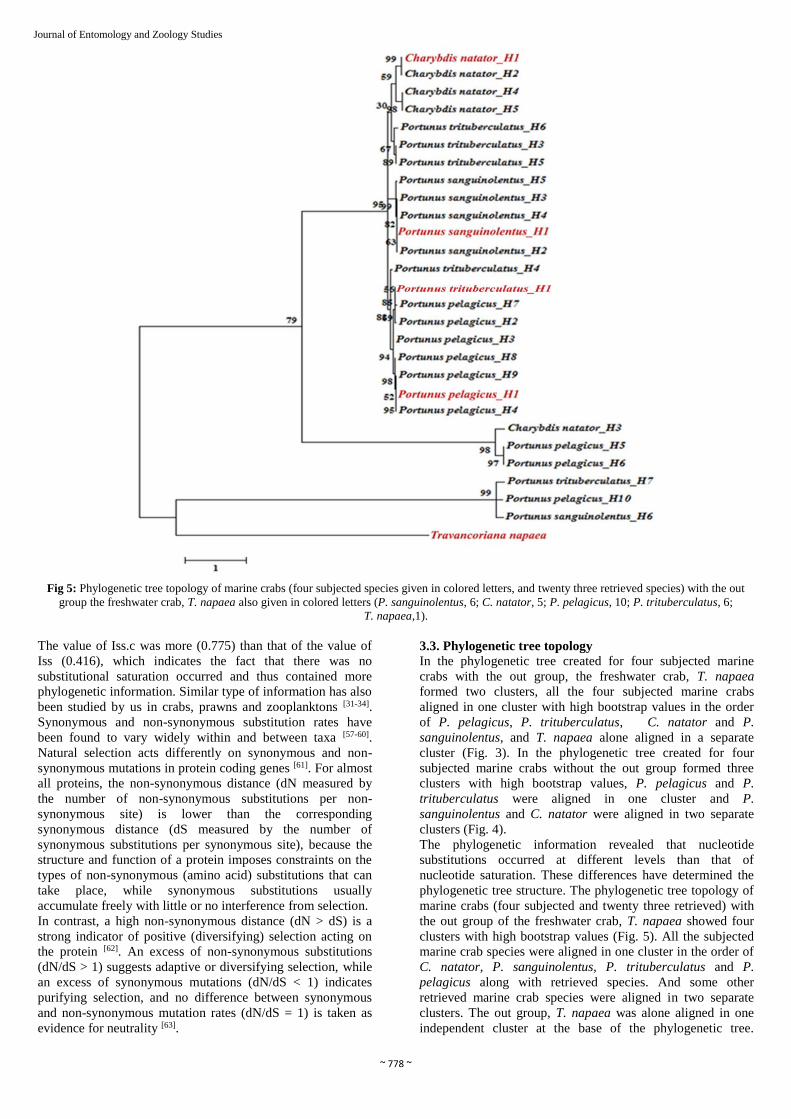
Fig 5: Phylogenetic tree topology of marine crabs (four subjected species given in colored letters, and twenty three retrieved species) with the out
group the freshwater crab, T. napaea also given in colored letters (P. sanguinolentus, 6; C. natator, 5; P. pelagicus, 10; P. trituberculatus, 6;
T. napaea,1).
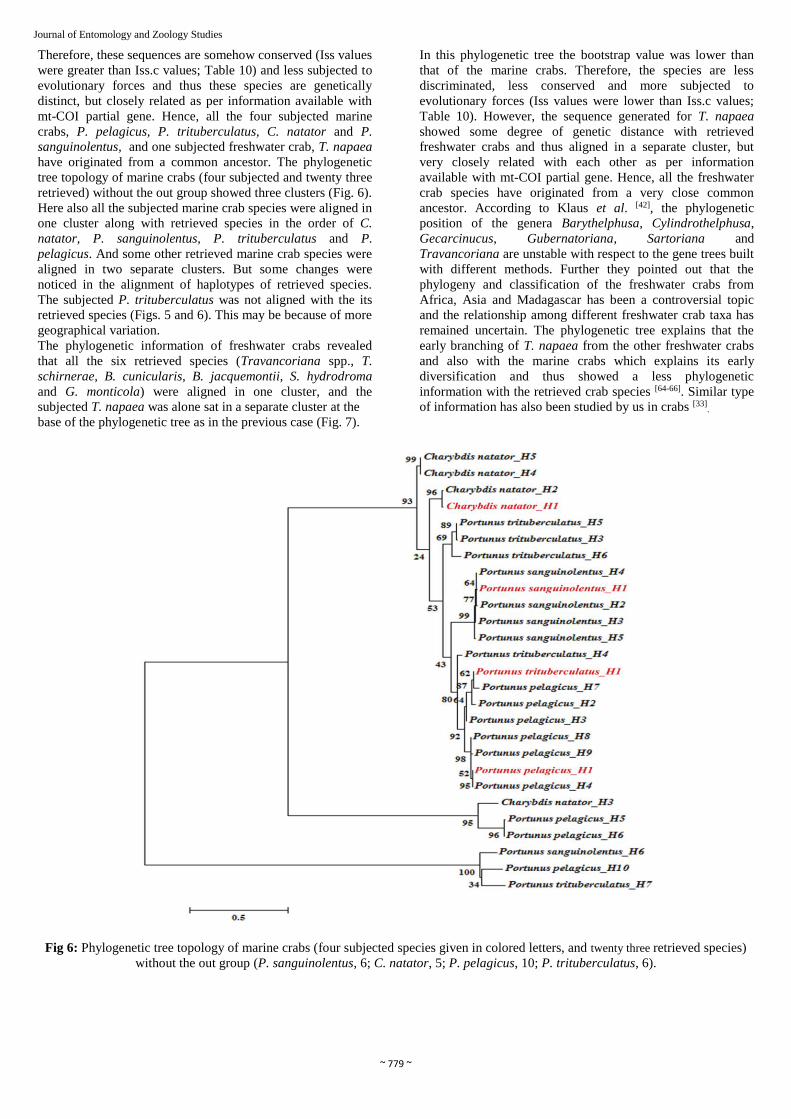
The value of Iss.c was more (0.775) than that of the value of
Iss (0.416), which indicates the fact that there was no
substitutional saturation occurred and thus contained more
phylogenetic information. Similar type of information has also
been studied by us in crabs, prawns and zooplanktons [31-34].
Synonymous and non-synonymous substitution rates have
been found to vary widely within and between taxa [57-60].
Natural selection acts differently on synonymous and non-
synonymous mutations in protein coding genes [61]. For almost
all proteins, the non-synonymous distance (dN measured by
the number of non-synonymous substitutions per non-
synonymous site) is lower than the corresponding
synonymous distance (dS measured by the number of
synonymous substitutions per synonymous site), because the
structure and function of a protein imposes constraints on the
types of non-synonymous (amino acid) substitutions that can
take place, while synonymous substitutions usually
accumulate freely with little or no interference from selection.
In contrast, a high non-synonymous distance (dN > dS) is a
strong indicator of positive (diversifying) selection acting on
the protein [62]. An excess of non-synonymous substitutions
(dN/dS > 1) suggests adaptive or diversifying selection, while
an excess of synonymous mutations (dN/dS < 1) indicates
purifying selection, and no difference between synonymous
and non-synonymous mutation rates (dN/dS = 1) is taken as
evidence for neutrality [63].
3.3. Phylogenetic tree topology
In the phylogenetic tree created for four subjected marine
crabs with the out group, the freshwater crab, T. napaea
formed two clusters, all the four subjected marine crabs
aligned in one cluster with high bootstrap values in the order
of P. pelagicus, P. trituberculatus, C. natator and P.
sanguinolentus, and T. napaea alone aligned in a separate
cluster (Fig. 3). In the phylogenetic tree created for four
subjected marine crabs without the out group formed three
clusters with high bootstrap values, P. pelagicus and P.
trituberculatus were aligned in one cluster and P.
sanguinolentus and C. natator were aligned in two separate
clusters (Fig. 4).
The phylogenetic information revealed that nucleotide
substitutions occurred at different levels than that of
nucleotide saturation. These differences have determined the
phylogenetic tree structure. The phylogenetic tree topology of
marine crabs (four subjected and twenty three retrieved) with
the out group of the freshwater crab, T. napaea showed four
clusters with high bootstrap values (Fig. 5). All the subjected
marine crab species were aligned in one cluster in the order of
C. natator, P. sanguinolentus, P. trituberculatus and P.
pelagicus along with retrieved species. And some other
retrieved marine crab species were aligned in two separate
clusters. The out group, T. napaea was alone aligned in one
independent cluster at the base of the phylogenetic tree.
~ 779 ~
Journal of Entomology and Zoology Studies
Therefore, these sequences are somehow conserved (Iss values
were greater than Iss.c values; Table 10) and less subjected to
evolutionary forces and thus these species are genetically
distinct, but closely related as per information available with
mt-COI partial gene. Hence, all the four subjected marine
crabs, P. pelagicus, P. trituberculatus, C. natator and P.
sanguinolentus, and one subjected freshwater crab, T. napaea
have originated from a common ancestor. The phylogenetic
tree topology of marine crabs (four subjected and twenty three
retrieved) without the out group showed three clusters (Fig. 6).
Here also all the subjected marine crab species were aligned in
one cluster along with retrieved species in the order of C.
natator, P. sanguinolentus, P. trituberculatus and P.
pelagicus. And some other retrieved marine crab species were
aligned in two separate clusters. But some changes were
noticed in the alignment of haplotypes of retrieved species.
The subjected P. trituberculatus was not aligned with the its
retrieved species (Figs. 5 and 6). This may be because of more
geographical variation.
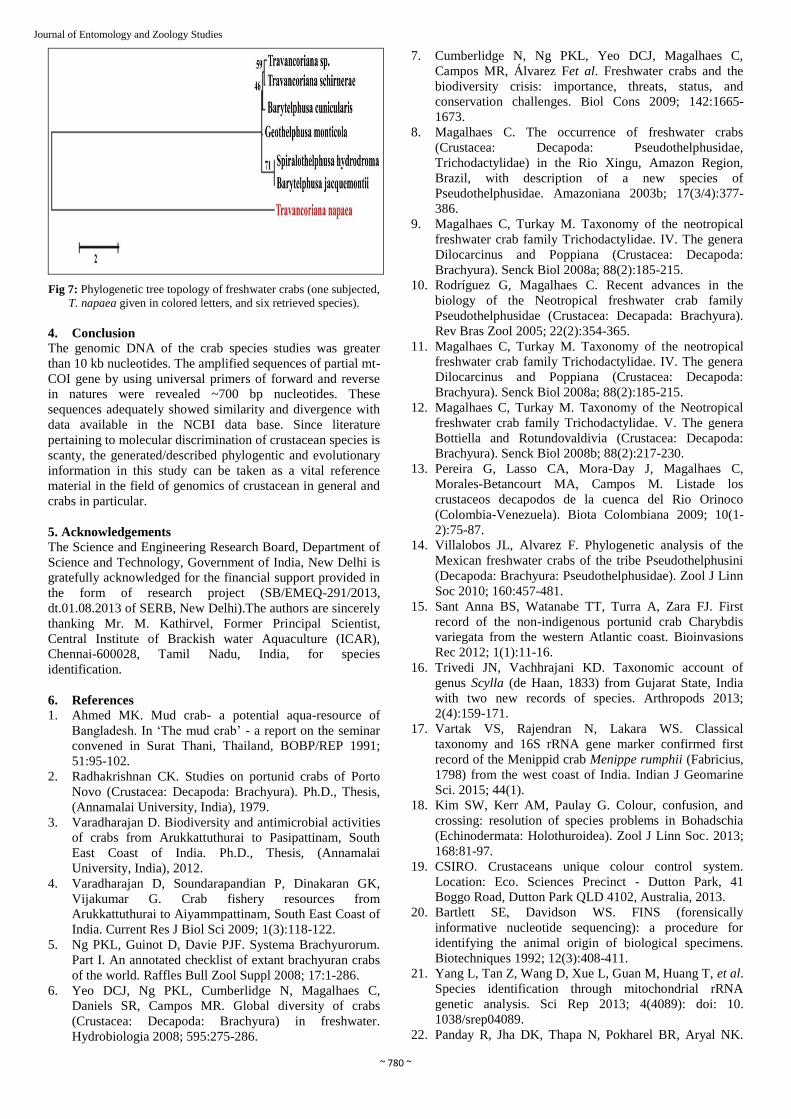
The phylogenetic information of freshwater crabs revealed
that all the six retrieved species (Travancoriana spp., T.
schirnerae, B. cunicularis, B. jacquemontii, S. hydrodroma
and G. monticola) were aligned in one cluster, and the
subjected T. napaea was alone sat in a separate cluster at the
base of the phylogenetic tree as in the previous case (Fig. 7).
In this phylogenetic tree the bootstrap value was lower than
that of the marine crabs. Therefore, the species are less
discriminated, less conserved and more subjected to
evolutionary forces (Iss values were lower than Iss.c values;
Table 10). However, the sequence generated for T. napaea
showed some degree of genetic distance with retrieved
freshwater crabs and thus aligned in a separate cluster, but
very closely related with each other as per information
available with mt-COI partial gene. Hence, all the freshwater
crab species have originated from a very close common
ancestor. According to Klaus et al. [42], the phylogenetic
position of the genera Barythelphusa, Cylindrothelphusa,
Gecarcinucus, Gubernatoriana, Sartoriana and
Travancoriana are unstable with respect to the gene trees built
with different methods. Further they pointed out that the
phylogeny and classification of the freshwater crabs from
Africa, Asia and Madagascar has been a controversial topic
and the relationship among different freshwater crab taxa has
remained uncertain. The phylogenetic tree explains that the
early branching of T. napaea from the other freshwater crabs
and also with the marine crabs which explains its early
diversification and thus showed a less phylogenetic
information with the retrieved crab species [64-66]. Similar type
of information has also been studied by us in crabs [33].
Fig 6: Phylogenetic tree topology of marine crabs (four subjected species given in colored letters, and twenty three retrieved species)
without the out group (P. sanguinolentus, 6; C. natator, 5; P. pelagicus, 10; P. trituberculatus, 6).
~ 780 ~
Journal of Entomology and Zoology Studies
Fig 7: Phylogenetic tree topology of freshwater crabs (one subjected,
T. napaea given in colored letters, and six retrieved species).
4. Conclusion
The genomic DNA of the crab species studies was greater
than 10 kb nucleotides. The amplified sequences of partial mt-
COI gene by using universal primers of forward and reverse
in natures were revealed ~700 bp nucleotides. These
sequences adequately showed similarity and divergence with
data available in the NCBI data base. Since literature
pertaining to molecular discrimination of crustacean species is
scanty, the generated/described phylogentic and evolutionary
information in this study can be taken as a vital reference
material in the field of genomics of crustacean in general and
crabs in particular.
5. Acknowledgements
The Science and Engineering Research Board, Department of
Science and Technology, Government of India, New Delhi is
gratefully acknowledged for the financial support provided in
the form of research project (SB/EMEQ-291/2013,
dt.01.08.2013 of SERB, New Delhi).The authors are sincerely
thanking Mr. M. Kathirvel, Former Principal Scientist,
Central Institute of Brackish water Aquaculture (ICAR),
Chennai-600028, Tamil Nadu, India, for species
identification.
6. References
1. Ahmed MK. Mud crab- a potential aqua-resource of
Bangladesh. In ‘The mud crab’ - a report on the seminar
convened in Surat Thani, Thailand, BOBP/REP 1991;
51:95-102.
2. Radhakrishnan CK. Studies on portunid crabs of Porto
Novo (Crustacea: Decapoda: Brachyura). Ph.D., Thesis,
(Annamalai University, India), 1979.
3. Varadharajan D. Biodiversity and antimicrobial activities
of crabs from Arukkattuthurai to Pasipattinam, South
East Coast of India. Ph.D., Thesis, (Annamalai
University, India), 2012.
4. Varadharajan D, Soundarapandian P, Dinakaran GK,
Vijakumar G. Crab fishery resources from
Arukkattuthurai to Aiyammpattinam, South East Coast of
India. Current Res J Biol Sci 2009; 1(3):118-122.
5. Ng PKL, Guinot D, Davie PJF. Systema Brachyurorum.
Part I. An annotated checklist of extant brachyuran crabs
of the world. Raffles Bull Zool Suppl 2008; 17:1-286.
6. Yeo DCJ, Ng PKL, Cumberlidge N, Magalhaes C,
Daniels SR, Campos MR. Global diversity of crabs
(Crustacea: Decapoda: Brachyura) in freshwater.
Hydrobiologia 2008; 595:275-286.
7. Cumberlidge N, Ng PKL, Yeo DCJ, Magalhaes C,
Campos MR, Álvarez Fet al. Freshwater crabs and the
biodiversity crisis: importance, threats, status, and
conservation challenges. Biol Cons 2009; 142:1665-
1673.
8. Magalhaes C. The occurrence of freshwater crabs
(Crustacea: Decapoda: Pseudothelphusidae,
Trichodactylidae) in the Rio Xingu, Amazon Region,
Brazil, with description of a new species of
Pseudothelphusidae. Amazoniana 2003b; 17(3/4):377-
386.
9. Magalhaes C, Turkay M. Taxonomy of the neotropical
freshwater crab family Trichodactylidae. IV. The genera
Dilocarcinus and Poppiana (Crustacea: Decapoda:
Brachyura). Senck Biol 2008a; 88(2):185-215.
10. Rodríguez G, Magalhaes C. Recent advances in the
biology of the Neotropical freshwater crab family
Pseudothelphusidae (Crustacea: Decapada: Brachyura).
Rev Bras Zool 2005; 22(2):354-365.
11. Magalhaes C, Turkay M. Taxonomy of the neotropical
freshwater crab family Trichodactylidae. IV. The genera
Dilocarcinus and Poppiana (Crustacea: Decapoda:
Brachyura). Senck Biol 2008a; 88(2):185-215.
12. Magalhaes C, Turkay M. Taxonomy of the Neotropical
freshwater crab family Trichodactylidae. V. The genera
Bottiella and Rotundovaldivia (Crustacea: Decapoda:
Brachyura). Senck Biol 2008b; 88(2):217-230.
13. Pereira G, Lasso CA, Mora-Day J, Magalhaes C,
Morales-Betancourt MA, Campos M. Listade los
crustaceos decapodos de la cuenca del Rio Orinoco
(Colombia-Venezuela). Biota Colombiana 2009; 10(1-
2):75-87.
14. Villalobos JL, Alvarez F. Phylogenetic analysis of the
Mexican freshwater crabs of the tribe Pseudothelphusini
(Decapoda: Brachyura: Pseudothelphusidae). Zool J Linn
Soc 2010; 160:457-481.
15. Sant Anna BS, Watanabe TT, Turra A, Zara FJ. First
record of the non-indigenous portunid crab Charybdis
variegata from the western Atlantic coast. Bioinvasions
Rec 2012; 1(1):11-16.
16. Trivedi JN, Vachhrajani KD. Taxonomic account of
genus Scylla (de Haan, 1833) from Gujarat State, India
with two new records of species. Arthropods 2013;
2(4):159-171.
17. Vartak VS, Rajendran N, Lakara WS. Classical
taxonomy and 16S rRNA gene marker confirmed first
record of the Menippid crab Menippe rumphii (Fabricius,
1798) from the west coast of India. Indian J Geomarine
Sci. 2015; 44(1).
18. Kim SW, Kerr AM, Paulay G. Colour, confusion, and
crossing: resolution of species problems in Bohadschia
(Echinodermata: Holothuroidea). Zool J Linn Soc. 2013;
168:81-97.
19. CSIRO. Crustaceans unique colour control system.
Location: Eco. Sciences Precinct - Dutton Park, 41
Boggo Road, Dutton Park QLD 4102, Australia, 2013.
20. Bartlett SE, Davidson WS. FINS (forensically
informative nucleotide sequencing): a procedure for
identifying the animal origin of biological specimens.
Biotechniques 1992; 12(3):408-411.
21. Yang L, Tan Z, Wang D, Xue L, Guan M, Huang T, et al.
Species identification through mitochondrial rRNA
genetic analysis. Sci Rep 2013; 4(4089): doi: 10.
1038/srep04089.
22. Panday R, Jha DK, Thapa N, Pokharel BR, Aryal NK.
~ 781 ~
Journal of Entomology and Zoology Studies
Forensic wildlife parts and their product identification
and individualization using DNA barcoding. Open
Forensic Scie J. 2014; 7:6-13.
23. Wu S, Xiong J, Yu Y. Taxonomic resolutions based on
18S rRNA genes: A case study of subclass Copepoda.
PLoS One 2015; 10(6):e0131498.
24. Bucklin A, Wiebe PH, Smolenack SB. DNA barcodes for
species identification of euphausiids (Euphausiacea,
Crustacea). J Plank Res. 2007; 29:483-493.
25. Costa FO, de Waard JR, Boutillier J, Ratnasingham S,
Dooh RT, Hajibabaei M et al. Biological identifications
through DNA barcodes: the case of the Crustacea.
Canadian J Fish Aqua Sci. 2007; 64:272-295.
26. Tautz D, Arctander P, Alessandro M, Thomas RH,
Vogler AP. A plea for DNA taxonomy. Trends Ecol Evol
2003; 18(2):70-74.
27. Folmer O, Black M, Hoeh W, Lutz R, Vrijenhoek R.
DNA primers for amplification of mitochondrial
cytochrome c oxidase subunit I from diversed metazoan
invertebrates. Mol Mar Biol Biotech 1994; 3:294-297.
28. Hebert PDN, Cywinska A, Cywinska SL, Ball SL, de
Waard JR. Biological identifications through DNA
barcodes. Proc Biol Sci 2003; 270(1512):313-321.
29. Blaxter ML. The promise of a DNA taxonomy. Phil
Trans R Soc Lond. Ser B 2004; 359:669-679.
30. Lefebure T, Douady CJ, Gouy M, Gibert J. Relationship
between morphological taxonomy and molecular
divergence within Crustacea: proposal of a molecular
threshold to help species delimitation.
Mol Phylogen Evol 2006; 40:435-447.
31. Rajkumar G, Bhavan PS, Udayasuriyan R, Vadivalagan
C. Molecular identification of shrimp species, Penaeus
semisulcatus, Metapenaeus dobsoni, Metapenaeus
brevicornis, Fenneropenaeus indicus, Parapenaeopsis
stylifera and Solenocera crassicornis inhabiting in the
coromandel coast (Tamil Nadu, India) using MT-COI
gene. Inter J Fish Aqua Stud. 2015; 2(4):96-106.
32. Udayasuriyan R, Bhavan PS, Vadivalagan C, Rajkumar
G. Efficiency of different COI markers in DNA
barcoding of freshwater prawn species. J Entomol Zool
Stud. 2015; 3(3):98-110.
33. Bhavan PS, Umamaheswari S, Udayasuriyan R,
Rajkumar G, Amritha H, Saranya K. Discrimination of
two freshwater crabs Spiralothelphusa hydrodroma and
Barytelphusa jacquemontii and one mangrove crab
Neosarmatium asiaticum by DNA barcoding of MT-COI
gene. J Chem Biol Phys Sci. 2015; 5(2):1426-1440.
34. Bhavan PS, Udayasuriyan R, Vadivalagan C, Kalpana R.
Diversity of zooplankton in four perennial lakes of
Coimbatore (India) and molecular characterization of
Asplanchna intermedia, Moina micrura, Mesocyclops
edax and Cypris protubera through mt-COI gene. J
Entomol Zool Stud. 2016; 4(2):183-197.
35. Herbst JFW. Kritisches VerzeichniB meiner
Insektensammlung. Archiv der Insectengeschichte 1783;
4(5):1-151.
36. Jose J, Lakshmi PS. Training Programme on Taxonomy
and Identification of Commercially Important
Crustaceans of India. Central Marine Fisheries Research
Institute, Kochi, India, 2013, 1-175.
37. Herbst JFW, Der Kafer, Jablonsky CG. Natursysem aller
bekannten in und auslandischen Insecten, alseine
Fortsetzung der von Buffonschen Naturgeschichte.
Nachdem System des Ritters von Linne und Fabricius:
Ben Joachim Pauli, Berlin 1789; 2:1-330.
38. WoRMS. Editorial Board. World Register of Marine
Species. Available from http://www.marinespecies.org at
VLIZ, 2016.
39. Linnaeus C. Systema naturae per regna trianaturae:
secundum classes, ordines, genera, species, cum
characteribus, differentiis, synonymis, locis (in Latin)
(10th ed.). Stockholm: Laurentius Salvius, 1758.
40. Miers EJ. Catalogue of the Stalk and Sessile eyed
Crustacea of New Zealand. Colonial Museum and
Geological Survey Department. London. 1876, 136.
41. Alcock A. Diagnosis of new species and varieties of
freshwater crabs. Nos. 1–4. Records of the Indian
Museum 1909; 3:243-252.
42. Klaus S, Schubartb CD, Brandis D. Phylogeny,
biogeography and a new taxonomy for the
Gecarcinucoidea Rathbun, 1904 (Decapoda: Brachyura).
Org Divers Evol 2006; 6:199-217.
43. Bott R. Die Sußwasserkrabben von Europa, Asien,
Australien und ihre Stammesgeschichte. Abhandlungen
der Senckenbergischen Natur forschenden Gesellschaft.
1970; 526:1-338.
44. Cumberlidge N. Travancoriana napaea is placed in the
IUCN Red List of Threatened
Species.2008;e.T134646A3992284.http://dx.doi.org/10.2
305/IUCN.UK.RLTS.T134646A3992284.en
45. Kimura M. A simple method for estimating evolutionary
rate of base substitutions through comparative studies of
nucleotide sequences. J Mol Evol 1980; 16:111-120.
46. Xia X. Data analysis in molecular biology and evolution
(DAMBE). Kluwer Academic Publishers, Boston, 2000.
47. Muse SV, Gaut BS. A likelihood approach for comparing
synonymous and non-synonymous nucleotide
substitution rates, with application to the chloroplast
genome. Mol Biol Evol 1994; 11:715-724.
48. Felsenstein J. Evolutionary trees from DNA-sequences -
a maximum-likelihood approach. J Mol Evol 1981;
17:368-376.
49. Xia X, Xie Z, Salemi M, Chen L, Wang Y. An index of
substitution saturation and its application. Mol Phylogen
Evol 2003; 26:1-7.
50. Nei M, Kumar S. Molecular Evolution and
Phylogenetics. Oxford University Press, New York,
2000.
51. Bode SNS, Lamatsch DK, Martins MJF, Schmit O,
Vandekerkhove J, Mezquita F, Namiotko T et al.
Exceptional cryptic diversity and multiple origins of
parthenogenesis in a freshwater Ostracod. Mol Phylogen
Evol 2010; 5:542-552.
52. Waugh J. DNA barcoding in animal species: progress,
potential and pitfalls. Bio Essays 2007; 29:188-197.
53. Knowlton N, Weigt LA. New dates and new rates for
divergence across the Isthmus of Panama. Proc R Soc
Lond Ser B 1998; 265:2257-2263.
54. Patarnello T, Marcato S, Zane L, Varotto V, Bargelloni
L. Phylogeography of the Chionodraco genus
(Perciformes, Channichthyidae) in the Southern Ocean.
Mol Phylogen Evol 2003; 28:420-429.
55. Silva JM, Creer S, Santos A, Costa AC, Cunha MR,
Costa FO et al Systematic and evolutionary insights
derived from mtDNA COI barcode diversity in the
Decapoda (Crustacea: Malacostraca). PLoS ONE 2011;
6(5):e19449.
56. Karanovic I. Barcoding of ancient lake Ostracods
(Crustacea) reveals cryptic speciation with extremely low
distances. PLoS ONE 2015; 10(3):e0121133.
~ 782 ~
Journal of Entomology and Zoology Studies
doi:10.1371/journal.pone.0121133.
57. Britten RJ. Rates of DNA sequence evolution differ
between taxonomic groups. Science 1986; 231:1393-
1398.
58. Wolfe KH, Li WH, Sharp PM. Rates of nucleotide
substitution vary greatly among plant mitochondrial,
chloroplast, and nuclear DNAs. Proc Nat Acad Sci USA
1987; 84:9054-9058.
59. Kumar S, Subramanian S. Mutation rates in mammalian
genomes. Proc Nat Acad Sci USA 2002; 99:803-808.
60. Drouin G, Daoud H, Xia J. Relative rates of synonymous
substitutions in the mitochondrial, chloroplast and
nuclear genomes of seed plants. Mol Phylogen Evol,
2008; 49:827-831.
61. Kimura M. Preponderance of synonymous changes as
evidence for the neutral theory of molecular evolution.
Nature 1977; 267:275-276.
62. Messier W, Stewart CB. Episodic adaptive evolution of
primate lysozymes. Nature 1977; 385:151-154.
63. Yang Z, Nielsen R. Codon-substitution models for
detecting molecular adaptation at individual sites along
specific lineages. Mol Biol Evol 2002; 19:908-917.
64. Biju SD, Bossuyt F. New frog family from India reveals
an ancient biogeographical link with the Seychelles.
Nature 2003; 425:711-714.
65. Bossuyt F, Meegaskumbura M, Beenaerts N, Gower DJ,
Pethiyagoda R, Roelants K et al. Local endemism within
the Western Ghats-Sri Lanka biodiversity hotspot.
Science 2004; 306:479-481.
66. Prasad V, Farooqui A, Tripathi SKM, Garg R, Thakur B.
Evidence of Late Paleocene-Early Eocene equatorial rain
forest refugia in southern Western Ghats, India. J Biosci
2009; 34:771-979.