Embed Size (px)
DESCRIPTION
A report from the Eurobarometer - Fieldwork: May - June 2009 | Report publication: November 2009. Special Eurobarometer 317 / Wave 71.2. – TNS Opinion & Social | This survey was requested by Directorate General Employment, Social Affairs and Equal Opportunities and coordinated by Directorate General Communication
Citation preview

Special Eurobarometer 317
Discrimination in the EU in 2009
Fieldwork May-June 2009
Report Publication November 2009
Spe
cial
Eur
obar
omet
er 3
17 /
Wav
e 71
.2. –
TN
S O
pini
on &
Soc
ial
This survey was requested by Directorate General Employment, Social Affairs and Equal Opportunities and coordinated by Directorate General Communication
This document does not represent the point of view of the European Commission.
The interpretations and opinions contained in it are solely those of the authors.
European Commission
Report


Special EUROBAROMETER 317 DISCRIMINATION IN THE EU IN 2009
- 1 -
TABLE OF CONTENTS
INTRODUCTION ............................................................................................4
1. SETTING THE CONTEXT.............................................................................8
2. THE PERCEPTION OF DISCRIMINATION IN EUROPE ...............................11
2.1 The perceived level of discrimination .......................................................11 2.2 Attitudes to diversity in public office........................................................14 2.3 Diversity in the media ...........................................................................15
3. EXPERIENCE OF DISCRIMINATION .........................................................22
3.1 Personal experience of discrimination ......................................................22 3.2 Seeing others discriminated against ........................................................25
4. COMBATTING DISCRIMINATION.............................................................30
4.1 Assessment of efforts made to fight discrimination ....................................30
5. KNOWLEDGE OF THE LAW.......................................................................34
5.1 Knowledge of one’s rights as a victim of discrimination ..............................34 5.2 Preferred reporting ‘points’ in case of harassment or discrimination .............38
6. VIEWS ABOUT EQUAL OPPORTUNITIES IN EMPLOYMENT.......................43
6.1 Factors which put citizens at a disadvantage ............................................43 6.2 Support for measures to provide equal opportunities in employment............45 6.3 Support for monitoring measures............................................................48 6.4 Perception of whether enough has been done to increase diversity in the work place........................................................................................................53
7. DISCRIMINATION ON GROUNDS OF ETHNIC ORIGIN .............................60
7.1 The perceived extent of ethnic discrimination ...........................................60 7.2 Changes in the perceptions of ethnic discrimination...................................64 7.3 Measuring discrimination on grounds of ethnic origin .................................67 7.4 Attitudes towards different ethnic groups .................................................69

Special EUROBAROMETER 317 DISCRIMINATION IN THE EU IN 2009
- 2 -
8. DISCRIMINATION ON GROUNDS OF AGE ................................................71
8.1 The perceived extent of discrimination on grounds of age...........................71 8.2 Changes in the perceptions of discrimination on grounds of age ..................73 8.3 Experience of age discrimination.............................................................75 8.4 Attitudes to citizens aged under 30 and citizens aged over 75 in the highest political office ............................................................................................76
9. DISCRIMINATION ON GROUNDS OF DISABILITY....................................78
9.1 The perceived extent of disability discrimination........................................78 9.2 Changes in the perceptions of discrimination on grounds of disability ...........81 9.3 Measuring disability discrimination ..........................................................83 9.4 Attitudes towards disabled people in public office ......................................84
10. DISCRIMINATION ON GROUNDS OF SEXUAL ORIENTATION .................85
10.1 The perceived extent of discrimination on grounds of sexual orientation .....85 10.2 Changes in the perceptions of discrimination on grounds of sexual orientation...............................................................................................................88 10.3 Measuring discrimination on grounds of sexual orientation........................90 10.4 Attitudes to LGBT people .....................................................................91
11. DISCRIMINATION ON GROUNDS OF GENDER........................................92
11.1 The perceived extent of discrimination on grounds of gender ....................92 11.2 Changes in the perceptions of discrimination on grounds of gender ............95 11.3 Experience of discrimination on grounds of gender ..................................97 11.4 Attitudes to women in the highest political office .....................................98
12. DISCRIMINATION ON GROUNDS OF RELIGION OR BELIEF ...................99
12.1 The perceived extent of discrimination on grounds of religion or belief........99 12.2 Changes in the perceptions of discrimination on grounds of religion or belief............................................................................................................. 102 12.3 Experience of discrimination on grounds of religion or belief.................... 105 12.4 Attitudes to citizens of a different religion or belief in public office............ 106

Special EUROBAROMETER 317 DISCRIMINATION IN THE EU IN 2009
- 3 -
13. THE IMPACT OF THE ECONOMIC AND FINANCIAL CRISIS ...................107
13.1 The perceived impact of the crisis on the importance and funding of equality and diversity policies ................................................................................ 107 13.2 The perceived impact of the crisis on levels of discrimination in the labour market ................................................................................................... 109
CONCLUSION ............................................................................................117 ANNEXES Technical specifications Questionnaire Data tables


Special EUROBAROMETER 317 DISCRIMINATION IN THE EU IN 2009
- 4 -
INTRODUCTION This report presents the results from a new Eurobarometer survey on discrimination. It is the third in a series of surveys commissioned by the European Commission DG Employment, Social Affairs and Equal Opportunities. The European anti-discrimination legislation is one of the most extensive in the world. In 2000, the European Union adopted two very far-reaching laws1 to prohibit discrimination in the workplace based on racial or ethnic origin, religion or belief, disability, age or sexual orientation2. As far as racial and ethnic origin is concerned, this legislation extends to other aspects of daily life, such as education and social services. These texts come in addition to numerous laws that have been adopted at EU level since 1975 to promote equality between women and men in the workplace3. The first survey4 was conducted in the summer of 2006 in anticipation of the 2007 European Year of Equal Opportunities for All. This European Year aimed to inform citizens of their rights, to celebrate diversity and to promote equal opportunities for everyone in the European Union. This initiative led the way to a bolder strategy seeking to give momentum to the fight against discrimination in the EU5. Drawing on the successful implementation of the 2007 European Year of Equal Opportunities for All6, the Commission adopted under its renewed social agenda on 2 July 2008 a non-discrimination package comprising: a proposal for a new directive on equal treatment prohibiting discrimination on grounds of age, disability, sexual orientation and religion or belief outside the employment sphere and a communication which presents a comprehensive approach to step up action against discrimination and promote equal opportunities7. The second survey was conducted in early 2008 to track how perceptions and opinions in this field had changed in the intervening year8. The latest survey was conducted between 29 May and 15 June 2009. This time, new questions were added notably to measure the extent to which the economic crisis may hamper the implementation of anti-discrimination policies and efforts. In addition and for the first time, the survey also covered the three Candidate Countries: Croatia, the Former Yugoslav Republic of Macedonia (FYROM) and Turkey.
1Directive 2000/43/EC of 29 June 2000 and Directive 2000/78/EC of 27 November 2000. Both directives are based on Article 13 of the Amsterdam Treaty establishing the European Community which reads: "the Council, acting unanimously on a proposal from the Commission and after consulting the European Parliament, may take appropriate action to combat discrimination based on gender, racial or ethnic origin, religion or belief, disability, age or sexual orientation". Discrimination occurring in the workplace on the grounds of gender is prohibited by several other directives that have been adopted since 1975. 2Throughout the report we use the acronym LGBT to refer to Lesbian, Gay, Bisexual and Transgender people. 3For more information on the rights to non discrimination and equal opportunities, please see www.equality2007.europa.eu or www.stop-discrimination.info 4 Discrimination in the European Union: (special Eurobarometer 263). Fieldwork June-July 2006. http://ec.europa.eu/public_opinion/archives/ebs/ebs_263_en.pdf 5 More details can be found in the ‘Framework strategy for non-discrimination and equal opportunities for all’ published by the European Commission in 2005, available at http://ec.europa.eu/employment_social/fundamental_rights/pdf/pubst/poldoc/com07_en.pdf. 6 Communication from the Commission to the Council, the European Parliament, the European Economic and Social Committee and the Committee of the Regions - Implementation, results and overall assessment of the 2007 European Year of Equal Opportunities for All COM/2009/0269 final 7 Communication from the Commission to the European Parliament, the Council, the European Economic and Social Committee and the Committee of the Regions - Non-discrimination and equal opportunities: A renewed commitment {SEC(2008) 2172} /* COM/2008/0420 final. 8 Discrimination in 2008: (Special Eurobarometer 296). Fieldwork February-March 2008. http://ec.europa.eu/public_opinion/archives/ebs/ebs_296_en.pdf

Special EUROBAROMETER 317 DISCRIMINATION IN THE EU IN 2009
- 5 -
All three surveys have been carried out by TNS Opinion & Social network. The methodology used is that of Eurobarometer surveys as carried out by the Directorate General for Communication (“Research and Political Analysis” Unit)9. A technical note on the manner in which interviews were conducted by the Institutes within the TNS Opinion & Social network is appended as an annex to this report. This note indicates the interview methods and the confidence intervals10. The findings from this survey provide insight into the perceptions, attitudes, knowledge and awareness of discrimination and inequality in the European Union and the Candidate Countries in 2009. In the report the six legally prohibited grounds of discrimination in the EU are examined:
1. Gender 2. Ethnic origin 3. Religion or beliefs 4. Age 5. Disability 6. Sexual orientation
The report proceeds with the following structure:
♦ Setting the context, including whether citizens think of themselves as belonging to a minority group and the diversity of citizens’ social circles;
♦ Perceptions of discrimination covering attitudes to different groups and the perceived extent of discrimination in Europe;
♦ Measurements of discrimination in Europe, whether directly experienced by citizens or witnessed as happening to a third person;
♦ An examination of media coverage of diversity; ♦ Assessments of efforts made to combat discrimination; ♦ Knowledge of one’s rights as a potential victim of discrimination; ♦ Views on equal opportunities in employment; ♦ A detailed analysis of discrimination on individual grounds; ♦ An examination of the effect of the economic crisis on the perceived extent of
discrimination and on efforts to combat it. In analysing each of these issues, the report firstly presents overall results at the EU level, noting any significant evolutions compared to the 2008 survey. This is followed by a breakdown of results by country, before providing a detailed look at relevant variations between different segments of society. The latter analysis groups are all derived from answers to socio-demographic questions asked in the survey:
♦ Age, gender, education, urbanisation and place of birth (the typical socio-demographic questions of the Eurobarometer);
♦ Diversity of the respondent’s social circle11 (a question that is also analysed in this survey);
9 http://ec.europa.eu/public_opinion/index_en.htm 10 The result tables are included in the annex. It should be noted that the total of the percentages in the tables of this report may exceed 100% when the respondent has the possibility of giving several answers to the same question. 11 QE16 Do you have friends or acquaintances who are…?

Special EUROBAROMETER 317 DISCRIMINATION IN THE EU IN 2009
- 6 -
♦ Whether the respondent has been discriminated against or witnessed discrimination occurring (two further questions which are also analysed in this survey12).
In addition some results are strongly linked with key attitudinal positions, namely:
♦ Perceptions of how widespread discrimination is in one’s country13; ♦ Whether respondents consider being part of a minority group14.
In understanding the focus of this study, readers are reminded that the Eurobarometer is a general population survey of EU citizens aged 15 and, in some instances, of citizens in the Candidate Countries and/or EFTA countries. Whilst the Eurobarometer covers a cross-section of Europeans, this implies that only a small number of citizens belonging to the various minority groups in the EU will have been included in this study. Any analysis of the results pertaining to these specific sub-groups must therefore be treated with caution15.
The Eurobarometer website can be consulted at the following address:
http://ec.europa.eu/public_opinion/index_en.htm
We would like to take the opportunity to thank all the respondents
across the continent who have given their time to take part in this survey.
Without their active participation, this study would not have been possible.
12 QE3 In the past 12 months have you personally felt discriminated against or harassed on the basis of one or more of the following grounds? Was it discrimination on the basis of...? QE4 In the past 12 months, have you witnessed someone being discriminated against or harassed on the basis of one or more of the following grounds? Was it discrimination on basis of...? 13 QE1 For each of the following types of discrimination, could you please tell me whether, in your opinion, it is very widespread, fairly widespread, fairly rare or very rare in (OUR COUNTRY)? Discrimination on the basis of… 14 QE17 Where you live, do you consider yourself to be part of any of the following? Please tell me all that apply. 15. The EU27 sample sizes of the minority groups covered by the survey are as follows: Ethnic minority: n=1210 (5%); Religious minority: n=1092 (4%); Minority in terms of disability: n=586 (2%); Sexual minority: n=255 (1%).

Special EUROBAROMETER 317 DISCRIMINATION IN THE EU IN 2009
- 7 -
In this report, the countries are represented by their official abbreviations. The abbreviations used in this report correspond to16:
*Cyprus as a whole is one of the 27 European Union Member States. However, the “acquis communautaire” is suspended in the part of the country that is not controlled by the government of the Republic of Cyprus. For practical reasons, only the interviews conducted in the part of the country controlled by the government of the Republic of Cyprus are recorded in the category “CY” and included in the EU27 average. The interviews conducted in the part of the country not controlled by the government of the Republic of Cyprus are recorded in the category “CY (tcc)” [tcc: Turkish Cypriot Community]. ** Provisional code which does not prejudge in any way the definitive nomenclature for this country, which will be agreed following the conclusion of negotiations currently taking place at the United Nations.
16 Readers should note that the report includes graphs showing the break-down of responses to questions at the EU27 level. In these graphs, the abbreviation “DK” refers to “don’t know” responses.
ABBREVIATIONS EU27 European Union – 27 Member States BE Belgium BG Bulgaria CZ Czech Republic DK Denmark D-E East Germany DE Germany D-W West Germany EE Estonia EL Greece ES Spain FR France IE Ireland IT Italy CY Republic of Cyprus*
CY (tcc) Area not controlled by the government of the Republic of Cyprus
LT Lithuania LV Latvia LU Luxembourg HU Hungary MT Malta NL The Netherlands AT Austria PL Poland PT Portugal RO Romania SI Slovenia SK Slovakia FI Finland SE Sweden UK The United Kingdom HR Croatia TR Turkey MK The former Yugoslav Republic of Macedonia**

Special EUROBAROMETER 317 DISCRIMINATION IN THE EU IN 2009
- 8 -
1. SETTING THE CONTEXT This chapter aims at establishing the background to the topic of discrimination. We look at the extent of diversity in Europeans’ social networks and how many citizens define themselves as belonging to a minority group.
- Diversity in friends is most widespread in terms of religion, disability and ethnicity -
As noted in the earlier surveys, an important analytical distinction to be made when analysing different levels of discrimination is whether citizens count members of different groups amongst their own social circle17. This has considerable impact on attitudes to the subject. The latest survey reveals that the social circle of Europeans has become more diverse: close to two out three Europeans have friends or acquaintances who are of a different religion or have different beliefs to them (64%; +3 percentage points) and close to three out of five have friends or acquaintances who are disabled (58%; +3 percentage points) or of a different ethnic origin to them (57%; +2 percentage points). Despite slight increases since 2008, it remains comparatively rarer for citizens to have gay, lesbian, bisexual or transgender (LGBT) friends or acquaintances (38%; +4 percentage points) or to have Roma friends (17%; +3 percentage points). There is wide variation here between countries, which are in part explained by demographics. For example, close to six out of ten Macedonians say that they have friends who are Roma (59%), compared to just four percent of Cypriots who give the same answer. Clearly this is related to the respective proportions of the local populations who are Roma. However, cultural attitudes also play a factor, particularly with regard to sexual orientation. Whilst close to seven out of ten Dutch citizens say they have LGBT friends (68%), just three percent of Romanians say the same. This reflects - inter alia - varying attitudes towards homosexuality, which will be explored in greater detail below. It can be observed that citizens’ contact with others who are “different” from themselves varies depending on the citizens’ socio-demographic characteristics18. For each type of friend/acquaintance included in the survey, the main determining factors are:
♦ Having friends/acquaintances of different ethnic origin: o Naturally, more common amongst those not living in their country of birth; o Becomes less common with age; o Becomes more common the longer one stays in full-time education; o Is more common in urban areas than rural areas; o Is somewhat more common among men than it is among women; o Is somewhat more common among citizens with a political orientation that
is to the left of the spectrum.
17 QE16 Do you have friends or acquaintances who are…? 18 Full results for this question can be found in the annexes of this report

Special EUROBAROMETER 317 DISCRIMINATION IN THE EU IN 2009
- 9 -
♦ Having Roma friends/acquaintances:
o This is least likely among citizens aged 55 and over.
♦ Having LGBT friends/acquaintances: o Is much less likely amongst those aged 55 or above; o Becomes considerably more likely the longer citizens stayed in education; o Is more common among citizens with a political orientation that is to the left
of the spectrum; o Is somewhat more common in urban areas than rural areas.
♦ Having disabled friends/acquaintances: o Is considerably more common when citizens themselves have a chronic
physical or mental health problem; o The longer citizens stayed in full-time education, the more likely it is.
♦ Having friends/acquaintances of a different religion or different beliefs: o Is less likely among citizens aged 55 and over; o The longer citizens stayed in full-time education, the more likely it is; o Is more common amongst those not living in their country of birth.
- Few citizens feel they are part of a minority group –
As already noted in the previous surveys, there are very few citizens who consider themselves as part of a minority group where they live19. Overall 85% do not define themselves as being part of any minority group, whilst only a minimal proportion consider themselves as falling into any of the minority groups under discussion here20. Four percent of Europeans are unable to answer to this question.21
19 No general definition of minority was offered to the interviewees when they were asked this question. A list of the minority groups under discussion here was read out. 20 QE17 Where you live, do you consider yourself to be part of any of the following? Please tell me all that apply. (MULTIPLE ANSWERS POSSIBLE) 21 As noted in the introduction, the Eurobarometer is a general population survey. Consequently, minorities are under-represented. In reality, the proportion of the EU population that does not belong to majority ethnic/religious groups, that is LGBT or disabled is higher. For example, the percentage of disabled citizens in the total EU population has been variously estimated at between 16% and 20%, depending on the definition of disability used.

Special EUROBAROMETER 317 DISCRIMINATION IN THE EU IN 2009
- 10 -
QE17. Where you live, do you consider yourself to be part of any of the following? Please tell me all that apply. (MULTIPLE ANSWERS POSSIBLE)
- % EU27
4%
1%
1%
2%
4%
85%
5%
DK
None of the above(SPONTANEOUS)
Any other minority group(SPECIFY)
A sexual minority
A minority in terms ofdisability
A religious minority
An ethnic minority
* The abbreviation DK refers to the respondents stating “Don’t know”. It is used throughout the whole document.


Special EUROBAROMETER 317 DISCRIMINATION IN THE EU IN 2009
- 11 -
2. THE PERCEPTION OF DISCRIMINATION IN EUROPE 2.1 The perceived level of discrimination
- Discrimination on ethnic grounds is considered the most widespread - Discrimination on grounds of ethnic origin (61%) is seen to be the most widespread form of discrimination in the EU, followed by discrimination on grounds of age (58%) and disability (53%). Whilst the former has seen no significant change since 2008, we note a large shift in public opinion over the past year on the latter: Europeans now far more often perceive discrimination on grounds of age (+16 percentage points since 2008). This holds also true for disability, with an increase of +8 percentage points in perceptions that this is widespread. Whilst in 2008 the majority view was that discrimination on these two grounds was rare, more than half of Europeans now consider these two grounds for discrimination to be widespread.22
QE1 Perception of discrimination on the basis of… - % EU
32
33
37
52
41
49
43
41
53
56
53
51
61
62
58
42
53
45
47
51
40
36
39
42
…ethnic origin Rare Widespread
20092008
20092008
20092008
20092008
20092008
20092008
...disability
...sexual orientation
...religion or belief
…age
...gender
NB: “Don’t know” and “non-existent” (SPONTANEOUS) answers are not shown
22 QE1: For each of the following types of discrimination, could you please tell me whether, in your opinion, it is very widespread, fairly widespread, fairly rare or very rare in (OUR COUNTRY)? Discrimination on the basis of…

Special EUROBAROMETER 317 DISCRIMINATION IN THE EU IN 2009
- 12 -
Hence in 2009, for four of the six grounds of discrimination examined in this survey (all those on which discrimination is legally prohibited in the EU23), a higher proportion of Europeans consider discrimination to be widespread than to be rare: apart from discrimination on grounds of ethnic origin, age and disability this also applies to sexual orientation (47%)24, although discrimination on these grounds was considered more widespread in 2008 (-4 points). One possible explanation of the increased perception of discimination on the grounds of age and disability is that the 2007 “European Year of Equal Opportunities for All” has increased awareness of these two grounds among Europeans, an impact that may not yet have been registered in the 2008 survey. However, there is also evidence that the economic crisis has impacted people’s views. This argument is further developed in subsequent chapters. It is also the case that a substantial proportion of Europeans – over one third - think that discrimination on the grounds of gender and religion or belief is widespread. It can be noted at the same time, however, that both of these two grounds are perceived to be ‘rare’ by an absolute majority (both 53%). Later in the report, these results are analysed in greater detail, highlighting considerable differences in perception between countries and by socio-demographic and cultural factors as well as personal experience of discrimination. It should also be noted that citizens were also able to give the spontaneous answer that they consider a particular type of discrimination to be non-existent in their country. Although a different type of response to that of the two ‘rare’ answers (fairly rare and very rare), a ‘non-existent’ answer should be seen as a highly positive response. The proportions of EU citizens giving such answers are four percent for discrimination on religious grounds, three percent for discrimination on ethnicity, gender and sexual orientation grounds and two percent on age and disability grounds.
- Discrimination overall is perceived as less common now than five years ago -
When asked to make a comparison with the situation five years ago, citizens are more likely to say that discrimination on all six grounds has become less widespread.25 This is particularly true for discrimination on the basis of gender where around two-thirds (65%) consider that this has become less widespread. Furthermore, six out of ten citizens think that discrimination regarding sexual orientation and disability has become less widespread and around half hold this view with regard to discrimination on the basis of religion and belief (56%), ethnic origin (48%) and age (47%). However, there still exist sizable proportions who express contrary views. Comparing results with those of 2008, the same shift in views concerning discrimination on the basis of age and disability is found. For both age and disability, there are notable increases in the share of ‘more widespread’ answers (+9 and +5 percentage points respectively).
23 The EU Member States are free to adopt stricter anti-discrimination legislation, for example prohibiting discrimination based on additional grounds, and many have done so. 24 QE1 For each of the following types of discrimination, could you please tell me whether, in your opinion, it is very widespread, fairly widespread, fairly rare or very rare in (OUR COUNTRY)? 25 QE2 If you compare the situation with 5 years ago, would you say that the following types of discrimination are more common or less common in (OUR COUNTRY)? Discrimination on the basis of…

Special EUROBAROMETER 317 DISCRIMINATION IN THE EU IN 2009
- 13 -
At the same time, further improvements concerning discrimination on the basis of ethnic origin and religion or belief are noted. For these two grounds, the share of ‘less widespread’ answer has steadily increased since 2008.
QE2. If you compare the situation with 5 years ago, would you say that the following types of discrimination are more common or less
common in (OUR COUNTRY)? Discrimination on the basis of… -% EU
47
57
48
44
56
52
60
67
60
61
65
67
42
33
41
48
32
38
29
24
28
29
24
24
Less widespread More widespread
…age
…ethnic origin
…religion or belief
…disability
…gender
…sexual orientation
20092008
200920082009200820092008
20092008
20092008
20092008
20092008
NB: “Don’t know” answers are not shown

Special EUROBAROMETER 317 DISCRIMINATION IN THE EU IN 2009
- 14 -
2.2 Attitudes to diversity in public office In order to further uncover citizens’ attitudes to different groups, a question that was introduced for the first time in 2008 has been asked again this year26. The question requires the respondent to say how comfortable they would be having someone from a specific group assigned to their country’s highest political office, using a scale from 1 to 10 where 10 represents being ‘totally comfortable’27.
- Acceptance of diversity in the public sphere varies - Europeans make strong distinctions depending on the group in question. They have relatively few qualms with the highest political office being occupied by a woman (8.5) or a disabled person (7.4). There is more reluctance when it comes to homosexuality, religion (6.5 each) or having a different ethnic origin than the rest of the population (6.2). Age is also an issue, especially if the person were over 75 (4.8), but also if they were under 30 (5.9).
QE6. And using a scale from 1 to 10, please tell me how you would feel about having someone from each of the following categories
in the highest elected political position in (OUR COUNTRY)? - % EU27
4,8
5,9
6,2
6,5
6,5
7,4
8,5
A person aged over 75
A person aged under 30
A person from a different ethnic origin thanthe majority of the population
A homosexual (gay man or lesbian woman)
A person from a different religion than themajority of the population
A disabled person
A woman
Average score out of 10
26 QE6 And using a scale from 1 to 10, please tell me how you would feel about having someone from each of the following categories in the highest elected political position in (OUR COUNTRY)? On this scale, '1' means that you would be "very uncomfortable" and '10' means that you would be "totally comfortable" with this situation. 27 The responses are considerably more negative than those given in 2008. It appears that this is due to a context effect: in 2008, citizens were first asked how they feel about having citizens from different minority groups as a neighbour. However, in the 2009 survey this question has not been asked. For 2008 results, please see Special Eurobarometer 296: http://ec.europa.eu/public_opinion/archives/ebs/ebs_296_en.pdf

Special EUROBAROMETER 317 DISCRIMINATION IN THE EU IN 2009
- 15 -
Again, these overall figures mask variations according to socio-demographic groupings and between countries, which are treated further down in the report (see chapters 7 to 12). 2.3 Diversity in the media
- A significant share of Europeans feels that diversity is not sufficiently reflected in the media -
In wave 71.2 a new question was added to ascertain to what extent Europeans see diversity reflected in the media. Again, the various grounds for discrimination were measured. Across all grounds for discrimination, a significant share of Europeans is of the view that diversity is not sufficiently reflected in the media.28 As illustrated in the below graph, this perception is particularly widespread for ‘disability’, with 44% of Europeans feeling that diversity on this aspect is not sufficiently reflected in the media. Around a third of Europeans also holds this view when it comes to ‘ethnic origin’ (36%), ‘religion or belief’ (35%), ‘age’ (33%) and ‘sexual orientation’ (31%). In terms of ‘gender’, around a quarter of Europeans feel that diversity is not sufficiently reflected in the media (26%).29
QE11. Do you think that diversity is sufficiently reflected in the media, in terms of…?
36%
35%
33%
31%
26%
55%
52%
66%
13%
44%
56%
59%
48% 8%
9%
13%
8%
8%
Disability
Ethnic origin
Religion or belief
Age
Sexual orientation
Gender
No Yes DK
28 QE11: Do you think that diversity is sufficiently reflected in the media, in terms of …… 29 ‘The total ‘No’ answers are reported, which combine ‘No definitely not’ and ‘No, not really.

Special EUROBAROMETER 317 DISCRIMINATION IN THE EU IN 2009
- 16 -
Looking at the national level, the following pattern emerges: For the aspect of ‘disability’, the highest proportion of ‘Total No’ responses can be seen in France, with 65% of citizens feeling that diversity is not sufficiently reflected in the media in this respect. Other countries where at least half of the respondents share this view are Sweden (58%), Greece, Hungary (each 53%), Spain (51%) and Belgium (50%).

Special EUROBAROMETER 317 DISCRIMINATION IN THE EU IN 2009
- 17 -
Regarding ‘ethnic origin’, the survey shows that one respondent in two in Spain feels that it is not sufficiently reflected in the media (50%), with this view next most pronounced in Italy (47%) and Greece (46%).

Special EUROBAROMETER 317 DISCRIMINATION IN THE EU IN 2009
- 18 -
In terms of ‘religion or belief’, the survey shows that over half of the respondents in Greece feel that it is not sufficiently reflected in the media (57%). As such, the Greeks voice a significantly higher level of criticism than other Europeans with the next highest level of ‘Total No’ responses recorded in the Czech Republic (45%).

Special EUROBAROMETER 317 DISCRIMINATION IN THE EU IN 2009
- 19 -
The response pattern for ‘age’ sees Greece again as the country where responses on diversity in the media are least positive, with a total of 58% saying that this kind of diversity is not sufficiently reflected. Turkey (50%) and Austria (48%) follow.

Special EUROBAROMETER 317 DISCRIMINATION IN THE EU IN 2009
- 20 -
Greece also records the highest ‘Total No’ responses in terms of ‘sexual orientation’, (51%), although similar observations are recorded in Turkey (49%).

Special EUROBAROMETER 317 DISCRIMINATION IN THE EU IN 2009
- 21 -
Finally, the survey shows that particularly in Greece, a large share of people feel that diversity in terms of gender is not sufficiently reflected in the media (55%). The next highest proportion of ‘Total No’ responses is recorded in Turkey (44%).


Special EUROBAROMETER 317 DISCRIMINATION IN THE EU IN 2009
- 22 -
3. EXPERIENCE OF DISCRIMINATION Thus far we have seen evidence of the perceived extent of discrimination in Europe. Overall, the proportions answering that discrimination is widespread are substantial. For four of the six grounds, it is still more likely to be seen as widespread rather than rare, even with the evident positive development that Europeans believe it to be on the decrease rather than on the rise. In this chapter we analyse discrimination, either as directly experienced by the respondent or when witnessed as a third party. 3.1 Personal experience of discrimination
- 16% of Europeans say they were discriminated against in the last year - In the course of the 12 months leading up to the survey, 16% of citizens report that they personally felt discriminated against or harassed for at least one of the grounds under consideration here: gender, disability, ethnic origin, age30, sexual orientation, religion or belief.31 83% of Europeans say that they have not felt discriminated against in the year prior to this survey and one percent lacks an opinion. As in 2008, age is the most common ground of self-reported discrimination, with six percent experiencing this over the course of the year. This is followed by discrimination on the grounds of gender and ethnic origin, which three precent report having experienced32.
2%
3%
1%
2%
2%
2%
3%
6%
15%
1%
3%
1%
1%
2%
3%
3%
6%
16%
DK
For another reason
Sexual orientation
Religion or belief
Disability
Ethnic origin
Gender
Age
Yes
2008 2009
QE3. In the past 12 months have you personally felt discriminated against or harassed on the basis of one or more of of the following grounds? Please tell me all that
apply.(MULTIPLE ANSWERS POSSIBLE)- % EU
30 Note: it was intentionally not specified in the questionnaire whether this was on the grounds of age or youth, so as to allow the respondent to interpret ‘age discrimination’ as they see it. 31 QE3 In the past 12 months have you personally felt discriminated against or harassed on the basis of one or more of the following grounds? Please tell me all that apply. (MULTIPLE ANSWERS POSSIBLE) 32 A further 3% indicate that they have been discriminated on a different ground than any of the six ‘official’ grounds.

Special EUROBAROMETER 317 DISCRIMINATION IN THE EU IN 2009
- 23 -
In terms of national results, the variations are rather moderate. The highest rate of self-reported discrimination is seen in the Former Yugoslav Republic of Macedonia (25%), with discrimination on the ground of ethnic origin and age accounting for a large share of this (8% each). In fact, self-reported discrimination on the ground of ethnic origin is highest among Macedonians. After the Macedonians, Austrians and Italians have the highest self-reported discrimination (22% each). In Austria, age discrimination represents the largest share of this (7%) while in Italy gender is most commonly reported (7%). Single-digit self-reporting levels are noted only in Greece (6%), Malta (7%) and Romania (9%).

Special EUROBAROMETER 317 DISCRIMINATION IN THE EU IN 2009
- 24 -
- There is a clear link between experiencing discrimination and feeling part of a minority -
The data point to a strong relationship between citizens defining themselves as part of a minority group and the experience of discrimination, with this particularly notable in the case of discrimination on the grounds of disability, ethnicity and sexual orientation. This suggests either that self-perceived minorities are more likely to experience discrimination or that the experience of discrimination or harassment is a significant factor in citizens perceiving themselves to be a ‘minority’ in these term. The graph below illustrates this link. For example, a quarter of those Europeans who say that they belong to a minority group in terms of their ethnic origin also say that they have felt discriminated against on these grounds in the last 12 months. In contrast, the reported rate of experienced ethnic discrimination stands at only three percent when we consider all Europeans and not just those who define themselves as belonging to a minority group.
12%
12%
23%
31%
11%
23%
25%
33%
Religion or belief
Sexual orientation
Ethnic origin
Disability
2008 2009
QE3 / QE17 In the past 12 months, have you personally felt disciminated against or harassed on the basis of one or more of the following grounds?
- % EU27% of those self-defining as minority who experience discrimination on relevant grounds
Bases: All self-defining as a minority for grounds under consideration (Disability n=586; Ethnic origin n=1210; Sexual orientation n=255; Religion or belief n=1092). Caution: small bases. NB: For the question on self-defining as part of a minority, there were no options for ‘age’ or ‘gender’.
These findings are generally very similar to those obtained in 2008. The recorded increase among respondents who self-define themselves as belonging to a minority in terms of sexual orientation is based on very small sample sizes which do not make it possible to validate the shift since 2008. 33
33 In 2009, 255 respondents self-defined themselves as belonging to a sexual minority. In 2008, this figure was even lower (n=190).

Special EUROBAROMETER 317 DISCRIMINATION IN THE EU IN 2009
- 25 -
3.2 Seeing others discriminated against
- Around a quarter of Europeans report witnessing discrimination or harassment in the past year -
An alternative measure of the extent of discrimination is to ask whether citizens have witnessed other citizens being discriminated against or harassed. Around a quarter (26%) say they have seen this happening in the 12 months leading up to their interview34. It is quite logical that this figure is higher than that for self-reported discrimination, for a number of reasons: ● There may be more than one witness to an incident of discrimination (i.e. it would be ‘double-reported’). ● A given respondent may also witness more than one incident of discrimination over the course of a year and thus be ‘double counted’ in this way. ● Perceptual factors: if a respondent is to some extent sensitive to the idea of discrimination they are more likely to perceive an incident as being one of discrimination.
2%
5%
6%
6%
7%
7%
14%
29%
2%
3%
5%
5%
6%
6%
8%
12%
26%
1%DK
For another reason
Gender
Religion or belief
Sexual orientation
Disability
Age
Ethnic origin
Yes
2008 2009
QE4. In the past 12 months, have you witnessed someone being discriminated against or harassed on the basis of one or more of the following grounds? Please tell me all that
apply.- % EU27
34 QE4 In the past 12 months, have you witnessed someone being discriminated against or harassed on the basis of one or more of the following grounds? Please tell me all that apply.

Special EUROBAROMETER 317 DISCRIMINATION IN THE EU IN 2009
- 26 -
We also notice that, when we examine specific grounds for discrimination, the order of results differs between self-reported and third party-witnessed discrimination. Considering the latter, ethnic origin is the most common with 12% saying they have witnessed discrimination on these grounds, whilst age is the second most common with eight percent saying they have witnessed this. This order represents a reversal of the top two items seen for the question on self-reported discrimination.
Again, the results are broadly similar to those obtained in 2008 when 14% of Europeans had witnessed ethnic discrimination and seven percent had witnessed age discrimination.
QE3/QE4 - Experience of discrimination-% EU27
3% 6% 2% 3%
12%
8%6% 6%
5% 5%3%1% 1%
3%
Ethnicorigin
Age Sexualorientation
Disability Gender Religion orbelief
For anotherreason
% personally experienced % witnessed

Special EUROBAROMETER 317 DISCRIMINATION IN THE EU IN 2009
- 27 -
- Wide variation in results from one country to the next - Looking at the national results, we see that over a third of Swedes (42%), Austrians (38%) and Danes (36%) say that they witnessed discrimination over the period in question. In all three countries, the large overall figure is in particular a result of high rates of claims to have witnessed discrimination on ethnic grounds (23% in Denmark, 20% in Sweden and 16% in Austria). Third-party reported discrimination, on any grounds, is lowest in Malta (12%).

Special EUROBAROMETER 317 DISCRIMINATION IN THE EU IN 2009
- 28 -
- Several factors influence how likely someone is to say that they have seen discrimination or harassment -
We can distinguish between four layers that influence results for these questions:
1. General factors that make a respondent more likely to witness discrimination, 2. Belonging to a minority (self-defined membership), 3. Personal experience of discrimination and 4. The effect of social contact with citizens from minority groups.
Concerning general factors, the following are likely to increase a respondent’s chances of claiming to have witnessed discrimination: ● Being younger rather than older: 35% of those aged 15-24 report witnessing discrimination or harassment, compared to 19% of those aged 55+. ● Staying in full-time education for longer: 32% of citizens staying in education until the age of 20 or above have witnessed discrimination compared to 18% of those finishing at the age of 15 or earlier. ● Living in an urban area (30%) rather than a rural village (23%). It should be noted that all these groups are more likely to have diverse social circles (see chapter 1) and this is a key factor in making citizens more likely to report having witnessed discrimination (see below). All these groups are also more likely to have higher levels of media access, thereby making them more ‘sensitive’ to discrimination issues. Citizens who belong to a particular minority (self-defined) are much more likely to witness discrimination on the grounds of that minority classification. In other words, 33% of citizens who define themselves as belonging to an ethnic minority witnessed discrimination on the grounds of ethnic origin; 26% who belong to a sexual minority witnessed discrimination on the grounds of sexual orientation; 23% of disabled citizens witnessed discrimination on the grounds of disability. There is a very strong relationship between having experienced discrimination oneself and witnessing it happening to others: 17% of those who were not discriminated against themselves in the period in question report having seen it happening elsewhere, compared to 69% of citizens who were discriminated against on one ground and 77% of those discriminated against on multiple grounds (these being citizens who report experiencing discrimination on multiple grounds in the 12 months before the survey)35.
35 Caution: note small base size here (812 respondents report being discriminated against on multiple grounds)

Special EUROBAROMETER 317 DISCRIMINATION IN THE EU IN 2009
- 29 -
Having a social network characterised by diversity clearly has an effect in making a respondent more likely to witness discrimination on the relevant grounds, particularly when it concerns racial discrimination.
QE16. BY HAVING FRIENDS WHO ARE…
QE4 In the past 12 months, have you witnessed someone being discriminated against or harassed on the basis of one or more of the following grounds?
Total % Yes
Different ethnic origin
Roma Disabled LGBT
Ethnic origin 12% 17% 19%
Disability 6% 8%
Sexual orientation 6% 10%
There is also a strong link between having witnessed discrimination happening (or indeed being discriminated against) and the belief that discrimination is widespread. We explore this in more detail in the chapters below on specific forms of discrimination.

Special EUROBAROMETER 317 DISCRIMINATION IN THE EU IN 2009
- 30 -
4. COMBATTING DISCRIMINATION 4.1 Assessment of efforts made to fight discrimination
- Opinion of national efforts made to combat discrimination is divided between those who think these are sufficient and those who do not -
Taking aggregate results at EU level, we can see that opinion is divided as to whether sufficient efforts are being made in citizens’ countries to fight all forms of discrimination: Whilst a slight majority of 49% think that this is the case, 44% express the opposite view. Seven percent give a ‘don’t know’ answer indicating that awareness is high for this topic36. Opinion tends to be more qualified than absolute, with answers for ‘yes’, to some extent’ (38%) and ‘no, not really’ (33%) outnumbering those for ‘yes, definitely’ and ‘no, definitely not’ (11% each).
A positive development has now been recorded for the second successive time since the survey was first carried out in 2006. Over the past year, positive answers have increased by 2 percentage points whilst negative answers have decreased by 4 percentage points.
36 QE9 In general, would you say that enough effort is made in (OUR COUNTRY) to fight all forms of discrimination?

Special EUROBAROMETER 317 DISCRIMINATION IN THE EU IN 2009
- 31 -
As in 2008, the highest proportions who think that enough effort is being made are found in Finland (68%), followed by Cyprus (65%), the Netherlands (63%) and Luxembourg (62%). At the other end of the scale, 28% of Latvians and 31% of Swedes feel current efforts are sufficient. The relationship between evaluations of the efforts being made to combat discrimination and perceptions of it being widespread or not is present in some countries but not in others (see chapters 6-12). As just one example, Sweden and Latvia are both countries where a low proportion of citizens think that current efforts suffice, but in Latvia discrimination is generally seen as very rare whilst in Sweden it is seen as much more widespread.

Special EUROBAROMETER 317 DISCRIMINATION IN THE EU IN 2009
- 32 -
Considering the evolutions at national level, we see that citizens in Greece are now much more critical than was the case in 2008 (-11 points). A significantly more critical stance concerning the national efforts made to fight all forms of discrimination is also noted in Malta (-9), Romania and Austria (both -8). Conversely, in a number of countries, higher levels of satisfaction are reported.
QE9: Assessment of efforts: Notable changes 2008 – 2009
Note: Figures shown = % ‘yes’
2008 2009
Change
(% points)
Belgium 54% 60% +6
Slovakia 47% 53% +6
Poland 30% 36% +6
Germany 53% 58% +5
Ireland 45% 50% +5
France 38% 43% +5
Italy 39% 43% +4
Estonia 46% 42% -4
Bulgaria 39% 34% -5
Hungary 41% 36% -5
Austria 57% 49% -8
Romania 51% 43% -8
Malta 52% 43% -9
Greece 51% 40% -11
-Evaluations differ depending on minority membership-
The survey reveals that citizens who belong to a sexual minority are particularly likely to feel that not enough effort is being made in their country to fight all forms of discrimination (58%). This sentiment is even more widely voiced by citizens who say they belong to a minority group not specified by the interviewer (62%). Conversely, half of citizens who say they belong to an ethnic minority feel that enough effort is being made in their country. They do not differ as such from citizens who do not belong to a minority group.
QE17. CITIZENS WHO SELF-DEFINE AS BELONGING TO … QE9. In general, would you say that enough effort is made in (OUR COUNTRY) to fight all forms of discrimination?
Total % Ethnic
minority Religious minority
Sexual minority
Minority in terms
of disability
Other None
Yes 49% 50% 45% 40% 44% 30% 50%
No 44% 45% 50% 58% 53% 62% 44%

Special EUROBAROMETER 317 DISCRIMINATION IN THE EU IN 2009
- 33 -
- Those that think discrimination is widespread are more likely to feel that current efforts to fight it are insufficient - It is important to note that evaluations of measures being taken at national level are very much related to views on the pervasiveness of discrimination in society. Citizens who perceive discrimination to be widespread are more likely to feel efforts are insufficient.
QE1. CITIZENS PERCEIVING DISCRIMINATION IN (OUR COUNTRY) TO BE WIDESPREAD
QE9. In general, would you say that enough effort is made in (OUR COUNTRY) to fight all forms of discrimination?
Total % Ethnic
origin Gender
Sexual orientation
Age Religion or belief
Disability
Yes 49% 44% 41% 41% 45% 42% 41%
No 44% 52% 55% 55% 50% 54% 54%
Similarly, experience of discrimination – whether it has happened to the respondent personally or whether they claim to have witnessed it happening to someone else – is also an important influence on opinions of the sufficiency of efforts made to fight discrimination. Those who have witnessed discrimination are more likely to think these efforts sufficient.
QE3. EXPERIENCED DISCRIMINATION IN LAST 12 MONTHS
QE4. WITNESSED DISCRIMINATION IN LAST
12 MONTHS
QE9. In general, would you say that enough effort is made in (OUR COUNTRY) to fight all forms of discrimination?
Total %
No Single Ground
Multiple Grounds*
Yes No
Yes 49% 51% 41% 32% 53% 39%
No 44% 43% 54% 65% 40% 58%
*Note: Results for multiple grounds should be considered as indicative due to the small base (n=812), i.e. only 3% of Europeans have experienced multiple discrimination in the last 12 months.
In terms of general socio-demographic factors, citizens are more likely to say that enough effort is made in their country if they are: ● Male: 51% of men think current efforts suffice, compared to 47% of women. ● Aged 55 and over: 52% of those aged 55 and over say enough effort is made compared to 44% of those aged 15 to 24.

Special EUROBAROMETER 317 DISCRIMINATION IN THE EU IN 2009
- 34 -
5. KNOWLEDGE OF THE LAW In this brief chapter we examine the extent to which citizens are aware of their rights in cases of discrimination and harassment. We also test a newly added question to ascertain which reporting points citizens prefer in the event that they have been a victim of harassment or discrimination. 5.1 Knowledge of one’s rights as a victim of discrimination
- The majority of Europeans still do not know their rights related to discrimination or harassment -
As in 2008, only one-third of EU citizens say that they know their rights, should they be a victim of discrimination or harassment (33%). Over half (52%) give the opposite answer, with the remainder saying that ‘it depends’ (12%). As the graph below shows, views in this regard have not changed much since 200837.
QE10. Do you know your rights if you are the victim of discrimination or harassment?
-% EU27
11%
53%
33%
12%
52%
33%
3%
3%DK
That depends(SPONT.)
No
Yes
2008 2009
Although the direction of results in most countries is close to the overall EU average, there are nonetheless some countries where more citizens say they would know their rights rather than they would not: Finland (63% would know vs. 27% would not), the UK (49% vs. 44%), Sweden (47% vs. 43%), Malta (45% vs. 41%) and Slovenia (41% vs. 38%).
37 QE10 Do you know your rights if you are the victim of discrimination or harassment?

Special EUROBAROMETER 317 DISCRIMINATION IN THE EU IN 2009
- 35 -
In the Former Yugoslav Republic of Macedonia, there is a nearly even split (45% vs. 44%). The lowest proportions knowing their rights are recorded in Austria (16%). It can be noted in this context that in Austria the proportion of citizens saying they have suffered discriminated in the past year (22%) is above the EU average of 16%.

Special EUROBAROMETER 317 DISCRIMINATION IN THE EU IN 2009
- 36 -
Although the EU average has remained stable over the last year, there are a number of countries that have seen substantial fluctuations in knowledge of rights since the last survey.
Knowledge of rights: Notable changes 2008 – 2009
Note: Figures shown = % ‘yes’
2008 2009
Change
(% points)
UK 41% 49% +8
France 31% 38% +7
Sweden 41% 47% +6
Ireland 30% 36% +6
Spain 32% 36% +4
Bulgaria 17% 21% +4
Malta 49% 45% -4
Slovakia 46% 41% -5
Italy 31% 25% -6
Czech
Republic 40% 33% -7
Hungary 39% 32% -7
Greece 35% 27% -8
Portugal 35% 24% -11
Poland 36% 24% -12
- Awareness levels not much higher among minority respondents - The survey reveals that citizens who belong to a minority only slightly more often report awareness than other citizens. The only group that stands out are citizens who say they belong to a minority group not specified by the interviewer: four out of ten feel they know their rights if they are the victim of discrimination or harassment, compared to, on average, a third of European citizens38.
QE17. CITIZENS WHO SELF-DEFINE AS BELONGING TO … QE10 Do you know your rights if you are the victim of discrimination or harassment?
Total % Ethnic
minority Religious minority
Sexual minority
Minority in terms
of disability
Other None
Yes 33% 37% 34% 35% 37% 40% 33%
No 52% 47% 49% 43% 51% 45% 53%
38 These findings need to be seen as only indicative due to the small proportion of self defined minorities interviewed.

Special EUROBAROMETER 317 DISCRIMINATION IN THE EU IN 2009
- 37 -
- Victimisation does not increase awareness - It is important here to consider whether citizens have actually experienced discrimination or not, as these citizens would most need to be aware of their rights. We can see that these citizens do have a slightly higher level of awareness – 35% of those experiencing discrimination on a single grounds and 37% of those experiencing it on multiple grounds say that they know their rights, compared to 33% of those who did not experience discrimination. However, this gap is not a large one and it could be argued that raising awareness amongst those who have already experienced discrimination or are liable to do so in future is a matter of high importance.
QE3. BY EXPERIENCE OF DISCRIMINATION LAST 12 MONTHS
QE10 Do you know your rights if you are the victim of discrimination or harassment
Total % Yes
NO SINGLE
GROUND MULTIPLE GROUNDS*
Yes 33% 33% 35% 37%
No 52% 53% 48% 45%
*All citizens who experienced discrimination on more than one grounds over the course of the last 12 months. Caution: small bases.
- Length of education an important influence on knowledge - Education is a much more telling factor of claimed knowledge, with the latter generally increasing the longer a respondent has spent in education. We see that the knowledge gap between those who stayed in full-time education the shortest and the longest is very large and in fact even larger than it was in 200839.
BY AGE OF FINISHING FULL-TIME EDUCATION QE10 Do you know your rights if you are the victim of discrimination or harassment?
Total % Yes
15- 16-19 20+ Still studying
Yes 33% 21% 33% 44% 33%
No 52% 64% 52% 42% 51%
39 Discrimination in 2008: (special Eurobarometer 296). Fieldwork February-March 2008. http://ec.europa.eu/public_opinion/archives/ebs/ebs_296_en.pdf

Special EUROBAROMETER 317 DISCRIMINATION IN THE EU IN 2009
- 38 -
5.2 Preferred reporting ‘points’ in case of harassment or discrimination
-In the event of becoming a victim of discrimination or harassment, the
majority of EU citizens prefer to report the case to the police or a lawyer - One of the newly added questions in this wave aimed at ascertaining which reporting points citizens preferred in the event that they became a victim of discrimination or harassment. From a list of possible answers that were polled, the majority of European citizens mentioned ‘the police’ or ‘lawyer’ first as a preferred reporting point. The gap between the former and the latter is considerable, with the police being mentioned by 34% of EU citizens and ‘a lawyer’ by 14%. It can be hypothesised, especially when looking at the total mentions later on, that a lawyer is the second step in a reporting process, with the police being the preferred first reporting point.40 As can be seen in the chart below, further mentions of preferred reporting points are for the ‘body for the promotion of equal treatment in one’s country’ and a ‘trade union’ (13% of Europeans mention these respectively as a first mention). All other reporting points receive equal or less than five percent of mentions. Just over one European in ten spontaneously mentioned ‘don’t know’ (12%).
QE15a In case you are the victim of discrimination or harassment, to whom would you prefer to report your case? Firstly?
-%EU
12%
5%
4%
5%
13%
13%
14%
34%
DK
Other (SPONTANEOUS)
NGO's - associations
Tribunals
Trade Unions
Body for the promotion ofequal treatment
Lawyer
Police
40 QE15a In case you are the victim of discrimination or harassment, to whom would you prefer to report your case? Firstly?

Special EUROBAROMETER 317 DISCRIMINATION IN THE EU IN 2009
- 39 -
Citizens were given the opportunity to provide second and third mentions as well. The aggregated analysis of total mentions sees the above results repeated, with ‘lawyer’ now being mentioned by 51% of Europeans after ‘police’ at 55%:
QE15T In case you are the victim of discrimination or harassment, to whom would you prefer to report your case? Total mentions
-%EU
11%
8%
18%
27%
35%
35%
51%
55%
DK
Other (SPONTANEOUS)
NGO's - associations
Trade Unions
Tribunals
Body for the promotion ofequal treatment
Lawyer
Police
Looking at the national level for total mentions, wee see the following results:

Sp
eci
al
EU
RO
BA
RO
METER
31
7
DIS
CR
IMIN
ATIO
N I
N T
HE E
U I
N 2
00
9
-
40 -
Police
Law
yer
Tri
bu
nals
Bo
dy f
or
the p
rom
oti
on
of
eq
ual tr
eatm
en
t (S
PE
CIF
Y T
HE
NA
ME
A
CC
OR
DIN
G T
HE
CO
UN
TR
Y)
Tra
de U
nio
ns
NG
O's
-
ass
oci
ati
on
sO
ther
(SP
ON
TA
NE
OU
S)
DK
EU
27
55%
51%
35%
35%
27%
18%
8%
11%
BE
64
%50%
34%
51%
41%
17%
10%
5%
BG
52
%41%
47%
47%
16%
23%
5%
15%
CZ
66
%55%
43%
38%
22%
21%
4%
11%
DK
64%
57%
24%
29%
65
%15%
11%
4%
DE
47%
65
%29%
44%
24%
17%
9%
12%
EE
52
%27%
32%
32%
17%
12%
11%
20%
IE43%
38%
11%
40%
45
%14%
14%
19%
EL
64%
71
%44%
50%
18%
22%
3%
3%
ES
58
%52%
46%
18%
27%
20%
8%
11%
FR5
8%
50%
38%
33%
33%
25%
6%
5%
IT6
5%
60%
35%
25%
26%
21%
4%
8%
CY
53%
61
%38%
42%
28%
10%
9%
4%
LV4
6%
28%
38%
33%
19%
12%
14%
18%
LT4
8%
45%
48
%45%
13%
6%
9%
16%
LU7
1%
59%
36%
26%
38%
13%
12%
4%
HU
59
%37%
44%
37%
13%
9%
6%
18%
MT
62
%56%
18%
21%
36%
16%
7%
10%
NL
65
%35%
16%
53%
31%
11%
15%
10%
AT
44%
53
%35%
36%
36%
20%
7%
15%
PL5
0%
42%
44%
29%
19%
27%
4%
21%
PT4
4%
28%
39%
31%
15%
26%
4%
28%
RO
61
%47%
53%
34%
13%
10%
4%
14%
SI
58%
59
%23%
39%
20%
28%
17%
8%
SK
71
%54%
40%
42%
24%
11%
9%
8%
FI5
5%
43%
27%
25%
50%
20%
13%
7%
SE
46%
39%
11%
74
%56%
17%
14%
5%
UK
48
%45%
28%
32%
32%
7%
16%
14%
HR
65%
47%
43%
33%
23%
40%
6%
8%
TR
62%
45%
59%
24%
11%
13%
9%
15%
MK
56%
42%
42%
24%
17%
27%
11%
12%
Hig
hest
perc
en
tag
e b
y c
ou
ntr
yLo
wes
t per
centa
ge
by
countr
y
QE1
5.
To w
ho
m w
ou
ld y
ou
pre
fer
to r
ep
ort
yo
ur
case
of
dis
crim
inati
on
?
Hig
hes
t per
centa
ge
by
item
Low
est
per
centa
ge
by
item

Special EUROBAROMETER 317 DISCRIMINATION IN THE EU IN 2009
- 41 -
-Diverse reporting preferences at country level - An examination of the national resuts reveals a strongly diverse pattern of preferences. For instance, the extent to which Europeans would report their case of discrimination to a lawyer ranges from 27% in Estonia to 71% in Greece. The country results are even more extreme in the case of national bodies for the promotion of equal treatment. The proportion of citizens who would prefer reporting to this body in the case of victimisation ranges from 18% in Spain to 74% in Sweden. The strong diversity of preferences reflect different attitudes and relations with official instances as well as varying degrees to which specific bodies have been set up and operationalised in the Member States.

Special EUROBAROMETER 317 DISCRIMINATION IN THE EU IN 2009
- 42 -
In terms of general socio-demographic factors, citizens in the different socio-demographic groups show the following preferences in reporting (looking at ‘total mentions’): ● For the ‘police’ (55% EU average), females are slightly more likely to express a
preference compared to men (57% vs. 53%). ● Regarding the various age groups, the youngest age group of 15-24 years show a preference for the ‘police’ (61% vs. 55% average) as well as for a ‘body for the promotion of equal treatment in one’s country’, with 38% of these mentioning this preference vs. 35% at EU average. We also see a preference in those in the older age group of 40-54 years of age for this reporting point. For the ‘police’ we see similar figures repeated with those who have ended their education at 15 years of age also showing a preference (59%) as well as those who are still studying (62%). With regards to ‘lawyer’ as a preferred reporting point (51% EU average), those somewhat older (25-39 year age group) as well as those having ended their education at 20+ years of age indicate a preference (55% and 56% respectively). ● For ‘tribunals’ (35% EU average), those in the 25-54 age group indicate a preference (38% and 37% for the 25-39 years and 40-54 years groupings) as do those still studying (37%). This is repeated when looking at the ‘body for the promotion of equal treatment’ (35% EU average) with these age groups as well as those with higher education levels or those still studying showing higher figures (44% and 41% respectively). The latter education categories also show a preference for NGOs, with 21% and 23% respectively compared to the EU average of 18%. A similar picture is seen for ‘trade unions’ (at 27% EU average) with those in the age group of 25-54 years of age indicating a preference (33% and 32% for the 25-39 years and 40-54 years groupings) as well as those with longer time spent in education (34% for those who have ended their education at 20+ years of age). ● In terms of occupation we see preferences by those self-employed for ‘lawyer’ and ‘NGOs’ with 59% and 21% compared to EU averages of 51% and 18% for these reporting points.


Special EUROBAROMETER 317 DISCRIMINATION IN THE EU IN 2009
- 43 -
6. VIEWS ABOUT EQUAL OPPORTUNITIES IN EMPLOYMENT The European Union Equality in Employment Directive implements the principle of equal treatment in employment and training irrespective of religion or belief, disability, sexual orientation and age41. The Racial Equality Directive42 provides the same protection regarding race and ethnic origin, as well as applying outside the labour market, for example to social protection and access to goods and services. This is in addition to the numerous laws adopted in the past 30 years to fight discrimination based on gender and to allow for equal treatment of women and men in the workplace. In this chapter we examine three aspects of equal opportunities in employment plus a question newly added in 2009:
1. Factors which are seen as putting someone at a disadvantage, 2. Support for measures aimed at ensuring equal opportunities, and 3. Support for the monitoring of the implementation of equal opportunities
policies. 4. Whether citizens feel that is enough is being done to increase diversity in the
workplace 6.1 Factors which put citizens at a disadvantage In order to test perceptions of equal opportunities in the workplace, citizens were asked which factors they feel may put job applicants at a disadvantage if a company had to choose between two candidates with otherwise equal skills and qualifications43.
- A job candidate’s look and age are seen as the factors most likely to put them at a disadvantage; disability and ethnic origin now feature less -
As can be seen from the chart below, it is clear that the EU public still feels that a ‘level playing field’ in employment is far from a reality, with significant proportions of citizens seeing a range of criteria as being likely to lead to disadvantage. In analysing these results, it should be borne in mind that there may be some degree of ‘under-claim’ in that some citizens may feel it is more socially acceptable to give certain answers (particularly if they are thinking about the question in terms of whether they themselves were to be hiring). Close to half of Europeans (48%) in 2009 believe that a candidate’s look, dress-sense or presentation and the candidate’s age would be a disadvantage. This is followed by skin colour or ethnic origin (38%), having a disability (37%) and the candidate’s general physical appearance (36%).
41 EC Directive 2000/78/EC of 27 November 2000 establishing a general framework for equal treatment in employment and occupation. 42 EC Directive/2000/43/EC of 29 June 2000 implementing the principle of equal treatment between persons irrespective of racial or ethnic origin. This Directive offers a more comprehensive protection than the EC Directive 2000/78/EC (see above foot note): it covers employment and occupation and also education, social protection (including social security and healthcare), social advantages and access to goods and services, including housing. 43QE5 In (OUR COUNTRY), when a company wants to hire someone and has the choice between two candidates with equal skills and qualifications, which of the following criteria may, in your opinion, put one candidate at a disadvantage?

Special EUROBAROMETER 317 DISCRIMINATION IN THE EU IN 2009
- 44 -
We see that ethnic origin and disability are less and less seen as a disadvantage. Following a drop of eight points in the percentage of citizens who feel that disability would be a disadvantage between 2006 and 2008 a further fall has now been noted (-4 from 41% to 37%). Concerning skin colour or ethnic origin, the percentage of citizens who feel that this would be a disadvantage decreased from 42% to 38% in the latest survey following a drop of 4 points between 2008 and 2009. Conversely, the percentage of citizens who feel that age would be a disadvantage has increased since 2008 (+3 points). This is in line with the fact that – compared to 2008 – citizens are now considerably more likely to say that discrimination on the basis of age is widespread in their country (see chapter 10, below).
1%
5%
9%
14%
18%
21%
22%
26%
34%
38%
41%
42%
45%
50%
4%
2%
4%
9%
13%
16%
18%
19%
22%
30%
36%
37%
38%
48%
48%
3%DK
Other (SPONTANEOUS)
None of those (SPONTANEOUS)
The candidate’s address
The candidate’s name
Whether the candidate is a smoker or not
The candidate’s sexual orientation (for example, being gayor lesbian)*
The candidate’s gender
The expression of a religious belief (for example, wearing avisible religious symbol)
The candidate’s way of speaking, his or her accent
The candidate’s general physical appearance (size,weight, face, etc.)
A disability
The candidate’s skin colour or ethnic origin
The candidate's age
The candidate’s look, dress-sense or presentation
2008 2009
QE5. In (OUR COUNTRY), when a company wants to hire someone and has the choice between two candidates with equal skills and qualifications, which
of the following criteria may, in your opinion, put one candidate at a disadvantage?- % EU
*NB: Since 2008 this item was given as ‘The candidate’s sexual orientation (for example, being gay or lesbian)’
It is important to note that whilst most of the factors examined in this question represent ‘discrimination’ if they are used as the basis for a hiring decision, this is not the case for the factor seen as most likely to lead to disadvantage – look, dress sense or presentation. For many jobs, presenting a professional appearance will be as important an aspect as skills and qualifications.

Special EUROBAROMETER 317 DISCRIMINATION IN THE EU IN 2009
- 45 -
6.2 Support for measures to provide equal opportunities in employment
- EU citizens are highly supportive of equal opportunities measures - As we have seen above, citizens consider that several factors other than skills and qualifications play a role in the selection of job applicants. Perhaps because of this, there is strong support for the implementation of specific measures aimed at providing equal opportunities in the field of employment44. This support ranges from 63% for specific measures related to sexual orientation to 81% for measures related to disability. This question was also asked in 2006 and 2008. However, in 2008, a slightly modified version was fielded to include specific examples of the types of ‘measures’ that could be implemented (special training schemes or adapted selection and recruitment processes). These were not included in the 2006 and 2009 versions. Because of this, it is best to focus on the evolution between 2006 and 2009. Over time, we have seen a slight decline in support for special measures, with the exception of ethnic origin where opinions have not evolved. However, the ranking of the grounds for special measures was identical in all three surveys.
44 QE7: Would you be in favour of or opposed to specific measures being adopted to provide equal opportunities for everyone in the field of employment? Specific measures for people depending on their…

Special EUROBAROMETER 317 DISCRIMINATION IN THE EU IN 2009
- 46 -
QE7. Measures being adopted to provide equal opportunities for everyone in the field of employment
In favour or opposed to measures depending on ...?-%EU
12
18
16
23
23
25
23
25
81
87
77
84
75
79
69
70
67
70
63
66
28
10
13
17
…disability
…age
…gender
…ethnic origin
…religion or belief
…sexual orientation
Opposed In favour
20092006
20092006
20092006
20092006
20092006
20092006

Special EUROBAROMETER 317 DISCRIMINATION IN THE EU IN 2009
- 47 -
An analysis as to whether support for specific measures is higher when people are personally affected provides interesting insight. It shows that disabled people are particularly supportive of specific measures being adopted to provide equal opportunities for everyone in the field of employment. Not only are disabled people more in favour when the measures concern them, they are also more supportive when the measures concern other minorities. For example, when the measures concern religion or belief, 72% of disabled respondents express support, compared to 66% of respondents for whom the measures are meant, namely those who say they belong to a religious minority.
QE17. CITIZENS WHO SELF-DEFINE AS BELONGING TO … QE7 In favour of specific measures being adopted to provide equal opportunities for everyone in the field of employment…depending on..
Total Ethnic
minority Religious minority
Sexual minority
Minority in terms
of disability
Other None
Disability 81% 77% 73% 70% 82% 73% 81%
Ethnic origin 69% 71% 68% 64% 73% 56% 70%
Religion or belief 67% 66% 66% 61% 72% 53% 68%
Sexual orientation 63% 59% 59% 59% 66% 48% 64%
As an overall pattern, it can be seen that the youngest age group is more favourable towards the adoption of specific measures. This is not so true for measures based on age, where the difference is that those aged 55+ are slightly less supportive.
BY AGE QE7 In favour of specific measures being adopted to provide equal opportunities for everyone in the field of employment…depending on.
Total
Age 15-24 Age 25-39 Age 40-54 Age 55+
Disability 81% 82% 80% 82% 78%
Age 77% 79% 78% 78% 75%
Gender 75% 77% 75% 75% 73%
Ethnic origin 69% 74% 69% 70% 66%
Religion or belief 67% 72% 69% 67% 64%
Sexual orientation 63% 67% 65% 65% 58%
Ultimately, however, we stress that any variations in results between different groups represent minor variations in the overall pattern, which is that of wide support amongst EU citizens for equal opportunities measures.

Special EUROBAROMETER 317 DISCRIMINATION IN THE EU IN 2009
- 48 -
6.3 Support for monitoring measures As in 2008, citizens were also asked a further question45 about equal opportunities measures in the workplace, applying more specifically to ethnic origin. This question arose from the results revealed by the 2006 Eurobarometer: discrimination on the basis of ethnic origin was perceived as the most widespread throughout the EU and, as we have already seen, in 2009 this was still the case. Citizens were asked to indicate whether they support or oppose two measures:
1. Monitoring the composition of the work-force in order to evaluate the representation of citizens from ethnic minorities.
2. Monitoring recruitment procedures to ensure that candidates from ethnic
minorities have the same chance of being selected for interview or hired as other candidates with similar skills and qualifications.
- The majority of Europeans support monitoring measures aimed at evaluating
equality in the workplace based on ethnicity -
Europeans remain favourable towards both of these proposals, although it should be noted that public opinion is less positive than in 2008. Support for monitoring recruitment procedures (67%; -4) remains more widespread than support for monitoring the composition of the work-force (52%; -5). Despite the falls recorded since 2008, these results continue to provide clear evidence of strong support for active measures to ensure and monitor equality of opportunity at work.
45 QE8. To what extent do you support or oppose the following in the workplace?

Special EUROBAROMETER 317 DISCRIMINATION IN THE EU IN 2009
- 49 -
For the first item, monitoring the composition of the work-force for representation, the most supportive publics are found in Greece (78%; +1) Cyprus (67%; -11), and Denmark (66%; -5). Conversely, in Austria, Germany, Sweden and Slovakia an outright majority rejects these measures. Support is weakest in Austria (31%; -11) and Germany (33%; -7).

Special EUROBAROMETER 317 DISCRIMINATION IN THE EU IN 2009
- 50 -

Special EUROBAROMETER 317 DISCRIMINATION IN THE EU IN 2009
- 51 -
For the second item, concerned with recruitment procedures, the country-by-country picture is more homogenous, with an absolute majority in all countries being in support. In Sweden, for instance, with 78% of citizens feeling that discrimination is widespread, there is strong support for monitoring recruitment procedures (79%; -4). The most favourable citizens of all after Sweden are found in Denmark (78%;-6), Finland (77%; -1) and the UK (77%; -1). The lowest support is noted in Malta (50%; -10) and Austria (50%; -5).

Special EUROBAROMETER 317 DISCRIMINATION IN THE EU IN 2009
- 52 -
The results point to a strong distinction between the two measures and it must be noted that there does not appear to be a relationship between support for these measures and the extent to which discrimination on the ground of ethnic origin is perceived to take place. Hence we find that for instance in Sweden – where 78% of citizens feel that discrimination is widespread – there is strong support for monitoring recruitment procedures (79%), yet a majority rejects the monitoring of the composition of the work-force (57%).
- Support is related to personal experience and age -
As for the measures examined in the preceding section, support for these monitoring measures depends on people’s personal situation and experiences. Among citizens belonging to an ethnic minority (self-defined): ● 71% (+4 compared to EU average) support monitoring recruitment procedures; ● 58% (+6) support monitoring workplace composition. Among citizens born outside Europe: ● 73% (+6 compared to EU average) support monitoring recruitment procedures; ● 59% (+7) support monitoring workplace composition. Among citizens with Roma friends: ● 72% (+5 compared to EU average) support monitoring recruitment procedures; ● 58% (+6) support monitoring workplace composition. Among citizens who have experienced multiple discrimination in the past year: ● 72% (+5 compared to EU average) support monitoring recruitment procedures; ● 54% (+2) support monitoring workplace composition. Age is also important with youngest citizens being more supportive than ‘older’ Europeans: ● 73% (+11 compared to those 55 years of age and over) support monitoring
recruitment procedures; ● 56% (+10) support monitoring workplace composition.

Special EUROBAROMETER 317 DISCRIMINATION IN THE EU IN 2009
- 53 -
6.4 Perception of whether enough has been done to increase diversity in the work place
As part of the newly added questions in this wave, citizens were asked whether they felt that enough has been done to increase diversity in the work place for the six grounds of potential discrimination.46 - The majority of citizens in the workplace are positive about the level of what
has been done to increase diversity in the workplace - As this question is specifically asked in the workplace context, more than half of European citizens (54%) spontaneously said that the question and the various grounds of discrimination about which it asked were ‘not applicable’. This percentage of Europeans includes those who are not in work: the unemployed, the retired, students, house persons or those of other status who are not in the workplace (sickness, maternity leave, etc.). For the purpose of analysis, the ‘not applicable’ responses have been excluded and the percentages have been recalculated on the base of the remaining respondents47.
QE14. Do you think that enough is being done to increase diversity in your work place
as far as… is concerned? -%EU27
55%
51%
48%
48%
46%
37%
39%
38%
10%
58% 33%
42%
39%
10%
16%
13%
8%
9%Gender
Age
Ethnic origin
Disability
Religion or belief
Sexual orientation
Total Yes Total No DK
46 QE14: Do you think that enough is being done to increase diversity in your work place as far as… is concerned? Total Yes’ combines ‘Yes definitely’ and ‘Yes, to some extent’; ‘Total No’ combines “no, definitely not’ and ‘no, not really’ from the scale. 47 The bases are: Ethnic origin (QE14.1)- n = 12389; Gender (QE14.2) – n = 12426; Sexual orientation (QE14.3) – n = 12248; Age (QE14.4) – n = 12507; Religion or belief (QE14.5) – n = 12296; Disability (QE14.6) – n = 12328.

Special EUROBAROMETER 317 DISCRIMINATION IN THE EU IN 2009
- 54 -
Amongst those in the workplace, the survey thus shows that the absolute majority feels that enough is being done to increase diversity in the workplace for all grounds for discrimination, with ‘gender’, ‘age’, and ‘ethnic origin’ showing 50% results for ‘total yes’. ‘Sexual orientation’ shows the lowest figure at 46%; this aspect also generates the highest level of ‘don’t know’ responses. Turning to the national analysis and looking at the ‘total yes’ responses, we see that the Nordic countries such as Denmark (72%) and Sweden (71%) emerge as those where the majority of citizens in the workplace state that enough has been done to increase diversity in the workplace in terms of ‘gender’ (58% EU average). Belgium follows suit at 70%. The lowest levels of ‘total yes’ responses are noted in Turkey and Romania (28% and 35% respectively).

Special EUROBAROMETER 317 DISCRIMINATION IN THE EU IN 2009
- 55 -
In terms of ‘age’ (EU average ‘total yes’ of 55%), we see the lowest levels of ‘total yes’ again occurring in Turkey with 26%, followed by Romania (33%). However, citizens in the workplace in Slovenia and Sweden, as well as Denmark, Germany and the UK are more positive with levels of 67%+.

Special EUROBAROMETER 317 DISCRIMINATION IN THE EU IN 2009
- 56 -
The picture for ‘ethnic origin’ (51% yes at EU average) is somewhat similar. Levels are highest for Slovenia and the UK, where 65% of citizens think that measures are adequate, followed closely by the Nordic countries of Denmark and Sweden at 64%. The countries with the lowest levels in this respect are Turkey and Bulgaria where less than a third feels that enough has been done (27% for Turkey and 30% for Bulgaria).

Special EUROBAROMETER 317 DISCRIMINATION IN THE EU IN 2009
- 57 -
A similar pattern emerges across the remaining three grounds for discrimination, with the UK and Slovenia showing higher levels for ‘disability’ and ‘religion or belief’ as well as ‘sexual orientation’, with Belgium also reporting high levels for the latter aspect. In terms of lower levels of approval for all three aspects, Turkey and Bulgaria consistently report similar results.

Special EUROBAROMETER 317 DISCRIMINATION IN THE EU IN 2009
- 58 -

Special EUROBAROMETER 317 DISCRIMINATION IN THE EU IN 2009
- 59 -


Special EUROBAROMETER 317 DISCRIMINATION IN THE EU IN 2009
- 60 -
7. DISCRIMINATION ON GROUNDS OF ETHNIC ORIGIN From this chapter onwards, we conduct a more detailed examination of discrimination on the six different grounds. This covers the following areas:
• The perceived extent of the type of discrimination in the respondent’s country. • How these views have changed over time. • National differences for measures of reported discrimination – both as
experienced by the citizen and witnessed as happening to someone else. • Attitudes to the particular group in question, as measured by the question on
comfort with having a member of that group elected to the highest political office of one’s country.
7.1 The perceived extent of ethnic discrimination - Ethnic discrimination continues to be seen as widespread by the majority of
Europeans- Of the six grounds of discrimination examined in the survey, discrimination on grounds of ethnic origin is seen as the most widespread: 16% of European citizens think that this is very widespread in their country, whilst 45% think that it is fairly widespread. A quarter think that it is fairly rare with a further seven percent considering that it is very rare and just three precent giving the spontaneous answer that it is non-existent in their country. Four percent say that they ‘don’t know’.48 There is a considerable degree of variation from one country to the next in opinions of the prevalence of ethnic discrimination. It is seen as widespread by at least three-quarters of Dutch (80%), French, Hungarian (both 79%), Swedish (78%), Danish and Maltese (both 77%) citizens. At the other end of the scale, fewer than 4 in 10 Lithuanians (26%), Poles (33%) and Latvians (34%) share this view. In these three countries we also find an above average proportion of citizens saying that discrimination on the grounds of ethnic origin is non-existent (10%, 9% and 11%, respectively compared to EU average of 3%). In Bulgaria and Estonia, this figure is even higher (12%). The above figures should be interpreted in context of the particular ethnic profiles of the given countries and the extent to which issues such as ethnicity, immigration and multiculturalism feature in public discourse.
48 QE1.For each of the following types of discrimination, could you please tell me whether, in your opinion, it is very widespread, fairly widespread, fairly rare or very rare in (OUR COUNTRY)? Discrimination on the basis of…

Special EUROBAROMETER 317 DISCRIMINATION IN THE EU IN 2009
- 61 -

Special EUROBAROMETER 317 DISCRIMINATION IN THE EU IN 2009
- 62 -
- National variations in perceptions of ethnic discrimination defy a simple
explanation - This wide difference between national results is a complex phenomenon that defies a simple explanation. In the first place, the perception of ethnic discrimination as widespread is not related to more citizens actually experiencing discrimination in these countries: none of the countries where at least three-quarters see ethnic discrimination as widespread have above average self-reported discrimination levels on ethnic grounds (see chapter 3). Again, an explanation for this could be that the perception of ethnic discrimination in national contexts is driven by the prominence of related issues in the national media and the visibility of ethnic minority populations. Nonetheless, in some countries there is a relationship between ethnic discrimination reported as witnessed (rather than experienced) by a citizen and the belief that discrimination is widespread, as shown in the table below.
Ethnic Discrimination
widespread %
(diff from EU)
Witnessed discrimination on ethnic grounds
% (diff from EU)
High perception of ethnic discrimination as widespread (75% or over)
Netherlands 80% (+19)
19% (+7)
France 79% (+18)
15% (+3)
Hungary 79% (+18)
11% (-1)
Sweden 78% (+17)
20% (+8)
Denmark 77% (+16)
23% (+11)
Malta 77% (+16)
6% (-6)
Low perception of ethnic discrimination as widespread (30%) or under
Lithuania 26% (-35)
4% (-8)
Poland 33% (-28)
4% (-8)
Latvia 34% (-27)
7% (-5)

Special EUROBAROMETER 317 DISCRIMINATION IN THE EU IN 2009
- 63 -
We can see that: ●The Netherlands, Sweden and Denmark are countries where higher than average proportions of citizens claim to have witnessed ethnic discrimination, and think that this is widespread in their country. ●This link is weaker in France and does not hold for Hungary and Malta. ●The reverse link (fewer witnessing ethnic discrimination, fewer believing it is widespread) is evident in Lithuania, Poland and Latvia. An alternative means of exploring different perceptions is to look at how they differ according to socio-demographic and political factors. - Having friends of a different ethnic origin makes citizens more sensitive to
discrimination on this ground - Here an important factor is having friends who are of a different ethnic origin. 67% of citizens for whom this is the case say that discrimination is widespread in their country. The figure drops to 54% for those without such friends49. We have already noted (see chapter 2) that citizens with friends who represent a certain type of minority are more likely to say they have witnessed discrimination on those particular grounds. Given that the same is also true for believing this kind of discrimination to be widespread, we can conclude that the make-up of one’s social circle is key in making the individual more ‘sensitive’ to perceiving different grounds for discrimination and to believing them to be common. Interestingly, those who consider themselves to be part of an ethnic minority are only slightly more likely than average to think that ethnic discrimination is common in their country.
QE16. FRIENDS WITH DIFFERENT ETHNIC
ORIGIN
QE17. SELF-DEFINED MINORITY
QE1.1 DISCRIMINATION ON GROUND OF ETHNIC ORIGIN
Total %
Yes No Ethnic*
Widespread 61% 67% 54% 65%
Rare 32% 29% 36% 31%
*Note: In this table, the figures for those who say that they belong to an ethnic minority should be considered as indicative due to the small base (n=1210). In other words, 5% of citizens consider themselves to be part of an ethnic minority.
49 It should be noted that having Roma friends is less of a distinguishing factor: overall, 64% of citizens with Roma friends believe discrimination is widespread, compared to 61% of citizens without Roma friends.

Special EUROBAROMETER 317 DISCRIMINATION IN THE EU IN 2009
- 64 -
Finally, we note that the belief that ethnic discrimination is more widespread is:
• more common amongst the youngest group of citizens (65%) compared to the oldest (57%).
• more frequent amongst citizens who spent the longest time in education (66%) compared to those who spent the shortest time (57%).
• more likely to be held by citizens with left-wing political views (69%) than by those with centrist or right-wing views (both 59%).
As will be shown below, these distinctions hold for most grounds for discrimination, rather than being specific to ethnicity. 7.2 Changes in the perceptions of ethnic discrimination Having examined in detail the static picture in terms of perceived ethnic discrimination, we now briefly examine the dynamic view. This can be done in two ways:
1. By looking at the evolution of opinion since 2006. 2. Through examining the question of whether ethnic discrimination is perceived to
be more or less widespread than it was five years ago.
- Perceived extent of ethnic discrimination remains widespread - Taking the first approach, we see that at the EU level the perception that ethnic discrimination is widespread is slowly decreasing (from 64% in 2006 to 62% in 2008 to 61% now) although the view that it is rare is more volatile (30% in 2006 vs. 33% in 2008 and 32% in 2009). However, if we focus on the most recent changes at national level, we find a more mixed situation with large improvements in some countries mirrored by a more negative view in others. Thus, we find that the proportion of citizens who think that ethnic discrimination is widespread has gone down most in the UK (-11) but this is mirrored by an even larger increase in Hungary (+12).

Special EUROBAROMETER 317 DISCRIMINATION IN THE EU IN 2009
- 65 -
Perception of ethnic discrimination as widespread in country: Notable changes 2008 – 2009
Note: Figures shown = % ‘very widespread’ + %’fairly widespread’
2008 2009 Change
(% points)
UK 69% 58% -11
Ireland 52% 46% -6
Greece 76% 71% -5
Italy 76% 71% -5
Poland 28% 33% +5
Czech
Republic 52% 57% +5
Bulgaria 34% 40% +6
Romania 40% 46% +6
Latvia 27% 34% +7
Slovenia 43% 50% +7
Finland 65% 72% +7
Malta 69% 77% +8
Cyprus 61% 70% +9
Hungary 67% 79% +12
Despite these variations, it should be noted that the same extremity of views noted in 2008 also exists in 2009. As in 2008, discrimination on ethnic grounds is perceived to be least widespread in Lithuania (26% vs. 23% in 2008) and most widespread in The Netherlands (80% vs. 79%). - A small majority feel that ethnic discrimination is now less widespread than
five years ago - Taking the second approach, based on a more medium-term comparison with five years ago, we see that just over four in ten citizens feel that ethnic discrimination is now more widespread (41%). Close to half of citizens feel that the opposite is the case (48%). These figures reflect more positive perceptions than the previous two surveys when close to half of respondents still perceived discrimination on the grounds of ethnic origin to be widespread (49% in 2006 and 48% in 2008).50 Despite these improvements, there are only seven countries where an absolute majority feel that ethnic discrimination has become less widespread over the past five years led by Cyprus (70%) and Croatia (65%). Conversely, there are six countries where an absolute majority believe that discrimination is now more widespread, led by Hungary (73%) and Malta (66%).
50 QE2.If you compare the situation with 5 years ago, would you say that the following types of discrimination are more common or less common in (OUR COUNTRY)? Discrimination on the basis of…

Special EUROBAROMETER 317 DISCRIMINATION IN THE EU IN 2009
- 66 -

Special EUROBAROMETER 317 DISCRIMINATION IN THE EU IN 2009
- 67 -
7.3 Measuring discrimination on grounds of ethnic origin In this survey we have used two methods to measure discrimination – whether someone has personally felt discriminated against in the last 12 months51, and whether people think they have seen someone discriminated against in the same period.52 Regarding the measure of personal experience of discrimination, we do not present the results for each country here, as on the whole these do not much exceed the overall EU average of three percent. We do note, however, that eight percent of Macedonians and six percent of Bulgarians and Turkish citizens say that they had been discriminated against on grounds of ethnicity in the 12 months leading up to the survey. This may well be linked to particular ethnic groups who live in these countries. National results for witnessing discrimination on ethnic grounds vary from the EU average (12%) more than they do for witnessing discrimination on the basis of other grounds. As was demonstrated earlier, those countries with the highest proportions of citizens who think that they have seen discrimination on the grounds of ethnicity occur (Sweden, Denmark and the Netherlands) also rank among the highest when it comes to feeling that this form of discrimination is widespread.
51 QE3. In the past 12 months have you personally felt discriminated against or harassed on the basis of one or more of the following grounds? Please tell me all that apply. 52 QE4.In the past 12 months, have you witnessed someone being discriminated against or harassed on the basis of one or more of the following grounds? Please tell me all that apply.

Special EUROBAROMETER 317 DISCRIMINATION IN THE EU IN 2009
- 68 -

Special EUROBAROMETER 317 DISCRIMINATION IN THE EU IN 2009
- 69 -
7.4 Attitudes towards different ethnic groups We end this chapter by examining attitudes to ethnic diversity as measured by the question on how ‘comfortable’ or not citizens would be with having someone of a different ethnic origin from the majority of the population in the highest elected political position in their country53. - Strong national variations in the extent to which Europeans feel comfortable
about having a different ethnic majority in their country’s highest elected political position -
For the EU as a whole, the average ‘comfortable’ score on a scale from 1 to 10 is 6.2. However, this average figure conceals wide variations at the national level: the results range from 3.5 in Cyprus to 8.0 in Sweden.
Level of comfort with person from different ethnic origin in the highest elected political position in (YOUR COUNTRY)
EU average EU average 6.2
Sweden (8.0)
France (7.3) Highest results by
country
Denmark, Poland (7.2)
Austria, The Czech Republic (4.6)
Malta (4.4)
Greece (4.2)
Lowest results by country
Cyprus (3.5)
53 QE6.3 And using a scale from 1 to 10, please tell me how you would feel about having someone from each of the following categories in the highest elected political position in (OUR COUNTRY)?... A person from a different ethnic origin than the majority of the population?

Special EUROBAROMETER 317 DISCRIMINATION IN THE EU IN 2009
- 70 -
As seen throughout the survey, the composition of a respondent’s social circle is an important factor. We see that citizens with friends or acquaintances of a different ethnic origin tend to feel more comfortable (average of 6.8 compared to 5.5 for those without such friends or neighbours)54. Linked to this, the groups that are most comfortable with having someone of a different ethnicity elected to the highest political office are also those who we have seen earlier are most likely to have a diverse social circle. On average:
• Citizens born outside Europe (7.3)55 are more comfortable than those born in the country in question (6.2)
• Citizens with the longest educations (6.8) are more comfortable than those with the shortest educations (5.6).
• The youngest citizens (6.7) are more comfortable than the oldest (5.7). • Citizens with left wing views (6.7) are more comfortable than those with right
wing views (5.8). The survey shows that the average comfort level among citizens who define themselves as belonging to an ethnic minority is – for the EU as a whole – not much higher than average (6.5 vs. 6.2)56. This result should be seen in the context of the question wording which stresses “someone from a different ethnic majority”. In other words, respondents from an ethnic minority are – as other respondents - asked how they feel about having someone from a different ethnic group than themselves in the highest political office. Finally, it is interesting to note that disabled respondents tend to feel more comfortable than those who say they belong to an ethnic minority about having a person from a different ethnic origin elected to the highest national political position (6.8 vs. 6.5).
54 Contrary to what we noted earlier, citizens with Roma friends or neighbours feel even more comfortable (7.0) than those with friends or neighbours from ‘ethnic minorities’. 55 Due to the small number of citizens who were born outside Europe (n=574) these results can only be regarded as indicative. 56 Due to small bases (n=1210 for self-defined ethnic minority), we cannot examine the extent to which comfort levels among ethnic minorities would differ between countries.


Special EUROBAROMETER 317 DISCRIMINATION IN THE EU IN 2009
- 71 -
8. DISCRIMINATION ON GROUNDS OF AGE 8.1 The perceived extent of discrimination on grounds of age
- Public opinion has shifted considerably since 2008: the majority of Europeans now perceive discrimination on grounds of age to be widespread -
As noted in chapter 1, opinions about the extent of discrimination on grounds of age have turned around in the course of a single year. If in 2008 an outright majority of Europeans perceived discrimination on this ground to be rare (52%), the balance has shifted in 2009 with 58% now perceiving it to be widespread (16% very widespread, 42% fairly widespread) compared to 37% who believe it is rare (10% very rare, 27% fairly rare). Two percent think that discrimination on grounds of age is non-existent in their country and a further three percent say that they ‘don’t know’. 57 It it important to remember that when citizens were asked to estimate the extent of age discrimination, they were not asked to differentiate between whether it is on the grounds of old age or youth. Thus citizens will have had different ideas in mind when thinking about this question. Regardless of the above distinction, the majority view in all but six countries58 is that age discrimination is widespread. In fact, in 22 of the 30 countries surveyed this opinion is held by an absolute majority. Hungarian citizens top the list, with 79% saying that age discrimination is widespread in their country, followed by citizens in the Czech Republic (74%), France (68%), Latvia (67%) and The Netherlands (66%).
57 QE1.For each of the following types of discrimination, could you please tell me whether, in your opinion, it is very widespread, fairly widespread, fairly rare or very rare in (OUR COUNTRY)? Discrimination on the basis of… 58 The six countries are Turkey, Ireland, Luxembourg, Denmark, Malta and Germany.

Special EUROBAROMETER 317 DISCRIMINATION IN THE EU IN 2009
- 72 -

Special EUROBAROMETER 317 DISCRIMINATION IN THE EU IN 2009
- 73 -
- Older citizens are more likely to say age discrimination is widespread - As already noted we cannot be sure whether a respondent associates ‘age discrimination’ with a specific age group. The only thing we can say on the basis of the survey is that citizens aged 40 or over are more likely to say that discrimination on ground of age is widespread. This is in direct contrast to the other grounds, which are more likely to seen as widespread by the youngest group of citizens.
BY AGE QE1.4 DISCRIMINATION ON GROUNDS OF AGE
Total %
15-24 25-39 40-54 55+
Widespread 58% 49% 56% 60% 60%
Rare 37% 45% 40% 36% 33%
Other distinctions are more along typical lines seen for other grounds for discrimination:
• Women (60%) are more likely to see age discrimination as widespread than men (55%) are;
• Left-wing citizens (63%) think it is more common than do those with centrist (54%) or right-wing views (57%).
8.2 Changes in the perceptions of discrimination on grounds of age - Perception that age discrimination is widespread has increased throughout
the EU - Since 2008, the perception that age discrimination is widespread has increased from 42% to 58% (+16 points). This trend is noted in all countries surveyed, with the exception of Portugal where only a minor increase has been recorded (+2). Furthermore, apart from Italy (+8), these shifts are above 10 percentage points in all other countries surveyed. The largest increases have been recorded in Cyprus (+27), Romania (+25), France and The Netherlands (both +22). The economic crisis seems to lie at the core of this shift in opinion: one of the perceived consequences of the crisis is that the jobs of older Europeans are less secure. Despite the significant shift in opinion since 2008, when invited to make a comparison with the situation five years previously the proportion of citizens who feel that such discrimination is now less widespread (47%; 38% slightly less widespread, 9% far less widespread) still slightly outnumbers the percentage that feels it is now more widespread (42%; 10% far more widespread, 32% slightly more widespread).59 However, the difference between these two opinions is now considerably smaller than it was in 2008 (+5 points vs. +24 points).
59 QE2.4 If you compare the situation with 5 years ago, would you say that the following types of discrimination are more common or less common in (OUR COUNTRY)? Discrimination on the basis of…Age

Special EUROBAROMETER 317 DISCRIMINATION IN THE EU IN 2009
- 74 -
In fourteen of the thirty countries surveyed the majority view is that age discrimination is now less widespread. This view is particularly strong in Cyprus (77%) and is next highest in Denmark (64%) and Malta (62%). Conversely, there are also three countries where at least six out of ten citizens feel the contrary: 73% of Hungarians, 65% of Czech and 60% of Slovakians think it is now more widespread.

Special EUROBAROMETER 317 DISCRIMINATION IN THE EU IN 2009
- 75 -
8.3 Experience of age discrimination
- Age is the ground for discrimination that is most frequently experienced - Whilst we have seen public perceptions of age discrimination shift in the course of the year, the proportion of citizens reporting that they have been discriminated against has not changed. However, at six percent, ‘age’ continues to represent the most common ground of self-reported discrimination. Unlike ethnic discrimination, there is no significant gap between experienced and witnessed discrimination, with eight percent reporting the latter. This comparatively high figure may well be due to the fact that age is a shared attribute relevant to all, and young and old may be susceptible to suffer discrimination under various (often differing) circumstances. Age discrimination is ‘most’ prominent in the Czech Republic, with 11% saying they have experienced it and 17% that they have witnessed it. Other countries showing higher than average levels of reported discrimination – for both measures – are Sweden and Slovakia.
EXPERIENCED AGE
DISCRIMINATION (QE3) WITNESSED AGE
DISCRIMINATION (QE4)
EU average 6% EU average 8%
1 (Highest) Czech Rep. (11%) Czech Rep. (17%)
2 Sweden (9%) Sweden (14%)
2 Slovakia (9%) Slovakia (14%)
Lowest Cyprus (1%)
Cyprus, Malta (2%)

Special EUROBAROMETER 317 DISCRIMINATION IN THE EU IN 2009
- 76 -
8.4 Attitudes to citizens aged under 30 and citizens aged over 75 in the highest political office Next we present attitudes to having “young” or “old” people occupying the highest political position in the respondent’s country. Here, respondents were asked how comfortable they would be with someone aged under 30 or a person aged over 75 in this position. - Relatively low levels of comfort with both a very young and a very old holder
of the highest political office - Having someone aged under 30 or above 75 in the highest political office of one's country both provoke significantly more discomfort than some of the other scenarios presented to citizens - such as having someone from a religious minority or a woman in office (see section 1.3). Of the two, Europeans are – on average – more comfortable with the idea of someone aged under 30 (5.9) than they are with that of someone aged over 75 (4.8) in this position. Considering the example of a person aged under 30, the countries most receptive to having such a political leader are Croatia (7.8) Romania (7.7), Poland (7.3) and Denmark (7.2). A very low score is recorded in Germany (4.0)60.
Level of comfort with someone aged under 30 in
highest political office in one's country
EU figure EU average 5.9
Croatia (7.8)
Romania (7.7)
Poland (7.3)
Highest results by country
Denmark (7.2)
FYROM (5.0) Lowest results
by country Germany (4.0)
As would be expected, we can see a clear relationship between a respondent’s age and answers to this question, with the expressed level of comfort decreasing the older the respondent.
60 The full results for this question can be found in the annexes of this report.

Special EUROBAROMETER 317 DISCRIMINATION IN THE EU IN 2009
- 77 -
BY AGE QE6.4 Level of comfort with a person aged under 30 in highest political position
EU average Age 15-24 Age 25-39 Age 40-54 Age 55+
Average score out of 10 5.9 7.0 6.3 5.8 5.3
For the situation with a person older than 75, it is notable that the variation in average comfort levels among individual countries is less. Even in the country with the highest results - Poland (5.9) - the average score is just 1.1 points higher than the EU average (4.8). Citizens in Cyprus are least comfortable with the idea of being led by a person that is older than 75.
Level of comfort with someone aged over 75 in
highest political office in one's country
EU figure EU average 4.8
Poland (5.9) Highest results
by country Spain (5.7)
Bulgaria, Latvia, FYROM (3.3) Lowest results
by country Cyprus (3.1)
Having seen the link between being younger and feeling more comfortable with a younger political leader, we might suppose that the reverse would be true for having an older leader. In fact, we see that this is not the case – it is the group of youngest respondents that is more comfortable with an older leader – even if the difference in average comfort levels between the age groups is small.
BY AGE QE6.7 Level of comfort with a person aged over 75 in highest political position
EU average Age 15-24 Age 25-39 Age 40-54 Age 55+
Average score out of 10
4.8 5.1 5.0 4.6 4.5


Special EUROBAROMETER 317 DISCRIMINATION IN THE EU IN 2009
- 78 -
9. DISCRIMINATION ON GROUNDS OF DISABILITY 9.1 The perceived extent of disability discrimination Just over half of Europeans perceive discrimination on grounds of disability to
be widespread - The same shift noted for age has occurred with regards to discrimination on grounds of disability. If the majority view in 2008 was that discrimination on grounds of disability was rare (49%), the majority now feel that it is widespread (53%: 13% very widespread, 40% fairly widespread). Just over four out of ten citizens now believe it is rare (41%: 10% very rare, 31% fairly rare). Two percent think that discrimination on the grounds of disability is non-existent in their country and a further four percent say that they ‘don’t know’. As for the two other grounds of discrimination already discussed, country-by-country results exhibit a strong degree of variation, with the countries where discrimination is seen as most widespread being France (74% widespread), Latvia, Hungary (both 64%), Belgium, Greece (both 63%) and The Netherlands (62%). The countries where this perception is least common are Malta (33%), Turkey (34%), Ireland (35%), and Austria (39%).

Special EUROBAROMETER 317 DISCRIMINATION IN THE EU IN 2009
- 79 -

Special EUROBAROMETER 317 DISCRIMINATION IN THE EU IN 2009
- 80 -
- As can be expected, disabled citizens are most likely to see discrimination on this ground as widespread - There are several variables that are linked to the perception of discrimination on grounds of disability being widespread. For example, having friends who are disabled makes one more likely to believe that discrimination is widespread in the country where one lives – this same link was also seen for discrimination on ethnic grounds, although it should be noted that the link applies to having all kinds of different friends and is not limited to having disabled friends61. However, unlike the results described earlier for ethnicity, citizens who declare to belong to a minority in terms of disability much more often say that in their view discrimination on this ground is widespread.
QE16.4 FRIENDS WHO ARE DISBALED
QE17 SELF-DEFINED MINORITY QE1.6 DISCRIMINATION ON
GROUNDS OF DISABILITY Total
% Yes No Disabled*
Widespread 53% 56% 50% 69%
Rare 41% 39% 43% 29%
*Note: Results for self defined minority as disabled should be considered as indicative due to the small base (n=586), i.e. only 2% of citizens consider themselves to belong to this minority group.
In fact, as already noted it appears that citizens who self-define themselves as being disabled are more likely to say that discrimination on the various grounds is widespread. Holding left-wing political views (60%) as opposed to centrist (52%) or right-wing views (51%) is a further factor that makes citizens more likely to consider discrimination on the grounds of disability as widespread. Factors such as age and gender have less impact on people’s views concerning the extent of this ground of discrimination.
61 In fact, citizens with LGBT friends are even more likely to feel that discrimination against disabled citizens is widespread (60%).
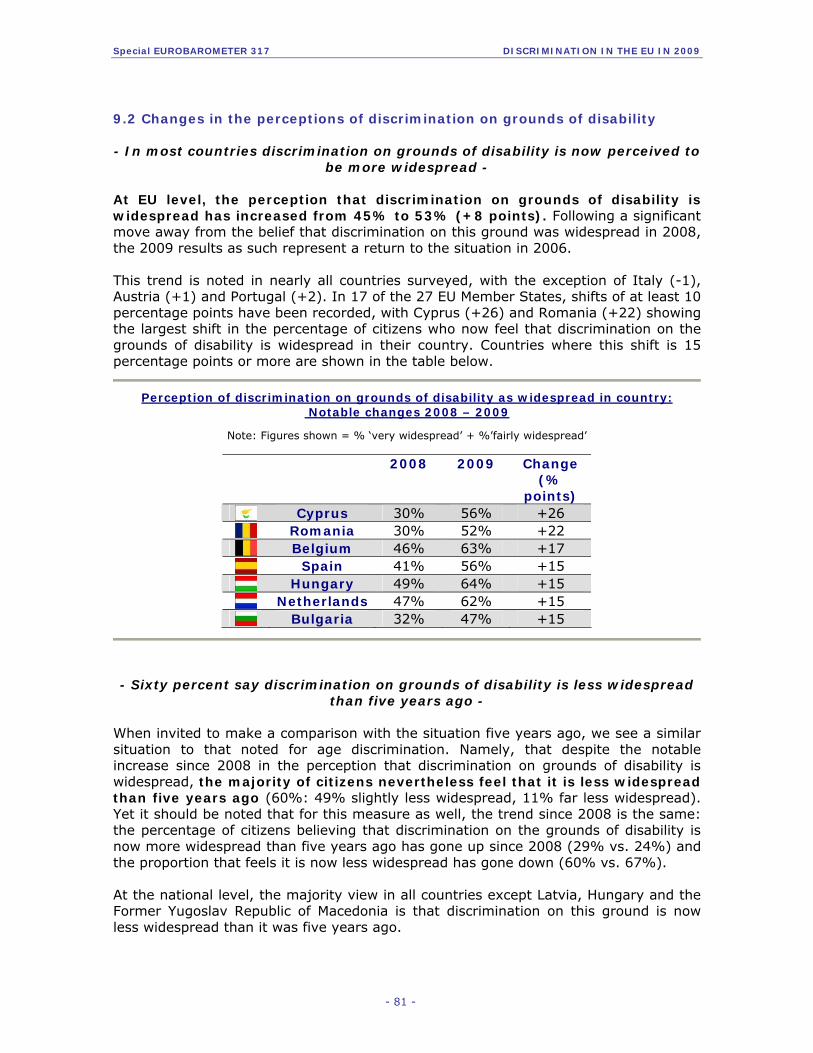
Special EUROBAROMETER 317 DISCRIMINATION IN THE EU IN 2009
- 81 -
9.2 Changes in the perceptions of discrimination on grounds of disability - In most countries discrimination on grounds of disability is now perceived to
be more widespread - At EU level, the perception that discrimination on grounds of disability is widespread has increased from 45% to 53% (+8 points). Following a significant move away from the belief that discrimination on this ground was widespread in 2008, the 2009 results as such represent a return to the situation in 2006. This trend is noted in nearly all countries surveyed, with the exception of Italy (-1), Austria (+1) and Portugal (+2). In 17 of the 27 EU Member States, shifts of at least 10 percentage points have been recorded, with Cyprus (+26) and Romania (+22) showing the largest shift in the percentage of citizens who now feel that discrimination on the grounds of disability is widespread in their country. Countries where this shift is 15 percentage points or more are shown in the table below.
Perception of discrimination on grounds of disability as widespread in country: Notable changes 2008 – 2009
Note: Figures shown = % ‘very widespread’ + %’fairly widespread’
2008 2009
Change
(% points)
Cyprus 30% 56% +26
Romania 30% 52% +22
Belgium 46% 63% +17
Spain 41% 56% +15
Hungary 49% 64% +15
Netherlands 47% 62% +15
Bulgaria 32% 47% +15
- Sixty percent say discrimination on grounds of disability is less widespread
than five years ago - When invited to make a comparison with the situation five years ago, we see a similar situation to that noted for age discrimination. Namely, that despite the notable increase since 2008 in the perception that discrimination on grounds of disability is widespread, the majority of citizens nevertheless feel that it is less widespread than five years ago (60%: 49% slightly less widespread, 11% far less widespread). Yet it should be noted that for this measure as well, the trend since 2008 is the same: the percentage of citizens believing that discrimination on the grounds of disability is now more widespread than five years ago has gone up since 2008 (29% vs. 24%) and the proportion that feels it is now less widespread has gone down (60% vs. 67%). At the national level, the majority view in all countries except Latvia, Hungary and the Former Yugoslav Republic of Macedonia is that discrimination on this ground is now less widespread than it was five years ago.

Special EUROBAROMETER 317 DISCRIMINATION IN THE EU IN 2009
- 82 -

Special EUROBAROMETER 317 DISCRIMINATION IN THE EU IN 2009
- 83 -
9.3 Measuring disability discrimination - Self-reporting and witnessing of discrimination on grounds of disability over
the course of a year remains at the same level as in 2008- The increased perception that discrimination on the grounds of disability is widespread is not matched by increased levels of self-reporting of this ground for discrimination. As in 2008, two percent of citizens across Europe say they were discriminated against because of a disability in the 12 months preceding the survey62, with six percent saying that they have witnessed this happening to someone else.63
Proportion of citizens witnessing discrimination on grounds of disability of 12 months
EU figure EU average 6%
Sweden (12%) Highest results
by country Austria (9%)
Croatia, Greece, Hungary, Lithuania, Portugal (3%)
Lowest results by country
Malta, Cyprus (2%)
62QE3. In the past 12 months have you personally felt discriminated against or harassed on the basis of one or more of of the following grounds? Please tell me all that apply. 63QE4. In the past 12 months, have you witnessed someone being discriminated against or harassed on the basis of one or more of the following grounds? Please tell me all that apply.

Special EUROBAROMETER 317 DISCRIMINATION IN THE EU IN 2009
- 84 -
9.4 Attitudes towards disabled people in public office
- Relatively high acceptance of disabled persons in the highest political office-
Europeans are relatively comfortable with the idea of having a disabled person in the highest elected political office in their country.64 Close to a third of Europeans report feeling totally comfortable with this idea. These respondents selected point 10 on the scale from 1 to 10 and the average comfort level is 7.4. However, there are large variations at the country level with average ‘comfort’ scores ranging from4.7 in the Former Yugoslav Republic of Macedonia to 8.8 in Sweden.
Level of comfort with a disabled person in the highest elected political position in one’s country
EU figure EU average 7.4
Sweden (8.8)
Ireland (8.7) Highest results by country
Denmark (8.6)
Bulgaria, Hungary (5.6) Lowest results by country
FYROM (4.7)
At a personal level, it is perhaps not surprising to find that respondents who say they are disabled feel more comfortable than average with the idea of having a disabled person in the highest elected national office (8.0 vs. 7.4). The survey again highlights how important having a diverse circle of friends is. Europeans with LGBT friends feel most comfortable (8.1), followed by those with disabled friends or with friends of a different religion (both 7.7). Finally, it is interesting to note that managers (8.0) are much more comfortable than the other occupational groups.
64 QE6.6 And using a scale from 1 to 10, please tell me how you would feel about having someone from each of the following categories in the highest elected political position in (OUR COUNTRY)? A disabled person.


Special EUROBAROMETER 317 DISCRIMINATION IN THE EU IN 2009
- 85 -
10. DISCRIMINATION ON GROUNDS OF SEXUAL ORIENTATION 10.1 The perceived extent of discrimination on grounds of sexual orientation - Just under half of EU citizens think that discrimination on grounds of sexual
orientation is widespread in their country - In contrast with what we found for discrimination on the grounds of age and disability, Europeans are on average now less inclined to see sexual orientation as a widespread ground for discrimination in the EU than was the case in 2008.65 It is now seen as the fourth most widespread ground for discrimination in the EU. Just under half think that it is widespread (47% widespread: 12% very widespread, 35% fairly widespread), as opposed to 43% who think that it is rare (32% fairly rare, 11% very rare). Three percent think discrimination on grounds of sexual orientation is non-existent in their country and seven percent state ‘don’t know’. Examining the national results we see the same pattern as in 2008, namely that discrimination on grounds of sexual orientation is seen as being particularly widespread in many of the Mediterranean countries. For example, the three countries where it is seen as being most widespread are Cyprus (66%) and Greece (64%). Italy and France (both 61%) also have results far above the EU average of 47%.
65 QE 1.3 For each of the following types of discrimination, could you please tell me whether, in your opinion, it is very widespread, fairly widespread, fairly rare or very rare in (OUR COUNTRY)? Discrimination on the basis of… Sexual orientation (for example being gay or lesbian)

Special EUROBAROMETER 317 DISCRIMINATION IN THE EU IN 2009
- 86 -

Special EUROBAROMETER 317 DISCRIMINATION IN THE EU IN 2009
- 87 -
Looking at the lower percentages, we can see that discrimination on grounds of sexual orientation is perceived as much less widespread in many of the newer entrants to the EU – the bottom four countries are Bulgaria, the Czech Republic (both 22%), Slovakia (27%) and Estonia (28%). It can also be noted that a lower than average proportion of citizens in these countries report that they have LGBT friends66. Conversely, in countries where an above average proportion reports having LGBT friends the perception that discrimination on grounds of sexual orientation is widespread is towards the higher end of the country ranking67. Hence, we see that having LGBT friends makes one more likely to think that discrimination on this ground is widespread. The results of the survey seem to indicate that people who feel they are part of a sexual minority more often perceive discrimination on this ground to be widespread. However due to small sample sizes, we can not attach any statistical proof to this finding.
QE16. LGBT FRIENDS QE17. SELF-DEFINED
MINORITY QE1.3 DISCRIMINATION ON GROUNDS OF SEXUAL ORIENTATION
Total %
Yes No Sexual*
Widespread 47% 53% 44% 57%
Rare 43% 43% 43% 39%
*Note: In this table, the result for those who say that they belong to a sexual minority should be treated with extreme caution due to very the small base (n=255). In other words, only 1% of citizens consider themselves to be part of a sexual minority.
The other relevant factors in the perception of the extent of discrimination on grounds of sexual orientation also follow the patterns examined above:
• The youngest citizens (53%) see it as being more widespread than the oldest (42%).
• It is seen as more common by citizens on the political left (51%) than those in the centre or on the right (both 45%).
• Citizens who stayed in education until at least the age of 20 (48%) are more likely to see it as being widespread than those who finished studying at the age of 15 or younger (44%).
• Men are slightly more likely to perceive it as rare than are women (45 vs. 42%).
66 In Bulgaria, seven percent have LGBT friends; In the Czech Republic, 20%; In Estonia, 17%; In Slovakia, 15% vis-à-vis the EU average at 38%. 67 The highest proportions are noted in The Netherlands (68%), followed by Sweden and France (both 59%).

Special EUROBAROMETER 317 DISCRIMINATION IN THE EU IN 2009
- 88 -
10.2 Changes in the perceptions of discrimination on grounds of sexual orientation
- Discrimination on sexual grounds in the EU is now perceived to be less widespread-
The perception of how widespread discrimination on the grounds of sexual orientation is has fallen since 2008 to a level below that recorded in 2006. The belief that it is widespread has dropped by four percentage point since 2008 (from 51%) whilst the view that it is rare has increased by two percentage points (from 41% in 2008). In 2006, the corresponding figures were 50% and 41%. Although this drop in the perceived extent of discrimination is noted in many countries, there are a few exceptions. The most prominent instance is the nine-point increase amongst the Dutch in the belief that discrimination on grounds of sexual orientation is widespread. In fact these figures can be linked to the increased incidence of attacks against LGBT people in recent years, a topic that has been widely covered by the Dutch media68. At the same time, significantly fewer citizens in Italy and the UK now believe that discrimination on grounds of sexual orientation is widespread in their country than was recorded in 2008.
Perception of discrimination on grounds of sexuality as widespread in country: Notable changes 2008 – 2009
Note: Figures shown = % ‘very widespread’ + % ‘fairly widespread’
2008 2009
Change
(% points) Italy 72% 61% -11 UK 50% 40% -10 Greece 73% 64% -9 Ireland 38% 30% -8 Lithuania 43% 36% -7 Portugal 65% 58% -7 Cyprus 73% 66% -7
Czech
Republic 27% 22% -5
Estonia 32% 28% -4 Germany 40% 36% -4 Spain 48% 44% -4
Denmark 34% 38% +4 Latvia 36% 40% +4 Romania 45% 49% +4 Luxembourg 34% 39% +5 Netherlands 45% 54% +9
68 See, for instance, a report from the Dutch news channel NOS on 20 November 2008: http://www.nos.nl/nosjournaal/artikelen/2008/11/20/201108_homos.html.

Special EUROBAROMETER 317 DISCRIMINATION IN THE EU IN 2009
- 89 -
- Discrimination on grounds of sexual orientation is seen as less widespread now than five years ago -
When making a medium-term comparison with five years ago, citizens are much more likely to say that discrimination on grounds of sexual orientation is now less widespread (60%) than they are to say it is more widespread (28%). These figures are very similar to those obtained in 2008 (61% vs. 29%).69 In virtually all countries of the EU, the majority opinion is that discrimination on grounds of sexual orientation is now less widespread. There are some exceptions with the Former Yugoslav Republic of Macedonia being the only one where citizens who think it is now more widespread significantly outnumber those who think that it is less widespread (39% vs. 32%).
69 QE2.3 If you compare the situation with 5 years ago, would you say that the following types of discrimination are more common or less common in (OUR COUNTRY)? Discrimination on the basis of… Sexual orientation (for example being gay or lesbian)

Special EUROBAROMETER 317 DISCRIMINATION IN THE EU IN 2009
- 90 -
10.3 Measuring discrimination on grounds of sexual orientation
- Discrimination on grounds of sexual orientation much more likely to be witnessed than experienced -
Just one percent of citizens across the EU report experienced discrimination on the grounds of sexual orientation over the year before the survey. At four percent, the highest self-reported level is noted in Italy. As with the general pattern, a higher proportion of citizens think they have witnessed this discrimination taking place (6%). The Dutch (10%), Swedes and Austrians (both 9%) are the most likely to say this.
Proportion of citizens witnessing discrimination on grounds of sexual orientation of 12 months
EU figure EU average 6%
Netherlands (10%) Highest results
by country Sweden, Austria (9%)
Lowest results by country
Bulgaria, Czech Republic, Cyprus (1%)

Special EUROBAROMETER 317 DISCRIMINATION IN THE EU IN 2009
- 91 -
10.4 Attitudes to LGBT people
- Strong national variations in the degree to which people feel comfortable
with having a LGBT leader in their country - The survey reveals large variations in the extent to which Europeans feel comfortable with the idea of having a LGBT person holding the highest political office in their country.70 On average, around a quarter of Europeans (27%) would feel totally comfortable with this situation. If we examine the average scores on the comfort scale from 1 to 10, we find that people in Sweden (8.7), Denmark (8.4) and the Netherlands (8.2) feel most comfortable with having a LGBT leader in their country, while people in Bulgaria (3.2), Romania and Turkey (each 3.4) report feeling least comfortable.
Level of comfort with a LGBT person in highest political position
EU figure EU average 6.5
Sweden (8.7)
Denmark (8.4) Highest results
by country
Netherlands (8.2)
Romania, Turkey (3.4) Lowest results
by country Bulgaria(3.2)
In this context again, the importance of having LGBT friends or acquaintances in shaping opinions is evident. Europeans with LGBT friends are much more open to the idea of having them in political office than Europeans without LGBT friends.
QE16.3 LGBT FRIENDS
QE6.3 Level of comfort with LGBT people in highest elected office
Total %
Yes No
Average 6.5 8.0 5.5
70 QE6.2 And using a scale from 1 to 10, please tell me how you would feel about having someone from each of the following categories in the highest elected political position in (OUR COUNTRY)? A homosexual (gay man or lesbian woman).


Special EUROBAROMETER 317 DISCRIMINATION IN THE EU IN 2009
- 92 -
11. DISCRIMINATION ON GROUNDS OF GENDER 11.1 The perceived extent of discrimination on grounds of gender
- Over half of citizens in the EU think that gender discrimination is rare - Discrimination on grounds of gender is one of the two forms of discrimination perceived by more citizens as being rare than widespread: 53% think it is rare (15% very rare and 38% fairly rare) and 40% that it is widespread (33% fairly widespread and 7% very widespread). Three percent say, spontaneously, that it is non-existent and four percent ‘don’t know’.71 This overall pattern is found to exist in all countries but a few. Looking at the exceptions, we find three countries where an outright majority feel gender discrimination is widespread: Hungary (57%), France (54%) and Sweden (52%). In five further countries public opinion is divided: Greece, Cyprus, Italy, FYROM and Turkey. At the other end of the scale, around two in three people in Luxembourg (69%), Denmark, Ireland, Finland (each 67%) and Germany (65%) think gender discrimination is rare in their country.
71 QE1.2 For each of the following types of discrimination, could you please tell me whether, in your opinion, it is very widespread, fairly widespread, fairly rare or very rare in (OUR COUNTRY)? Discrimination on the basis of… Gender

Special EUROBAROMETER 317 DISCRIMINATION IN THE EU IN 2009
- 93 -

Special EUROBAROMETER 317 DISCRIMINATION IN THE EU IN 2009
- 94 -
- Women are much more likely than men to say gender discrimination is
common - Even if both genders are more likely to see gender discrimination as rare rather than widespread, the survey reveals a considerable gender gap: 44% of women in Europe believe it is widespread, compared to 37% of European men.
BY GENDER QE1.2 DISCRIMINATION ON BASIS OF GENDER
Total %
MALE FEMALE
Widespread 40% 37% 44%
Rare 53% 56% 49%
The usual differences according to political leanings – with those to the left being more likely to think that discrimination is widespread – are also strongly evident in the case of gender discrimination. Citizens on the political left are more likely to say that this is widespread than rare by a gap of just two percentage points, with this rising to 16 points for those in the centre and 17 points for those on the right.
POLITICAL VIEWS QE1.2 DISCRIMINATION ON GROUNDS OF GENDER
Total %
LEFT CENTRE RIGHT
Widespread 40% 47% 39% 38%
Rare 53% 49% 55% 55%

Special EUROBAROMETER 317 DISCRIMINATION IN THE EU IN 2009
- 95 -
11.2 Changes in the perceptions of discrimination on grounds of gender
- Gender discrimination is seen to be as widespread as in 2006 after a temporary decrease in 2008 -
The 2009 results are very similar to those obtained in 2006 and represent an increase in the perception that gender discrimination is widespread since 2008. The proportion answering either very or fairly widespread has increased (+4 points, from 36%), with a near-corresponding decrease in the share of those answering either fairly rare or very rare (-3 points, from 56%). Many individual countries reflect this overall trend and many of these countries are those where the proportions considering gender discrimination to be widespread most decreased in 2008. In other words, in many countries we find a return to the 2006 situation. The largest increase has been recorded in Hungary and Cyprus (both +14). As is frequently the case with anayses of shifts, there are also some exceptions. In two Mediterranean countries in particular, we see that gender discrimination is now far less often seen to be widespread than was the case in 2008.
Perception of discrimination on grounds of gender as being widespread in country:
Notable changes 2008 – 2009
Note: Figures shown = % ‘very widespread’ + %’fairly widespread’
2008 2009
Change
(% points) Spain 54% 45% -9
Portugal 43% 35% -8
Italy 49% 46% -3
Germany 23% 30% +7 Bulgaria 13% 20% +7 Estonia 26% 33% +7
Czech
Republic 38% 45% +7
Belgium 31% 39% +8 France 46% 54% +8 Slovenia 30% 40% +10 Netherlands 27% 38% +11 Romania 25% 38% +13 Cyprus 34% 48% +14 Hungary 43% 57% +14

Special EUROBAROMETER 317 DISCRIMINATION IN THE EU IN 2009
- 96 -
- However, around two-thirds say gender discrimination is less widespread than it was five years ago -
The shifts since 2008 regarding the measure which asked for a comparison with the situation five years previously are very minor and the dominant view remains that gender discrimination has declined considerably. Less than a quarter (24%) think that it is now more widespread than five years ago, whilst around two-thirds (65%) hold the contrary opinion.72 In many countries, the opinion that discrimination is now less widespread reaches even higher proportions. This is especially the case in Cyprus (82% less widespread), Denmark (78%) and Finland (75%). As in 2008, Hungary is the only country where more citizens think that gender discrimination is now more widespread than five years ago (51%) than think it is now less widespread (42%).
72QE2.2 If you compare the situation with 5 years ago, would you say that the following types of discrimination are more common or less common in (OUR COUNTRY)? Discrimination on the basis of… Gender

Special EUROBAROMETER 317 DISCRIMINATION IN THE EU IN 2009
- 97 -
11.3 Experience of discrimination on grounds of gender
- Three percent of Europeans say they have experienced gender discrimination in the past 12 months -
In the EU as a whole, three percent of citizens say that they experienced discrimination on the ground of gender in the 12 months before they were interviewed, with this rising to eight percent in Hungary and seven percent in Italy and Sweden.73 Five percent of the total sample report having witnessed gender discrimination in the year before interview.74 A far higher than average proportion of Swedes (14%) say that they saw this happening during the 12 month period in question. This is considerably higher than the second-ranking country (Spain, at 8%).
EXPERIENCED GENDER
DISCRIMINATION (QE3) WITNESSED GENDER
DISCRIMINATION (QE4)
Highest EU average (3%) EU average (5%)
1 Hungary (8%) 1 Sweden (14%)
2 Sweden (7%) 2 Spain (8%)
2 Italy (7%) 3 - 6 countries (7%)
Lowest Poland (1%) Portugal (1%)
- Gender discrimination is experienced much more by women than by men - Although gender discrimination can encompass both sexes, it is experienced more often by women (5%) than men (2%). There is no difference between men and women when it comes to witnessing discrimination (5% of both genders have witnessed it).
73 QE3 In the past 12 months have you personally felt discriminated against or harassed on the basis of one or more of of the following grounds? Please tell me all that apply... Gender. 74 QE4. In the past 12 months, have you witnessed someone being discriminated against or harassed on the basis of one or more of the following grounds? Please tell me all that apply...Gender

Special EUROBAROMETER 317 DISCRIMINATION IN THE EU IN 2009
- 98 -
11.4 Attitudes to women in the highest political office - The average European is very comfortable with a female holding the highest
political office - The idea of having a woman in the highest elected political position causes little discomfort for the vast majority of Europeans surveyed, with the average ‘comfort rating’ being 8.5 out of a maximum of 1075. Around half of respondents (49%) answer that they would be totally comfortable with having a woman in this position (point 10 on the scale). Just 1% would be very uncomfortable. All countries record a very high average result here, with the Swedes and Lithuanians being most comfortable of all with the idea (average score is 9.6 out of 10 for both countries). Over 8 out of 10 citizens in these two countries (84% and 81%) and in Denmark (81%) feel totally comfortable.
Level of comfort with a woman in highest political office of one's country
EU figures EU average 8.5
Sweden, Lithuania (9.6)
Denmark (9.5) Highest results by country
Ireland, Slovenia (9.3)
Italy, FYROM (7.8) Lowest results
by country Portugal (7.6)
Whilst there is something of a gender difference here with women showing an average level of comfort higher than that for men (8.8 vs. 8.3), we emphasise that this is a minor variation on the overall pattern, which is that EU citizens show very little prejudice in terms of gender when it comes to the issue of political office76.
75 QE6.1 And using a scale from 1 to 10, please tell me how you would feel about having someone from each of the following categories in the highest elected political position in (OUR COUNTRY)? A woman 76 There are also small differences depending on education with citizens who stayed in full-time education giving a higher score (8.9) than citizens who left school aged 15 or younger (8.2).


Special EUROBAROMETER 317 DISCRIMINATION IN THE EU IN 2009
- 99 -
12. DISCRIMINATION ON GROUNDS OF RELIGION OR BELIEF 12.1 The perceived extent of discrimination on grounds of religion or belief
- Discrimination on grounds of religion or belief is now seen as the least widespread form in the EU, although still perceived as widespread by close to
four out of ten Europeans - Discrimination on grounds of religion or belief is considered to be the least widespread form of discrimination in the EU: 39% of citizens say that this is widespread and over half (53%) think that it is rare77. Four percent think that it does not exist in their country and the same proportion is unable to answer. Again responses are more moderate than extreme, with 30% and 37% respectively saying that this type of discrimination is fairly widespread or fairly rare, compared to 9% saying it is very widespread and 16% that it is very rare. Discrimination based on religion/belief is seen as most widespread of all in the Netherlands (59%) and France (58%), followed by Denmark (55%), Belgium (54%), Sweden (53%) and Greece (51%). We note that these are all countries where immigration issues feature prominently in the public debate. At the other end of the scale, just 12% of Czechs and Slovakians, 13% of Latvians and 14% of Lithuanians think this type of discrimination is common in their country. These are all countries where there is relatively little religious diversity. The map below demonstrates that all the new Member States except Cyprus and Slovenia are below the EU average and towards the bottom of the ranking. In the three Candidate Countries views are closer to the EU average.
77 QE1.5 For each of the following types of discrimination, could you please tell me whether, in your opinion, it is very widespread, fairly widespread, fairly rare or very rare in (OUR COUNTRY)? Discrimination on the basis of… Religion or belief

Special EUROBAROMETER 317 DISCRIMINATION IN THE EU IN 2009
- 100 -

Special EUROBAROMETER 317 DISCRIMINATION IN THE EU IN 2009
- 101 -
In terms of social groupings, opinion follows the familiar pattern, with this type of discrimination being more likely to be perceived as widespread by:
• The youngest citizens (43%) rather than the oldest (34%). • Citizens with left-wing views (44%) more than those with right-wing views
(36%). • Citizens with friends who have a different religion or belief from their own (41%
vs. 36% of those without such friends). • Citizens who self-define as a religious minority (51%).
QE16.5 FRIENDS WHO
HAVE DIFFERENT RELIGION OR BELIEF
QE17. SELF-DEFINED MINORITY
QE1.5 DISCRIMINATION ON BASIS OF RELIGION OR BELIEF
Total %
Yes No Religious*
Widespread 39% 41% 36% 51%
Rare 53% 53% 53% 45%
*Note: Results for those who consider themselves to be part of a religious minority should be considered as indicative due to the small base (1092), i.e. only 4% of citizens say that they belong to a religious minority.
Again we note that citizens with LGBT friends are more inclined to feel that discrimination on the grounds of religion or belief is widespread (47%) than those with friends belonging to the group of citizens that is perceived as suffering discrimination. This indicates that having a social circle that includes friends or acquaintances of a different sexual orientation may make citizens more perceptive of the issue of discrimination in general.
DISCRIMINATION IS WIDESPREAD ON GROUNDS OF…
EU27 TOTAL LGBT
FRIENDS
FRIENDS OF A
DIFFERENT ETHNIC ORIGIN
ROMA FRIENDS
DISABLED FRIENDS
FRIENDS WITH
DIFFERENT RELIGION
…Ethnic origin 61% 71% 67% 64% 65% 65%
…Gender 40% 46% 42% 44% 42% 42%
…Sexual orientation
47% 53% 50% 51% 49% 48%
…Age 58% 61% 59% 62% 60% 59%
…Religion 39% 47% 42% 40% 41% 41%
…Disability 53% 60% 56% 58% 56% 56%

Special EUROBAROMETER 317 DISCRIMINATION IN THE EU IN 2009
- 102 -
12.2 Changes in the perceptions of discrimination on grounds of religion or belief - Overall, the perception that discrimination on religious or belief grounds is
widespread continues to decline - Overall, the opinion that discrimination on the basis of religion or belief is widespread continues to fall since it was first measured by this survey in 2006. Following a three point drop between 2006 and 2008, we now note a further decline of three points (from 42% in 2008). This drop is matched by an increased tendency to believe this form of discrimination is rare: from 47% to 51% in 2008 with a further increase of two points noted in the latest survey. Thus since 2006, we have moved from a state of opinion that was split roughly evenly to one where a majority think discrimination is rare. Despite this overall shift, the belief that discrimination on grounds of religion or belief is widespread has increased significantly in a number of countries, with the largest shifts noted in Finland and Romania (both +7). The most notable shifts in the opposite direction have occurred in the UK (-11) and Italy (-10) where 45% now believe discrimination on the basis of religion or belief is widespread.
Perception of discrimination on grounds of religion or belief as widespread in
country: Notable changes 2008 – 2009
Note: Figures shown = % ‘very widespread’ + %’fairly widespread’
2008 2009
Change
(% points) UK 56% 45% -11 Italy 55% 45% -10 Portugal 36% 27% -9 Spain 41% 32% -9 Denmark 62% 55% -7 Malta 39% 35% -4
Bulgaria 15% 19% +4 Netherlands 55% 59% +4 Hungary 17% 23% +6 Slovenia 33% 39% +6 Austria 41% 47% +6 Romania 20% 27% +7 Finland 27% 34% +7

Special EUROBAROMETER 317 DISCRIMINATION IN THE EU IN 2009
- 103 -
- Overall, the majority view is that discrimination on religious grounds is less
widespread than five years ago - There has been a further increase since 2008 in the proportion of citizens who feel that discrimination on grounds of religion or belief is now less widespread than it was five years ago78. An outright majority holds this view (56%; +4) and less than a third think it is more widespread than it was five years ago (32%; -6). Most countries follow the general pattern, with more citizens thinking discrimination is now less widespread. This belief is expressed at extremely high levels in Cyprus (79%) the Czech Republic (78%), and Slovakia (72%). At the same time, in the Netherlands and Denmark, an outright majority of citizens consider discrimination to be more widespread than it was five years ago (55% and 52%, respectively). In France, this is also the majority view (46% ‘more widespread’ vs. 39% ‘less widespread’) whilst public opinion is divided in Sweden (46% vs. 45%) and Austria (45% vs. 47%).
78 QE2.5 If you compare the situation with 5 years ago, would you say that the following types of discrimination are more common or less common in (OUR COUNTRY)? Discrimination on the basis of… Religion or belief

Special EUROBAROMETER 317 DISCRIMINATION IN THE EU IN 2009
- 104 -

Special EUROBAROMETER 317 DISCRIMINATION IN THE EU IN 2009
- 105 -
12.3 Experience of discrimination on grounds of religion or belief
- One percent of citizens report experiencing discrimination on grounds of religion or belief in the past year -
Across the EU, only one percent of citizens say that they experienced discriminated on the grounds of religion or belief in the year leading up to their interview79. Apart from the Former Yugoslav Republic of Macedonia (6%), Austria (5%) and Italy (3%), the proportion of citizens who report this form of discrimination is two percent or less in all surveyed countries. In terms of witnessing discrimination, five percent say that they saw this happen on the grounds of religion or belief in the year before interview80. By far the highest result here is recorded in Denmark (15%), followed by Sweden (11%), Austria and the Netherlands (each 10%). At one percent, witnessing discrimination on grounds of religion or belief is least common in the Czech Republic, Hungary, Malta, Romania and Portugal.
Proportion of citizens witnessing discrimination on grounds of religion or belief over 12 months
EU figure EU average 5%
Denmark (15%)
Sweden (11%) Highest results by country
Austria, The Netherlands (10%)
From the country ranking it is apparent that witnessing this form of discrimination is related to the extent to which countries are culturally diverse. This is also evident when the influence of origin is considered:
• 16% of citizens who belong to a religious minority have witnessed this form of discrimination.
• 11% of citizens born outside of the EU and 10% of citizens born in the EU but outside the country of survey have witnessed this form of discrimination.
79 QE3. In the past 12 months have you personally felt discriminated against or harassed on the basis of one or more of of the following grounds? Please tell me all that apply... Religion or belief 80 QE4. In the past 12 months, have you witnessed someone being discriminated against or harassed on the basis of one or more of the following grounds? Please tell me all that apply... Religion or belief

Special EUROBAROMETER 317 DISCRIMINATION IN THE EU IN 2009
- 106 -
12.4 Attitudes to citizens of a different religion or belief in public office - Close to a quarter of Europeans would feel totally comfortable with having a
person from a religious minority as political leader in their country - Finally, we see that on average close to a quarter of Europeans (24%) would feel totally comfortable with the idea of a person from a minority religion holding the highest political office in their country, giving a rating of 10 out of 1081. On the comfort scale from 1 to 10, the EU average is 6.5. This average figure conceals high variations at the national level: the results range from 3.7 in Cyprus to 8.1 in Poland.
Level of comfort with a political leader with a different religion than the majority of the population
EU figure EU average 6.5
Poland (8.1)
Ireland (7.8) Highest results
by country
Sweden (7.2)
Austria (4.8)
Malta (4.6) Lowest results
by country
Cyprus (3.7)
81 QE6.5 And using a scale from 1 to 10, please tell me how you would feel about having someone from each of the following categories in the highest elected political position in (OUR COUNTRY)? A person from a different religion than the majority of the population

Special EUROBAROMETER 317 DISCRIMINATION IN THE EU IN 2009
- 107 -
13. THE IMPACT OF THE ECONOMIC AND FINANCIAL CRISIS 13.1 The perceived impact of the crisis on the importance and funding of
equality and diversity policies
- Almost half of Europeans see the crisis as having a negative impact on the
importance and funding of policies promoting equality and diversity - As part of the newly added questions in the wave under discussion, Europeans were asked about their views on how the crisis would impact the importance of equality and diversity policies in their countries and whether these policies would receive less funding due to the crisis. As can be seen throughout all Eurobarometer questions that deal with the crisis, the mood in spring 2009 is indeed somber and Europeans at this time have few illusions about the impact of the crisis on all types of policies. Equality and diversity policies are no exception to this rule. When asked whether they thought that “due to the economical crisis the policies promoting equality and diversity in (our country), will be considered less important and receive less funding”, 49% of Europeans stated that this would definitely (11%) or to some extent (38%) have an impact. Just over a third felt it would have no impact (26% ‘not really’ and 8% ‘no, definitely not’), with about one in six (17%) stating ‘don’t know’ on this question.82
82 QE12 Do you think that due to the economical crisis the policies promoting equality and diversity in (OUR COUNTRY), will be considered less important and receive less funding?

Special EUROBAROMETER 317 DISCRIMINATION IN THE EU IN 2009
- 108 -
As might be expected, across countries wide variations can be seen. The country with the most somber assessment is Sweden, where 68% of citizens feel that the crisis will have an impact. Denmark and the Netherlands follow closely at 67% and 66%, with 65% of Slovenians and Latvians also feeling that the crisis will have an impact on equality and diversity policies in their countries.
Conversely, Spanish citizens do not share this view, with 55% expecting no impact (versus EU average of 34% ‘Total No’ answers to this question). The highest ‘don’t know’ responses can be found in Malta and Bulgaria with 39% and 37% respectively. Further countries where more than 30% of citizens answer ‘don’t know’ are Portugal and Cyprus, at 32% and 33% respectively).

Special EUROBAROMETER 317 DISCRIMINATION IN THE EU IN 2009
- 109 -
13.2 The perceived impact of the crisis on levels of discrimination in the labour market
- The crisis is seen as most contributing to an increase in levels of discrimination in the labour market on grounds of ‘age’ -
The crisis was further discussed with European citizens in terms of discrimination in the labour market and the extent to which it may contribute to discrimination on various grounds in the labour market. As illustrated in the graph, the greatest contribution of the crisis to an increase in discrimination levels is on the grounds of ‘age’. In earlier chapters, we already made the link between the crisis and the increased perception of age discrimination. This link is futher confirmed by the results presented here: 64% of European citizens indicate that the economic crisis will contribute to an increase of discrimination on the grounds of age in the labour market. Just under a third (29%) disagrees and less than a tenth (7%) doesn’t know.83 Looking later at the ‘don’t know’ levels in more detail, we see opinions on this particular ground for discrimination being most firm. A possible increase in the levels of discrimination in the labour market on grounds of ‘ethnic origin’ and ‘’disability’ is perceived by more than 50% of Europeans (57% for the former and 56% for the latter). More than 40% of Europeans state that the crisis will contribute to increased levels of discrimination in the labour market on grounds of ‘gender’ (43%) and ‘religion or belief’ (42%), with half of Europeans giving ‘Total No’ answers to these two grounds of discrimination (49% respectively). The crisis is seen to have less of impact on grounds of ‘sexual orientation’ in the labour market, with fewer than four in ten Europeans seeing the crisis contributing to this aspect (37%).
83 QE13: Do you think that the economic crisis will contribute to an increase of discrimination on the basis of…in the labour market? ‘Total Yes’ combines ‘Yes definitely’ and ‘Yes, to some extent’; ‘Total No’ combines “no, definitely not’ and ‘no, not really’ from the scale.

Special EUROBAROMETER 317 DISCRIMINATION IN THE EU IN 2009
- 110 -
QE13. Do you think that the economical crisis will contribute to an increase of discrimination on the basis of… in the labour market? -%EU27
57%
56%
43%
42%
37%
34%
36%
52%
8%
64%
49%
49%
29% 7%
9%
9%
11%
8%
Age
Ethnic origin
Disability
Gender
Religion or belief
Sexual orientation
Yes No DK
Looking at the national level, a clear trend in terms of highest ‘Total Yes’ responses on each grounds of discrimination emerges: High proportions of Greek and Slovenian as well as Finnish citizens feel that the crisis will contribute to an increase in levels of discrimination on all grounds in the labour market. On the grounds of ‘age’ the picture is somewhat more varied, with 83% of Finns thinking that the crisis may contribute to increased levels of age discrimination in the labour market. Greece and Latvia follow suit with 80% of citizens feeling this way.

Special EUROBAROMETER 317 DISCRIMINATION IN THE EU IN 2009
- 111 -

Special EUROBAROMETER 317 DISCRIMINATION IN THE EU IN 2009
- 112 -
Over eight out of ten Greeks (83%) believe that the crisis may contribute to increased discrimination on the grounds of ethnic origin, with Cyprus and Finland following at 78%. Seventy percent of Slovenians also share this view.

Special EUROBAROMETER 317 DISCRIMINATION IN THE EU IN 2009
- 113 -
Over three quarters of Greek and Finnish citizens (each 77%) see a potential increase of discrimination on the basis of disability in the labour market, with 76% of Slovenians following suit; 66% of Greeks and 64% of Slovenians see the crisis as potentially contributing to discrimination on grounds of gender. Results for these two countries are similar for the grounds of ‘religion or belief’ and ‘sexual orientation’: 63% of Greeks and Slovenians feel that the crisis will contribute to an increase in discrimination levels on the former aspect, with 62% of Slovenians and 61% of Greek citizens seeing such a potential increase on grounds of ‘sexual orientation’.

Special EUROBAROMETER 317 DISCRIMINATION IN THE EU IN 2009
- 114 -

Special EUROBAROMETER 317 DISCRIMINATION IN THE EU IN 2009
- 115 -

Special EUROBAROMETER 317 DISCRIMINATION IN THE EU IN 2009
- 116 -
It is worthwhile looking at patterns emerging in the ‘don’t know’ levels. Three countries consistently record the highest levels for all grounds of discrimination compared to the EU averages for ‘don’t know’ on these aspects: about one in five Portuguese (18%) state ‘don’t know’ for ‘age’ (versus the EU average of 7%), whereas more than one in five Maltese and Bulgarians state ‘don’t know’ for the other grounds of discrimination (which is double or more than the relevant EU averages for ‘don’t know’).

Special EUROBAROMETER 317 DISCRIMINATION IN THE EU IN 2009
- 117 -
CONCLUSION As with its predecessors, this study analysed the opinions and perceptions of Europeans on issues and public policies that relate to discrimination. This Eurobarometer has further extended our analysis of how these perceptions and opinions change through time (this being the third such study). Cognisant of the global financial crisis that the European Union has found itself very much a part of, a decision was taken to broaden this year’s study to include an examination of how this crisis would be effecting European perceptions and opinions when it came to discrimination. The results are very illuminating. In general, the survey highlights the following: Personal experience of discrimination Personal experience of discrimination remains largely at 2008 levels, with “age” being the most common (6%) grounds upon which discrimination was experienced in the 12 months leading up to the study. Overall, 16% of Europeans reported experiencing discrimination in 12 months leading up to the study. Perceptions of discrimination Ethnic origin remains the most widely perceived ground for discrimination in Europe (61% vs. 62% in 2008) in 2009, although it is now closely followed by age (58% in 2009 vs. 42% in 2008). Europeans would also feel least comfortable with someone from an ethnic minority or non-middle-aged as measured by the comfort rating for a person so described attaining to the highest elected position in their country. Europeans would be most comfortable with a woman attaining to such an office, followed by a person with a disability. Just less than half of Europeans (47%) considered discrimination based on sexual orientation to be widespread, this is 4% lower than last year. The degree to which this was considered widespread varied importantly by country, with many Mediterranean countries considering discrimination in this regard to be quite widespread, while new entrants to the EU particularly did not seem to think that this form of discrimination is widespread. Overall, Europeans appear comfortable with a LGBT person attaining to the highest elected office in their country, but this varies with the respect to whether LGBT people form part of a person’s social circle as well as again by country with the Scandinavians countries appearing more comfortable than countries newer to the EU. Discrimination on the grounds of gender or religion/belief was not perceived by Europeans to be widespread. There is a particularly high degree of comfort with a woman attaining to the highest elected office in a country, with a shade under half (49%) of Europeans being “totally fine” with this. Comfort with those of religious minorities varied quite widely, with noticeably lower levels of comfort being reported in countries where immigration particularly, was noted to form an important part of the public debate. However, religion/belief was considered by Europeans to be the least widespread form of discrimination. This profile of perceptions of discrimination on the grounds of religion/belief suggests that the issue remains largely latent but potentially troublesome. The report also examined, where possible, the views of minority groups although these results can only be seen as indicative due to small sample sizes. Views of respondents who belong to an ethnic minority The 1210 interviewees – five percent of the total sample - who indicated they belong to an ethnic minority on average only slightly more frequently perceive ethnic discrimination as being widespread in their country (65% vs. 61% EU average).

Special EUROBAROMETER 317 DISCRIMINATION IN THE EU IN 2009
- 118 -
Views of respondents who belong to a religious minority There were 1092 interviewees who indicated that they belong to a religious minority, representing four percent of the total sample. Of these respondents, just over half perceive discrimination on grounds of religion or belief to be widespread (51%). This compares starkly with the EU average of 39% and it would thus appear that belonging to a religious minority makes citizens much more perceptive of the occurrence of discrimination on this ground. A quarter of these respondents personally felt discriminated against on the ground of their ethnicity. Views of disabled respondents The survey includes 586 respondents who self-define themselves as disabled, two percent of the total sample. This group of Europeans much more often says that in their view discrimination on grounds of disability is widespread (69% vs. 53% EU average) and a third of them have personally felt discriminated against because of their disability. Overall, it appears that disabled Europeans are more likely to feel that discrimination in general (i.e. on the various grounds) is widespread. Again, these results are only indicative and need to be treated with caution. Views of respondents who belong to a sexual minority Only 255 of the interviewees indicated that they belong to a sexual minority. The results of the survey seem to indicate that people who feel they are part of a sexual minority more often perceive discrimination on this ground to be widespread and more frequently report having been discriminated against. However the sample is too small to give these findings any statistical weight. Finally, the five following findings stand out clearly from the data of which the first two may well be of a short term nature.
1. This wave saw an increase in the perception that discrimination occurred with respect to age and disability compared to 2008.
In 2009 an outright majority of Europeans (58%) considered discrimination on the basis of age to be widespread; this is significantly more than in 2008 when 42% of Europeans considered it to be widespread. The perception that discrimination upon the grounds of age is widespread is noticeably more prevalent amongst those who are 40 years or older (60% of those aged 40-54 hold this view, while 49% of those aged 15-24 hold this view). Considering the current economic crisis, this perception around age found an ominously strong expression in views about discrimination in the labour market, with 48% of respondents considering one’s age to be a disadvantage when seeking employment. This increase of three percent on last year’s level sees age becoming the most common perceived disadvantage when seeking a job (together with a candidate’s look, dress and presentation) and will no doubt colour public perception of the crisis as jobs become more scarce than they have been in many years. Having a disability is the only other ground for discrimination that is now seen by more Europeans as being widespread than was the case last year (53% in 2009 vs. 45% in 2008).

Special EUROBAROMETER 317 DISCRIMINATION IN THE EU IN 2009
- 119 -
2. The advent of the financial crisis has lowered confidence that European governments will continue to address issues of discrimination with the same level of funding and sense of priority.
Europeans expect that the financial crisis will see less funding allocated to policies aimed at combating discrimination as well as these policies declining in priority. Considering the above finding around age and disability, it is important to note that the majority of Europeans think that the economic crisis will lead to an increase of discrimination in three specific areas: on the grounds of age (with 64% of Europeans believing this), ethnic origin (57%) and disability (56%). However, it should be noted that a positive evolution has been noted now for two surveys in a row when it comes to combatting discrimination in general, with slightly more (49%, +2 percentage points) people saying that enough is being done and fewer people (44%, -4 points) saying that not enough is being done than was the case last year. Yet, where citizens perceive discrimination to be widespread (on any of the six grounds specified by the EU), they are less likely to consider efforts to combat discrimination to be sufficient. Finally, in this context, support for equal opportunities measures in the workplace appears to have remained at the high levels reported in 2008 (ranging from 81% for disability-targeted measures to 63% for measures dependent upon sexual orientation). With respect to particular workforce monitoring policies, support remains firmer for policies that monitor recruitment processes (67%) rather than composition of the workforce (52%).
3. The most important determinant of sensitivity to discrimination, as well as comfort with minorities, continues to be the degree of diversity to be found in one’s social circle.
It is quite stunning how potent an influence diversity in one’s social circle is upon attitudes to minorities. Being open-minded and having contact with minorities is the factor with the most positive influence on people’s attitudes. When rating out of 10 how comfortable (with 10 being completely comfortable) they would feel with a LGBT person attaining the highest elected office in the land, those with LGBT friends gave an average rating of 8.5, while those without gave an average rating of 5.5 – a significantly lower rating. This sort of finding is now consistent across three waves of this Eurobarometer study and is, no doubt, going to continue being so. Given the positive association between high levels of diversity in one’s social circle and acceptance of minorities, it is encouraging that this wave saw a net increase in the diversity to be found in Europeans’ social circles with respect to at least five minority groups. Nearly two out of three people have friends who hold different beliefs to them (64%), are disabled (58%) or are of different ethnic origin (57%); this is an increase on the last wave of three percent, three percent and two percent respectively. Increases of similar magnitude were noted for the incidence of people with LGBT friends and Roma friends, although these remained at lower levels (38% and 14% respectively). People who are more likely to have a diverse social circle appear to be those who are younger, have spent longer in full-time education, live in urban areas and who describe themselves as holding political views that are more to the left of the political spectrum. Finally, it appears in particular that having a social circle that includes friends or acquaintances of a different sexual orientation may make citizens more perceptive of the issue of discrimination in general.

Special EUROBAROMETER 317 DISCRIMINATION IN THE EU IN 2009
- 120 -
4. Diversity is not sufficiently reflected in the media.
Whilst the latest survey thus reveals a positive shift in that the social circle of Europeans has become more diverse, a significant proportion of Europeans does not feel that diversity is sufficiently reflect in the media. This is particularly a concern when it comes to ‘disability’, with 44% of Europeans feeling that diversity on this aspect is not sufficiently reflected in the media. Around a third of Europeans also holds this view when it comes to ‘ethnic origin’ (36%), ‘religion or belief’ (35%), ‘age’ (33%) and ‘sexual orientation’ (31%). In terms of ‘gender’, around a quarter of Europeans feel that diversity is not sufficiently reflected in the media (26%).
5. Europeans are not sufficiently aware of their rights.
Only a third of Europeans say they know their rights should they be a victim of discrimination or harassment (33%). Knowledge levels have not improved since 2008. This lack of awareness also affects citizens who belong to a minority. These citizens only slightly more often report awareness than average. Furthermore, the survey reveals that citizens who have actually experienced discrimination are also not significantly more aware of their rights: 35% of those experiencing discrimination on a single grounds and 37% of those experiencing it on multiple grounds say that they know their rights. This lack of knowledge is further evident from the finding that the majority of Europeans would prefer to report to the police if they felt they had been discriminated against. Awareness of the existence of special agencies, such as bodies for the promotion of equal treatment or tribunals appears to be low with fewer citizens selecting these as the preferred reporting point. Hence the survey highlights that raising the awareness of all Europeans in terms of discrimination laws is a matter of high importance. With the clouds of recession hanging over many European economies, it is encouraging to see the progress that the European Union has made in a number of ways when it comes to reducing discrimination. This report does, however, point to an immediate challenge in that discrimination on the grounds of age and disability is perceived as being more widespread than last year. Encouragingly, the data has also begun to reveal the social mechanism by which such discrimination may be resolved—the social circle and the role of education and awareness raising. Efforts and policies that seek to work with this reality will no doubt go some way to ensuring that the other major finding of this report—that Europeans largely believe that the economic crisis will reduce the efforts made to combat discrimination—will remain largely that, expectations.


ANNEXES


TECHNICAL SPECIFICATIONS


SP
EC
IAL E
UR
OB
AR
OM
ETER
31
7
“Dis
crim
inati
on
in
th
e E
U in
20
09
”
TEC
HN
ICA
L S
PEC
IFIC
ATIO
NS
Bet
wee
n t
he
25
th o
f M
ay a
nd t
he
17
th o
f Ju
ne
2009,
TNS O
pin
ion &
Soc
ial,
a co
nso
rtiu
m c
reat
ed b
etw
een T
NS p
lc a
nd T
NS o
pin
ion,
carr
ied o
ut
wav
e 71.2
of th
e EU
RO
BARO
METE
R, on
req
ues
t of
the
EU
RO
PEAN
CO
MM
ISSIO
N, D
irec
tora
te-G
ener
al for
Com
munic
atio
n, “R
esea
rch a
nd P
olitic
al A
nal
ysis
”.
The
SPE
CIA
L EU
RO
BARO
METE
R 3
17 is
par
t of
the
wav
e 71.2
and c
over
s th
e pop
ula
tion
of
the
resp
ective
nat
ional
itie
s of
the
Euro
pea
n U
nio
n M
ember
Sta
tes,
res
iden
t in
eac
h o
f th
e M
ember
Sta
tes
and a
ged
15 y
ears
and o
ver.
The
SPE
CIA
L EU
RO
BARO
METE
R 3
17 h
as a
lso
bee
n c
onduct
ed in t
he
thre
e ca
ndid
ate
countr
ies
(Cro
atia
, Turk
ey a
nd t
he
Form
er Y
ugos
lav
Rep
ublic
of
Mac
edon
ia).
In t
hes
e co
untr
ies,
the
surv
ey c
over
s th
e nat
ional
pop
ula
tion
of
citize
ns
and t
he
pop
ula
tion
of
citize
ns
of a
ll th
e Euro
pea
n U
nio
n M
ember
Sta
tes
that
are
res
iden
ts in t
hes
e co
untr
ies
and h
ave
a su
ffic
ient
com
man
d o
f th
e nat
ional
lan
guag
es t
o an
swer
the
ques
tion
nai
re.
The
bas
ic s
ample
des
ign a
pplie
d in a
ll st
ates
is
a m
ulti-st
age,
ran
dom
(pro
bab
ility
) on
e. I
n e
ach
countr
y, a
num
ber
of
sam
plin
g p
oints
was
dra
wn w
ith p
robab
ility
pro
por
tion
al t
o pop
ula
tion
siz
e (f
or a
tot
al c
over
age
of t
he
countr
y) a
nd t
o pop
ula
tion
den
sity
. In
ord
er t
o do
so,
the
sam
plin
g p
oints
wer
e dra
wn s
yste
mat
ical
ly f
rom
eac
h o
f th
e "a
dm
inis
trat
ive
regio
nal
units"
, af
ter
stra
tific
atio
n b
y in
div
idual
unit
and t
ype
of a
rea.
They
thus
repre
sent
the
whol
e te
rritor
y of
the
countr
ies
surv
eyed
acc
ordin
g t
o th
e EU
RO
STAT N
UTS I
I (o
r eq
uiv
alen
t) a
nd a
ccor
din
g
to t
he
dis
trib
ution
of
the
resi
den
t pop
ula
tion
of
the
resp
ective
nat
ional
itie
s in
ter
ms
of m
etro
pol
itan
, urb
an a
nd r
ura
l ar
eas.
In e
ach o
f th
e se
lect
ed
sam
plin
g poi
nts
, a
star
ting ad
dre
ss w
as dra
wn,
at ra
ndom
. Fu
rther
ad
dre
sses
(e
very
N
th ad
dre
ss)
wer
e se
lect
ed by
stan
dar
d "r
ando
m ro
ute
" pro
cedure
s, f
rom
the
initia
l ad
dre
ss.
In e
ach h
ouse
hol
d,
the
resp
onden
t w
as d
raw
n,
at r
andom
(fo
llow
ing t
he
"clo
sest
birth
day
rule
").
All
inte
rvie
ws
wer
e co
nduct
ed f
ace-
to-f
ace
in p
eople
's h
omes
and i
n t
he
appro
priat
e nat
ional
lan
guag
e. A
s fa
r as
the
dat
a ca
ptu
re i
s co
nce
rned
, CAPI
(Com
pute
r Ass
iste
d P
erso
nal
Inte
rvie
w)
was
use
d in
thos
e co
untr
ies
wher
e th
is t
echniq
ue
was
ava
ilable
.

AB
BR
EV
IATIO
NS
C
OU
NTR
IES
IN
STIT
UTES
N
°
INT
ER
VIE
WS
FIE
LD
WO
RK
D
ATES
P
OP
ULA
TIO
N
15
+
BE
Bel
giu
m
TN
S D
imar
so
1.0
00
29/0
5/2
009
17/0
6/2
009
8.7
86.8
05
BG
Bulg
aria
TN
S B
BSS
1.0
09
29/0
5/2
009
8/0
6/2
009
6.6
47.3
75
CZ
Cze
ch R
ep.
TN
S A
isa
1.0
33
29/0
5/2
009
14/0
6/2
009
8.5
71.7
10
DK
Den
mar
k TN
S G
allu
p D
K
1.0
01
25/0
5/2
009
17/0
6/2
009
4.4
32.9
31
DE
Ger
man
y TN
S I
nfr
ates
t 1.5
23
29/0
5/2
009
14/0
6/2
009
64.5
46.0
96
EE
Est
onia
Em
or
1.0
07
29/0
5/2
009
14/0
6/2
009
887.0
94
IE
Irel
and
TN
S M
RBI
1.0
07
29/0
5/2
009
11/0
6/2
009
3.3
75.3
99
EL
Gre
ece
TN
S I
CAP
1.0
00
29/0
5/2
009
14/0
6/2
009
8.6
91.3
04
ES
Spai
n
TN
S D
emosc
opia
1.0
07
29/0
5/2
009
14/0
6/2
009
38.5
36.8
44
FR
Fran
ce
TN
S S
ofr
es
1.0
78
29/0
5/2
009
15/0
6/2
009
46.4
25.6
53
IT
Ital
y TN
S I
nfr
ates
t 1.0
48
29/0
5/2
009
14/0
6/2
009
48.8
92.5
59
CY
Rep
. of Cyp
rus
Syn
ova
te
501
27/0
5/2
009
14/0
6/2
009
638.9
00
LV
Latv
ia
TN
S L
atvi
a 1.0
12
29/0
5/2
009
14/0
6/2
009
1.4
44.8
84
LT
Lith
uan
ia
TN
S G
allu
p L
ithuan
ia
1.0
22
29/0
5/2
009
10/0
6/2
009
2.8
46.7
56
LU
Luxe
mbou
rg
TN
S I
LReS
504
25/0
5/2
009
17/0
6/2
009
388.9
14
HU
H
ungar
y TN
S H
ungar
y 1.0
00
29/0
5/2
009
13/0
6/2
009
8.3
20.6
14
MT
Mal
ta
MIS
CO
500
29/0
5/2
009
13/0
6/2
009
335.4
76
NL
Net
her
lands
TN
S N
IPO
1.0
79
28/0
5/2
009
16/0
6/2
009
13.0
17.6
90
AT
Aust
ria
Öst
erre
ichis
ches
Gal
lup-I
nst
itut
1.0
01
29/0
5/2
009
11/0
6/2
009
7.0
04.2
05
PL
Pola
nd
TN
S O
BO
P
1.0
00
29/0
5/2
009
16/0
6/2
009
32.1
55.8
05
PT
Port
ugal
TN
S E
URO
TESTE
1.0
20
29/0
5/2
009
16/0
6/2
009
8.0
80.9
15
RO
Rom
ania
TN
S C
SO
P 1.0
23
29/0
5/2
009
11/0
6/2
009
18.2
46.7
31
SI
Slo
venia
RM
PLU
S
1.0
22
28/0
5/2
009
12/0
6/2
009
1.7
29.2
98
SK
Slo
vaki
a TN
S A
ISA S
K
1.0
37
29/0
5/2
009
17/0
6/2
009
4.3
16.4
38
FI
Finla
nd
TN
S G
allu
p O
y 999
29/0
5/2
009
15/0
6/2
009
4.3
53.4
95
SE
Sw
eden
TN
S G
ALL
UP
1.0
06
29/0
5/2
009
13/0
6/2
009
7.5
62.2
63
UK
United
Kin
gdom
TN
S U
K
1.3
17
29/0
5/2
009
15/0
6/2
009
50.5
19.8
77
HR
Cro
atia
Puls
1.0
00
28/0
5/2
009
14/0
6/2
009
3.7
34.3
00
TR
Turk
ey
TN
S P
IAR
1.0
03
29/0
5/2
009
12/0
6/2
009
47.5
83.8
30
MK
Form
er Y
ugosl
av R
ep.
of M
aced
onia
TN
S B
rim
a 1.0
09
29/0
5/2
009
3/0
6/2
009
1.6
48.0
12
TO
TAL
26.7
56
25/0
5/2
009
17/0
6/2
009
453.7
22.1
73

For
each
cou
ntr
y a
com
par
ison
bet
wee
n t
he
sam
ple
and t
he
univ
erse
was
car
ried
out.
The
Univ
erse
des
crip
tion
was
der
ived
fro
m E
uros
tat
pop
ula
tion
dat
a or
fro
m n
atio
nal
sta
tist
ics
offic
es.
For
all
countr
ies
surv
eyed
, a
nat
ional
wei
ghting p
roce
dure
, usi
ng m
argin
al a
nd i
nte
rcel
lula
r w
eighting,
was
ca
rrie
d o
ut
bas
ed o
n t
his
Univ
erse
des
crip
tion
. In
all
countr
ies,
gen
der
, ag
e, r
egio
n a
nd s
ize
of loc
ality
wer
e in
trod
uce
d in t
he
iter
atio
n p
roce
dure
. Fo
r in
tern
atio
nal
wei
ghting (
i.e.
EU
ave
rages
), T
NS O
pin
ion &
Soc
ial
applie
s th
e of
ficia
l pop
ula
tion
fig
ure
s as
pro
vided
by
EU
RO
STA
T or
nat
ional
sta
tist
ic
offic
es. The
tota
l pop
ula
tion
fig
ure
s fo
r in
put
in t
his
pos
t-w
eighting p
roce
dure
are
list
ed a
bov
e.
Rea
der
s ar
e re
min
ded
that
surv
ey r
esults
are
estim
atio
ns ,
the
accu
racy
of
whic
h,
ever
ythin
g b
eing e
qual
, re
sts
upon
the
sam
ple
siz
e an
d u
pon
the
obse
rved
per
centa
ge.
W
ith s
ample
s of
abou
t 1,0
00 in
terv
iew
s, t
he
real
per
centa
ges
var
y w
ithin
the
follo
win
g c
onfid
ence
lim
its:
Ob
serv
ed
perc
en
tag
es
10%
or
90%
20%
or
80%
30%
or
70%
40%
or
60%
50%
Con
fid
en
ce lim
its
± 1
.9 p
oints
±
2.5
poi
nts
±
2.7
poi
nts
±
3.0
poi
nts
±
3.1
poi
nts


QUESTIONNAIRE


QE
1Q
E1
Ver
y w
ide
spre ad
Fairl y
wid
esp
re ad
Fairl y rare
Ver
y ra
reN
on-
exis
ten
t (S
PO
NT
AN
EO
US )
DK
Très
ré
pand
u
Plu
tô t ré
pand
u
Plu
tôt r
are
Très
ra
reIn
exi
stan
t (S
PO
NT
AN
E )
NS
P
(434)
11
23
45
6(434)
11
23
45
6(435)
21
23
45
6(435)
21
23
45
6
(436)
31
23
45
6(436)
31
23
45
6
(437)
41
23
45
6(437)
41
23
45
6(438)
51
23
45
6(438)
51
23
45
6(439)
61
23
45
6(439)
61
23
45
6D
’un
hand
icap
EB
69.1
QA
1 TR
EN
D M
OD
IFIE
D
Du
sexe
De
l’orie
ntat
ion
sexu
elle
(par
exe
mpl
e êt
re
hom
osex
uel o
u le
sbie
nne)
(M)
De
l’âge
De
la re
ligio
n ou
des
con
vict
ions
Pou
r cha
cun
des
type
s de
dis
crim
inat
ion
suiv
ants
, dite
s-m
oi s
i, se
lon
vous
, il s
’agi
t de
quel
que
chos
e de
très
répa
ndu,
ass
ez ré
pand
u, p
lutô
t rar
e ou
très
rare
en
(NO
TRE
PA
YS
). D
es d
iscr
imin
atio
ns s
ur b
ase
…
(MO
NTR
ER
CA
RTE
AV
EC
EC
HE
LLE
– U
NE
RE
PO
NS
E P
AR
LIG
NE
)
(LIR
E –
RO
TATI
ON
)
De
l’orig
ine
ethn
ique
Par
lons
d'u
n au
tre s
ujet
.
PO
SE
R Q
E E
N U
E27
+ H
R +
TR
+ M
K
Dis
abili
ty
EB
69.1
QA
1 TR
EN
D M
OD
IFIE
D
Gen
der
Sex
ual o
rient
atio
n (fo
r exa
mpl
e be
ing
gay
or
lesb
ian)
(M)
Age
Rel
igio
n or
bel
ief (
M)
For e
ach
of th
e fo
llow
ing
type
s of
dis
crim
inat
ion,
cou
ld y
ou p
leas
e te
ll m
e w
heth
er, i
n yo
ur
opin
ion,
it is
ver
y w
ides
prea
d, fa
irly
wid
espr
ead,
fairl
y ra
re o
r ver
y ra
re in
(OU
R C
OU
NTR
Y)?
D
iscr
imin
atio
n on
the
basi
s of
…
(SH
OW
CA
RD
WIT
H S
CA
LE –
ON
E A
NS
WE
R P
ER
LIN
E)
(RE
AD
OU
T –
RO
TATE
)
Eth
nic
orig
in
Let's
talk
abo
ut a
noth
er to
pic.
AS
K Q
E T
O E
U27
+ H
R +
TR
+ M
K
Dis
crim
inat
ion
is u
nder
stoo
d to
mea
n w
hen
a pe
rson
or g
roup
is tr
eate
d le
ss fa
vour
ably
than
ot
hers
bec
ause
of s
peci
fic p
erso
nal c
hara
cter
istic
s.
Que
stio
nnai
reE
B71
225
/57
13/0
5/20
09

QE
2Q
E2
(440)
1(440)
1(441)
2(441)
2
(442)
3
(442)
3
(443)
4(443)
4
(444)
5(444)
5
(445)
6(445)
6
EB
69.1
QA
2 TR
EN
D M
OD
IFIE
D
45
D’u
n ha
ndic
ap1
23
45
De
la re
ligio
n ou
des
co
nvic
tions
(M)
12
3
45
De
l’âge
12
34
5
De
l’orie
ntat
ion
sexu
elle
(par
ex
empl
e êt
re h
omos
exue
l ou
lesb
ienn
e) (M
)
12
3
45
Du
sexe
12
34
5D
e l’o
rigin
e et
hniq
ue
12
3
(MO
NTR
ER
CA
RTE
AV
EC
EC
HE
LLE
– U
NE
RE
PO
NS
E P
AR
LIG
NE
)
(LIR
E –
RO
TATI
ON
)B
eauc
oup
plus
ré
pand
ues
Un
peu
plus
ré
pand
ues
Un
peu
moi
ns
répa
ndue
s
Bea
ucou
p m
oins
ré
pand
ues
NS
P
Et d
iriez
-vou
s qu
e, p
ar ra
ppor
t à il
y a
5 a
ns, l
es d
iscr
imin
atio
ns s
uiva
ntes
son
t plu
s ré
pand
ues
ou m
oins
répa
ndue
s en
(NO
TRE
PA
YS
) ? D
es d
iscr
imin
atio
ns s
ur b
ase
…
EB
69.1
QA
2 TR
EN
D M
OD
IFIE
D
45
Dis
abili
ty1
23
45
Rel
igio
n or
bel
ief (
M)
12
3
45
Age
12
34
5
Sex
ual o
rient
atio
n (fo
r ex
ampl
e be
ing
gay
or
lesb
ian)
(M)
12
3
45
Gen
der
12
34
5E
thni
c or
igin
12
3
(SH
OW
CA
RD
WIT
H S
CA
LE –
ON
E A
NS
WE
R P
ER
LIN
E)
(RE
AD
OU
T –
RO
TATE
)Fa
r mor
e w
ides
prea
d
Slig
htly
m
ore
wid
espr
ead
Slig
htly
le
ss
wid
espr
ead
Far l
ess
wid
espr
ead
DK
If yo
u co
mpa
re th
e si
tuat
ion
with
5 y
ears
ago
, wou
ld y
ou s
ay th
at th
e fo
llow
ing
type
s of
di
scrim
inat
ion
are
mor
e co
mm
on o
r les
s co
mm
on in
(OU
R C
OU
NTR
Y)?
Dis
crim
inat
ion
on th
e ba
sis
of…
Que
stio
nnai
reE
B71
226
/57
13/0
5/20
09

QE
3Q
E3
(446-454)
(446-454)
1,1,
2,2,
3,3,
4,4,
5,5,
6,6,
7,7,
8,8,
9,9,
QE
4Q
E4
(455-463)
(455-463)
1,1,
2,2,
3,3,
4,4,
5,5,
6,6,
7,7,
8,8,
9,9,
Non
(M)
NS
P
EB
69.1
QA
4 TR
EN
D M
OD
IFIE
D
De
l’âge
De
la re
ligio
n ou
des
con
vict
ions
D’u
n ha
ndic
apP
our u
ne a
utre
rais
on (M
)
(MO
NTR
ER
CA
RTE
- LI
RE
– P
LUS
IEU
RS
RE
PO
NS
ES
PO
SS
IBLE
S)
De
l’orig
ine
ethn
ique
Du
sexe
De
l’orie
ntat
ion
sexu
elle
NS
P
EB
69.1
QA
3 TR
EN
D M
OD
IFIE
D
Au
cour
s de
s 12
der
nier
s m
ois,
ave
z-vo
us é
té le
tém
oin
d’un
e di
scrim
inat
ion
ou d
u ha
rcèl
emen
t d’u
ne p
erso
nne
à ca
use
de l’
une
ou p
lusi
eurs
des
rais
ons
suiv
ante
s ?
Veu
illez
m
e do
nner
tout
es le
s ré
pons
es q
ui s
’app
lique
nt à
la s
ituat
ion.
De
la re
ligio
n ou
des
con
vict
ions
D’u
n ha
ndic
apP
our u
ne a
utre
rais
on (
M)
Non
(M)
De
l’orig
ine
ethn
ique
Du
sexe
De
l’orie
ntat
ion
sexu
elle
De
l’âge
Au
cour
s de
s 12
der
nier
s m
ois,
vou
s êt
es-v
ous
pers
onne
llem
ent s
enti(
e) d
iscr
imin
é(e)
ou
harc
elé(
e) à
cau
se d
e l’u
ne o
u pl
usie
urs
des
rais
ons
suiv
ante
s ?
S'a
giss
ait-i
l d'u
ne
disc
rimin
atio
n ou
d'u
n ha
rcèl
emen
t sur
bas
e ...
? V
euill
ez m
e do
nner
tout
es le
s ré
pons
es q
ui
s’ap
pliq
uent
à la
situ
atio
n.
(NE
PA
S L
IRE
– M
ON
TRE
R C
AR
TE A
VE
C L
ETT
RE
S –
PLU
SIE
UR
S R
EP
ON
SE
S
PO
SS
IBLE
S)
No
(M)
DK
EB
69.1
QA
4 TR
EN
D M
OD
IFIE
D
Age
Rel
igio
n or
bel
ief
Dis
abili
tyFo
r ano
ther
reas
on (M
)
(SH
OW
CA
RD
- R
EA
D O
UT
- MU
LTIP
LE A
NS
WE
RS
PO
SS
IBLE
)
Eth
nic
orig
inG
ende
rS
exua
l orie
ntat
ion
DK
EB
69.1
QA
3 TR
EN
D M
OD
IFIE
D
In th
e pa
st 1
2 m
onth
s, h
ave
you
witn
esse
d so
meo
ne b
eing
dis
crim
inat
ed a
gain
st o
r har
asse
d on
the
basi
s of
one
or m
ore
of th
e fo
llow
ing
grou
nds?
Ple
ase
tell
me
all t
hat a
pply
.
Rel
igio
n or
bel
ief
Dis
abili
tyFo
r ano
ther
reas
on (M
)N
o (M
)
Eth
nic
orig
inG
ende
rS
exua
l orie
ntat
ion
Age
In th
e pa
st 1
2 m
onth
s ha
ve y
ou p
erso
nally
felt
disc
rimin
ated
aga
inst
or h
aras
sed
on th
e ba
sis
of o
ne o
r mor
e of
of t
he fo
llow
ing
grou
nds?
Ple
ase
tell
me
all t
hat a
pply
.
(DO
NO
T R
EA
D O
UT
– S
HO
W C
AR
D W
ITH
LE
TTE
RS
– M
ULT
IPLE
AN
SW
ER
S P
OS
SIB
LE)
Que
stio
nnai
reE
B71
227
/57
13/0
5/20
09

QE
5Q
E5
(464-478)
(464-478)
1,1,
2,2,
3,3,
4,4,
5,5,
6,6,
7,7,
8,8,
9,9,
10,
10,
11,
11,
12,
12,
13,
13,
14,
14,
15,
15,
NS
P
EB
69.1
QA
7 TR
EN
D M
OD
IFIE
D
Le lo
ok, l
a fa
çon
de s
’hab
iller
ou
de s
e pr
ésen
ter d
u ca
ndid
atL’
appa
renc
e ph
ysiq
ue g
énér
ale
du c
andi
dat (
taill
e, p
oids
, vis
age,
etc
.) A
utre
s (S
PO
NTA
NE
) (M
)A
ucun
de
ceux
-là (S
PO
NTA
NE
) (M
)
L’âg
e du
can
dida
tL’
exis
tenc
e d’
un h
andi
cap
L’ex
pres
sion
d’u
ne c
onvi
ctio
n re
ligie
use
(par
exe
mpl
e le
por
t d’u
n si
gne
relig
ieux
vis
ible
)Le
fait
que
le c
andi
dat f
ume
ou p
as
La fa
çon
de p
arle
r, l’a
ccen
t du
cand
idat
La c
oule
ur d
e pe
au o
u l’o
rigin
e et
hniq
ue d
u ca
ndid
atLe
sex
e du
can
dida
tL'
orie
ntat
ion
sexu
elle
du
cand
idat
(par
exe
mpl
e êt
re h
omos
exue
l ou
lesb
ienn
e) (M
)
En
(NO
TRE
PA
YS
), lo
rsqu
’une
ent
repr
ise
cher
che
à em
bauc
her q
uelq
u’un
et q
u’el
le a
le
choi
x en
tre d
eux
cand
idat
s de
com
péte
nces
et d
e qu
alifi
catio
ns é
gale
s, q
uels
son
t, da
ns la
lis
te s
uiva
nte,
tous
les
critè
res
qui,
selo
n vo
us, p
euve
nt d
éfav
oris
er u
n ca
ndid
at ?
(MO
NTR
ER
CA
RTE
– L
IRE
– R
OTA
TIO
N –
PLU
SIE
UR
S R
EP
ON
SE
S P
OS
SIB
LES
)
Le n
om d
u ca
ndid
atL’
adre
sse
du c
andi
dat
DK
EB
69.1
QA
7 TR
EN
D M
OD
IFIE
D
The
cand
idat
e’s
look
, dre
ss-s
ense
or p
rese
ntat
ion
The
cand
idat
e’s
gene
ral p
hysi
cal a
ppea
ranc
e (s
ize,
wei
ght,
face
, etc
.) O
ther
s (S
PO
NTA
NE
OU
S) (
M)
Non
e of
thos
e (S
PO
NTA
NE
OU
S) (
M)
The
cand
idat
e's
age
A d
isab
ility
The
expr
essi
on o
f a re
ligio
us b
elie
f (fo
r exa
mpl
e w
earin
g a
visi
ble
relig
ious
sy
mbo
l)W
heth
er th
e ca
ndid
ate
is a
sm
oker
or n
ot
The
cand
idat
e’s
way
of s
peak
ing,
his
or h
er a
ccen
tTh
e ca
ndid
ate’
s sk
in c
olou
r or e
thni
c or
igin
The
cand
idat
e’s
gend
erTh
e ca
ndid
ate’
s se
xual
orie
ntat
ion
(for e
xam
ple,
bei
ng g
ay o
r les
bian
)
In (O
UR
CO
UN
TRY
), w
hen
a co
mpa
ny w
ants
to h
ire s
omeo
ne a
nd h
as th
e ch
oice
bet
wee
n tw
o ca
ndid
ates
with
equ
al s
kills
and
qua
lific
atio
ns, w
hich
of t
he fo
llow
ing
crite
ria m
ay, i
n yo
ur
opin
ion,
put
one
can
dida
te a
t a d
isad
vant
age?
(SH
OW
CA
RD
– R
EA
D O
UT
– R
OTA
TE –
MU
LTIP
LE A
NS
WE
RS
PO
SS
IBLE
)
The
cand
idat
e’s
nam
eTh
e ca
ndid
ate’
s ad
dres
s
Que
stio
nnai
reE
B71
228
/57
13/0
5/20
09

QE
6Q
E6
1 V
ery
unco
mfo
rtab
le
23
45
67
89
10
Tota
lly
co
mf
orta
ble
Indi
ffer
ent
(SP
ON
TA
NE
OU
S )
DK
1 Tr
ès
mal
à
l’ais
e
23
45
67
89
10
Tout
à
fait
à l’a
ise
Indi
ffér
ent
(SP
ON
TA
NE )
NS
P
(479-480)
11
23
45
67
89
1011
12(479-480)
11
23
45
67
89
1011
12
(481-482)
21
23
45
67
89
1011
12
(481-482)
21
23
45
67
89
1011
12
(483-484)
31
23
45
67
89
1011
12
(483-484)
31
23
45
67
89
1011
12
(485-486)
41
23
45
67
89
1011
12
(485-486)
41
23
45
67
89
1011
12
(487-488)
51
23
45
67
89
1011
12
(487-488)
51
23
45
67
89
1011
12
(489-490)
61
23
45
67
89
1011
12(489-490)
61
23
45
67
89
1011
12
(491-492)
71
23
45
67
89
1011
12
(491-492)
71
23
45
67
89
1011
12U
ne p
erso
nne
âgée
de
plus
de
75 a
ns
EB
69.1
QA
8
Une
per
sonn
e d’
une
orig
ine
ethn
ique
di
ffére
nte
de la
m
ajor
ité d
e la
po
pula
tion
Une
per
sonn
e âg
ée d
e m
oins
de
30
ans
Une
per
sonn
e d’
une
relig
ion
diffé
rent
e de
la
maj
orité
de
la
popu
latio
nU
ne p
erso
nne
hand
icap
ée
(MO
NTR
ER
CA
RTE
AV
EC
EC
HE
LLE
- U
NE
RE
PO
NS
E P
AR
LIG
NE
) - (S
I NE
CE
SS
AIR
E,
EX
PLI
QU
ER
AU
RE
PO
ND
AN
T Q
U'IL
S'A
GIR
AIT
DU
PR
ES
IDE
NT\
PR
EM
IER
MIN
ISTR
E\
CH
AN
CE
LIE
R, E
TC.,
SE
LON
LE
CO
NTE
XTE
NA
TIO
NA
L)
(LIR
E –
R
OTA
TIO
N )
Une
fem
me
Un
hom
osex
uel
(un
hom
me
hom
osex
uel o
u un
e fe
mm
e le
sbie
nne)
Et s
ur u
ne é
chel
le d
e 1
à 10
, pou
rrie
z-vo
us m
e di
re c
e qu
e vo
us re
ssen
tirie
z si
une
per
sonn
e ap
parte
nant
à c
hacu
ne d
es c
atég
orie
s su
ivan
tes
étai
t élu
e au
plu
s ha
ut p
oste
pol
itiqu
e en
(N
OTR
E P
AY
S).
A p
erso
n ag
ed
over
75
EB
69.1
QA
8
A p
erso
n fro
m a
di
ffere
nt e
thni
c or
igin
than
the
maj
ority
of t
he
popu
latio
n
A p
erso
n ag
ed
unde
r 30
A p
erso
n fro
m a
di
ffere
nt re
ligio
n th
an th
e m
ajor
ity
of th
e po
pula
tion
A d
isab
led
pers
on
(SH
OW
CA
RD
WIT
H S
CA
LE -
ON
E A
NS
WE
R P
ER
LIN
E) -
(IF
NE
CE
SS
AR
Y, E
XP
LAIN
TO
TH
E R
ES
PO
ND
EN
T TH
AT
THIS
WO
ULD
BE
TH
E P
RE
SID
EN
T\ P
RIM
E M
INIS
TER
\ C
HA
NC
ELL
OR
, ETC
. AS
RE
LEV
AN
T IN
YO
UR
NA
TIO
NA
L C
ON
TEX
T)
(RE
AD
OU
T –
RO
TATE
)
A w
oman
A h
omos
exua
l (g
ay m
an o
r le
sbia
n w
oman
)
And
usi
ng a
sca
le fr
om 1
to 1
0, p
leas
e te
ll m
e ho
w y
ou w
ould
feel
abo
ut h
avin
g so
meo
ne fr
om
each
of t
he fo
llow
ing
cate
gorie
s in
the
high
est e
lect
ed p
oliti
cal p
ositi
on in
(OU
R C
OU
NTR
Y)?
Que
stio
nnai
reE
B71
229
/57
13/0
5/20
09

QE
7Q
E7
(493)
1(493)
1(494)
2(494)
2
(495)
3(495)
3
(496)
4(496)
4
(497)
5(497)
5
(498)
6(498)
6
EB
69.1
QA
9 TR
EN
D M
OD
IFIE
D
45
D'u
n ha
ndic
ap1
23
45
De
la re
ligio
n ou
des
co
nvic
tions
(M)
12
3
45
De
l'âge
12
34
5
De
l'orie
ntat
ion
sexu
elle
(M)
12
3
45
Du
sexe
12
34
5D
e l'o
rigin
e et
hniq
ue
12
3
(MO
NTR
ER
CA
RTE
AV
EC
EC
HE
LLE
– U
NE
SE
ULE
RE
PO
NS
E P
AR
LIG
NE
)
(LIR
E –
RO
TATI
ON
)To
ut à
fait
favo
rabl
eP
lutô
t fa
vora
ble
Plu
tôt
oppo
sé(e
)To
ut à
fait
oppo
sé(e
)N
SP
Ser
iez-
vous
favo
rabl
e ou
opp
osé(
e) à
la m
ise
en p
lace
de
mes
ures
spé
cial
es d
estin
ées
à do
nner
des
cha
nces
éga
les
à to
us d
ans
le d
omai
ne d
e l’e
mpl
oi ?
Des
mes
ures
com
me,
par
ex
empl
e, d
es p
rogr
amm
es d
e fo
rmat
ion
spéc
iaux
ou
proc
essu
s de
sél
ectio
n et
recr
utem
ent
adap
tés
à de
s pe
rson
nes
en fo
nctio
n …
?
EB
69.1
QA
9 TR
EN
D M
OD
IFIE
D
45
Dis
abili
ty1
23
45
Rel
igio
n or
bel
ief (
M)
12
3
45
Age
12
34
5
Sex
ual o
rient
atio
n (M
)1
23
45
Gen
der
12
34
5E
thni
c or
igin
12
3
(SH
OW
CA
RD
WIT
H S
CA
LE –
ON
E A
NS
WE
R P
ER
LIN
E)
(RE
AD
OU
T –
RO
TATE
)To
tally
in
favo
urS
omew
hat
in fa
vour
Som
ewha
t op
pose
dTo
tally
op
pose
dD
K
Wou
ld y
ou b
e in
favo
ur o
f or o
ppos
ed to
spe
cific
mea
sure
s be
ing
adop
ted
to p
rovi
de e
qual
op
portu
nitie
s fo
r eve
ryon
e in
the
field
of e
mpl
oym
ent?
Mea
sure
s su
ch a
s, fo
r exa
mpl
e sp
ecia
l tra
inin
g sc
hem
es o
r ada
pted
sel
ectio
n an
d re
crui
tem
ent p
roce
sses
, for
peo
ple
depe
ndin
g on
th
eir..
.
Que
stio
nnai
reE
B71
230
/57
13/0
5/20
09

QE
8Q
E8
(499)
1
(499)
1
(500)
2
(500)
24
5
EB
69.1
QA
10
Sur
veill
ance
des
pro
cédu
res
de re
crut
emen
t pou
r s’
assu
rer q
ue le
s ca
ndid
ats
issu
s de
min
orité
s et
hniq
ues
ont a
utan
t de
chan
ces
d’êt
re
invi
tés
à de
s en
tretie
ns o
u em
bauc
hés
que
d’au
tres
cand
idat
s à
com
péte
nces
et
qual
ifica
tions
éga
les
12
3
Vou
s êt
es
tout
à fa
it op
posé
(e)
NS
P
Sur
veill
ance
de
la
com
posi
tion
de l’
ense
mbl
e de
s em
ploy
és p
our é
valu
er
la re
prés
enta
tion
des
pers
onne
s is
sues
de
min
orité
s et
hniq
ues
12
34
5
(LIR
E –
RO
TATI
ON
)V
ous
sout
enez
to
ut à
fait
Vou
s so
uten
ez
plut
ôt
Vou
s êt
es
plut
ôt
oppo
sé(e
)
Dan
s qu
elle
mes
ure
sout
enez
-vou
s ou
vou
s op
pose
z-vo
us a
ux m
esur
es s
uiva
ntes
sur
le li
eu
de tr
avai
l ?
(MO
NTR
ER
CA
RTE
AV
EC
EC
HE
LLE
- U
NE
RE
PO
NS
E P
AR
LIG
NE
)
45
EB
69.1
QA
10
Mon
itorin
g th
e re
crui
tmen
t pr
oced
ures
to e
nsur
e th
at
cand
idat
es fr
om e
thni
c m
inor
ities
hav
e th
e sa
me
chan
ce o
f bei
ng s
elec
ted
for
inte
rvie
w o
r hire
d as
oth
er
cand
idat
es w
ith s
imila
r ski
lls
and
qual
ifica
tions
12
3
Tota
lly
oppo
seD
K
Mon
itorin
g th
e co
mpo
sitio
n of
the
wor
k-fo
rce
to e
valu
ate
the
repr
esen
tatio
n of
peo
ple
from
eth
nic
min
oriti
es
12
34
5
(RE
AD
OU
T –
RO
TATE
)To
tally
su
ppor
t S
omew
hat
supp
ort
Som
ewha
t op
pose
To w
hat e
xten
t do
you
supp
ort o
r opp
ose
the
follo
win
g in
the
wor
k pl
ace?
(SH
OW
CA
RD
WIT
H S
CA
LE -
ON
E A
NS
WE
R P
ER
LIN
E)
Que
stio
nnai
reE
B71
231
/57
13/0
5/20
09

QE
9Q
E9
(501)
(501)
11
22
33
44
55
QE
10Q
E10
(502)
(502)
11
22
33
44
Non
Cel
a dé
pend
(SP
ON
TAN
E)
NS
P
EB
69.1
QA
12
Con
nais
sez-
vous
vos
dro
its s
i vou
s fa
ites
l’obj
et d
’une
dis
crim
inat
ion
ou d
’un
harc
èlem
ent ?
(LIR
E)
Oui
Non
, plu
tôt p
asN
on, p
as d
u to
utN
SP
EB
69.1
QA
11
D’u
ne m
aniè
re g
énér
ale,
diri
ez-v
ous
que
l’on
fait
suffi
sam
men
t d’e
fforts
en
(NO
TRE
PA
YS
) po
ur lu
tter c
ontre
tout
e fo
rme
de d
iscr
imin
atio
n ?
(MO
NTR
ER
CA
RTE
– L
IRE
– U
NE
SE
ULE
RE
PO
NS
E)
Oui
, tou
t à fa
it O
ui, p
lutô
t
No
That
dep
ends
(SP
ON
TAN
EO
US
)D
K
EB
69.1
QA
12
Do
you
know
you
r rig
hts
if yo
u ar
e th
e vi
ctim
of d
iscr
imin
atio
n or
har
assm
ent?
(RE
AD
OU
T)
Yes
No,
not
real
lyN
o, d
efin
itely
not
DK
EB
69.1
QA
11
In g
ener
al, w
ould
you
say
that
eno
ugh
effo
rt is
mad
e in
(OU
R C
OU
NTR
Y) t
o fig
ht a
ll fo
rms
of
disc
rimin
atio
n?
(SH
OW
CA
RD
– R
EA
D O
UT
– O
NE
AN
SW
ER
ON
LY)
Yes
, def
inite
lyY
es, t
o so
me
exte
nt
Que
stio
nnai
reE
B71
232
/57
13/0
5/20
09

QE
11Q
E11
(503)
1(503)
1(504)
2(504)
2(505)
3(505)
3(506)
4(506)
4
(507)
5(507)
5
(508)
6(508)
6
QE
12Q
E12
(509)
(509)
11
22
33
44
55
NS
P
NE
W
Oui
, tou
t à fa
itO
ui, p
lutô
tN
on, p
lutô
t pas
Non
, pas
du
tout
NE
W
Pen
sez-
vous
que
, en
rais
on d
e la
cris
e éc
onom
ique
, les
pol
itiqu
es e
ncou
rage
ant l
’éga
lité
et la
di
vers
ité e
n (N
OTR
E P
AY
S) v
ont ê
tre c
onsi
déré
es c
omm
e m
oins
impo
rtant
es e
t don
c re
cevo
ir m
oind
de
fond
s ?
(LIR
E –
UN
E S
EU
LE R
EP
ON
SE
)
45
D'u
n ha
ndic
ap1
23
45
De
la re
ligio
n ou
des
co
nvic
tions
12
3
45
De
l’âge
12
34
5D
e l’o
rient
atio
n se
xuel
le1
23
45
De
l’âge
12
34
5D
e l'o
rigin
e et
hniq
ue
12
3
Pen
sez-
vous
que
la d
iver
sité
est
suf
fisam
men
t rep
rése
ntée
dan
s le
s m
édia
, en
ce q
ui
conc
erne
… ?
(MO
NTR
ER
CA
RTE
AV
EC
EC
HE
LLE
– U
NE
RE
PO
NS
E P
AR
LIG
NE
)
(LIR
E –
RO
TATI
ON
)O
ui, t
out à
fa
itO
ui, p
lutô
tN
on, p
lutô
t pa
sN
on, p
as
du to
utN
SP
DK
NE
W
Yes
, def
inite
lyY
es, t
o so
me
exte
ntN
o, n
ot re
ally
No,
def
inite
ly n
ot
NE
W
Do
you
thin
k th
at d
ue to
the
econ
omic
al c
risis
the
polic
ies
prom
otin
g eq
ualit
y an
d di
vers
ity in
(O
UR
CO
UN
TRY
), w
ill b
e co
nsid
ered
less
impo
rtant
and
rece
ive
less
fund
ing?
(RE
AD
OU
T –
ON
E A
NS
WE
R O
NLY
)
45
Dis
abili
ty1
23
45
Rel
igio
n an
d be
lief
12
3
45
Age
12
34
5S
exua
l orie
ntat
ion
12
3
45
Gen
der
12
34
5E
thni
c or
igin
12
3
Do
you
thin
k th
at d
iver
sity
is s
uffic
ient
ly re
flect
ed in
the
med
ia, i
n te
rms
of…
?
(SH
OW
CA
RD
WIT
H S
CA
LE –
ON
E A
NS
WE
R P
ER
LIN
E)
(RE
AD
OU
T –
RO
TATE
)Y
es,
defin
itely
Yes
, to
som
e ex
tent
No,
not
re
ally
No,
de
finite
ly
not
DK
Que
stio
nnai
reE
B71
233
/57
13/0
5/20
09

QE
13Q
E13
(510)
1(510)
1(511)
2(511)
2(512)
3(512)
3(513)
4(513)
4
(514)
5(514)
5
(515)
6(515)
6
QE
14Q
E14
(516)
1(516)
1(517)
2(517)
2(518)
3(518)
3(519)
4(519)
4
(520)
5(520)
5
(521)
6(521)
64
5
NE
W
Un
hand
icap
12
3
45
La re
ligio
n ou
des
co
nvic
tions
12
34
5L’
âge
12
3
45
L’or
ient
atio
n se
xuel
le1
23
45
L’âg
e1
23
Non
, pas
du
tout
NS
P
L'or
igin
e et
hniq
ue
12
34
5
(LIR
E –
RO
TATI
ON
)O
ui, t
out à
fa
itO
ui, p
lutô
tN
on, p
lutô
t pa
s
NE
W
Diri
ez-v
ous
que
l’aug
men
tatio
n de
la d
iver
sité
sur
vot
re li
eu d
e tra
vail
est s
uffis
amm
ent
enco
urag
ée e
n ce
qui
con
cern
e …
?
(MO
NTR
ER
CA
RTE
AV
EC
EC
HE
LLE
– U
NE
RE
PO
NS
E P
AR
LIG
NE
)
45
D'u
n ha
ndic
ap1
23
45
De
la re
ligio
n ou
des
co
nvic
tions
12
3
45
De
l’âge
12
34
5D
e l’o
rient
atio
n se
xuel
le1
23
45
De
l’âge
12
34
5D
e l'o
rigin
e et
hniq
ue
12
3
MO
NTR
ER
CA
RTE
AV
EC
EC
HE
LLE
– U
NE
RE
PO
NS
E P
AR
LIG
NE
)
(LIR
E –
RO
TATI
ON
)O
ui, t
out à
fa
itO
ui, p
lutô
tN
on, p
lutô
t pa
sN
on, p
as
du to
utN
SP
Pen
sez-
vous
que
la c
rise
écon
omiq
ue v
a co
ntrib
uer à
l’au
gmen
tatio
n de
la d
iscr
imin
atio
n su
r ba
se …
sur
le m
arch
é de
l’em
ploi
?
45
NE
W
Dis
abili
ty1
23
45
Rel
igio
n an
d be
lief
12
34
5A
ge1
23
45
Sex
ual o
rient
atio
n1
23
45
Gen
der
12
3
No,
de
finite
ly
not
DK
Eth
nic
orig
in1
23
45
(RE
AD
OU
T –
RO
TATE
)Y
es,
defin
itely
Yes
, to
som
e ex
tent
No,
not
re
ally
NE
W
Do
you
thin
k th
at e
noug
h is
bei
ng d
one
to in
crea
se d
iver
sity
in y
our w
ork
plac
e as
far a
s… is
co
ncer
ned?
(SH
OW
CA
RD
WIT
H S
CA
LE –
ON
E A
NS
WE
R P
ER
LIN
E)
45
Dis
abili
ty1
23
45
Rel
igio
n an
d be
lief
12
3
45
Age
12
34
5S
exua
l orie
ntat
ion
12
3
45
Gen
der
12
34
5E
thni
c or
igin
12
3
(SH
OW
CA
RD
WIT
H S
CA
LE –
ON
E A
NS
WE
R P
ER
LIN
E)
(RE
AD
OU
T –
RO
TATE
)Y
es,
defin
itely
Yes
, to
som
e ex
tent
No,
not
re
ally
No,
de
finite
ly
not
DK
Do
you
thin
k th
at th
e ec
onom
ical
cris
is w
ill c
ontri
bute
to a
n in
crea
se o
f dis
crim
inat
ion
on th
e ba
sis
of…
in th
e la
bour
mar
ket?
Que
stio
nnai
reE
B71
234
/57
13/0
5/20
09

QE
15a
QE
15a
QE
15b
QE
15b
QE
15c
QE
15c
(522)
(523)
(524)
(522)
(523)
(524)
QE
16Q
E16
(525)
1(525)
1
(526)
2(526)
2(527)
3(527)
3(528)
4(528)
4
(529)
5(529)
5
EB
69.1
D47
D’u
ne re
ligio
n ou
de
conv
ictio
ns d
iffér
ente
s de
s vô
tres
12
3A
ttein
t(e)s
d'u
n ha
ndic
ap
12
3H
omos
exue
l(le)
s 1
23
Rom
s 1
23
D’u
ne a
utre
orig
ine
ethn
ique
que
la v
ôtre
12
3
NE
W
Ave
z-vo
us d
es a
mis
ou
des
rela
tions
… ?
(UN
E R
EP
ON
SE
PA
R L
IGN
E)
(LIR
E)
Oui
Non
NS
P
NS
P8
88
Aut
re (S
PO
NTA
NE
)7
77
A la
pol
ice
66
6A
un
avoc
at5
55
A u
n or
gani
sme
pour
l’ég
alité
des
cha
nces
(SP
EC
IFIE
R
EN
FO
NC
TIO
N D
U P
AY
S)
44
4A
ux tr
ibun
aux
33
3A
des
ON
G –
ass
ocia
tions
22
2
EN
P
RE
MIE
RE
T E
NS
UIT
EE
T E
NFI
N
A d
es s
yndi
cats
11
1
(LIR
E –
RO
TATI
ON
)Q
E15
aQ
E15
bQ
E15
c
Au
cas
où v
ous
serie
z vi
ctim
e de
dis
crim
inat
ion
ou d
e ha
rcèl
emen
t, à
qui p
réfè
rerie
z-vo
us
vous
adr
esse
r ? E
n pr
emie
r ?
Et e
nsui
te ?
Et e
nfin
?
(UN
E R
EP
ON
SE
PA
R C
OLO
NN
E)
EB
69.1
D47
Of a
diff
eren
t rel
igio
n or
hav
e di
ffere
nt b
elie
fs th
an
you
12
3D
isab
led
12
3H
omos
exua
l1
23
Rom
a1
23
Peo
ple
who
se e
thni
c or
igin
is d
iffer
ent f
rom
you
rs1
23
NE
W
Do
you
have
frie
nds
or a
cqua
inta
nces
who
are
…?
(ON
E A
NS
WE
R P
ER
LIN
E)
(RE
AD
OU
T)Y
esN
oD
K
DK
88
8O
ther
(SP
ON
TAN
EO
US
)7
77
Pol
ice
66
6La
wye
r5
55
Bod
y fo
r the
pro
mot
ion
of e
qual
trea
tmen
t (S
PE
CIF
Y T
HE
N
AM
E A
CC
OR
DIN
G T
HE
CO
UN
TRY
)4
44
Trib
unal
s3
33
NG
O's
- as
soci
atio
ns2
22
FIR
STL
YA
ND
TH
EN
AN
D
FIN
ALL
Y
Trad
e U
nion
s1
11
(RE
AD
OU
T –
RO
TATE
)Q
E15
aQ
E15
bQ
E15
c
In c
ase
you
are
the
vict
im o
f dis
crim
inat
ion
or h
aras
smen
t, to
who
m w
ould
you
pre
fer t
o re
port
your
cas
e? F
irstly
?
And
then
?
And
fina
lly?
(ON
E A
NS
WE
R P
ER
CO
LUM
N)
Que
stio
nnai
reE
B71
235
/57
13/0
5/20
09

QE
17Q
E17
(530-536)
(530-536)
1,1,
2,2,
3,3,
4,4,
5,5,
6,6,
7,7,
QE
17o
QE
17o
52
(537,538-547)
52
(537,538-547)
NE
W
PO
SE
R Q
E17
o S
I "U
N A
UTR
E G
RO
UP
E M
INO
RIT
AIR
E",
CO
DE
6 E
N Q
E17
- LE
S A
UTR
ES
A
LLE
R E
N Q
E18
Que
l(s) a
utre
(s)?
(NO
TER
EN
CLA
IR -
CO
DE
R A
U B
UR
EA
U)
Auc
un d
’ent
re e
ux (S
PO
NTA
NE
)U
n au
tre g
roup
e m
inor
itaire
(SP
ON
TAN
E -
SP
EC
IFIE
R)
NS
P
EB
69.1
D51
Une
min
orité
eth
niqu
eU
ne m
inor
ité re
ligie
use
Une
min
orité
sex
uelle
Une
min
orité
liée
à u
n ha
ndic
ap
Sur
vot
re li
eu d
e ré
side
nce,
con
sidé
rez-
vous
que
vou
s ap
parte
nez
à l’u
n de
s gr
oupe
s su
ivan
ts ?
Veu
illez
m’in
diqu
er to
us c
eux
qui s
’app
lique
nt à
vou
s.
(LIR
E –
RO
TATI
ON
– P
LUS
IEU
RS
RE
PO
NS
ES
PO
SS
IBLE
S)
NE
W
AS
K Q
E17
o IF
"AN
Y O
THE
R M
INO
RIT
Y G
RO
UP
", C
OD
E 6
IN Q
E17
- O
THE
RS
GO
TO
Q
E18
Whi
ch o
ther
(s)?
(WR
ITE
DO
WN
- C
OD
E A
T TH
E O
FFIC
E)
Non
e of
the
abov
e (S
PO
NTA
NE
OU
S)
Any
oth
er m
inor
ity g
roup
(SP
ON
TAN
EO
US
- S
PE
CIF
Y)
DK
EB
69.1
D51
An
ethn
ic m
inor
ityA
relig
ious
min
ority
A s
exua
l min
ority
A m
inor
ity in
term
s of
dis
abili
ty
Whe
re y
ou li
ve, d
o yo
u co
nsid
er y
ours
elf t
o be
par
t of a
ny o
f the
follo
win
g? P
leas
e te
ll m
e al
l th
at a
pply
.
(RE
AD
OU
T –
RO
TATE
– M
ULT
IPLE
AN
SW
ER
S P
OS
SIB
LE)
Que
stio
nnai
reE
B71
236
/57
13/0
5/20
09

D44
D44
(548-549)
(548-549)
11
22
33
44
55
66
77
88
99
1010
1111
1212
1313
QE
18Q
E18
(550)
(550)
11
22
33
EB
69.1
D48
Oui
Non
Ref
us (S
PO
NTA
NE
)
Aut
re (S
PO
NTA
NE
)N
SP
EB
69.1
D44
Sou
ffrez
-vou
s d’
un p
robl
ème
de s
anté
chr
oniq
ue p
hysi
que
ou m
enta
l qui
vou
s gê
ne d
ans
vos
activ
ités
quot
idie
nnes
?
Bou
ddhi
ste
Hin
doui
ste
Ath
éist
eN
on c
roya
nt \
agno
stiq
ue
Aut
re c
hrét
ien
Juif
Mus
ulm
anS
ikh
(NE
PA
S L
IRE
- M
ON
TRE
R C
AR
TE -
LIS
TE P
RE
-CO
DE
E -
UN
E S
EU
LE R
EP
ON
SE
)
Cat
holiq
ueO
rthod
oxe
Pro
test
ant
A T
OU
S
Vou
s-m
ême,
vou
s co
nsid
érez
-vou
s co
mm
e ét
ant .
.. ?
EB
69.1
D48
Yes
No
Ref
usal
(SP
ON
TAN
EO
US
)
Oth
er (S
PO
NTA
NE
OU
S)
DK
EB
69.1
D44
Do
you
suffe
r fro
m a
chr
onic
phy
sica
l or m
enta
l hea
lth p
robl
em w
hich
affe
cts
you
in y
our d
aily
ac
tiviti
es?
Bud
dhis
tH
indu
Ath
eist
Non
bel
ieve
r\Agn
ostic
Oth
er C
hris
tian
Jew
ish
Mus
limS
ikh
(DO
NO
T R
EA
D -
SH
OW
CA
RD
- P
RE
CO
DE
D L
IST
- ON
E A
NS
WE
R O
NLY
)
Cat
holic
Orth
odox
Pro
test
ant
AS
K A
LL
Do
you
cons
ider
you
rsel
f to
be…
?
Que
stio
nnai
reE
B71
237
/57
13/0
5/20
09


TABLES


TO
TA
LV
ery
w
idesp
read
Fair
ly
wid
esp
read
Fair
lyra
reV
ery
rare
No
n-e
xis
ten
t (S
P.)
DK
Wid
esp
read
Rare
EU
27
26
75
61
6%
45
%2
5%
7%
3%
4%
61
%3
2%
BE
10
00
23%
48%
22%
5%
- 2%
71%
27%
BG
10
09
10%
30%
28%
14%
12%
6%
40%
42%
CZ
10
33
15%
42%
32%
7%
2%
2%
57%
39%
DK
10
01
26%
51%
19%
3%
- 1%
77%
22%
D-W
10
92
10%
45%
31%
8%
2%
4%
55%
39%
DE
15
23
11%
43%
32%
8%
2%
4%
54%
40%
D-E
43
111%
37%
35%
9%
- 8%
48%
44%
EE
10
07
8%
33%
30%
13%
12%
4%
41%
43%
IE1
00
710%
36%
26%
18%
4%
6%
46%
44%
EL
10
00
26%
45%
19%
9%
1%
- 71%
28%
ES
10
07
15%
51%
23%
8%
1%
2%
66%
31%
FR1
07
825%
54%
15%
1%
- 5%
79%
16%
IT1
04
818%
53%
19%
5%
1%
4%
71%
24%
CY
50
119%
51%
20%
8%
1%
1%
70%
28%
LV1
01
25%
29%
34%
16%
11%
5%
34%
50%
LT1
02
24%
22%
34%
23%
10%
7%
26%
57%
LU5
04
11%
35%
38%
10%
1%
5%
46%
48%
HU
10
00
33%
46%
15%
3%
1%
2%
79%
18%
MT
50
037%
40%
14%
3%
1%
5%
77%
17%
NL
10
79
28%
52%
15%
3%
- 2%
80%
18%
AT
10
01
15%
48%
23%
6%
3%
5%
63%
29%
PL1
00
05%
28%
37%
13%
9%
8%
33%
50%
PT1
02
09%
48%
28%
6%
4%
5%
57%
34%
RO
10
23
11%
35%
23%
14%
10%
7%
46%
37%
SI
10
22
11%
39%
33%
11%
3%
3%
50%
44%
SK
10
37
10%
39%
36%
11%
1%
3%
49%
47%
FI9
99
12%
60%
25%
2%
- 1%
72%
27%
SE
10
06
19%
59%
18%
2%
- 2%
78%
20%
UK
13
17
16%
42%
30%
5%
1%
6%
58%
35%
HR
10
00
8%
33%
30%
20%
5%
4%
41%
50%
TR
10
03
17%
31%
25%
12%
7%
8%
48%
37%
MK
10
09
27%
27%
18%
18%
5%
5%
54%
36%
QE1.1
For
each
of
the
follo
win
gty
pes
of
dis
crim
inat
ion,
could
you
ple
ase
tell
me
whet
her
,in
your
opin
ion,
itis
very
wid
espre
ad,
fairly
wid
espre
ad,
fairly
rare
or
very
rar
e in
(O
UR C
OU
NTRY)?
Dis
crim
inat
ion o
n t
he
bas
is o
f…
Eth
nic
origin

TO
TA
LV
ery
w
idesp
read
Fair
ly
wid
esp
read
Fair
lyra
reV
ery
rare
No
n-e
xis
ten
t (S
P.)
DK
Wid
esp
read
Rare
EU
27
26
75
67
%3
3%
38
%1
5%
3%
4%
40
%5
3%
BE
10
00
9%
30%
41%
18%
1%
1%
39%
59%
BG
10
09
4%
16%
30%
26%
19%
5%
20%
56%
CZ
10
33
12%
33%
39%
12%
3%
1%
45%
51%
DK
10
01
5%
26%
47%
20%
1%
1%
31%
67%
D-W
10
92
4%
25%
40%
26%
2%
3%
29%
66%
DE
15
23
5%
25%
41%
24%
2%
3%
30%
65%
D-E
43
19%
26%
43%
18%
2%
2%
35%
61%
EE
10
07
5%
28%
32%
16%
14%
5%
33%
48%
IE1
00
73%
17%
36%
31%
7%
6%
20%
67%
EL
10
00
14%
35%
30%
19%
2%
- 49%
49%
ES
10
07
7%
38%
35%
14%
3%
3%
45%
49%
FR1
07
810%
44%
36%
6%
- 4%
54%
42%
IT1
04
88%
38%
33%
12%
4%
5%
46%
45%
CY
50
19%
39%
29%
18%
3%
2%
48%
47%
LV1
01
25%
24%
39%
17%
10%
5%
29%
56%
LT1
02
26%
27%
34%
17%
9%
7%
33%
51%
LU5
04
4%
21%
47%
22%
3%
3%
25%
69%
HU
10
00
13%
44%
29%
10%
2%
2%
57%
39%
MT
50
010%
24%
34%
20%
5%
7%
34%
54%
NL
10
79
6%
32%
46%
14%
- 2%
38%
60%
AT
10
01
6%
22%
40%
18%
11%
3%
28%
58%
PL1
00
05%
25%
44%
13%
8%
5%
30%
57%
PT1
02
05%
30%
44%
12%
5%
4%
35%
56%
RO
10
23
6%
32%
27%
16%
11%
8%
38%
43%
SI
10
22
7%
33%
38%
16%
3%
3%
40%
54%
SK
10
37
5%
31%
41%
18%
2%
3%
36%
59%
FI9
99
4%
27%
56%
11%
1%
1%
31%
67%
SE
10
06
8%
44%
37%
9%
- 2%
52%
46%
UK
13
17
8%
35%
40%
10%
1%
6%
43%
50%
HR
10
00
8%
34%
29%
19%
6%
4%
42%
48%
TR
10
03
12%
29%
26%
17%
8%
8%
41%
43%
MK
10
09
16%
28%
21%
23%
7%
5%
44%
44%
QE1.2
For
each
of
the
follo
win
gty
pes
of
dis
crim
inat
ion,
could
you
ple
ase
tell
me
whet
her
,in
your
opin
ion,
itis
very
wid
espre
ad,
fairly
wid
espre
ad,
fairly
rare
or
very
rar
e in
(O
UR C
OU
NTRY)?
Dis
crim
inat
ion o
n t
he
bas
is o
f…
Gen
der

TO
TA
LV
ery
w
idesp
read
Fair
ly
wid
esp
read
Fair
lyra
reV
ery
rare
No
n-e
xis
ten
t (S
P.)
DK
Wid
esp
read
Rare
EU
27
26
75
61
2%
35
%3
2%
11
%3
%7
%4
7%
43
%
BE
10
00
11%
34%
36%
13%
3%
3%
45%
49%
BG
10
09
5%
17%
22%
17%
12%
27%
22%
39%
CZ
10
33
4%
18%
48%
22%
5%
3%
22%
70%
DK
10
01
9%
29%
44%
15%
1%
2%
38%
59%
D-W
10
92
8%
28%
41%
17%
2%
4%
36%
58%
DE
15
23
8%
28%
40%
18%
2%
4%
36%
58%
D-E
43
19%
24%
38%
23%
2%
4%
33%
61%
EE
10
07
8%
20%
29%
16%
13%
14%
28%
45%
IE1
00
79%
21%
32%
23%
5%
10%
30%
55%
EL
10
00
22%
42%
23%
11%
2%
- 64%
34%
ES
10
07
10%
34%
35%
14%
2%
5%
44%
49%
FR1
07
816%
45%
29%
3%
1%
6%
61%
32%
IT1
04
815%
46%
23%
9%
2%
5%
61%
32%
CY
50
125%
41%
21%
7%
1%
5%
66%
28%
LV1
01
211%
29%
26%
13%
10%
11%
40%
39%
LT1
02
212%
24%
24%
14%
7%
19%
36%
38%
LU5
04
10%
29%
38%
14%
1%
8%
39%
52%
HU
10
00
15%
29%
32%
12%
4%
8%
44%
44%
MT
50
022%
35%
23%
10%
2%
8%
57%
33%
NL
10
79
13%
41%
36%
8%
- 2%
54%
44%
AT
10
01
7%
34%
35%
13%
4%
7%
41%
48%
PL1
00
016%
34%
23%
7%
8%
12%
50%
30%
PT1
02
013%
45%
26%
7%
4%
5%
58%
33%
RO
10
23
19%
30%
16%
12%
8%
15%
49%
28%
SI
10
22
16%
31%
31%
12%
5%
5%
47%
43%
SK
10
37
6%
21%
39%
22%
5%
7%
27%
61%
FI9
99
7%
43%
40%
6%
1%
3%
50%
46%
SE
10
06
10%
47%
35%
5%
- 3%
57%
40%
UK
13
17
10%
30%
39%
9%
1%
11%
40%
48%
HR
10
00
20%
33%
20%
14%
5%
8%
53%
34%
TR
10
03
18%
19%
20%
14%
10%
19%
37%
34%
MK
10
09
28%
16%
12%
14%
9%
21%
44%
26%
QE1.3
For
each
of
the
follo
win
gty
pes
of
dis
crim
inat
ion,
could
you
ple
ase
tell
me
whet
her
,in
your
opin
ion,
itis
very
wid
espre
ad,
fairly
wid
espre
ad,
fairly
rare
or
very
rar
e in
(O
UR C
OU
NTRY)?
Dis
crim
inat
ion o
n t
he
bas
is o
f…
Sex
ual
orien
tation (
for
exam
ple
bei
ng g
ay o
r le
sbia
n)

TO
TA
LV
ery
w
idesp
read
Fair
ly
wid
esp
read
Fair
lyra
reV
ery
rare
No
n-e
xis
ten
t (S
P.)
DK
Wid
esp
read
Rare
EU
27
26
75
61
6%
42
%2
7%
10
%2
%3
%5
8%
37
%
BE
10
00
12%
41%
31%
13%
2%
1%
53%
44%
BG
10
09
17%
41%
16%
11%
9%
6%
58%
27%
CZ
10
33
29%
45%
19%
4%
2%
1%
74%
23%
DK
10
01
6%
33%
41%
17%
1%
2%
39%
58%
D-W
10
92
10%
36%
34%
16%
1%
3%
46%
50%
DE
15
23
12%
36%
34%
15%
1%
2%
48%
49%
D-E
43
120%
36%
31%
11%
- 2%
56%
42%
EE
10
07
9%
42%
26%
10%
9%
4%
51%
36%
IE1
00
79%
27%
31%
22%
5%
6%
36%
53%
EL
10
00
20%
40%
26%
12%
2%
- 60%
38%
ES
10
07
16%
45%
25%
10%
1%
3%
61%
35%
FR1
07
821%
47%
25%
5%
- 2%
68%
30%
IT1
04
815%
39%
27%
12%
3%
4%
54%
39%
CY
50
111%
43%
26%
16%
2%
2%
54%
42%
LV1
01
220%
47%
19%
7%
4%
3%
67%
26%
LT1
02
214%
45%
23%
11%
4%
3%
59%
34%
LU5
04
7%
30%
39%
18%
2%
4%
37%
57%
HU
10
00
33%
46%
15%
4%
1%
1%
79%
19%
MT
50
014%
30%
29%
19%
3%
5%
44%
48%
NL
10
79
18%
48%
26%
7%
- 1%
66%
33%
AT
10
01
10%
36%
32%
12%
6%
4%
46%
44%
PL1
00
013%
38%
29%
11%
5%
4%
51%
40%
PT1
02
09%
44%
30%
8%
5%
4%
53%
38%
RO
10
23
13%
42%
20%
10%
8%
7%
55%
30%
SI
10
22
14%
38%
31%
11%
3%
3%
52%
42%
SK
10
37
20%
44%
24%
8%
1%
3%
64%
32%
FI9
99
11%
52%
32%
4%
- 1%
63%
36%
SE
10
06
12%
43%
36%
8%
- 1%
55%
44%
UK
13
17
18%
43%
27%
6%
1%
5%
61%
33%
HR
10
00
15%
32%
26%
18%
5%
4%
47%
44%
TR
10
03
9%
24%
29%
19%
11%
8%
33%
48%
MK
10
09
29%
31%
17%
15%
4%
4%
60%
32%
QE1.4
For
each
of
the
follo
win
gty
pes
of
dis
crim
inat
ion,
could
you
ple
ase
tell
me
whet
her
,in
your
opin
ion,
itis
very
wid
espre
ad,
fairly
wid
espre
ad,
fairly
rare
or
very
rar
e in
(O
UR C
OU
NTRY)?
Dis
crim
inat
ion o
n t
he
bas
is o
f…
Age

TO
TA
LV
ery
w
idesp
read
Fair
ly
wid
esp
read
Fair
lyra
reV
ery
rare
No
n-e
xis
ten
t (S
P.)
DK
Wid
esp
read
Rare
EU
27
26
75
69
%3
0%
37
%1
6%
4%
4%
39
%5
3%
BE
10
00
15%
39%
32%
11%
1%
2%
54%
43%
BG
10
09
3%
16%
30%
22%
19%
10%
19%
52%
CZ
10
33
2%
10%
47%
32%
7%
2%
12%
79%
DK
10
01
14%
41%
33%
9%
1%
2%
55%
42%
D-W
10
92
6%
27%
43%
19%
2%
3%
33%
62%
DE
15
23
6%
26%
43%
20%
2%
3%
32%
63%
D-E
43
14%
20%
43%
27%
2%
4%
24%
70%
EE
10
07
3%
15%
34%
21%
19%
8%
18%
55%
IE1
00
74%
15%
35%
32%
8%
6%
19%
67%
EL
10
00
15%
36%
29%
16%
4%
- 51%
45%
ES
10
07
5%
27%
38%
23%
3%
4%
32%
61%
FR1
07
817%
41%
33%
4%
- 5%
58%
37%
IT1
04
810%
35%
37%
10%
3%
5%
45%
47%
CY
50
17%
33%
30%
25%
2%
3%
40%
55%
LV1
01
22%
11%
33%
30%
18%
6%
13%
63%
LT1
02
23%
11%
31%
30%
19%
6%
14%
61%
LU5
04
6%
24%
43%
20%
1%
6%
30%
63%
HU
10
00
4%
19%
36%
29%
9%
3%
23%
65%
MT
50
010%
25%
33%
18%
7%
7%
35%
51%
NL
10
79
15%
44%
32%
7%
- 2%
59%
39%
AT
10
01
11%
36%
34%
10%
5%
4%
47%
44%
PL1
00
05%
19%
41%
20%
10%
5%
24%
61%
PT1
02
03%
24%
47%
14%
7%
5%
27%
61%
RO
10
23
4%
23%
29%
24%
13%
7%
27%
53%
SI
10
22
8%
31%
38%
16%
4%
3%
39%
54%
SK
10
37
1%
11%
33%
37%
14%
4%
12%
70%
FI9
99
4%
30%
54%
10%
- 2%
34%
64%
SE
10
06
10%
43%
36%
8%
- 3%
53%
44%
UK
13
17
11%
34%
37%
10%
1%
7%
45%
47%
HR
10
00
8%
26%
33%
22%
7%
4%
34%
55%
TR
10
03
16%
26%
26%
16%
9%
7%
42%
42%
MK
10
09
18%
21%
18%
26%
12%
5%
39%
44%
QE1.5
For
each
of
the
follo
win
gty
pes
of
dis
crim
inat
ion,
could
you
ple
ase
tell
me
whet
her
,in
your
opin
ion,
itis
very
wid
espre
ad,
fairly
wid
espre
ad,
fairly
rare
or
very
rar
e in
(O
UR C
OU
NTRY)?
Dis
crim
inat
ion o
n t
he
bas
is o
f…
Rel
igio
n o
r bel
ief

TO
TA
LV
ery
w
idesp
read
Fair
ly
wid
esp
read
Fair
lyra
reV
ery
rare
No
n-e
xis
ten
t (S
P.)
DK
Wid
esp
read
Rare
EU
27
26
75
61
3%
40
%3
1%
10
%2
%4
%5
3%
41
%
BE
10
00
16%
47%
26%
8%
1%
2%
63%
34%
BG
10
09
12%
35%
21%
10%
9%
13%
47%
31%
CZ
10
33
11%
40%
36%
9%
2%
2%
51%
45%
DK
10
01
8%
34%
40%
16%
- 2%
42%
56%
D-W
10
92
8%
33%
41%
14%
2%
2%
41%
55%
DE
15
23
9%
34%
41%
13%
1%
2%
43%
54%
D-E
43
112%
36%
39%
11%
- 2%
48%
50%
EE
10
07
10%
39%
27%
11%
9%
4%
49%
38%
IE1
00
78%
27%
30%
23%
6%
6%
35%
53%
EL
10
00
22%
41%
24%
11%
2%
- 63%
35%
ES
10
07
11%
45%
28%
10%
2%
4%
56%
38%
FR1
07
822%
52%
20%
3%
- 3%
74%
23%
IT1
04
814%
41%
28%
10%
2%
5%
55%
38%
CY
50
110%
46%
27%
13%
1%
3%
56%
40%
LV1
01
217%
47%
21%
6%
4%
5%
64%
27%
LT1
02
210%
40%
28%
12%
4%
6%
50%
40%
LU5
04
8%
35%
37%
15%
1%
4%
43%
52%
HU
10
00
20%
44%
24%
7%
2%
3%
64%
31%
MT
50
010%
23%
36%
21%
4%
6%
33%
57%
NL
10
79
15%
47%
28%
7%
- 3%
62%
35%
AT
10
01
7%
32%
38%
14%
5%
4%
39%
52%
PL1
00
011%
36%
35%
9%
5%
4%
47%
44%
PT1
02
012%
45%
29%
7%
3%
4%
57%
36%
RO
10
23
15%
37%
22%
11%
7%
8%
52%
33%
SI
10
22
15%
37%
31%
11%
3%
3%
52%
42%
SK
10
37
8%
36%
35%
15%
2%
4%
44%
50%
FI9
99
8%
48%
37%
5%
- 2%
56%
42%
SE
10
06
14%
44%
31%
7%
- 4%
58%
38%
UK
13
17
13%
37%
34%
9%
1%
6%
50%
43%
HR
10
00
14%
30%
27%
19%
6%
4%
44%
46%
TR
10
03
12%
22%
28%
19%
11%
8%
34%
47%
MK
10
09
25%
28%
20%
15%
4%
8%
53%
35%
QE1.6
For
each
of
the
follo
win
gty
pes
of
dis
crim
inat
ion,
could
you
ple
ase
tell
me
whet
her
,in
your
opin
ion,
itis
very
wid
espre
ad,
fairly
wid
espre
ad,
fairly
rare
or
very
rar
e in
(O
UR C
OU
NTRY)?
Dis
crim
inat
ion o
n t
he
bas
is o
f…
Dis
abili
ty

TO
TA
LFar
mo
re
wid
esp
read
Slig
htl
y m
ore
w
idesp
read
Slig
htl
y less
w
idesp
read
Far
less
w
idesp
read
DK
Mo
re
wid
esp
read
Less
w
idesp
read
EU
27
26
75
69
%3
2%
39
%9
%1
1%
41
%4
8%
BE
10
00
12%
35%
40%
9%
4%
47%
49%
BG
10
09
6%
24%
29%
19%
22%
30%
48%
CZ
10
33
9%
39%
34%
11%
7%
48%
45%
DK
10
01
16%
39%
36%
5%
4%
55%
41%
D-W
10
92
5%
31%
44%
8%
12%
36%
52%
DE
15
23
4%
32%
43%
9%
12%
36%
52%
D-E
43
15%
35%
38%
10%
12%
40%
48%
EE
10
07
5%
26%
34%
11%
24%
31%
45%
IE1
00
715%
27%
29%
16%
13%
42%
45%
EL
10
00
21%
32%
36%
11%
- 53%
47%
ES
10
07
6%
37%
44%
9%
4%
43%
53%
FR1
07
811%
38%
35%
2%
14%
49%
37%
IT1
04
811%
36%
38%
8%
7%
47%
46%
CY
50
16%
22%
55%
15%
2%
28%
70%
LV1
01
26%
25%
36%
12%
21%
31%
48%
LT1
02
24%
23%
35%
13%
25%
27%
48%
LU5
04
8%
27%
40%
6%
19%
35%
46%
HU
10
00
32%
41%
18%
3%
6%
73%
21%
MT
50
035%
31%
23%
5%
6%
66%
28%
NL
10
79
14%
44%
33%
2%
7%
58%
35%
AT
10
01
13%
41%
33%
6%
7%
54%
39%
PL1
00
02%
15%
45%
17%
21%
17%
62%
PT1
02
06%
23%
53%
9%
9%
29%
62%
RO
10
23
7%
25%
31%
18%
19%
32%
49%
SI
10
22
9%
36%
39%
6%
10%
45%
45%
SK
10
37
9%
36%
38%
10%
7%
45%
48%
FI9
99
6%
39%
48%
3%
4%
45%
51%
SE
10
06
8%
40%
43%
2%
7%
48%
45%
UK
13
17
12%
29%
40%
8%
11%
41%
48%
HR
10
00
6%
21%
49%
16%
8%
27%
65%
TR
10
03
13%
31%
26%
16%
14%
44%
42%
MK
10
09
20%
24%
32%
16%
8%
44%
48%
QE2.1
Ifyo
uco
mpar
eth
esi
tuat
ion
with
5ye
ars
ago,
would
you
say
that
the
follo
win
gty
pes
of
dis
crim
inat
ion
are
more
com
mon
or
less
com
mon in (
OU
R C
OU
NTRY)?
Dis
crim
inat
ion o
n t
he
bas
is o
f…
Eth
nic
origin

TO
TA
LFar
mo
re
wid
esp
read
Slig
htl
y m
ore
w
idesp
read
Slig
htl
y less
w
idesp
read
Far
less
w
idesp
read
DK
Mo
re
wid
esp
read
Less
w
idesp
read
EU
27
26
75
65
%1
9%
51
%1
4%
11
%2
4%
65
%
BE
10
00
5%
21%
53%
17%
4%
26%
70%
BG
10
09
3%
16%
30%
28%
23%
19%
58%
CZ
10
33
9%
23%
45%
17%
6%
32%
62%
DK
10
01
2%
15%
64%
14%
5%
17%
78%
D-W
10
92
1%
13%
56%
19%
11%
14%
75%
DE
15
23
2%
14%
56%
18%
10%
16%
74%
D-E
43
14%
20%
56%
13%
7%
24%
69%
EE
10
07
4%
19%
40%
12%
25%
23%
52%
IE1
00
75%
14%
42%
23%
16%
19%
65%
EL
10
00
9%
24%
45%
22%
- 33%
67%
ES
10
07
5%
21%
53%
16%
5%
26%
69%
FR1
07
86%
22%
52%
6%
14%
28%
58%
IT1
04
86%
23%
48%
14%
9%
29%
62%
CY
50
13%
13%
57%
25%
2%
16%
82%
LV1
01
26%
24%
39%
12%
19%
30%
51%
LT1
02
26%
25%
35%
10%
24%
31%
45%
LU5
04
4%
13%
54%
11%
18%
17%
65%
HU
10
00
13%
38%
34%
8%
7%
51%
42%
MT
50
09%
14%
46%
23%
8%
23%
69%
NL
10
79
3%
17%
64%
8%
8%
20%
72%
AT
10
01
6%
22%
45%
20%
7%
28%
65%
PL1
00
03%
15%
50%
15%
17%
18%
65%
PT1
02
06%
18%
55%
12%
9%
24%
67%
RO
10
23
7%
22%
31%
21%
19%
29%
52%
SI
10
22
6%
32%
43%
9%
10%
38%
52%
SK
10
37
7%
28%
45%
14%
6%
35%
59%
FI9
99
2%
19%
65%
10%
4%
21%
75%
SE
10
06
2%
18%
67%
7%
6%
20%
74%
UK
13
17
5%
18%
53%
12%
12%
23%
65%
HR
10
00
5%
24%
47%
15%
9%
29%
62%
TR
10
03
9%
29%
28%
20%
14%
38%
48%
MK
10
09
14%
23%
37%
18%
8%
37%
55%
QE2.2
Ifyo
uco
mpar
eth
esi
tuat
ion
with
5ye
ars
ago,
would
you
say
that
the
follo
win
gty
pes
of
dis
crim
inat
ion
are
more
com
mon
or
less
com
mon in (
OU
R C
OU
NTRY)?
Dis
crim
inat
ion o
n t
he
bas
is o
f…
Gen
der

TO
TA
LFar
mo
re
wid
esp
read
Slig
htl
y m
ore
w
idesp
read
Slig
htl
y less
w
idesp
read
Far
less
w
idesp
read
DK
Mo
re
wid
esp
read
Less
w
idesp
read
EU
27
26
75
67
%2
1%
46
%1
4%
12
%2
8%
60
%
BE
10
00
9%
20%
48%
19%
4%
29%
67%
BG
10
09
5%
13%
21%
19%
42%
18%
40%
CZ
10
33
4%
15%
46%
25%
10%
19%
71%
DK
10
01
4%
18%
58%
15%
5%
22%
73%
D-W
10
92
3%
16%
51%
20%
10%
19%
71%
DE
15
23
4%
16%
50%
20%
10%
20%
70%
D-E
43
17%
14%
47%
23%
9%
21%
70%
EE
10
07
6%
19%
31%
12%
32%
25%
43%
IE1
00
78%
16%
38%
20%
18%
24%
58%
EL
10
00
14%
28%
42%
16%
- 42%
58%
ES
10
07
5%
18%
54%
16%
7%
23%
70%
FR1
07
89%
27%
46%
5%
13%
36%
51%
IT1
04
89%
26%
46%
11%
8%
35%
57%
CY
50
15%
15%
63%
12%
5%
20%
75%
LV1
01
29%
29%
27%
9%
26%
38%
36%
LT1
02
29%
27%
26%
9%
29%
36%
35%
LU5
04
6%
15%
49%
10%
20%
21%
59%
HU
10
00
15%
29%
30%
12%
14%
44%
42%
MT
50
014%
17%
47%
14%
8%
31%
61%
NL
10
79
9%
29%
52%
5%
5%
38%
57%
AT
10
01
8%
21%
46%
15%
10%
29%
61%
PL1
00
07%
22%
37%
12%
22%
29%
49%
PT1
02
07%
23%
52%
9%
9%
30%
61%
RO
10
23
11%
26%
23%
14%
26%
37%
37%
SI
10
22
10%
34%
38%
7%
11%
44%
45%
SK
10
37
4%
23%
40%
20%
13%
27%
60%
FI9
99
3%
25%
59%
8%
5%
28%
67%
SE
10
06
3%
20%
59%
12%
6%
23%
71%
UK
13
17
7%
18%
48%
13%
14%
25%
61%
HR
10
00
11%
25%
40%
13%
11%
36%
53%
TR
10
03
9%
23%
23%
19%
26%
32%
42%
MK
10
09
20%
19%
20%
12%
29%
39%
32%
QE2.3
Ifyo
uco
mpar
eth
esi
tuat
ion
with
5ye
ars
ago,
would
you
say
that
the
follo
win
gty
pes
of
dis
crim
inat
ion
are
more
com
mon
or
less
com
mon in (
OU
R C
OU
NTRY)?
Dis
crim
inat
ion o
n t
he
bas
is o
f…
Sex
ual
orien
tation (
for
exam
ple
bei
ng g
ay o
r le
sbia
n)

TO
TA
LFar
mo
re
wid
esp
read
Slig
htl
y m
ore
w
idesp
read
Slig
htl
y less
w
idesp
read
Far
less
w
idesp
read
DK
Mo
re
wid
esp
read
Less
w
idesp
read
EU
27
26
75
61
0%
32
%3
8%
9%
11
%4
2%
47
%
BE
10
00
10%
30%
43%
12%
5%
40%
55%
BG
10
09
17%
33%
18%
11%
21%
50%
29%
CZ
10
33
24%
41%
23%
7%
5%
65%
30%
DK
10
01
4%
26%
54%
10%
6%
30%
64%
D-W
10
92
8%
36%
37%
9%
10%
44%
46%
DE
15
23
9%
35%
38%
9%
9%
44%
47%
D-E
43
113%
34%
38%
9%
6%
47%
47%
EE
10
07
9%
29%
32%
9%
21%
38%
41%
IE1
00
710%
21%
34%
18%
17%
31%
52%
EL
10
00
13%
29%
41%
17%
- 42%
58%
ES
10
07
8%
33%
44%
10%
5%
41%
54%
FR1
07
811%
37%
35%
4%
13%
48%
39%
IT1
04
810%
28%
42%
11%
9%
38%
53%
CY
50
12%
18%
60%
17%
3%
20%
77%
LV1
01
220%
37%
22%
6%
15%
57%
28%
LT1
02
213%
36%
26%
8%
17%
49%
34%
LU5
04
4%
22%
43%
9%
22%
26%
52%
HU
10
00
31%
42%
18%
4%
5%
73%
22%
MT
50
09%
21%
42%
20%
8%
30%
62%
NL
10
79
9%
42%
37%
4%
8%
51%
41%
AT
10
01
12%
34%
34%
12%
8%
46%
46%
PL1
00
05%
23%
43%
11%
18%
28%
54%
PT1
02
09%
26%
49%
8%
8%
35%
57%
RO
10
23
10%
30%
24%
17%
19%
40%
41%
SI
10
22
12%
37%
37%
6%
8%
49%
43%
SK
10
37
20%
40%
28%
7%
5%
60%
35%
FI9
99
7%
42%
42%
4%
5%
49%
46%
SE
10
06
5%
34%
45%
4%
12%
39%
49%
UK
13
17
9%
29%
42%
8%
12%
38%
50%
HR
10
00
9%
26%
43%
13%
9%
35%
56%
TR
10
03
7%
25%
29%
23%
16%
32%
52%
MK
10
09
25%
31%
26%
11%
7%
56%
37%
QE2.4
Ifyo
uco
mpar
eth
esi
tuat
ion
with
5ye
ars
ago,
would
you
say
that
the
follo
win
gty
pes
of
dis
crim
inat
ion
are
more
com
mon
or
less
com
mon in (
OU
R C
OU
NTRY)?
Dis
crim
inat
ion o
n t
he
bas
is o
f…
Age

TO
TA
LFar
mo
re
wid
esp
read
Slig
htl
y m
ore
w
idesp
read
Slig
htl
y less
w
idesp
read
Far
less
w
idesp
read
DK
Mo
re
wid
esp
read
Less
w
idesp
read
EU
27
26
75
66
%2
6%
42
%1
4%
12
%3
2%
56
%
BE
10
00
9%
36%
38%
12%
5%
45%
50%
BG
10
09
3%
16%
30%
25%
26%
19%
55%
CZ
10
33
1%
11%
46%
32%
10%
12%
78%
DK
10
01
14%
38%
38%
6%
4%
52%
44%
D-W
10
92
3%
26%
46%
14%
11%
29%
60%
DE
15
23
4%
26%
45%
14%
11%
30%
59%
D-E
43
15%
26%
41%
17%
11%
31%
58%
EE
10
07
4%
13%
38%
15%
30%
17%
53%
IE1
00
75%
16%
38%
25%
16%
21%
63%
EL
10
00
10%
28%
43%
19%
- 38%
62%
ES
10
07
3%
22%
49%
17%
9%
25%
66%
FR1
07
810%
36%
36%
3%
15%
46%
39%
IT1
04
88%
30%
42%
11%
9%
38%
53%
CY
50
12%
16%
59%
20%
3%
18%
79%
LV1
01
22%
16%
39%
19%
24%
18%
58%
LT1
02
23%
18%
35%
16%
28%
21%
51%
LU5
04
4%
25%
44%
8%
19%
29%
52%
HU
10
00
6%
21%
35%
26%
12%
27%
61%
MT
50
09%
21%
44%
18%
8%
30%
62%
NL
10
79
13%
42%
35%
3%
7%
55%
38%
AT
10
01
11%
34%
38%
9%
8%
45%
47%
PL1
00
02%
13%
45%
19%
21%
15%
64%
PT1
02
05%
20%
52%
13%
10%
25%
65%
RO
10
23
4%
17%
33%
26%
20%
21%
59%
SI
10
22
7%
35%
42%
7%
9%
42%
49%
SK
10
37
3%
15%
39%
33%
10%
18%
72%
FI9
99
2%
28%
60%
4%
6%
30%
64%
SE
10
06
6%
40%
42%
3%
9%
46%
45%
UK
13
17
9%
26%
43%
9%
13%
35%
52%
HR
10
00
5%
20%
49%
17%
9%
25%
66%
TR
10
03
12%
28%
28%
18%
14%
40%
46%
MK
10
09
15%
21%
29%
24%
11%
36%
53%
QE2.5
Ifyo
uco
mpar
eth
esi
tuat
ion
with
5ye
ars
ago,
would
you
say
that
the
follo
win
gty
pes
of
dis
crim
inat
ion
are
more
com
mon
or
less
com
mon in (
OU
R C
OU
NTRY)?
Dis
crim
inat
ion o
n t
he
bas
is o
f…
Rel
igio
n o
r bel
ief

TO
TA
LFar
mo
re
wid
esp
read
Slig
htl
y m
ore
w
idesp
read
Slig
htl
y less
w
idesp
read
Far
less
w
idesp
read
DK
Mo
re
wid
esp
read
Less
w
idesp
read
EU
27
26
75
66
%2
3%
49
%1
1%
11
%2
9%
60
%
BE
10
00
7%
26%
51%
12%
4%
33%
63%
BG
10
09
10%
21%
29%
14%
26%
31%
43%
CZ
10
33
7%
25%
48%
13%
7%
32%
61%
DK
10
01
2%
20%
62%
11%
5%
22%
73%
D-W
10
92
2%
22%
52%
13%
11%
24%
65%
DE
15
23
3%
23%
52%
12%
10%
26%
64%
D-E
43
17%
24%
51%
11%
7%
31%
62%
EE
10
07
6%
21%
40%
14%
19%
27%
54%
IE1
00
78%
16%
37%
23%
16%
24%
60%
EL
10
00
10%
27%
46%
17%
- 37%
63%
ES
10
07
4%
22%
54%
14%
6%
26%
68%
FR1
07
87%
26%
48%
5%
14%
33%
53%
IT1
04
87%
24%
48%
12%
9%
31%
60%
CY
50
13%
13%
64%
17%
3%
16%
81%
LV1
01
213%
30%
32%
7%
18%
43%
39%
LT1
02
27%
29%
33%
11%
20%
36%
44%
LU5
04
6%
18%
48%
10%
18%
24%
58%
HU
10
00
15%
34%
34%
9%
8%
49%
43%
MT
50
06%
11%
49%
27%
7%
17%
76%
NL
10
79
5%
25%
55%
5%
10%
30%
60%
AT
10
01
7%
23%
44%
17%
9%
30%
61%
PL1
00
03%
17%
52%
14%
14%
20%
66%
PT1
02
07%
22%
54%
9%
8%
29%
63%
RO
10
23
8%
27%
28%
17%
20%
35%
45%
SI
10
22
8%
35%
42%
8%
7%
43%
50%
SK
10
37
7%
30%
41%
14%
8%
37%
55%
FI9
99
2%
25%
61%
7%
5%
27%
68%
SE
10
06
3%
21%
59%
7%
10%
24%
66%
UK
13
17
6%
19%
52%
11%
12%
25%
63%
HR
10
00
6%
20%
47%
17%
10%
26%
64%
TR
10
03
6%
23%
31%
24%
16%
29%
55%
MK
10
09
18%
26%
30%
13%
13%
44%
43%
QE2.6
Ifyo
uco
mpar
eth
esi
tuat
ion
with
5ye
ars
ago,
would
you
say
that
the
follo
win
gty
pes
of
dis
crim
inat
ion
are
more
com
mon
or
less
com
mon in (
OU
R C
OU
NTRY)?
Dis
crim
inat
ion o
n t
he
bas
is o
f…
Dis
abili
ty

TO
TA
LEth
nic
ori
gin
Gen
der
Sexu
al
ori
en
tati
on
Ag
eR
elig
ion
or
belief
Dis
ab
ilit
yFo
r an
oth
er
reaso
nN
oD
K
EU
27
26
75
63
%3
%1
%6
%1
%2
%3
%8
3%
1%
BE
10
00
3%
4%
2%
5%
2%
4%
4%
82%
0%
BG
10
09
6%
2%
1%
5%
2%
1%
2%
85%
3%
CZ
10
33
3%
4%
1%
11%
1%
2%
2%
82%
0%
DK
10
01
3%
4%
1%
5%
2%
1%
3%
86%
0%
D-W
10
92
2%
2%
1%
5%
1%
1%
3%
86%
1%
DE
15
23
2%
2%
1%
5%
1%
2%
3%
87%
0%
D-E
43
11%
3%
2%
5%
1%
3%
2%
87%
0%
EE
10
07
5%
2%
1%
6%
1%
2%
2%
82%
2%
IE1
00
73%
3%
3%
3%
1%
1%
3%
87%
2%
EL
10
00
1%
2%
1%
2%
0%
1%
0%
94%
- ES
10
07
2%
4%
2%
5%
0%
1%
3%
85%
- FR
10
78
3%
3%
1%
5%
1%
2%
5%
83%
1%
IT1
04
84%
7%
4%
5%
3%
2%
3%
76%
2%
CY
50
11%
2%
0%
1%
1%
1%
5%
90%
- LV
10
12
3%
2%
0%
8%
1%
2%
2%
84%
1%
LT1
02
21%
2%
1%
5%
0%
2%
2%
88%
1%
LU5
04
4%
4%
1%
5%
2%
3%
4%
83%
0%
HU
10
00
3%
8%
1%
8%
1%
2%
1%
80%
1%
MT
50
01%
3%
- 2%
0%
1%
2%
90%
3%
NL
10
79
2%
2%
1%
5%
2%
2%
1%
88%
0%
AT
10
01
5%
6%
2%
7%
5%
2%
4%
76%
2%
PL1
00
00%
1%
1%
4%
1%
1%
2%
87%
4%
PT1
02
01%
3%
3%
4%
1%
1%
2%
85%
3%
RO
10
23
1%
2%
0%
5%
1%
1%
2%
85%
5%
SI
10
22
2%
4%
1%
8%
1%
2%
6%
83%
2%
SK
10
37
2%
3%
0%
9%
0%
1%
6%
81%
2%
FI9
99
1%
2%
1%
5%
1%
1%
3%
88%
0%
SE
10
06
3%
7%
1%
9%
1%
3%
2%
79%
1%
UK
13
17
4%
3%
1%
8%
2%
3%
4%
79%
1%
HR
10
00
2%
2%
0%
5%
1%
1%
4%
87%
1%
TR
10
03
6%
4%
1%
2%
2%
1%
1%
81%
6%
MK
10
09
8%
5%
1%
8%
6%
3%
6%
72%
3%
QE3
Inth
epas
t12
month
shav
eyo
uper
sonal
lyfe
ltdis
crim
inat
edag
ainst
or
har
asse
don
the
bas
isof
one
or
more
of
of
the
follo
win
ggro
unds?
Plea
sete
llm
eal
lth
atap
ply
.(D
O N
OT R
EAD
OU
T –
MU
LTIP
LE A
NSW
ERS P
OSSIB
LE)

TO
TA
LEth
nic
ori
gin
Gen
der
Sexu
al
ori
en
tati
on
Ag
eR
elig
ion
or
belief
Dis
ab
ilit
yFo
r an
oth
er
reaso
nN
oD
K
EU
27
26
75
61
2%
5%
6%
8%
5%
6%
3%
72
%2
%
BE
10
00
8%
3%
6%
6%
4%
5%
3%
75%
1%
BG
10
09
9%
2%
1%
7%
2%
4%
1%
78%
4%
CZ
10
33
9%
7%
1%
17%
1%
4%
3%
70%
1%
DK
10
01
23%
7%
7%
8%
15%
7%
3%
64%
0%
D-W
10
92
14%
4%
5%
8%
7%
7%
3%
69%
1%
DE
15
23
12%
4%
5%
9%
7%
7%
3%
70%
1%
D-E
43
17%
5%
8%
13%
5%
8%
3%
72%
1%
EE
10
07
10%
4%
4%
9%
2%
6%
2%
75%
2%
IE1
00
715%
2%
5%
4%
4%
4%
2%
75%
2%
EL
10
00
14%
3%
3%
3%
4%
3%
0%
80%
- ES
10
07
17%
8%
6%
9%
2%
6%
4%
69%
0%
FR1
07
815%
5%
6%
4%
6%
6%
4%
72%
0%
IT1
04
89%
6%
8%
5%
3%
4%
1%
71%
2%
CY
50
114%
2%
1%
2%
2%
2%
3%
80%
0%
LV1
01
27%
2%
2%
11%
3%
5%
1%
76%
2%
LT1
02
24%
3%
2%
6%
2%
3%
2%
85%
1%
LU5
04
12%
4%
8%
7%
5%
8%
4%
74%
0%
HU
10
00
11%
7%
2%
8%
1%
3%
0%
73%
1%
MT
50
06%
3%
3%
2%
1%
2%
1%
86%
3%
NL
10
79
19%
5%
10%
9%
10%
8%
3%
68%
0%
AT
10
01
16%
6%
9%
10%
10%
9%
4%
59%
3%
PL1
00
04%
3%
5%
8%
3%
3%
2%
78%
3%
PT1
02
06%
1%
5%
5%
1%
3%
2%
81%
3%
RO
10
23
5%
4%
2%
6%
1%
4%
2%
79%
5%
SI
10
22
8%
6%
2%
8%
5%
4%
6%
73%
2%
SK
10
37
10%
7%
3%
14%
1%
7%
5%
72%
1%
FI9
99
12%
6%
5%
8%
5%
7%
3%
73%
0%
SE
10
06
20%
14%
9%
14%
11%
12%
5%
58%
0%
UK
13
17
12%
4%
6%
9%
6%
7%
2%
70%
1%
HR
10
00
7%
4%
3%
7%
4%
3%
2%
80%
1%
TR
10
03
9%
7%
2%
4%
6%
5%
1%
76%
6%
MK
10
09
11%
7%
3%
7%
8%
4%
5%
69%
4%
QE4
Inth
epas
t12
month
s,hav
eyo
uw
itnes
sed
som
eone
bei
ng
dis
crim
inat
edag
ainst
or
har
asse
don
the
bas
isof
one
or
more
of
the
follo
win
ggro
unds?
Plea
sete
llm
eal
lth
at a
pply
. (M
ULT
IPLE
AN
SW
ERS P
OSSIB
LE)
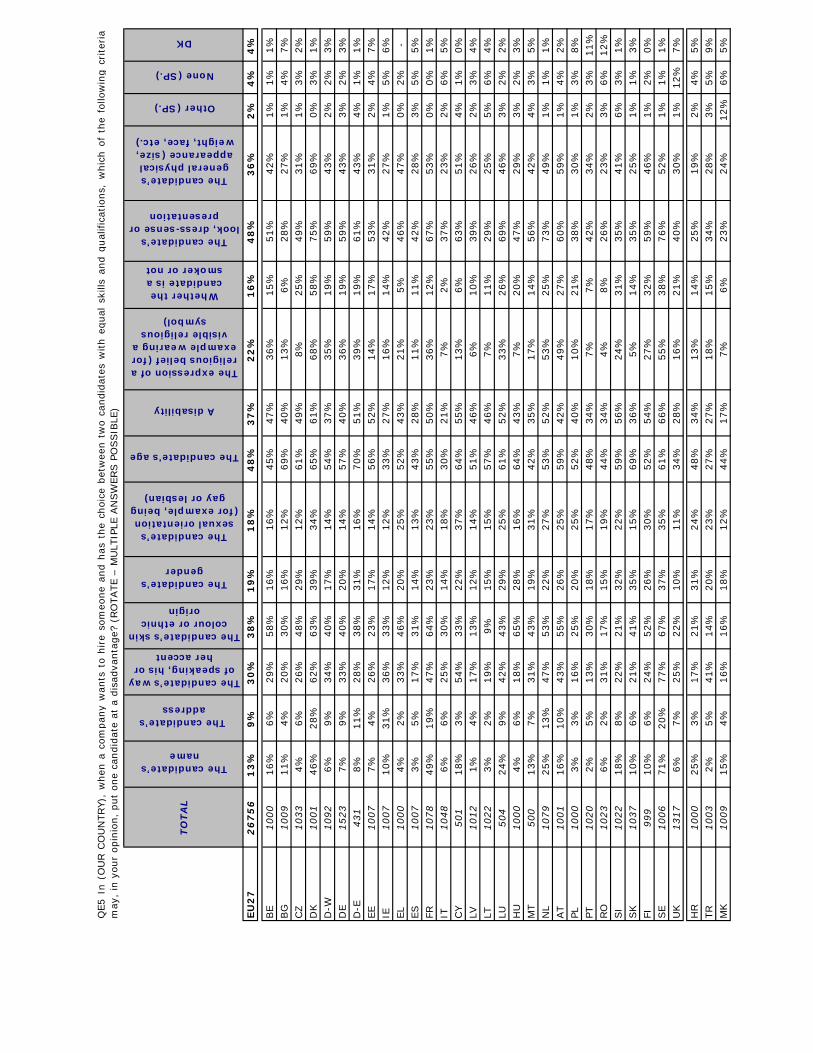
TO
TA
L
The candidate’s name
The candidate’s address
The candidate’s way of speaking, his or
her accent
The candidate’s skin colour or ethnic
origin
The candidate’s gender
The candidate’s sexual orientation
(for example, being gay or lesbian)
The candidate's age
A disability
The expression of a religious belief (for example wearing a
visible religious symbol)
Whether the candidate is a smoker or not
The candidate’s look, dress-sense or
presentation
The candidate’s general physical
appearance (size, weight, face, etc.)
Other (SP.)
None (SP.)
DK
EU
27
26
75
61
3%
9%
30
%3
8%
19
%1
8%
48
%3
7%
22
%1
6%
48
%3
6%
2%
4%
4%
BE
10
00
16%
6%
29%
58%
16%
16%
45%
47%
36%
15%
51%
42%
1%
1%
1%
BG
10
09
11%
4%
20%
30%
16%
12%
69%
40%
13%
6%
28%
27%
1%
4%
7%
CZ
10
33
4%
6%
26%
48%
29%
12%
61%
49%
8%
25%
49%
31%
1%
3%
2%
DK
10
01
46%
28%
62%
63%
39%
34%
65%
61%
68%
58%
75%
69%
0%
3%
1%
D-W
10
92
6%
9%
34%
40%
17%
14%
54%
37%
35%
19%
59%
43%
2%
2%
3%
DE
15
23
7%
9%
33%
40%
20%
14%
57%
40%
36%
19%
59%
43%
3%
2%
3%
D-E
43
18%
11%
28%
38%
31%
16%
70%
51%
39%
19%
61%
43%
4%
1%
1%
EE
10
07
7%
4%
26%
23%
17%
14%
56%
52%
14%
17%
53%
31%
2%
4%
7%
IE1
00
710%
31%
36%
33%
12%
12%
33%
27%
16%
14%
42%
27%
1%
5%
6%
EL
10
00
4%
2%
33%
46%
20%
25%
52%
43%
21%
5%
46%
47%
0%
2%
- ES
10
07
3%
5%
17%
31%
14%
13%
43%
28%
11%
11%
42%
28%
3%
5%
5%
FR1
07
849%
19%
47%
64%
23%
23%
55%
50%
36%
12%
67%
53%
0%
0%
1%
IT1
04
86%
6%
25%
30%
14%
18%
30%
21%
7%
2%
37%
23%
2%
6%
5%
CY
50
118%
3%
54%
33%
22%
37%
64%
55%
13%
6%
63%
51%
4%
1%
0%
LV1
01
21%
4%
17%
13%
12%
14%
51%
46%
6%
10%
39%
26%
2%
3%
4%
LT1
02
23%
2%
19%
9%
15%
15%
57%
46%
7%
11%
29%
25%
5%
6%
4%
LU5
04
24%
9%
42%
43%
29%
25%
61%
52%
33%
26%
69%
46%
3%
2%
2%
HU
10
00
4%
6%
18%
65%
28%
16%
64%
43%
7%
20%
47%
29%
3%
2%
3%
MT
50
013%
7%
31%
43%
19%
31%
42%
35%
17%
14%
56%
42%
4%
3%
5%
NL
10
79
25%
13%
47%
53%
22%
27%
53%
52%
53%
25%
73%
49%
1%
1%
1%
AT
10
01
16%
10%
43%
55%
26%
25%
59%
42%
49%
27%
60%
59%
1%
4%
2%
PL1
00
03%
3%
16%
25%
20%
25%
52%
40%
10%
21%
38%
30%
1%
3%
8%
PT1
02
02%
5%
13%
30%
18%
17%
48%
34%
7%
7%
42%
34%
2%
3%
11%
RO
10
23
6%
2%
31%
17%
15%
19%
44%
34%
4%
8%
26%
23%
3%
6%
12%
SI
10
22
18%
8%
22%
21%
32%
22%
59%
56%
24%
31%
35%
41%
6%
3%
1%
SK
10
37
10%
6%
21%
41%
35%
15%
69%
36%
5%
14%
35%
25%
1%
1%
3%
FI9
99
10%
6%
24%
52%
26%
30%
52%
54%
27%
32%
59%
46%
1%
2%
0%
SE
10
06
71%
20%
77%
67%
37%
35%
61%
66%
55%
38%
76%
52%
1%
1%
1%
UK
13
17
6%
7%
25%
22%
10%
11%
34%
28%
16%
21%
40%
30%
1%
12%
7%
HR
10
00
25%
3%
17%
21%
31%
24%
48%
34%
13%
14%
25%
19%
2%
4%
5%
TR
10
03
2%
5%
41%
14%
20%
23%
27%
27%
18%
15%
34%
28%
3%
5%
9%
MK
10
09
15%
4%
16%
16%
18%
12%
44%
17%
7%
6%
23%
24%
12%
6%
5%
QE5
In(O
UR
CO
UN
TRY),
when
aco
mpan
yw
ants
tohire
som
eone
and
has
the
choic
ebet
wee
ntw
oca
ndid
ates
with
equal
skill
san
dqual
ific
atio
ns,
whic
hof
the
follo
win
gcr
iter
iam
ay,
in y
our
opin
ion,
put
one
candid
ate
at a
dis
adva
nta
ge?
(RO
TATE –
MU
LTIP
LE A
NSW
ERS P
OSSIB
LE)

TO
TA
L1
Very
u
nco
mfo
rtab
le2
34
56
78
91
0To
tally
com
fort
ab
le
Ind
iffe
ren
t (S
P.)
DK
Avera
ge
EU
27
26
75
61
%1
%1
%2
%6
%4
%7
%1
2%
9%
49
%7
%1
%8
,5
BE
10
00
2%
1%
1%
1%
4%
3%
8%
13%
12%
53%
2%
- 8,6
BG
10
09
2%
- 1%
2%
4%
3%
5%
7%
8%
47%
18%
3%
8,6
CZ
10
33
- -
1%
1%
7%
7%
7%
15%
12%
36%
14%
- 8,3
DK
10
01
1%
- -
1%
2%
1%
4%
3%
6%
81%
1%
- 9,5
D-W
10
92
2%
1%
1%
1%
7%
3%
5%
11%
7%
48%
14%
- 8,5
DE
15
23
2%
1%
1%
1%
8%
3%
5%
11%
7%
47%
14%
- 8,4
D-E
43
13%
1%
1%
2%
10%
4%
5%
10%
8%
44%
12%
- 8,1
EE
10
07
1%
- 1%
2%
6%
3%
4%
6%
8%
60%
8%
1%
8,9
IE1
00
71%
- -
1%
2%
1%
3%
8%
8%
69%
5%
2%
9,3
EL
10
00
4%
1%
2%
2%
5%
3%
5%
15%
13%
49%
1%
- 8,3
ES
10
07
- 1%
1%
1%
5%
6%
11%
13%
12%
49%
1%
- 8,6
FR1
07
81%
- 1%
1%
6%
4%
5%
14%
11%
56%
1%
- 8,8
IT1
04
81%
1%
3%
3%
5%
8%
13%
15%
13%
28%
9%
1%
7,8
CY
50
14%
- 1%
1%
6%
3%
5%
11%
8%
60%
- 1%
8,6
LV1
01
22%
1%
1%
1%
8%
3%
4%
10%
8%
49%
12%
1%
8,5
LT1
02
21%
- -
- 2%
1%
1%
5%
5%
81%
3%
1%
9,6
LU5
04
1%
- 1%
1%
8%
3%
6%
7%
5%
50%
17%
1%
8,6
HU
10
00
1%
- 2%
3%
7%
6%
8%
13%
8%
42%
9%
1%
8,2
MT
50
01%
- -
1%
5%
3%
4%
9%
11%
58%
7%
1%
9,0
NL
10
79
1%
- -
1%
3%
3%
9%
17%
11%
53%
2%
- 8,8
AT
10
01
2%
1%
2%
4%
10%
5%
7%
11%
6%
38%
13%
1%
7,9
PL1
00
01%
- 1%
1%
3%
2%
4%
8%
7%
64%
8%
1%
9,1
PT1
02
0-
- 2%
3%
7%
6%
8%
17%
9%
16%
29%
3%
7,6
RO
10
23
2%
1%
2%
2%
5%
3%
8%
10%
10%
36%
17%
4%
8,1
SI
10
22
1%
- 1%
1%
3%
1%
3%
7%
6%
75%
2%
- 9,3
SK
10
37
2%
1%
2%
4%
8%
8%
8%
14%
13%
36%
3%
1%
7,9
FI9
99
- 1%
1%
1%
7%
6%
7%
15%
16%
37%
9%
- 8,4
SE
10
06
1%
- -
- 3%
1%
1%
4%
3%
84%
2%
1%
9,6
UK
13
17
3%
1%
1%
1%
6%
3%
3%
9%
6%
64%
3%
- 8,8
HR
10
00
2%
1%
1%
1%
6%
3%
5%
9%
8%
62%
1%
1%
8,7
TR
10
03
4%
2%
1%
2%
3%
5%
8%
11%
8%
36%
17%
3%
8,0
MK
10
09
10%
1%
2%
2%
7%
4%
5%
7%
7%
51%
3%
1%
7,8
QE6.1
And
usi
ng
asc
ale
from
1to
10,
ple
ase
tell
me
how
you
would
feel
about
hav
ing
som
eone
from
each
of
the
follo
win
gca
tegories
inth
ehig
hes
tel
ecte
dpolit
ical
posi
tion
in(O
UR C
OU
NTRY)?
A w
om
an

TO
TA
LU
nco
mfo
rtab
leA
lit
tle
un
com
fort
ab
leC
om
fort
ab
leA
vera
ge
EU
27
26
75
63
%1
8%
70
%8
,5
BE
10
00
4%
16%
78%
8,6
BG
10
09
3%
14%
62%
8,6
CZ
10
33
1%
22%
62%
8,3
DK
10
01
1%
7%
90%
9,5
D-W
10
92
4%
16%
66%
8,5
DE
15
23
4%
17%
65%
8,4
D-E
43
16%
20%
62%
8,1
EE
10
07
3%
14%
74%
8,9
IE1
00
71%
7%
85%
9,3
EL
10
00
7%
15%
76%
8,3
ES
10
07
2%
23%
74%
8,6
FR1
07
82%
16%
80%
8,8
IT1
04
85%
29%
56%
7,8
CY
50
16%
15%
79%
8,6
LV1
01
24%
17%
67%
8,5
LT1
02
21%
5%
90%
9,6
LU5
04
2%
18%
62%
8,6
HU
10
00
3%
23%
63%
8,2
MT
50
01%
12%
78%
9,0
NL
10
79
2%
15%
81%
8,8
AT
10
01
5%
26%
55%
7,9
PL1
00
02%
10%
79%
9,1
PT1
02
02%
24%
42%
7,6
RO
10
23
5%
18%
56%
8,1
SI
10
22
2%
8%
88%
9,3
SK
10
37
5%
27%
63%
7,9
FI9
99
2%
21%
68%
8,4
SE
10
06
1%
5%
91%
9,6
UK
13
17
4%
13%
79%
8,8
HR
10
00
4%
15%
79%
8,7
TR
10
03
7%
18%
55%
8,0
MK
10
09
13%
18%
65%
7,8
QE6.1
And
usi
ng
asc
ale
from
1to
10,
ple
ase
tell
me
how
you
would
feel
about
hav
ing
som
eone
from
each
of
the
follo
win
gca
tegories
inth
ehig
hes
tel
ecte
dpolit
ical
posi
tion
in(O
UR C
OU
NTRY)?
A w
om
an

TO
TA
L1
Very
u
nco
mfo
rtab
le2
34
56
78
91
0To
tally
com
fort
ab
le
Ind
iffe
ren
t (S
P.)
DK
Avera
ge
EU
27
26
75
61
2%
4%
5%
4%
10
%6
%7
%9
%6
%2
7%
8%
2%
6,5
BE
10
00
6%
1%
3%
3%
8%
6%
10%
14%
10%
36%
3%
- 7,6
BG
10
09
33%
10%
6%
4%
6%
3%
2%
1%
1%
6%
15%
13%
3,2
CZ
10
33
8%
1%
5%
7%
17%
11%
7%
7%
3%
6%
26%
2%
5,5
DK
10
01
4%
3%
3%
3%
5%
2%
5%
5%
4%
65%
1%
- 8,4
D-W
10
92
9%
4%
5%
3%
15%
5%
4%
7%
6%
24%
17%
1%
6,5
DE
15
23
9%
4%
5%
3%
16%
5%
4%
7%
6%
24%
16%
1%
6,4
D-E
43
19%
3%
7%
6%
16%
6%
4%
7%
3%
24%
15%
- 6,2
EE
10
07
31%
3%
6%
5%
9%
4%
4%
5%
5%
15%
10%
3%
4,7
IE1
00
77%
2%
3%
2%
6%
5%
5%
9%
7%
43%
7%
4%
7,7
EL
10
00
32%
5%
6%
6%
8%
8%
8%
7%
5%
12%
3%
- 4,6
ES
10
07
4%
2%
4%
4%
9%
9%
14%
11%
9%
32%
2%
- 7,4
FR1
07
86%
2%
3%
2%
9%
5%
7%
12%
7%
44%
2%
1%
7,8
IT1
04
812%
5%
7%
5%
9%
11%
12%
11%
5%
11%
10%
2%
5,7
CY
50
151%
6%
5%
4%
8%
3%
2%
3%
3%
14%
- 1%
3,7
LV1
01
234%
7%
7%
4%
11%
4%
3%
3%
3%
9%
13%
2%
3,8
LT1
02
245%
4%
5%
3%
7%
2%
2%
3%
3%
17%
4%
5%
4,0
LU5
04
8%
3%
3%
3%
8%
3%
7%
7%
3%
28%
25%
2%
7,0
HU
10
00
21%
6%
8%
6%
11%
6%
6%
5%
3%
9%
15%
4%
4,6
MT
50
011%
2%
4%
4%
11%
8%
6%
8%
6%
29%
6%
5%
6,7
NL
10
79
2%
1%
1%
2%
4%
5%
13%
18%
11%
40%
2%
1%
8,2
AT
10
01
12%
3%
8%
8%
15%
8%
8%
8%
3%
12%
13%
2%
5,4
PL1
00
015%
5%
6%
5%
7%
4%
5%
8%
4%
26%
9%
6%
6,1
PT1
02
07%
4%
6%
6%
10%
6%
6%
9%
3%
7%
31%
5%
5,6
RO
10
23
37%
8%
6%
5%
6%
4%
5%
4%
2%
6%
9%
8%
3,4
SI
10
22
27%
7%
5%
4%
8%
4%
5%
6%
3%
26%
4%
1%
5,4
SK
10
37
23%
6%
7%
6%
10%
12%
8%
8%
4%
5%
7%
4%
4,6
FI9
99
10%
7%
8%
6%
17%
6%
7%
11%
7%
11%
9%
1%
5,6
SE
10
06
3%
1%
2%
1%
4%
3%
5%
7%
4%
67%
2%
1%
8,7
UK
13
17
11%
2%
4%
3%
7%
3%
6%
8%
6%
45%
4%
1%
7,4
HR
10
00
37%
5%
6%
4%
9%
4%
6%
6%
4%
14%
3%
2%
4,4
TR
10
03
47%
9%
6%
3%
3%
2%
1%
1%
2%
14%
3%
9%
3,4
MK
10
09
47%
7%
4%
1%
5%
3%
2%
3%
2%
13%
4%
9%
3,5
QE6.2
And
usi
ng
asc
ale
from
1to
10,
ple
ase
tell
me
how
you
would
feel
about
hav
ing
som
eone
from
each
of
the
follo
win
gca
tegories
inth
ehig
hes
tel
ecte
dpolit
ical
posi
tion
in(O
UR C
OU
NTRY)?
A h
om
ose
xual
(gay
man
or
lesb
ian w
om
an)

TO
TA
LU
nco
mfo
rtab
leA
lit
tle
un
com
fort
ab
leC
om
fort
ab
leA
vera
ge
EU
27
26
75
62
0%
27
%4
2%
6,5
BE
10
00
10%
26%
60%
7,6
BG
10
09
49%
15%
8%
3,2
CZ
10
33
14%
42%
16%
5,5
DK
10
01
10%
14%
75%
8,4
D-W
10
92
18%
28%
37%
6,5
DE
15
23
18%
28%
37%
6,4
D-E
43
119%
32%
34%
6,2
EE
10
07
40%
22%
25%
4,7
IE1
00
712%
19%
59%
7,7
EL
10
00
43%
30%
24%
4,6
ES
10
07
9%
36%
52%
7,4
FR1
07
811%
23%
64%
7,8
IT1
04
824%
38%
27%
5,7
CY
50
161%
17%
21%
3,7
LV1
01
248%
22%
15%
3,8
LT1
02
254%
15%
23%
4,0
LU5
04
14%
21%
39%
7,0
HU
10
00
36%
28%
17%
4,6
MT
50
017%
28%
43%
6,7
NL
10
79
5%
23%
69%
8,2
AT
10
01
23%
39%
22%
5,4
PL1
00
026%
20%
39%
6,1
PT1
02
017%
27%
20%
5,6
RO
10
23
52%
19%
12%
3,4
SI
10
22
38%
21%
36%
5,4
SK
10
37
36%
35%
18%
4,6
FI9
99
24%
36%
30%
5,6
SE
10
06
6%
13%
78%
8,7
UK
13
17
17%
20%
58%
7,4
HR
10
00
47%
23%
25%
4,4
TR
10
03
62%
9%
17%
3,4
MK
10
09
57%
12%
18%
3,5
QE6.2
And
usi
ng
asc
ale
from
1to
10,
ple
ase
tell
me
how
you
would
feel
about
hav
ing
som
eone
from
each
of
the
follo
win
gca
tegories
inth
ehig
hes
tel
ecte
dpolit
ical
posi
tion
in(O
UR C
OU
NTRY)?
A h
om
ose
xual
(gay
man
or
lesb
ian w
om
an)

TO
TA
L1
Very
u
nco
mfo
rtab
le2
34
56
78
91
0To
tally
com
fort
ab
le
Ind
iffe
ren
t (S
P.)
DK
Avera
ge
EU
27
26
75
61
0%
5%
6%
6%
12
%7
%9
%9
%5
%2
2%
7%
2%
6,2
BE
10
00
15%
5%
10%
7%
14%
6%
9%
11%
5%
15%
2%
1%
5,5
BG
10
09
17%
7%
6%
6%
13%
6%
6%
5%
4%
13%
11%
6%
5,0
CZ
10
33
12%
6%
10%
11%
16%
12%
5%
5%
1%
4%
16%
2%
4,6
DK
10
01
9%
5%
6%
4%
7%
3%
7%
8%
5%
44%
1%
1%
7,2
D-W
10
92
13%
9%
8%
5%
14%
5%
5%
7%
5%
16%
12%
1%
5,4
DE
15
23
15%
8%
8%
6%
15%
5%
5%
7%
4%
15%
11%
1%
5,2
D-E
43
121%
6%
9%
8%
19%
6%
4%
4%
3%
11%
7%
2%
4,6
EE
10
07
12%
3%
8%
6%
13%
6%
6%
9%
6%
21%
8%
2%
6,1
IE1
00
712%
4%
4%
5%
9%
7%
8%
7%
6%
29%
5%
4%
6,5
EL
10
00
34%
7%
8%
7%
10%
7%
7%
8%
4%
8%
- -
4,2
ES
10
07
3%
3%
6%
7%
11%
9%
12%
10%
8%
29%
2%
- 7,1
FR1
07
85%
4%
3%
5%
11%
6%
10%
12%
6%
35%
2%
1%
7,3
IT1
04
89%
5%
7%
9%
12%
13%
12%
9%
4%
9%
9%
2%
5,6
CY
50
148%
5%
8%
4%
9%
4%
4%
4%
1%
11%
- 2%
3,5
LV1
01
212%
7%
9%
6%
15%
6%
6%
7%
4%
13%
13%
2%
5,4
LT1
02
225%
7%
6%
6%
10%
3%
4%
6%
3%
23%
4%
3%
5,2
LU5
04
9%
3%
5%
3%
9%
5%
7%
10%
2%
23%
21%
3%
6,5
HU
10
00
11%
4%
9%
9%
16%
10%
8%
8%
3%
12%
8%
2%
5,4
MT
50
026%
9%
5%
9%
13%
6%
4%
5%
1%
13%
5%
4%
4,4
NL
10
79
8%
4%
7%
7%
11%
9%
15%
14%
6%
17%
1%
1%
6,4
AT
10
01
16%
8%
11%
9%
16%
10%
7%
5%
3%
6%
6%
3%
4,6
PL1
00
04%
3%
7%
5%
8%
6%
7%
10%
6%
32%
9%
3%
7,2
PT1
02
02%
2%
5%
6%
11%
6%
9%
13%
3%
8%
31%
4%
6,4
RO
10
23
8%
3%
5%
6%
13%
7%
9%
8%
6%
15%
15%
5%
6,2
SI
10
22
15%
7%
8%
6%
11%
4%
6%
7%
5%
28%
3%
- 5,9
SK
10
37
9%
6%
9%
9%
12%
12%
11%
11%
5%
8%
5%
3%
5,5
FI9
99
6%
6%
9%
12%
16%
8%
13%
11%
5%
8%
5%
1%
5,5
SE
10
06
4%
2%
3%
4%
7%
4%
8%
11%
6%
49%
1%
1%
8,0
UK
13
17
11%
2%
4%
4%
10%
6%
8%
8%
4%
38%
4%
1%
7,0
HR
10
00
10%
5%
6%
4%
14%
7%
10%
8%
7%
25%
3%
1%
6,4
TR
10
03
15%
7%
6%
5%
12%
6%
5%
4%
5%
17%
13%
5%
5,4
MK
10
09
16%
6%
6%
6%
13%
5%
8%
8%
7%
20%
3%
2%
5,8
QE6.3
And
usi
ng
asc
ale
from
1to
10,
ple
ase
tell
me
how
you
would
feel
about
hav
ing
som
eone
from
each
of
the
follo
win
gca
tegories
inth
ehig
hes
tel
ecte
dpolit
ical
posi
tion
in(O
UR C
OU
NTRY)?
A p
erso
n f
rom
a d
iffe
rent
ethnic
origin
than
the
maj
ority
of
the
popula
tion

TO
TA
LU
nco
mfo
rtab
leA
lit
tle
un
com
fort
ab
leC
om
fort
ab
leA
vera
ge
EU
27
26
75
62
1%
34
%3
7%
6,2
BE
10
00
30%
37%
31%
5,5
BG
10
09
31%
31%
21%
5,0
CZ
10
33
28%
44%
11%
4,6
DK
10
01
20%
20%
58%
7,2
D-W
10
92
30%
29%
28%
5,4
DE
15
23
31%
31%
26%
5,2
D-E
43
136%
37%
18%
4,6
EE
10
07
23%
31%
36%
6,1
IE1
00
720%
29%
42%
6,5
EL
10
00
49%
31%
20%
4,2
ES
10
07
12%
38%
47%
7,1
FR1
07
812%
32%
53%
7,3
IT1
04
821%
47%
22%
5,6
CY
50
162%
20%
17%
3,5
LV1
01
227%
34%
24%
5,4
LT1
02
238%
23%
33%
5,2
LU5
04
17%
25%
35%
6,5
HU
10
00
24%
43%
22%
5,4
MT
50
040%
33%
19%
4,4
NL
10
79
18%
41%
38%
6,4
AT
10
01
35%
42%
14%
4,6
PL1
00
014%
26%
48%
7,2
PT1
02
09%
32%
25%
6,4
RO
10
23
16%
35%
29%
6,2
SI
10
22
30%
27%
39%
5,9
SK
10
37
24%
44%
24%
5,5
FI9
99
22%
49%
23%
5,5
SE
10
06
9%
23%
66%
8,0
UK
13
17
17%
28%
50%
7,0
HR
10
00
20%
36%
40%
6,4
TR
10
03
28%
27%
26%
5,4
MK
10
09
28%
32%
35%
5,8
QE6.3
And
usi
ng
asc
ale
from
1to
10,
ple
ase
tell
me
how
you
would
feel
about
hav
ing
som
eone
from
each
of
the
follo
win
gca
tegories
inth
ehig
hes
tel
ecte
dpolit
ical
posi
tion
in(O
UR C
OU
NTRY)?
A p
erso
n f
rom
a d
iffe
rent
ethnic
origin
than
the
maj
ority
of
the
popula
tion

TO
TA
L1
Very
u
nco
mfo
rtab
le2
34
56
78
91
0To
tally
com
fort
ab
le
Ind
iffe
ren
t (S
P.)
DK
Avera
ge
EU
27
26
75
61
0%
5%
9%
8%
12
%8
%9
%1
0%
5%
18
%5
%1
%5
,9
BE
10
00
7%
3%
8%
8%
13%
9%
12%
13%
8%
17%
2%
- 6,4
BG
10
09
11%
5%
6%
6%
10%
5%
7%
8%
6%
22%
9%
5%
6,2
CZ
10
33
4%
2%
6%
8%
13%
9%
11%
13%
8%
14%
11%
1%
6,4
DK
10
01
5%
3%
5%
7%
12%
5%
8%
10%
6%
38%
1%
- 7,2
D-W
10
92
22%
11%
14%
10%
11%
3%
4%
6%
3%
7%
8%
1%
4,1
DE
15
23
25%
10%
14%
9%
11%
3%
5%
6%
3%
7%
7%
- 4,0
D-E
43
133%
8%
11%
9%
13%
4%
6%
5%
2%
6%
3%
- 3,7
EE
10
07
12%
4%
9%
6%
14%
6%
6%
8%
5%
22%
7%
1%
6,0
IE1
00
78%
5%
5%
8%
11%
7%
6%
7%
6%
31%
4%
2%
6,6
EL
10
00
10%
4%
6%
8%
10%
9%
11%
12%
10%
19%
1%
- 6,3
ES
10
07
3%
4%
7%
6%
12%
9%
17%
11%
8%
22%
1%
- 6,8
FR1
07
87%
6%
8%
8%
16%
9%
10%
11%
5%
19%
1%
- 6,1
IT1
04
86%
3%
7%
8%
11%
13%
14%
12%
6%
12%
6%
2%
6,1
CY
50
122%
6%
9%
6%
8%
6%
9%
6%
6%
21%
- 1%
5,4
LV1
01
29%
4%
9%
6%
14%
7%
9%
9%
6%
20%
6%
1%
6,1
LT1
02
216%
6%
7%
7%
13%
4%
4%
5%
4%
30%
2%
2%
6,0
LU5
04
9%
5%
6%
8%
15%
6%
8%
11%
4%
15%
12%
1%
5,9
HU
10
00
6%
5%
10%
8%
10%
8%
10%
10%
5%
20%
6%
2%
6,2
MT
50
08%
2%
3%
7%
11%
6%
7%
10%
9%
27%
6%
4%
6,9
NL
10
79
8%
5%
11%
11%
16%
11%
13%
10%
4%
10%
1%
- 5,5
AT
10
01
9%
4%
11%
10%
12%
8%
9%
9%
4%
15%
7%
2%
5,7
PL1
00
06%
3%
5%
4%
7%
4%
7%
10%
7%
36%
9%
2%
7,3
PT1
02
05%
3%
8%
8%
12%
8%
10%
11%
3%
8%
20%
4%
5,8
RO
10
23
2%
2%
2%
3%
9%
5%
9%
12%
9%
29%
14%
4%
7,7
SI
10
22
14%
7%
9%
6%
12%
5%
6%
9%
5%
25%
2%
- 5,9
SK
10
37
7%
5%
9%
8%
9%
12%
9%
12%
9%
16%
2%
2%
6,1
FI9
99
7%
8%
15%
12%
15%
9%
11%
9%
6%
6%
2%
- 5,2
SE
10
06
7%
4%
6%
8%
14%
10%
12%
10%
4%
24%
1%
- 6,4
UK
13
17
14%
6%
10%
9%
14%
5%
6%
7%
3%
23%
2%
1%
5,6
HR
10
00
3%
4%
4%
3%
8%
6%
9%
8%
7%
46%
1%
1%
7,8
TR
10
03
7%
4%
6%
7%
10%
6%
6%
7%
9%
22%
12%
4%
6,5
MK
10
09
24%
9%
7%
5%
12%
6%
5%
7%
5%
17%
2%
1%
5,0
QE6.4
And
usi
ng
asc
ale
from
1to
10,
ple
ase
tell
me
how
you
would
feel
about
hav
ing
som
eone
from
each
of
the
follo
win
gca
tegories
inth
ehig
hes
tel
ecte
dpolit
ical
posi
tion
in(O
UR C
OU
NTRY)?
A p
erso
n a
ged
under
30

TO
TA
LU
nco
mfo
rtab
leA
lit
tle
un
com
fort
ab
leC
om
fort
ab
leA
vera
ge
EU
27
26
75
62
4%
37
%3
3%
5,9
BE
10
00
17%
41%
39%
6,4
BG
10
09
22%
28%
36%
6,2
CZ
10
33
13%
41%
35%
6,4
DK
10
01
13%
31%
55%
7,2
D-W
10
92
48%
28%
16%
4,1
DE
15
23
49%
29%
15%
4,0
D-E
43
152%
31%
13%
3,7
EE
10
07
25%
33%
35%
6,0
IE1
00
718%
32%
44%
6,6
EL
10
00
21%
37%
42%
6,3
ES
10
07
14%
44%
41%
6,8
FR1
07
821%
42%
35%
6,1
IT1
04
816%
45%
30%
6,1
CY
50
137%
30%
33%
5,4
LV1
01
223%
36%
34%
6,1
LT1
02
229%
27%
40%
6,0
LU5
04
20%
36%
30%
5,9
HU
10
00
21%
35%
36%
6,2
MT
50
014%
31%
46%
6,9
NL
10
79
24%
50%
24%
5,5
AT
10
01
24%
40%
28%
5,7
PL1
00
015%
22%
53%
7,3
PT1
02
016%
37%
22%
5,8
RO
10
23
5%
26%
49%
7,7
SI
10
22
30%
29%
39%
5,9
SK
10
37
21%
38%
36%
6,1
FI9
99
30%
47%
22%
5,2
SE
10
06
17%
44%
38%
6,4
UK
13
17
30%
35%
32%
5,6
HR
10
00
11%
25%
62%
7,8
TR
10
03
17%
29%
37%
6,5
MK
10
09
40%
27%
30%
5,0
QE6.4
And
usi
ng
asc
ale
from
1to
10,
ple
ase
tell
me
how
you
would
feel
about
hav
ing
som
eone
from
each
of
the
follo
win
gca
tegories
inth
ehig
hes
tel
ecte
dpolit
ical
posi
tion
in(O
UR C
OU
NTRY)?
A p
erso
n a
ged
under
30

TO
TA
L1
Very
u
nco
mfo
rtab
le2
34
56
78
91
0To
tally
com
fort
ab
le
Ind
iffe
ren
t (S
P.)
DK
Avera
ge
EU
27
26
75
67
%4
%5
%6
%1
3%
7%
9%
9%
6%
24
%8
%2
%6
,5
BE
10
00
14%
9%
9%
8%
13%
6%
11%
10%
5%
14%
1%
- 5,4
BG
10
09
15%
6%
6%
6%
10%
7%
6%
6%
5%
15%
12%
6%
5,3
CZ
10
33
4%
3%
4%
7%
19%
12%
8%
7%
3%
8%
24%
1%
5,8
DK
10
01
13%
6%
5%
5%
11%
4%
9%
8%
4%
33%
1%
1%
6,5
D-W
10
92
8%
6%
6%
6%
16%
5%
6%
8%
4%
21%
13%
1%
6,1
DE
15
23
9%
6%
6%
6%
17%
6%
6%
7%
4%
19%
13%
1%
5,9
D-E
43
117%
4%
6%
6%
22%
8%
4%
6%
4%
12%
10%
1%
5,2
EE
10
07
10%
3%
6%
5%
13%
7%
7%
8%
5%
23%
12%
1%
6,3
IE1
00
75%
3%
2%
3%
7%
5%
7%
8%
8%
44%
6%
2%
7,8
EL
10
00
25%
6%
6%
7%
10%
9%
8%
9%
7%
12%
1%
- 5,0
ES
10
07
2%
3%
4%
6%
11%
10%
15%
11%
7%
28%
3%
- 7,1
FR1
07
86%
4%
6%
6%
14%
5%
10%
11%
5%
29%
2%
2%
6,8
IT1
04
87%
4%
7%
8%
12%
10%
13%
10%
6%
11%
10%
2%
5,9
CY
50
145%
7%
7%
5%
11%
3%
2%
4%
2%
13%
- 1%
3,7
LV1
01
211%
5%
9%
5%
16%
4%
7%
7%
5%
14%
15%
2%
5,6
LT1
02
220%
5%
6%
5%
9%
3%
4%
6%
5%
28%
5%
4%
5,8
LU5
04
7%
3%
5%
5%
13%
5%
8%
9%
4%
18%
21%
2%
6,3
HU
10
00
4%
2%
4%
5%
14%
9%
9%
10%
5%
21%
15%
2%
6,8
MT
50
025%
9%
8%
6%
12%
5%
4%
3%
4%
15%
5%
4%
4,6
NL
10
79
8%
4%
7%
8%
12%
8%
14%
14%
4%
18%
2%
1%
6,2
AT
10
01
14%
5%
9%
12%
15%
10%
9%
6%
1%
7%
8%
4%
4,8
PL1
00
02%
1%
3%
4%
8%
4%
6%
8%
6%
46%
10%
2%
8,1
PT1
02
02%
1%
3%
4%
11%
7%
9%
12%
3%
9%
35%
4%
6,6
RO
10
23
4%
1%
3%
4%
13%
6%
8%
10%
8%
20%
18%
5%
7,0
SI
10
22
12%
5%
6%
4%
11%
5%
6%
8%
6%
33%
3%
1%
6,6
SK
10
37
2%
2%
3%
4%
10%
13%
8%
13%
12%
19%
11%
3%
7,1
FI9
99
3%
5%
9%
9%
21%
11%
12%
10%
4%
8%
7%
1%
5,7
SE
10
06
6%
3%
4%
5%
11%
7%
10%
11%
6%
34%
1%
2%
7,2
UK
13
17
10%
3%
4%
5%
11%
5%
8%
9%
5%
35%
4%
1%
7,0
HR
10
00
7%
5%
4%
3%
15%
6%
9%
11%
6%
30%
2%
2%
6,8
TR
10
03
21%
7%
8%
7%
9%
5%
5%
3%
3%
16%
11%
5%
4,9
MK
10
09
15%
6%
6%
5%
12%
7%
7%
10%
7%
20%
3%
2%
5,9
QE6.5
And
usi
ng
asc
ale
from
1to
10,
ple
ase
tell
me
how
you
would
feel
about
hav
ing
som
eone
from
each
of
the
follo
win
gca
tegories
inth
ehig
hes
tel
ecte
dpolit
ical
posi
tion
in(O
UR C
OU
NTRY)?
A p
erso
n f
rom
a d
iffe
rent
relig
ion t
han
the
maj
ority
of
the
popula
tion

TO
TA
LU
nco
mfo
rtab
leA
lit
tle
un
com
fort
ab
leC
om
fort
ab
leA
vera
ge
EU
27
26
75
61
6%
35
%3
9%
6,5
BE
10
00
32%
38%
29%
5,4
BG
10
09
28%
28%
25%
5,3
CZ
10
33
11%
45%
18%
5,8
DK
10
01
24%
29%
46%
6,5
D-W
10
92
20%
34%
33%
6,1
DE
15
23
21%
35%
30%
5,9
D-E
43
127%
40%
22%
5,2
EE
10
07
19%
32%
36%
6,3
IE1
00
710%
22%
59%
7,8
EL
10
00
37%
33%
28%
5,0
ES
10
07
9%
42%
46%
7,1
FR1
07
815%
35%
46%
6,8
IT1
04
819%
43%
27%
5,9
CY
50
159%
21%
19%
3,7
LV1
01
225%
32%
26%
5,6
LT1
02
231%
21%
38%
5,8
LU5
04
15%
31%
31%
6,3
HU
10
00
10%
36%
36%
6,8
MT
50
041%
28%
22%
4,6
NL
10
79
19%
42%
36%
6,2
AT
10
01
29%
45%
14%
4,8
PL1
00
06%
21%
61%
8,1
PT1
02
06%
30%
25%
6,6
RO
10
23
8%
31%
38%
7,0
SI
10
22
23%
26%
47%
6,6
SK
10
37
8%
35%
44%
7,1
FI9
99
17%
54%
22%
5,7
SE
10
06
13%
32%
52%
7,2
UK
13
17
16%
29%
49%
7,0
HR
10
00
16%
33%
47%
6,8
TR
10
03
36%
26%
22%
4,9
MK
10
09
27%
31%
37%
5,9
QE6.5
And
usi
ng
asc
ale
from
1to
10,
ple
ase
tell
me
how
you
would
feel
about
hav
ing
som
eone
from
each
of
the
follo
win
gca
tegories
inth
ehig
hes
tel
ecte
dpolit
ical
posi
tion
in(O
UR C
OU
NTRY)?
A p
erso
n f
rom
a d
iffe
rent
relig
ion t
han
the
maj
ority
of
the
popula
tion

TO
TA
L1
Very
u
nco
mfo
rtab
le2
34
56
78
91
0To
tally
com
fort
ab
le
Ind
iffe
ren
t (S
P.)
DK
Avera
ge
EU
27
26
75
64
%2
%3
%4
%1
1%
7%
9%
11
%7
%3
2%
8%
2%
7,4
BE
10
00
5%
2%
3%
4%
10%
7%
11%
15%
11%
28%
3%
1%
7,3
BG
10
09
13%
4%
5%
5%
15%
8%
7%
7%
3%
14%
10%
9%
5,6
CZ
10
33
3%
1%
4%
5%
16%
14%
11%
12%
5%
9%
18%
2%
6,4
DK
10
01
2%
1%
2%
2%
6%
3%
7%
7%
8%
60%
1%
1%
8,6
D-W
10
92
3%
2%
4%
3%
16%
6%
7%
8%
7%
28%
15%
1%
7,2
DE
15
23
3%
2%
4%
3%
16%
6%
8%
8%
6%
28%
15%
1%
7,1
D-E
43
17%
3%
6%
4%
18%
7%
8%
7%
3%
23%
12%
2%
6,4
EE
10
07
15%
4%
7%
5%
11%
6%
5%
7%
7%
23%
8%
2%
6,0
IE1
00
71%
1%
1%
2%
3%
5%
6%
11%
9%
53%
6%
2%
8,7
EL
10
00
5%
2%
3%
4%
8%
7%
12%
17%
12%
29%
1%
- 7,4
ES
10
07
3%
2%
3%
4%
11%
11%
14%
14%
8%
27%
2%
1%
7,3
FR1
07
82%
1%
2%
3%
10%
5%
9%
14%
11%
40%
2%
1%
8,0
IT1
04
82%
3%
4%
6%
9%
11%
14%
14%
8%
16%
11%
2%
6,8
CY
50
112%
2%
3%
5%
12%
6%
9%
10%
6%
34%
- 1%
6,9
LV1
01
27%
4%
5%
5%
15%
6%
7%
10%
7%
20%
13%
1%
6,4
LT1
02
220%
4%
6%
5%
11%
3%
4%
7%
5%
28%
4%
3%
5,9
LU5
04
5%
2%
2%
2%
7%
3%
7%
11%
7%
27%
25%
2%
7,5
HU
10
00
13%
5%
7%
7%
12%
9%
8%
9%
5%
14%
8%
3%
5,6
MT
50
05%
1%
2%
4%
10%
6%
7%
12%
10%
29%
9%
5%
7,5
NL
10
79
2%
1%
2%
3%
6%
6%
13%
19%
10%
35%
2%
1%
7,9
AT
10
01
4%
- 3%
7%
19%
10%
13%
11%
4%
15%
12%
2%
6,5
PL1
00
02%
- 2%
2%
7%
3%
6%
9%
7%
51%
8%
3%
8,5
PT1
02
05%
3%
7%
7%
12%
5%
7%
13%
3%
7%
24%
7%
5,9
RO
10
23
9%
5%
6%
7%
11%
6%
9%
8%
5%
13%
13%
8%
5,8
SI
10
22
12%
5%
7%
5%
12%
4%
8%
8%
5%
30%
4%
- 6,4
SK
10
37
4%
4%
5%
6%
10%
13%
10%
14%
10%
15%
6%
3%
6,6
FI9
99
3%
3%
6%
8%
17%
12%
15%
15%
7%
8%
5%
1%
6,2
SE
10
06
2%
- 1%
2%
5%
3%
5%
10%
7%
62%
1%
2%
8,8
UK
13
17
3%
2%
2%
2%
7%
3%
7%
10%
7%
53%
3%
1%
8,3
HR
10
00
1%
2%
2%
2%
8%
4%
9%
12%
11%
46%
1%
2%
8,3
TR
10
03
7%
5%
4%
6%
11%
8%
7%
7%
6%
20%
14%
5%
6,3
MK
10
09
24%
10%
8%
4%
11%
5%
6%
6%
6%
13%
3%
4%
4,7
QE6.6
And
usi
ng
asc
ale
from
1to
10,
ple
ase
tell
me
how
you
would
feel
about
hav
ing
som
eone
from
each
of
the
follo
win
gca
tegories
inth
ehig
hes
tel
ecte
dpolit
ical
posi
tion
in(O
UR C
OU
NTRY)?
A d
isab
led p
erso
n

TO
TA
LU
nco
mfo
rtab
leA
lit
tle
un
com
fort
ab
leC
om
fort
ab
leA
vera
ge
EU
27
26
75
69
%3
1%
51
%7
,4
BE
10
00
10%
32%
54%
7,3
BG
10
09
22%
34%
24%
5,6
CZ
10
33
8%
46%
26%
6,4
DK
10
01
5%
18%
75%
8,6
D-W
10
92
9%
32%
44%
7,2
DE
15
23
10%
33%
42%
7,1
D-E
43
115%
37%
34%
6,4
EE
10
07
26%
27%
37%
6,0
IE1
00
74%
16%
73%
8,7
EL
10
00
11%
31%
57%
7,4
ES
10
07
8%
39%
49%
7,3
FR1
07
85%
27%
66%
8,0
IT1
04
810%
40%
38%
6,8
CY
50
117%
31%
50%
6,9
LV1
01
216%
33%
36%
6,4
LT1
02
230%
23%
40%
5,9
LU5
04
9%
20%
44%
7,5
HU
10
00
25%
36%
27%
5,6
MT
50
08%
27%
51%
7,5
NL
10
79
5%
28%
63%
7,9
AT
10
01
7%
50%
30%
6,5
PL1
00
04%
18%
67%
8,5
PT1
02
014%
31%
23%
5,9
RO
10
23
20%
33%
26%
5,8
SI
10
22
24%
29%
43%
6,4
SK
10
37
13%
40%
39%
6,6
FI9
99
11%
53%
30%
6,2
SE
10
06
3%
15%
79%
8,8
UK
13
17
7%
19%
70%
8,3
HR
10
00
5%
23%
69%
8,3
TR
10
03
17%
32%
32%
6,3
MK
10
09
42%
26%
25%
4,7
QE6.6
And
usi
ng
asc
ale
from
1to
10,
ple
ase
tell
me
how
you
would
feel
about
hav
ing
som
eone
from
each
of
the
follo
win
gca
tegories
inth
ehig
hes
tel
ecte
dpolit
ical
posi
tion
in(O
UR C
OU
NTRY)?
A d
isab
led p
erso
n

TO
TA
L1
Very
u
nco
mfo
rtab
le2
34
56
78
91
0To
tally
com
fort
ab
le
Ind
iffe
ren
t (S
P.)
DK
Avera
ge
EU
27
26
75
61
9%
9%
11
%9
%1
1%
7%
7%
7%
3%
11
%5
%1
%4
,8
BE
10
00
15%
9%
13%
9%
12%
7%
8%
9%
4%
12%
2%
- 5,1
BG
10
09
34%
11%
10%
7%
9%
3%
3%
1%
1%
7%
8%
6%
3,3
CZ
10
33
22%
8%
16%
12%
10%
9%
6%
4%
1%
3%
8%
1%
3,8
DK
10
01
20%
10%
12%
5%
14%
5%
7%
6%
4%
17%
- -
4,9
D-W
10
92
24%
12%
13%
8%
10%
4%
5%
5%
2%
9%
7%
1%
4,2
DE
15
23
29%
11%
12%
7%
10%
4%
5%
5%
2%
8%
6%
1%
3,9
D-E
43
150%
9%
9%
5%
8%
6%
3%
3%
1%
2%
3%
1%
2,8
EE
10
07
23%
7%
12%
7%
11%
6%
5%
7%
3%
12%
6%
1%
4,7
IE1
00
719%
8%
6%
6%
8%
8%
7%
7%
4%
19%
4%
4%
5,4
EL
10
00
29%
10%
10%
9%
10%
9%
8%
5%
4%
5%
1%
- 4,1
ES
10
07
8%
8%
10%
11%
11%
9%
12%
8%
6%
15%
2%
- 5,7
FR1
07
821%
10%
12%
13%
15%
6%
6%
7%
2%
8%
- -
4,4
IT1
04
810%
7%
7%
9%
11%
11%
13%
9%
5%
7%
10%
1%
5,4
CY
50
155%
5%
6%
8%
5%
4%
3%
4%
2%
8%
- -
3,1
LV1
01
235%
13%
14%
7%
9%
4%
3%
2%
2%
5%
5%
1%
3,3
LT1
02
238%
8%
8%
6%
9%
3%
4%
4%
3%
13%
3%
1%
3,9
LU5
04
31%
10%
10%
6%
11%
5%
7%
5%
2%
6%
5%
2%
3,8
HU
10
00
17%
8%
12%
8%
13%
7%
7%
7%
3%
9%
8%
1%
4,7
MT
50
033%
6%
8%
8%
12%
6%
5%
5%
3%
9%
2%
3%
4,1
NL
10
79
18%
8%
13%
10%
12%
10%
10%
9%
2%
7%
1%
- 4,7
AT
10
01
13%
5%
11%
10%
12%
11%
9%
6%
3%
10%
8%
2%
5,1
PL1
00
012%
6%
11%
6%
9%
5%
6%
7%
4%
24%
7%
3%
5,9
PT1
02
09%
7%
10%
9%
13%
6%
7%
9%
3%
4%
19%
4%
4,9
RO
10
23
22%
11%
9%
7%
10%
5%
5%
4%
3%
9%
9%
6%
4,2
SI
10
22
28%
7%
9%
8%
13%
7%
7%
5%
3%
10%
3%
- 4,4
SK
10
37
28%
12%
12%
8%
10%
8%
5%
6%
3%
3%
2%
3%
3,8
FI9
99
15%
16%
18%
14%
10%
7%
8%
5%
2%
3%
2%
- 4,0
SE
10
06
16%
6%
11%
11%
11%
8%
9%
9%
5%
13%
- 1%
5,2
UK
13
17
20%
8%
11%
9%
11%
6%
6%
6%
3%
17%
2%
1%
5,0
HR
10
00
33%
11%
8%
4%
10%
6%
8%
4%
4%
9%
2%
1%
4,1
TR
10
03
33%
12%
6%
5%
7%
4%
2%
4%
3%
13%
7%
4%
4,0
MK
10
09
51%
10%
5%
4%
6%
4%
2%
3%
2%
11%
1%
1%
3,3
QE6.7
And
usi
ng
asc
ale
from
1to
10,
ple
ase
tell
me
how
you
would
feel
about
hav
ing
som
eone
from
each
of
the
follo
win
gca
tegories
inth
ehig
hes
tel
ecte
dpolit
ical
posi
tion
in(O
UR C
OU
NTRY)?
A p
erso
n a
ged
ove
r 75

TO
TA
LU
nco
mfo
rtab
leA
lit
tle
un
com
fort
ab
leC
om
fort
ab
leA
vera
ge
EU
27
26
75
63
8%
35
%2
1%
4,8
BE
10
00
37%
36%
25%
5,1
BG
10
09
55%
22%
9%
3,3
CZ
10
33
46%
37%
7%
3,8
DK
10
01
43%
30%
26%
4,9
D-W
10
92
48%
27%
17%
4,2
DE
15
23
52%
26%
15%
3,9
D-E
43
167%
22%
6%
2,8
EE
10
07
41%
29%
22%
4,7
IE1
00
733%
28%
30%
5,4
EL
10
00
49%
36%
14%
4,1
ES
10
07
27%
43%
29%
5,7
FR1
07
843%
40%
17%
4,4
IT1
04
823%
45%
21%
5,4
CY
50
166%
20%
14%
3,1
LV1
01
262%
23%
9%
3,3
LT1
02
255%
22%
19%
3,9
LU5
04
52%
29%
13%
3,8
HU
10
00
38%
35%
18%
4,7
MT
50
047%
31%
17%
4,1
NL
10
79
40%
41%
18%
4,7
AT
10
01
29%
42%
19%
5,1
PL1
00
028%
26%
36%
5,9
PT1
02
026%
35%
16%
4,9
RO
10
23
42%
28%
15%
4,2
SI
10
22
44%
35%
18%
4,4
SK
10
37
52%
31%
13%
3,8
FI9
99
49%
39%
10%
4,0
SE
10
06
34%
38%
27%
5,2
UK
13
17
38%
32%
26%
5,0
HR
10
00
52%
28%
17%
4,1
TR
10
03
51%
19%
20%
4,0
MK
10
09
66%
15%
16%
3,3
QE6.7
And
usi
ng
asc
ale
from
1to
10,
ple
ase
tell
me
how
you
would
feel
about
hav
ing
som
eone
from
each
of
the
follo
win
gca
tegories
inth
ehig
hes
tel
ecte
dpolit
ical
posi
tion
in(O
UR C
OU
NTRY)?
A p
erso
n a
ged
ove
r 75

TO
TA
LTo
tally in
fa
vo
ur
So
mew
hat
in f
avo
ur
So
mew
hat
op
po
sed
To
tally
op
po
sed
DK
In f
avo
ur
Op
po
sed
EU
27
26
75
62
7%
42
%1
5%
8%
8%
69
%2
3%
BE
10
00
20%
39%
26%
12%
3%
59%
38%
BG
10
09
35%
39%
8%
4%
14%
74%
12%
CZ
10
33
19%
41%
23%
8%
9%
60%
31%
DK
10
01
29%
33%
17%
18%
3%
62%
35%
D-W
10
92
27%
41%
17%
9%
6%
68%
26%
DE
15
23
26%
41%
17%
9%
7%
67%
26%
D-E
43
121%
40%
20%
12%
7%
61%
32%
EE
10
07
37%
41%
8%
6%
8%
78%
14%
IE1
00
735%
37%
13%
5%
10%
72%
18%
EL
10
00
30%
42%
20%
7%
1%
72%
27%
ES
10
07
31%
48%
10%
6%
5%
79%
16%
FR1
07
827%
41%
14%
12%
6%
68%
26%
IT1
04
817%
47%
18%
8%
10%
64%
26%
CY
50
141%
31%
15%
10%
3%
72%
25%
LV1
01
221%
39%
18%
9%
13%
60%
27%
LT1
02
216%
46%
12%
6%
20%
62%
18%
LU5
04
38%
35%
12%
5%
10%
73%
17%
HU
10
00
27%
46%
17%
5%
5%
73%
22%
MT
50
021%
34%
20%
11%
14%
55%
31%
NL
10
79
24%
34%
19%
20%
3%
58%
39%
AT
10
01
12%
39%
32%
7%
10%
51%
39%
PL1
00
021%
53%
10%
3%
13%
74%
13%
PT1
02
026%
49%
11%
5%
9%
75%
16%
RO
10
23
41%
36%
8%
4%
11%
77%
12%
SI
10
22
38%
42%
11%
4%
5%
80%
15%
SK
10
37
19%
50%
20%
5%
6%
69%
25%
FI9
99
23%
51%
18%
5%
3%
74%
23%
SE
10
06
35%
33%
14%
14%
4%
68%
28%
UK
13
17
38%
36%
11%
7%
8%
74%
18%
HR
10
00
31%
49%
9%
4%
7%
80%
13%
TR
10
03
26%
39%
12%
6%
17%
65%
18%
MK
10
09
39%
30%
12%
11%
8%
69%
23%
QE7.1
Would
you
be
infa
vour
of
or
oppose
dto
spec
ific
mea
sure
sbei
ng
adopte
dto
pro
vide
equal
opport
unitie
sfo
rev
eryo
ne
inth
efiel
dof
emplo
ymen
t?M
easu
res
such
as,
for
exam
ple
spec
ial tr
ainin
g s
chem
es o
r ad
apte
d s
elec
tion a
nd r
ecru
item
ent
pro
cess
es,
for
peo
ple
dep
endin
g o
n t
hei
r...
Eth
nic
origin

TO
TA
LTo
tally in
fa
vo
ur
So
mew
hat
in f
avo
ur
So
mew
hat
op
po
sed
To
tally
op
po
sed
DK
In f
avo
ur
Op
po
sed
EU
27
26
75
63
6%
39
%1
0%
8%
7%
75
%1
8%
BE
10
00
32%
40%
15%
12%
1%
72%
27%
BG
10
09
50%
31%
4%
4%
11%
81%
8%
CZ
10
33
37%
36%
12%
8%
7%
73%
20%
DK
10
01
32%
24%
16%
24%
4%
56%
40%
D-W
10
92
36%
36%
13%
10%
5%
72%
23%
DE
15
23
37%
35%
13%
10%
5%
72%
23%
D-E
43
139%
30%
12%
13%
6%
69%
25%
EE
10
07
42%
36%
7%
8%
7%
78%
15%
IE1
00
746%
35%
6%
3%
10%
81%
9%
EL
10
00
58%
38%
3%
1%
- 96%
4%
ES
10
07
41%
44%
5%
5%
5%
85%
10%
FR1
07
830%
40%
12%
13%
5%
70%
25%
IT1
04
826%
46%
11%
8%
9%
72%
19%
CY
50
168%
22%
3%
4%
3%
90%
7%
LV1
01
227%
37%
16%
8%
12%
64%
24%
LT1
02
223%
45%
8%
5%
19%
68%
13%
LU5
04
42%
33%
9%
7%
9%
75%
16%
HU
10
00
42%
41%
10%
3%
4%
83%
13%
MT
50
045%
43%
3%
1%
8%
88%
4%
NL
10
79
28%
27%
20%
23%
2%
55%
43%
AT
10
01
28%
44%
14%
7%
7%
72%
21%
PL1
00
030%
49%
7%
3%
11%
79%
10%
PT1
02
026%
49%
11%
5%
9%
75%
16%
RO
10
23
48%
31%
6%
4%
11%
79%
10%
SI
10
22
49%
40%
4%
3%
4%
89%
7%
SK
10
37
28%
47%
14%
6%
5%
75%
20%
FI9
99
26%
45%
17%
8%
4%
71%
25%
SE
10
06
37%
25%
14%
20%
4%
62%
34%
UK
13
17
44%
34%
8%
7%
7%
78%
15%
HR
10
00
38%
46%
7%
3%
6%
84%
10%
TR
10
03
29%
39%
9%
7%
16%
68%
16%
MK
10
09
43%
30%
9%
11%
7%
73%
20%
QE7.2
Would
you
be
infa
vour
of
or
oppose
dto
spec
ific
mea
sure
sbei
ng
adopte
dto
pro
vide
equal
opport
unitie
sfo
rev
eryo
ne
inth
efiel
dof
emplo
ymen
t?M
easu
res
such
as,
for
exam
ple
spec
ial tr
ainin
g s
chem
es o
r ad
apte
d s
elec
tion a
nd r
ecru
item
ent
pro
cess
es,
for
peo
ple
dep
endin
g o
n t
hei
r...
G
ender

TO
TA
LTo
tally in
fa
vo
ur
So
mew
hat
in f
avo
ur
So
mew
hat
op
po
sed
To
tally
op
po
sed
DK
In f
avo
ur
Op
po
sed
EU
27
26
75
62
6%
37
%1
6%
12
%9
%6
3%
28
%
BE
10
00
26%
40%
18%
15%
1%
66%
33%
BG
10
09
22%
28%
17%
11%
22%
50%
28%
CZ
10
33
24%
38%
19%
10%
9%
62%
29%
DK
10
01
26%
36%
18%
16%
4%
62%
34%
D-W
10
92
25%
32%
20%
15%
8%
57%
35%
DE
15
23
24%
32%
20%
16%
8%
56%
36%
D-E
43
120%
33%
19%
20%
8%
53%
39%
EE
10
07
29%
33%
15%
11%
12%
62%
26%
IE1
00
741%
35%
8%
4%
12%
76%
12%
EL
10
00
30%
44%
18%
8%
- 74%
26%
ES
10
07
32%
44%
9%
8%
7%
76%
17%
FR1
07
829%
36%
14%
15%
6%
65%
29%
IT1
04
818%
46%
16%
9%
11%
64%
25%
CY
50
145%
32%
11%
7%
5%
77%
18%
LV1
01
216%
31%
23%
15%
15%
47%
38%
LT1
02
210%
34%
16%
15%
25%
44%
31%
LU5
04
36%
29%
16%
9%
10%
65%
25%
HU
10
00
21%
36%
25%
8%
10%
57%
33%
MT
50
038%
43%
6%
3%
10%
81%
9%
NL
10
79
25%
25%
21%
26%
3%
50%
47%
AT
10
01
15%
38%
26%
9%
12%
53%
35%
PL1
00
018%
41%
16%
8%
17%
59%
24%
PT1
02
026%
46%
12%
5%
11%
72%
17%
RO
10
23
25%
27%
18%
14%
16%
52%
32%
SI
10
22
36%
39%
14%
6%
5%
75%
20%
SK
10
37
16%
41%
26%
9%
8%
57%
35%
FI9
99
18%
41%
23%
12%
6%
59%
35%
SE
10
06
33%
22%
16%
24%
5%
55%
40%
UK
13
17
38%
34%
11%
8%
9%
72%
19%
HR
10
00
27%
40%
14%
10%
9%
67%
24%
TR
10
03
16%
20%
18%
22%
24%
36%
40%
MK
10
09
21%
22%
16%
24%
17%
43%
40%
QE7.3
Would
you
be
infa
vour
of
or
oppose
dto
spec
ific
mea
sure
sbei
ng
adopte
dto
pro
vide
equal
opport
unitie
sfo
rev
eryo
ne
inth
efiel
dof
emplo
ymen
t?M
easu
res
such
as,
for
exam
ple
spec
ial tr
ainin
g s
chem
es o
r ad
apte
d s
elec
tion a
nd r
ecru
item
ent
pro
cess
es,
for
peo
ple
dep
endin
g o
n t
hei
r...
Sex
ual
orien
tation

TO
TA
LTo
tally in
fa
vo
ur
So
mew
hat
in f
avo
ur
So
mew
hat
op
po
sed
To
tally
op
po
sed
DK
In f
avo
ur
Op
po
sed
EU
27
26
75
63
2%
45
%1
1%
6%
6%
77
%1
7%
BE
10
00
28%
48%
16%
7%
1%
76%
23%
BG
10
09
40%
38%
7%
3%
12%
78%
10%
CZ
10
33
34%
42%
12%
6%
6%
76%
18%
DK
10
01
23%
27%
23%
23%
4%
50%
46%
D-W
10
92
33%
43%
15%
5%
4%
76%
20%
DE
15
23
33%
43%
15%
5%
4%
76%
20%
D-E
43
134%
43%
10%
8%
5%
77%
18%
EE
10
07
36%
43%
10%
4%
7%
79%
14%
IE1
00
743%
38%
8%
3%
8%
81%
11%
EL
10
00
45%
45%
8%
2%
- 90%
10%
ES
10
07
40%
47%
5%
4%
4%
87%
9%
FR1
07
831%
45%
11%
9%
4%
76%
20%
IT1
04
823%
52%
11%
6%
8%
75%
17%
CY
50
150%
37%
6%
4%
3%
87%
10%
LV1
01
225%
43%
17%
5%
10%
68%
22%
LT1
02
220%
48%
10%
3%
19%
68%
13%
LU5
04
37%
36%
13%
5%
9%
73%
18%
HU
10
00
39%
45%
9%
3%
4%
84%
12%
MT
50
039%
47%
4%
1%
9%
86%
5%
NL
10
79
23%
43%
18%
14%
2%
66%
32%
AT
10
01
24%
45%
18%
6%
7%
69%
24%
PL1
00
026%
53%
8%
3%
10%
79%
11%
PT1
02
028%
52%
8%
4%
8%
80%
12%
RO
10
23
37%
38%
11%
3%
11%
75%
14%
SI
10
22
43%
42%
9%
2%
4%
85%
11%
SK
10
37
26%
49%
16%
4%
5%
75%
20%
FI9
99
24%
51%
16%
5%
4%
75%
21%
SE
10
06
27%
32%
20%
16%
5%
59%
36%
UK
13
17
40%
39%
9%
4%
8%
79%
13%
HR
10
00
35%
48%
8%
2%
7%
83%
10%
TR
10
03
22%
41%
13%
7%
17%
63%
20%
MK
10
09
39%
33%
10%
10%
8%
72%
20%
QE7.4
Would
you
be
infa
vour
of
or
oppose
dto
spec
ific
mea
sure
sbei
ng
adopte
dto
pro
vide
equal
opport
unitie
sfo
rev
eryo
ne
inth
efiel
dof
emplo
ymen
t?M
easu
res
such
as,
for
exam
ple
spec
ial tr
ainin
g s
chem
es o
r ad
apte
d s
elec
tion a
nd r
ecru
item
ent
pro
cess
es,
for
peo
ple
dep
endin
g o
n t
hei
r...
Age

TO
TA
LTo
tally in
fa
vo
ur
So
mew
hat
in f
avo
ur
So
mew
hat
op
po
sed
To
tally
op
po
sed
DK
In f
avo
ur
Op
po
sed
EU
27
26
75
62
7%
40
%1
5%
10
%8
%6
7%
25
%
BE
10
00
20%
39%
24%
14%
3%
59%
38%
BG
10
09
35%
36%
10%
3%
16%
71%
13%
CZ
10
33
25%
37%
18%
11%
9%
62%
29%
DK
10
01
42%
35%
10%
10%
3%
77%
20%
D-W
10
92
25%
38%
18%
12%
7%
63%
30%
DE
15
23
24%
37%
19%
13%
7%
61%
32%
D-E
43
119%
35%
22%
17%
7%
54%
39%
EE
10
07
36%
38%
9%
9%
8%
74%
18%
IE1
00
743%
33%
10%
5%
9%
76%
15%
EL
10
00
36%
44%
15%
5%
- 80%
20%
ES
10
07
29%
47%
10%
7%
7%
76%
17%
FR1
07
824%
39%
16%
15%
6%
63%
31%
IT1
04
817%
49%
17%
7%
10%
66%
24%
CY
50
146%
37%
9%
6%
2%
83%
15%
LV1
01
220%
37%
19%
10%
14%
57%
29%
LT1
02
216%
47%
9%
7%
21%
63%
16%
LU5
04
35%
31%
14%
9%
11%
66%
23%
HU
10
00
36%
41%
13%
4%
6%
77%
17%
MT
50
032%
46%
8%
2%
12%
78%
10%
NL
10
79
19%
27%
24%
26%
4%
46%
50%
AT
10
01
12%
39%
29%
9%
11%
51%
38%
PL1
00
024%
50%
10%
4%
12%
74%
14%
PT1
02
025%
48%
11%
6%
10%
73%
17%
RO
10
23
42%
34%
8%
4%
12%
76%
12%
SI
10
22
39%
43%
9%
4%
5%
82%
13%
SK
10
37
24%
44%
16%
10%
6%
68%
26%
FI9
99
18%
49%
19%
10%
4%
67%
29%
SE
10
06
27%
27%
19%
21%
6%
54%
40%
UK
13
17
37%
35%
12%
8%
8%
72%
20%
HR
10
00
33%
47%
9%
4%
7%
80%
13%
TR
10
03
25%
37%
13%
9%
16%
62%
22%
MK
10
09
39%
28%
11%
13%
9%
67%
24%
QE7.5
Would
you
be
infa
vour
of
or
oppose
dto
spec
ific
mea
sure
sbei
ng
adopte
dto
pro
vide
equal
opport
unitie
sfo
rev
eryo
ne
inth
efiel
dof
emplo
ymen
t?M
easu
res
such
as,
for
exam
ple
spec
ial tr
ainin
g s
chem
es o
r ad
apte
d s
elec
tion a
nd r
ecru
item
ent
pro
cess
es,
for
peo
ple
dep
endin
g o
n t
hei
r...
Rel
igio
n o
r bel
ief

TO
TA
LTo
tally in
fa
vo
ur
So
mew
hat
in f
avo
ur
So
mew
hat
op
po
sed
To
tally
op
po
sed
DK
In f
avo
ur
Op
po
sed
EU
27
26
75
63
7%
44
%8
%5
%6
%8
1%
13
%
BE
10
00
33%
48%
11%
6%
2%
81%
17%
BG
10
09
42%
38%
6%
2%
12%
80%
8%
CZ
10
33
27%
47%
14%
5%
7%
74%
19%
DK
10
01
24%
22%
21%
28%
5%
46%
49%
D-W
10
92
41%
41%
9%
5%
4%
82%
14%
DE
15
23
41%
42%
9%
4%
4%
83%
13%
D-E
43
140%
43%
9%
4%
4%
83%
13%
EE
10
07
39%
41%
10%
2%
8%
80%
12%
IE1
00
751%
34%
4%
3%
8%
85%
7%
EL
10
00
51%
43%
5%
1%
- 94%
6%
ES
10
07
42%
48%
3%
3%
4%
90%
6%
FR1
07
835%
46%
7%
8%
4%
81%
15%
IT1
04
825%
51%
11%
4%
9%
76%
15%
CY
50
154%
35%
3%
5%
3%
89%
8%
LV1
01
230%
40%
14%
5%
11%
70%
19%
LT1
02
221%
48%
9%
4%
18%
69%
13%
LU5
04
45%
31%
9%
7%
8%
76%
16%
HU
10
00
36%
44%
13%
3%
4%
80%
16%
MT
50
045%
43%
3%
1%
8%
88%
4%
NL
10
79
41%
36%
11%
10%
2%
77%
21%
AT
10
01
27%
45%
16%
5%
7%
72%
21%
PL1
00
031%
50%
7%
2%
10%
81%
9%
PT1
02
030%
51%
8%
2%
9%
81%
10%
RO
10
23
40%
35%
10%
4%
11%
75%
14%
SI
10
22
44%
43%
7%
2%
4%
87%
9%
SK
10
37
23%
49%
16%
5%
7%
72%
21%
FI9
99
29%
51%
13%
4%
3%
80%
17%
SE
10
06
42%
31%
10%
12%
5%
73%
22%
UK
13
17
45%
37%
7%
4%
7%
82%
11%
HR
10
00
38%
46%
6%
3%
7%
84%
9%
TR
10
03
28%
37%
13%
6%
16%
65%
19%
MK
10
09
41%
28%
11%
11%
9%
69%
22%
QE7.6
Would
you
be
infa
vour
of
or
oppose
dto
spec
ific
mea
sure
sbei
ng
adopte
dto
pro
vide
equal
opport
unitie
sfo
rev
eryo
ne
inth
efiel
dof
emplo
ymen
t?M
easu
res
such
as,
for
exam
ple
spec
ial tr
ainin
g s
chem
es o
r ad
apte
d s
elec
tion a
nd r
ecru
item
ent
pro
cess
es,
for
peo
ple
dep
endin
g o
n t
hei
r...
D
isab
ility

TO
TA
LTo
tally
sup
po
rt
So
mew
hat
sup
po
rtS
om
ew
hat
op
po
seTo
tally
op
po
seD
KS
up
po
rts
Op
po
ses
EU
27
26
75
61
7%
35
%2
1%
14
%1
3%
52
%3
5%
BE
10
00
16%
39%
29%
10%
6%
55%
39%
BG
10
09
24%
39%
10%
5%
22%
63%
15%
CZ
10
33
11%
38%
27%
13%
11%
49%
40%
DK
10
01
32%
34%
17%
13%
4%
66%
30%
D-W
10
92
9%
24%
32%
27%
8%
33%
59%
DE
15
23
8%
25%
33%
27%
7%
33%
60%
D-E
43
17%
24%
36%
27%
6%
31%
63%
EE
10
07
14%
35%
15%
20%
16%
49%
35%
IE1
00
725%
38%
12%
8%
17%
63%
20%
EL
10
00
27%
51%
15%
6%
1%
78%
21%
ES
10
07
17%
35%
15%
8%
25%
52%
23%
FR1
07
816%
32%
24%
16%
12%
48%
40%
IT1
04
815%
46%
21%
5%
13%
61%
26%
CY
50
128%
39%
12%
2%
19%
67%
14%
LV1
01
29%
27%
29%
18%
17%
36%
47%
LT1
02
213%
39%
13%
5%
30%
52%
18%
LU5
04
19%
31%
19%
11%
20%
50%
30%
HU
10
00
19%
44%
15%
8%
14%
63%
23%
MT
50
018%
27%
14%
5%
36%
45%
19%
NL
10
79
15%
33%
24%
23%
5%
48%
47%
AT
10
01
6%
25%
38%
22%
9%
31%
60%
PL1
00
010%
35%
24%
11%
20%
45%
35%
PT1
02
019%
41%
15%
3%
22%
60%
18%
RO
10
23
25%
38%
8%
8%
21%
63%
16%
SI
10
22
19%
32%
24%
16%
9%
51%
40%
SK
10
37
7%
32%
35%
16%
10%
39%
51%
FI9
99
13%
45%
23%
9%
10%
58%
32%
SE
10
06
13%
25%
25%
32%
5%
38%
57%
UK
13
17
30%
33%
14%
12%
11%
63%
26%
HR
10
00
15%
41%
20%
12%
12%
56%
32%
TR
10
03
21%
31%
9%
3%
36%
52%
12%
MK
10
09
23%
30%
17%
16%
14%
53%
33%
QE8.1
To w
hat
ext
ent
do y
ou s
upport
or
oppose
the
follo
win
g in t
he
work
pla
ce?
Monitoring t
he
com
posi
tion o
f th
e w
ork
-forc
e to
eva
luat
e th
e re
pre
senta
tion o
f peo
ple
fro
m e
thnic
min
orities

TO
TA
LTo
tally
sup
po
rt
So
mew
hat
sup
po
rtS
om
ew
hat
op
po
seTo
tally
op
po
seD
KS
up
po
rts
Op
po
ses
EU
27
26
75
62
8%
39
%1
4%
8%
11
%6
7%
22
%
BE
10
00
25%
43%
22%
5%
5%
68%
27%
BG
10
09
30%
40%
6%
2%
22%
70%
8%
CZ
10
33
18%
46%
21%
6%
9%
64%
27%
DK
10
01
49%
29%
8%
10%
4%
78%
18%
D-W
10
92
21%
32%
24%
16%
7%
53%
40%
DE
15
23
21%
31%
25%
17%
6%
52%
42%
D-E
43
119%
30%
28%
19%
4%
49%
47%
EE
10
07
34%
36%
9%
9%
12%
70%
18%
IE1
00
734%
35%
8%
6%
17%
69%
14%
EL
10
00
30%
44%
19%
6%
1%
74%
25%
ES
10
07
21%
41%
9%
6%
23%
62%
15%
FR1
07
833%
41%
10%
7%
9%
74%
17%
IT1
04
819%
50%
16%
4%
11%
69%
20%
CY
50
130%
41%
10%
3%
16%
71%
13%
LV1
01
226%
36%
16%
8%
14%
62%
24%
LT1
02
221%
43%
9%
3%
24%
64%
12%
LU5
04
37%
35%
12%
5%
11%
72%
17%
HU
10
00
27%
43%
14%
3%
13%
70%
17%
MT
50
021%
29%
15%
6%
29%
50%
21%
NL
10
79
34%
36%
13%
14%
3%
70%
27%
AT
10
01
11%
39%
26%
13%
11%
50%
39%
PL1
00
016%
46%
14%
6%
18%
62%
20%
PT1
02
029%
42%
8%
1%
20%
71%
9%
RO
10
23
34%
38%
5%
4%
19%
72%
9%
SI
10
22
32%
36%
15%
9%
8%
68%
24%
SK
10
37
17%
47%
22%
6%
8%
64%
28%
FI9
99
31%
46%
13%
5%
5%
77%
18%
SE
10
06
56%
23%
8%
10%
3%
79%
18%
UK
13
17
44%
33%
9%
6%
8%
77%
15%
HR
10
00
26%
45%
13%
5%
11%
71%
18%
TR
10
03
28%
31%
7%
3%
31%
59%
10%
MK
10
09
38%
30%
8%
11%
13%
68%
19%
QE8.2
To w
hat
ext
ent
do y
ou s
upport
or
oppose
the
follo
win
g in t
he
work
pla
ce?
Monitoring
the
recr
uitm
ent
pro
cedure
sto
ensu
reth
atca
ndid
ates
from
ethnic
min
orities
hav
eth
esa
me
chan
ceof
bei
ng
sele
cted
for
inte
rvie
wor
hired
asoth
erca
ndid
ates
with
sim
ilar
skill
s an
d q
ual
ific
atio
ns

TO
TA
LY
es,
defi
nit
ely
Yes,
to
so
me
exte
nt
No
, n
ot
really
No
, d
efi
nit
ely
n
ot
DK
Yes
No
EU
27
26
75
61
1%
38
%3
3%
11
%7
%4
9%
44
%
BE
10
00
13%
47%
29%
7%
4%
60%
36%
BG
10
09
6%
28%
40%
11%
15%
34%
51%
CZ
10
33
8%
36%
38%
15%
3%
44%
53%
DK
10
01
11%
32%
38%
17%
2%
43%
55%
D-W
10
92
18%
41%
29%
8%
4%
59%
37%
DE
15
23
17%
41%
29%
9%
4%
58%
38%
D-E
43
111%
41%
31%
15%
2%
52%
46%
EE
10
07
9%
33%
35%
11%
12%
42%
46%
IE1
00
717%
33%
29%
10%
11%
50%
39%
EL
10
00
8%
32%
40%
20%
- 40%
60%
ES
10
07
11%
44%
28%
11%
6%
55%
39%
FR1
07
88%
35%
38%
15%
4%
43%
53%
IT1
04
85%
38%
41%
9%
7%
43%
50%
CY
50
120%
45%
22%
9%
4%
65%
31%
LV1
01
24%
24%
47%
14%
11%
28%
61%
LT1
02
28%
35%
32%
10%
15%
43%
42%
LU5
04
19%
43%
28%
6%
4%
62%
34%
HU
10
00
7%
29%
40%
19%
5%
36%
59%
MT
50
06%
37%
37%
13%
7%
43%
50%
NL
10
79
15%
48%
28%
7%
2%
63%
35%
AT
10
01
13%
36%
34%
11%
6%
49%
45%
PL1
00
03%
33%
37%
11%
16%
36%
48%
PT1
02
07%
46%
27%
6%
14%
53%
33%
RO
10
23
8%
35%
30%
12%
15%
43%
42%
SI
10
22
7%
46%
35%
10%
2%
53%
45%
SK
10
37
12%
41%
30%
13%
4%
53%
43%
FI9
99
10%
58%
27%
3%
2%
68%
30%
SE
10
06
7%
24%
40%
27%
2%
31%
67%
UK
13
17
17%
39%
28%
11%
5%
56%
39%
HR
10
00
5%
29%
41%
18%
7%
34%
59%
TR
10
03
8%
27%
26%
25%
14%
35%
51%
MK
10
09
7%
42%
24%
20%
7%
49%
44%
QE9 I
n g
ener
al,
would
you s
ay t
hat
enough e
ffort
is
mad
e in
(O
UR C
OU
NTRY)
to f
ight
all fo
rms
of
dis
crim
inat
ion?

TO
TA
LY
es
No
Th
at
dep
en
ds
(SP
.)D
K
EU
27
26
75
63
3%
52
%1
2%
3%
BE
10
00
32%
54%
11%
3%
BG
10
09
21%
52%
17%
10%
CZ
10
33
33%
49%
15%
3%
DK
10
01
29%
65%
5%
1%
D-W
10
92
27%
51%
18%
4%
DE
15
23
26%
51%
19%
4%
D-E
43
124%
53%
22%
1%
EE
10
07
32%
53%
13%
2%
IE1
00
736%
44%
15%
5%
EL
10
00
27%
63%
10%
- ES
10
07
36%
54%
8%
2%
FR1
07
838%
59%
2%
1%
IT1
04
825%
48%
21%
6%
CY
50
142%
49%
9%
- LV
10
12
24%
64%
11%
1%
LT1
02
236%
49%
10%
5%
LU5
04
32%
56%
8%
4%
HU
10
00
32%
52%
12%
4%
MT
50
045%
41%
8%
6%
NL
10
79
38%
55%
5%
2%
AT
10
01
16%
47%
33%
4%
PL1
00
024%
63%
9%
4%
PT1
02
024%
56%
14%
6%
RO
10
23
30%
51%
13%
6%
SI
10
22
41%
38%
18%
3%
SK
10
37
41%
48%
7%
4%
FI9
99
63%
27%
8%
2%
SE
10
06
47%
43%
8%
2%
UK
13
17
49%
44%
5%
2%
HR
10
00
28%
61%
8%
3%
TR
10
03
28%
45%
10%
17%
MK
10
09
45%
44%
9%
2%
QE10 D
o y
ou k
now
your
rights
if
you a
re t
he
vict
im o
f dis
crim
inat
ion o
r har
assm
ent?

TO
TA
LY
es,
d
efi
nit
ely
Yes,
to
so
me
exte
nt
No
, n
ot
really
No
, d
efi
nit
ely
n
ot
DK
Yes
No
EU
27
26
75
61
2%
43
%3
0%
6%
9%
55
%3
6%
BE
10
00
15%
45%
29%
6%
5%
60%
35%
BG
10
09
20%
43%
22%
5%
10%
63%
27%
CZ
10
33
13%
44%
29%
6%
8%
57%
35%
DK
10
01
15%
47%
28%
6%
4%
62%
34%
D-W
10
92
19%
44%
25%
5%
7%
63%
30%
DE
15
23
18%
43%
26%
6%
7%
61%
32%
D-E
43
115%
39%
29%
9%
8%
54%
38%
EE
10
07
12%
47%
26%
3%
12%
59%
29%
IE1
00
711%
43%
24%
3%
19%
54%
27%
EL
10
00
14%
40%
38%
8%
- 54%
46%
ES
10
07
10%
33%
40%
10%
7%
43%
50%
FR1
07
89%
46%
29%
8%
8%
55%
37%
IT1
04
86%
40%
39%
8%
7%
46%
47%
CY
50
114%
47%
21%
4%
14%
61%
25%
LV1
01
25%
43%
36%
5%
11%
48%
41%
LT1
02
210%
49%
24%
4%
13%
59%
28%
LU5
04
15%
39%
30%
3%
13%
54%
33%
HU
10
00
21%
37%
27%
8%
7%
58%
35%
MT
50
07%
34%
30%
8%
21%
41%
38%
NL
10
79
17%
49%
25%
4%
5%
66%
29%
AT
10
01
12%
42%
32%
7%
7%
54%
39%
PL1
00
08%
45%
30%
6%
11%
53%
36%
PT1
02
06%
36%
33%
4%
21%
42%
37%
RO
10
23
10%
41%
23%
3%
23%
51%
26%
SI
10
22
14%
46%
28%
7%
5%
60%
35%
SK
10
37
12%
49%
26%
5%
8%
61%
31%
FI9
99
10%
55%
31%
1%
3%
65%
32%
SE
10
06
18%
40%
29%
6%
7%
58%
35%
UK
13
17
16%
47%
21%
4%
12%
63%
25%
HR
10
00
12%
41%
33%
6%
8%
53%
39%
TR
10
03
11%
37%
26%
12%
14%
48%
38%
MK
10
09
24%
39%
17%
6%
14%
63%
23%
QE11.1
Do y
ou t
hin
k th
at d
iver
sity
is
suff
icie
ntly
reflec
ted in t
he
med
ia,
in t
erm
s of…
? Eth
nic
origin

TO
TA
LY
es,
d
efi
nit
ely
Yes,
to
so
me
exte
nt
No
, n
ot
really
No
, d
efi
nit
ely
n
ot
DK
Yes
No
EU
27
26
75
62
0%
46
%2
2%
4%
8%
66
%2
6%
BE
10
00
26%
44%
21%
5%
4%
70%
26%
BG
10
09
21%
36%
25%
7%
11%
57%
32%
CZ
10
33
21%
42%
24%
6%
7%
63%
30%
DK
10
01
25%
51%
17%
3%
4%
76%
20%
D-W
10
92
27%
44%
18%
5%
6%
71%
23%
DE
15
23
27%
43%
18%
6%
6%
70%
24%
D-E
43
122%
40%
20%
11%
7%
62%
31%
EE
10
07
16%
44%
23%
4%
13%
60%
27%
IE1
00
717%
42%
19%
3%
19%
59%
22%
EL
10
00
12%
33%
42%
13%
- 45%
55%
ES
10
07
35%
43%
15%
2%
5%
78%
17%
FR1
07
821%
55%
15%
3%
6%
76%
18%
IT1
04
88%
49%
32%
5%
6%
57%
37%
CY
50
111%
37%
26%
12%
14%
48%
38%
LV1
01
27%
46%
32%
3%
12%
53%
35%
LT1
02
211%
50%
22%
3%
14%
61%
25%
LU5
04
22%
46%
20%
2%
10%
68%
22%
HU
10
00
27%
40%
22%
4%
7%
67%
26%
MT
50
016%
39%
19%
7%
19%
55%
26%
NL
10
79
22%
50%
17%
4%
7%
72%
21%
AT
10
01
15%
42%
31%
6%
6%
57%
37%
PL1
00
013%
51%
23%
3%
10%
64%
26%
PT1
02
06%
37%
32%
5%
20%
43%
37%
RO
10
23
14%
40%
21%
3%
22%
54%
24%
SI
10
22
15%
45%
29%
7%
4%
60%
36%
SK
10
37
19%
45%
25%
4%
7%
64%
29%
FI9
99
15%
62%
19%
1%
3%
77%
20%
SE
10
06
38%
36%
19%
3%
4%
74%
22%
UK
13
17
19%
48%
19%
3%
11%
67%
22%
HR
10
00
15%
41%
31%
5%
8%
56%
36%
TR
10
03
10%
32%
29%
15%
14%
42%
44%
MK
10
09
22%
39%
19%
6%
14%
61%
25%
QE11.2
Do y
ou t
hin
k th
at d
iver
sity
is
suff
icie
ntly
reflec
ted in t
he
med
ia,
in t
erm
s of…
? G
ender

TO
TA
LY
es,
d
efi
nit
ely
Yes,
to
so
me
exte
nt
No
, n
ot
really
No
, d
efi
nit
ely
n
ot
DK
Yes
No
EU
27
26
75
61
5%
41
%2
5%
6%
13
%5
6%
31
%
BE
10
00
18%
42%
26%
6%
8%
60%
32%
BG
10
09
15%
30%
28%
12%
15%
45%
40%
CZ
10
33
13%
39%
32%
7%
9%
52%
39%
DK
10
01
16%
48%
26%
4%
6%
64%
30%
D-W
10
92
23%
41%
24%
4%
8%
64%
28%
DE
15
23
22%
41%
25%
4%
8%
63%
29%
D-E
43
119%
38%
26%
8%
9%
57%
34%
EE
10
07
12%
40%
28%
5%
15%
52%
33%
IE1
00
712%
38%
23%
5%
22%
50%
28%
EL
10
00
11%
38%
40%
11%
- 49%
51%
ES
10
07
23%
44%
17%
4%
12%
67%
21%
FR1
07
89%
38%
22%
8%
23%
47%
30%
IT1
04
85%
42%
38%
7%
8%
47%
45%
CY
50
17%
40%
26%
8%
19%
47%
34%
LV1
01
213%
43%
28%
4%
12%
56%
32%
LT1
02
214%
44%
23%
4%
15%
58%
27%
LU5
04
13%
36%
26%
4%
21%
49%
30%
HU
10
00
16%
30%
27%
8%
19%
46%
35%
MT
50
09%
35%
27%
8%
21%
44%
35%
NL
10
79
17%
52%
21%
3%
7%
69%
24%
AT
10
01
9%
44%
33%
7%
7%
53%
40%
PL1
00
010%
45%
25%
7%
13%
55%
32%
PT1
02
07%
36%
31%
5%
21%
43%
36%
RO
10
23
12%
32%
21%
7%
28%
44%
28%
SI
10
22
17%
46%
25%
7%
5%
63%
32%
SK
10
37
10%
41%
30%
7%
12%
51%
37%
FI9
99
14%
58%
23%
1%
4%
72%
24%
SE
10
06
24%
36%
21%
4%
15%
60%
25%
UK
13
17
17%
43%
21%
3%
16%
60%
24%
HR
10
00
15%
39%
29%
7%
10%
54%
36%
TR
10
03
7%
23%
31%
18%
21%
30%
49%
MK
10
09
15%
31%
19%
10%
25%
46%
29%
QE11.3
Do y
ou t
hin
k th
at d
iver
sity
is
suff
icie
ntly
reflec
ted in t
he
med
ia,
in t
erm
s of…
? Sex
ual
orien
tation

TO
TA
LY
es,
d
efi
nit
ely
Yes,
to
so
me
exte
nt
No
, n
ot
really
No
, d
efi
nit
ely
n
ot
DK
Yes
No
EU
27
26
75
61
4%
45
%2
7%
6%
8%
59
%3
3%
BE
10
00
18%
45%
27%
5%
5%
63%
32%
BG
10
09
17%
38%
26%
7%
12%
55%
33%
CZ
10
33
15%
43%
26%
9%
7%
58%
35%
DK
10
01
13%
52%
27%
4%
4%
65%
31%
D-W
10
92
21%
45%
23%
6%
5%
66%
29%
DE
15
23
20%
44%
24%
7%
5%
64%
31%
D-E
43
116%
39%
29%
11%
5%
55%
40%
EE
10
07
12%
46%
27%
3%
12%
58%
30%
IE1
00
714%
42%
20%
5%
19%
56%
25%
EL
10
00
8%
33%
45%
13%
1%
41%
58%
ES
10
07
27%
40%
23%
5%
5%
67%
28%
FR1
07
814%
51%
25%
4%
6%
65%
29%
IT1
04
86%
48%
33%
7%
6%
54%
40%
CY
50
18%
44%
27%
7%
14%
52%
34%
LV1
01
26%
48%
32%
4%
10%
54%
36%
LT1
02
211%
47%
25%
4%
13%
58%
29%
LU5
04
15%
43%
29%
3%
10%
58%
32%
HU
10
00
18%
42%
27%
6%
7%
60%
33%
MT
50
011%
41%
22%
5%
21%
52%
27%
NL
10
79
12%
50%
27%
6%
5%
62%
33%
AT
10
01
7%
39%
38%
10%
6%
46%
48%
PL1
00
010%
45%
30%
5%
10%
55%
35%
PT1
02
06%
36%
33%
5%
20%
42%
38%
RO
10
23
11%
38%
25%
4%
22%
49%
29%
SI
10
22
13%
47%
29%
7%
4%
60%
36%
SK
10
37
14%
46%
27%
5%
8%
60%
32%
FI9
99
11%
58%
27%
1%
3%
69%
28%
SE
10
06
22%
39%
27%
6%
6%
61%
33%
UK
13
17
13%
45%
26%
5%
11%
58%
31%
HR
10
00
12%
39%
34%
8%
7%
51%
42%
TR
10
03
7%
27%
32%
18%
16%
34%
50%
MK
10
09
20%
39%
20%
7%
14%
59%
27%
QE11.4
Do y
ou t
hin
k th
at d
iver
sity
is
suff
icie
ntly
reflec
ted in t
he
med
ia,
in t
erm
s of…
? Age

TO
TA
LY
es,
d
efi
nit
ely
Yes,
to
so
me
exte
nt
No
, n
ot
really
No
, d
efi
nit
ely
n
ot
DK
Yes
No
EU
27
26
75
61
1%
41
%2
9%
6%
13
%5
2%
35
%
BE
10
00
14%
44%
28%
6%
8%
58%
34%
BG
10
09
14%
35%
30%
8%
13%
49%
38%
CZ
10
33
9%
36%
35%
10%
10%
45%
45%
DK
10
01
13%
46%
30%
6%
5%
59%
36%
D-W
10
92
20%
42%
27%
4%
7%
62%
31%
DE
15
23
18%
42%
27%
6%
7%
60%
33%
D-E
43
112%
43%
28%
11%
6%
55%
39%
EE
10
07
9%
40%
33%
5%
13%
49%
38%
IE1
00
713%
40%
22%
5%
20%
53%
27%
EL
10
00
9%
34%
44%
13%
- 43%
57%
ES
10
07
11%
36%
27%
9%
17%
47%
36%
FR1
07
89%
35%
27%
8%
21%
44%
35%
IT1
04
86%
47%
34%
6%
7%
53%
40%
CY
50
16%
44%
28%
7%
15%
50%
35%
LV1
01
24%
43%
36%
6%
11%
47%
42%
LT1
02
29%
46%
27%
5%
13%
55%
32%
LU5
04
13%
35%
28%
3%
21%
48%
31%
HU
10
00
12%
27%
33%
10%
18%
39%
43%
MT
50
08%
36%
26%
7%
23%
44%
33%
NL
10
79
17%
50%
23%
4%
6%
67%
27%
AT
10
01
10%
44%
33%
6%
7%
54%
39%
PL1
00
08%
43%
31%
7%
11%
51%
38%
PT1
02
05%
32%
35%
6%
22%
37%
41%
RO
10
23
9%
36%
26%
4%
25%
45%
30%
SI
10
22
14%
46%
28%
8%
4%
60%
36%
SK
10
37
12%
41%
26%
10%
11%
53%
36%
FI9
99
9%
53%
33%
2%
3%
62%
35%
SE
10
06
15%
33%
32%
6%
14%
48%
38%
UK
13
17
13%
46%
23%
4%
14%
59%
27%
HR
10
00
11%
42%
31%
8%
8%
53%
39%
TR
10
03
13%
37%
24%
13%
13%
50%
37%
MK
10
09
21%
35%
18%
9%
17%
56%
27%
QE11.5
Do y
ou t
hin
k th
at d
iver
sity
is
suff
icie
ntly
reflec
ted in t
he
med
ia,
in t
erm
s of…
? Rel
igio
n o
r bel
ief

TO
TA
LY
es,
d
efi
nit
ely
Yes,
to
so
me
exte
nt
No
, n
ot
really
No
, d
efi
nit
ely
n
ot
DK
Yes
No
EU
27
26
75
61
0%
38
%3
4%
10
%8
%4
8%
44
%
BE
10
00
11%
34%
38%
12%
5%
45%
50%
BG
10
09
17%
39%
27%
7%
10%
56%
34%
CZ
10
33
10%
42%
34%
8%
6%
52%
42%
DK
10
01
8%
39%
40%
9%
4%
47%
49%
D-W
10
92
18%
40%
30%
6%
6%
58%
36%
DE
15
23
16%
40%
31%
7%
6%
56%
38%
D-E
43
111%
38%
37%
9%
5%
49%
46%
EE
10
07
9%
45%
30%
4%
12%
54%
34%
IE1
00
713%
35%
25%
8%
19%
48%
33%
EL
10
00
9%
37%
41%
12%
1%
46%
53%
ES
10
07
9%
34%
35%
16%
6%
43%
51%
FR1
07
85%
22%
43%
22%
8%
27%
65%
IT1
04
86%
47%
34%
6%
7%
53%
40%
CY
50
18%
39%
28%
10%
15%
47%
38%
LV1
01
26%
49%
32%
4%
9%
55%
36%
LT1
02
28%
49%
25%
5%
13%
57%
30%
LU5
04
12%
31%
34%
11%
12%
43%
45%
HU
10
00
10%
27%
38%
15%
10%
37%
53%
MT
50
012%
38%
23%
6%
21%
50%
29%
NL
10
79
7%
41%
38%
8%
6%
48%
46%
AT
10
01
8%
41%
36%
9%
6%
49%
45%
PL1
00
09%
48%
28%
6%
9%
57%
34%
PT1
02
06%
37%
32%
4%
21%
43%
36%
RO
10
23
7%
32%
31%
6%
24%
39%
37%
SI
10
22
14%
46%
29%
7%
4%
60%
36%
SK
10
37
10%
47%
27%
7%
9%
57%
34%
FI9
99
7%
50%
38%
3%
2%
57%
41%
SE
10
06
8%
23%
39%
19%
11%
31%
58%
UK
13
17
10%
38%
32%
8%
12%
48%
40%
HR
10
00
11%
38%
33%
10%
8%
49%
43%
TR
10
03
8%
33%
27%
16%
16%
41%
43%
MK
10
09
17%
36%
21%
9%
17%
53%
30%
QE11.6
Do y
ou t
hin
k th
at d
iver
sity
is
suff
icie
ntly
reflec
ted in t
he
med
ia,
in t
erm
s of…
? D
isab
ility

TO
TA
LY
es,
defi
nit
ely
Yes,
to
so
me
exte
nt
No
, n
ot
really
No
, d
efi
nit
ely
n
ot
DK
Yes
No
EU
27
26
75
61
1%
38
%2
6%
8%
17
%4
9%
34
%
BE
10
00
9%
42%
33%
6%
10%
51%
39%
BG
10
09
9%
32%
20%
2%
37%
41%
22%
CZ
10
33
17%
44%
23%
5%
11%
61%
28%
DK
10
01
19%
48%
23%
6%
4%
67%
29%
D-W
10
92
14%
38%
23%
10%
15%
52%
33%
DE
15
23
15%
36%
24%
11%
14%
51%
35%
D-E
43
116%
29%
29%
12%
14%
45%
41%
EE
10
07
19%
41%
19%
4%
17%
60%
23%
IE1
00
721%
42%
14%
4%
19%
63%
18%
EL
10
00
17%
44%
28%
7%
4%
61%
35%
ES
10
07
6%
29%
32%
23%
10%
35%
55%
FR1
07
810%
34%
29%
8%
19%
44%
37%
IT1
04
86%
33%
32%
6%
23%
39%
38%
CY
50
16%
34%
16%
11%
33%
40%
27%
LV1
01
221%
44%
17%
5%
13%
65%
22%
LT1
02
211%
41%
19%
5%
24%
52%
24%
LU5
04
7%
40%
27%
4%
22%
47%
31%
HU
10
00
13%
43%
24%
6%
14%
56%
30%
MT
50
07%
24%
21%
9%
39%
31%
30%
NL
10
79
22%
44%
22%
4%
8%
66%
26%
AT
10
01
9%
43%
28%
8%
12%
52%
36%
PL1
00
09%
39%
24%
4%
24%
48%
28%
PT1
02
08%
38%
17%
5%
32%
46%
22%
RO
10
23
13%
31%
20%
9%
27%
44%
29%
SI
10
22
19%
46%
20%
6%
9%
65%
26%
SK
10
37
11%
52%
23%
4%
10%
63%
27%
FI9
99
11%
53%
24%
2%
10%
64%
26%
SE
10
06
20%
48%
18%
9%
5%
68%
27%
UK
13
17
13%
47%
22%
4%
14%
60%
26%
HR
10
00
10%
40%
27%
9%
14%
50%
36%
TR
10
03
13%
33%
21%
12%
21%
46%
33%
MK
10
09
17%
42%
16%
8%
17%
59%
24%
QE12
Do
you
thin
kth
atdue
toth
eec
onom
ical
cris
isth
epolic
ies
pro
moting
equal
ity
and
div
ersi
tyin
(OU
RCO
UN
TRY),
will
be
consi
der
edle
ssim
port
ant
and
rece
ive
less
fundin
g?

TO
TA
LY
es,
defi
nit
ely
Yes,
to
so
me
exte
nt
No
, n
ot
really
No
, d
efi
nit
ely
n
ot
DK
Yes
No
EU
27
26
75
61
6%
41
%2
6%
8%
9%
57
%3
4%
BE
10
00
17%
45%
27%
7%
4%
62%
34%
BG
10
09
17%
38%
26%
7%
12%
55%
33%
CZ
10
33
20%
42%
25%
8%
5%
62%
33%
DK
10
01
13%
45%
31%
8%
3%
58%
39%
D-W
10
92
13%
40%
28%
12%
7%
53%
40%
DE
15
23
14%
39%
29%
11%
7%
53%
40%
D-E
43
115%
34%
33%
10%
8%
49%
43%
EE
10
07
16%
41%
26%
9%
8%
57%
35%
IE1
00
729%
40%
14%
7%
10%
69%
21%
EL
10
00
34%
49%
14%
3%
- 83%
17%
ES
10
07
25%
49%
16%
5%
5%
74%
21%
FR1
07
819%
41%
24%
7%
9%
60%
31%
IT1
04
810%
39%
32%
7%
12%
49%
39%
CY
50
134%
44%
9%
6%
7%
78%
15%
LV1
01
212%
37%
32%
10%
9%
49%
42%
LT1
02
27%
33%
33%
13%
14%
40%
46%
LU5
04
24%
39%
23%
6%
8%
63%
29%
HU
10
00
27%
44%
18%
4%
7%
71%
22%
MT
50
020%
35%
14%
9%
22%
55%
23%
NL
10
79
21%
51%
20%
5%
3%
72%
25%
AT
10
01
15%
49%
22%
7%
7%
64%
29%
PL1
00
08%
36%
33%
8%
15%
44%
41%
PT1
02
011%
44%
21%
6%
18%
55%
27%
RO
10
23
14%
30%
27%
14%
15%
44%
41%
SI
10
22
30%
40%
22%
5%
3%
70%
27%
SK
10
37
19%
46%
24%
8%
3%
65%
32%
FI9
99
21%
57%
19%
1%
2%
78%
20%
SE
10
06
26%
47%
18%
7%
2%
73%
25%
UK
13
17
13%
41%
31%
5%
10%
54%
36%
HR
10
00
13%
41%
29%
11%
6%
54%
40%
TR
10
03
15%
30%
28%
11%
16%
45%
39%
MK
10
09
21%
36%
19%
14%
10%
57%
33%
QE13.1
Do y
ou t
hin
k th
at t
he
econom
ical
crisi
s w
ill c
ontr
ibute
to a
n incr
ease
of
dis
crim
inat
ion o
n t
he
bas
is o
f… in t
he
labour
mar
ket?
Eth
nic
origin

TO
TA
LY
es,
defi
nit
ely
Yes,
to
so
me
exte
nt
No
, n
ot
really
No
, d
efi
nit
ely
n
ot
DK
Yes
No
EU
27
26
75
61
0%
33
%3
7%
12
%8
%4
3%
49
%
BE
10
00
9%
26%
46%
15%
4%
35%
61%
BG
10
09
11%
32%
36%
9%
12%
43%
45%
CZ
10
33
14%
40%
29%
13%
4%
54%
42%
DK
10
01
5%
27%
49%
16%
3%
32%
65%
D-W
10
92
7%
29%
40%
19%
5%
36%
59%
DE
15
23
9%
29%
39%
18%
5%
38%
57%
D-E
43
116%
32%
34%
13%
5%
48%
47%
EE
10
07
11%
38%
31%
12%
8%
49%
43%
IE1
00
711%
30%
36%
13%
10%
41%
49%
EL
10
00
22%
44%
27%
7%
- 66%
34%
ES
10
07
14%
39%
30%
11%
6%
53%
41%
FR1
07
813%
30%
38%
11%
8%
43%
49%
IT1
04
87%
30%
40%
11%
12%
37%
51%
CY
50
116%
43%
23%
10%
8%
59%
33%
LV1
01
213%
40%
30%
10%
7%
53%
40%
LT1
02
29%
37%
29%
12%
13%
46%
41%
LU5
04
12%
29%
43%
9%
7%
41%
52%
HU
10
00
13%
43%
29%
7%
8%
56%
36%
MT
50
05%
25%
33%
17%
20%
30%
50%
NL
10
79
6%
31%
46%
13%
4%
37%
59%
AT
10
01
8%
39%
33%
14%
6%
47%
47%
PL1
00
08%
35%
36%
8%
13%
43%
44%
PT1
02
09%
41%
26%
5%
19%
50%
31%
RO
10
23
11%
32%
28%
14%
15%
43%
42%
SI
10
22
27%
37%
25%
8%
3%
64%
33%
SK
10
37
13%
41%
34%
10%
2%
54%
44%
FI9
99
13%
47%
34%
5%
1%
60%
39%
SE
10
06
12%
33%
37%
16%
2%
45%
53%
UK
13
17
10%
33%
40%
7%
10%
43%
47%
HR
10
00
12%
43%
30%
9%
6%
55%
39%
TR
10
03
13%
27%
28%
15%
17%
40%
43%
MK
10
09
18%
36%
22%
14%
10%
54%
36%
QE13.2
Do y
ou t
hin
k th
at t
he
econom
ical
crisi
s w
ill c
ontr
ibute
to a
n incr
ease
of
dis
crim
inat
ion o
n t
he
bas
is o
f… in t
he
labour
mar
ket?
G
ender

TO
TA
LY
es,
defi
nit
ely
Yes,
to
so
me
exte
nt
No
, n
ot
really
No
, d
efi
nit
ely
n
ot
DK
Yes
No
EU
27
26
75
69
%2
8%
39
%1
3%
11
%3
7%
52
%
BE
10
00
8%
24%
49%
16%
3%
32%
65%
BG
10
09
11%
24%
30%
10%
25%
35%
40%
CZ
10
33
5%
25%
38%
26%
6%
30%
64%
DK
10
01
4%
25%
50%
18%
3%
29%
68%
D-W
10
92
5%
23%
43%
22%
7%
28%
65%
DE
15
23
5%
23%
42%
22%
8%
28%
64%
D-E
43
16%
22%
42%
21%
9%
28%
63%
EE
10
07
11%
26%
33%
17%
13%
37%
50%
IE1
00
78%
27%
39%
12%
14%
35%
51%
EL
10
00
19%
42%
31%
7%
1%
61%
38%
ES
10
07
11%
31%
36%
14%
8%
42%
50%
FR1
07
813%
26%
39%
12%
10%
39%
51%
IT1
04
87%
30%
41%
10%
12%
37%
51%
CY
50
115%
39%
21%
12%
13%
54%
33%
LV1
01
211%
31%
32%
13%
13%
42%
45%
LT1
02
28%
30%
28%
13%
21%
38%
41%
LU5
04
12%
28%
41%
9%
10%
40%
50%
HU
10
00
10%
30%
39%
9%
12%
40%
48%
MT
50
06%
21%
38%
14%
21%
27%
52%
NL
10
79
7%
30%
47%
12%
4%
37%
59%
AT
10
01
5%
33%
39%
14%
9%
38%
53%
PL1
00
08%
30%
35%
8%
19%
38%
43%
PT1
02
010%
40%
25%
5%
20%
50%
30%
RO
10
23
18%
25%
24%
12%
21%
43%
36%
SI
10
22
27%
35%
25%
8%
5%
62%
33%
SK
10
37
9%
28%
43%
14%
6%
37%
57%
FI9
99
13%
44%
36%
3%
4%
57%
39%
SE
10
06
9%
28%
40%
18%
5%
37%
58%
UK
13
17
8%
30%
44%
8%
10%
38%
52%
HR
10
00
15%
38%
28%
11%
8%
53%
39%
TR
10
03
15%
20%
26%
18%
21%
35%
44%
MK
10
09
16%
27%
18%
16%
23%
43%
34%
QE13.3
Do y
ou t
hin
k th
at t
he
econom
ical
crisi
s w
ill c
ontr
ibute
to a
n incr
ease
of
dis
crim
inat
ion o
n t
he
bas
is o
f… in t
he
labour
mar
ket?
Sex
ual
orien
tation

TO
TA
LY
es,
defi
nit
ely
Yes,
to
so
me
exte
nt
No
, n
ot
really
No
, d
efi
nit
ely
n
ot
DK
Yes
No
EU
27
26
75
62
2%
42
%2
2%
7%
7%
64
%2
9%
BE
10
00
16%
45%
28%
7%
4%
61%
35%
BG
10
09
33%
40%
12%
5%
10%
73%
17%
CZ
10
33
36%
39%
15%
6%
4%
75%
21%
DK
10
01
12%
49%
29%
8%
2%
61%
37%
D-W
10
92
24%
45%
17%
9%
5%
69%
26%
DE
15
23
26%
43%
18%
9%
4%
69%
27%
D-E
43
134%
35%
24%
4%
3%
69%
28%
EE
10
07
32%
41%
16%
4%
7%
73%
20%
IE1
00
718%
39%
24%
8%
11%
57%
32%
EL
10
00
33%
47%
16%
4%
- 80%
20%
ES
10
07
26%
46%
18%
5%
5%
72%
23%
FR1
07
821%
42%
22%
8%
7%
63%
30%
IT1
04
812%
36%
33%
8%
11%
48%
41%
CY
50
123%
50%
13%
6%
8%
73%
19%
LV1
01
236%
44%
11%
4%
5%
80%
15%
LT1
02
224%
42%
16%
7%
11%
66%
23%
LU5
04
22%
44%
22%
6%
6%
66%
28%
HU
10
00
34%
40%
16%
4%
6%
74%
20%
MT
50
012%
31%
26%
10%
21%
43%
36%
NL
10
79
27%
49%
17%
4%
3%
76%
21%
AT
10
01
28%
44%
17%
6%
5%
72%
23%
PL1
00
014%
44%
24%
7%
11%
58%
31%
PT1
02
017%
43%
18%
4%
18%
60%
22%
RO
10
23
20%
35%
19%
11%
15%
55%
30%
SI
10
22
38%
37%
17%
5%
3%
75%
22%
SK
10
37
30%
45%
16%
6%
3%
75%
22%
FI9
99
26%
57%
15%
1%
1%
83%
16%
SE
10
06
23%
52%
17%
6%
2%
75%
23%
UK
13
17
18%
41%
27%
5%
9%
59%
32%
HR
10
00
18%
44%
24%
8%
6%
62%
32%
TR
10
03
14%
26%
28%
16%
16%
40%
44%
MK
10
09
27%
38%
15%
10%
10%
65%
25%
QE13.4
Do y
ou t
hin
k th
at t
he
econom
ical
crisi
s w
ill c
ontr
ibute
to a
n incr
ease
of
dis
crim
inat
ion o
n t
he
bas
is o
f… in t
he
labour
mar
ket?
Age

TO
TA
LY
es,
defi
nit
ely
Yes,
to
so
me
exte
nt
No
, n
ot
really
No
, d
efi
nit
ely
n
ot
DK
Yes
No
EU
27
26
75
61
0%
32
%3
6%
13
%9
%4
2%
49
%
BE
10
00
14%
38%
35%
10%
3%
52%
45%
BG
10
09
10%
26%
38%
11%
15%
36%
49%
CZ
10
33
5%
21%
40%
29%
5%
26%
69%
DK
10
01
10%
41%
36%
10%
3%
51%
46%
D-W
10
92
8%
28%
38%
20%
6%
36%
58%
DE
15
23
9%
27%
39%
19%
6%
36%
58%
D-E
43
110%
25%
42%
16%
7%
35%
58%
EE
10
07
9%
27%
38%
17%
9%
36%
55%
IE1
00
77%
28%
37%
16%
12%
35%
53%
EL
10
00
19%
44%
28%
9%
- 63%
37%
ES
10
07
12%
33%
33%
15%
7%
45%
48%
FR1
07
815%
34%
31%
10%
10%
49%
41%
IT1
04
87%
33%
39%
9%
12%
40%
48%
CY
50
113%
41%
26%
12%
8%
54%
38%
LV1
01
26%
25%
41%
19%
9%
31%
60%
LT1
02
25%
24%
36%
20%
15%
29%
56%
LU5
04
13%
30%
40%
9%
8%
43%
49%
HU
10
00
6%
22%
40%
21%
11%
28%
61%
MT
50
07%
22%
34%
16%
21%
29%
50%
NL
10
79
14%
40%
35%
7%
4%
54%
42%
AT
10
01
10%
44%
28%
10%
8%
54%
38%
PL1
00
05%
28%
42%
11%
14%
33%
53%
PT1
02
07%
34%
30%
10%
19%
41%
40%
RO
10
23
10%
24%
34%
17%
15%
34%
51%
SI
10
22
26%
37%
26%
7%
4%
63%
33%
SK
10
37
5%
20%
43%
28%
4%
25%
71%
FI9
99
11%
45%
38%
4%
2%
56%
42%
SE
10
06
12%
42%
31%
11%
4%
54%
42%
UK
13
17
10%
32%
40%
7%
11%
42%
47%
HR
10
00
10%
38%
33%
12%
7%
48%
45%
TR
10
03
17%
24%
30%
14%
15%
41%
44%
MK
10
09
18%
28%
24%
18%
12%
46%
42%
QE13.5
Do y
ou t
hin
k th
at t
he
econom
ical
crisi
s w
ill c
ontr
ibute
to a
n incr
ease
of
dis
crim
inat
ion o
n t
he
bas
is o
f… in t
he
labour
mar
ket?
Rel
igio
n o
r bel
ief

TO
TA
LY
es,
defi
nit
ely
Yes,
to
so
me
exte
nt
No
, n
ot
really
No
, d
efi
nit
ely
n
ot
DK
Yes
No
EU
27
26
75
61
6%
40
%2
8%
8%
8%
56
%3
6%
BE
10
00
14%
41%
33%
9%
3%
55%
42%
BG
10
09
20%
40%
20%
5%
15%
60%
25%
CZ
10
33
21%
46%
23%
6%
4%
67%
29%
DK
10
01
11%
44%
32%
10%
3%
55%
42%
D-W
10
92
14%
39%
29%
13%
5%
53%
42%
DE
15
23
16%
38%
29%
12%
5%
54%
41%
D-E
43
122%
34%
30%
9%
5%
56%
39%
EE
10
07
26%
46%
16%
4%
8%
72%
20%
IE1
00
711%
39%
28%
11%
11%
50%
39%
EL
10
00
26%
51%
18%
5%
- 77%
23%
ES
10
07
18%
42%
25%
8%
7%
60%
33%
FR1
07
818%
39%
27%
9%
7%
57%
36%
IT1
04
88%
33%
37%
10%
12%
41%
47%
CY
50
114%
56%
13%
9%
8%
70%
22%
LV1
01
230%
45%
14%
5%
6%
75%
19%
LT1
02
220%
42%
17%
8%
13%
62%
25%
LU5
04
17%
39%
30%
7%
7%
56%
37%
HU
10
00
23%
46%
20%
4%
7%
69%
24%
MT
50
08%
25%
31%
16%
20%
33%
47%
NL
10
79
16%
51%
24%
6%
3%
67%
30%
AT
10
01
11%
46%
26%
11%
6%
57%
37%
PL1
00
010%
41%
29%
7%
13%
51%
36%
PT1
02
016%
43%
19%
4%
18%
59%
23%
RO
10
23
17%
33%
22%
12%
16%
50%
34%
SI
10
22
35%
41%
17%
4%
3%
76%
21%
SK
10
37
16%
47%
23%
9%
5%
63%
32%
FI9
99
18%
59%
20%
1%
2%
77%
21%
SE
10
06
25%
48%
17%
7%
3%
73%
24%
UK
13
17
14%
38%
33%
5%
10%
52%
38%
HR
10
00
16%
42%
26%
9%
7%
58%
35%
TR
10
03
15%
27%
28%
15%
15%
42%
43%
MK
10
09
24%
35%
15%
13%
13%
59%
28%
QE13.6
Do y
ou t
hin
k th
at t
he
econom
ical
crisi
s w
ill c
ontr
ibute
to a
n incr
ease
of
dis
crim
inat
ion o
n t
he
bas
is o
f… in t
he
labour
mar
ket?
D
isab
ility

TO
TA
LY
es,
defi
nit
ely
Yes,
to
so
me
exte
nt
No
, n
ot
really
No
, d
efi
nit
ely
n
ot
No
t ap
plica
ble
(S
P.)
DK
Yes
No
EU
27
26
75
67
%1
6%
13
%5
%5
4%
5%
23
%1
8%
BE
10
00
7%
20%
14%
3%
54%
2%
27%
17%
BG
10
09
4%
10%
16%
10%
51%
9%
14%
26%
CZ
10
33
4%
17%
18%
7%
48%
6%
21%
25%
DK
10
01
12%
19%
13%
4%
51%
1%
31%
17%
D-W
10
92
10%
19%
11%
5%
52%
3%
29%
16%
DE
15
23
10%
19%
11%
5%
52%
3%
29%
16%
D-E
43
19%
18%
12%
4%
54%
3%
27%
16%
EE
10
07
9%
13%
14%
7%
52%
5%
22%
21%
IE1
00
710%
20%
8%
3%
53%
6%
30%
11%
EL
10
00
5%
13%
18%
9%
53%
2%
18%
27%
ES
10
07
5%
16%
12%
6%
58%
3%
21%
18%
FR1
07
87%
21%
12%
4%
51%
5%
28%
16%
IT1
04
82%
14%
18%
6%
53%
7%
16%
24%
CY
50
16%
21%
13%
5%
52%
3%
27%
18%
LV1
01
25%
19%
12%
5%
46%
13%
24%
17%
LT1
02
25%
9%
7%
5%
65%
9%
14%
12%
LU5
04
10%
17%
11%
4%
50%
8%
27%
15%
HU
10
00
5%
13%
13%
4%
62%
3%
18%
17%
MT
50
05%
12%
10%
8%
54%
11%
17%
18%
NL
10
79
8%
20%
19%
3%
48%
2%
28%
22%
AT
10
01
4%
20%
17%
7%
49%
3%
24%
24%
PL1
00
03%
11%
13%
5%
59%
9%
14%
18%
PT1
02
03%
17%
13%
3%
58%
6%
20%
16%
RO
10
23
3%
12%
14%
7%
55%
9%
15%
21%
SI
10
22
10%
16%
8%
3%
60%
3%
26%
11%
SK
10
37
5%
20%
17%
9%
45%
4%
25%
26%
FI9
99
5%
20%
21%
3%
48%
3%
25%
24%
SE
10
06
19%
18%
10%
4%
43%
6%
37%
14%
UK
13
17
12%
17%
11%
2%
55%
3%
29%
13%
HR
10
00
5%
12%
12%
7%
60%
4%
17%
19%
TR
10
03
2%
7%
11%
6%
67%
7%
9%
17%
MK
10
09
7%
10%
7%
5%
66%
5%
17%
12%
QE14.1
Do y
ou t
hin
k th
at e
nough is
bei
ng d
one
to incr
ease
div
ersi
ty in y
our
work
pla
ce a
s fa
r as
… is
conce
rned
? Eth
nic
origin

TO
TA
LY
es,
defi
nit
ely
Yes,
to
so
me
exte
nt
No
, n
ot
really
No
, d
efi
nit
ely
n
ot
No
t ap
plica
ble
(S
P.)
DK
Yes
No
EU
27
26
75
69
%1
8%
12
%4
%5
3%
4%
27
%1
6%
BE
10
00
10%
22%
10%
3%
54%
1%
32%
13%
BG
10
09
6%
13%
14%
8%
51%
8%
19%
22%
CZ
10
33
7%
20%
15%
7%
47%
4%
27%
22%
DK
10
01
17%
19%
9%
4%
50%
1%
36%
13%
D-W
10
92
15%
17%
10%
4%
52%
2%
32%
14%
DE
15
23
15%
17%
10%
4%
52%
2%
32%
14%
D-E
43
117%
18%
8%
4%
52%
1%
35%
12%
EE
10
07
8%
13%
14%
7%
52%
6%
21%
21%
IE1
00
711%
20%
8%
3%
53%
5%
31%
11%
EL
10
00
6%
15%
15%
9%
53%
2%
21%
24%
ES
10
07
7%
20%
9%
4%
58%
2%
27%
13%
FR1
07
88%
23%
11%
3%
51%
4%
31%
14%
IT1
04
83%
15%
18%
4%
53%
7%
18%
22%
CY
50
15%
21%
13%
5%
53%
3%
26%
18%
LV1
01
27%
21%
9%
5%
46%
12%
28%
14%
LT1
02
25%
10%
8%
5%
64%
8%
15%
13%
LU5
04
12%
20%
9%
3%
49%
7%
32%
12%
HU
10
00
7%
17%
10%
3%
60%
3%
24%
13%
MT
50
011%
13%
9%
5%
54%
8%
24%
14%
NL
10
79
11%
22%
14%
3%
48%
2%
33%
17%
AT
10
01
8%
24%
13%
4%
48%
3%
32%
17%
PL1
00
04%
15%
11%
4%
59%
7%
19%
15%
PT1
02
03%
18%
12%
3%
57%
7%
21%
15%
RO
10
23
4%
12%
13%
7%
55%
9%
16%
20%
SI
10
22
12%
16%
7%
3%
60%
2%
28%
10%
SK
10
37
7%
22%
16%
8%
44%
3%
29%
24%
FI9
99
8%
24%
16%
2%
48%
2%
32%
18%
SE
10
06
25%
15%
10%
3%
43%
4%
40%
13%
UK
13
17
13%
18%
9%
2%
55%
3%
31%
11%
HR
10
00
5%
13%
11%
8%
60%
3%
18%
19%
TR
10
03
2%
7%
10%
6%
68%
7%
9%
16%
MK
10
09
6%
12%
7%
4%
66%
5%
18%
11%
QE14.2
Do y
ou t
hin
k th
at e
nough is
bei
ng d
one
to incr
ease
div
ersi
ty in y
our
work
pla
ce a
s fa
r as
… is
conce
rned
? G
ender

TO
TA
LY
es,
defi
nit
ely
Yes,
to
so
me
exte
nt
No
, n
ot
really
No
, d
efi
nit
ely
n
ot
No
t ap
plica
ble
(S
P.)
DK
Yes
No
EU
27
26
75
66
%1
5%
13
%5
%5
4%
7%
21
%1
8%
BE
10
00
7%
20%
13%
4%
55%
1%
27%
17%
BG
10
09
2%
4%
11%
14%
51%
18%
6%
25%
CZ
10
33
5%
14%
15%
9%
50%
7%
19%
24%
DK
10
01
10%
15%
13%
7%
51%
4%
25%
20%
D-W
10
92
11%
14%
12%
5%
53%
5%
25%
17%
DE
15
23
11%
14%
12%
5%
53%
5%
25%
17%
D-E
43
111%
14%
10%
5%
54%
6%
25%
15%
EE
10
07
5%
8%
13%
11%
52%
11%
13%
24%
IE1
00
78%
18%
9%
2%
54%
9%
26%
11%
EL
10
00
3%
12%
18%
12%
53%
2%
15%
30%
ES
10
07
4%
15%
11%
5%
59%
6%
19%
16%
FR1
07
87%
19%
11%
4%
51%
8%
26%
15%
IT1
04
82%
13%
18%
5%
53%
9%
15%
23%
CY
50
14%
16%
16%
6%
52%
6%
20%
22%
LV1
01
23%
14%
11%
7%
47%
18%
17%
18%
LT1
02
23%
6%
7%
6%
65%
13%
9%
13%
LU5
04
8%
15%
12%
3%
49%
13%
23%
15%
HU
10
00
4%
9%
11%
5%
64%
7%
13%
16%
MT
50
06%
15%
11%
5%
54%
9%
21%
16%
NL
10
79
10%
18%
15%
4%
49%
4%
28%
19%
AT
10
01
3%
19%
16%
7%
49%
6%
22%
23%
PL1
00
02%
11%
11%
5%
59%
12%
13%
16%
PT1
02
02%
14%
15%
3%
58%
8%
16%
18%
RO
10
23
2%
9%
14%
9%
56%
10%
11%
23%
SI
10
22
9%
14%
9%
2%
60%
6%
23%
11%
SK
10
37
4%
14%
17%
13%
46%
6%
18%
30%
FI9
99
4%
14%
24%
4%
48%
6%
18%
28%
SE
10
06
19%
14%
9%
3%
44%
11%
33%
12%
UK
13
17
11%
18%
9%
2%
55%
5%
29%
11%
HR
10
00
5%
10%
11%
9%
61%
4%
15%
20%
TR
10
03
2%
3%
10%
8%
67%
10%
5%
18%
MK
10
09
4%
6%
6%
7%
66%
11%
10%
13%
QE14.3
Do y
ou t
hin
k th
at e
nough is
bei
ng d
one
to incr
ease
div
ersi
ty in y
our
work
pla
ce a
s fa
r as
… is
conce
rned
? Sex
ual
orien
tation

TO
TA
LY
es,
defi
nit
ely
Yes,
to
so
me
exte
nt
No
, n
ot
really
No
, d
efi
nit
ely
n
ot
No
t ap
plica
ble
(S
P.)
DK
Yes
No
EU
27
26
75
68
%1
8%
13
%4
%5
3%
4%
26
%1
7%
BE
10
00
9%
22%
13%
2%
53%
1%
31%
15%
BG
10
09
5%
14%
13%
9%
51%
8%
19%
22%
CZ
10
33
7%
19%
17%
8%
46%
3%
26%
25%
DK
10
01
14%
19%
12%
4%
50%
1%
33%
16%
D-W
10
92
13%
19%
10%
4%
52%
2%
32%
14%
DE
15
23
13%
19%
10%
4%
52%
2%
32%
14%
D-E
43
114%
18%
9%
5%
52%
2%
32%
14%
EE
10
07
9%
15%
13%
6%
52%
5%
24%
19%
IE1
00
78%
19%
9%
3%
54%
7%
27%
12%
EL
10
00
4%
14%
17%
10%
53%
2%
18%
27%
ES
10
07
5%
17%
13%
5%
58%
2%
22%
18%
FR1
07
88%
21%
11%
4%
51%
5%
29%
15%
IT1
04
83%
15%
18%
5%
53%
6%
18%
23%
CY
50
16%
21%
15%
4%
51%
3%
27%
19%
LV1
01
28%
21%
10%
4%
46%
11%
29%
14%
LT1
02
26%
11%
7%
4%
64%
8%
17%
11%
LU5
04
11%
19%
10%
3%
50%
7%
30%
13%
HU
10
00
6%
18%
11%
3%
60%
2%
24%
14%
MT
50
08%
15%
8%
6%
54%
9%
23%
14%
NL
10
79
9%
22%
16%
4%
47%
2%
31%
20%
AT
10
01
5%
23%
16%
6%
47%
3%
28%
22%
PL1
00
03%
14%
13%
4%
59%
7%
17%
17%
PT1
02
03%
16%
14%
4%
57%
6%
19%
18%
RO
10
23
3%
12%
14%
8%
55%
8%
15%
22%
SI
10
22
10%
18%
8%
3%
59%
2%
28%
11%
SK
10
37
7%
25%
14%
7%
44%
3%
32%
21%
FI9
99
7%
23%
17%
3%
48%
2%
30%
20%
SE
10
06
17%
22%
9%
4%
43%
5%
39%
13%
UK
13
17
12%
19%
10%
2%
55%
2%
31%
12%
HR
10
00
5%
12%
13%
7%
60%
3%
17%
20%
TR
10
03
2%
7%
11%
6%
67%
7%
9%
17%
MK
10
09
7%
11%
7%
4%
66%
5%
18%
11%
QE14.4
Do y
ou t
hin
k th
at e
nough is
bei
ng d
one
to incr
ease
div
ersi
ty in y
our
work
pla
ce a
s fa
r as
… is
conce
rned
? Age

TO
TA
LY
es,
defi
nit
ely
Yes,
to
so
me
exte
nt
No
, n
ot
really
No
, d
efi
nit
ely
n
ot
No
t ap
plica
ble
(S
P.)
DK
Yes
No
EU
27
26
75
66
%1
6%
13
%5
%5
4%
6%
22
%1
8%
BE
10
00
6%
21%
12%
4%
55%
2%
27%
16%
BG
10
09
4%
8%
15%
10%
51%
12%
12%
25%
CZ
10
33
6%
14%
15%
9%
49%
7%
20%
24%
DK
10
01
11%
16%
14%
6%
51%
2%
27%
20%
D-W
10
92
11%
16%
12%
5%
52%
4%
27%
17%
DE
15
23
11%
15%
12%
5%
53%
4%
26%
17%
D-E
43
110%
15%
12%
7%
53%
3%
25%
19%
EE
10
07
6%
9%
16%
9%
52%
8%
15%
25%
IE1
00
79%
18%
8%
3%
54%
8%
27%
11%
EL
10
00
3%
12%
19%
11%
53%
2%
15%
30%
ES
10
07
4%
14%
12%
6%
59%
5%
18%
18%
FR1
07
87%
19%
11%
5%
51%
7%
26%
16%
IT1
04
82%
15%
17%
5%
53%
8%
17%
22%
CY
50
15%
19%
16%
6%
52%
2%
24%
22%
LV1
01
25%
17%
10%
6%
47%
15%
22%
16%
LT1
02
25%
7%
7%
5%
65%
11%
12%
12%
LU5
04
7%
16%
12%
3%
50%
12%
23%
15%
HU
10
00
5%
10%
11%
5%
63%
6%
15%
16%
MT
50
05%
15%
10%
6%
54%
10%
20%
16%
NL
10
79
9%
18%
17%
4%
49%
3%
27%
21%
AT
10
01
4%
20%
16%
7%
48%
5%
24%
23%
PL1
00
02%
12%
12%
4%
60%
10%
14%
16%
PT1
02
02%
16%
13%
4%
58%
7%
18%
17%
RO
10
23
3%
11%
14%
8%
55%
9%
14%
22%
SI
10
22
9%
17%
7%
3%
60%
4%
26%
10%
SK
10
37
7%
16%
15%
12%
45%
5%
23%
27%
FI9
99
4%
17%
23%
3%
48%
5%
21%
26%
SE
10
06
16%
18%
11%
4%
43%
8%
34%
15%
UK
13
17
11%
18%
10%
2%
56%
3%
29%
12%
HR
10
00
4%
12%
12%
8%
60%
4%
16%
20%
TR
10
03
2%
7%
10%
7%
67%
7%
9%
17%
MK
10
09
6%
10%
6%
6%
66%
6%
16%
12%
QE14.5
Do y
ou t
hin
k th
at e
nough is
bei
ng d
one
to incr
ease
div
ersi
ty in y
our
work
pla
ce a
s fa
r as
… is
conce
rned
? Rel
igio
n o
r bel
ief

TO
TA
LY
es,
defi
nit
ely
Yes,
to
so
me
exte
nt
No
, n
ot
really
No
, d
efi
nit
ely
n
ot
No
t ap
plica
ble
(S
P.)
DK
Yes
No
EU
27
26
75
66
%1
6%
14
%6
%5
4%
4%
22
%2
0%
BE
10
00
6%
16%
17%
6%
54%
1%
22%
23%
BG
10
09
3%
8%
14%
13%
51%
11%
11%
27%
CZ
10
33
4%
16%
19%
8%
48%
5%
20%
27%
DK
10
01
8%
17%
16%
6%
51%
2%
25%
22%
D-W
10
92
11%
19%
11%
4%
52%
3%
30%
15%
DE
15
23
11%
19%
11%
4%
53%
2%
30%
15%
D-E
43
111%
19%
12%
3%
54%
1%
30%
15%
EE
10
07
6%
10%
14%
10%
53%
7%
16%
24%
IE1
00
79%
16%
10%
4%
55%
6%
25%
14%
EL
10
00
2%
14%
18%
11%
53%
2%
16%
29%
ES
10
07
4%
17%
12%
6%
59%
2%
21%
18%
FR1
07
87%
18%
13%
8%
51%
3%
25%
21%
IT1
04
83%
16%
16%
5%
53%
7%
19%
21%
CY
50
18%
22%
12%
3%
53%
2%
30%
15%
LV1
01
25%
17%
11%
6%
46%
15%
22%
17%
LT1
02
23%
8%
8%
6%
66%
9%
11%
14%
LU5
04
7%
14%
17%
6%
49%
7%
21%
23%
HU
10
00
4%
12%
13%
5%
62%
4%
16%
18%
MT
50
06%
13%
10%
6%
54%
11%
19%
16%
NL
10
79
6%
18%
20%
5%
48%
3%
24%
25%
AT
10
01
5%
21%
16%
6%
49%
3%
26%
22%
PL1
00
02%
11%
14%
5%
60%
8%
13%
19%
PT1
02
03%
14%
16%
3%
58%
6%
17%
19%
RO
10
23
3%
11%
13%
8%
56%
9%
14%
21%
SI
10
22
9%
15%
9%
4%
60%
3%
24%
13%
SK
10
37
5%
19%
17%
10%
45%
4%
24%
27%
FI9
99
4%
16%
24%
4%
49%
3%
20%
28%
SE
10
06
12%
13%
17%
8%
43%
7%
25%
25%
UK
13
17
11%
18%
11%
3%
55%
2%
29%
14%
HR
10
00
4%
12%
12%
8%
60%
4%
16%
20%
TR
10
03
2%
6%
11%
7%
67%
7%
8%
18%
MK
10
09
5%
8%
8%
7%
66%
6%
13%
15%
QE14.6
Do y
ou t
hin
k th
at e
nough is
bei
ng d
one
to incr
ease
div
ersi
ty in y
our
work
pla
ce a
s fa
r as
… is
conce
rned
? D
isab
ility

TO
TA
LTra
de U
nio
ns
NG
O's
-
ass
oci
ati
on
sTri
bu
nals
Bo
dy f
or
the
pro
mo
tio
n o
f eq
ual tr
eatm
en
tLaw
yer
Po
lice
Oth
er
(SP
.)D
K
EU
27
26
75
61
3%
4%
5%
13
%1
4%
34
%5
%1
2%
BE
10
00
19%
4%
3%
20%
8%
34%
7%
5%
BG
10
09
6%
3%
8%
21%
10%
33%
4%
15%
CZ
10
33
10%
6%
3%
10%
14%
43%
3%
11%
DK
10
01
49%
2%
1%
4%
8%
26%
6%
4%
D-W
10
92
10%
4%
2%
19%
21%
27%
5%
12%
DE
15
23
10%
3%
3%
19%
20%
27%
6%
12%
D-E
43
112%
2%
3%
18%
14%
31%
8%
12%
EE
10
07
7%
2%
4%
14%
8%
36%
9%
20%
IE1
00
727%
3%
1%
13%
8%
20%
9%
19%
EL
10
00
8%
6%
5%
22%
16%
37%
3%
3%
ES
10
07
14%
6%
9%
4%
16%
36%
4%
11%
FR1
07
817%
7%
5%
14%
13%
35%
4%
5%
IT1
04
810%
5%
7%
7%
18%
44%
1%
8%
CY
50
118%
2%
2%
17%
14%
35%
8%
4%
LV1
01
29%
3%
5%
14%
7%
32%
12%
18%
LT1
02
25%
1%
3%
25%
10%
34%
6%
16%
LU5
04
22%
4%
2%
6%
9%
46%
7%
4%
HU
10
00
5%
2%
6%
17%
6%
42%
4%
18%
MT
50
019%
6%
2%
5%
13%
39%
6%
10%
NL
10
79
8%
2%
2%
23%
2%
42%
11%
10%
AT
10
01
20%
5%
5%
14%
12%
24%
5%
15%
PL1
00
07%
7%
10%
8%
18%
27%
2%
21%
PT1
02
05%
8%
9%
13%
7%
28%
2%
28%
RO
10
23
7%
2%
7%
14%
10%
44%
2%
14%
SI
10
22
10%
11%
2%
11%
16%
35%
7%
8%
SK
10
37
11%
2%
4%
9%
14%
47%
5%
8%
FI9
99
35%
4%
3%
7%
10%
27%
7%
7%
SE
10
06
36%
2%
1%
31%
5%
12%
8%
5%
UK
13
17
18%
2%
5%
8%
10%
33%
10%
14%
HR
10
00
11%
16%
4%
8%
10%
40%
3%
8%
TR
10
03
6%
3%
12%
7%
8%
45%
4%
15%
MK
10
09
9%
9%
8%
9%
10%
36%
7%
12%
QE15a
In c
ase
you a
re t
he
vict
im o
f dis
crim
inat
ion o
r har
assm
ent,
to w
hom
would
you p
refe
r to
rep
ort
your
case
? Fi
rstly?

TO
TA
LTra
de U
nio
ns
NG
O's
-
ass
oci
ati
on
sTri
bu
nals
Bo
dy f
or
the
pro
mo
tio
n o
f eq
ual
treatm
en
tLaw
yer
Po
lice
Oth
er
(SP
.)D
K
EU
27
23
68
39
%8
%1
4%
13
%2
6%
15
%3
%1
2%
BE
94
913%
7%
9%
20%
23%
18%
4%
6%
BG
85
76%
13%
17%
20%
21%
14%
2%
7%
CZ
92
46%
9%
17%
15%
29%
16%
1%
7%
DK
96
312%
6%
4%
10%
31%
28%
4%
5%
D-W
96
28%
9%
11%
17%
33%
11%
3%
8%
DE
13
41
8%
8%
12%
17%
32%
12%
3%
8%
D-E
37
97%
6%
11%
16%
30%
16%
4%
10%
EE
80
28%
7%
13%
15%
14%
14%
3%
26%
IE8
14
15%
6%
5%
21%
20%
16%
4%
13%
EL
96
74%
7%
13%
18%
38%
15%
- 5%
ES
89
78%
8%
17%
7%
26%
17%
4%
13%
FR1
02
59%
10%
17%
11%
21%
16%
2%
14%
IT9
65
9%
9%
13%
8%
31%
15%
1%
14%
CY
47
97%
4%
8%
16%
35%
13%
2%
15%
LV8
31
8%
7%
16%
14%
16%
12%
2%
25%
LT8
62
6%
3%
22%
15%
25%
11%
4%
14%
LU4
82
10%
5%
8%
12%
34%
17%
4%
10%
HU
82
56%
5%
19%
14%
22%
12%
2%
20%
MT
44
810%
6%
8%
10%
30%
16%
2%
18%
NL
96
715%
4%
4%
24%
16%
16%
6%
15%
AT
85
411%
10%
12%
14%
29%
11%
3%
10%
PL7
89
6%
12%
25%
12%
19%
15%
2%
9%
PT7
39
6%
15%
23%
14%
14%
13%
3%
12%
RO
87
74%
5%
21%
11%
30%
15%
1%
13%
SI
93
86%
10%
9%
17%
26%
16%
4%
12%
SK
95
58%
5%
13%
19%
27%
19%
2%
7%
FI9
29
11%
10%
12%
10%
20%
17%
7%
13%
SE
95
215%
6%
2%
33%
17%
16%
4%
7%
UK
11
37
9%
2%
14%
14%
24%
11%
7%
19%
HR
92
17%
13%
16%
15%
24%
15%
2%
8%
TR
85
63%
5%
24%
8%
28%
14%
5%
13%
MK
88
75%
14%
17%
8%
24%
12%
4%
16%
QE15b I
n c
ase
you a
re t
he
vict
im o
f dis
crim
inat
ion o
r har
assm
ent,
to w
hom
would
you p
refe
r to
rep
ort
your
case
? Sec
ondly
?

TO
TA
LTra
de U
nio
ns
NG
O's
-
ass
oci
ati
on
sTri
bu
nals
Bo
dy f
or
the
pro
mo
tio
n o
f eq
ual
treatm
en
tLaw
yer
Po
lice
Oth
er
(SP
.)D
K
EU
27
20
79
78
%9
%2
2%
13
%1
9%
11
%3
%1
5%
BE
89
311%
8%
24%
13%
23%
14%
2%
5%
BG
79
46%
11%
30%
13%
16%
10%
2%
12%
CZ
86
28%
8%
30%
18%
19%
9%
1%
7%
DK
91
54%
9%
21%
16%
21%
13%
5%
11%
D-W
88
78%
8%
19%
13%
20%
12%
3%
17%
DE
12
30
8%
8%
20%
13%
21%
11%
3%
16%
D-E
34
19%
7%
23%
12%
27%
6%
3%
13%
EE
59
46%
8%
30%
11%
14%
8%
2%
21%
IE7
08
9%
8%
10%
14%
20%
14%
3%
22%
EL
92
36%
10%
29%
12%
19%
14%
- 10%
ES
77
79%
9%
28%
9%
17%
9%
5%
14%
FR8
85
9%
11%
21%
10%
21%
10%
1%
17%
IT8
32
10%
10%
21%
13%
16%
10%
2%
18%
CY
40
55%
5%
35%
12%
17%
8%
1%
17%
LV6
19
5%
6%
33%
13%
13%
7%
2%
21%
LT7
38
5%
3%
37%
10%
20%
6%
5%
14%
LU4
33
8%
6%
30%
10%
20%
11%
4%
11%
HU
66
05%
4%
34%
13%
20%
10%
1%
13%
MT
36
611%
7%
12%
9%
21%
11%
2%
27%
NL
82
113%
8%
14%
12%
24%
11%
4%
14%
AT
77
29%
8%
25%
13%
19%
13%
3%
10%
PL7
20
10%
14%
20%
16%
13%
16%
2%
9%
PT6
51
7%
11%
22%
13%
17%
10%
4%
16%
RO
76
34%
5%
38%
14%
14%
6%
2%
17%
SI
82
65%
10%
17%
16%
24%
10%
7%
11%
SK
88
86%
6%
28%
17%
18%
8%
3%
14%
FI8
12
6%
9%
15%
11%
18%
14%
7%
20%
SE
88
47%
11%
9%
13%
20%
21%
6%
13%
UK
92
58%
4%
16%
17%
21%
7%
6%
21%
HR
84
78%
13%
29%
13%
17%
13%
1%
6%
TR
74
13%
8%
36%
13%
17%
7%
6%
10%
MK
74
55%
9%
26%
10%
15%
12%
5%
18%
QE15c
In c
ase
you a
re t
he
vict
im o
f dis
crim
inat
ion o
r har
assm
ent,
to w
hom
would
you p
refe
r to
rep
ort
your
case
? Thirdly
?

TO
TA
LTra
de U
nio
ns
NG
O's
-
ass
oci
ati
on
sTri
bu
nals
Bo
dy f
or
the
pro
mo
tio
n o
f eq
ual
treatm
en
tLaw
yer
Po
lice
Oth
er
(SP
.)D
K
EU
27
26
75
62
7%
18
%3
5%
35
%5
1%
55
%8
%1
1%
BE
10
00
41%
17%
34%
51%
50%
64%
10%
5%
BG
10
09
16%
23%
47%
47%
41%
52%
5%
15%
CZ
10
33
22%
21%
43%
38%
55%
66%
4%
11%
DK
10
01
65%
15%
24%
29%
57%
64%
11%
4%
D-W
10
92
24%
18%
28%
45%
66%
46%
8%
12%
DE
15
23
24%
17%
29%
44%
65%
47%
9%
12%
D-E
43
125%
13%
31%
41%
62%
50%
11%
12%
EE
10
07
17%
12%
32%
32%
27%
52%
11%
20%
IE1
00
745%
14%
11%
40%
38%
43%
14%
19%
EL
10
00
18%
22%
44%
50%
71%
64%
3%
3%
ES
10
07
27%
20%
46%
18%
52%
58%
8%
11%
FR1
07
833%
25%
38%
33%
50%
58%
6%
5%
IT1
04
826%
21%
35%
25%
60%
65%
4%
8%
CY
50
128%
10%
38%
42%
61%
53%
9%
4%
LV1
01
219%
12%
38%
33%
28%
46%
14%
18%
LT1
02
213%
6%
48%
45%
45%
48%
9%
16%
LU5
04
38%
13%
36%
26%
59%
71%
12%
4%
HU
10
00
13%
9%
44%
37%
37%
59%
6%
18%
MT
50
036%
16%
18%
21%
56%
62%
7%
10%
NL
10
79
31%
11%
16%
53%
35%
65%
15%
10%
AT
10
01
36%
20%
35%
36%
53%
44%
7%
15%
PL1
00
019%
27%
44%
29%
42%
50%
4%
21%
PT1
02
015%
26%
39%
31%
28%
44%
4%
28%
RO
10
23
13%
10%
53%
34%
47%
61%
4%
14%
SI
10
22
20%
28%
23%
39%
59%
58%
17%
8%
SK
10
37
24%
11%
40%
42%
54%
71%
9%
8%
FI9
99
50%
20%
27%
25%
43%
55%
13%
7%
SE
10
06
56%
17%
11%
74%
39%
46%
14%
5%
UK
13
17
32%
7%
28%
32%
45%
48%
16%
14%
HR
10
00
23%
40%
43%
33%
47%
65%
6%
8%
TR
10
03
11%
13%
59%
24%
45%
62%
9%
15%
MK
10
09
17%
27%
42%
24%
42%
56%
11%
12%
QE15T T
o w
hom
would
you p
refe
r to
rep
ort
your
case
of
dis
crim
inat
ion?
(MAX.
3 A
NSW
ERS)

TO
TA
LY
es
No
DK
EU
27
26
75
65
7%
42
%1
%
BE
10
00
58%
42%
- BG
10
09
67%
32%
1%
CZ
10
33
41%
59%
- D
K1
00
162%
38%
- D
-W1
09
257%
42%
1%
DE
15
23
51%
48%
1%
D-E
43
127%
72%
1%
EE
10
07
79%
21%
- IE
10
07
52%
47%
1%
EL
10
00
53%
47%
- ES
10
07
65%
35%
- FR
10
78
74%
25%
1%
IT1
04
850%
48%
2%
CY
50
170%
30%
- LV
10
12
66%
33%
1%
LT1
02
259%
40%
1%
LU5
04
75%
24%
1%
HU
10
00
50%
49%
1%
MT
50
031%
66%
3%
NL
10
79
63%
37%
- AT
10
01
44%
55%
1%
PL1
00
025%
74%
1%
PT1
02
060%
38%
2%
RO
10
23
55%
42%
3%
SI
10
22
65%
34%
1%
SK
10
37
47%
52%
1%
FI9
99
47%
52%
1%
SE
10
06
75%
24%
1%
UK
13
17
71%
28%
1%
HR
10
00
69%
30%
1%
TR
10
03
38%
56%
6%
MK
10
09
80%
19%
1%
QE16.1
Do y
ou h
ave
frie
nds
or
acquai
nta
nce
s w
ho a
re…
? Pe
ople
whose
eth
nic
origin
is
diffe
rent
from
yours

TO
TA
LY
es
No
DK
EU
27
26
75
61
7%
82
%1
%
BE
10
00
6%
89%
5%
BG
10
09
51%
47%
2%
CZ
10
33
22%
78%
- D
K1
00
15%
91%
4%
D-W
10
92
8%
91%
1%
DE
15
23
6%
93%
1%
D-E
43
12%
98%
- EE
10
07
12%
88%
- IE
10
07
5%
94%
1%
EL
10
00
7%
93%
- ES
10
07
38%
62%
- FR
10
78
15%
83%
2%
IT1
04
810%
88%
2%
CY
50
14%
96%
- LV
10
12
27%
73%
- LT
10
22
12%
87%
1%
LU5
04
8%
91%
1%
HU
10
00
51%
48%
1%
MT
50
06%
91%
3%
NL
10
79
5%
95%
- AT
10
01
7%
90%
3%
PL1
00
07%
92%
1%
PT1
02
020%
78%
2%
RO
10
23
42%
55%
3%
SI
10
22
12%
87%
1%
SK
10
37
46%
53%
1%
FI9
99
22%
78%
- SE
10
06
9%
90%
1%
UK
13
17
16%
83%
1%
HR
10
00
22%
78%
- TR
10
03
10%
85%
5%
MK
10
09
59%
40%
1%
QE16.2
Do y
ou h
ave
frie
nds
or
acquai
nta
nce
s w
ho a
re…
? Rom
a

TO
TA
LY
es
No
DK
EU
27
26
75
63
8%
58
%4
%
BE
10
00
53%
45%
2%
BG
10
09
7%
83%
10%
CZ
10
33
20%
78%
2%
DK
10
01
53%
44%
3%
D-W
10
92
35%
61%
4%
DE
15
23
34%
62%
4%
D-E
43
129%
67%
4%
EE
10
07
17%
81%
2%
IE1
00
740%
55%
5%
EL
10
00
17%
83%
- ES
10
07
56%
42%
2%
FR1
07
859%
39%
2%
IT1
04
832%
65%
3%
CY
50
116%
83%
1%
LV1
01
212%
84%
4%
LT1
02
27%
88%
5%
LU5
04
57%
41%
2%
HU
10
00
11%
77%
12%
MT
50
032%
66%
2%
NL
10
79
68%
31%
1%
AT
10
01
26%
67%
7%
PL1
00
011%
83%
6%
PT1
02
021%
70%
9%
RO
10
23
3%
84%
13%
SI
10
22
17%
77%
6%
SK
10
37
15%
80%
5%
FI9
99
35%
61%
4%
SE
10
06
59%
36%
5%
UK
13
17
56%
42%
2%
HR
10
00
9%
86%
5%
TR
10
03
5%
89%
6%
MK
10
09
6%
80%
14%
QE16.3
Do y
ou h
ave
frie
nds
or
acquai
nta
nce
s w
ho a
re…
? H
om
ose
xual

TO
TA
LY
es
No
DK
EU
27
26
75
65
8%
41
%1
%
BE
10
00
62%
38%
- BG
10
09
60%
37%
3%
CZ
10
33
51%
49%
- D
K1
00
159%
41%
- D
-W1
09
252%
47%
1%
DE
15
23
52%
47%
1%
D-E
43
151%
48%
1%
EE
10
07
65%
35%
- IE
10
07
62%
37%
1%
EL
10
00
38%
62%
- ES
10
07
68%
32%
- FR
10
78
65%
34%
1%
IT1
04
855%
44%
1%
CY
50
155%
44%
1%
LV1
01
268%
32%
- LT
10
22
63%
36%
1%
LU5
04
66%
33%
1%
HU
10
00
48%
51%
1%
MT
50
042%
57%
1%
NL
10
79
58%
42%
- AT
10
01
48%
51%
1%
PL1
00
047%
52%
1%
PT1
02
058%
39%
3%
RO
10
23
38%
59%
3%
SI
10
22
64%
36%
- SK
10
37
67%
32%
1%
FI9
99
57%
43%
- SE
10
06
63%
36%
1%
UK
13
17
73%
27%
-
HR
10
00
65%
35%
- TR
10
03
43%
53%
4%
MK
10
09
68%
31%
1%
QE16.4
Do y
ou h
ave
frie
nds
or
acquai
nta
nce
s w
ho a
re…
? D
isab
led

TO
TA
LY
es
No
DK
EU
27
26
75
66
4%
33
%3
%
BE
10
00
62%
36%
2%
BG
10
09
59%
36%
5%
CZ
10
33
44%
50%
6%
DK
10
01
66%
32%
2%
D-W
10
92
73%
25%
2%
DE
15
23
69%
29%
2%
D-E
43
153%
44%
3%
EE
10
07
61%
37%
2%
IE1
00
773%
25%
2%
EL
10
00
38%
62%
- ES
10
07
63%
33%
4%
FR1
07
875%
23%
2%
IT1
04
851%
46%
3%
CY
50
162%
38%
- LV
10
12
78%
20%
2%
LT1
02
255%
43%
2%
LU5
04
76%
21%
3%
HU
10
00
65%
26%
9%
MT
50
037%
60%
3%
NL
10
79
80%
18%
2%
AT
10
01
61%
37%
2%
PL1
00
044%
53%
3%
PT1
02
061%
32%
7%
RO
10
23
54%
41%
5%
SI
10
22
72%
27%
1%
SK
10
37
78%
20%
2%
FI9
99
66%
32%
2%
SE
10
06
70%
26%
4%
UK
13
17
79%
19%
2%
HR
10
00
74%
26%
- TR
10
03
24%
70%
6%
MK
10
09
77%
22%
1%
QE16.5
Do y
ou h
ave
frie
nds
or
acquai
nta
nce
s w
ho a
re…
? O
f a
diffe
rent
relig
ion o
r hav
e diffe
rent
bel
iefs
than
you

TO
TA
LA
n e
thn
ic
min
ori
tyA
relig
iou
s m
ino
rity
A s
exu
al
min
ori
ty
A m
ino
rity
in
te
rms
of
dis
ab
ilit
y
No
ne o
f th
e
ab
ove (
SP
.)
An
y o
ther
min
ori
ty g
rou
p
(SP
.)D
K
EU
27
26
75
65
%4
%1
%2
%8
5%
1%
4%
BE
10
00
5%
4%
2%
3%
83%
1%
4%
BG
10
09
15%
6%
0%
1%
77%
- 6%
CZ
10
33
5%
2%
1%
3%
86%
- 5%
DK
10
01
3%
3%
1%
2%
90%
1%
2%
D-W
10
92
5%
3%
0%
1%
89%
0%
3%
DE
15
23
5%
3%
1%
1%
89%
0%
3%
D-E
43
12%
2%
1%
2%
90%
0%
3%
EE
10
07
8%
2%
0%
3%
71%
0%
16%
IE1
00
73%
3%
0%
2%
89%
1%
2%
EL
10
00
1%
1%
- 1%
97%
- -
ES
10
07
4%
3%
1%
2%
89%
1%
2%
FR1
07
83%
3%
1%
3%
87%
1%
3%
IT1
04
84%
6%
2%
2%
81%
0%
7%
CY
50
11%
1%
- 1%
97%
- -
LV1
01
26%
3%
0%
2%
84%
- 6%
LT1
02
23%
2%
0%
3%
85%
0%
7%
LU5
04
6%
6%
1%
1%
82%
1%
4%
HU
10
00
5%
3%
1%
3%
85%
1%
4%
MT
50
01%
5%
1%
1%
85%
- 7%
NL
10
79
3%
5%
1%
2%
87%
1%
2%
AT
10
01
5%
8%
3%
4%
81%
2%
4%
PL1
00
01%
3%
0%
2%
91%
0%
3%
PT1
02
02%
3%
1%
1%
85%
0%
8%
RO
10
23
8%
10%
0%
0%
79%
0%
6%
SI
10
22
6%
6%
1%
3%
84%
- 5%
SK
10
37
7%
7%
0%
3%
76%
2%
8%
FI9
99
3%
4%
1%
2%
86%
1%
4%
SE
10
06
4%
4%
2%
4%
84%
1%
4%
UK
13
17
8%
5%
1%
3%
81%
1%
1%
HR
10
00
3%
3%
0%
1%
91%
0%
2%
TR
10
03
5%
2%
0%
1%
83%
0%
9%
MK
10
09
10%
3%
0%
3%
81%
1%
5%
QE17 W
her
e yo
u liv
e, d
o y
ou c
onsi
der
yours
elf
to b
e par
t of
any
of
the
follo
win
g?
Plea
se t
ell m
e al
l th
at a
pply
. (R
OTATE –
MU
LTIP
LE A
NSW
ERS P
OSSIB
LE)

TO
TA
LY
es
No
R
efu
sal
(SP
.)
EU
27
26
75
61
4%
85
%1
%
BE
10
00
17%
82%
1%
BG
10
09
12%
87%
1%
CZ
10
33
12%
87%
1%
DK
10
01
24%
76%
- D
-W1
09
212%
86%
2%
DE
15
23
13%
86%
1%
D-E
43
115%
84%
1%
EE
10
07
22%
78%
- IE
10
07
6%
94%
- EL
10
00
9%
91%
- ES
10
07
8%
92%
- FR
10
78
19%
81%
- IT
10
48
3%
96%
1%
CY
50
118%
82%
- LV
10
12
18%
82%
- LT
10
22
13%
86%
1%
LU5
04
14%
84%
2%
HU
10
00
19%
80%
1%
MT
50
011%
89%
- N
L1
07
921%
79%
- AT
10
01
18%
79%
3%
PL1
00
020%
79%
1%
PT1
02
013%
85%
2%
RO
10
23
16%
83%
1%
SI
10
22
18%
80%
2%
SK
10
37
14%
84%
2%
FI9
99
16%
84%
- SE
10
06
27%
73%
- U
K1
31
721%
79%
-
HR
10
00
20%
79%
1%
TR
10
03
9%
86%
5%
MK
10
09
15%
84%
1%
QE18 D
o y
ou s
uff
er f
rom
a c
hro
nic
phys
ical
or
men
tal hea
lth p
roble
m w
hic
h a
ffec
ts y
ou in y
our
dai
ly a
ctiv
itie
s?