Embed Size (px)
Citation preview
Seediscussions,stats,andauthorprofilesforthispublicationat:https://www.researchgate.net/publication/313556742
DiscretionaryprovisioningpracticesamongWesternEuropeanbanks
ArticleinJournalofFinancialEconomicPolicy·February2017
DOI:10.1108/JFEP-07-2016-0049
CITATIONS
0
READS
19
1author:
Someoftheauthorsofthispublicationarealsoworkingontheserelatedprojects:
DiscretionaryProvisioningPracticesamongWesternEuropeanBanksViewproject
BankEarningsSmoothingduringMandatoryIFRSAdoptioninNigeriaViewproject
PetersonKOzili
UniversityofEssex
14PUBLICATIONS19CITATIONS
SEEPROFILE
AllcontentfollowingthispagewasuploadedbyPetersonKOzilion25February2017.
Theuserhasrequestedenhancementofthedownloadedfile.Allin-textreferencesunderlinedinblueareaddedtotheoriginaldocument
andarelinkedtopublicationsonResearchGate,lettingyouaccessandreadthemimmediately.

Discretionary Provisioning Practices among Western European Banks
Peterson K Ozili
University of Essex
United Kingdom
2017
Discretionary Provisioning Practices among Western European Banks
Abstract
The purpose of this study is to investigate whether discretionary provisioning by Western European
banks is driven by income smoothing or credit risk considerations. We find evidence that
discretionary provisioning by Western European banks is driven by income smoothing incentives in
the post-financial crisis period, particularly, among listed banks. Also, we observe that discretionary
provisioning is significantly influenced by credit risk factors, mainly, non-performing loans and loan
growth. Also, we find that discretionary provisioning by Western European banks is procyclical with
fluctuations in the economic cycle. Overall, the implication of the findings is that discretionary
provisioning among Western European banks is driven by both income smoothing and credit risk
considerations.
Keywords: Managerial Discretion, Income smoothing, Bank regulation, Loan loss provisions,
Western Europe, Procyclicality.
JEL Code: C21, C23, G21, M41
Published Version: http://www.emeraldinsight.com/doi/abs/10.1108/JFEP-07-2016-0049
To cite: Ozili, P. K. (2017). Discretionary provisioning practices among Western European
banks. Journal of Financial Economic Policy, Vol. 9 No. 1.
1. Introduction
In this paper, we investigate whether discretionary provisioning among Western European banks is
driven by credit risk or income smoothing considerations. Bank loan loss provisions play an important
role in micro-prudential regulation of banks. Under Basel II, bank capital should be sufficient to cover
unexpected losses while loan loss provisions (and loan loss reserves) should cover expected losses on
bank loan portfolio (BCBS, 2004). Accordingly, European banks are required to set aside ‘specific
provisions’ to cover probable impaired loans and make ‘general provisions’ to cover loan losses
arising from fluctuations in the business cycle (FSF, 2009). After the 2007 to 2009 financial crisis,
bank regulators in Europe introduced strict rules on bank provisioning and risk-taking behaviour, and
such rules were intended to ensure that the provisioning of Western European banks is driven by
credit risk considerations. In this paper, we argue that discretionary provisioning will be driven by
credit risk considerations if bank managers are more concerned about the credit quality of their loan
portfolio in the post-financial crisis period, or discretionary provisioning will be driven by income
smoothing incentives if bank managers are more concerned about earnings stability (or opportunistic
earnings management) in the post-financial crisis period. To date, it is not clear whether the
provisioning behaviour of Western European banks is driven by credit risk or income smoothing
considerations particularly after the 2007 to 2009 financial crisis.
Moreover, prior European studies examine bank provisioning practices in the pre-crisis period [e.g.
Leventis et al, 2011 (examine 1999 to 2008); Curcio and Hasan, 2015 (examine 1996 to 2006); Skala,
2015 (examine Central European banks from 2004 to 2012)]. In contrast to Skala (2015), the present
study examine the case of Western European banks to investigate whether loan loss provisioning of
Western European banks is driven by credit risk or income smoothing considerations before and after
the financial crisis.
The study employs bank data from Bankscope from 16 Western European countries and finds that
discretionary provisioning by Western European banks is driven by both income smoothing and credit
risk considerations. This study contributes to the literature that investigate the determinants of loan
loss provisions. We add to this strand of literature by providing evidence that managerial provisioning
decisions in Western Europe is driven by both income smoothing and credit risk considerations. Also,
by focusing on the context of Western European banks, we contribute to the income smoothing
literature by providing another evidence for income smoothing in Europe.
The remainder of the paper is organised as follows. Section 2 presents the literature review and
develops the hypotheses. Section 3 presents the data and methodology. Section 4 presents the findings
and Section 5 concludes.
2. Literature Review
Kleimeier (2002) and Evans et al (2008) demonstrate that banking in Western Europe has become
more competitive, more concentrated and more integrated in the last decade just before the 2008
financial crisis. It was during this period (characterized by increased bank competition, concentration,
and market integration) that Leventis et al (2011) examine income smoothing practices among 91
listed European banks during 1999 to 2008 period. They investigate the impact of accounting
disclosure (IFRS) on banks’ incentive to use loan loss provisions to smooth income and to manage
regulatory capital. They find evidence for income smoothing via provisions. However, they observe
that bank income smoothing behaviour is reduced after IFRS adoption in Europe. Bonin and Kosak
(2013) investigate the provisioning practices of banks in emerging European countries during the
1997 to 2010 period. They find evidence for income smoothing, capital management and
macroeconomic procyclicality. Also, Curcio and Hasan (2015) investigate the provisioning and
income smoothing practices of Euro-Area and non-Euro Area credit institutions using pre-crisis bank
data, during 1996 to 2006 period. They find that non-Euro Area banks use provisions to smooth
income. However, they observe that Euro-Area banks did not smooth income possibly because they
were concerned about the credit quality of bank loan portfolio. Jointly, Bonin and Kosak (2013) and
Curcio and Hasan (2015)’s findings show that discretionary provisioning in the pre-crisis period was
driven by income smoothing and capital management considerations than by credit risk
considerations. Other non-EU studies find similar evidence for income smoothing in the pre-crisis
period (e.g. Bhat, 1996; Lobo and Yang, 2001; Kanagaretnam et al, 2004; El Sood, 2012; Balboa et
al, 2013; Ozili, 2016, etc.).
In contrast to the pre-crisis banking environment, the post-crisis banking environment in Western
Europe has become more regulated after the 2008 crisis (Temming, 2014), and only few studies use
post-crisis EU bank data to investigate the impact of the regulatory environment on loan loss
provisioning practices of EU banks. For example, Olszak et al (2016) investigate the determinants of
bank loan loss provisions and procyclicality. They find that loan loss provisions of large and listed
commercial banks is procyclical with business cycle fluctuations. Also, they observe that better
investor protection and bank capital regulation reduce the procyclicality of loan loss provisions. Skala
(2015) investigates the case of Central European banks during the 2004 to 2012 period and find that
banks in the region use loan loss provisions to smooth income, and that provisions is procyclical with
fluctuations in the economic cycle. Overall, there are few studies on bank loan loss provisioning
practices in the post-financial crisis period.
To develop the hypothesis, we predict a strong positive association between loan loss provisions and
bank earnings if Western European banks increase (decrease) provisions to lower (increase) high
(low) earnings in order to report stable earnings over time. This is consistent with the argument of the
income smoothing hypothesis (Ahmed et al, 1999; Fonseca and Gonzalez, 2008; Leventis et al, 2011).
Hypothesis: Western European banks use loan loss provisions to smooth bank earnings.
On the other hand, we predict a negative association between loan loss provisions and bank earnings
if bank provisions is driven by credit risk considerations rather than by income smoothing
consideration. To date, conclusions to support the income smoothing hypothesis are mixed in the
income smoothing literature (e.g. Ahmed et al, 1999; Lobo and Yang, 2001; Kanagaretnam et al,
2004).
3. Data and Methodology
3.1. Data
The bank sample consists of selected Western European banking institutions in the Bankscope
database. The countries include: United Kingdom, Denmark, Finland, Ireland, Greece, Portugal,
Belgium, Austria, Italy, France, Luxemburg, Spain, Netherland, Germany, Sweden, and Norway. The
sample period cover the 2004 to 2013 period. All sample banks have December 31 fiscal year ends.
The sample includes banks with required data for our tests from 2004 to 2013. Banks that have loan
loss provisions data in Bankscope database for at least two consecutive years were included in the
sample in order to control for quality of bank financial reporting. Year-2008 bank-year observations
were excluded from the analysis to control for the adverse effect of the financial crisis from affecting
our inference. The resulting final sample yields 114 banks consisting of 22 listed banks and 92 non-
listed banks.
3.2. Methodology
The baseline model specification adopted in this study follows the existing literature.
𝐿𝐿𝑃 𝑖𝑡 = 𝛼0 + 𝛼1 𝑁𝑃𝐿 𝑖𝑡 + 𝛼2 𝐿𝑂𝐴𝑁 𝑖𝑡 + 𝛼3 𝐸𝐵𝑇𝑃 𝑖𝑡 + 𝛼4 𝐶𝐴𝑅 𝑖𝑡 + 𝛼5 ∆𝐺𝐷𝑃𝑗𝑡
+ 𝛼6𝑆𝐼𝑍𝐸 𝑖𝑡 + 𝜀 𝑖𝑡 … … … (1)
Where,
LLP = Ratio of loan loss provisions to total assets for bank i at time t.
NPL = Ratio of impaired loans to gross loans for bank i at time t
LOAN = Change in gross loan outstanding for bank i at time t.
CAR = Ratio of actual tier 1 regulatory capital to risk-weighted assets for bank i at time t.
EBTP = Ratio of earnings before taxes and loan loss provisions to total assets for bank i at time t.
SIZE = Natural logarithm of total assets for bank i at time t.
∆GDP = Change in gross domestic product for country j at period t.
ε = Error term.
Consistent with prior studies, the explanatory variables include non-performing loan (NPL), loan
growth (LOAN), tier 1 capital (CAR), bank size (SIZE) and gross domestic product growth rate
(∆GDP). NPL reflects the credit quality of banks (Beaver and Engel, 1996; Ahmed et al, 1999). NPL,
an ex-post measure of the quality of bank loan portfolio, is considered to contain information on bank
risk that is not captured by traditional measures of credit risk (Ahmed et al, 1999). We predict a
positive sign for NPL coefficient because banks will increase provisions when they expect higher loan
defaults. We use loan growth (LOAN) as a proxy for contemporaneous credit risk (Lobo and Yang,
2001; Laeven and Majnoni, 2003; Kanagaretnam et al, 2003; Bushman and Williams, 2012). A
positive sign for LOAN variable indicates that banks would increase provisions when loan supply
increases to compensate for contemporaneous credit risk concerns. However, Lobo and Yang (2001)
point out that a negative sign on the LOAN variable may be expected if there is improved quality of
incremental loans which in turn would require fewer provisioning. Following the argument of Laeven
and Majnoni (2003), we predict a positive sign for LOAN coefficient. CAR variable reflects banks’
use of provisions to manage regulatory capital (Ahmed et al, 1999; Anandarajan et al, 2007; Kilic et
al, 2012; Bonin and Kosak, 2013). We expect a negative sign for CAR coefficient if banks increase
provisions when they have low Tier 1 capital ratio. Also, we use the natural logarithm of total assets
(SIZE) as a proxy for bank size. Kilic et al (2012), Ozili (2015) and Curcio and Hasan (2015) also use
the SIZE variable. Large banks are considered to have higher levels of business activities and tend to
keep more provisions to compensate for their high level of business activities compared to smaller
banks (Anandarajan et al, 2003). Accordingly, we expect a positive relationship between SIZE and
LLP. At country level, ΔGDP controls for economic fluctuations for each country. The use of ΔGDP
to capture changes in economic activity for each country is common across the literature (e.g. Bikker
and Metzemakers, 2005; Floro, 2010, etc.). Consistent with prior studies, we expect a negative
relationship between LLP and ∆GDP because banks will increase provisions during bad economic
periods (recessionary periods), and keep fewer provisions during good economic periods (Laeven and
Majnoni, 2003; Bikker and Metzemakers, 2005; Floro, 2010, etc.).
The coefficients of interest in the analysis are NPL, LOAN, EBTP and POST*EBTP coefficients. The
income smoothing variable (EBTP) is included to test whether Western European banks use loan loss
provisions to smooth income. We introduce POST dummy variable that take the value ‘1’ for the
post-financial crisis period (2009-2013) and ‘0’ for the pre-crisis period (2004-2007). We interact
POST with EBTP to detect whether income smoothing via provisions is pronounced in the post-
financial crisis period compared to the pre-financial crisis period. The use of POST*EBTP interaction
term is consistent with Anandarajan et al (2007) who examine the case of Australian banks. We
interpret a significant and positive sign for EBTP and POST*EBTP coefficients as evidence for the
use of provisions to smooth income. We also interpret a significant and positive sign for NPL and
LOAN coefficients as evidence for the use of provisions for credit risk purposes because banks will
keep more provisions when they expect higher NPL and LOAN.
4. Empirical Result
4.1. Descriptive Statistics and Correlation
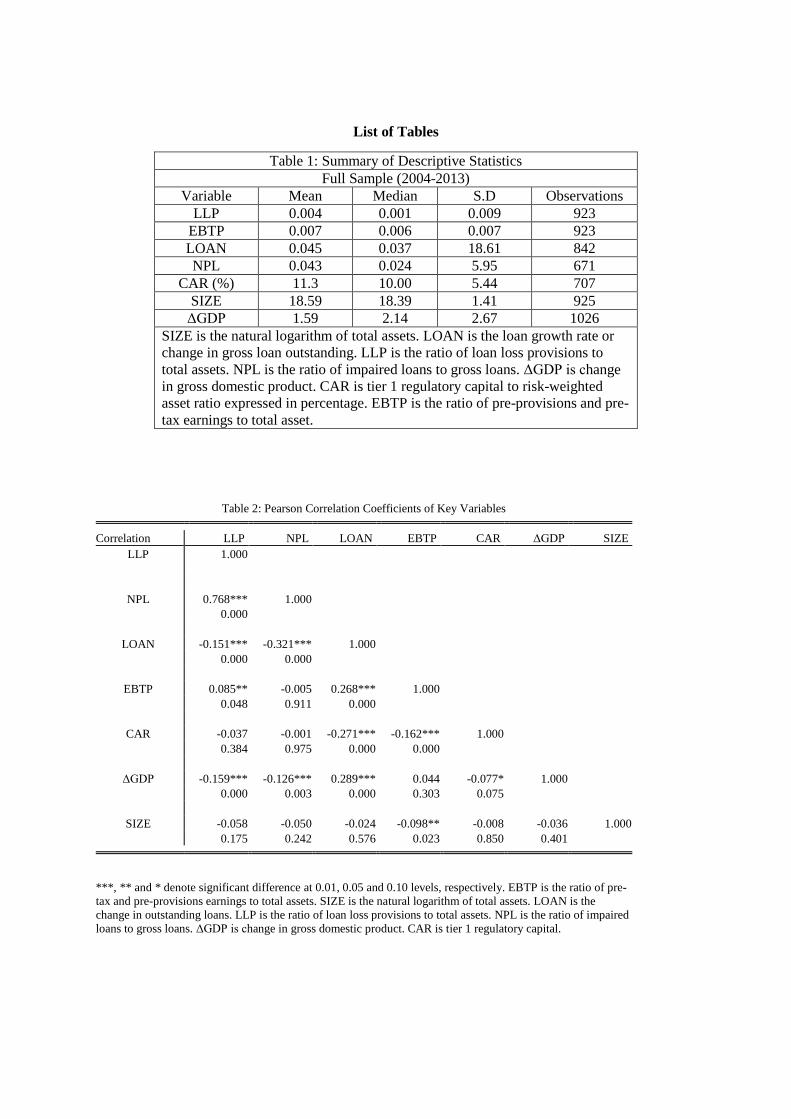
Descriptive statistics for the full sample from 2004 to 2013 is presented in Table 1. Loan loss
provisions (LLPs), on average, is 0.37% while pre-provisions and pre-tax earnings (EBTP) is 0.74%.
Capital management variable (CAR), on average, is 11.34% while bank size (SIZE) is 18.59. Change
in gross loan (LOAN) is 4.53% while non-performing loan (NPL), on average, is 4.32%.
[Insert Table 1]
Table 2 reports the correlation coefficients and the associated p-values for each variable. LLP is
positively correlated with EBTP (0.085), and suggests that an increase in earnings (EBTP) is followed
by increase in loan loss provisions (LLP). LLP is negatively correlated with SIZE (-0.058). On the
other hand, LLP is negatively correlated with CAR (-0.037), and supports the capital management
hypothesis that propose a negative relationship between CAR and LLP. LLP coefficient is negatively
correlated with ∆GDP (-0.159), and indicates that provisioning by Western European banks is
procyclical with fluctuations in the economic cycle. LLP is negative and significantly correlated with
LOAN (-0.151), and indicates that higher bank lending is followed by fewer provisions. LLP is
positively correlated with NPL (0.768), and indicates that banks increase provisions when they expect
higher loan losses. Finally, the correlation between the independent variables are not too high, hence,
multicollinearity is not an issue in the analysis.
[Insert Table 2]
4.2. Estimation Results
The result is reported in Table 3. Column 1 reports the pooled regression results for the full bank
sample. EBTP coefficient (t = 2.16) is positive and significant at 5% level, and provide support for the
income smoothing hypothesis. Leventis et al (2011) find similar evidence. POST*EBTP coefficient is
negative and insignificant in Column 2, and indicates that the use of provisions to smooth earnings is
not pronounced during the post-financial crisis period compared to the pre-financial crisis period.
With respect to the control variables in Column 1, NPL coefficient (t = 8.28) is positive and
significant at 1% level, and indicates that Western European banks increase provisions when they
expect higher non-performing loans. LOAN coefficient (t = 3.57) is positive and significant, and
implies that Western European banks keep more provisions when they increase bank lending. CAR
coefficient (t = -0.11) is negative and insignificant. SIZE coefficient (t = -0.49) is insignificant. ∆GDP
coefficient (t = -3.37) is negative and significant at 1% level, and indicates that provisioning by
Western European banks is procyclical with fluctuations in the economic cycle. Interestingly, ∆GDP
coefficient is significant in all estimation in Table 3.
[Insert Table 3]
4.3. Sensitivity Analysis
First, we test whether listed1 banks use provisions to smooth income. The result is reported in Column
3 of Table 3. LISTED*EBTP coefficient is insignificant. Secondly, we use the interaction term
LISTED*POST*EBTP to test whether income smoothing is pronounced among listed banks in the
post-crisis period compared to non-listed banks in the pre-crisis period. LISTED*POST*EBTP
coefficient is insignificant in Column 4 while the coefficient of the credit risk variables (NPL and
LOAN) remain significant. Further, we divide the full sample into two sub-samples: listed banks and
non-listed banks to test whether listed and non-listed banks use provisions to smooth reported
earnings during the post-crisis period relative to the pre-crisis period. For the listed banks sub-sample
(Column 6), POST*EBTP coefficient is positive and significant, and implies that listed banks use
provisions to smooth income to a greater extent during the post-financial crisis period compared to the
pre-financial crisis period. For the non-listed banks sub-sample (Column 8), POST*EBTP coefficient
is insignificant, and implies that non-listed banks do not use provisions to smooth income to a greater
extent in the post-financial crisis period compared to the pre-financial crisis period.
[Insert Table 3]
Furthermore, in Table 4 we perform additional tests with respect to the sample period. We divide the
full sample into two sub-samples: pre-financial crisis period (2004-2007) and the post-financial crisis
period (2009-2013). EBTP coefficient is positive and significant in Column 1 and 3, and indicates that
banks use provisions to smooth income in the pre-and post-crisis period while the coefficient of the
credit risk variables (NPL and LOAN) also remain significant. However, EBTP coefficient is more
significant in the post-crisis period. This suggests that provisioning by Western European banks
during the post-crisis period is driven by income smoothing and credit risk considerations. Finally, we
use the pre- and post-crisis subsample category to test again whether listed banks use provisions to
smooth income to a greater extent compared to non-listed banks. LISTED*EBTP coefficient is
insignificant in Column 2 and 4 while the coefficient of the credit risk variables (NPL and LOAN)
remain significant.
[Insert Table 4]
5. Conclusion
In this study, we investigate whether discretionary provisioning by Western European banks is driven
by income smoothing or credit risk considerations. We find evidence that discretionary provisioning
by Western European banks is driven by income smoothing incentives in the post-financial crisis
period, particularly, among listed banks. We also find that bank provisioning is procyclical with
fluctuations in the economic cycle. Also, we observe that credit risk factors (NPLs and LOANs)
significantly influence the level of bank provisions throughout the analysis. Hence, we conclude that
1 We distinguish between listed and non-listed banks based on the list of companies provided available at the
London Stock Exchange (LSE) updated as at 30th April, 2015. We use the London Stock Exchange as a proxy
for the capital market because it is considered to be the most diverse capital market in Europe with regional
company listing in Europe. The classification yields 22 listed banks and 92 non-listed banks. We note that the
small number of listed bank may affect our inference.
discretionary provisioning among Western European banks is driven by both income smoothing and
credit risk considerations.
Assuming one goal of bank supervisors is to ensure that discretionary provisions is driven solely by
credit risk considerations, our empirical results confirm that discretionary provisioning by Western
European banks reflects credit risk considerations. However, for the purpose of policy making, bank
supervisors in Western Europe should find ways to ensure that discretionary provisioning is driven
solely by credit risk considerations while discouraging the use of provisions to smooth income. Future
research could investigate other credit risk factors that influence the level of discretionary provisions
among Western European banks. Also, future research could investigate whether discretionary
provisions is influenced by the risk culture of banks in Western Europe, Central Europe and Emerging
Europe.
References
Ahmed, A.S., Takeda, C. and Thomas, S. (1999), “Bank Loan Loss Provisions: A Re-examination of
Capital Management, Earnings Management and Signaling Effects”, Journal of Accounting and
Economics, Vol. 28, pp. 1-25.
Anandarajan, A., Hasan, I., and Lozano-Vivas, A. (2003), “The Role of Loan Loss Provisions in
Earnings Management, Capital Management, and Signaling: The Spanish Experience”, Advances in
International Accounting, Vol. 16, pp. 45-65.
Anandarajan, A, Hasan, I., and McCarthy, C. (2007), “Use of Loan Loss Provisions for Capital,
Earnings Management and Signaling by Australian banks”, Accounting and Finance, Vol 47, pp. 357-
379.
Balboa, M., López-Espinosa, G., and Rubia, A. (2013), “Nonlinear Dynamics in Discretionary
Accruals: An Analysis of Bank Loan Loss Provisions”, Journal of Banking and Finance, Vol. 37, No.
12, pp. 5186-5207.
Beaver, W and Engel, E. (1996), “Discretionary Behavior with Respect to Allowance for Loan Losses
and the Behavior of Security Prices”, Journal of Accounting and Economics, Vol. 22, pp. 177-206.
BCBS (2004), “International Convergence of Capital Measurement and Capital Standards: a Revised
Framework”, Basel Committee on Banking Supervision, June (www.bis.org).
Bhat, V. N. (1996), “Banks and Income Smoothing: An Empirical Analysis”, Applied Financial
Economics, Vol. 6 No. 6, pp. 505-510.
Bikker, J. A., and Metzemakers, P. A. (2005), “Bank Provisioning Behaviour and
Procyclicality”. Journal of International Financial Markets, Institutions and Money, Vol. 15, No. 2,
pp. 141-157.
Bonin, J., and Kosak, M. (2013), “Loan Loss Provisioning in Emerging Europe: Precautionary or Pro-
Cyclical?” Wesleyan University, Department of Economics.
Bushman, R. M., and Williams, C. D. (2012), “Accounting Discretion, Loan Loss Provisioning, and
Discipline of Banks’ Risk-taking”, Journal of Accounting and Economics, Vol. 54 No. 1, pp. 1-18.
Curcio, D., and Hasan, I. (2015), “Earnings and Capital Management and Signalling: the Use of Loan
Loss Provisions by European Banks”, The European Journal of Finance, Vol. 21 No. 1, pp. 26-50.
El Sood, H., A. (2012), “Loan Loss Provisions and Income Smoothing in US Banks Pre and Post
Financial Crisis”, International Review of Financial Analysis, Vol. 25, pp. 64-72.
Evans, P., Hasan, I., and Lozano-Vivas, A. (2008), “Deregulation and Convergence of Banking: The
EU experience”, Finnish Economic Papers, Vol. 21, No. 2, pp. 104-117.
Financial Stability Forum. (2009), “Report of the Financial Stability Forum on Addressing
Procyclicality in the Financial System”, April 2, Available at:
(http:/www.financialstabilityboard.org/publications/r_0904a.pdf). Accessed 7th August, 2015.
Floro, D. (2010), “Loan Loss Provisioning and the Business Cycle: Does Capital Matter? Evidence
from Philippine Banks”, Bank for International Settlements Research Paper.
Fonseca, A.R, and Gonzalez, F (2008), "Cross-country Determinants of Bank Income Smoothing by
Managing Loan Loss Provisions." Journal of Banking and Finance Vol. 32 No. 2, pp. 217-228.
Kilic, E., Lobo, G. J., Ranasinghe, T., and Sivaramakrishnan, K. (2012), “The Impact of SFAS 133 on
Income Smoothing by Banks through Loan Loss Provisions”, The Accounting Review, Vol. 88 No. 1,
pp. 233-260.
Kanagaretnam, K., Lobo, G.J and Mathieu, R. (2003), “Managerial Incentives for Income Smoothing
through Bank Loan Loss Provisions”, Review of Quantitative Finance and Accounting, Vol. 20, pp.
63-80.
Kanagaretnam, K, Lobo, G. J., and Yang, D. (2004), “Joint Tests of Signaling and Income Smoothing
through Bank Loan Loss Provisions”, Contemporary Accounting Research, Vol. 21 No. 4, pp. 843-
884.
Kleimeier (2002), “Banking in Western Europe”, The International Encyclopedia of Business and
Management Thomson Learning. Available at: http://pub.maastrichtuniversity.nl/f14f1705-ae83-
4958-b739-9350f40c6252. Accessed: 7th August, 2015.
Leventis, S., Dimitropoulos, P. E., and Anandarajan, A. (2011), “Loan Loss Provisions, Earnings
Management and Capital Management under IFRS: The Case of EU Commercial Banks”, Journal of
Financial Services Research, Vol. 40 No. 1-2, pp. 103-122.
Lobo, G.J. and Yang, D.H. (2001), “Bank Managers' Heterogeneous Decisions on Discretionary Loan
loss provisions”, Review of Quantitative Finance and Accounting, Vol. 16 No. 3, pp. 223-250.
Olszak, M., Pipień, M., Kowalska, I., and Roszkowska, S. (2016), “What Drives Heterogeneity of
Cyclicality of Loan Loss Provisions in the EU?”, Journal of Financial Services Research, 1-42.
Ozili, P.K. (2015), “Loan Loss Provisioning, Income Smoothing, Signaling, Capital Management and
Procyclicality: Does IFRS Matter? Empirical Evidence from Nigeria”, Mediterranean Journal of
Social Sciences, Vol 6 No.2, pp. 224-232.
Ozili, P.K. (2017), “Bank Earnings Smoothing, Audit Quality and Procyclicality in Africa. The Case
of Loan Loss Provisions”, Review of Accounting and Finance, Vol. 16, No. 2 Forthcoming.
Skała, D. (2015), “Saving on a Rainy Day? Income Smoothing and Procyclicality of Loan Loss
Provisions in Central European Banks”, International Finance, Vol. 18 No. 1, pp. 25-46.
Temming, M. (2014), “Effect of Pre-Crisis Capital on Stock Abnormal Return at Acquisition
Announcements. The Case of the Western European Banking Sector during the 2008 Crisis”.
Available at: http://essay.utwente.nl/64742/1/Temming_MA_MB.pdf
List of Tables
Table 1: Summary of Descriptive Statistics
Full Sample (2004-2013)
Variable Mean Median S.D Observations
LLP 0.004 0.001 0.009 923
EBTP 0.007 0.006 0.007 923
LOAN 0.045 0.037 18.61 842
NPL 0.043 0.024 5.95 671
CAR (%) 11.3 10.00 5.44 707
SIZE 18.59 18.39 1.41 925
ΔGDP 1.59 2.14 2.67 1026
SIZE is the natural logarithm of total assets. LOAN is the loan growth rate or
change in gross loan outstanding. LLP is the ratio of loan loss provisions to
total assets. NPL is the ratio of impaired loans to gross loans. ΔGDP is change
in gross domestic product. CAR is tier 1 regulatory capital to risk-weighted
asset ratio expressed in percentage. EBTP is the ratio of pre-provisions and pre-
tax earnings to total asset.
Table 2: Pearson Correlation Coefficients of Key Variables
Correlation LLP NPL LOAN EBTP CAR ΔGDP SIZE
LLP 1.000
NPL 0.768*** 1.000
0.000
LOAN -0.151*** -0.321*** 1.000
0.000 0.000
EBTP 0.085** -0.005 0.268*** 1.000
0.048 0.911 0.000
CAR -0.037 -0.001 -0.271*** -0.162*** 1.000
0.384 0.975 0.000 0.000
ΔGDP -0.159*** -0.126*** 0.289*** 0.044 -0.077* 1.000
0.000 0.003 0.000 0.303 0.075
SIZE -0.058 -0.050 -0.024 -0.098** -0.008 -0.036 1.000
0.175 0.242 0.576 0.023 0.850 0.401
***, ** and * denote significant difference at 0.01, 0.05 and 0.10 levels, respectively. EBTP is the ratio of pre-
tax and pre-provisions earnings to total assets. SIZE is the natural logarithm of total assets. LOAN is the
change in outstanding loans. LLP is the ratio of loan loss provisions to total assets. NPL is the ratio of impaired
loans to gross loans. ΔGDP is change in gross domestic product. CAR is tier 1 regulatory capital.
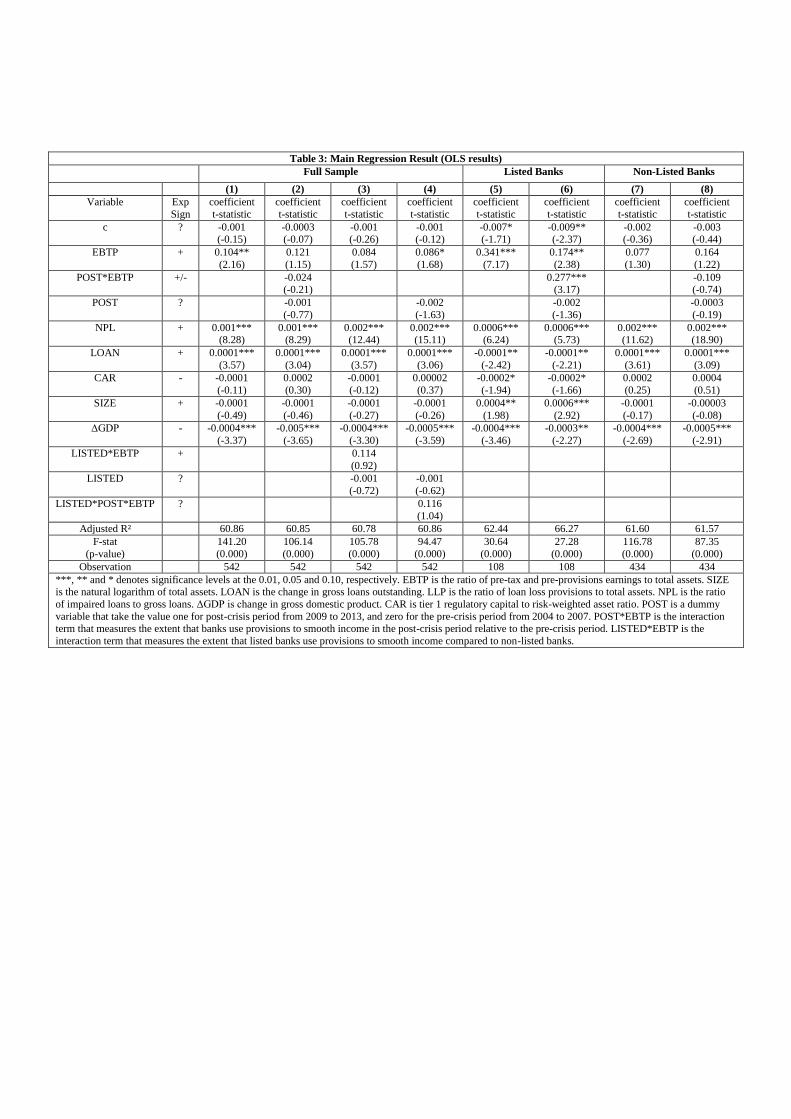
Table 3: Main Regression Result (OLS results)
Full Sample Listed Banks Non-Listed Banks
(1) (2) (3) (4) (5) (6) (7) (8)
Variable Exp
Sign
coefficient
t-statistic
coefficient
t-statistic
coefficient
t-statistic
coefficient
t-statistic
coefficient
t-statistic
coefficient
t-statistic
coefficient
t-statistic
coefficient
t-statistic
c ? -0.001 (-0.15)
-0.0003 (-0.07)
-0.001 (-0.26)
-0.001 (-0.12)
-0.007* (-1.71)
-0.009** (-2.37)
-0.002 (-0.36)
-0.003 (-0.44)
EBTP + 0.104**
(2.16)
0.121
(1.15)
0.084
(1.57)
0.086*
(1.68)
0.341***
(7.17)
0.174**
(2.38)
0.077
(1.30)
0.164
(1.22)
POST*EBTP +/- -0.024 (-0.21)
0.277*** (3.17)
-0.109 (-0.74)
POST ? -0.001
(-0.77)
-0.002
(-1.63)
-0.002
(-1.36)
-0.0003
(-0.19)
NPL + 0.001*** (8.28)
0.001*** (8.29)
0.002*** (12.44)
0.002*** (15.11)
0.0006*** (6.24)
0.0006*** (5.73)
0.002*** (11.62)
0.002*** (18.90)
LOAN + 0.0001***
(3.57)
0.0001***
(3.04)
0.0001***
(3.57)
0.0001***
(3.06)
-0.0001**
(-2.42)
-0.0001**
(-2.21)
0.0001***
(3.61)
0.0001***
(3.09)
CAR - -0.0001
(-0.11)
0.0002
(0.30)
-0.0001
(-0.12)
0.00002
(0.37)
-0.0002*
(-1.94)
-0.0002*
(-1.66)
0.0002
(0.25)
0.0004
(0.51)
SIZE + -0.0001
(-0.49)
-0.0001
(-0.46)
-0.0001
(-0.27)
-0.0001
(-0.26)
0.0004**
(1.98)
0.0006***
(2.92)
-0.0001
(-0.17)
-0.00003
(-0.08)
ΔGDP - -0.0004***
(-3.37)
-0.005***
(-3.65)
-0.0004***
(-3.30)
-0.0005***
(-3.59)
-0.0004***
(-3.46)
-0.0003**
(-2.27)
-0.0004***
(-2.69)
-0.0005***
(-2.91)
LISTED*EBTP + 0.114
(0.92)
LISTED ? -0.001
(-0.72)
-0.001
(-0.62)
LISTED*POST*EBTP ? 0.116
(1.04)
Adjusted R² 60.86 60.85 60.78 60.86 62.44 66.27 61.60 61.57
F-stat
(p-value)
141.20
(0.000)
106.14
(0.000)
105.78
(0.000)
94.47
(0.000)
30.64
(0.000)
27.28
(0.000)
116.78
(0.000)
87.35
(0.000)
Observation 542 542 542 542 108 108 434 434
***, ** and * denotes significance levels at the 0.01, 0.05 and 0.10, respectively. EBTP is the ratio of pre-tax and pre-provisions earnings to total assets. SIZE is the natural logarithm of total assets. LOAN is the change in gross loans outstanding. LLP is the ratio of loan loss provisions to total assets. NPL is the ratio
of impaired loans to gross loans. ΔGDP is change in gross domestic product. CAR is tier 1 regulatory capital to risk-weighted asset ratio. POST is a dummy
variable that take the value one for post-crisis period from 2009 to 2013, and zero for the pre-crisis period from 2004 to 2007. POST*EBTP is the interaction
term that measures the extent that banks use provisions to smooth income in the post-crisis period relative to the pre-crisis period. LISTED*EBTP is the
interaction term that measures the extent that listed banks use provisions to smooth income compared to non-listed banks.
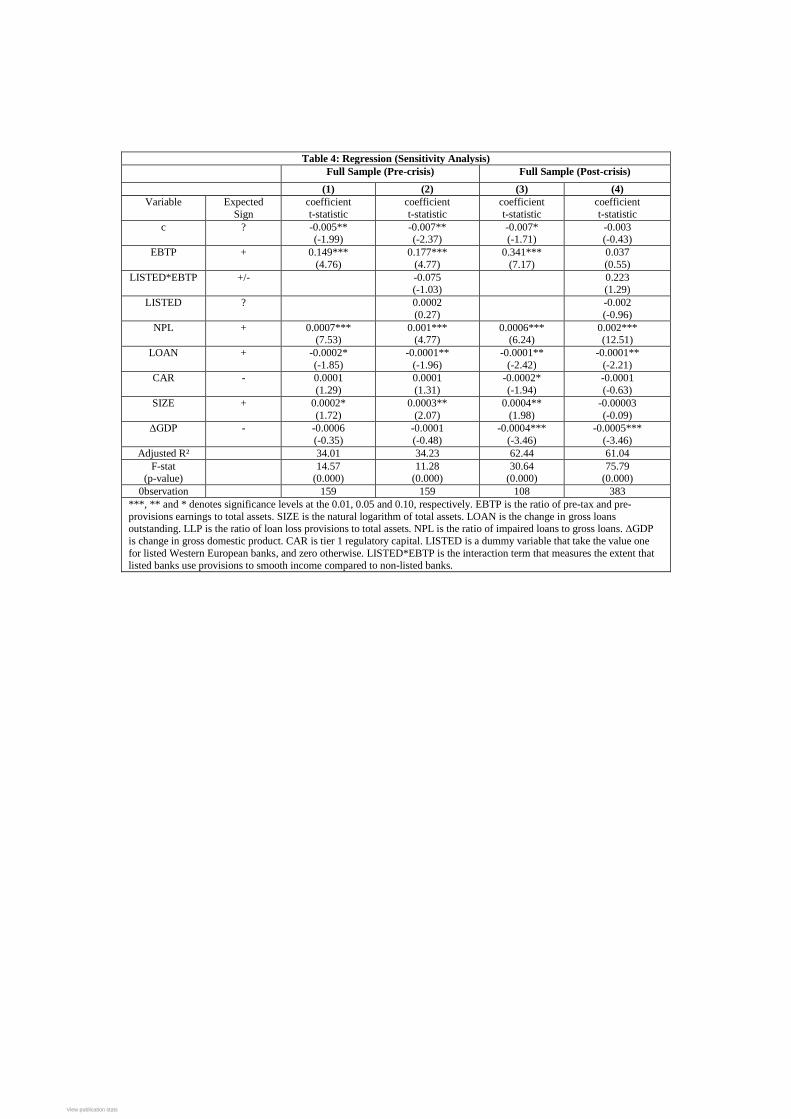
Table 4: Regression (Sensitivity Analysis)
Full Sample (Pre-crisis) Full Sample (Post-crisis)
(1) (2) (3) (4)
Variable Expected
Sign
coefficient
t-statistic
coefficient
t-statistic
coefficient
t-statistic
coefficient
t-statistic
c ? -0.005** (-1.99)
-0.007** (-2.37)
-0.007* (-1.71)
-0.003 (-0.43)
EBTP + 0.149***
(4.76)
0.177***
(4.77)
0.341***
(7.17)
0.037
(0.55)
LISTED*EBTP +/- -0.075 (-1.03)
0.223 (1.29)
LISTED ? 0.0002
(0.27)
-0.002
(-0.96)
NPL + 0.0007*** (7.53)
0.001*** (4.77)
0.0006*** (6.24)
0.002*** (12.51)
LOAN + -0.0002*
(-1.85)
-0.0001**
(-1.96)
-0.0001**
(-2.42)
-0.0001**
(-2.21)
CAR - 0.0001
(1.29)
0.0001
(1.31)
-0.0002*
(-1.94)
-0.0001
(-0.63)
SIZE + 0.0002*
(1.72)
0.0003**
(2.07)
0.0004**
(1.98)
-0.00003
(-0.09)
ΔGDP - -0.0006
(-0.35)
-0.0001
(-0.48)
-0.0004***
(-3.46)
-0.0005***
(-3.46)
Adjusted R² 34.01 34.23 62.44 61.04
F-stat (p-value)
14.57 (0.000)
11.28 (0.000)
30.64 (0.000)
75.79 (0.000)
0bservation 159 159 108 383
***, ** and * denotes significance levels at the 0.01, 0.05 and 0.10, respectively. EBTP is the ratio of pre-tax and pre-
provisions earnings to total assets. SIZE is the natural logarithm of total assets. LOAN is the change in gross loans outstanding. LLP is the ratio of loan loss provisions to total assets. NPL is the ratio of impaired loans to gross loans. ΔGDP
is change in gross domestic product. CAR is tier 1 regulatory capital. LISTED is a dummy variable that take the value one
for listed Western European banks, and zero otherwise. LISTED*EBTP is the interaction term that measures the extent that listed banks use provisions to smooth income compared to non-listed banks.
View publication statsView publication stats