Embed Size (px)
Citation preview
Discretionary consumer July 10, 2013
Paints
SECTOR UPDATE
Ambit Capital and / or its affiliates do and seek to do business including investment banking with companies covered in its research reports. As a result, investors should be aware that Ambit Capital may have a conflict of interest that could affect the objectivity of this report. Investors should not consider this report as the only factor in making their investment decision.
Please refer to the Disclaimers at the end of this Report.
Analyst contacts
Rakshit Ranjan, CFA [email protected] Tel: +91 22 3043 3201
Shariq Merchant [email protected] Tel: +91 22 3043 3246
ASIAN PAINTS BUY
CMP: `4,750
Target Price (12 months): `4,932
Previous TP: `4,932
Upside (%) 4%
EPS (FY14): `141.3
Change from previous (%) NA
Variance from consensus (%) 0
Stock Information
Mkt cap: `448bn/US$7.4bn
52-wk H/L: `5,050/3,432
3M ADV: `451mn/US$7.5mn
Stock Performance (%)
1M 3M 12M YTD
Absolute (0) (2) 23 5
Rel. to Sensex 0 (8) 12 5
BERGER PAINTS SELL
CMP: `235
Target Price (12 months): `204
Previous TP: `213
Downside (%) 15%
EPS (FY14): `7.2
Change from previous (%) -8
Variance from consensus (%) -5
Stock Information
Mkt cap: `82bn/US$1,357mn
52-wk H/L: `255/124
3M ADV: `63mn/US$1.1mn
Stock Performance (%)
1M 3M 12M YTD
Absolute 1 20 72 47
Rel. to Sensex 1 14 61 47
Source: Bloomberg, Ambit Capital research
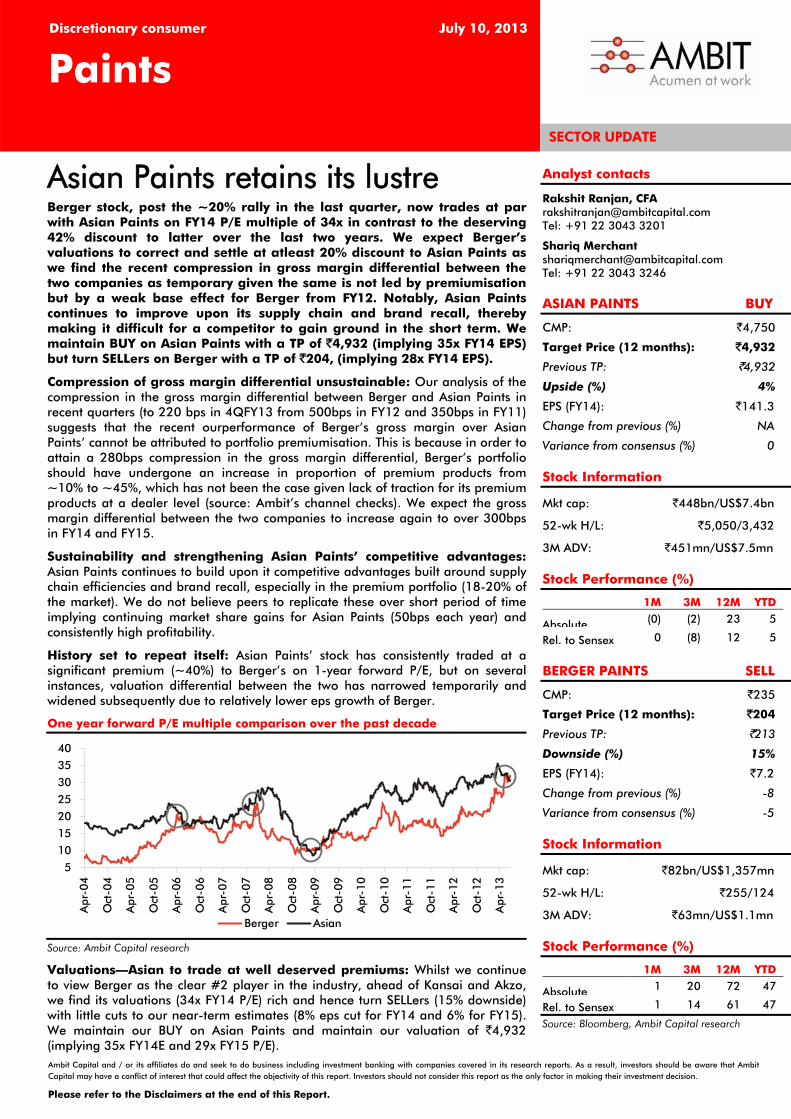
Asian Paints retains its lustre Berger stock, post the ~20% rally in the last quarter, now trades at par with Asian Paints on FY14 P/E multiple of 34x in contrast to the deserving 42% discount to latter over the last two years. We expect Berger’s valuations to correct and settle at atleast 20% discount to Asian Paints as we find the recent compression in gross margin differential between the two companies as temporary given the same is not led by premiumisation but by a weak base effect for Berger from FY12. Notably, Asian Paints continues to improve upon its supply chain and brand recall, thereby making it difficult for a competitor to gain ground in the short term. We maintain BUY on Asian Paints with a TP of `4,932 (implying 35x FY14 EPS) but turn SELLers on Berger with a TP of `204, (implying 28x FY14 EPS).
Compression of gross margin differential unsustainable: Our analysis of the compression in the gross margin differential between Berger and Asian Paints in recent quarters (to 220 bps in 4QFY13 from 500bps in FY12 and 350bps in FY11) suggests that the recent ourperformance of Berger’s gross margin over Asian Paints’ cannot be attributed to portfolio premiumisation. This is because in order to attain a 280bps compression in the gross margin differential, Berger’s portfolio should have undergone an increase in proportion of premium products from ~10% to ~45%, which has not been the case given lack of traction for its premium products at a dealer level (source: Ambit’s channel checks). We expect the gross margin differential between the two companies to increase again to over 300bps in FY14 and FY15.
Sustainability and strengthening Asian Paints’ competitive advantages: Asian Paints continues to build upon it competitive advantages built around supply chain efficiencies and brand recall, especially in the premium portfolio (18-20% of the market). We do not believe peers to replicate these over short period of time implying continuing market share gains for Asian Paints (50bps each year) and consistently high profitability.
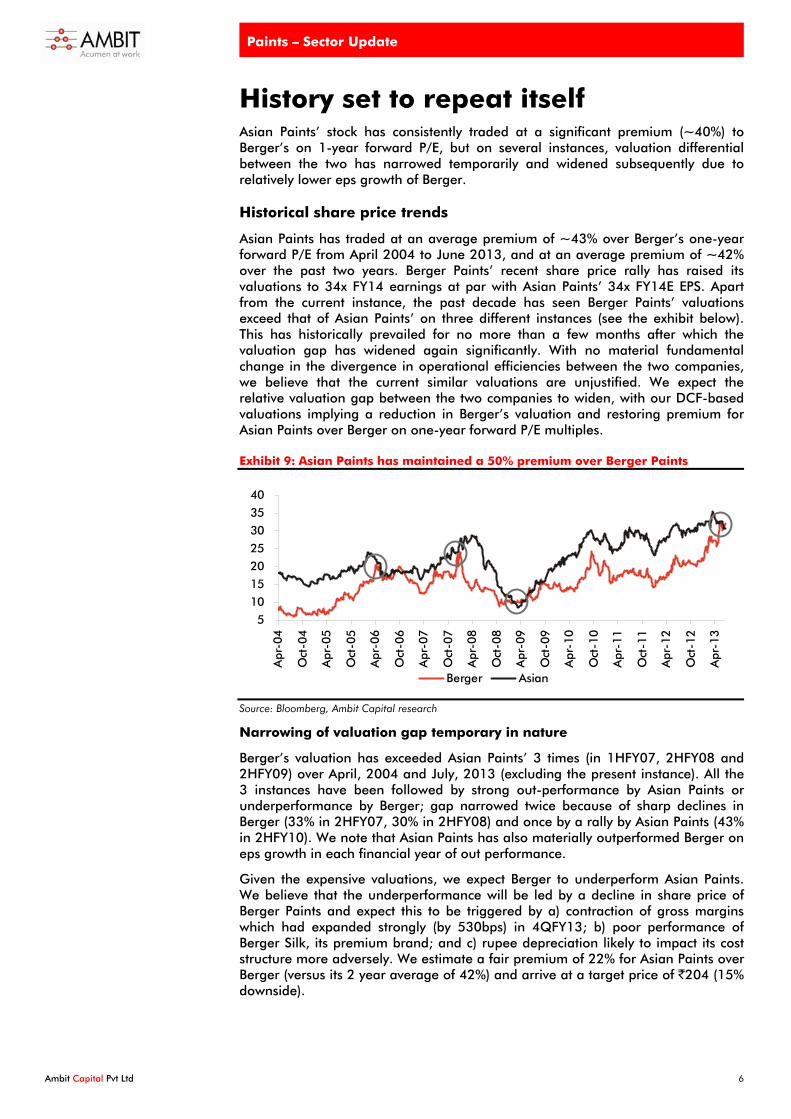
History set to repeat itself: Asian Paints’ stock has consistently traded at a significant premium (~40%) to Berger’s on 1-year forward P/E, but on several instances, valuation differential between the two has narrowed temporarily and widened subsequently due to relatively lower eps growth of Berger.
One year forward P/E multiple comparison over the past decade
5
10
15
20
25
30
35
40
Apr
-04
Oct
-04
Apr
-05
Oct
-05
Apr
-06
Oct
-06
Apr
-07
Oct
-07
Apr
-08
Oct
-08
Apr
-09
Oct
-09
Apr
-10
Oct
-10
Apr
-11
Oct
-11
Apr
-12
Oct
-12
Apr
-13
Berger Asian
Source: Ambit Capital research
Valuations—Asian to trade at well deserved premiums: Whilst we continue to view Berger as the clear #2 player in the industry, ahead of Kansai and Akzo, we find its valuations (34x FY14 P/E) rich and hence turn SELLers (15% downside) with little cuts to our near-term estimates (8% eps cut for FY14 and 6% for FY15). We maintain our BUY on Asian Paints and maintain our valuation of `4,932 (implying 35x FY14E and 29x FY15 P/E).
Paints – Sector Update
Ambit Capital Pvt Ltd 2
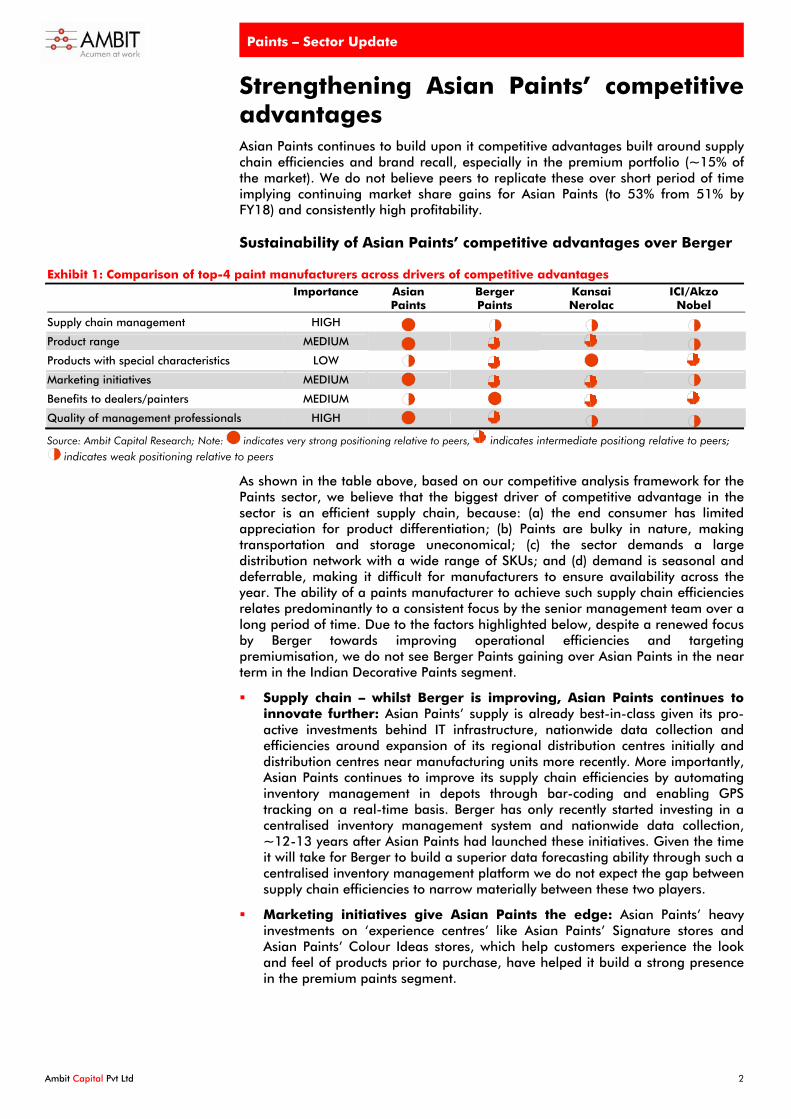
Strengthening Asian Paints’ competitive advantages Asian Paints continues to build upon it competitive advantages built around supply chain efficiencies and brand recall, especially in the premium portfolio (~15% of the market). We do not believe peers to replicate these over short period of time implying continuing market share gains for Asian Paints (to 53% from 51% by FY18) and consistently high profitability. Sustainability of Asian Paints’ competitive advantages over Berger
Exhibit 1: Comparison of top-4 paint manufacturers across drivers of competitive advantages
Importance Asian Paints
Berger Paints
Kansai Nerolac
ICI/Akzo Nobel
Supply chain management HIGH Product range MEDIUM Products with special characteristics LOW Marketing initiatives MEDIUM Benefits to dealers/painters MEDIUM Quality of management professionals HIGH Source: Ambit Capital Research; Note: indicates very strong positioning relative to peers, indicates intermediate positiong relative to peers;
indicates weak positioning relative to peers
As shown in the table above, based on our competitive analysis framework for the Paints sector, we believe that the biggest driver of competitive advantage in the sector is an efficient supply chain, because: (a) the end consumer has limited appreciation for product differentiation; (b) Paints are bulky in nature, making transportation and storage uneconomical; (c) the sector demands a large distribution network with a wide range of SKUs; and (d) demand is seasonal and deferrable, making it difficult for manufacturers to ensure availability across the year. The ability of a paints manufacturer to achieve such supply chain efficiencies relates predominantly to a consistent focus by the senior management team over a long period of time. Due to the factors highlighted below, despite a renewed focus by Berger towards improving operational efficiencies and targeting premiumisation, we do not see Berger Paints gaining over Asian Paints in the near term in the Indian Decorative Paints segment.
Supply chain – whilst Berger is improving, Asian Paints continues to innovate further: Asian Paints’ supply is already best-in-class given its pro-active investments behind IT infrastructure, nationwide data collection and efficiencies around expansion of its regional distribution centres initially and distribution centres near manufacturing units more recently. More importantly, Asian Paints continues to improve its supply chain efficiencies by automating inventory management in depots through bar-coding and enabling GPS tracking on a real-time basis. Berger has only recently started investing in a centralised inventory management system and nationwide data collection, ~12-13 years after Asian Paints had launched these initiatives. Given the time it will take for Berger to build a superior data forecasting ability through such a centralised inventory management platform we do not expect the gap between supply chain efficiencies to narrow materially between these two players.
Marketing initiatives give Asian Paints the edge: Asian Paints’ heavy investments on ‘experience centres’ like Asian Paints’ Signature stores and Asian Paints’ Colour Ideas stores, which help customers experience the look and feel of products prior to purchase, have helped it build a strong presence in the premium paints segment.
Paints – Sector Update
Ambit Capital Pvt Ltd 3
Quality of management professionals: Whilst most paint manufacturers
focus on quality of top management recruits, Asian Paints is reputed to be the only player in the industry which also focuses on recruiting high-quality professionals from the top B-schools of India for junior and mid-level managerial roles, which gives Asian Paints a substantial long-term competitive advantage which it has proven through its execution capabilities and superior supply chain.
Berger’s recent strides towards investing behind brand-building and supply chain initiatives are a step in the right direction. However, given the nature of these competitive advantages and hence the number of years it takes to build them, we do not expect Berger’s recent initiatives to help it substantially narrow the competitiveness gap against Asian Paints over the short term.
Paints – Sector Update
Ambit Capital Pvt Ltd 4
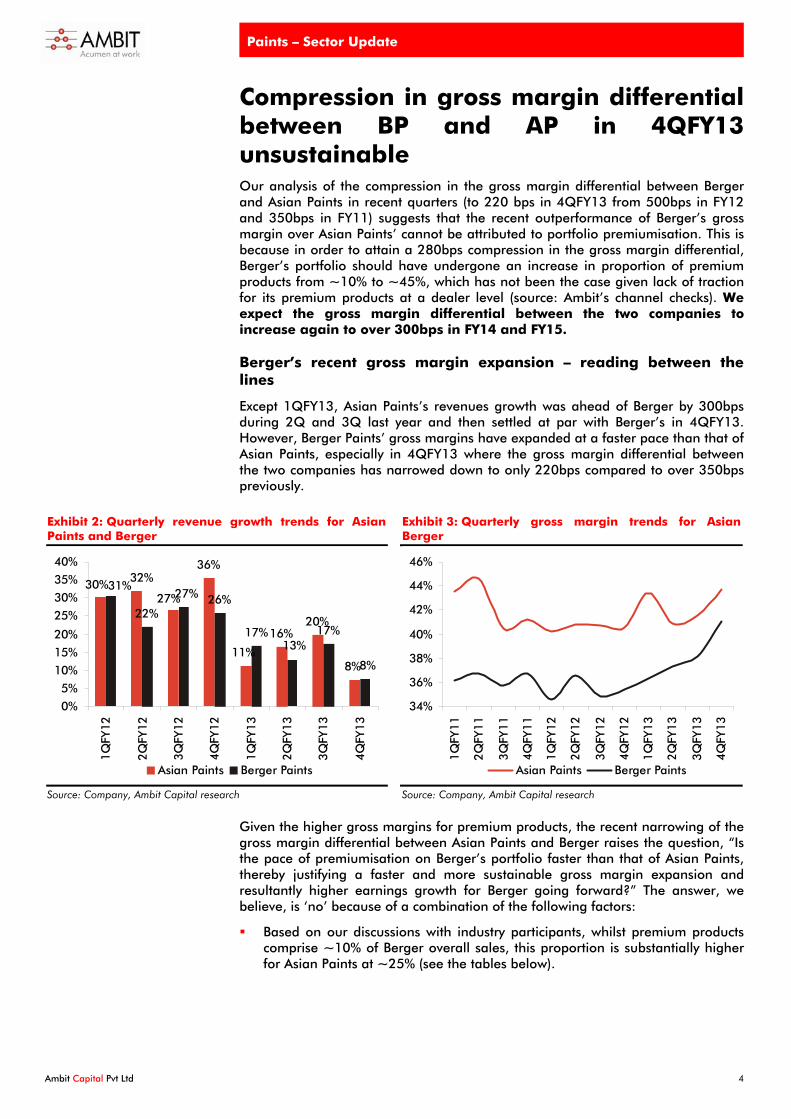
Compression in gross margin differential between BP and AP in 4QFY13 unsustainable Our analysis of the compression in the gross margin differential between Berger and Asian Paints in recent quarters (to 220 bps in 4QFY13 from 500bps in FY12 and 350bps in FY11) suggests that the recent outperformance of Berger’s gross margin over Asian Paints’ cannot be attributed to portfolio premiumisation. This is because in order to attain a 280bps compression in the gross margin differential, Berger’s portfolio should have undergone an increase in proportion of premium products from ~10% to ~45%, which has not been the case given lack of traction for its premium products at a dealer level (source: Ambit’s channel checks). We expect the gross margin differential between the two companies to increase again to over 300bps in FY14 and FY15.
Berger’s recent gross margin expansion – reading between the lines
Except 1QFY13, Asian Paints’s revenues growth was ahead of Berger by 300bps during 2Q and 3Q last year and then settled at par with Berger’s in 4QFY13. However, Berger Paints’ gross margins have expanded at a faster pace than that of Asian Paints, especially in 4QFY13 where the gross margin differential between the two companies has narrowed down to only 220bps compared to over 350bps previously.
Exhibit 2: Quarterly revenue growth trends for Asian Paints and Berger
36%
16%20%
22%26%
17% 17%
32%30%
8%11%
27%31%
8%
27%
13%
0%
5%
10%
15%
20%
25%
30%
35%
40%
1QFY
12
2QFY
12
3QFY
12
4QFY
12
1QFY
13
2QFY
13
3QFY
13
4QFY
13
Asian Paints Berger Paints
Source: Company, Ambit Capital research
Exhibit 3: Quarterly gross margin trends for Asian Berger
34%
36%
38%
40%
42%
44%
46%
1QFY
11
2QFY
11
3QFY
11
4QFY
11
1QFY
12
2QFY
12
3QFY
12
4QFY
12
1QFY
13
2QFY
13
3QFY
13
4QFY
13
Asian Paints Berger Paints
Source: Company, Ambit Capital research
Given the higher gross margins for premium products, the recent narrowing of the gross margin differential between Asian Paints and Berger raises the question, “Is the pace of premiumisation on Berger’s portfolio faster than that of Asian Paints, thereby justifying a faster and more sustainable gross margin expansion and resultantly higher earnings growth for Berger going forward?” The answer, we believe, is ‘no’ because of a combination of the following factors:
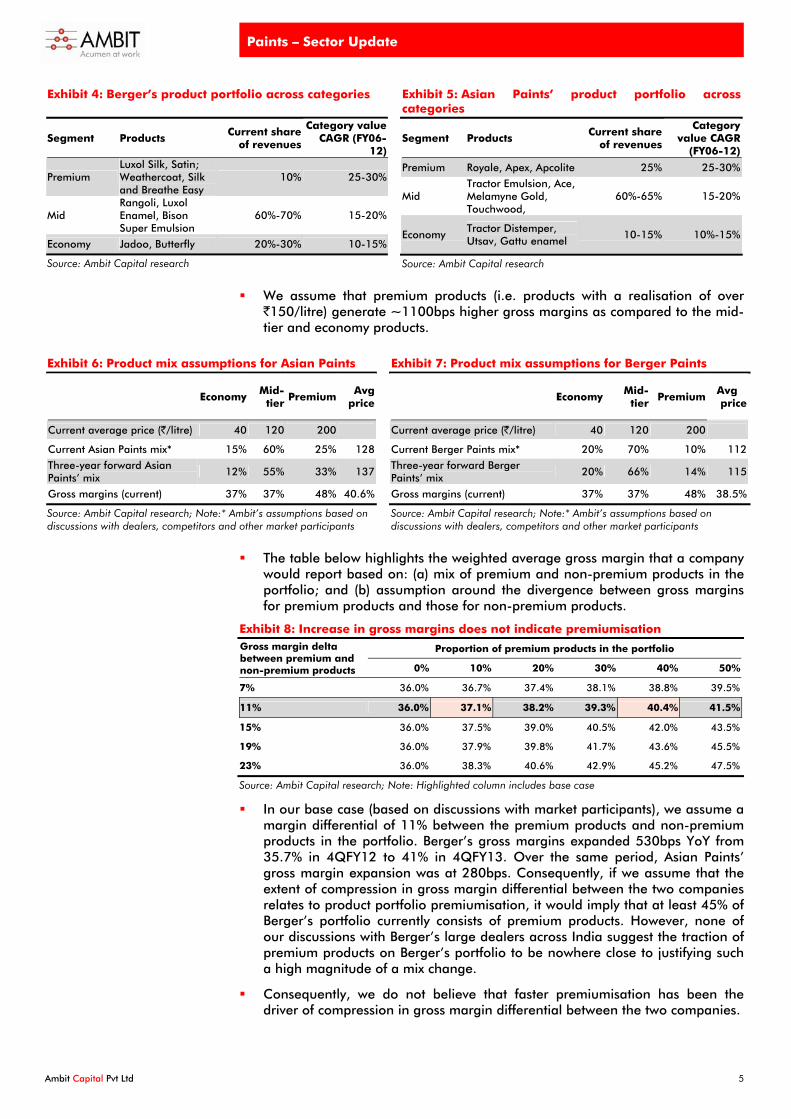
Based on our discussions with industry participants, whilst premium products comprise ~10% of Berger overall sales, this proportion is substantially higher for Asian Paints at ~25% (see the tables below).
Paints – Sector Update
Ambit Capital Pvt Ltd 5
Exhibit 4: Berger’s product portfolio across categories
Segment Products Current share
of revenues
Category value CAGR (FY06-
12)
Premium Luxol Silk, Satin; Weathercoat, Silk and Breathe Easy
10% 25-30%
Mid Rangoli, Luxol Enamel, Bison Super Emulsion
60%-70% 15-20%
Economy Jadoo, Butterfly 20%-30% 10-15%
Source: Ambit Capital research
Exhibit 5: Asian Paints’ product portfolio across categories
Segment Products Current share
of revenues
Category value CAGR
(FY06-12)
Premium Royale, Apex, Apcolite 25% 25-30%
Mid Tractor Emulsion, Ace, Melamyne Gold, Touchwood,
60%-65% 15-20%
Economy Tractor Distemper, Utsav, Gattu enamel
10-15% 10%-15%
Source: Ambit Capital research
We assume that premium products (i.e. products with a realisation of over `150/litre) generate ~1100bps higher gross margins as compared to the mid-tier and economy products.
Exhibit 6: Product mix assumptions for Asian Paints
Economy Mid-
tier Premium
Avg price
Current average price (`/litre) 40 120 200
Current Asian Paints mix* 15% 60% 25% 128
Three-year forward Asian Paints’ mix 12% 55% 33% 137
Gross margins (current) 37% 37% 48% 40.6%
Source: Ambit Capital research; Note:* Ambit’s assumptions based on discussions with dealers, competitors and other market participants
Exhibit 7: Product mix assumptions for Berger Paints
Economy Mid-
tier Premium
Avg price
Current average price (`/litre) 40 120 200
Current Berger Paints mix* 20% 70% 10% 112
Three-year forward Berger Paints’ mix 20% 66% 14% 115
Gross margins (current) 37% 37% 48% 38.5%
Source: Ambit Capital research; Note:* Ambit’s assumptions based on discussions with dealers, competitors and other market participants
The table below highlights the weighted average gross margin that a company would report based on: (a) mix of premium and non-premium products in the portfolio; and (b) assumption around the divergence between gross margins for premium products and those for non-premium products.
Exhibit 8: Increase in gross margins does not indicate premiumisation
Proportion of premium products in the portfolio Gross margin delta between premium and non-premium products 0% 10% 20% 30% 40% 50%
7% 36.0% 36.7% 37.4% 38.1% 38.8% 39.5%
11% 36.0% 37.1% 38.2% 39.3% 40.4% 41.5%
15% 36.0% 37.5% 39.0% 40.5% 42.0% 43.5%
19% 36.0% 37.9% 39.8% 41.7% 43.6% 45.5%
23% 36.0% 38.3% 40.6% 42.9% 45.2% 47.5%
Source: Ambit Capital research; Note: Highlighted column includes base case
In our base case (based on discussions with market participants), we assume a margin differential of 11% between the premium products and non-premium products in the portfolio. Berger’s gross margins expanded 530bps YoY from 35.7% in 4QFY12 to 41% in 4QFY13. Over the same period, Asian Paints’ gross margin expansion was at 280bps. Consequently, if we assume that the extent of compression in gross margin differential between the two companies relates to product portfolio premiumisation, it would imply that at least 45% of Berger’s portfolio currently consists of premium products. However, none of our discussions with Berger’s large dealers across India suggest the traction of premium products on Berger’s portfolio to be nowhere close to justifying such a high magnitude of a mix change.
Consequently, we do not believe that faster premiumisation has been the driver of compression in gross margin differential between the two companies.
Paints – Sector Update
Ambit Capital Pvt Ltd 6
History set to repeat itself Asian Paints’ stock has consistently traded at a significant premium (~40%) to Berger’s on 1-year forward P/E, but on several instances, valuation differential between the two has narrowed temporarily and widened subsequently due to relatively lower eps growth of Berger. Historical share price trends
Asian Paints has traded at an average premium of ~43% over Berger’s one-year forward P/E from April 2004 to June 2013, and at an average premium of ~42% over the past two years. Berger Paints’ recent share price rally has raised its valuations to 34x FY14 earnings at par with Asian Paints’ 34x FY14E EPS. Apart from the current instance, the past decade has seen Berger Paints’ valuations exceed that of Asian Paints’ on three different instances (see the exhibit below). This has historically prevailed for no more than a few months after which the valuation gap has widened again significantly. With no material fundamental change in the divergence in operational efficiencies between the two companies, we believe that the current similar valuations are unjustified. We expect the relative valuation gap between the two companies to widen, with our DCF-based valuations implying a reduction in Berger’s valuation and restoring premium for Asian Paints over Berger on one-year forward P/E multiples.
Exhibit 9: Asian Paints has maintained a 50% premium over Berger Paints
5
10
15
20
25
30
35
40
Apr
-04
Oct
-04
Apr
-05
Oct
-05
Apr
-06
Oct
-06
Apr
-07
Oct
-07
Apr
-08
Oct
-08
Apr
-09
Oct
-09
Apr
-10
Oct
-10
Apr
-11
Oct
-11
Apr
-12
Oct
-12
Apr
-13
Berger Asian
Source: Bloomberg, Ambit Capital research
Narrowing of valuation gap temporary in nature
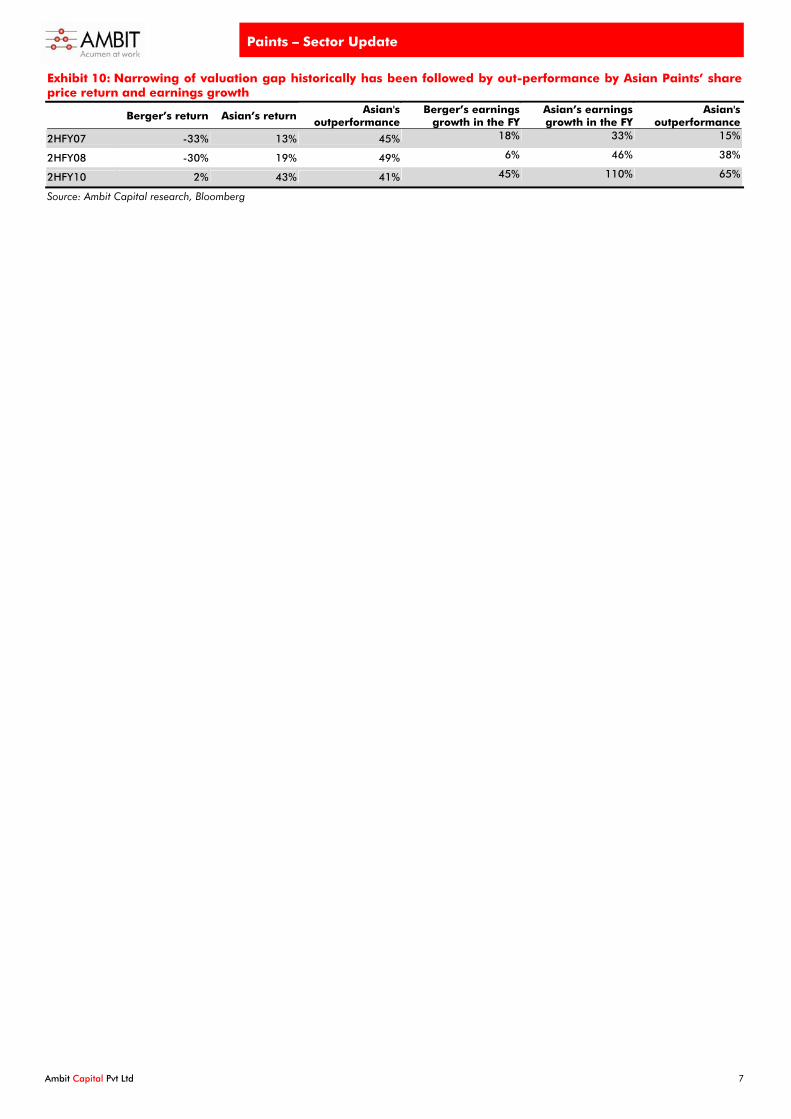
Berger’s valuation has exceeded Asian Paints’ 3 times (in 1HFY07, 2HFY08 and 2HFY09) over April, 2004 and July, 2013 (excluding the present instance). All the 3 instances have been followed by strong out-performance by Asian Paints or underperformance by Berger; gap narrowed twice because of sharp declines in Berger (33% in 2HFY07, 30% in 2HFY08) and once by a rally by Asian Paints (43% in 2HFY10). We note that Asian Paints has also materially outperformed Berger on eps growth in each financial year of out performance.
Given the expensive valuations, we expect Berger to underperform Asian Paints. We believe that the underperformance will be led by a decline in share price of Berger Paints and expect this to be triggered by a) contraction of gross margins which had expanded strongly (by 530bps) in 4QFY13; b) poor performance of Berger Silk, its premium brand; and c) rupee depreciation likely to impact its cost structure more adversely. We estimate a fair premium of 22% for Asian Paints over Berger (versus its 2 year average of 42%) and arrive at a target price of `204 (15% downside).
Paints – Sector Update
Ambit Capital Pvt Ltd 7
Exhibit 10: Narrowing of valuation gap historically has been followed by out-performance by Asian Paints’ share price return and earnings growth
Berger’s return Asian’s return Asian's
outperformance Berger’s earnings
growth in the FY Asian’s earnings growth in the FY
Asian's outperformance
2HFY07 -33% 13% 45% 18% 33% 15%
2HFY08 -30% 19% 49% 6% 46% 38%
2HFY10 2% 43% 41% 45% 110% 65%
Source: Ambit Capital research, Bloomberg
Paints – Sector Update
Ambit Capital Pvt Ltd 8
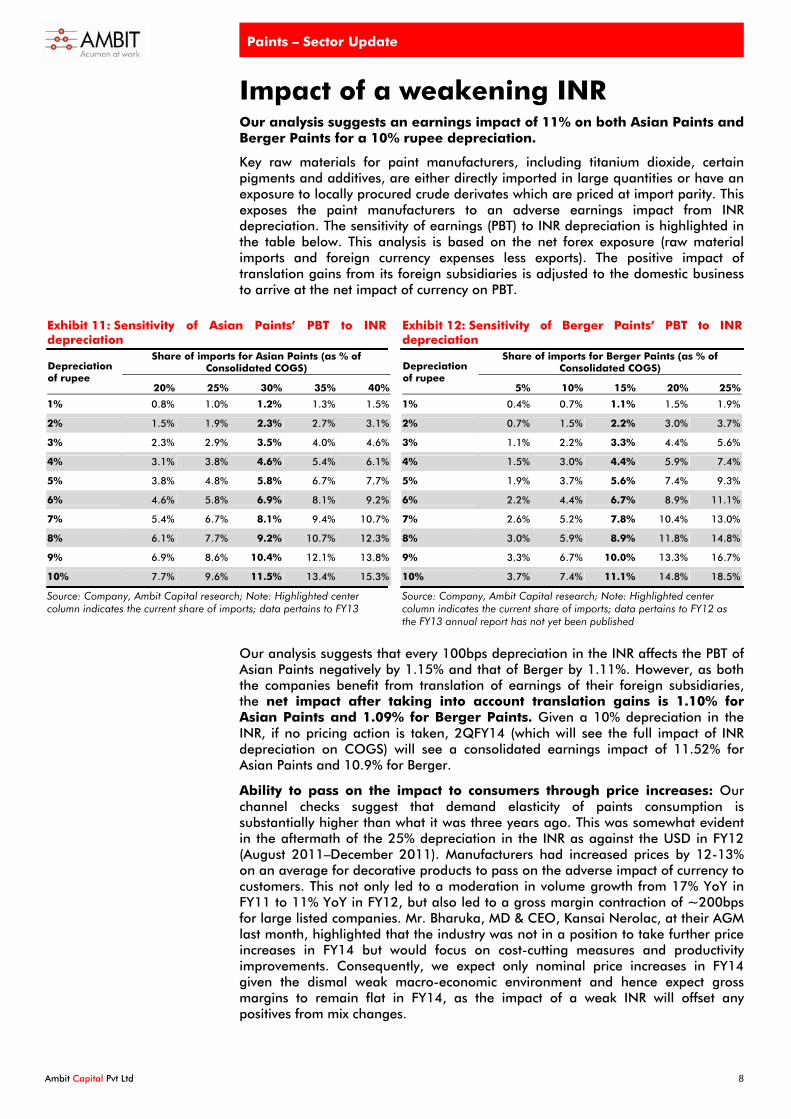
Impact of a weakening INR Our analysis suggests an earnings impact of 11% on both Asian Paints and Berger Paints for a 10% rupee depreciation.
Key raw materials for paint manufacturers, including titanium dioxide, certain pigments and additives, are either directly imported in large quantities or have an exposure to locally procured crude derivates which are priced at import parity. This exposes the paint manufacturers to an adverse earnings impact from INR depreciation. The sensitivity of earnings (PBT) to INR depreciation is highlighted in the table below. This analysis is based on the net forex exposure (raw material imports and foreign currency expenses less exports). The positive impact of translation gains from its foreign subsidiaries is adjusted to the domestic business to arrive at the net impact of currency on PBT.
Exhibit 11: Sensitivity of Asian Paints’ PBT to INR depreciation
Share of imports for Asian Paints (as % of Consolidated COGS) Depreciation
of rupee 20% 25% 30% 35% 40%
1% 0.8% 1.0% 1.2% 1.3% 1.5%
2% 1.5% 1.9% 2.3% 2.7% 3.1%
3% 2.3% 2.9% 3.5% 4.0% 4.6%
4% 3.1% 3.8% 4.6% 5.4% 6.1%
5% 3.8% 4.8% 5.8% 6.7% 7.7%
6% 4.6% 5.8% 6.9% 8.1% 9.2%
7% 5.4% 6.7% 8.1% 9.4% 10.7%
8% 6.1% 7.7% 9.2% 10.7% 12.3%
9% 6.9% 8.6% 10.4% 12.1% 13.8%
10% 7.7% 9.6% 11.5% 13.4% 15.3%
Source: Company, Ambit Capital research; Note: Highlighted center column indicates the current share of imports; data pertains to FY13
Exhibit 12: Sensitivity of Berger Paints’ PBT to INR depreciation
Share of imports for Berger Paints (as % of Consolidated COGS) Depreciation
of rupee 5% 10% 15% 20% 25%
1% 0.4% 0.7% 1.1% 1.5% 1.9%
2% 0.7% 1.5% 2.2% 3.0% 3.7%
3% 1.1% 2.2% 3.3% 4.4% 5.6%
4% 1.5% 3.0% 4.4% 5.9% 7.4%
5% 1.9% 3.7% 5.6% 7.4% 9.3%
6% 2.2% 4.4% 6.7% 8.9% 11.1%
7% 2.6% 5.2% 7.8% 10.4% 13.0%
8% 3.0% 5.9% 8.9% 11.8% 14.8%
9% 3.3% 6.7% 10.0% 13.3% 16.7%
10% 3.7% 7.4% 11.1% 14.8% 18.5%
Source: Company, Ambit Capital research; Note: Highlighted center column indicates the current share of imports; data pertains to FY12 as the FY13 annual report has not yet been published
Our analysis suggests that every 100bps depreciation in the INR affects the PBT of Asian Paints negatively by 1.15% and that of Berger by 1.11%. However, as both the companies benefit from translation of earnings of their foreign subsidiaries, the net impact after taking into account translation gains is 1.10% for Asian Paints and 1.09% for Berger Paints. Given a 10% depreciation in the INR, if no pricing action is taken, 2QFY14 (which will see the full impact of INR depreciation on COGS) will see a consolidated earnings impact of 11.52% for Asian Paints and 10.9% for Berger.
Ability to pass on the impact to consumers through price increases: Our channel checks suggest that demand elasticity of paints consumption is substantially higher than what it was three years ago. This was somewhat evident in the aftermath of the 25% depreciation in the INR as against the USD in FY12 (August 2011–December 2011). Manufacturers had increased prices by 12-13% on an average for decorative products to pass on the adverse impact of currency to customers. This not only led to a moderation in volume growth from 17% YoY in FY11 to 11% YoY in FY12, but also led to a gross margin contraction of ~200bps for large listed companies. Mr. Bharuka, MD & CEO, Kansai Nerolac, at their AGM last month, highlighted that the industry was not in a position to take further price increases in FY14 but would focus on cost-cutting measures and productivity improvements. Consequently, we expect only nominal price increases in FY14 given the dismal weak macro-economic environment and hence expect gross margins to remain flat in FY14, as the impact of a weak INR will offset any positives from mix changes.
Paints – Sector Update
Ambit Capital Pvt Ltd 9
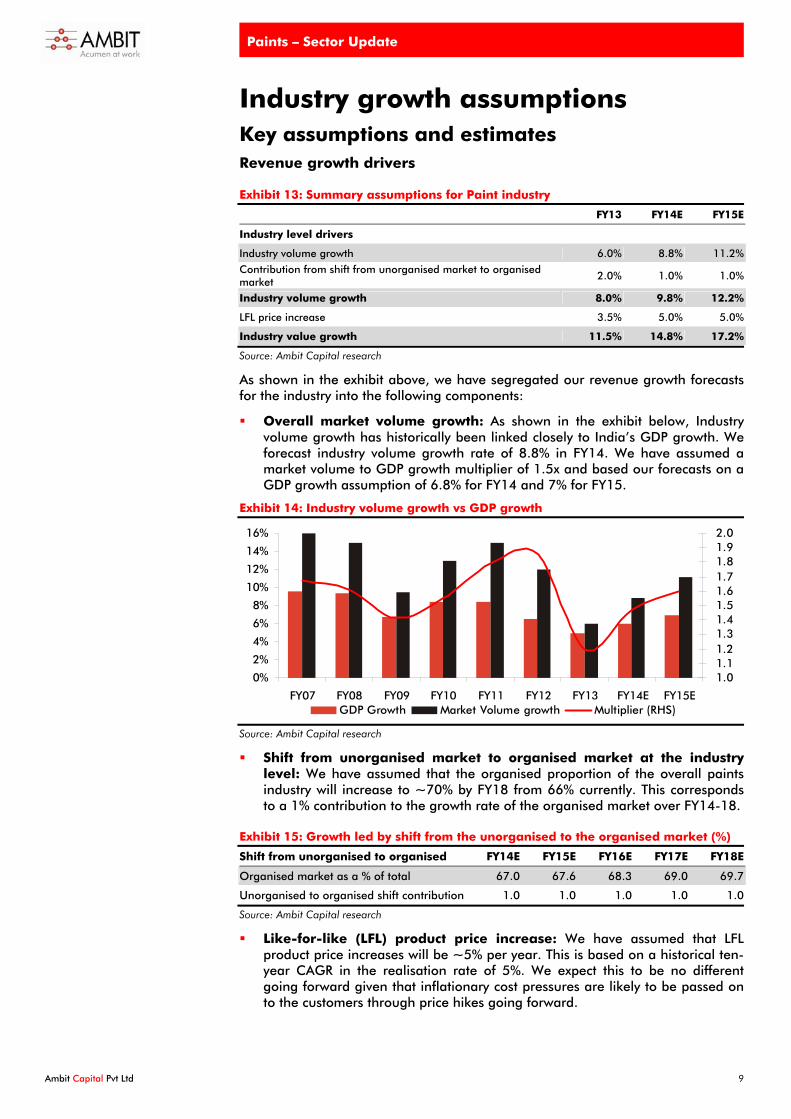
Industry growth assumptions Key assumptions and estimates Revenue growth drivers
Exhibit 13: Summary assumptions for Paint industry
FY13 FY14E FY15E
Industry level drivers
Industry volume growth 6.0% 8.8% 11.2%
Contribution from shift from unorganised market to organised market
2.0% 1.0% 1.0%
Industry volume growth 8.0% 9.8% 12.2%
LFL price increase 3.5% 5.0% 5.0%
Industry value growth 11.5% 14.8% 17.2%
Source: Ambit Capital research
As shown in the exhibit above, we have segregated our revenue growth forecasts for the industry into the following components:
Overall market volume growth: As shown in the exhibit below, Industry volume growth has historically been linked closely to India’s GDP growth. We forecast industry volume growth rate of 8.8% in FY14. We have assumed a market volume to GDP growth multiplier of 1.5x and based our forecasts on a GDP growth assumption of 6.8% for FY14 and 7% for FY15.
Exhibit 14: Industry volume growth vs GDP growth
0%
2%
4%
6%
8%
10%
12%
14%
16%
FY07 FY08 FY09 FY10 FY11 FY12 FY13 FY14E FY15E
1.01.11.21.31.41.51.61.71.81.92.0
GDP Growth Market Volume growth Multiplier (RHS)
Source: Ambit Capital research
Shift from unorganised market to organised market at the industry level: We have assumed that the organised proportion of the overall paints industry will increase to ~70% by FY18 from 66% currently. This corresponds to a 1% contribution to the growth rate of the organised market over FY14-18.
Exhibit 15: Growth led by shift from the unorganised to the organised market (%)
Shift from unorganised to organised FY14E FY15E FY16E FY17E FY18E
Organised market as a % of total 67.0 67.6 68.3 69.0 69.7
Unorganised to organised shift contribution 1.0 1.0 1.0 1.0 1.0
Source: Ambit Capital research
Like-for-like (LFL) product price increase: We have assumed that LFL product price increases will be ~5% per year. This is based on a historical ten-year CAGR in the realisation rate of 5%. We expect this to be no different going forward given that inflationary cost pressures are likely to be passed on to the customers through price hikes going forward.
Paints July 10, 2013
Berger Paints Bloomberg: BRGR IN EQUITY Reuters: BRGR.NS
Accounting: AMBER Predictability: GREEN Earnings momentum: GREEN
Ambit Capital and / or its affiliates do and seek to do business including investment banking with companies covered in its research reports. As a result, investors should be aware that Ambit Capital may have a conflict of interest that could affect the objectivity of this report. Investors should not consider this report as the only factor in making their investment decision.
Please refer to the Disclaimers at the end of this Report.
SELL
Key financials
Year to March FY11 FY12 FY13E FY14E FY15E
Operating income (` mn) 23,281 29,477 33,464 39,079 46,346 EBITDA (` mn) 2,373 3,035 3,712 4,425 5,341 EBITDA margin (%) 10.2% 10.3% 11.1% 11.3% 11.5% EPS (`) 4.3 5.2 6.3 7.2 9.0 RoE (%) 23.3% 24.3% 25.0% 24.1% 25.7% RoCE (%) 18.0% 19.1% 18.6% 17.8% 19.7% P/E (x) 55.6 46.3 38.2 33.5 26.9
Source: Company, Ambit Capital research
CHANGE IN STANCE
Rakshit Ranjan, CFA [email protected] Tel: +91 22 3043 3201
Shariq Merchant [email protected] Tel: +91 22 3043 3246
Recommendation
CMP: `241
Target Price (12 months): `204
Previous TP: `213
Downside (%) 15
EPS (FY14): `7.2 Change from previous (%) -8%
Variance from consensus (%) -5%
Stock Information
Mkt cap: `82bn/US$1,357mn
52-wk H/L: `255/124
3M ADV: `63mn/US$1.1mn
Beta: 0.9
BSE Sensex: 19,324
Nifty: 5,811
Stock Performance (%)
1M 3M 12M YTD
Absolute 1 20 72 47
Rel. to Sensex 1 14 61 47
1 year fwd P/E bandchart
10
40
70
100
130
160
190
220
250
Apr
-08
Sep-
08
Mar
-09
Sep-
09
Mar
-10
Sep-
10
Mar
-11
Sep-
11
Mar
-12
Sep-
12
Mar
-13
12x
17x
22x
30x
27x
Source: Bloomberg, Ambit Capital research
Not so premium Berger Paints’ current multiples are 18% higher than the peer group average for FY14. Whilst we believe that the premium to Kansai Nerolac and Akzo Nobel is justified, we believe that its at-par valuation to Asian Paints is unjustified given: (a) Berger lacks the competitive advantages that Asian Paints’ has built around supply chain management and superior brand equity through a consistent focus from the senior management on execution of its strategy over several decades; and (b) lower market share gains and slower margin expansion over next five years despite a rising mix of premium products. We reduce our estimates marginally and our valuation by 4% and turn SELLers on Berger Paints with a target price of `204.
Competitive position: MODERATE Changes to this position: STABLE
Compression of gross margin differential unsustainable: Our analysis of the compression in the gross margin differential between Berger and Asian Paints in recent quarters (to 220 bps in 4QFY13 from 500bps in FY12 and 350bps in FY11) suggests that the recent ourperformance of Berger’s gross margin over Asian Paints’ cannot be attributed to portfolio premiumisation. This is because in order to attain a 280bps compression in the gross margin differential, Berger’s portfolio should have undergone an increase in proportion of premium products from ~10% to ~45%, which has not been the case given lack of traction for its premium products at a dealer level (source: Ambit’s channel checks). We expect the gross margin differential between the two companies to increase again to over 300bps in FY14 and FY15.
Supply chain still playing catch up: While Asian Paints continues to invest in building further efficiencies in its supply chain (by automating inventory in depots through bar-coding and enabling GPS tracking of trucks on a real-time basis), Berger has only recently started investing in initiatives such as centralised inventory management, ~12-13 years after Asian Paints had launched such initiatives. Given the time it will take for Berger to build a superior data forecasting ability and given the continued investments by Asian Paints targeting futher efficiencies, we do not expect the gap between supply chain efficiencies to narrow materially between these two players.
Valuation and revision in estimates: Given the poor macro environment, we downgrade our revenue forecasts by 4% for FY14 and 5% for FY15, EBITDA forecasts by 7% for FY14 and FY15 and EPS forecasts by 7% for FY14 to `7.2 and 6% for FY15 to `9.0. We stand 2% ahead of consensus on the topline and 4% below on the bottomline for FY14 as we factor in lower gross margins and higher depreciation on account of the newly commissioned Hindupur plant. Our DCF-based approach values Berger Paints at `204 (implying 13% downside, 28x FY14E and 23x FY15E P/E). Berger currently trades at 34x FY14E and 27x FY15E earnings. We turn SELLers on Berger Paints.
Paints – Sector Update
Ambit Capital Pvt Ltd 11
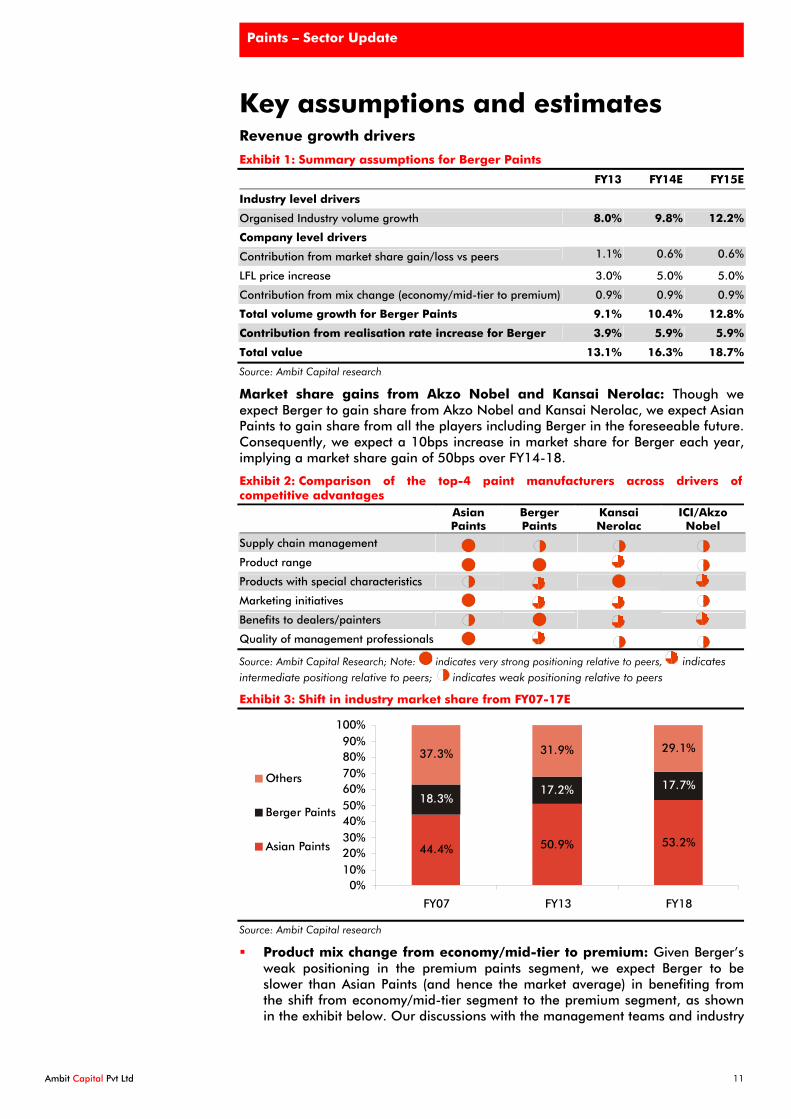
Key assumptions and estimates Revenue growth drivers
Exhibit 1: Summary assumptions for Berger Paints
FY13 FY14E FY15E
Industry level drivers
Organised Industry volume growth 8.0% 9.8% 12.2%
Company level drivers
Contribution from market share gain/loss vs peers 1.1% 0.6% 0.6% LFL price increase 3.0% 5.0% 5.0%
Contribution from mix change (economy/mid-tier to premium) 0.9% 0.9% 0.9%
Total volume growth for Berger Paints 9.1% 10.4% 12.8%
Contribution from realisation rate increase for Berger 3.9% 5.9% 5.9%
Total value 13.1% 16.3% 18.7%
Source: Ambit Capital research
Market share gains from Akzo Nobel and Kansai Nerolac: Though we expect Berger to gain share from Akzo Nobel and Kansai Nerolac, we expect Asian Paints to gain share from all the players including Berger in the foreseeable future. Consequently, we expect a 10bps increase in market share for Berger each year, implying a market share gain of 50bps over FY14-18.
Exhibit 2: Comparison of the top-4 paint manufacturers across drivers of competitive advantages
Asian Paints
Berger Paints
Kansai Nerolac
ICI/Akzo Nobel
Supply chain management Product range Products with special characteristics Marketing initiatives Benefits to dealers/painters Quality of management professionals Source: Ambit Capital Research; Note: indicates very strong positioning relative to peers, indicates intermediate positiong relative to peers; indicates weak positioning relative to peers
Exhibit 3: Shift in industry market share from FY07-17E
44.4% 50.9% 53.2%
18.3%17.2% 17.7%
37.3% 31.9% 29.1%
0%10%20%30%40%50%60%70%80%90%
100%
FY07 FY13 FY18
Others
Berger Paints
Asian Paints
Source: Ambit Capital research
Product mix change from economy/mid-tier to premium: Given Berger’s weak positioning in the premium paints segment, we expect Berger to be slower than Asian Paints (and hence the market average) in benefiting from the shift from economy/mid-tier segment to the premium segment, as shown in the exhibit below. Our discussions with the management teams and industry
Paints – Sector Update
Ambit Capital Pvt Ltd 12
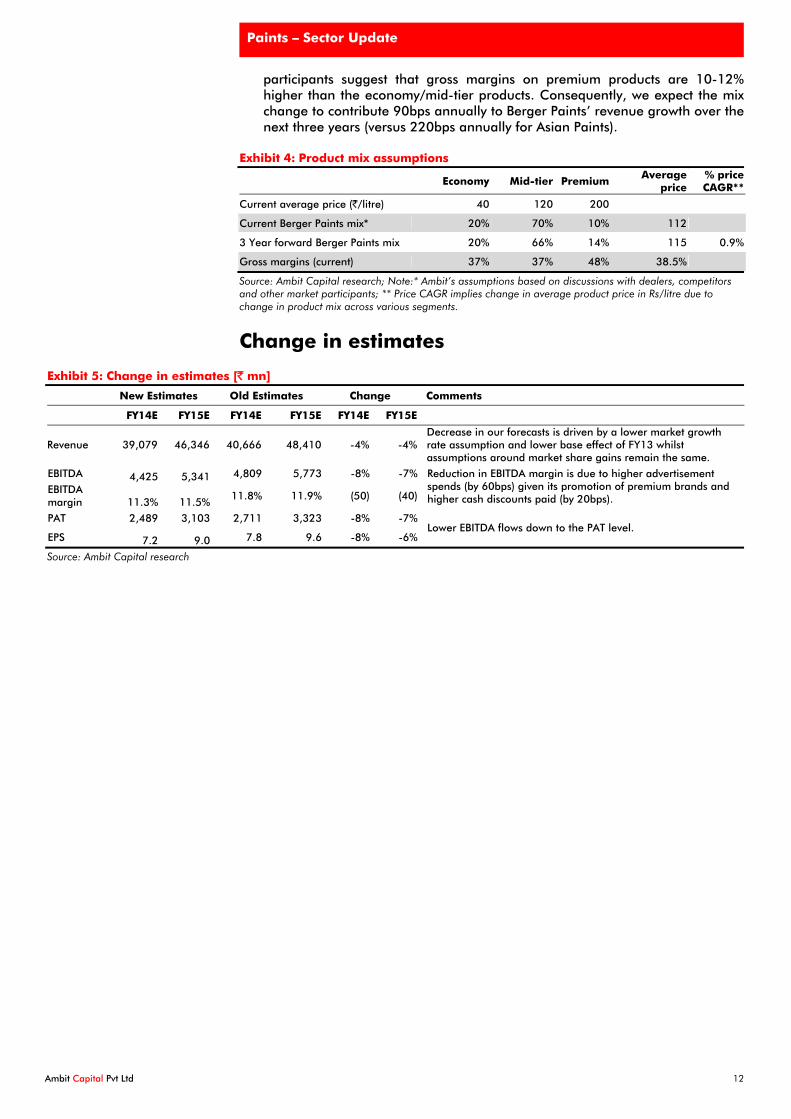
participants suggest that gross margins on premium products are 10-12% higher than the economy/mid-tier products. Consequently, we expect the mix change to contribute 90bps annually to Berger Paints’ revenue growth over the next three years (versus 220bps annually for Asian Paints).
Exhibit 4: Product mix assumptions
Economy Mid-tier Premium Average
price % price CAGR**
Current average price (`/litre) 40 120 200
Current Berger Paints mix* 20% 70% 10% 112
3 Year forward Berger Paints mix 20% 66% 14% 115 0.9%
Gross margins (current) 37% 37% 48% 38.5%
Source: Ambit Capital research; Note:* Ambit’s assumptions based on discussions with dealers, competitors and other market participants; ** Price CAGR implies change in average product price in Rs/litre due to change in product mix across various segments.
Change in estimates
Exhibit 5: Change in estimates [` mn]
New Estimates Old Estimates Change Comments
FY14E FY15E FY14E FY15E FY14E FY15E
Revenue 39,079 46,346 40,666 48,410 -4% -4% Decrease in our forecasts is driven by a lower market growth rate assumption and lower base effect of FY13 whilst assumptions around market share gains remain the same.
EBITDA 4,425 5,341 4,809 5,773 -8% -7%
EBITDA margin 11.3% 11.5%
11.8% 11.9% (50) (40)
Reduction in EBITDA margin is due to higher advertisement spends (by 60bps) given its promotion of premium brands and higher cash discounts paid (by 20bps).
PAT 2,489 3,103 2,711 3,323 -8% -7%
EPS 7.2 9.0 7.8 9.6 -8% -6% Lower EBITDA flows down to the PAT level.
Source: Ambit Capital research
Paints – Sector Update
Ambit Capital Pvt Ltd 13
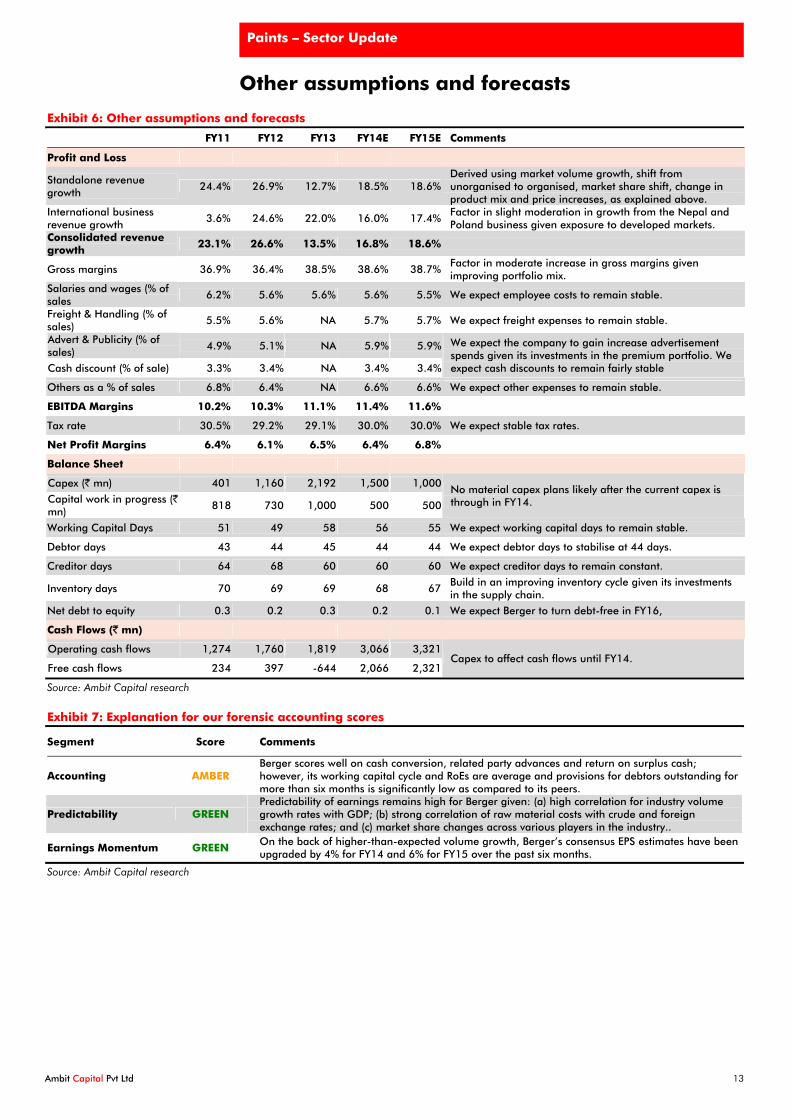
Other assumptions and forecasts
Exhibit 6: Other assumptions and forecasts
FY11 FY12 FY13 FY14E FY15E Comments
Profit and Loss
Standalone revenue growth
24.4% 26.9% 12.7% 18.5% 18.6% Derived using market volume growth, shift from unorganised to organised, market share shift, change in product mix and price increases, as explained above.
International business revenue growth
3.6% 24.6% 22.0% 16.0% 17.4% Factor in slight moderation in growth from the Nepal and Poland business given exposure to developed markets.
Consolidated revenue growth
23.1% 26.6% 13.5% 16.8% 18.6%
Gross margins 36.9% 36.4% 38.5% 38.6% 38.7% Factor in moderate increase in gross margins given improving portfolio mix.
Salaries and wages (% of sales
6.2% 5.6% 5.6% 5.6% 5.5% We expect employee costs to remain stable.
Freight & Handling (% of sales) 5.5% 5.6% NA 5.7% 5.7% We expect freight expenses to remain stable.
Advert & Publicity (% of sales)
4.9% 5.1% NA 5.9% 5.9%
Cash discount (% of sale) 3.3% 3.4% NA 3.4% 3.4%
We expect the company to gain increase advertisement spends given its investments in the premium portfolio. We expect cash discounts to remain fairly stable
Others as a % of sales 6.8% 6.4% NA 6.6% 6.6% We expect other expenses to remain stable.
EBITDA Margins 10.2% 10.3% 11.1% 11.4% 11.6%
Tax rate 30.5% 29.2% 29.1% 30.0% 30.0% We expect stable tax rates.
Net Profit Margins 6.4% 6.1% 6.5% 6.4% 6.8%
Balance Sheet
Capex (` mn) 401 1,160 2,192 1,500 1,000
Capital work in progress (` mn)
818 730 1,000 500 500
No material capex plans likely after the current capex is through in FY14.
Working Capital Days 51 49 58 56 55 We expect working capital days to remain stable.
Debtor days 43 44 45 44 44 We expect debtor days to stabilise at 44 days.
Creditor days 64 68 60 60 60 We expect creditor days to remain constant.
Inventory days 70 69 69 68 67 Build in an improving inventory cycle given its investments in the supply chain.
Net debt to equity 0.3 0.2 0.3 0.2 0.1 We expect Berger to turn debt-free in FY16,
Cash Flows (` mn)
Operating cash flows 1,274 1,760 1,819 3,066 3,321
Free cash flows 234 397 -644 2,066 2,321 Capex to affect cash flows until FY14.
Source: Ambit Capital research
Exhibit 7: Explanation for our forensic accounting scores
Segment Score Comments
Accounting AMBER Berger scores well on cash conversion, related party advances and return on surplus cash; however, its working capital cycle and RoEs are average and provisions for debtors outstanding for more than six months is significantly low as compared to its peers.
Predictability GREEN Predictability of earnings remains high for Berger given: (a) high correlation for industry volume growth rates with GDP; (b) strong correlation of raw material costs with crude and foreign exchange rates; and (c) market share changes across various players in the industry..
Earnings Momentum GREEN On the back of higher-than-expected volume growth, Berger’s consensus EPS estimates have been upgraded by 4% for FY14 and 6% for FY15 over the past six months.
Source: Ambit Capital research
Paints – Sector Update
Ambit Capital Pvt Ltd 14
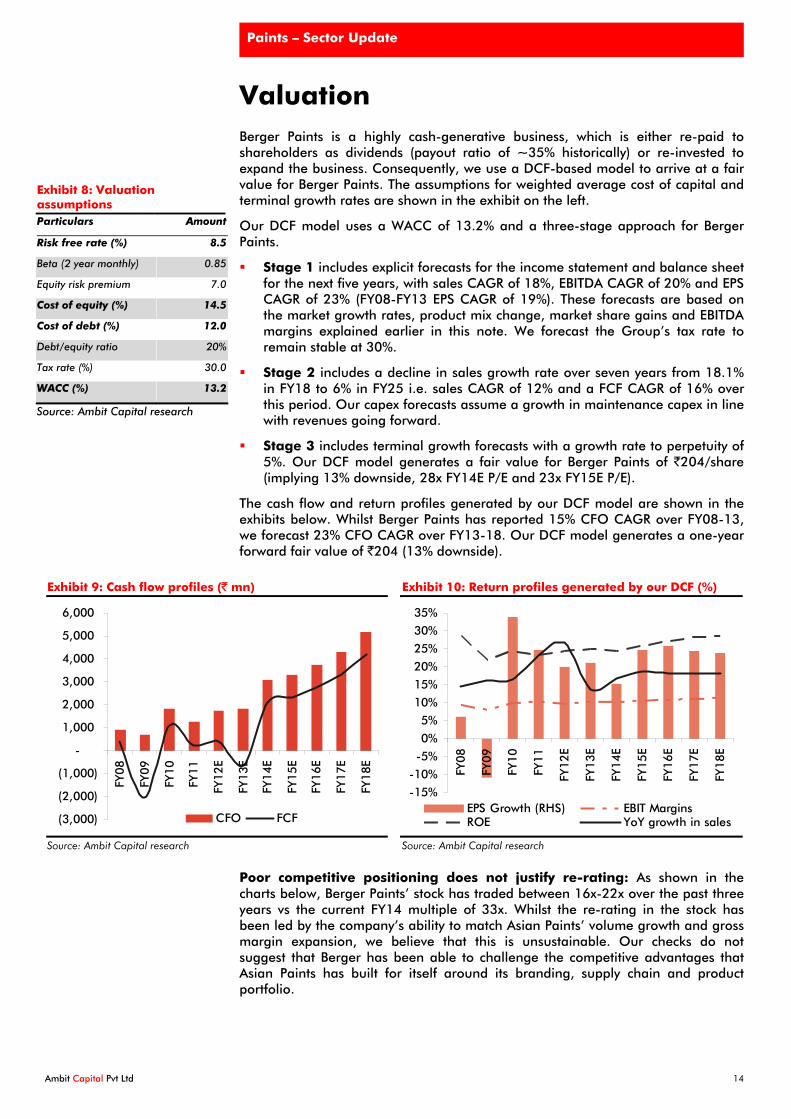
Valuation Berger Paints is a highly cash-generative business, which is either re-paid to shareholders as dividends (payout ratio of ~35% historically) or re-invested to expand the business. Consequently, we use a DCF-based model to arrive at a fair value for Berger Paints. The assumptions for weighted average cost of capital and terminal growth rates are shown in the exhibit on the left.
Our DCF model uses a WACC of 13.2% and a three-stage approach for Berger Paints.
Stage 1 includes explicit forecasts for the income statement and balance sheet for the next five years, with sales CAGR of 18%, EBITDA CAGR of 20% and EPS CAGR of 23% (FY08-FY13 EPS CAGR of 19%). These forecasts are based on the market growth rates, product mix change, market share gains and EBITDA margins explained earlier in this note. We forecast the Group’s tax rate to remain stable at 30%.
Stage 2 includes a decline in sales growth rate over seven years from 18.1% in FY18 to 6% in FY25 i.e. sales CAGR of 12% and a FCF CAGR of 16% over this period. Our capex forecasts assume a growth in maintenance capex in line with revenues going forward.
Stage 3 includes terminal growth forecasts with a growth rate to perpetuity of 5%. Our DCF model generates a fair value for Berger Paints of `204/share (implying 13% downside, 28x FY14E P/E and 23x FY15E P/E).
The cash flow and return profiles generated by our DCF model are shown in the exhibits below. Whilst Berger Paints has reported 15% CFO CAGR over FY08-13, we forecast 23% CFO CAGR over FY13-18. Our DCF model generates a one-year forward fair value of `204 (13% downside).
Exhibit 9: Cash flow profiles (` mn)
(3,000)
(2,000)
(1,000)
-
1,000
2,000
3,000
4,000
5,000
6,000
FY08
FY09
FY10
FY11
FY12
E
FY13
E
FY14
E
FY15
E
FY16
E
FY17
E
FY18
E
CFO FCF
Source: Ambit Capital research
Exhibit 10: Return profiles generated by our DCF (%)
-15%
-10%
-5%
0%
5%
10%
15%
20%
25%
30%
35%
FY08
FY09
FY10
FY11
FY12
E
FY13
E
FY14
E
FY15
E
FY16
E
FY17
E
FY18
E
EPS Growth (RHS) EBIT MarginsROE YoY growth in sales
Source: Ambit Capital research
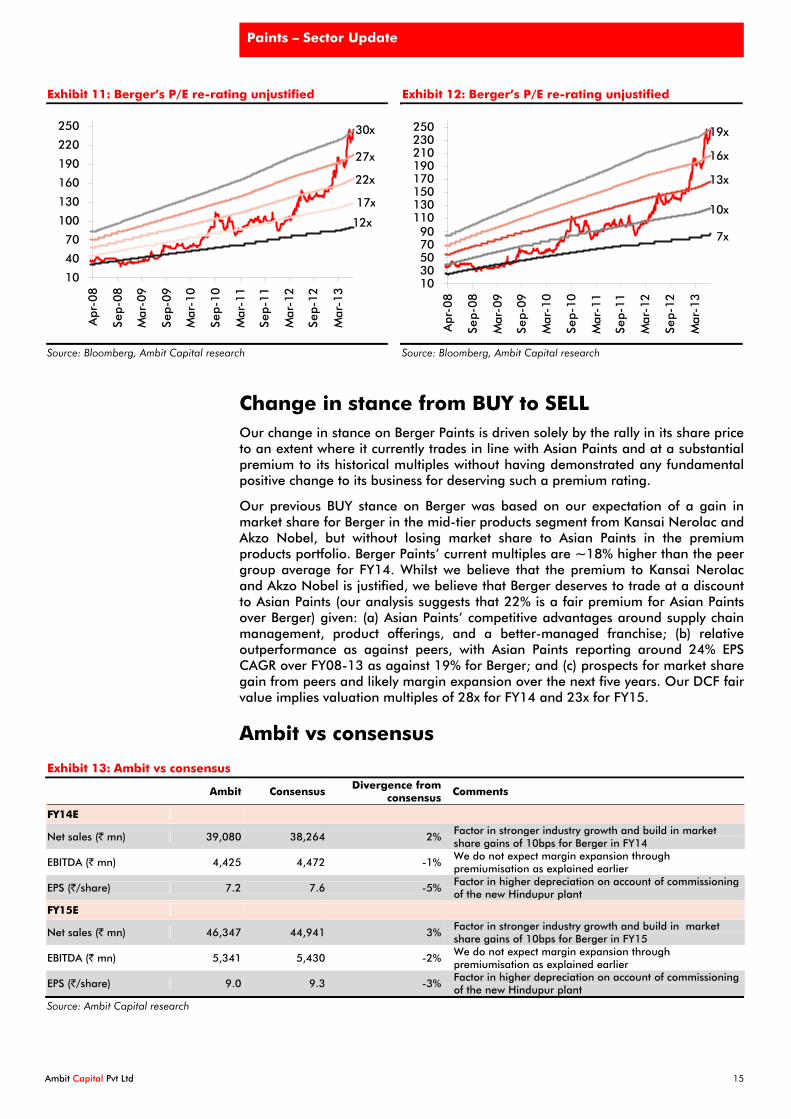
Poor competitive positioning does not justify re-rating: As shown in the charts below, Berger Paints’ stock has traded between 16x-22x over the past three years vs the current FY14 multiple of 33x. Whilst the re-rating in the stock has been led by the company’s ability to match Asian Paints’ volume growth and gross margin expansion, we believe that this is unsustainable. Our checks do not suggest that Berger has been able to challenge the competitive advantages that Asian Paints has built for itself around its branding, supply chain and product portfolio.
Exhibit 8: Valuation assumptions Particulars Amount
Risk free rate (%) 8.5
Beta (2 year monthly) 0.85
Equity risk premium 7.0
Cost of equity (%) 14.5
Cost of debt (%) 12.0
Debt/equity ratio 20%
Tax rate (%) 30.0
WACC (%) 13.2
Source: Ambit Capital research
Paints – Sector Update
Ambit Capital Pvt Ltd 15
Exhibit 11: Berger’s P/E re-rating unjustified
10
40
70
100
130
160
190
220
250
Apr
-08
Sep-
08
Mar
-09
Sep-
09
Mar
-10
Sep-
10
Mar
-11
Sep-
11
Mar
-12
Sep-
12
Mar
-13
12x
17x
22x
30x
27x
Source: Bloomberg, Ambit Capital research
Exhibit 12: Berger’s P/E re-rating unjustified
1030507090
110130150170190210230250
Apr
-08
Sep-
08
Mar
-09
Sep-
09
Mar
-10
Sep-
10
Mar
-11
Sep-
11
Mar
-12
Sep-
12
Mar
-13
7x
10x
13x
19x
16x
Source: Bloomberg, Ambit Capital research
Change in stance from BUY to SELL Our change in stance on Berger Paints is driven solely by the rally in its share price to an extent where it currently trades in line with Asian Paints and at a substantial premium to its historical multiples without having demonstrated any fundamental positive change to its business for deserving such a premium rating.
Our previous BUY stance on Berger was based on our expectation of a gain in market share for Berger in the mid-tier products segment from Kansai Nerolac and Akzo Nobel, but without losing market share to Asian Paints in the premium products portfolio. Berger Paints’ current multiples are ~18% higher than the peer group average for FY14. Whilst we believe that the premium to Kansai Nerolac and Akzo Nobel is justified, we believe that Berger deserves to trade at a discount to Asian Paints (our analysis suggests that 22% is a fair premium for Asian Paints over Berger) given: (a) Asian Paints’ competitive advantages around supply chain management, product offerings, and a better-managed franchise; (b) relative outperformance as against peers, with Asian Paints reporting around 24% EPS CAGR over FY08-13 as against 19% for Berger; and (c) prospects for market share gain from peers and likely margin expansion over the next five years. Our DCF fair value implies valuation multiples of 28x for FY14 and 23x for FY15.
Ambit vs consensus
Exhibit 13: Ambit vs consensus
Ambit Consensus Divergence from
consensus Comments
FY14E
Net sales (` mn) 39,080 38,264 2% Factor in stronger industry growth and build in market share gains of 10bps for Berger in FY14
EBITDA (` mn) 4,425 4,472 -1% We do not expect margin expansion through premiumisation as explained earlier
EPS (`/share) 7.2 7.6 -5% Factor in higher depreciation on account of commissioning of the new Hindupur plant
FY15E
Net sales (` mn) 46,347 44,941 3% Factor in stronger industry growth and build in market share gains of 10bps for Berger in FY15
EBITDA (` mn) 5,341 5,430 -2% We do not expect margin expansion through premiumisation as explained earlier
EPS (`/share) 9.0 9.3 -3% Factor in higher depreciation on account of commissioning of the new Hindupur plant
Source: Ambit Capital research
Paints – Sector Update
Ambit Capital Pvt Ltd 16
Key catalysts Decline in gross margins from the strong margin expansion reported in
4QFY13 (41%) due to a combination of (a) its premium portfolio not gaining traction as strongly as that of its largest peer, Asian Paints; and (b) sharp depreciation of the INR, impacting raw material prices.
Poor performance of premium brands like Berger Silk in light of strong competition from Asian Paints’ premium portfolio.
Risks to our SELL stance We see the following key risks to our SELL stance on Berger Paints:
Strong off take in the premium Berger Silk portfolio and larger than expected success in the new construction chemicals business.
Sharp decrease in input costs due to either INR appreciation or commodity price correction.
Paints – Sector Update
Ambit Capital Pvt Ltd 17
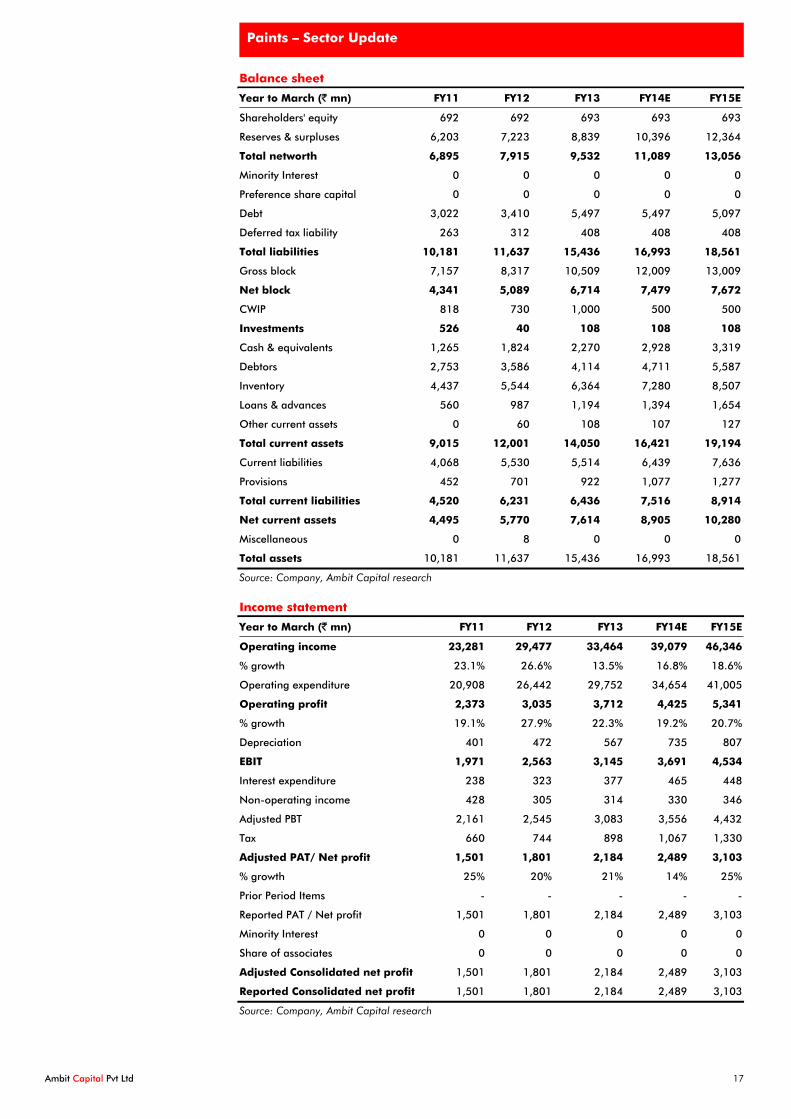
Balance sheet
Year to March (` mn) FY11 FY12 FY13 FY14E FY15E
Shareholders' equity 692 692 693 693 693
Reserves & surpluses 6,203 7,223 8,839 10,396 12,364
Total networth 6,895 7,915 9,532 11,089 13,056
Minority Interest 0 0 0 0 0
Preference share capital 0 0 0 0 0
Debt 3,022 3,410 5,497 5,497 5,097
Deferred tax liability 263 312 408 408 408
Total liabilities 10,181 11,637 15,436 16,993 18,561
Gross block 7,157 8,317 10,509 12,009 13,009
Net block 4,341 5,089 6,714 7,479 7,672
CWIP 818 730 1,000 500 500
Investments 526 40 108 108 108
Cash & equivalents 1,265 1,824 2,270 2,928 3,319
Debtors 2,753 3,586 4,114 4,711 5,587
Inventory 4,437 5,544 6,364 7,280 8,507
Loans & advances 560 987 1,194 1,394 1,654
Other current assets 0 60 108 107 127
Total current assets 9,015 12,001 14,050 16,421 19,194
Current liabilities 4,068 5,530 5,514 6,439 7,636
Provisions 452 701 922 1,077 1,277
Total current liabilities 4,520 6,231 6,436 7,516 8,914
Net current assets 4,495 5,770 7,614 8,905 10,280
Miscellaneous 0 8 0 0 0
Total assets 10,181 11,637 15,436 16,993 18,561
Source: Company, Ambit Capital research
Income statement
Year to March (` mn) FY11 FY12 FY13 FY14E FY15E
Operating income 23,281 29,477 33,464 39,079 46,346
% growth 23.1% 26.6% 13.5% 16.8% 18.6%
Operating expenditure 20,908 26,442 29,752 34,654 41,005
Operating profit 2,373 3,035 3,712 4,425 5,341
% growth 19.1% 27.9% 22.3% 19.2% 20.7%
Depreciation 401 472 567 735 807
EBIT 1,971 2,563 3,145 3,691 4,534
Interest expenditure 238 323 377 465 448
Non-operating income 428 305 314 330 346
Adjusted PBT 2,161 2,545 3,083 3,556 4,432
Tax 660 744 898 1,067 1,330
Adjusted PAT/ Net profit 1,501 1,801 2,184 2,489 3,103
% growth 25% 20% 21% 14% 25%
Prior Period Items - - - - -
Reported PAT / Net profit 1,501 1,801 2,184 2,489 3,103
Minority Interest 0 0 0 0 0
Share of associates 0 0 0 0 0
Adjusted Consolidated net profit 1,501 1,801 2,184 2,489 3,103
Reported Consolidated net profit 1,501 1,801 2,184 2,489 3,103
Source: Company, Ambit Capital research
Paints – Sector Update
Ambit Capital Pvt Ltd 18
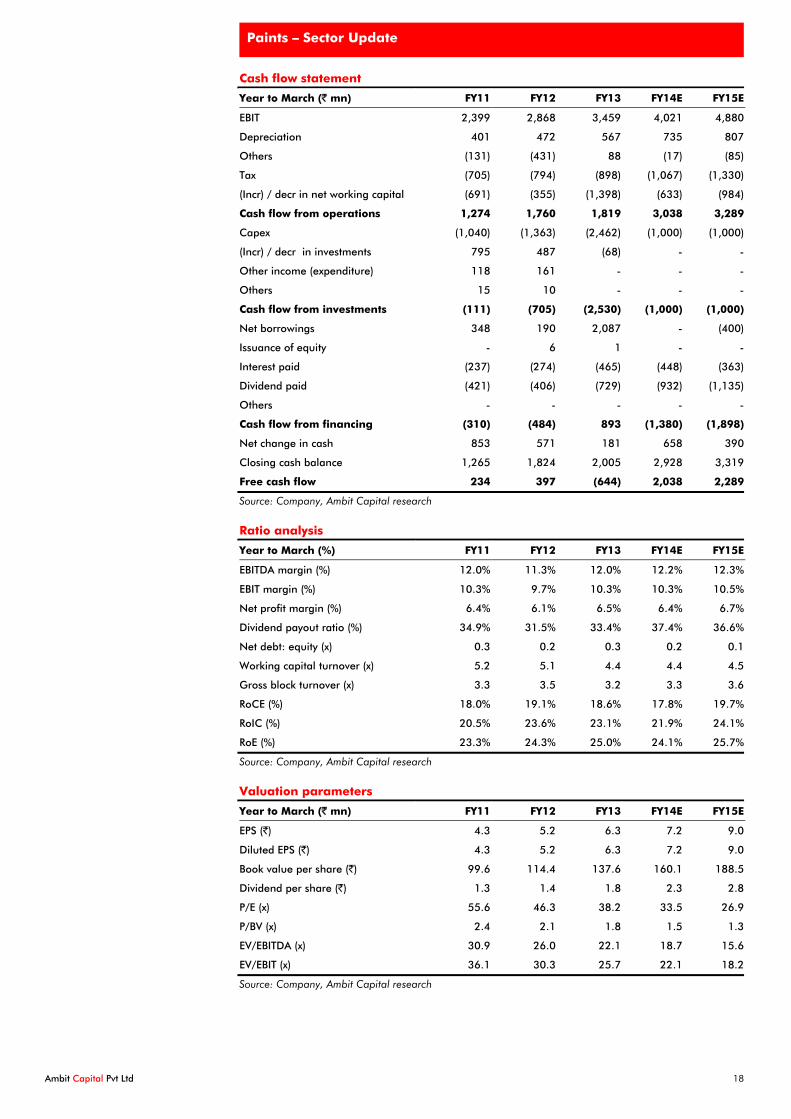
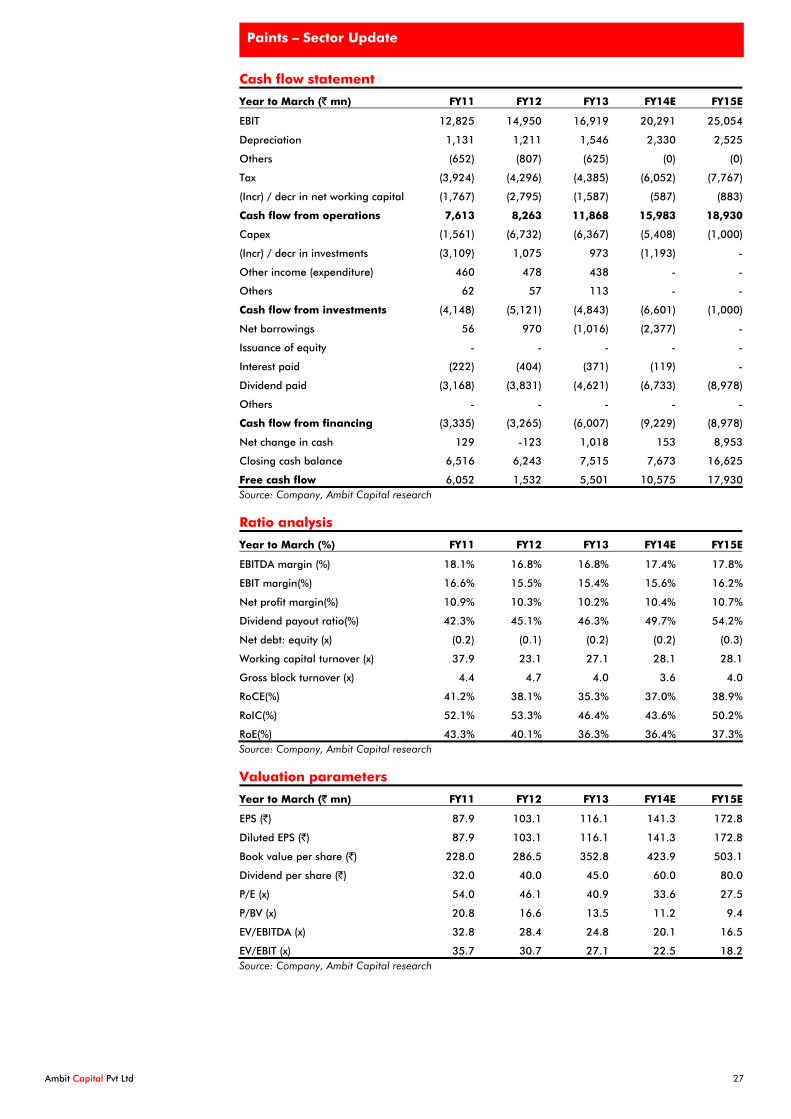
Cash flow statement
Year to March (` mn) FY11 FY12 FY13 FY14E FY15E
EBIT 2,399 2,868 3,459 4,021 4,880
Depreciation 401 472 567 735 807
Others (131) (431) 88 (17) (85)
Tax (705) (794) (898) (1,067) (1,330)
(Incr) / decr in net working capital (691) (355) (1,398) (633) (984)
Cash flow from operations 1,274 1,760 1,819 3,038 3,289
Capex (1,040) (1,363) (2,462) (1,000) (1,000)
(Incr) / decr in investments 795 487 (68) - -
Other income (expenditure) 118 161 - - -
Others 15 10 - - -
Cash flow from investments (111) (705) (2,530) (1,000) (1,000)
Net borrowings 348 190 2,087 - (400)
Issuance of equity - 6 1 - -
Interest paid (237) (274) (465) (448) (363)
Dividend paid (421) (406) (729) (932) (1,135)
Others - - - - -
Cash flow from financing (310) (484) 893 (1,380) (1,898)
Net change in cash 853 571 181 658 390
Closing cash balance 1,265 1,824 2,005 2,928 3,319
Free cash flow 234 397 (644) 2,038 2,289
Source: Company, Ambit Capital research
Ratio analysis
Year to March (%) FY11 FY12 FY13 FY14E FY15E
EBITDA margin (%) 12.0% 11.3% 12.0% 12.2% 12.3%
EBIT margin (%) 10.3% 9.7% 10.3% 10.3% 10.5%
Net profit margin (%) 6.4% 6.1% 6.5% 6.4% 6.7%
Dividend payout ratio (%) 34.9% 31.5% 33.4% 37.4% 36.6%
Net debt: equity (x) 0.3 0.2 0.3 0.2 0.1
Working capital turnover (x) 5.2 5.1 4.4 4.4 4.5
Gross block turnover (x) 3.3 3.5 3.2 3.3 3.6
RoCE (%) 18.0% 19.1% 18.6% 17.8% 19.7%
RoIC (%) 20.5% 23.6% 23.1% 21.9% 24.1%
RoE (%) 23.3% 24.3% 25.0% 24.1% 25.7%
Source: Company, Ambit Capital research
Valuation parameters
Year to March (` mn) FY11 FY12 FY13 FY14E FY15E
EPS (`) 4.3 5.2 6.3 7.2 9.0
Diluted EPS (`) 4.3 5.2 6.3 7.2 9.0
Book value per share (`) 99.6 114.4 137.6 160.1 188.5
Dividend per share (`) 1.3 1.4 1.8 2.3 2.8
P/E (x) 55.6 46.3 38.2 33.5 26.9
P/BV (x) 2.4 2.1 1.8 1.5 1.3
EV/EBITDA (x) 30.9 26.0 22.1 18.7 15.6
EV/EBIT (x) 36.1 30.3 25.7 22.1 18.2
Source: Company, Ambit Capital research
Paints – Sector Update
Ambit Capital Pvt Ltd 19
Asian Paints Key assumptions and estimates Revenue growth drivers
Exhibit 14: Summary assumptions for Asian Paints
FY13 FY14E FY15E
Industry level drivers
Organised Industry volume growth 8.0% 9.8% 12.2%
Company level drivers
Contribution from market share gain/loss vs peers 0.0% 0.6% 1.0%
LFL price increase 3.5% 5.0% 5.0% Contribution from mix change (economy/mid-tier to premium) 2.2% 2.2% 2.2%
Total volume growth for Asian Paints 8.0% 10.4% 13.2%
Contribution from realisation rate increase for Asian 5.7% 7.2% 7.2%
Total value 13.7% 17.7% 20.4%
Source: Ambit Capital research
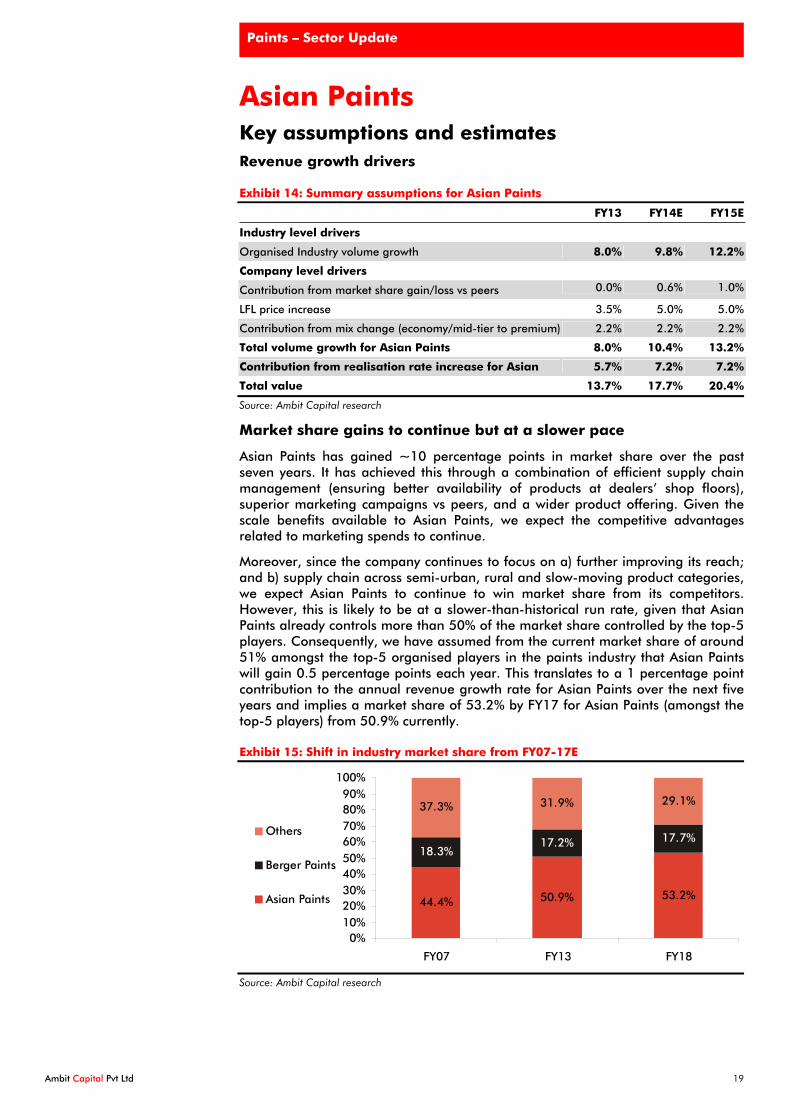
Market share gains to continue but at a slower pace
Asian Paints has gained ~10 percentage points in market share over the past seven years. It has achieved this through a combination of efficient supply chain management (ensuring better availability of products at dealers’ shop floors), superior marketing campaigns vs peers, and a wider product offering. Given the scale benefits available to Asian Paints, we expect the competitive advantages related to marketing spends to continue.
Moreover, since the company continues to focus on a) further improving its reach; and b) supply chain across semi-urban, rural and slow-moving product categories, we expect Asian Paints to continue to win market share from its competitors. However, this is likely to be at a slower-than-historical run rate, given that Asian Paints already controls more than 50% of the market share controlled by the top-5 players. Consequently, we have assumed from the current market share of around 51% amongst the top-5 organised players in the paints industry that Asian Paints will gain 0.5 percentage points each year. This translates to a 1 percentage point contribution to the annual revenue growth rate for Asian Paints over the next five years and implies a market share of 53.2% by FY17 for Asian Paints (amongst the top-5 players) from 50.9% currently.
Exhibit 15: Shift in industry market share from FY07-17E
44.4% 50.9% 53.2%
18.3%17.2% 17.7%
37.3% 31.9% 29.1%
0%10%20%30%40%50%60%70%80%90%
100%
FY07 FY13 FY18
Others
Berger Paints
Asian Paints
Source: Ambit Capital research
Paints – Sector Update
Ambit Capital Pvt Ltd 20
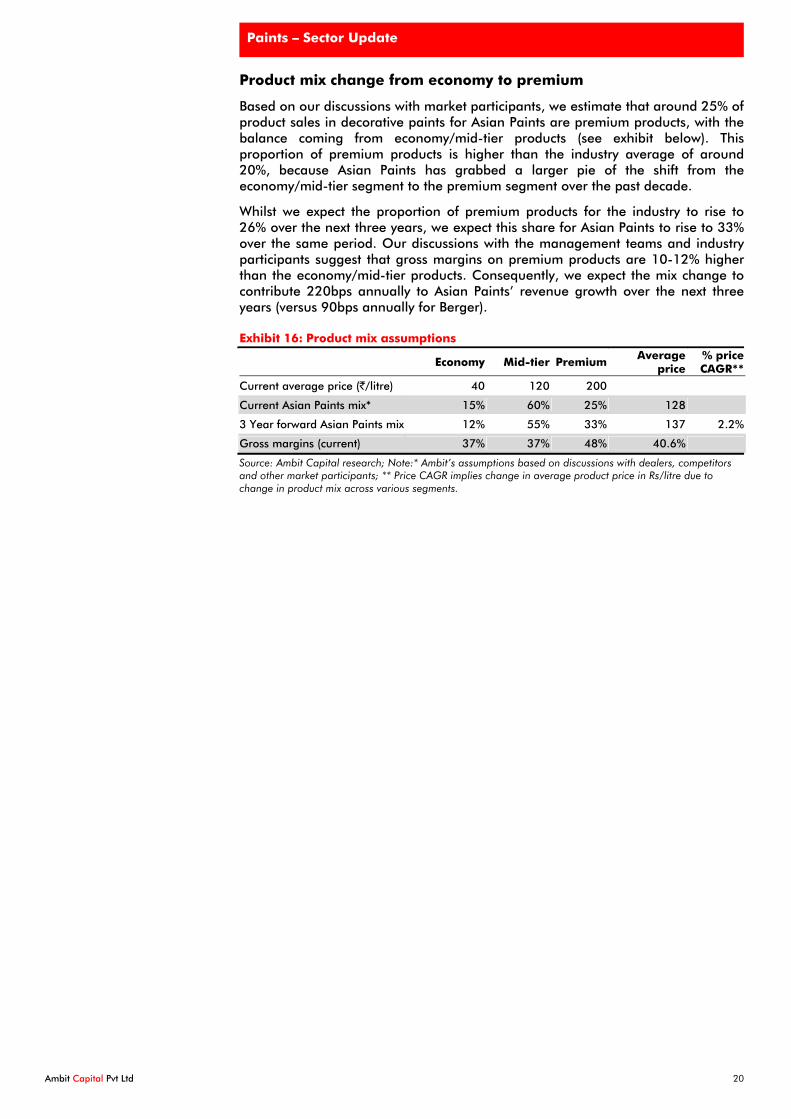
Product mix change from economy to premium
Based on our discussions with market participants, we estimate that around 25% of product sales in decorative paints for Asian Paints are premium products, with the balance coming from economy/mid-tier products (see exhibit below). This proportion of premium products is higher than the industry average of around 20%, because Asian Paints has grabbed a larger pie of the shift from the economy/mid-tier segment to the premium segment over the past decade.
Whilst we expect the proportion of premium products for the industry to rise to 26% over the next three years, we expect this share for Asian Paints to rise to 33% over the same period. Our discussions with the management teams and industry participants suggest that gross margins on premium products are 10-12% higher than the economy/mid-tier products. Consequently, we expect the mix change to contribute 220bps annually to Asian Paints’ revenue growth over the next three years (versus 90bps annually for Berger).
Exhibit 16: Product mix assumptions
Economy Mid-tier Premium Average price
% price CAGR**
Current average price (`/litre) 40 120 200
Current Asian Paints mix* 15% 60% 25% 128
3 Year forward Asian Paints mix 12% 55% 33% 137 2.2%
Gross margins (current) 37% 37% 48% 40.6%
Source: Ambit Capital research; Note:* Ambit’s assumptions based on discussions with dealers, competitors and other market participants; ** Price CAGR implies change in average product price in Rs/litre due to change in product mix across various segments.
Paints – Sector Update
Ambit Capital Pvt Ltd 21
Other assumptions and forecasts
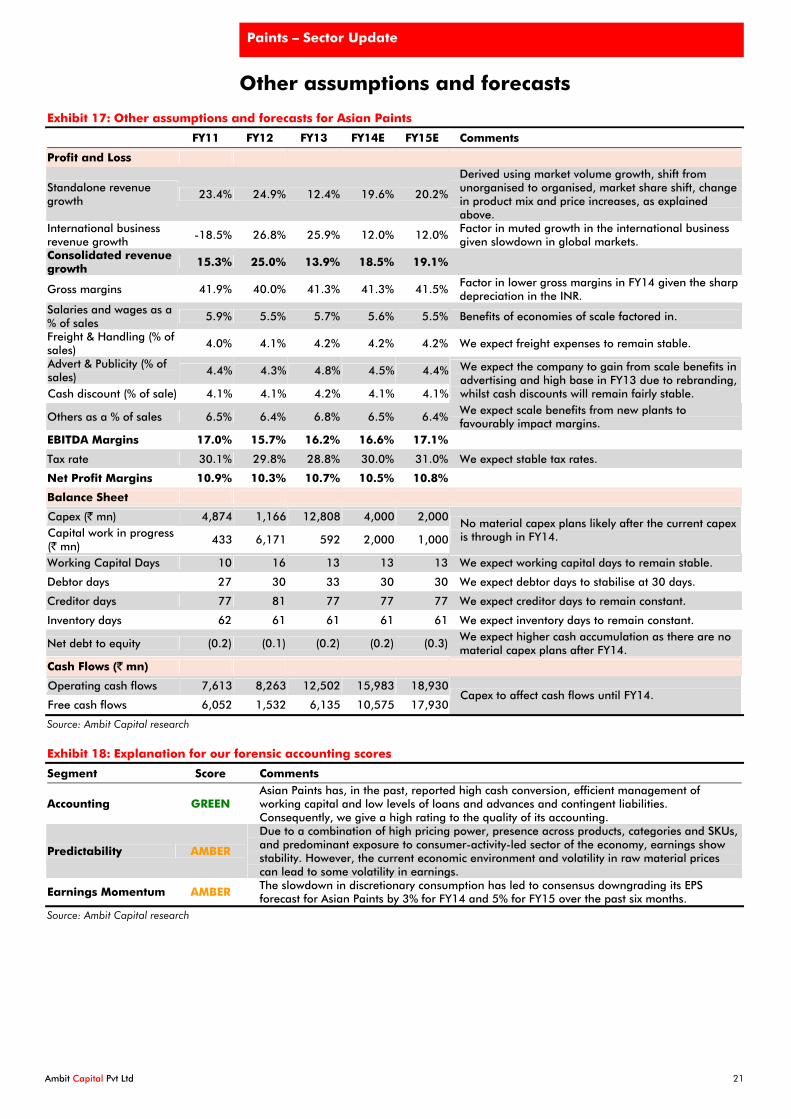
Exhibit 17: Other assumptions and forecasts for Asian Paints
FY11 FY12 FY13 FY14E FY15E Comments
Profit and Loss
Standalone revenue growth
23.4% 24.9% 12.4% 19.6% 20.2%
Derived using market volume growth, shift from unorganised to organised, market share shift, change in product mix and price increases, as explained above.
International business revenue growth
-18.5% 26.8% 25.9% 12.0% 12.0% Factor in muted growth in the international business given slowdown in global markets.
Consolidated revenue growth 15.3% 25.0% 13.9% 18.5% 19.1%
Gross margins 41.9% 40.0% 41.3% 41.3% 41.5% Factor in lower gross margins in FY14 given the sharp depreciation in the INR.
Salaries and wages as a % of sales
5.9% 5.5% 5.7% 5.6% 5.5% Benefits of economies of scale factored in.
Freight & Handling (% of sales)
4.0% 4.1% 4.2% 4.2% 4.2% We expect freight expenses to remain stable.
Advert & Publicity (% of sales)
4.4% 4.3% 4.8% 4.5% 4.4%
Cash discount (% of sale) 4.1% 4.1% 4.2% 4.1% 4.1%
We expect the company to gain from scale benefits in advertising and high base in FY13 due to rebranding, whilst cash discounts will remain fairly stable.
Others as a % of sales 6.5% 6.4% 6.8% 6.5% 6.4% We expect scale benefits from new plants to favourably impact margins.
EBITDA Margins 17.0% 15.7% 16.2% 16.6% 17.1%
Tax rate 30.1% 29.8% 28.8% 30.0% 31.0% We expect stable tax rates.
Net Profit Margins 10.9% 10.3% 10.7% 10.5% 10.8%
Balance Sheet
Capex (` mn) 4,874 1,166 12,808 4,000 2,000 Capital work in progress (` mn)
433 6,171 592 2,000 1,000 No material capex plans likely after the current capex is through in FY14.
Working Capital Days 10 16 13 13 13 We expect working capital days to remain stable.
Debtor days 27 30 33 30 30 We expect debtor days to stabilise at 30 days.
Creditor days 77 81 77 77 77 We expect creditor days to remain constant.
Inventory days 62 61 61 61 61 We expect inventory days to remain constant.
Net debt to equity (0.2) (0.1) (0.2) (0.2) (0.3) We expect higher cash accumulation as there are no material capex plans after FY14.
Cash Flows (` mn)
Operating cash flows 7,613 8,263 12,502 15,983 18,930
Free cash flows 6,052 1,532 6,135 10,575 17,930 Capex to affect cash flows until FY14.
Source: Ambit Capital research
Exhibit 18: Explanation for our forensic accounting scores
Segment Score Comments
Accounting GREEN Asian Paints has, in the past, reported high cash conversion, efficient management of working capital and low levels of loans and advances and contingent liabilities. Consequently, we give a high rating to the quality of its accounting.
Predictability AMBER
Due to a combination of high pricing power, presence across products, categories and SKUs, and predominant exposure to consumer-activity-led sector of the economy, earnings show stability. However, the current economic environment and volatility in raw material prices can lead to some volatility in earnings.
Earnings Momentum AMBER The slowdown in discretionary consumption has led to consensus downgrading its EPS forecast for Asian Paints by 3% for FY14 and 5% for FY15 over the past six months.
Source: Ambit Capital research
Paints – Sector Update
Ambit Capital Pvt Ltd 22
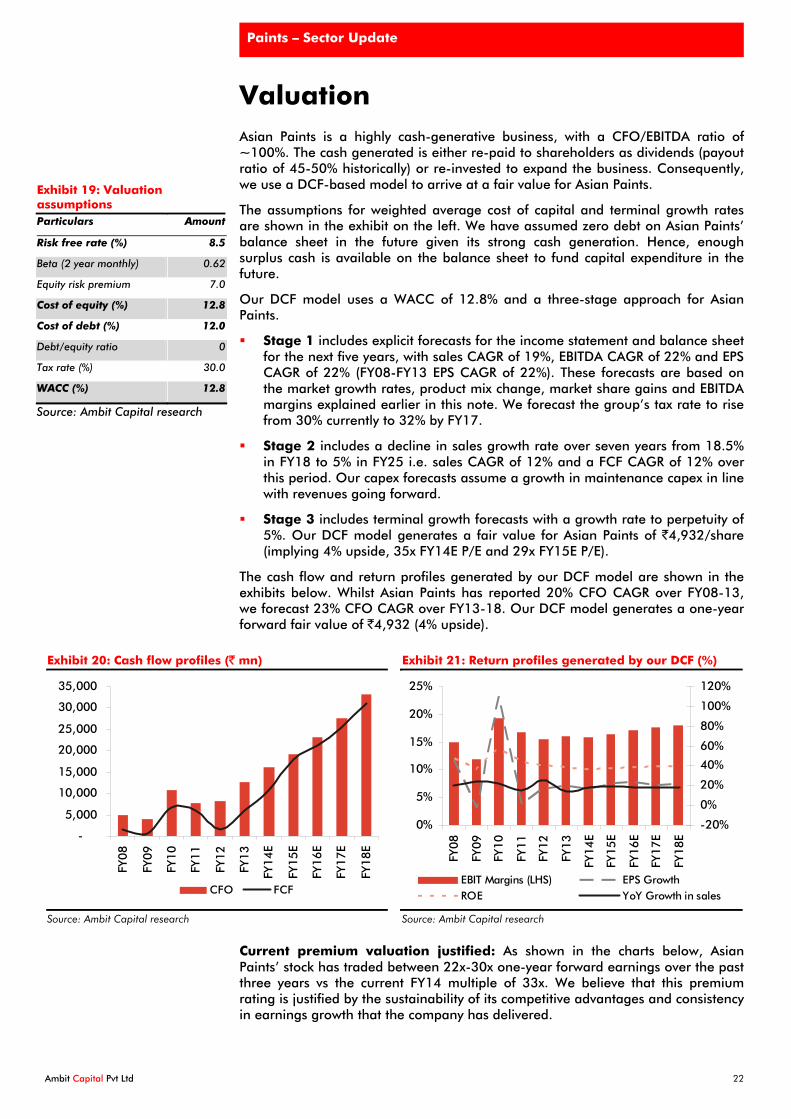
Valuation Asian Paints is a highly cash-generative business, with a CFO/EBITDA ratio of ~100%. The cash generated is either re-paid to shareholders as dividends (payout ratio of 45-50% historically) or re-invested to expand the business. Consequently, we use a DCF-based model to arrive at a fair value for Asian Paints.
The assumptions for weighted average cost of capital and terminal growth rates are shown in the exhibit on the left. We have assumed zero debt on Asian Paints’ balance sheet in the future given its strong cash generation. Hence, enough surplus cash is available on the balance sheet to fund capital expenditure in the future.
Our DCF model uses a WACC of 12.8% and a three-stage approach for Asian Paints.
Stage 1 includes explicit forecasts for the income statement and balance sheet for the next five years, with sales CAGR of 19%, EBITDA CAGR of 22% and EPS CAGR of 22% (FY08-FY13 EPS CAGR of 22%). These forecasts are based on the market growth rates, product mix change, market share gains and EBITDA margins explained earlier in this note. We forecast the group’s tax rate to rise from 30% currently to 32% by FY17.
Stage 2 includes a decline in sales growth rate over seven years from 18.5% in FY18 to 5% in FY25 i.e. sales CAGR of 12% and a FCF CAGR of 12% over this period. Our capex forecasts assume a growth in maintenance capex in line with revenues going forward.
Stage 3 includes terminal growth forecasts with a growth rate to perpetuity of 5%. Our DCF model generates a fair value for Asian Paints of `4,932/share (implying 4% upside, 35x FY14E P/E and 29x FY15E P/E).
The cash flow and return profiles generated by our DCF model are shown in the exhibits below. Whilst Asian Paints has reported 20% CFO CAGR over FY08-13, we forecast 23% CFO CAGR over FY13-18. Our DCF model generates a one-year forward fair value of `4,932 (4% upside).
Exhibit 20: Cash flow profiles (` mn)
-
5,000
10,000
15,000
20,000
25,000
30,000
35,000
FY08
FY09
FY10
FY11
FY12
FY13
FY14
E
FY15
E
FY16
E
FY17
E
FY18
E
CFO FCF
Source: Ambit Capital research
Exhibit 21: Return profiles generated by our DCF (%)
0%
5%
10%
15%
20%
25%
FY08
FY09
FY10
FY11
FY12
FY13
FY14
E
FY15
E
FY16
E
FY17
E
FY18
E
-20%
0%
20%
40%
60%
80%
100%
120%
EBIT Margins (LHS) EPS GrowthROE YoY Growth in sales
Source: Ambit Capital research
Current premium valuation justified: As shown in the charts below, Asian Paints’ stock has traded between 22x-30x one-year forward earnings over the past three years vs the current FY14 multiple of 33x. We believe that this premium rating is justified by the sustainability of its competitive advantages and consistency in earnings growth that the company has delivered.
Exhibit 19: Valuation assumptions Particulars Amount
Risk free rate (%) 8.5
Beta (2 year monthly) 0.62
Equity risk premium 7.0
Cost of equity (%) 12.8
Cost of debt (%) 12.0
Debt/equity ratio 0
Tax rate (%) 30.0
WACC (%) 12.8
Source: Ambit Capital research
Paints – Sector Update
Ambit Capital Pvt Ltd 23
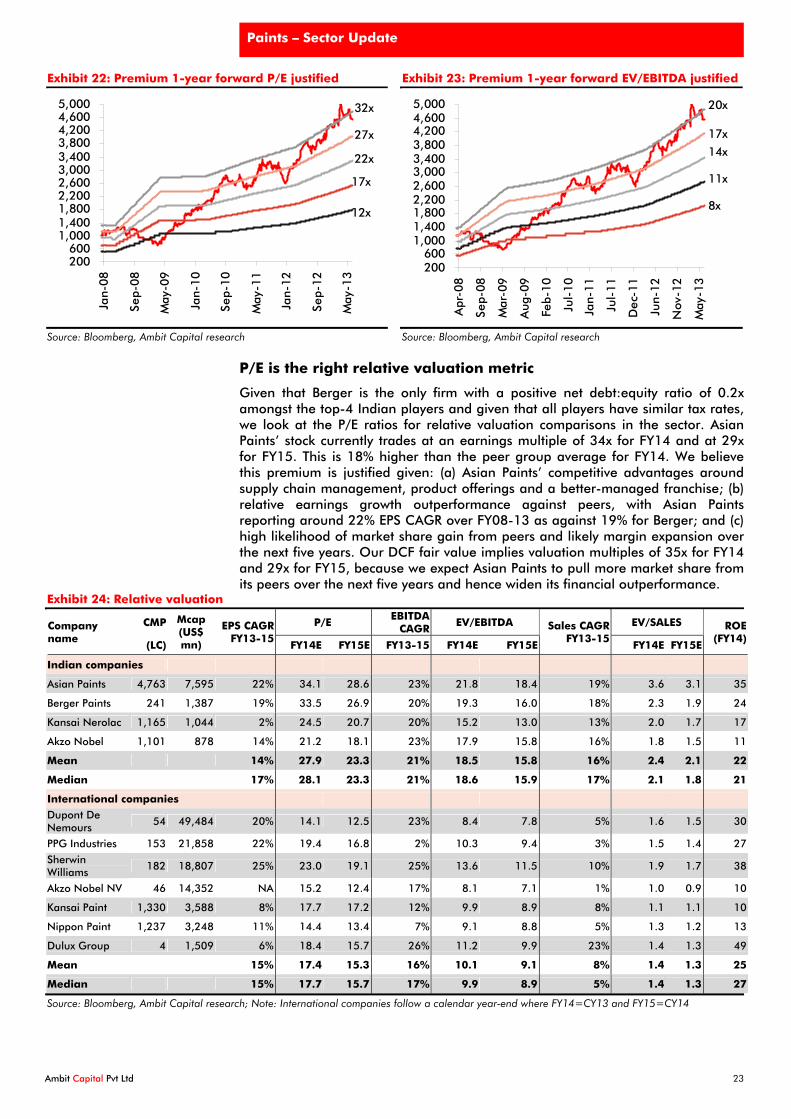
Exhibit 22: Premium 1-year forward P/E justified
200600
1,0001,4001,8002,2002,6003,0003,4003,8004,2004,6005,000
Jan-
08
Sep-
08
May
-09
Jan-
10
Sep-
10
May
-11
Jan-
12
Sep-
12
May
-13
12x
32x
27x
22x
17x
Source: Bloomberg, Ambit Capital research
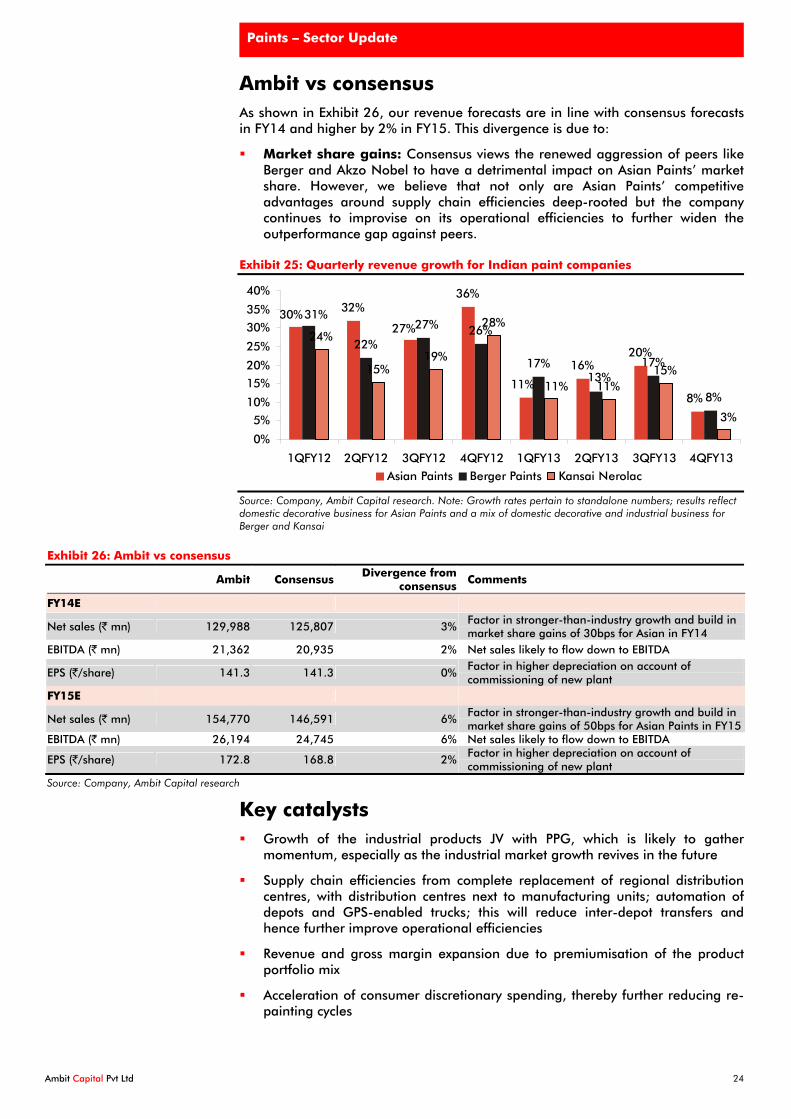
Exhibit 23: Premium 1-year forward EV/EBITDA justified
200600
1,0001,4001,8002,2002,6003,0003,4003,8004,2004,6005,000
Apr
-08
Sep-
08
Mar
-09
Aug
-09
Feb-
10
Jul-
10
Jan-
11
Jul-
11
Dec
-11
Jun-
12
Nov
-12
May
-13
8x
11x
14x
17x
20x
Source: Bloomberg, Ambit Capital research
P/E is the right relative valuation metric
Given that Berger is the only firm with a positive net debt:equity ratio of 0.2x amongst the top-4 Indian players and given that all players have similar tax rates, we look at the P/E ratios for relative valuation comparisons in the sector. Asian Paints’ stock currently trades at an earnings multiple of 34x for FY14 and at 29x for FY15. This is 18% higher than the peer group average for FY14. We believe this premium is justified given: (a) Asian Paints’ competitive advantages around supply chain management, product offerings and a better-managed franchise; (b) relative earnings growth outperformance against peers, with Asian Paints reporting around 22% EPS CAGR over FY08-13 as against 19% for Berger; and (c) high likelihood of market share gain from peers and likely margin expansion over the next five years. Our DCF fair value implies valuation multiples of 35x for FY14 and 29x for FY15, because we expect Asian Paints to pull more market share from its peers over the next five years and hence widen its financial outperformance.
Exhibit 24: Relative valuation
CMP P/E EBITDA
CAGR EV/EBITDA EV/SALES Company
name (LC)
Mcap (US$ mn)
EPS CAGR FY13-15
FY14E FY15E FY13-15 FY14E FY15E
Sales CAGR FY13-15
FY14E FY15E
ROE (FY14)
Indian companies
Asian Paints 4,763 7,595 22% 34.1 28.6 23% 21.8 18.4 19% 3.6 3.1 35
Berger Paints 241 1,387 19% 33.5 26.9 20% 19.3 16.0 18% 2.3 1.9 24
Kansai Nerolac 1,165 1,044 2% 24.5 20.7 20% 15.2 13.0 13% 2.0 1.7 17
Akzo Nobel 1,101 878 14% 21.2 18.1 23% 17.9 15.8 16% 1.8 1.5 11
Mean 14% 27.9 23.3 21% 18.5 15.8 16% 2.4 2.1 22
Median 17% 28.1 23.3 21% 18.6 15.9 17% 2.1 1.8 21
International companies
Dupont De Nemours
54 49,484 20% 14.1 12.5 23% 8.4 7.8 5% 1.6 1.5 30
PPG Industries 153 21,858 22% 19.4 16.8 2% 10.3 9.4 3% 1.5 1.4 27
Sherwin Williams
182 18,807 25% 23.0 19.1 25% 13.6 11.5 10% 1.9 1.7 38
Akzo Nobel NV 46 14,352 NA 15.2 12.4 17% 8.1 7.1 1% 1.0 0.9 10
Kansai Paint 1,330 3,588 8% 17.7 17.2 12% 9.9 8.9 8% 1.1 1.1 10
Nippon Paint 1,237 3,248 11% 14.4 13.4 7% 9.1 8.8 5% 1.3 1.2 13
Dulux Group 4 1,509 6% 18.4 15.7 26% 11.2 9.9 23% 1.4 1.3 49
Mean 15% 17.4 15.3 16% 10.1 9.1 8% 1.4 1.3 25
Median 15% 17.7 15.7 17% 9.9 8.9 5% 1.4 1.3 27
Source: Bloomberg, Ambit Capital research; Note: International companies follow a calendar year-end where FY14=CY13 and FY15=CY14
Paints – Sector Update
Ambit Capital Pvt Ltd 24
Ambit vs consensus As shown in Exhibit 26, our revenue forecasts are in line with consensus forecasts in FY14 and higher by 2% in FY15. This divergence is due to:
Market share gains: Consensus views the renewed aggression of peers like Berger and Akzo Nobel to have a detrimental impact on Asian Paints’ market share. However, we believe that not only are Asian Paints’ competitive advantages around supply chain efficiencies deep-rooted but the company continues to improvise on its operational efficiencies to further widen the outperformance gap against peers.
Exhibit 25: Quarterly revenue growth for Indian paint companies
32%36%
16%20%
22%26%
17% 17%
24%
15%19%
28%
15%
30%
8%11%
27%31%
8%
27%
13%11% 11%
3%
0%
5%
10%
15%
20%
25%
30%
35%
40%
1QFY12 2QFY12 3QFY12 4QFY12 1QFY13 2QFY13 3QFY13 4QFY13
Asian Paints Berger Paints Kansai Nerolac
Source: Company, Ambit Capital research. Note: Growth rates pertain to standalone numbers; results reflect domestic decorative business for Asian Paints and a mix of domestic decorative and industrial business for Berger and Kansai
Exhibit 26: Ambit vs consensus
Ambit Consensus Divergence from consensus Comments
FY14E
Net sales (` mn) 129,988 125,807 3% Factor in stronger-than-industry growth and build in market share gains of 30bps for Asian in FY14
EBITDA (` mn) 21,362 20,935 2% Net sales likely to flow down to EBITDA
EPS (`/share) 141.3 141.3 0% Factor in higher depreciation on account of commissioning of new plant
FY15E
Net sales (` mn) 154,770 146,591 6% Factor in stronger-than-industry growth and build in market share gains of 50bps for Asian Paints in FY15
EBITDA (` mn) 26,194 24,745 6% Net sales likely to flow down to EBITDA
EPS (`/share) 172.8 168.8 2% Factor in higher depreciation on account of commissioning of new plant
Source: Company, Ambit Capital research
Key catalysts Growth of the industrial products JV with PPG, which is likely to gather
momentum, especially as the industrial market growth revives in the future
Supply chain efficiencies from complete replacement of regional distribution centres, with distribution centres next to manufacturing units; automation of depots and GPS-enabled trucks; this will reduce inter-depot transfers and hence further improve operational efficiencies
Revenue and gross margin expansion due to premiumisation of the product portfolio mix
Acceleration of consumer discretionary spending, thereby further reducing re-painting cycles
Paints – Sector Update
Ambit Capital Pvt Ltd 25
Risks to our BUY stance We see the following key risks to our BUY stance on Asian Paints:
Poor capital allocation decisions by Asian Paints going forward, given that there are no material capex or debt-repayment-related capital utilisation requirements; whilst the recently announced acquisition of kitchen retailer ‘Sleek’ is small as compared to its balance sheet size, there is a risk of more and larger acquisitions around home décor which could be detrimental to its RoEs
Sustained sluggish economic growth for India over the next two years
Sharp increase in input costs due to either INR depreciation or commodity price increases along with high price elasticity of demand in the paints industry; this scenario will not allow Asian Paints to pass on input price inflation to the customers without moderation in customer demand
Paints – Sector Update
Ambit Capital Pvt Ltd 26
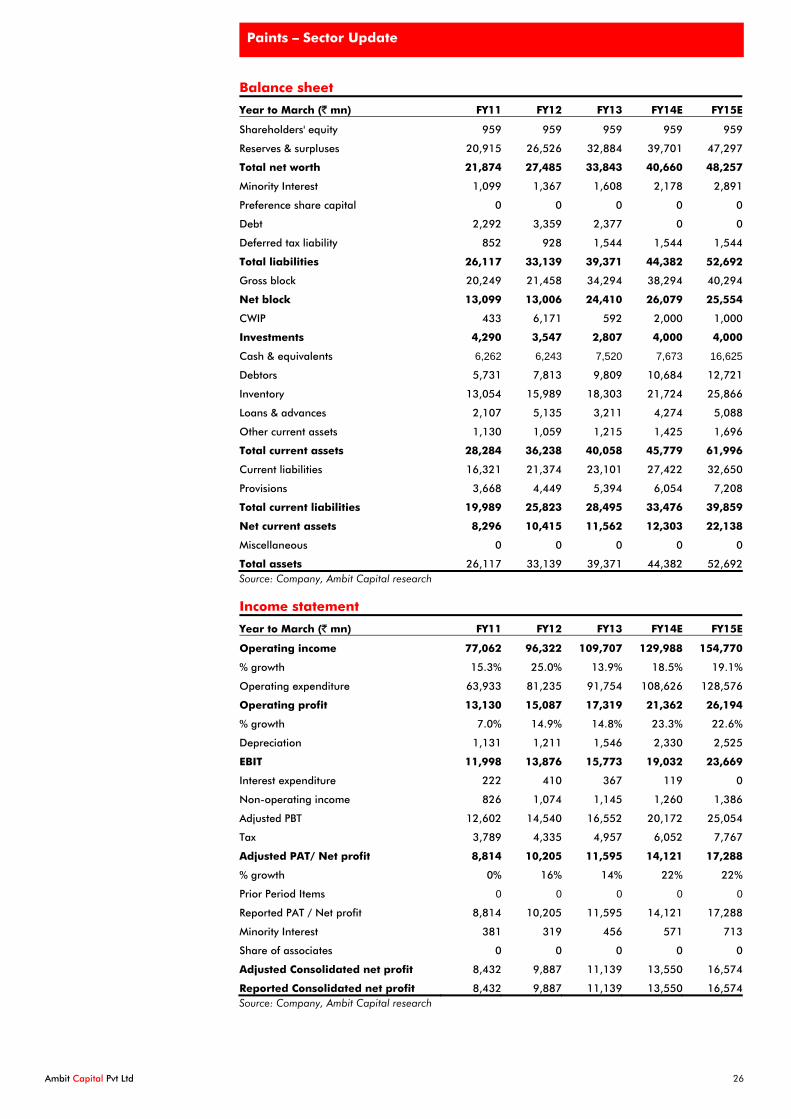
Balance sheet
Year to March (` mn) FY11 FY12 FY13 FY14E FY15E
Shareholders' equity 959 959 959 959 959
Reserves & surpluses 20,915 26,526 32,884 39,701 47,297
Total net worth 21,874 27,485 33,843 40,660 48,257
Minority Interest 1,099 1,367 1,608 2,178 2,891
Preference share capital 0 0 0 0 0
Debt 2,292 3,359 2,377 0 0
Deferred tax liability 852 928 1,544 1,544 1,544
Total liabilities 26,117 33,139 39,371 44,382 52,692
Gross block 20,249 21,458 34,294 38,294 40,294
Net block 13,099 13,006 24,410 26,079 25,554
CWIP 433 6,171 592 2,000 1,000
Investments 4,290 3,547 2,807 4,000 4,000
Cash & equivalents 6,262 6,243 7,520 7,673 16,625
Debtors 5,731 7,813 9,809 10,684 12,721
Inventory 13,054 15,989 18,303 21,724 25,866
Loans & advances 2,107 5,135 3,211 4,274 5,088
Other current assets 1,130 1,059 1,215 1,425 1,696
Total current assets 28,284 36,238 40,058 45,779 61,996
Current liabilities 16,321 21,374 23,101 27,422 32,650
Provisions 3,668 4,449 5,394 6,054 7,208
Total current liabilities 19,989 25,823 28,495 33,476 39,859
Net current assets 8,296 10,415 11,562 12,303 22,138
Miscellaneous 0 0 0 0 0
Total assets 26,117 33,139 39,371 44,382 52,692 Source: Company, Ambit Capital research
Income statement
Year to March (` mn) FY11 FY12 FY13 FY14E FY15E
Operating income 77,062 96,322 109,707 129,988 154,770
% growth 15.3% 25.0% 13.9% 18.5% 19.1%
Operating expenditure 63,933 81,235 91,754 108,626 128,576
Operating profit 13,130 15,087 17,319 21,362 26,194
% growth 7.0% 14.9% 14.8% 23.3% 22.6%
Depreciation 1,131 1,211 1,546 2,330 2,525
EBIT 11,998 13,876 15,773 19,032 23,669
Interest expenditure 222 410 367 119 0
Non-operating income 826 1,074 1,145 1,260 1,386
Adjusted PBT 12,602 14,540 16,552 20,172 25,054
Tax 3,789 4,335 4,957 6,052 7,767
Adjusted PAT/ Net profit 8,814 10,205 11,595 14,121 17,288
% growth 0% 16% 14% 22% 22%
Prior Period Items 0 0 0 0 0
Reported PAT / Net profit 8,814 10,205 11,595 14,121 17,288
Minority Interest 381 319 456 571 713
Share of associates 0 0 0 0 0
Adjusted Consolidated net profit 8,432 9,887 11,139 13,550 16,574
Reported Consolidated net profit 8,432 9,887 11,139 13,550 16,574 Source: Company, Ambit Capital research
Paints – Sector Update
Ambit Capital Pvt Ltd 27
Cash flow statement
Year to March (` mn) FY11 FY12 FY13 FY14E FY15E
EBIT 12,825 14,950 16,919 20,291 25,054
Depreciation 1,131 1,211 1,546 2,330 2,525
Others (652) (807) (625) (0) (0)
Tax (3,924) (4,296) (4,385) (6,052) (7,767)
(Incr) / decr in net working capital (1,767) (2,795) (1,587) (587) (883)
Cash flow from operations 7,613 8,263 11,868 15,983 18,930
Capex (1,561) (6,732) (6,367) (5,408) (1,000)
(Incr) / decr in investments (3,109) 1,075 973 (1,193) -
Other income (expenditure) 460 478 438 - -
Others 62 57 113 - -
Cash flow from investments (4,148) (5,121) (4,843) (6,601) (1,000)
Net borrowings 56 970 (1,016) (2,377) -
Issuance of equity - - - - -
Interest paid (222) (404) (371) (119) -
Dividend paid (3,168) (3,831) (4,621) (6,733) (8,978)
Others - - - - -
Cash flow from financing (3,335) (3,265) (6,007) (9,229) (8,978)
Net change in cash 129 -123 1,018 153 8,953
Closing cash balance 6,516 6,243 7,515 7,673 16,625
Free cash flow 6,052 1,532 5,501 10,575 17,930Source: Company, Ambit Capital research
Ratio analysis
Year to March (%) FY11 FY12 FY13 FY14E FY15E
EBITDA margin (%) 18.1% 16.8% 16.8% 17.4% 17.8%
EBIT margin(%) 16.6% 15.5% 15.4% 15.6% 16.2%
Net profit margin(%) 10.9% 10.3% 10.2% 10.4% 10.7%
Dividend payout ratio(%) 42.3% 45.1% 46.3% 49.7% 54.2%
Net debt: equity (x) (0.2) (0.1) (0.2) (0.2) (0.3)
Working capital turnover (x) 37.9 23.1 27.1 28.1 28.1
Gross block turnover (x) 4.4 4.7 4.0 3.6 4.0
RoCE(%) 41.2% 38.1% 35.3% 37.0% 38.9%
RoIC(%) 52.1% 53.3% 46.4% 43.6% 50.2%
RoE(%) 43.3% 40.1% 36.3% 36.4% 37.3%Source: Company, Ambit Capital research
Valuation parameters
Year to March (` mn) FY11 FY12 FY13 FY14E FY15E
EPS (`) 87.9 103.1 116.1 141.3 172.8
Diluted EPS (`) 87.9 103.1 116.1 141.3 172.8
Book value per share (`) 228.0 286.5 352.8 423.9 503.1
Dividend per share (`) 32.0 40.0 45.0 60.0 80.0
P/E (x) 54.0 46.1 40.9 33.6 27.5
P/BV (x) 20.8 16.6 13.5 11.2 9.4
EV/EBITDA (x) 32.8 28.4 24.8 20.1 16.5
EV/EBIT (x) 35.7 30.7 27.1 22.5 18.2 Source: Company, Ambit Capital research
Paints – Sector Update
Ambit Capital Pvt Ltd 28
Institutional Equities Team
Saurabh Mukherjea, CFA Head of Equities (022) 30433174 [email protected]
Research
Analysts Industry Sectors Desk-Phone E-mail
Aadesh Mehta Banking / NBFCs (022) 30433239 [email protected]
Achint Bhagat Cement / Infrastructure (022) 30433178 [email protected]
Ankur Rudra, CFA Technology / Telecom / Media (022) 30433211 [email protected]
Ashvin Shetty Automobile (022) 30433285 [email protected]
Bhargav Buddhadev Power / Capital Goods (022) 30433252 [email protected]
Dayanand Mittal Oil & Gas (022) 30433202 [email protected]
Gaurav Mehta Strategy / Derivatives Research (022) 30433255 [email protected]
Jatin Kotian Metals & Mining / Healthcare (022) 30433261 [email protected]
Karan Khanna Strategy (022) 30433251 [email protected]
Krishnan ASV Banking (022) 30433205 [email protected]
Nitin Bhasin E&C / Infrastructure / Cement (022) 30433241 [email protected]
Nitin Jain Technology (022) 30433291 [email protected]
Pankaj Agarwal, CFA NBFCs (022) 30433206 [email protected]
Pratik Singhania Real Estate / Retail (022) 30433264 [email protected]
Parita Ashar Metals & Mining (022) 30433223 [email protected]
Rakshit Ranjan, CFA Consumer / Real Estate (022) 30433201 [email protected]
Ravi Singh Banking / NBFCs (022) 30433181 [email protected]
Ritika Mankar Mukherjee Economy / Strategy (022) 30433175 [email protected]
Ritu Modi Healthcare (022) 30433292 [email protected]
Shariq Merchant Consumer (022) 30433246 [email protected]
Tanuj Mukhija E&C / Infrastructure (022) 30433203 [email protected]
Utsav Mehta Telecom / Media (022) 30433209 [email protected]
Sales
Name Regions Desk-Phone E-mail
Deepak Sawhney India / Asia (022) 30433295 [email protected]
Dharmen Shah India / Asia (022) 30433289 [email protected]
Dipti Mehta India / Europe / USA (022) 30433053 [email protected]
Nityam Shah, CFA USA (022) 30433259 [email protected]
Parees Purohit, CFA USA (022) 30433169 [email protected]
Pramod Gubbi, CFA India / Asia +65 86066476 [email protected]
Praveena Pattabiraman India / Asia (022) 30433268 [email protected]
Sarojini Ramachandran UK +44 (0) 20 7614 8374 [email protected]
Production
Sajid Merchant Production (022) 30433247 [email protected]
Joel Pereira Editor (022) 30433284 [email protected]
E&C = Engineering & Construction
Paints – Sector Update
Ambit Capital Pvt Ltd 29
Explanation of Investment Rating
Investment Rating Expected return
(over 12-month period from date of initial rating)
Buy >5%
Sell <5%
Disclaimer This report or any portion hereof may not be reprinted, sold or redistributed without the written consent of Ambit Capital. AMBIT Capital Research is disseminated and available primarily electronically, and, in some cases, in printed form.
Additional information on recommended securities is available on request.
Disclaimer 1. AMBIT Capital Private Limited (“AMBIT Capital”) and its affiliates are a full service, integrated investment banking, investment advisory and brokerage group. AMBIT
Capital is a Stock Broker, Portfolio Manager and Depository Participant registered with Securities and Exchange Board of India Limited (SEBI) and is regulated by SEBI 2. The recommendations, opinions and views contained in this Research Report reflect the views of the research analyst named on the Research Report and are based upon
publicly available information and rates of taxation at the time of publication, which are subject to change from time to time without any prior notice. 3. AMBIT Capital makes best endeavours to ensure that the research analyst(s) use current, reliable, comprehensive information and obtain such information from sources
which the analyst(s) believes to be reliable. However, such information has not been independently verified by AMBIT Capital and/or the analyst(s) and no representation or warranty, express or implied, is made as to the accuracy or completeness of any information obtained from third parties. The information or opinions are provided as at the date of this Research Report and are subject to change without notice.
4. If you are dissatisfied with the contents of this complimentary Research Report or with the terms of this Disclaimer, your sole and exclusive remedy is to stop using this Research Report and AMBIT Capital shall not be responsible and/ or liable in any manner.
5. If this Research Report is received by any client of AMBIT Capital or its affiliate, the relationship of AMBIT Capital/its affiliate with such client will continue to be governed by the terms and conditions in place between AMBIT Capital/ such affiliate and the client.
6. This Research Report is issued for information only and should not be construed as an investment advice to any recipient to acquire, subscribe, purchase, sell, dispose of, retain any securities. Recipients should consider this Research Report as only a single factor in making any investment decisions. This Research Report is not an offer to sell or the solicitation of an offer to purchase or subscribe for any investment or as an official endorsement of any investment.
7. If 'Buy', 'Sell', or 'Hold' recommendation is made in this Research Report such recommendation or view or opinion expressed on investments in this Research Report is not intended to constitute investment advice and should not be intended or treated as a substitute for necessary review or validation or any professional advice. The views expressed in this Research Report are those of the research analyst which are subject to change and do not represent to be an authority on the subject. AMBIT Capital may or may not subscribe to any and/ or all the views expressed herein.
8. AMBIT Capital makes no guarantee, representation or warranty, express or implied; and accepts no responsibility or liability as to the accuracy or completeness or currentess of the information in this Research Report. AMBIT Capital or its affiliates do not accept any liability whatsoever for any direct or consequential loss howsoever arising, directly or indirectly, from any use of this Research Report.
9. Past performance is not necessarily a guide to evaluate future performance. 10. AMBIT Capital and/or its affiliates (as principal or on behalf of its/their clients) and their respective officers directors and employees may hold positions in any securities
mentioned in this Research Report (or in any related investment) and may from time to time add to or dispose of any such securities (or investment). Such positions in securities may be contrary to or inconsistent with this Research Report.
11. This Research Report should be read and relied upon at the sole discretion and risk of the recipient. 12. The value of any investment made at your discretion based on this Research Report or income therefrom may be affected by changes in economic, financial and/ or
political factors and may go down as well as up and you may not get back the full or the expected amount invested. Some securities and/ or investments involve substantial risk and are not suitable for all investors.
13. This Research Report is being supplied to you solely for your information and may not be reproduced, redistributed or passed on, directly or indirectly, to any other person or published, copied in whole or in part, for any purpose. Neither this Research Report nor any copy of it may be taken or transmitted or distributed, directly or indirectly within India or into any other country including United States (to US Persons), Canada or Japan or to any resident thereof. The distribution of this Research Report in other jurisdictions may be strictly restricted and/ or prohibited by law or contract, and persons into whose possession this Research Report comes should inform themselves about such restriction and/ or prohibition, and observe any such restrictions and/ or prohibition.
14. Neither AMBIT Capital nor its affiliates or their respective directors, employees, agents or representatives, shall be responsible or liable in any manner, directly or indirectly, for views or opinions expressed in this Report or the contents or any errors or discrepancies herein or for any decisions or actions taken in reliance on the Report or inability to use or access our service or this Research Report or for any loss or damages whether direct or indirect, incidental, special or consequential including without limitation loss of revenue or profits that may arise from or in connection with the use of or reliance on this Research Report or inability to use or access our service or this Research Report.
Conflict of Interests 15. In the normal course of AMBIT Capital’s business circumstances may arise that could result in the interests of AMBIT Capital conflicting with the interests of clients or one
client’s interests conflicting with the interest of another client. AMBIT Capital makes best efforts to ensure that conflicts are identified and managed and that clients’ interests are protected. AMBIT Capital has policies and procedures in place to control the flow and use of non-public, price sensitive information and employees’ personal account trading. Where appropriate and reasonably achievable, AMBIT Capital segregates the activities of staff working in areas where conflicts of interest may arise. However, clients/potential clients of AMBIT Capital should be aware of these possible conflicts of interests and should make informed decisions in relation to AMBIT Capital’s services.
16. AMBIT Capital and/or its affiliates may from time to time have investment banking, investment advisory and other business relationships with companies covered in this Research Report and may receive compensation for the same. Research analysts provide important inputs into AMBIT Capital’s investment banking and other business selection processes.
17. AMBIT Capital and/or its affiliates may seek investment banking or other businesses from the companies covered in this Research Report and research analysts involved in preparing this Research Report may participate in the solicitation of such business.
18. In addition to the foregoing, the companies covered in this Research Report may be clients of AMBIT Capital where AMBIT Capital may be required, inter alia, to prepare and publish research reports covering such companies and AMBIT Capital may receive compensation from such companies in relation to such services. However, the views reflected in this Research Report are objective views, independent of AMBIT Capital’s relationship with such company.
19. In addition, AMBIT Capital may also act as a market maker or risk arbitrator or liquidity provider or may have assumed an underwriting commitment in the securities of companies covered in this Research Report (or in related investments) and may also be represented in the supervisory board or on any other committee of those companies.
Additional Disclaimer for U.S. Persons 20. The research report is solely a product of AMBIT Capital 21. AMBIT Capital is the employer of the research analyst(s) who has prepared the research report 22. Any subsequent transactions in securities discussed in the research reports should be effected through J.P.P. Euro-Securities, Inc. (“JPP”). 23. JPP does not accept or receive any compensation of any kind for the dissemination of the AMBIT Capital research reports. 24. The research analyst(s) preparing the research report is resident outside the United States and is/are not associated persons of any U.S. regulated broker-dealer and that
therefore the analyst(s) is/are not subject to supervision by a U.S. broker-dealer, and is/are not required to satisfy the regulatory licensing requirements of FINRA or required to otherwise comply with U.S. rules or regulations regarding, among other things, communications with a subject company, public appearances and trading securities held by a research analyst account.
© Copyright 2013 AMBIT Capital Private Limited. All rights reserved.
Ambit Capital Pvt. Ltd. Ambit House, 3rd Floor 449, Senapati Bapat Marg, Lower Parel, Mumbai 400 013, India. Phone: +91-22-3043 3000 Fax: +91-22-3043 3100