Embed Size (px)
Citation preview
Discovery Education Assessment K-HS Benchmark Assessments in ELA and Mathematics
What reports of student scores are available and how soon is each report available? Discovery Education Assessment produces multiple standard report formats to coincide with each interim assessment, as well as dynamic district reports. Interactive reports are linked to recommended digital remediation selected from Discovery Education’s award-winning Streaming service. Discovery Education Assessment recognizes the tremendous value in prompt, easy-to-read reports that allow all stakeholders, including students, parents, teachers, administrators and district staff, to instantly determine how learning is progressing. Reports are available immediately upon completion of student test administration. See the attached document (2014 DEA Sample Reports) for more information regarding the various student, class, teacher, and district level reports available from Discovery Education Assessment, including:
Class summary report Student skill report Student subskill report Answers report Item summary report Individual student report Drill down report Subgroup/disaggregated report Comparative growth report School comparison report Item analysis report
DiscoveryEducation.com 800-323-9084
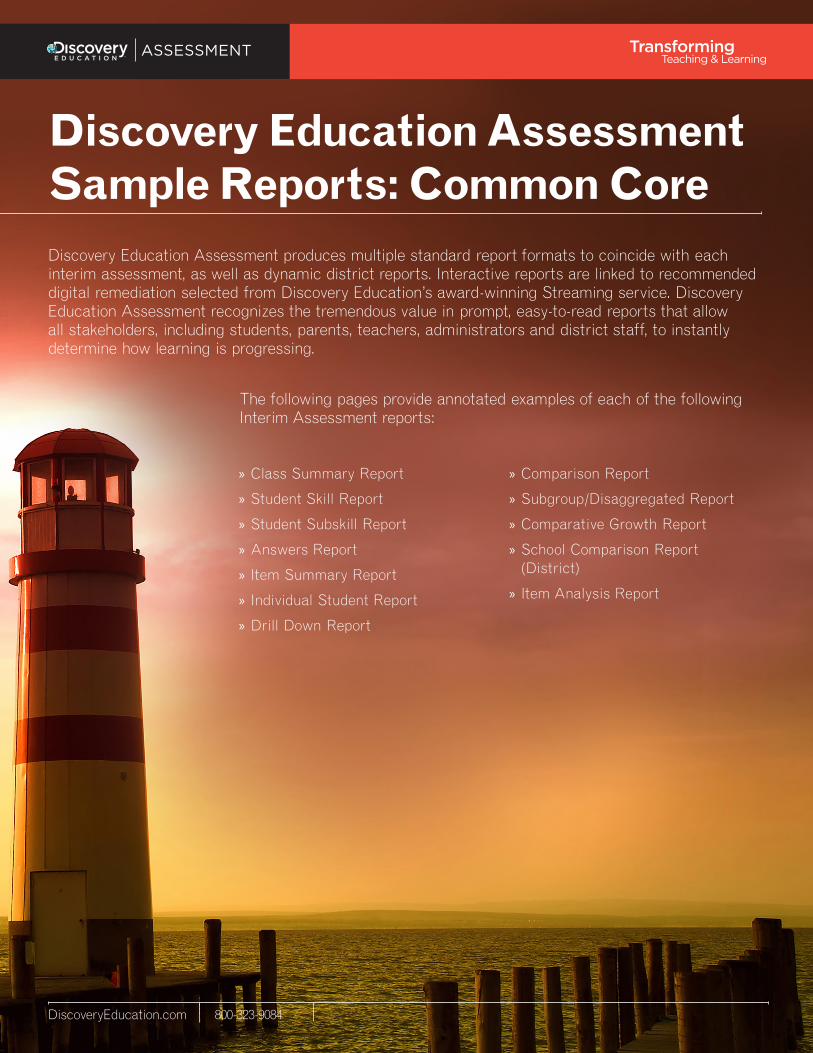
Discovery Education Assessment Sample Reports: Common Core
» Class Summary Report
» Student Skill Report
» Student Subskill Report
» Answers Report
» Item Summary Report
» Individual Student Report
» Drill Down Report
» Comparison Report
» Subgroup/Disaggregated Report
» Comparative Growth Report
» School Comparison Report (District)
» Item Analysis Report
Discovery Education Assessment produces multiple standard report formats to coincide with each interim assessment, as well as dynamic district reports. Interactive reports are linked to recommended digital remediation selected from Discovery Education’s award-winning Streaming service. Discovery Education Assessment recognizes the tremendous value in prompt, easy-to-read reports that allow all stakeholders, including students, parents, teachers, administrators and district staff, to instantly determine how learning is progressing.
The following pages provide annotated examples of each of the following Interim Assessment reports:
DiscoveryEducation.com 800-323-9084
Class Summary Report
Student Skill Report
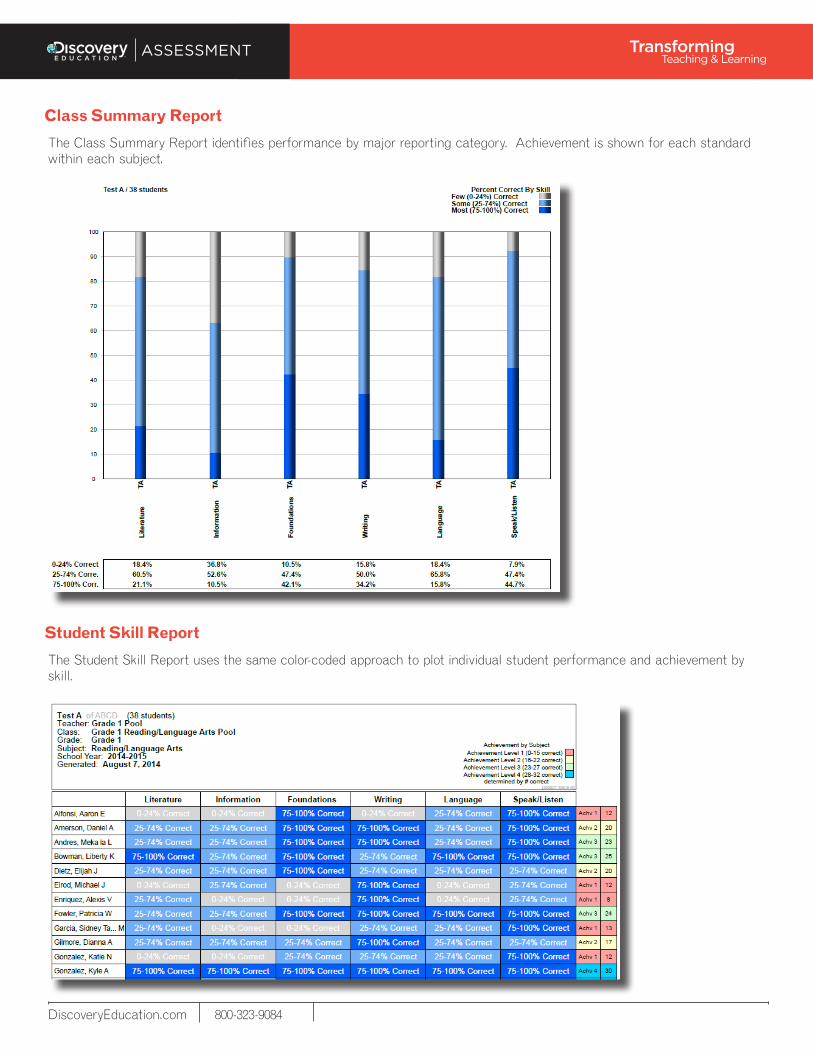
The Class Summary Report identifies performance by major reporting category. Achievement is shown for each standard within each subject.
The Student Skill Report uses the same color-coded approach to plot individual student performance and achievement by skill.
DiscoveryEducation.com 800-323-9084
Student Subskill Report
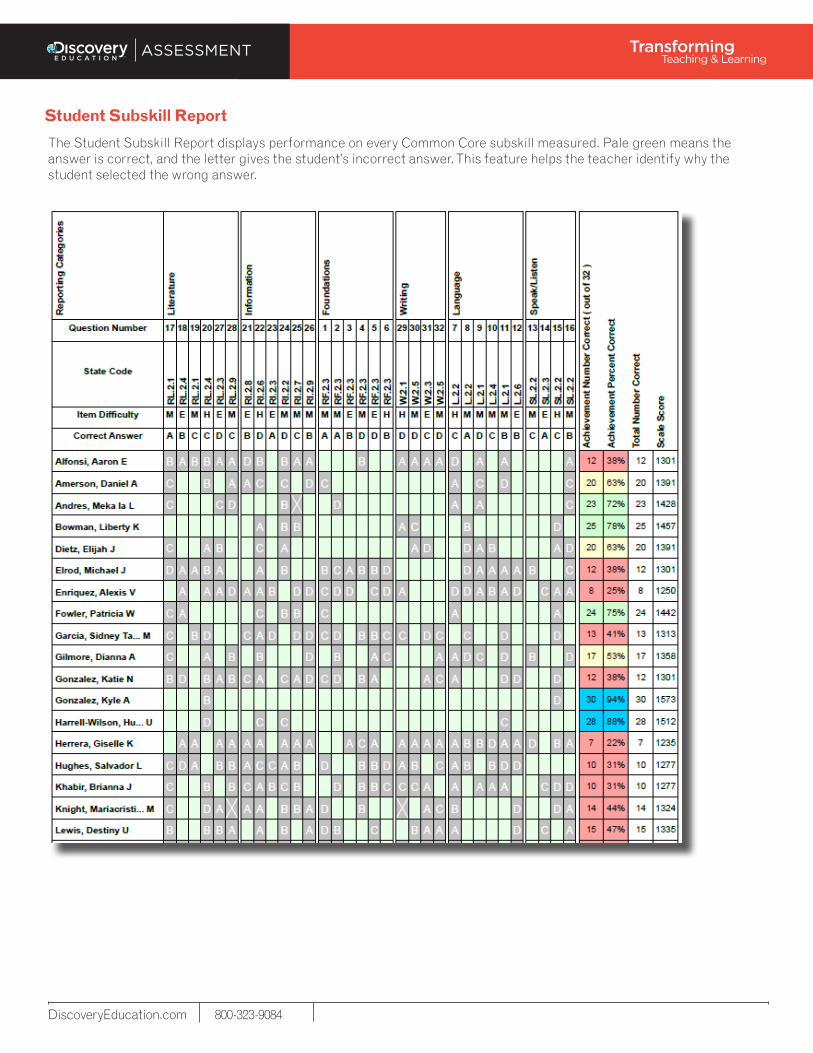
The Student Subskill Report displays performance on every Common Core subskill measured. Pale green means the answer is correct, and the letter gives the student’s incorrect answer. This feature helps the teacher identify why the student selected the wrong answer.
DiscoveryEducation.com 800-323-9084
Answers Report
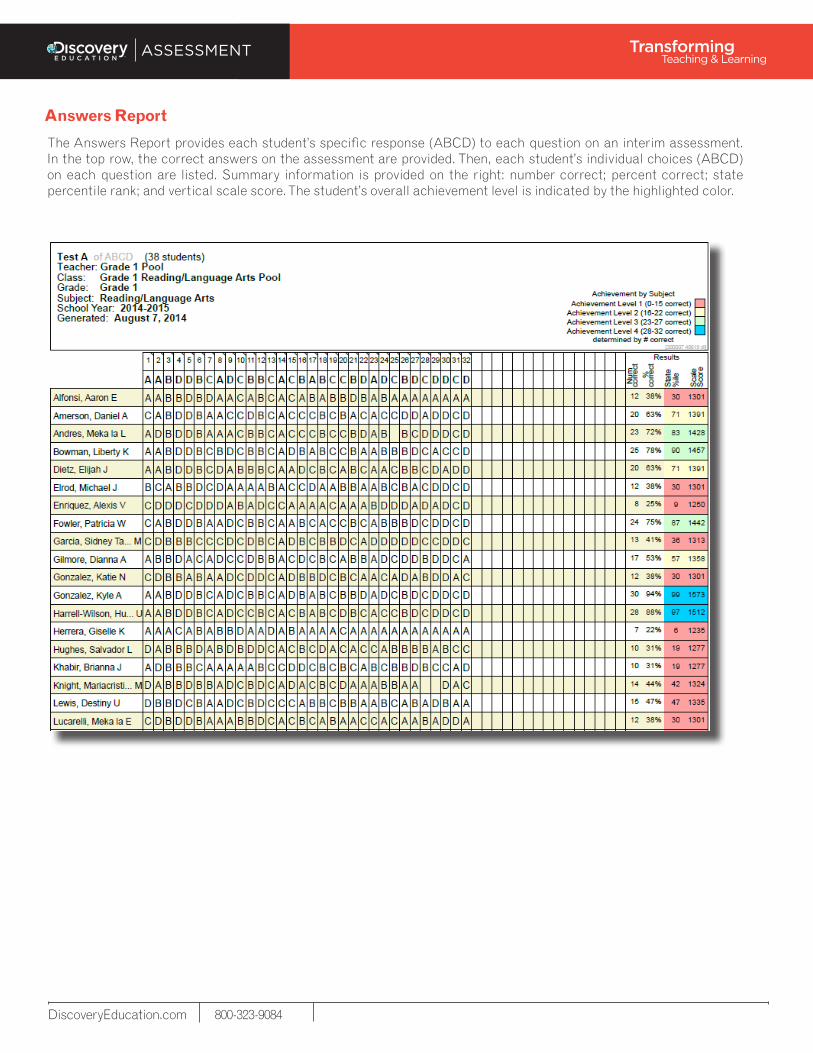
The Answers Report provides each student’s specific response (ABCD) to each question on an interim assessment. In the top row, the correct answers on the assessment are provided. Then, each student’s individual choices (ABCD) on each question are listed. Summary information is provided on the right: number correct; percent correct; state percentile rank; and vertical scale score. The student’s overall achievement level is indicated by the highlighted color.
DiscoveryEducation.com 800-323-9084
Item Summary Report
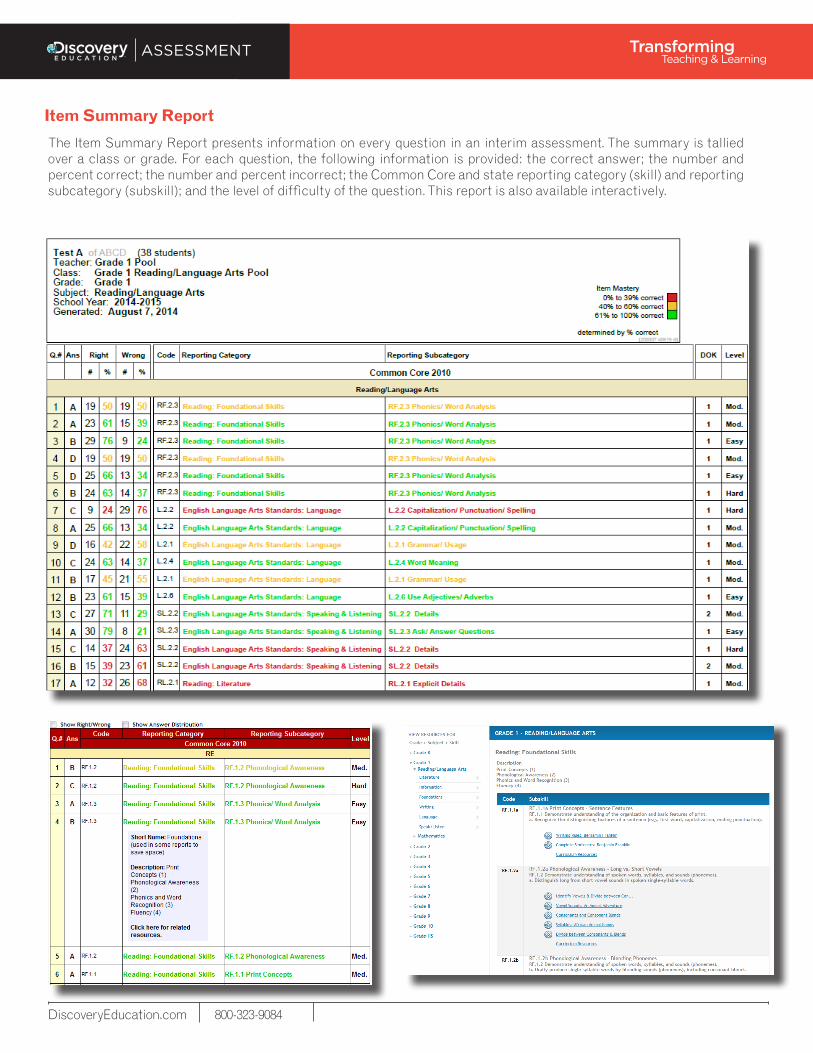
The Item Summary Report presents information on every question in an interim assessment. The summary is tallied over a class or grade. For each question, the following information is provided: the correct answer; the number and percent correct; the number and percent incorrect; the Common Core and state reporting category (skill) and reporting subcategory (subskill); and the level of difficulty of the question. This report is also available interactively.
DiscoveryEducation.com 800-323-9084
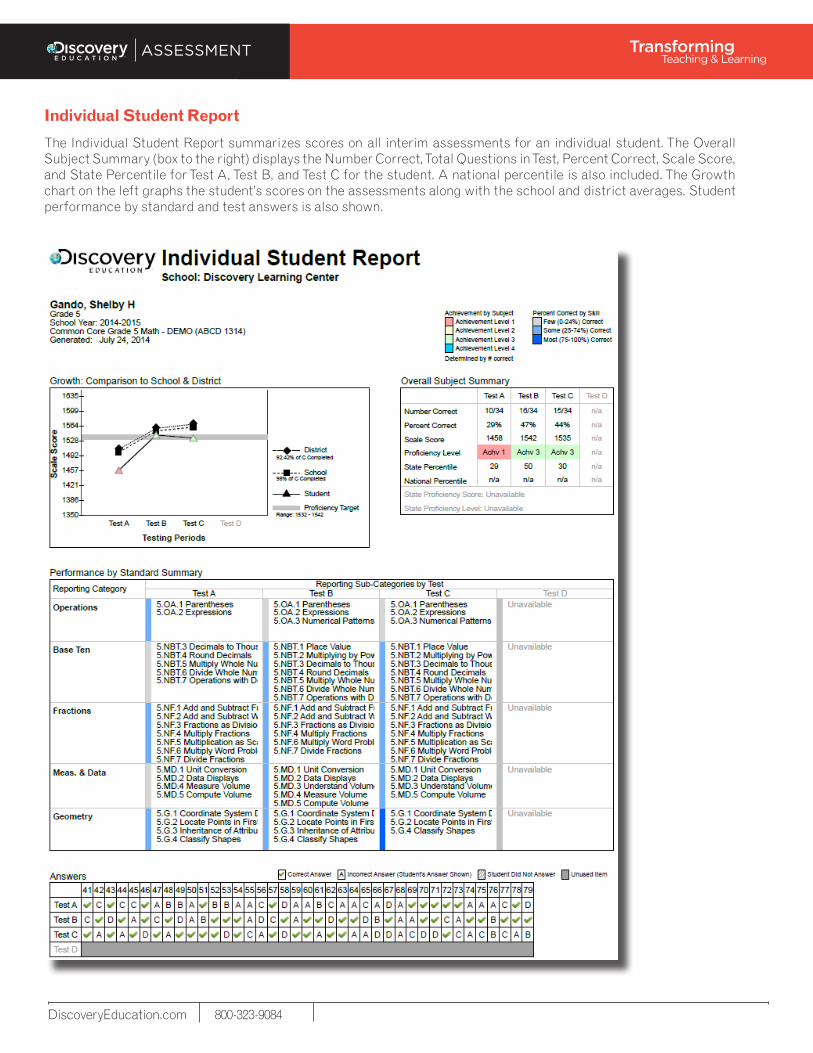
Individual Student Report
The Individual Student Report summarizes scores on all interim assessments for an individual student. The Overall Subject Summary (box to the right) displays the Number Correct, Total Questions in Test, Percent Correct, Scale Score, and State Percentile for Test A, Test B, and Test C for the student. A national percentile is also included. The Growth chart on the left graphs the student’s scores on the assessments along with the school and district averages. Student performance by standard and test answers is also shown.
DiscoveryEducation.com 800-323-9084
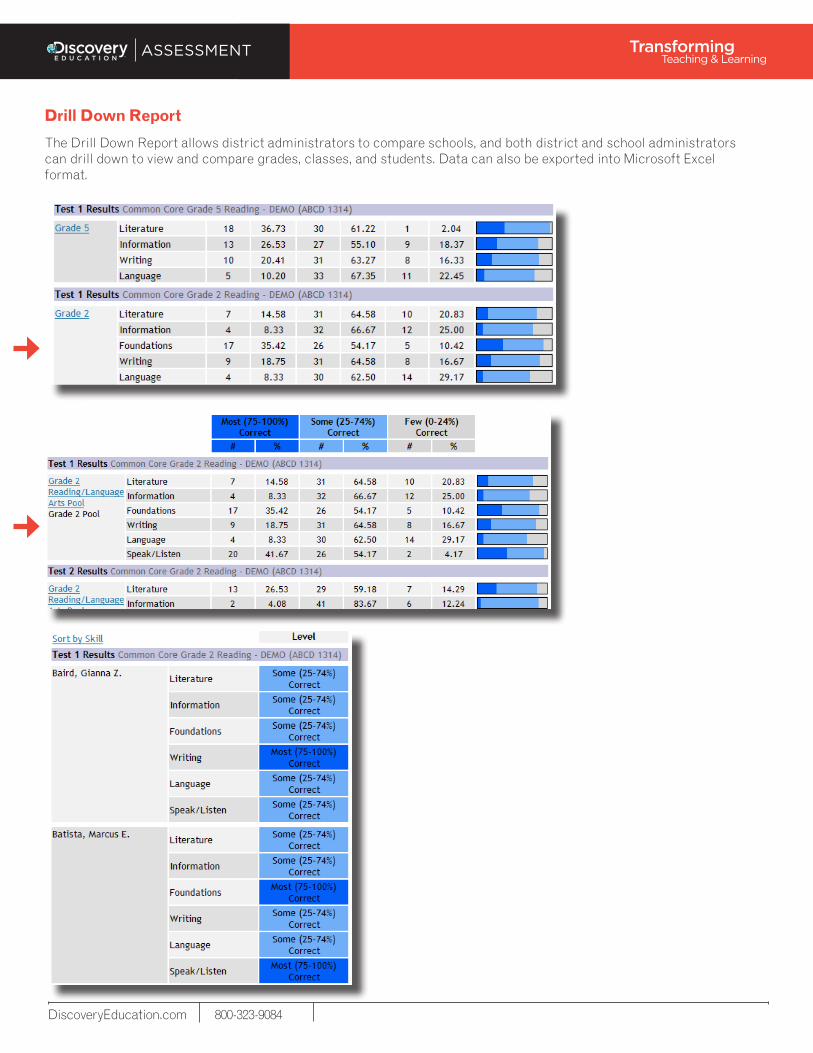
Drill Down Report
The Drill Down Report allows district administrators to compare schools, and both district and school administrators can drill down to view and compare grades, classes, and students. Data can also be exported into Microsoft Excel format.
DiscoveryEducation.com 800-323-9084
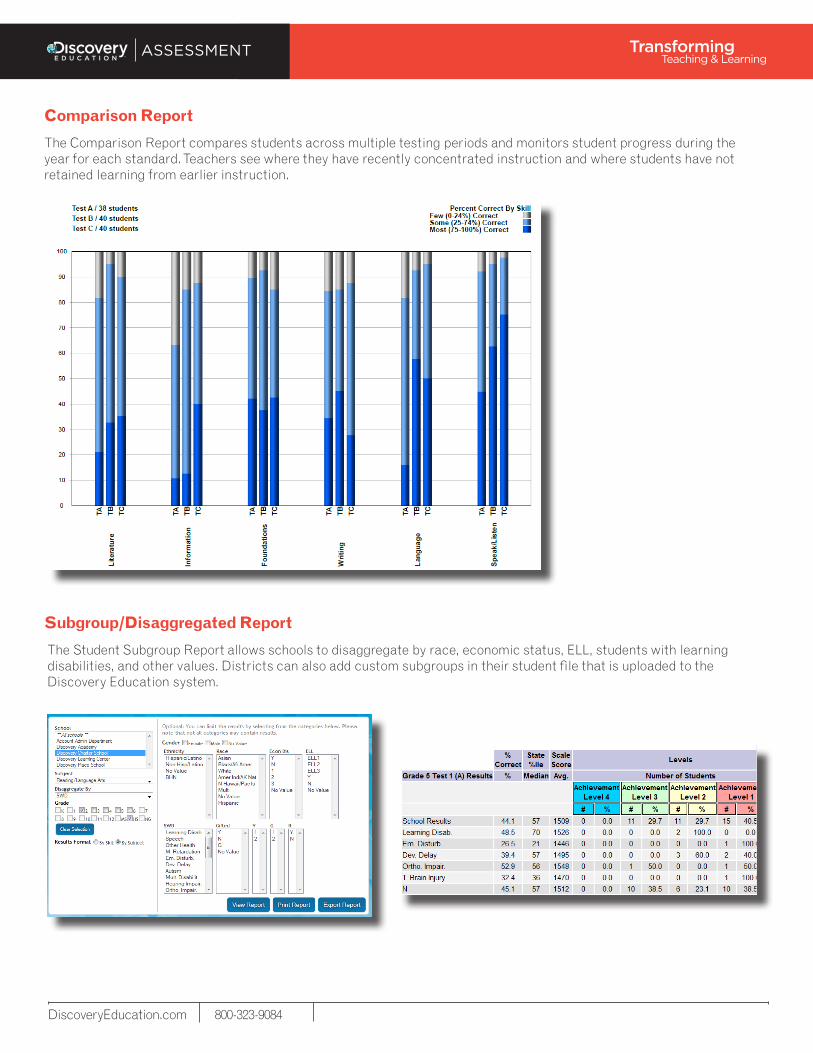
Comparison Report
The Comparison Report compares students across multiple testing periods and monitors student progress during the year for each standard. Teachers see where they have recently concentrated instruction and where students have not retained learning from earlier instruction.
Subgroup/Disaggregated Report
The Student Subgroup Report allows schools to disaggregate by race, economic status, ELL, students with learning disabilities, and other values. Districts can also add custom subgroups in their student file that is uploaded to the Discovery Education system.
DiscoveryEducation.com 800-323-9084
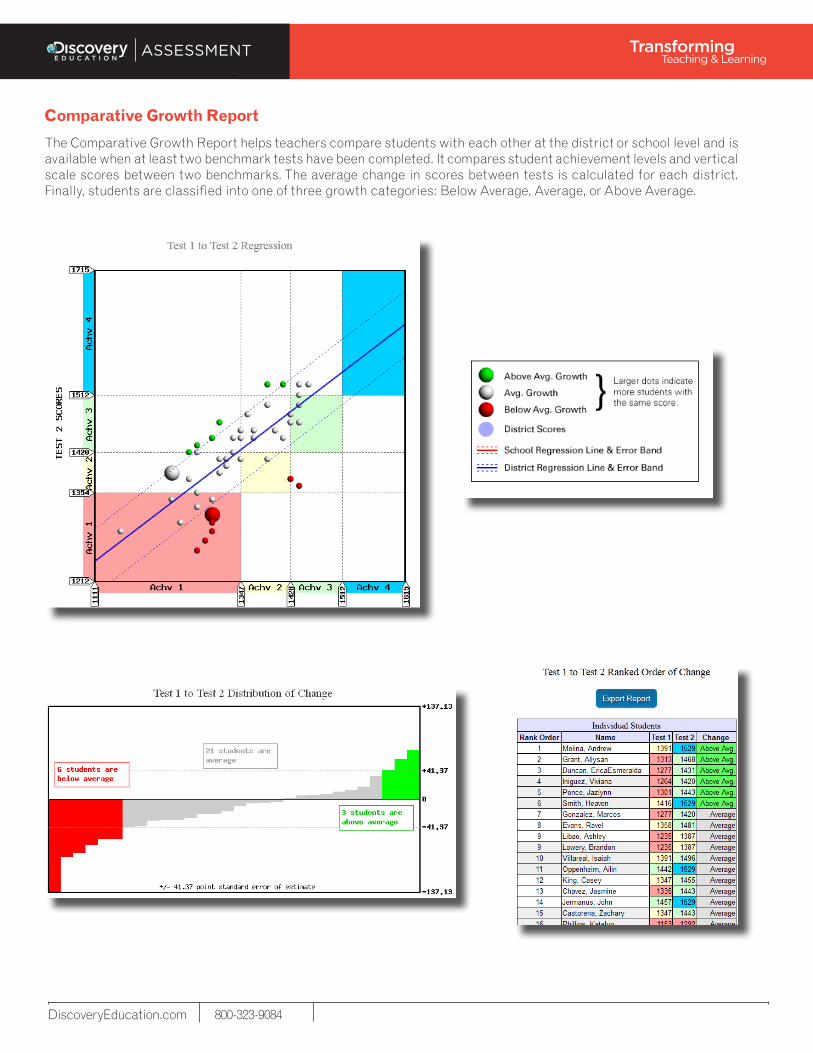
Comparative Growth Report
The Comparative Growth Report helps teachers compare students with each other at the district or school level and is available when at least two benchmark tests have been completed. It compares student achievement levels and vertical scale scores between two benchmarks. The average change in scores between tests is calculated for each district. Finally, students are classified into one of three growth categories: Below Average, Average, or Above Average.
DiscoveryEducation.com 800-323-9084
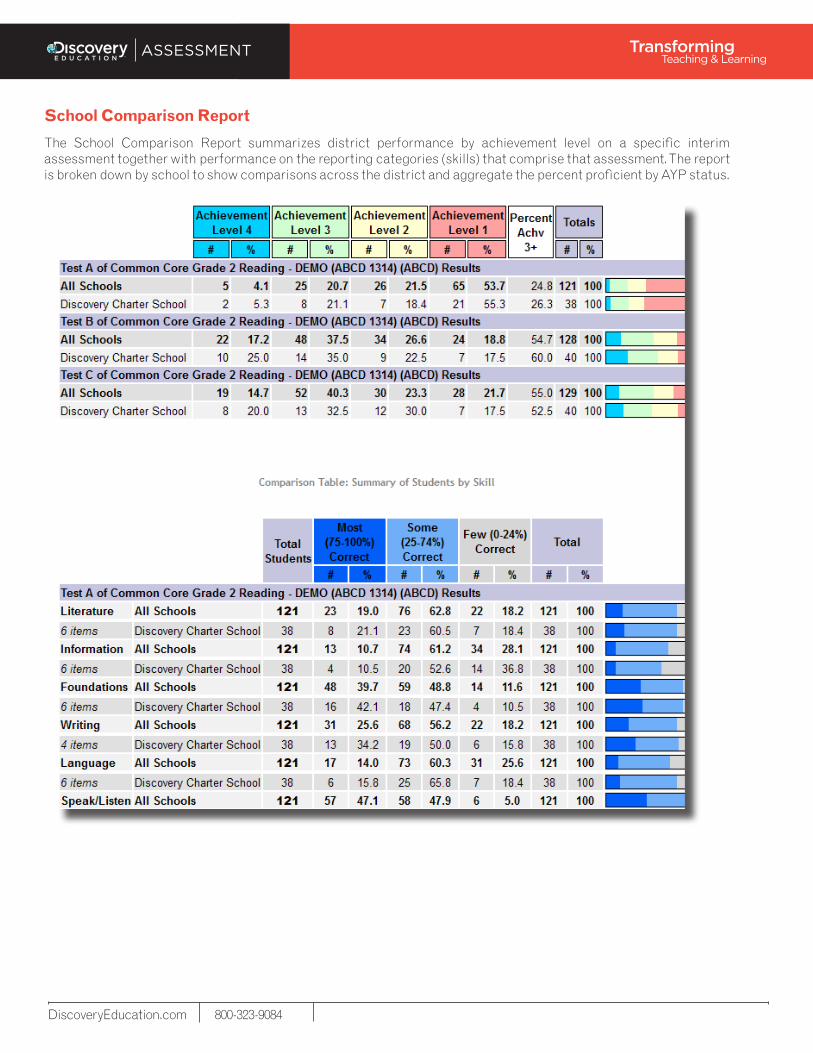
School Comparison Report
The School Comparison Report summarizes district performance by achievement level on a specific interim assessment together with performance on the reporting categories (skills) that comprise that assessment. The report is broken down by school to show comparisons across the district and aggregate the percent proficient by AYP status.
DiscoveryEducation.com 800-323-9084
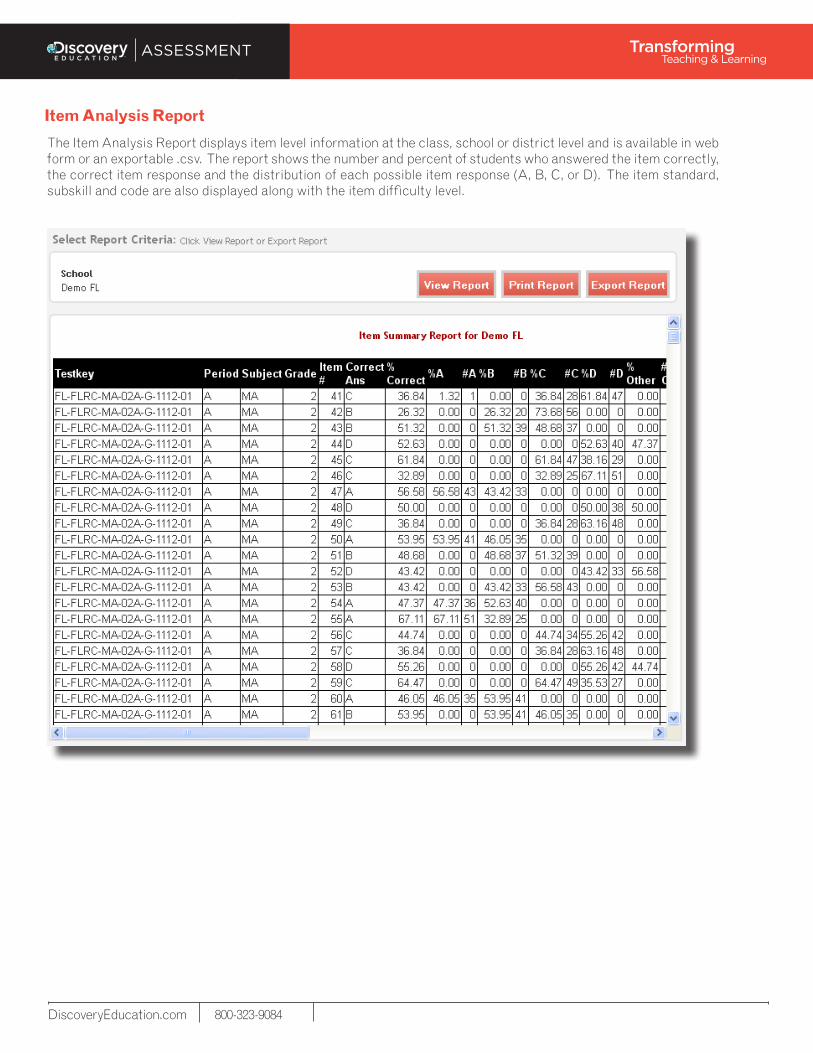
Item Analysis Report
The Item Analysis Report displays item level information at the class, school or district level and is available in web form or an exportable .csv. The report shows the number and percent of students who answered the item correctly, the correct item response and the distribution of each possible item response (A, B, C, or D). The item standard, subskill and code are also displayed along with the item difficulty level.