Embed Size (px)
Citation preview

Discovery and Mapping of the Dutch National
Critical IP InfrastructureResearch Project 2
Fahimeh Alizadeh, Razvan C. Oprea
Supervised by:
Benno Overeinder, NLnet LabsMarco Davids, SIDN
August 10, 2013
Abstract
The research project entails the mapping and subsequent analysisof the AS-level interconnections between the organisations active as theDutch critical infrastructure. The discovery of the organisations’ AS rep-resentation utilises exclusively public sources of information and uses atwo-pronged approach. First, a bottom-up process is used—starting fromthe complete list of Dutch ASNs we select the ones corresponding to Dutchcritical organisations. Second, a top-down approach—starting from a listof representative Dutch critical infrastructure organisations we find theirAS-level network representation. We use the UCLA’s AS topology mapfiles based on BGP routing tables and updates for determining the AS-level interconnections between critical sector organisations. We then im-plement a visualisation method for constructing the network graphs foreach critical sector and analyse their interconnections. We conclude thatthe Dutch critical infrastructure organisations are well interconnected butrely a lot on foreign entities for IP transit and even for carrying potentiallysensitive information via web and email services.

Contents
1 Introduction 11.1 Research question . . . . . . . . . . . . . . . . . . . . . . . . . . . 21.2 Outline . . . . . . . . . . . . . . . . . . . . . . . . . . . . . . . . 2
2 Previous Work 4
3 AS Discovery 53.1 Bottom-up AS Discovery Approach . . . . . . . . . . . . . . . . . 53.2 Limitations of the Bottom-up AS Discovery Approach . . . . . . 83.3 Top-down AS Discovery Approach . . . . . . . . . . . . . . . . . 83.4 Limitations of the Top-down AS Discovery Approach . . . . . . . 9
4 ASNs Interconnection Discovery 10
5 ASNs Network Visualization 135.1 Technical Considerations . . . . . . . . . . . . . . . . . . . . . . . 13
5.1.1 D3.js Library . . . . . . . . . . . . . . . . . . . . . . . . . 145.1.2 Sigma.js Library . . . . . . . . . . . . . . . . . . . . . . . 15
6 Data Analysis 19
7 Conclusions 26
I

List of Tables
1 The Dutch critical infrastructure sectors . . . . . . . . . . . . . . 22 Distribution of Mail providers in each sector . . . . . . . . . . . . 24
List of Figures
1 The RIPE NCC’s stats file (excerpt). . . . . . . . . . . . . . . . . 62 Distribution of Dutch AS numbers . . . . . . . . . . . . . . . . . 73 UCLA IRL map file (excerpt). . . . . . . . . . . . . . . . . . . . 114 Constructing the ASN relationships graph (fictive critical sector). 135 (x,y) selection for each node . . . . . . . . . . . . . . . . . . . . . 166 Two versions of node positioning (left one optimised) The chem-
ical and nuclear industries critical sector . . . . . . . . . . . . 177 (x,y) selection for each node (with foreign and Dutch ASNs sep-
arately positioned) . . . . . . . . . . . . . . . . . . . . . . . . . . 178 Energy critical sector without providers . . . . . . . . . . . . . . 199 Energy critical sector with providers . . . . . . . . . . . . . . . . 2010 Food critical sector with providers . . . . . . . . . . . . . . . . . 22
II

1 Introduction
Critical infrastructure has always been one of the primary topics of interest forgovernments, because it plays the crucial role in either national or internationalwide economy and welfare level in society. The best way for governments toprotect and extend the critical infrastructure is first to have a complete un-derstanding of the existing essential infrastructure, and second to analyse itsresilience and determine future improvements.
The protection of critical infrastructure, basically aimed at country safe-guarding and reducing weaknesses and risks of critical infrastructure, must in-clude the dependencies and connections between the various critical sectors.However, as shown below, the protection of the critical infrastructure has notbeen formalised until relatively recently.
Starting with the 1996 Executive Order 13010 - Critical Infrastructure Pro-tection issued by President William J. Clinton, creating a president’s Commis-sion on Critical Infrastructure Protection and defining eight critical sectors [1],governments formalised the protection plans of critical infrastructure sectors.
In the Netherlands, up to the beginning of this century, the critical infras-tructure protection was not a concern at the highest level [21]. At the end of the90’s, an initiative to protect the national critical infrastructure started withinthe Dutch Ministry of Defence, each infrastructure sector being responsible forits own critical infrastructures, with no central state organisation to coordinatenational critical infrastructure protection measures.
In 2002, the Dutch government started the Critical Infrastructure Protec-tion (CIP) project “Bescherming Vitale Infrastructuur” with the objective “Thedevelopment of an integrated set of measures to protect the infrastructure ofgovernment and industry” (which included Information and CommunicationTechnology) [24].
More recently, a policy letter Protecting Critical Infrastructure (2005) andthe third progress letter on National Security (2010) includes an analysis ofthe quality of protection of critical infrastructure [9]. Critical infrastructure isdefined as comprising “the business enterprises and public bodies that providethe goods and services essential for the day-to-day lives of most people in theNetherlands”. Critical infrastructure is divided into 12 critical sectors, with atotal of 31 essential goods and services. Table 1 represents the Dutch criticalsectors as they are defined by the Dutch government.
Since the protection of the national critical infrastructure is formalised ingovernment policies, some legitimate questions arise relating to the network in-terconnections between these organisations: how well interconnected are theyand how reliable are these network links? Can we graph and visually analysethese network interconnections? What conclusions can we draw? The answersto these questions are a sound starting point for organising more suitable de-fence strategies and taking weakness points into account to reduce the risks andthreats.
The main goals of this research are thus the discovery, visualisation andanalysis of the AS-level network relationships between the Dutch organisations
1

Category Critical Sectorenergy electricity, natural gas, oiltelecommunicationsand ICT
land-line and mobile telephony, radio, broadcasting,Internet
drinking water the water supplyfood the food supply (including in supermarkets), food
safetyhealth emergency and hospital care, medicines, vaccinesfinancial sector payments and money transfers by public bodiessurface water man-agement
water quality and quantity (control and manage-ment)
public order andsafety
public order and safety
legal order the courts and prisons, law enforcementpublic administra-tion
diplomacy, public information, the armed forces,decision-making
transport Amsterdam Schiphol Airport, the port of Rotter-dam, highways, waterways, railways
the chemical andnuclear industries
the transport, the storage, the production, the pro-cessing of materials
Table 1: The Dutch critical infrastructure sectors
that are part of these critical sectors.
1.1 Research question
The main goal of this research project can be summarised in the followingquestion:
Can we discover and map the Internet entities corresponding tothe Dutch national critical infrastructure with a sufficient degree ofconfidence?
We also set additional goals defined in the following two sub-questions:
• What are the authoritative source(s) of information when dis-covering the Internet presence of an organization?
• What can be said of the resilience of the Dutch critical infras-tructure IP-level network?
1.2 Outline
Section 2 reviews the related research that has been done on this topic and how itdiffers from this project’s approach. Section 3 and 4 introduce the methodologyused to discover the relevant AS numbers and to determine the relationshipsbetween them. It details on different approaches used in the research to obtainresults with a higher degree of confidence. The visualisation techniques usedfor creating AS-level graphs of different critical sectors is described in section5. AS-level graphs created from the aggregated collected information are then
2

analysed in section 6. The conclusions are drawn based on the research findingsin section 7.
3

2 Previous Work
Critical infrastructure protection and Internet interconnection resilience havebeen studied previously separately:
1. During the past two decades the interest in the protection of the nationalcritical infrastructure started growing in the United States and Europeand was formalised in policy documents, as shown in Section 1.
2. There are also a number of research papers focused on studying the In-ternet interconnection resilience, such as the April 2011 study “Inter-X:Resilience of the Internet Interconnection Ecosystem” by the EuropeanNetwork and Information Security Agency (ENISA) [23]. The study anal-ysed many potential threats to the Internet interconnections, ranging fromthe sustainability of the economic model to cascading technical failures,equipment reliability, coordinated BGP attacks, and human infrastructureneeded to maintain it during a pandemic flu.
3. Association francaise pour le nommage Internet en cooperation (AFNIC)started publishing since 2011 a report on the resilience of the French In-ternet. Their latest report [22] is more focused on the technical attackvectors, such as IP prefix hijackings, RPKI, and DNSSEC.
However, there are few previous research papers we found relevant to thesubject we focused on — the analysis and visualisation of the critical infrastruc-ture at a network level. Or at least, there are few public papers on the subject.
The exception we found is the 2012 paper “Exposing a Nation-Centric Viewon the German Internet — A Change in Perspective on the AS Level” [25].
In their research they have started from the list of IP prefixes allocated toorganisations registered in Germany and then they used RIPE Database, TeamCymru and RIPE RIS to find the originating AS numbers. The AS intercon-nections were then discovered using BGP dumps. This 2012 paper was the firststudy we found that analysed the AS-level relationship between entities part ofa national critical infrastructure.
In comparison with this paper, our research is, in some ways, more limitedin scope by the public nature of our sources of information — we do not knowfor instance, which IP blocks some organisations use internally. On the otherhand, we extend the scope of the research by including an analysis of many ofthe foreign ASes which act as proxies for web and mail services provided bycritical infrastructure Dutch companies.
Additionally, we have detailed in our report a method for building a graphof the ASN relationships and visually analysing the interdependencies.
4
3 AS Discovery
We have no idea on the organisations’ physical connections to the Internet, butsince we are interested in the logical IP topology, we decided to work strictly atthe AS level.
The ideal resource for our research would be getting a complete and accuratemapping of critical sector infrastructure organisations with their respective ASnumbers. While it is expected that all critical infrastructure-related organisa-tions have some Internet presence, one cannot assume that all of them will beusing their own AS number. Some might have their online presence (such aswebsite and email servers) hosted by organisations which access the Internetvia a certain AS number (we refer to such AS as a“proxy” AS) — and some ofthese proxy ASes can be located outside of the Netherlands.
There was a need for mapping AS numbers which encompass all these pos-sibilities — and we used two methods for achieving this. Once the AS numbersare determined, the interconnections between them are discovered and the re-sults can be analysed.
Below is a description of the steps related to the methodology we employed.
1. Bottom-up AS discovery approach
The first method for AS discovery is a “bottom-up” approach: startingfrom the list of all AS numbers allocated to organisations registered inthe Netherlands, we select those which are active in one of the 12 criticalinfrastructure sectors. This approach is intended to identify all critical in-frastructure Dutch organisations that have their own AS number (“native”AS).
2. Top-down AS discovery approach
The second approach for AS discovery is a “top-down” approach: wesearch for representative (prominent) instances of critical sector organisa-tions in the Netherlands and then find out whether they have a native AS(in which case we should see the organisation also listed in the bottom-upapproach) or they use a proxy AS.
For the latter case we look up the IP address of their A, AAAA, and MXDNS records and then identify the larger IP prefix they are part of andthe AS number announcing this IP prefix — this is the proxy AS.
3. Analysis and visualization
In this third step we combine the results of the previous two AS discoveryapproaches and look for all the relationships between the AS numbers.We analyse the resulting data, we visualise it, and draw conclusions.
3.1 Bottom-up AS Discovery Approach
As mentioned in Section 2, in an earlier research [25], AS numbers were de-termined (using a variety of tools such as the RIPE WHOIS database, TeamCymru, etc.) from IP prefixes.
5

The ideal scenario is finding an authoritative source of information thatwould offer us the AS information without going through the complex loop ofIP prefix-to-AS mapping. The RIPE NCC publishes a daily updated stats fileon their public FTP site [12] which contains, among other information, all theAS numbers allocated to all the organisations in the RIPE service region [13].Since the RIPE NCC is the sole organisation that hands out AS numbers in theservice region the Netherlands is part of, this makes the stats file an authorita-tive source of information.
Figure 1 shows an excerpt from the RIPE NCC’s stats file.
Figure 1: The RIPE NCC’s stats file (excerpt).
It can be observed in the stats file that the AS numbers are allocated to or-ganisations registered in different countries in the RIPE NCC service area. Outof these, our interest is in the organisations registered in the Netherlands (NLcountry code) and European Union (EU). While the NL allocations are easy toextract from the file, the EU ones could potentially correspond to organisationsregistered in any of the 28 European Union countries.
To select the Dutch organisations from the EU-labelled ones (around 1,400entries), we wrote and used a script which queried every entry against the RIPEWHOIS Database [15] and looked for country codes in the “Description” and“Address” fields. Any discrepancies or corner cases are then manually reviewed.
We thus obtained a (complete, as far as we can tell) list of 727 AS numbersallocated to organisations in the Netherlands. The next step is determiningwhich of these organisations are part of the Dutch critical infrastructure. Asshowed in Section 1, the Dutch government decided which economic sectors andgoods and services represent the national critical infrastructure. Unfortunately,there isn’t any way of determining the organisations-to-critical sector mapping.First, we needed to determine every organisation’s domain name and website
6

and manually review it to classify it.
We searched each one of the 727 AS numbers using Google, RIPEstat andthe Dutch Chamber of Commerce (Kamer van Koophandel [19]), labelled theorganisations based on the 12 sectors and 31 goods and services, according tothe classification done by the Dutch government, from A (Energy sector) to L(Chemical and Nuclear industries).
We observed that some organisations had several AS numbers registered ontheir name or their subsidiaries (we found subsidiaries using the KvK data) —for instance, SURFnet has over 60 AS numbers, while Koninklijke KPN N.V.(KPN) has almost 20.
We also noticed that the number of AS numbers in the Internet sector isdisproportionately high compared with the total number of “Dutch” ASNs.Unlike non-ICT sectors where relatively big organisations do not have theirown AS number, in ICT even the smallest entities sometimes have a nativeAS. We realised that we cannot claim that every single ICT-related companyis part of the national critical infrastructure only because it is classified as anICT sector company. We therefore decided to exclude companies which do nothave their own infrastructure: purely VoIP providers, hosting companies, ITservice providers — including Software-as-a-Service (SaaS) and Platform-as-a-Service (PaaS) providers, IT consultancy, education and research institutions.We included only Internet Service providers (ISPs), Data Centres and InternetExchange Points (even if their AS number is not related to the core service theyprovide).
We thus ended up with a list of 335 AS numbers related to critical infras-tructure sector organisations, out of which 265 AS numbers relate to the ICTsector (Internet in particular), as shown in Figure 2.
Figure 2: Distribution of Dutch AS numbers.
7

3.2 Limitations of the Bottom-up AS Discovery Approach
This approach has some limitations as well:
1. We do not know if all the AS numbers an organisation uses relate to criti-cal infrastructure-related operations. However, if for instance, we classifyKPN as a critical infrastructure organisation, we label all of its AS num-bers (and of its subsidiaries) as such. Taking into account the fact thatKPN can use and reuse its AS numbers as it sees fit and no outside partycan control this, there is not a better alternative to marking all of itsdiscovered AS numbers with the same label.
2. We have limited information regarding companies ownership, since we relyon two main public sources of information. On one hand we are are re-stricted to the information provided in the RIPE WHOIS database, whichis updated by the users and where the information regarding mergers, ac-quisitions and bankruptcies is updated with significant delays. On theother hand, we rely on the KvK data, which is precise, however manytimes difficult to understand which organisation is the owning which one.We did the best we could to understand the relationships between organ-isations, an effort which will prove useful when we later gather all the ASrelationships related to several AS numbers in one “virtual ASN”.
3.3 Top-down AS Discovery Approach
As described in the previous section, the bottom-up approach, while discover-ing all the Dutch AS numbers, resulted in a very distorted map of the criticalinfrastructure. For instance, there was notany organisation discovered in the“Surface Water” critical infrastructure sector.
We therefore started the discovery process from the opposite direction —starting with a list of companies we knew they were part of the critical in-frastructure. The selection came from multiple sources — through commonknowledge, Wikipedia, Google, etc., trying to have samples from each sector.The search yielded a total number of 147 organisations.
After the completion of this step, the KvK website was consulted again toidentify the corresponding domain name for each company in turn.
Since we had decided we will only use publicly available information, weare not privy to what IP address space critical sector organisations are usinginternally. Applying for access to such privileged information, besides the smallchances of approval, would have delayed the project too much and it would haverestricted the distribution of its results.
An obvious source of information, given a domain name, is represented by itsDNS records. Of the available ones, the interesting ones are those that indicateinformation flow.
For instance, if we consider that a fictive energy company has its A and MXrecords pointing to an IP address (part of a IP prefix) allocated to a foreignorganisation, then we can safely assume that the website and (external) mail
8

servers (MTA) of this particular energy company are hosted by the foreign en-tity. Even if the hosted website is just a front-end interface, while the databasesand storage stores are not externalised (a very likely scenario), there is dataflow from inside the company to the foreign entity (web site updates) and likelyfrom outside to the inside (for example web forms, access statistics, etc.). Incase of mail, it is even more obvious — while internal company mail could berestricted to the internal network, every incoming mail from a different domainwould have to pass through the mail servers indicated by the MX records (theforeign entity).
This is not the case with other types of DNS records — there is no trafficexchanged between a company’s internal network and the machines identifiedby the NS records, for instance, except for DNS updates. Same could be saidof other types of DNS records, such as SRV and TXT.
We concluded therefore that the A, AAAA, and MX records are the oneswe should focus on. We queried for the AAAA record to cover for the cornercase in which an organisation’s web site is reachable over IPv4 on a certain webhost and via IPv6 on another. We used the Internet Systems Consortium “dig”utility for gathering the IP addresses corresponding to these DNS records, andthen RIPEstat to find the prefix they are part of and the originating AS (theproxy AS).
3.4 Limitations of the Top-down AS Discovery Approach
Besides the already mentioned observation that we only work with publicly ac-cessible data, there are some other limitations of this approach:
1. We do not see any backup and private links the organisations might have.The only visible information, except for the discovery of a native AS (whichwould have been seen already from the bottom-up approach), is repre-sented by the A, AAAA, and MX DNS records.
2. Complete mapping of critical sector industries requires specialised knowl-edge. In the critical sector “Food”, for instance, one could consider almostall organisations in the food supply chain as being part of the critical in-frastructure. And there are many, many different organisations — breed-ing companies, animal food manufacturers, pig farms, slaughterhouses,food transport companies, butcheries, supermarkets. A complete list ofnational critical infrastructure organisations could only be obtained usingspecialised knowledge (potentially via industry associations ) or privilegedinformation (via for instance the Chamber of Commerce).
9

4 ASNs Interconnection Discovery
The combined results of the two approaches for AS discovery, bottom-up andtop-down give us a “master” list of AS numbers. This list represents all theAS numbers allocated to organisations registered in the Netherlands (via thebottom-up approach) and a representative selection — almost 150 hand-pickedorganisations (via the top-down approach).
Our next goal is to see what kind of relationships (interconnections or links)exist between all these AS numbers allocated to Dutch critical infrastructureorganisations. At an AS level, this kind of information can be obtained viathe BGP tables. But a more accurate view on these links can be obtained byusing multiple observation points — and there are few methods for obtainingmulti-views on the BGP links:
• Routing Information Service (RIS) [14] is a RIPE NCC project that col-lects and stores Internet routing data from 14 locations around the globe.It is using servers acting as software routers called Remote Route Collec-tors (RRC) that collects default free BGP routing information from manyparticipating peers.
• Route Views is a project of the University of Oregon [20]). In a fashionsimilar to RIPE RIS, it operates data collectors throughout the world.Collectors serve as real-time operational tools, as well as data sources forthe RouteViews central data archive. It was originally created to help ISPsdebug and optimise their networks, nowadays it is also used in academicresearch.
• Route Servers — some organisations still install publicly-accessible routersdesigned to peer with as many parties as possible for the benefit of thenetworking community. Network operators can access these routers usingTelnet or SSH and run a variety of commands (ping, traceroute) or lookat the routing tables to help them troubleshoot network problems or get abetter understanding on AS topology. Routeserver.org [11] and BGP4.net[8] provide lists of public route servers across the globe.
• Looking Glasses — some operators allow public access to some routersvia web CGI’s which provide a view into the BGP table of that partic-ular router. BG4.net [3] has a rather large list of looking glasses serversworldwide. Similarly to the observation made with the route servers, thereare services which aggregate the information provided by several lookingglasses into one master BGP routing table.
Among the services that aggregate the data from RIPE RIS, Route Views,route servers and looking glasses three stand out: The University of California,Los Angeles (UCLA) Internet Research Lab, The Cooperative Association forInternet Data Analysis (CAIDA) and University of Washington’s iPlane.
We looked the type of data provided by each one of these sources:
• University of Washington’s iPlane [7] is more geared towards measuringlinks performance (latency, bandwidth, capacity, loss rates) than a com-plete AS-level topology. Nevertheless, an AS map is being constructed and
10

updated daily by using traceroute from different vantage points (Planet-Lab nodes and traceroute servers).
• CAIDA collects several different types of data from various vantage pointsand makes this data available to the research community by publishing iton their website [18] We were particularly interested in the AS relation-ships data [2], with the latest version of the file dated June 2012. CAIDAwas also able to specify the confidence they have in the type of AS rela-tionship data: “99.1% of the links we infer to be provider-customer arevalidated to be provider-customer, with the correct direction. 94.7% ofthe links we infer to be peer-peer are validated to be peer-peer.”
• UCLA’s Internet Research Lab [6] released daily AS topology map filesbased on BGP routing tables and updates (RIPE RIS, Route Views),Route Servers and Looking Glasses. UCLA released node files (lists ofAS numbers), links files (relationships between AS numbers) but also veryimportantly, map files containing direct links between any two AS numbersand the type of relationships - peer-to-peer (P2P), provider-to-customer(P2C) and customer-to-provider (C2P). At the time of our research, thenewest data file was from 7 April 2013.
However, upon closer examination, we observed that the fields in the mapfiles showing the type of relationships has not been updated since Novem-ber 2012. Our supervisor, Benno Overeinder contacted the UCLA Inter-net AS-level topology maintainer, Yu Zhang and the data started beingre-published, in a slightly changed format starting with June 2013 andavailable at a new URL [5]
Figure 3 shows an excerpt of the map file.
Figure 3: UCLA IRL map file (excerpt).
Upon considering our options we decided to drop the plan to use Universityof Washington’s iPlane data sets. While their data was the newest, we missedthe AS relationship types between AS numbers and their set was limited totraceroute discoveries from PlanetLab servers (so no RIPE RIS or Route Views)
We had to decide then between CAIDA and UCLA data and we chose forthe latter, for the simple fact that the data was newer - at the time we decided,we still believed we will work with the April 2013 data, not with the November2012 we ended up with. There was no sense in using both datasets (UCLA andCAIDA’s) because in case of discrepancies we wouldn’t have known whetherthis is due to CAIDA and UCLA seeing different routes or simply due to the
11

fact that there are routes which were present when CAIDA undertook the mea-surements and were then dropped.
With a fairly comprehensive list of AS numbers, relationships and relation-ship types, we needed to find a way to map them.
The first approach, obviously, was to select all the links in the UCLA mapfile in which both nodes are from the master file of all critical infrastructure ASnumbers (Dutch and foreign, discovered via the bottom-up plus the top downapproaches). The result would be a list containing exclusively the links betweenthe ASes corresponding to the Dutch critical infrastructure.
Unfortunately, the resulting graph had so many disconnected nodes that werealised quickly that we had to consider adding more intermediary or transitnodes to the map file — this would enable us to see whether there are concen-tration points, where many links are terminated for instance.
Obviously the goal is to build the minimum graph that connects all the crit-ical infrastructure AS numbers, native and proxy.
Which AS numbers to include to show relevant links? One initial idea wehad was to include non-Dutch Tier 1’s and Tier 2’s - or, at least the transitproviders mostly recognised as being such — and we created a list of 21 suchorganisations. We added these 21 AS numbers to our list and the number oflinks increased dramatically — actually the number of resulting links was so big(the 21 Tier 1 and Tier 2 ASNs doubled the amount of links for a bigger criticalsector, like Energy) that we were now experiencing the opposite scenario thanbefore: because of the excessive amount of links between these major providers,it was hard to extract the useful information from so much non-relevant data inthe graphs.
It was clear by now that we needed a middle path: enough links to showthe full connection mesh between our critical infrastructure sectors and withoutany extraneous links which would otherwise “swamp” the graphs and obscureany useful information.
The idea we finally implemented involved using the UCLA map file for gath-ering AS relationship types: for every unique AS number in our list we addedits transit provider to the list and then we built the full mesh of relationshipsbetween the new master list: AS numbers plus their providers.
Figure 4 is a schematic representation of this idea applied on a fictive sector.
12

Figure 4: Constructing the ASN relationships graph (fictive critical sector).
5 ASNs Network Visualization
Not only gathering the proper information from various data sources and aggre-gating them optimally is important, but also the way the collected informationwill be used and presented. Visualisation helps troubleshooting process operatemore suitable in large scale environments. In case of a small number of ASNs,tracing all the relations between them would not be an issue but managing allthe AS numbers registered in a country manually is close to impossible. Thebest approach would be either splitting the input dataset to smaller data setsand visualising each one of them, or, if the input dataset is clear enough, thevisualisation process can be done without further division.
In this project we tried to use interactive visualisation methods to keepthe level of clarity and informativeness at the highest level. The implementedprogram provides a set of graphs for each critical sector to maintain simplicityand also one graph for the entire critical infrastructure. These set of graphscan be considered an additional input for further investigations and analysis interms of resilience and determining the connectivity degree.
5.1 Technical Considerations
There are number of technologies used in each development stage of the vi-sualisation method, such as bash scripting, python, CSS and JavaScript. Thefollowing describes the options taken into account to reach the best result graph.
13

5.1.1 D3.js Library
D3.js [4] stands for Data-Driven Documents, a JavaScript library that uses well-structured JSON files as input. The fields and values of input JSON files canbe modified based on application requirements, but a specific format has to bekept. D3.js library is used for creating AS-level diagrams, representing each ASnumber as a node and each inter-AS relation as a link. Nodes will be distinctwith the associated labels and colours.
The input dataset has to be formatted in a way that is retrievable for D3.jslibrary. There are two input files used for each AS-level graph: one containingthe nodes and the other containing the links. The following code block showsan example of two nodes, with one of them having its own AS number and theother one being the customer of another company (proxy AS).
[
{
"as":"286",
"company":"Brabant Water",
"sector": "C1",
"input":["proxy",{"record":"A","company":"Koninklijke KPN N.V.","
country":"nl"}]
},
{
"as":"56517",
"company":"Vitens N.V.",
"sector": "C1",
"input":["native"]
}
]
We tried to put as much as information in each node. Each node contains theAS number, the company name (corresponding to that AS number), the criticalsector code (represented with a unique combination of digits and letters) andsome further information on the AS number origin. As we described before(Section 3), there are two possibilities for each company:
• If the company has its own AS number, it is specified in the nodes list as“native”.
• If the company does not have its own AS number and it is dependent onanother company having its own AS number, it is specified in the nodeslist as “proxy”. In the node specifications there is also more informationrelated to the origin company and the country that origin company isregistered in.
For the links input file, the case is much simpler. For each link only two fieldsare filled: “source” and “target”. Both fields are representative of AS numbersthat have a direct link. All the links are defined as bidirectional, so the pair ofAS numbers in links file will appear at most once. Also it does not make any dif-ference if the AS numbers in the “source” and “target” fields are swapped. SinceAS numbers are unique, they will be treated as pointers to unique companies.
14
[
{"source":286,"target":56517}
]
Positioning AS nodes on the screen in the most efficient way is one of themain goals of the visualisation technique. The first step is to visually differenti-ate the Dutch AS numbers from the foreign ASNs either with colours, bordersor grouping nodes together.
Several options can be taken into account for positioning nodes (AS numbersand companies) on the screen based on the requirements. Force Layout is theplacement method used in this project. D3.js library uses some positioningfunctions by default, which are meant to set “top” and “left” CSS fields ofeach node based on the calculations of best fitted positions. D3.js also providesparameters that can be set to fine-tune the placement of nodes. Force layout isa simulation of force in Physics science. Each link is the representation of a coiland there is a force between each two nodes. There are a number of parameters,which can be set to refine the final position of the nodes on the screen. Thegraph can be moved easily and the nodes can be dragged, but it is still necessaryto add zoom-in or Fisheye effects to see more details of nodes more clearly.
5.1.2 Sigma.js Library
Sigma.js [17] is an open source library, which can be extended easily in termsof additional plug-ins. Comparing it with the D3.js library, we chose to use theSigma.js mainly because it included many functions which were missing in thein D3.js library, such as zoom-in.
In order to parse JSON input files, jQuery functionality is involved - thesame JSON files from D3.js are used in this method as well.
In contrast to D3.js, Sigma.js does not provide positioning layout. Position-ing function is needed to display the nodes and links on the screen in the mostefficient way. The following list shows the requirements that have to be met inorder to make the graph comprehensive enough:
• The isolated nodes have to be found easily in the graph. The difficultywith graphs with high number of nodes is that there must be a dynamicpositioning function which selects the best fitted position for each nodeon the screen. If the nodes are put on top of each other or too closetogether, then the links can not be differentiated very well and it is notclear whether a node is part of a particular link or not. With zooming intothe graph links originating from each node will be shown clearly but it ismore preferable if isolated nodes and nodes with higher degree (number oflinks the node is part of) are distinguishable without further actions andat first sight.
Nodes are spread on the screen on circles with the same centre and differentradiuses. Nodes with a higher degree are set on the inner circles and nodeswith lower degrees are set on the outer circles. This ensures that isolatednodes appear separately and away from dense areas.
• The nodes have to be distributed on the screen equally. We first triedputting them on random positions and the resulting graph was not clear.
15

We then decided it is more preferable to locate nodes with higher degreeclose together, since this way the majority of links are shown shorter inthe graph and results in a more apprehensible graph.
The nodes are managed within an array sorted by descending number oflinks. Therefore, the higher index in array represents a node with lowerdegree. The following code block shows the formula used for each node tocalculate its position:
y = sin(a) * r
x = cos(a) * r
As shown in figure 5, r is the radius, which is calculated by using theindex number of the node in the array. So the node with highest degreewill have the radius 0 and will be located on the centre of the circle. Allother nodes with lower degrees will be arranged around it with differentradiuses. Also a is the radian angle, calculated by using the index numberof the node in the array. Although the same value could be used for eachnode’s angle, to end up with better graph, it is better to spread nodeswith different angles and use empty spaces on the screen. (x0,y0) is thecenter of all the circles, which in this case is (0,0).
Figure 5: (x,y) selection for each node
• Due to the focus of this research and to make the analysis the networkgraph easier, there must be a clear visual distinction between the DutchASNs and the foreign ones. We tried various solutions and in the end wesettled for using different colours for nodes, displaying flags of the coun-try that the corresponding ASN is allocated to and having two referencecentres on the screen. In sector 6 it is shown that foreign ASNs are moreconnected in general than Dutch ones. Having all the links related to for-eign ASNs next to the links of Dutch ASNs makes the analysis harder forthe viewer. The difference this latter option makes is visible in Figure 6,where the left graph shows a clearer picture of how links are distributedbetween foreign and Dutch ASNs.
Separately positioning of ASN numbers has to be implemented with aslightly different method. Figure 7 shows that how two different initialcentres of circles are considered. In this case the radian angle used inpositioning function can not be in this range: [0,2π] because of overlapping
16

(a) (b)
Figure 6: Two versions of node positioning (left one optimised) The chemicaland nuclear industries critical sector
of left-located circles and right-located ones. Semicircles can have theproper target with [π/2,3π/2] for left-located ones and [3π/2,5π/2] for theright-located ones.
Figure 7: (x,y) selection for each node (with foreign and Dutch ASNs separatelypositioned)
• We have shown in the graphs the number of companies dependent on eachASN. ASNs and their inter-connections are shown as nodes and links. Thecolour gradient is another parameter that can be taken into account toshow the density of each node in terms of number of companies dependenton it but we use it to distinguish between national ASNs and foreign ones.
17

In order to add this additional information in the graph, we implementedvariable size method for each node; the node with larger size is a proxy(or transit provider) for a higher number of companies.
Some other improvements we applied to the visualisation method to increasethe clarity of the graphs are using different colours for links between Dutch nodesand foreign nodes and displaying name of the owner company of ASNs as labels.
18

6 Data Analysis
In this section we find out how well the companies active in critical sectors areconnected and if there are any interesting findings in the ASN mapping of Dutchcritical sectors. The network graphs are used as input data source for furtherresearch. The network graphs of each critical sector is commented below. Inthe list below, we used the term “subsector” instead of the official terminologyof “goods” and “services”, mostly to increase the clarity of the explanations.
1. Energy critical sector We investigated the energy critical infrastructuresector which has 3 sub-sectors: electricity, gas and oil. Figure 8 shows theASN network graph for this sector when only direct links between eachtwo ASNs are taken into account. It is obvious that the graph is toodisconnected for drawing any conclusions. Although every two ASNs willbe connected in a graph containing all ASNs, the number of isolated nodesin this graph is too high. The links are distributed almost equally in twosides: 44% for the foreign ASNs and 56% for the Dutch ASNs.
Figure 8: Energy critical sector without providers
As shown in Section 4, with so many isolated nodes in the graph we had toinclude the immediate transit providers. In most cases a transit provideroffers the connectivity for an AS, and the provider usually has the higherdegree of connectivity. Using the maps file provided by UCLA (Section4), we intersect the Energy ASNs from the first column with the rows
19

containing customer-to-provider in their third column and the graphis redrawn. Figure 9 shows new network graph with transit providersincluded. The graph is more connected than before and the distributionof links is totally changed: 69% for foreign part and 31% for Dutch part.
Although it is expected for each node to have at least one link (it will bethe connection of the node to its provider), we still can find one isolatedASN in Dutch part. According to RIPE Stats [16], ASN 61013, whichbelongs to Alliander N.V. company has never announced any IP prefix.Alliander N.V. is one of the largest companies in maintenance, expansionand adaptation of the gas and electricity network in the Netherlands.The web server and mail server of this company are hosted by BritishTelecommunications plc (ASN 5400).
Figure 9: Energy critical sector with providers
For this sector, KPN B.V. is the Dutch ASN with highest degree and alsowith the highest number of companies depending on it. In the foreign part,Level 3 Communications Inc. and Swisscom appear in the graph with thehighest degree, while Microsoft Corp. and British Telecommunications plchave the highest number of companies depending on them.
2. Telecommunications and ICT For this critical sector, 4 subsectors aredefined by Dutch government: mobile telephony and land-line, broadcast,radio and Internet. As explained in Section 3, “Internet” is quite a generalterm for all the services that can be provided by companies active in thisarea. We had to list the services in order and choose only few with highest
20
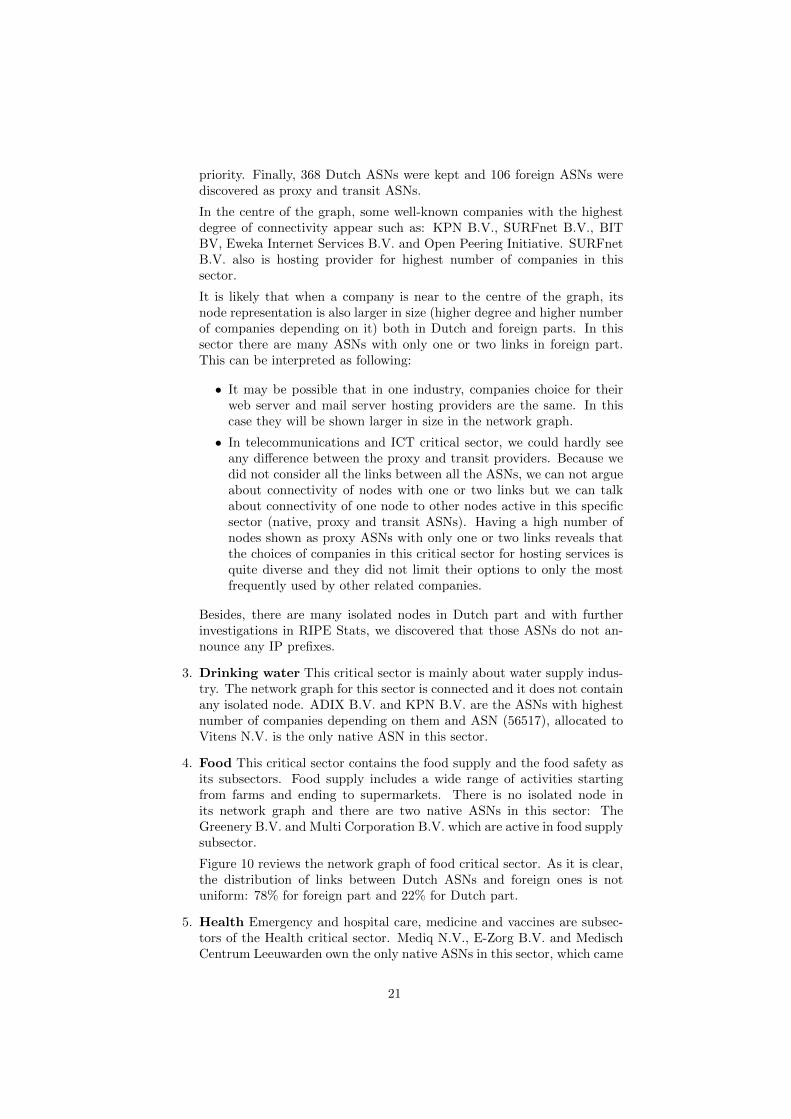
priority. Finally, 368 Dutch ASNs were kept and 106 foreign ASNs werediscovered as proxy and transit ASNs.
In the centre of the graph, some well-known companies with the highestdegree of connectivity appear such as: KPN B.V., SURFnet B.V., BITBV, Eweka Internet Services B.V. and Open Peering Initiative. SURFnetB.V. also is hosting provider for highest number of companies in thissector.
It is likely that when a company is near to the centre of the graph, itsnode representation is also larger in size (higher degree and higher numberof companies depending on it) both in Dutch and foreign parts. In thissector there are many ASNs with only one or two links in foreign part.This can be interpreted as following:
• It may be possible that in one industry, companies choice for theirweb server and mail server hosting providers are the same. In thiscase they will be shown larger in size in the network graph.
• In telecommunications and ICT critical sector, we could hardly seeany difference between the proxy and transit providers. Because wedid not consider all the links between all the ASNs, we can not argueabout connectivity of nodes with one or two links but we can talkabout connectivity of one node to other nodes active in this specificsector (native, proxy and transit ASNs). Having a high number ofnodes shown as proxy ASNs with only one or two links reveals thatthe choices of companies in this critical sector for hosting services isquite diverse and they did not limit their options to only the mostfrequently used by other related companies.
Besides, there are many isolated nodes in Dutch part and with furtherinvestigations in RIPE Stats, we discovered that those ASNs do not an-nounce any IP prefixes.
3. Drinking water This critical sector is mainly about water supply indus-try. The network graph for this sector is connected and it does not containany isolated node. ADIX B.V. and KPN B.V. are the ASNs with highestnumber of companies depending on them and ASN (56517), allocated toVitens N.V. is the only native ASN in this sector.
4. Food This critical sector contains the food supply and the food safety asits subsectors. Food supply includes a wide range of activities startingfrom farms and ending to supermarkets. There is no isolated node inits network graph and there are two native ASNs in this sector: TheGreenery B.V. and Multi Corporation B.V. which are active in food supplysubsector.
Figure 10 reviews the network graph of food critical sector. As it is clear,the distribution of links between Dutch ASNs and foreign ones is notuniform: 78% for foreign part and 22% for Dutch part.
5. Health Emergency and hospital care, medicine and vaccines are subsec-tors of the Health critical sector. Mediq N.V., E-Zorg B.V. and MedischCentrum Leeuwarden own the only native ASNs in this sector, which came
21

Figure 10: Food critical sector with providers
up through the bottom-up approach. The graph is connected and eachnode has a degree more than 1 except two native nodes (Mediq N.V. andE-Zorg B.V.), where their connectivity is offered by their providers.
It is more likely that the nodes in centre of the graph (correspondingto a higher degree and a higher number of links) are active in ICT andtelecommunications, even for critical infrastructure sectors not related toICT and telecommunications, For example we have seen KPN B.V. mostlyas one of top nodes in terms of degree of the node. Also in this sectorcompanies SURFnet B.V., KPN B.V., and Atrato IP Networks appear ashaving highest degree.
6. Financial sector This sector has a generic subsector of payments andmoney transfers by public bodies. For this sector, we safely excluded enti-ties such as Nationale Nederlanden (pensions, investments and mortgages)and GSX (hosted services including payment gateways) because they donot make “payments and money transfers by public bodies”. Public bodyis an organisation whose work is part of the process of government butnot part of the government itself [10]. Besides we included organisationslike banks, which receive the salary of government employees. Due to thevague government definition of what exactly critical infrastructure sec-tors, goods and services encompass, there is a certain level of freedom inchoosing representative entities for our list of critical infrastructure or-
22

ganisations. Interestingly 64% of nodes in this graph are native althoughthe graph has two isolated native nodes, corresponding to organisationswhich, even though have ASN numbers assigned to them, have decided tohost their services elsewhere.
7. Surface water management The subsector defined here by the govern-ment are the surface water quality and quantity. In this sector, there isonly one native ASN: 42894 (Ministerie van Verkeer en Waterstaat/Rijk-swaterstaat). The graph is connected and Microsoft Corp. has the highestnumber of companies dependent on.
8. Public order and safety All city halls can be considered, which areessentially active in this sector. Although about 50% of all nodes havetheir own ASN, in the graph we observe some native isolated nodes, whichaccording to RIPEStat do not announce any IP prefixes.
9. Legal order Legal order critical sector is defined with two subsectors: thecourts and prisons and law enforcement. For the latter, Dutch Police andNationale Politie, which are local divisions of Dutch Police were selected.The only native ASN in this graph belongs to “Voorziening tot samen-werking Politie Nederland”. The graph is well connected in Dutch part;every Dutch ASN (proxy or native) has a minimum degree of 3, whichmeans except its direct provider, it has one other BGP neighbour.
The Courts of Justice do not have their own ASNs but they have out-sourced their mail server and web server inside the country (ASP4ALLHosting for the web server and Tele2 for the mail server).
10. Public administration Diplomacy, Public information, the armed forcesand decision-making are subsectors introduced for this critical sector. Allthe ministries may be considered in decision-making subsector. Also mostof them can be taken into account as a provider of public information.Ministerie van Algemene Zaken, which applies coordination of governmentpolicy and communications on the Royal House and Ministerie van Buiten-landse Zaken are selected for diplomacy subsector. 26% of our nodes inthis sector are representative of native ASNs but still there are ministriesdependent on foreign hosting companies. Dutch ministries are accessiblethrough two umbrella domains:
• government.nl: Mail services are outsourced to MessageLabs (UKand US) but the web server is hosted in Prolocation B.V. in theNetherlands.
• rijksoverheid.nl: Mail server and web server are outsourced butare hosted inside the country (Prolocation B.V. for web server, KPNB.V. for mail server).
11. Transport In this critical sector there are four subsectors defined suchas: Amsterdam Schiphol Airport, the port of Rotterdam, waterways, high-ways and railways. Schiphol airport and the port of Rotterdam are sepa-rated because of their importance and vital role in transport industry.
British Telecommunications plc is the most frequently used foreign hostingcompany by the organisations active in this sector. One isolated native
23

Sector DutchProvider
ForeignProvider
Top 1 Foreign Provider
energy 56% 44% Microsoft Corp., UStelecommunications andICT
96% 4% Websense Hosted, UK
drinking water 61% 39% MessageLabs Inc., USfood 63% 37% No clear leading providerhealth 75% 25% MessageLabs Ltd., UKfinancial sector 81% 9% MessageLabs Ltd., UKsurface water manage-ment
57% 43% Microsoft Corp., US
public order and safety 92% 8% ClaraNet Ltd., UKlegal order 67% 33% BT plc, UKpublic administration 74% 26% MessageLabs Ltd., UKtransport 61% 39% BT plc, UKthe chemical and nuclearindustries
36% 64% MessageLabs Inc., US
Table 2: Distribution of Mail providers in each sector
node from Zeeland Seaports N.V. appears in the graph. Also other nativeASNs in the graph apparently do not have high number of links. In thecentre of circle we can see KPN B.V. with the highest degree and with thehighest number of companies depending on it.
12. The chemical and nuclear industries Based on the steps needed fora chemical process, there are 4 subsectors introduced in this sector: thetransport, the storage, the production and the processing of materials.For instance Urenco Netherland B.V. is working in the uranium en-richment area and providing nuclear fuel cycle. On the other hand Covradoes the radioactive waste management in the Netherlands. It is unlikelyto find a company active in all subsectors.
The graph is connected and contains only one native ASN. MicrosoftCorp., MessageLabs Inc. and MessageLabs Ltd. are the most frequentlyused for outsourcing purposes by companies active in this sector.
Table 2 reviews the distribution of mail providers as foreign or Dutch. As itis clear in all sectors the number of Dutch providers used is higher than foreignproviders but one: The chemical and nuclear industries, which is dependentmostly on MessageLabs Inc.
The biggest mail providers are MessageLabs (UK and US), KPN B.V.,Microsoft Corp., Tele2 Nederland B.V. and Ziggo. In fact, MessageLabs,a division of Symantec Corp., is the single biggest mail provider in our list.
Another interesting observation is that sometimes related companies/indus-tries choose the same providers:
• MessageLabs Ltd.: ABN AMRO and Triodos Bank.
24

• MessageLabs Ltd.: AkzoNobel and GGD.
• BT plc.: NS and ProRail.
• Microsoft Corp.: Royal Dutch Shell, Gasunie and Argos Energies.
25

7 Conclusions
In this research we mapped the representative Dutch critical infrastructure or-ganisations using the two discovery methods (bottom-up and top-down). Thediscovered organisations were verified manually one-by-one so we have a highdegree of confidence in the accuracy of the results.
However, we only worked with public sources of information and thus wedid not see physical, private and back-up links (as shown in Section 3). We donot know how different organisations physically connect to the internet, neitherthose that use private AS numbers or private links. But we do know how theorganisations listed interconnect to each other at an AS level and we were ableto draw the corresponding graph and extract some interesting results.
A more comprehensive list of organisations can only be obtained with spe-cialised information (consider the food-sector example we gave in Section 3), orwith privileged access to information. Such information would allow us to knowwhat IP address space is actually being used inside every organisation and thusfind the “native” AS number, in addition to the proxy ASNs. It would alsoallow us to gather the full list of Dutch organisations in all the critical sectors(via for instance the Chamber of Commerce) and the top-down AS discoveryapproach would then produce comprehensive results, instead of representativesamples.
From the research done we observed that many critical infrastructure organ-isations have reliable connections to the Internet (the native and proxy ASesare well interconnected), but rely a lot on foreign providers for their commu-nication needs. If we would consider the imaginary scenario of an emergencyin which critical sector organisations can only communicate using Dutch links,then around half of them (those that use foreign proxy ASes) would be cut-offfrom the network.
How important is however the IP network for a particular critical sectororganisation, such as an energy provider? We simply cannot know this withoutaccess to specialised and privileged information. But we do know that with itsA and MX records part of an IP prefix announced by a foreign AS, all webtraffic and emails received by this organisation pass through foreign entities.Let us consider the hypothetical scenario of such an energy provider providinga web portal for its customers (www.myenergyprovider.nl) in which one can seehis invoices, provide payment methods (bank accounts and/or credit cards), sethis contact details (address, phone number, etc.). How important is, from aprivacy and a confidentiality perspective at least, that such information goesfirst through a foreign provider whose infrastructure, privacy policies, trafficretention policies and (deep) traffic inspection procedures are unknown to usand which can change at any time, without notice to us, the end user? Howvalid are then the confidentiality agreements we sign with our energy provider?What happens when instead of an energy provider company we consider the caseof a medical unit or a medical insurance company which allows its customers tovisualise and edit their records online (medical bills, address, telephone, bankaccount)?
In this context we find it would be useful to start a discussion regarding the
26

security and privacy implications of having critical infrastructure organisations’email and websites hosted with foreign entities, especially so with those fromoutside the European Union (EU) since they do not not necessarily have thesame laws regarding data privacy and confidentiality. Which laws apply on the“privacy sensitive” data if many companies have online presence out-sourced toforeign or even non-EU countries? This is becoming more and more importantas many critical sector organisations allow their customers to manage their ac-counts online (Energy providers for instance) or make various requests via email.
A clear conclusion is that we do not see that national critical infrastructureorganisations regard their network infrastructure and the data communicationflow as being of critical importance, yet.
27

References
[1] Amendment to Executive Order 13010, the President’s Commission onCritical Infrastructure Protection. Website. http://www.archives.gov/
federal-register/executive-orders/1996.html.
[2] AS Relationships in CAIDA project. Website. http://www.caida.org/
data/active/as-relationships/.
[3] BGP Looking Glasses List. Website. http://www.bgp4.as/
looking-glasses.
[4] Data-Driven Documents JavaScript Library. Website. http://d3js.org/.
[5] Internet AS-level Topology Data by UCLA. Website. http://irl.cs.
ucla.edu/topology/.
[6] Internet Topology Collection by UCLA. Website. http://irl.cs.ucla.
edu/topology/index-old.html.
[7] iPlane: An Information Plane for Distributed Services. Website. http:
//iplane.cs.washington.edu/.
[8] IPv4 Route Servers List. Website. http://www.bgp4.net/rs.
[9] Protecting critical infrastructure. Website. http://www.
government.nl/issues/crisis-national-security-and-terrorism/
protecting-critical-infrastructure.
[10] Public body definition by MacMillan dictionary. Website. http://www.
macmillandictionary.com/dictionary/british/public-body.
[11] Public Route Servers List. Website. http://routeserver.org.
[12] RIPE NCC ASN information list. Website. ftp://ftp.ripe.net/pub/
stats/ripencc.
[13] RIPE NCC service region. Website. http://www.nro.
net/about-the-nro/list-of-country-codes-and-rirs/
list-of-country-codes-in-the-ripe-ncc-region.
[14] RIPE Routing Information Service (RIS). Website. http://www.ripe.
net/data-tools/stats/ris/routing-information-service.
[15] RIPE WHOIS Database. Website. http://whois.ripe.net.
[16] RIPEStat information for AS61013. Website. https://stat.ripe.net/
AS61013$#$tabId=at-a-glance.
[17] Sigma.js JavaScript Library. Website. http://sigmajs.org/.
[18] The Cooperative Association for Internet Data Analysis (CAIDA). Web-site. http://www.caida.org/data/overview/.
[19] The Dutch Chamber of Commerce. Website. http://www.kvk.nl.
28

[20] University of Oregon Route Views Project. Website. http://www.
routeviews.org/.
[21] Critical Infrastructure Protection: Survey of World-Wide Activities. Bun-desamt fur Sicherheit in der Informationstechnik (BSI), 2004.
[22] Resilience de l’Internet Francais (ENISA report). Website, 2012. http:
//www.afnic.fr/medias/documents/Dossiers_pour_breves_et_CP/
Observatoire-sur-la-resilience-Internet-en-France-2012.pdf.
[23] Hall, Chris, Ross Anderson, Richard Clayton, Evangelos Ouzounis,and Panagiotis Trimintzios. Resilience of the Internet Interconnec-tion Ecosystem., 2011. http://www.enisa.europa.eu/activities/
Resilience-and-CIIP/critical-infrastructure-and-services/
inter-x/interx/report.
[24] Luiijf, Eric AM, Helen H. Burger, and Marieke HA Klaver. Critical (in-formation) Infrastructure Protection in the Netherlands. GI Jahrestagung(Schwerpunkt ”Sicherheit-Schutz und Zuverlassigkeit”), pages 9–19, 2003.
[25] Matthias Wahlisch, Thomas C Schmidt, Markus de Brun and ThomasHaberlen. Exposing a nation-centric view on the German internet - achange in perspective on the AS level. Proc. of the 13th Passive and ActiveMeasurement Conference (PAM), 7192:200–210, 2012.
29