Embed Size (px)
Citation preview
Discovery and dissection of metabolic oscillations inthe microaerobic nitric oxide response network ofEscherichia coliJonathan L. Robinsona and Mark P. Brynildsena,1
aDepartment of Chemical and Biological Engineering, Princeton University, Princeton, NJ 08544
Edited by Gregory Stephanopoulos, Massachusetts Institute of Technology, Cambridge, MA, and accepted by the Editorial Board February 5, 2016 (receivedfor review October 28, 2015)
The virulence of many pathogens depends upon their ability tocope with immune-generated nitric oxide (NO·). In Escherichia coli,the major NO· detoxification systems are Hmp, an NO· dioxyge-nase (NOD), and NorV, an NO· reductase (NOR). It is well estab-lished that Hmp is the dominant system under aerobic conditions,whereas NorV dominates anaerobic conditions; however, the quan-titative contributions of these systems under the physiologicallyrelevant microaerobic regime remain ill defined. Here, we investi-gated NO· detoxification in environments ranging from 0 to 50 μMO2, and discovered a regime in which E. coli NO· defenses wereseverely compromised, as well as conditions that exhibited oscilla-tions in the concentration of NO·. Using an integrated computa-tional and experimental approach, E. coli NO· detoxification wasfound to be extremely impaired at low O2 due to a combinationof its inhibitory effects on NorV, Hmp, and translational activities,whereas oscillations were found to result from a kinetic competitionfor O2 between Hmp and respiratory cytochromes. Because at least777 different bacterial species contain the genetic requirements ofthis stress response oscillator, we hypothesize that such oscillatorybehavior could be a widespread phenomenon. In support of thishypothesis, Pseudomonas aeruginosa, whose respiratory and NO·response networks differ considerably from those of E. coli, wasfound to exhibit analogous oscillations in lowO2 environments. Thiswork provides insight into how bacterial NO· defenses function un-der the low O2 conditions that are likely to be encountered withinhost environments.
nitrosative stress | E. coli | microaerobic | Pseudomonas aeruginosa |kinetic modeling
Nitric oxide (NO·) plays a critical role in mammalian innateimmunity as a potent antimicrobial (1–3), where its broad
reactivity contributes to a diverse repertoire of cytotoxic effectsincluding respiratory inhibition, thiol nitrosation, iron–sulfur clus-ter ([Fe-S]) destruction, DNA deamination, and tyrosine nitration/nitrosylation (4, 5). To cope with this stress, many pathogens har-bor defenses to detoxify NO· and its reaction products, and repairNO·-mediated damage to biomolecules (6, 7). Disruption of thesedefenses has been shown to attenuate virulence in many patho-genic species, such as Neisseria meningitides, Pseudomonas aerugi-nosa, Yersinia pestis, Mycobacterium tuberculosis, Vibrio cholerae,uropathogenic and enterohemorrhagic Escherichia coli (UPECand EHEC, respectively), Staphylococcus aureus, and Salmo-nella enterica serovar Typhimurium (4, 6), which underscoresthe importance of NO· to immune function and highlights micro-bial NO· defense networks as a promising source of targets for thedevelopment of next-generation antiinfectives (8). This potentialhas inspired many investigations of bacterial NO· stress, fromwhich major defense systems, such as NO· dioxygenase (NOD) (9,10) and NO· reductase (NOR) (11, 12), have been identified.NODs are widely distributed among different bacterial species
(13) and provide protection from NO· under oxygenated con-ditions by catalyzing the reaction between NO· and O2 to formnitrate (9, 10). Although some studies have demonstrated that
NODs can detoxify NO· under anaerobic conditions using anNOR function, the rate is orders of magnitude slower than theO2-dependent reaction and the physiological relevance is a matterof debate (14–17). In addition to an NOD, many bacteria alsopossess a separate NOR, which functions optimally under anaer-obic conditions and complements the O2-dependent function ofNOD (11, 12, 18, 19). The contributions of these systems to NO·detoxification have been well studied under aerobic and anaerobicconditions (9–12, 15, 16, 20–23), but how they coordinate toremove NO· under the intermediate microaerobic regime is lessclear. The fact that O2 tensions in vivo span the entire anaerobic–aerobic spectrum, with ∼120–200 μM dissolved O2 in the lungs,∼50–130 μM in vasculature, ∼5–50 μM in tissue (muscle, liver,kidney, lymphoid tissues), and ∼0–100 μM in the gastrointestinaltract (24–29), underscores the importance of understanding bac-terial NO· detoxification at all O2 levels.In E. coli, several studies have examined NO· stress under
microaerobiosis (12, 30, 31). Gardner et al. (12) measured growthof wild-type (WT), Δhmp, ΔnorV, and ΔhmpΔnorV E. coli in anenvironment with ∼5 μM O2 and found that ΔhmpΔnorV was theslowest to recover, which suggested that both defense enzymesparticipate in NO· stress tolerance under low O2 conditions. Twoseparate studies found that the duration of respiratory inhibitionand growth arrest by NO· was inversely proportional to [O2] inE. coli cultures (measured down to ∼25 μM O2), although thecause was uncertain, and was suspected to be the result of reducedNO· autoxidation or decreased abundance of substrate (O2) to
Significance
Many bacteria use NO· dioxygenase and NO· reductase todefend themselves against immune-generated NO·. The im-portance and contribution of these systems under microaerobicconditions, which pathogens are likely to encounter within ahost, remain poorly understood. We investigated the NO· re-sponse of Escherichia coli throughout the microaerobic regime,and discovered conditions that largely disabled the NO· de-fenses of E. coli, and environments where the [NO·] oscillated.Components found to comprise the oscillatory circuit are dis-tributed broadly among bacterial species, suggesting that thesedynamics could be a characteristic feature of how bacteria re-spond to NO· in low O2 environments. In support of this hy-pothesis, analogous oscillations were observed in NO·-stressedcultures of Pseudomonas aeruginosa under low O2 conditions.
Author contributions: J.L.R. and M.P.B. designed research; J.L.R. performed research; J.L.R.and M.P.B. analyzed data; and J.L.R. and M.P.B. wrote the paper.
The authors declare no conflict of interest.
This article is a PNAS Direct Submission. G.S. is a guest editor invited by the EditorialBoard.
Data deposition: A Systems Biology Markup Language (SBML) version of the model de-scribed in this work was deposited in the BioModels Database (https://www.ebi.ac.uk/biomodels/) with the identifier: MODEL1601140000.1To whom correspondence should be addressed. Email: [email protected].
This article contains supporting information online at www.pnas.org/lookup/suppl/doi:10.1073/pnas.1521354113/-/DCSupplemental.
www.pnas.org/cgi/doi/10.1073/pnas.1521354113 PNAS | Published online March 7, 2016 | E1757–E1766
SYST
EMSBIOLO
GY
PNASPL
US
Dow
nloa
ded
by g
uest
on
Dec
embe
r 10
, 202
1
drive the Hmp NO· dioxygenation reaction (30, 31). Kinetic char-acterizations of purified Hmp demonstrated that the rate of NO·dioxygenation was reduced at lower [O2], which was attributed to itsrelatively low affinity for O2 (measured Km,O2 values ranged from∼25 to as high as 100 μM O2) (16, 32, 33). Although these studieshave provided initial insight into the influence of [O2] on bacterialNO· defenses, they generally focused on the participation of onlyone network component (namely Hmp), and they did not quantifythe distribution of NO· among the available consumption path-ways at different [O2]. As such, there remains considerable un-certainty regarding the quantitative contribution of NOD andNOR to NO· detoxification within the microaerobic regime.Here, we sought to investigate NO· stress in E. coli under low
[O2] environments, focusing on the quantitative trade-off be-tween its NOD (Hmp) and NOR (NorV) throughout this regime.To do this, we used a kinetic model to quantitatively characterizeE. coli NO· detoxification in environments with [O2] between0 and 50 μM. Simulations predicted compromised NO· defenses(increased time required to clear NO· from the culture) withinthis range relative to 50 and 0 μM O2, and this was experimentallyconfirmed, although the magnitude of the effect was under-estimated by the initial predictions. Furthermore, [NO·] oscilla-tions, which were not predicted a priori, were observed at 5 and10 μM O2. Using an integrated computational and experimentalapproach, NO· defenses were found to be considerably impaired bydecreased substrate (O2) abundance for Hmp, strong O2-mediatedsuppression of NorV activity, and a general reduction in translationrate at reduced [O2]. Computational dissection of the [NO·]oscillations predicted that they were driven by an imbalancedcompetition for O2 between Hmp and respiratory cytochromes,the inhibitory effect of NO· on cytochrome quinol oxidase activity,and the NO· detoxification function of Hmp. This hypothesizedmechanism was confirmed experimentally with biochemical mea-surements (quantification of [NO·] and [O2]) from WT and ge-netic mutants, Δhmp and ΔCYT (mutant devoid of cytochromebo, bd-I, and bd-II terminal quinol oxidases). Given the modestgenetic requirements of this stress response oscillator, 777 differ-ent bacterial species cataloged in the Kyoto Encyclopedia ofGenes and Genomes (KEGG) database (34, 35) have the poten-tial to produce oscillations when stressed with NO· in low O2environments. To assess the generality of this native oscillator, wechose one of those bacterial species, P. aeruginosa, and found thatit exhibited analogous oscillatory behavior when treated with NO·under low O2 conditions. Collectively, this study reveals the exis-tence of metabolic oscillations in bacterial stress response net-works under physiologically relevant O2 conditions, quantifies the
trade-off between NOD and NOR in this regime, and provides acompelling example of the utility of quantitative modeling inmechanistic investigations of complex phenomena.
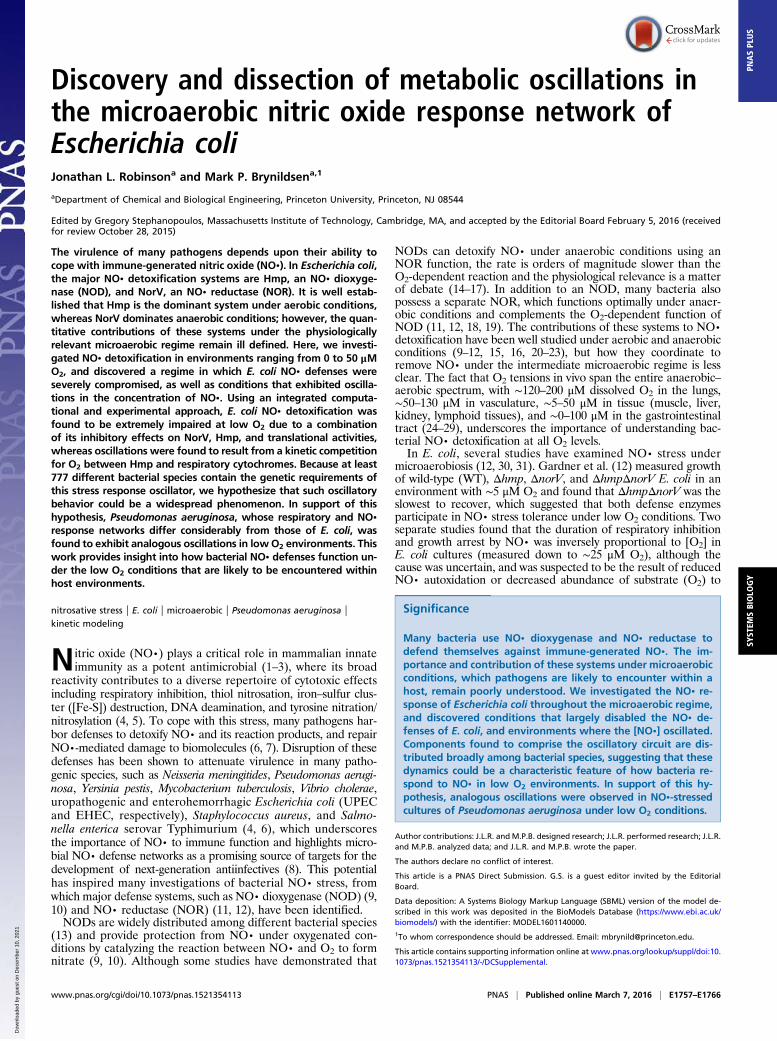
ResultsNO· Detoxification in E. coli Cultures in Low [O2] Environments. Tobegin exploring the dynamics of E. coli NO· detoxification at low[O2], WT E. coli were grown in an O2-control glove box andtreated with 50 μM dipropylenetriamine (DPTA) (Z)-1-[N-(3-aminopropyl)-N-(3-ammoniopropyl)amino]diazen-1-ium-1,2-diolate(NONOate), which dissociates with a half-life of ∼2.5 h (at 37 °Cand pH 7.4) to release 2 mol of NO· per mol of parent compound.The glove box environment was operated to maintain an atmo-sphere of 5% or 0% (vol/vol) O2, which corresponded to 50 and0 μM dissolved [O2], respectively (Materials and Methods). Under50 μM O2 conditions, the addition of DPTA NONOate produceda peak [NO·] of 0.57 ± 0.03 μM (mean ± SE) and NO· wascleared from the culture by 0.118 ± 0.004 h postdose (tclear,NO·,defined as the time after treatment at which [NO·] dropped below0.2 μM NO·) (Fig. 1A). Under anaerobic conditions (0 μM O2),the addition of DPTA NONOate yielded a higher [NO·] peak,1.49 ± 0.04 μM, and a marginally longer tclear,NO· of 0.136 ± 0.009 h(Fig. 1B). Using these data, we used a kinetic model of NO·stress (36) to delineate the O2 concentrations between 0 and50 μM that were most interesting for experimental investigation.The model was constructed and used in previous studies (36–38),where it was shown to be a valuable tool for quantitative,mechanistic interrogation of the E. coli NO· defense network. Acomplete list of biochemical species, kinetic parameters, and re-actions in the model are presented in Datasets S1 and S2, and SIAppendix, Table S1. Due to the different experimental conditionsused here, the model was trained on experimental [NO·] mea-surements from 50 and 0 μM O2 environments, and a Markovchain Monte Carlo (MCMC) procedure (39, 40) was used togenerate an ensemble of plausible models [defined as thoseexhibiting an evidence ratio (ER) of less than 10] (SI Appendix,Supporting Methods) that accounted for parametric uncertaintyand allowed the robustness of forward predictions to be assessed(Dataset S3). Simulated [NO·] curves from the ensemble at 50 and0 μM [O2] varied little and exhibited excellent agreement with ex-perimental measurements of [NO·] in WT (Fig. 1 A and B), Δhmp,and ΔnorV cultures (SI Appendix, Fig. S1), which gave confidence inthe predictive accuracy of the model for these conditions.Simulations of NO· detoxification throughout the micro-
aerobic regime exhibited uncertainty in the 0–20 μM O2 range,
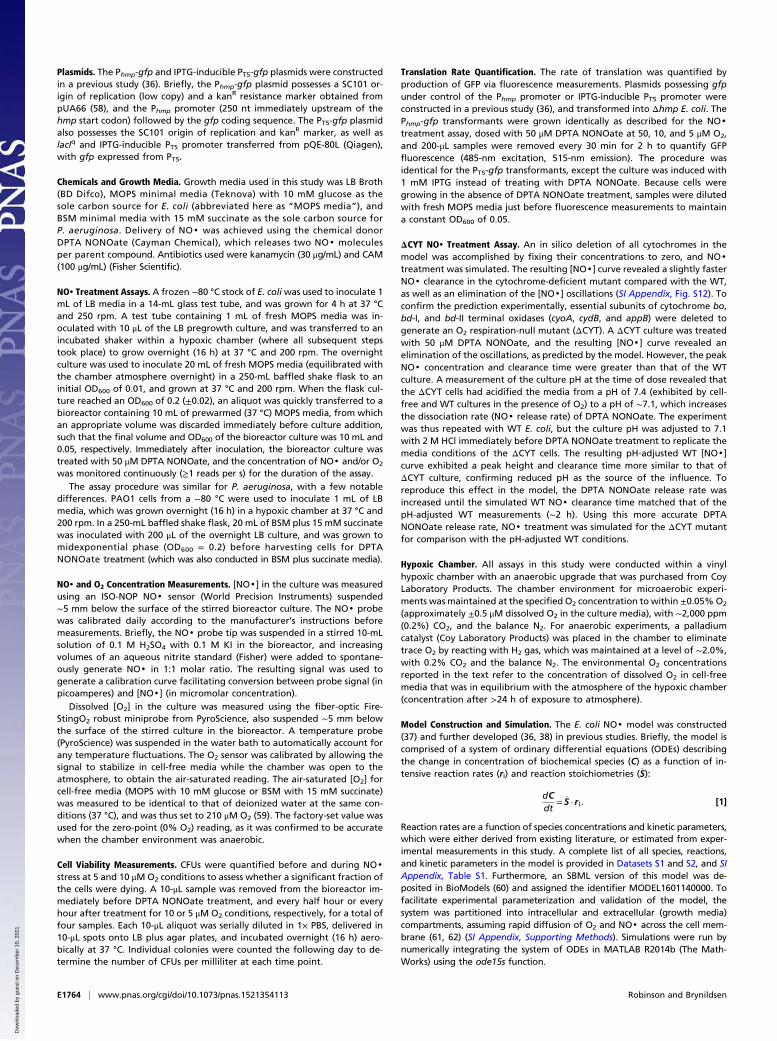
Fig. 1. Model training and prediction of NO· clear-ance throughout the microaerobic regime. Exponen-tial-phase cultures of wild-type (WT) E. coli at an OD600
of 0.05 were treated with 50 μM DPTA NONOate attime t = 0 under conditions of (A) 50 μMO2 or (B) 0 μMO2, and the [NO·] was measured (solid red line; meanof three independent experiments, with light redshading representing the SEM). The model was trainedon the measured [NO·] curves at 50 and 0 μM O2,where simulations using the resulting optimal param-eter set are plotted (dashed black lines). (C) NO·treatment simulations were run for [O2] environmentsranging from 0 to 50 μM O2, from which the time ofclearance of NO· (tclear,NO·) was calculated (quan-tified as the time required for [NO·] to drop below0.2 μM NO·). (D) Predicted contribution of differentNO·-consuming pathways (transfer to the gas phase,autoxidation, and the combination of Hmp- and NorV-mediated detoxification) to the total cumulative de-toxification of NO· up to time tclear,NO·. (E) Individualcontributions of Hmp and NorV to cumulative NO·detoxification. Dashed lines are simulations using the best-fit (minimum SSR, or ER = 1) parameter set, where shading of similar color represents predictionuncertainty (range of viable parameter sets with ER < 10). The O2 concentration corresponds to the concentration of dissolved O2 in cell-free media that was inequilibrium with the atmosphere of the hypoxic chamber.
E1758 | www.pnas.org/cgi/doi/10.1073/pnas.1521354113 Robinson and Brynildsen
Dow
nloa
ded
by g
uest
on
Dec
embe
r 10
, 202
1
where NO· was either cleared similarly across the entire regimewith mild inhibition between 10 and 20 μM O2 (∼3-fold increasein tclear,NO· relative to clearance at 0 or 50 μM O2) or NO· de-toxification was severely impaired (∼40- to 50-fold increase intclear,NO· relative to clearance at 0 or 50 μM O2, respectively)with a maximum depression in clearance occurring at ∼0.3 μMO2 (Fig. 1C). The optimal model predicted an effect between thesetwo extremes (∼15-fold increase in tclear,NO· relative to clearance at0 or 50 μM O2), where the maximum depression in NO· de-toxification existed at ∼1.5 μM O2. Using the ensemble of modelsto dissect NO· consumption into its individual pathways up tothe time of NO· clearance, we found that the predicted contri-bution of autoxidation to NO· clearance remained modest (<10%)throughout the entire range of [O2] explored, whereas Hmp andNorV were the dominant NO· consumption pathways (Fig. 1D).Loss of NO· to the gas phase comprised the majority of theremaining flux, where its maximum contribution was predicted tooccur under conditions where Hmp and NorV were least efficient(∼1–15 μM O2). Inspection of individual Hmp and NorV partici-pation revealed that Hmp was predicted to dominate NO· con-sumption down to ∼0.2–13 μM O2, beyond which (and intoanaerobiosis) NorV functioned as the primary NO· sink (Fig. 1E).Given these in silico predictions, and considering the 1 μM [O2]resolution of the glove box O2 controller, we reasoned that ad-ditional experiments performed at 5, 10, and 20 μM O2 wouldresolve uncertainty and determine the extent to which micro-aerobic environments impair NO· detoxification by E. coli.NO· detoxification was measured in cultures of WT, Δhmp,
and ΔnorV after the addition of 50 μM DPTA NONOate inenvironments of 5, 10, and 20 μM dissolved O2 (SI Appendix, Fig.S2). Results showed that E. coli was extremely impaired in itsability to remove NO· under microaerobic conditions, exceedingthe poorest NO· clearance dynamics predicted by the ensemble.The time needed to clear NO· from the culture was measured tobe ∼20-fold (compared with the predicted maximum of ∼15-fold)longer at 5 μM O2 (2.87 ± 0.08 h) than at 50 or 0 μM O2 (0.118 ±0.004 and 0.136 ± 0.009 h, respectively) (Fig. 2 and SI Appendix,Fig. S3). Another unpredicted behavior was the emergence ofoscillations in concentration of NO· at 5 and 10 μM O2. Oscil-lations began shortly after the initial clearance of NO·, and weredamped, eventually stabilizing at ∼0 μM [NO·] by ∼1 h after theinitial clearance of NO· (Fig. 2 B and C).We sought to understand the mechanisms underlying the unpre-
dicted severity of low O2 conditions on NO· detoxification and the[NO·] oscillations that were observed. To begin, we considered thepossibility that the impairment in NO· defenses at 5 and 10 μMarose from cell death. Both Hmp and NorV require reducingequivalents to detoxify NO·, and if cells were dying it would manifestas extended NO· clearance times. To assess this possibility, sampleswere removed immediately before the addition of DPTA NONOateand at various times after treatment, and plated on Luria–Bertani(LB) agar to quantify colony-forming units (CFUs). The number ofCFUs did not decrease following NO· treatment (SI Appendix, Fig.S4), eliminating cell death as a potential contributor to the poorability of E. coli to detoxify NO· at low O2 concentrations. In theabsence of a contribution from cell death, we assessed whethermodel simulations and experimentally measured [NO·] dynamicscould be reconciled.
Reconciliation of Measured NO· Clearance Times with Model Simulations.Initially, the 17 model parameters optimized on the WT [NO·]curves at 0 and 50 μM were reoptimized to fit the [NO·] curvesfrom all measured [O2] conditions (0, 5, 10, 20, and 50 μM O2)(Dataset S3). Although the simulated [NO·] profiles at the lower[O2] conditions were greatly improved with the reoptimized pa-rameter set, the model was unable to capture the [NO·] dynamicsat all of the conditions simultaneously, and specifically, the fit ofthe [NO·] curve at 50 μM O2 was compromised (SI Appendix,Fig. S5A). To quantitatively assess the quality of fit at each ofthe conditions in a manner that was independent of absolute[NO·] or the number of data points describing each curve, the
areas under the curve (AUCs) of each measured and simu-lated [NO·] profile were calculated, AUCmeas and AUCmodel,respectively, and the relative error (AUCRE) was evaluated:AUCRE = jAUCmeas − AUCmodelj/AUCmeas. The fit at 50 μMO2 was the poorest, with an AUCRE just over 2.0, or 200%relative error.The inability of the model to capture the measured [NO·] dy-
namics at the five different O2 conditions suggested that constrainedparameters, which were those not released during optimization,could be incorrect. We considered this a possibility because pa-rameter values obtained from the literature were not measuredunder conditions identical to those used in this study. Alternatively,the disagreement between simulations and measurements couldimplicate a problem with the model structure itself (e.g., missingreactions, incorrect rate equations). To assess whether the existingmodel structure was sufficient to capture the [NO·] dynamics underthe different [O2] conditions, all cellular parameters were allowed tovary within one order of magnitude, and the optimization was re-peated. Despite the increased parametric flexibility, the model wasstill unable to adequately capture all [NO·] curves, where only asmall improvement in performance at 50 μM O2 was achieved(AUCRE decreased from 2.0 to 0.67), but at the expense of agree-ment at 0 μMO2 (AUCRE increased from 0.10 to 0.24) (SI Appendix,Fig. S5B). Furthermore, an assessment of the Akaike informationcriterion (AIC) (Materials and Methods) suggested that the releaseof the additional parameters for optimization was not justified bythe improvement to model performance, as the AIC was greaterwhen all cellular parameters were relaxed (SI Appendix, Table S2).The inability of the model to capture the combined set of
[NO·] dynamics despite the release of all cellular parameterssuggested that a structural change to the model was necessary toaccurately describe the observed behavior. Given the noticeablyslower growth observed at 0, 5, and 10 μM O2 relative to growthat 20 and 50 μM O2 (SI Appendix, Table S3), and the strongassociation between growth rate and rate of protein synthesis(41), we reasoned that the rate of translation was likely a func-tion of [O2]. We therefore incorporated an [O2] dependency inthe rate equation for translation, where increased [O2] yielded afaster rate of protein production, and vice versa. An optimizationwas conducted of the original 17 parameters along with thetwo additional parameters that were introduced with the new[O2]-dependent translation rate equation (kact,O2 and KO2; seeMaterials and Methods) (Dataset S3). The optimal parameter setwith the new model structure was able to capture the [NO·] dy-namics at all measured [O2] conditions, with a low AUCER evenfor the 50 μM O2 [NO·] curve (SI Appendix, Fig. S5C). In addi-tion, the AIC was lower for the new parameter set relative to theprevious best fit, despite the penalty of including two additionaloptimized parameters (SI Appendix, Table S2).With the improved model performance, we sought to provide
direct experimental support for an [O2]-dependent translationrate. Using the model, an experimentally tractable in silico ex-periment was conducted whereby Hmp was replaced with GFPto allow real-time monitoring of protein expression from thePhmp promoter. NO· treatment of 50 μM DPTA NONOate wassimulated for conditions of 50, 10, and 5 μMO2, yielding predicted[GFP] profiles. The original model predicted virtually identicalconcentrations of GFP among the three O2 environments, whereasthe new model structure predicted an increasing rate of GFPproduction with higher [O2] (SI Appendix, Fig. S6 A and B). Whenthe corresponding experiment was performed (Materials andMethods), the measured [GFP] profiles (SI Appendix, Fig. S6C)were in excellent agreement with those predicted by the modelpossessing an [O2]-dependent translation rate, providing strong sup-port for the inclusion of this term. To assess whether the effect wasspecific to NO·-stressed conditions and/or the Phmp promoter, theexperiment was repeated in the absence of NO· treatment, and withgfp under the control of an isopropyl β-D-1-thiogalactopyranoside(IPTG)-inducible PT5 promoter. The same trend of increasingGFP production with increasing [O2] (while maintaining aconstant 1 mM IPTG concentration) was observed (SI Appendix,
Robinson and Brynildsen PNAS | Published online March 7, 2016 | E1759
SYST
EMSBIOLO
GY
PNASPL
US
Dow
nloa
ded
by g
uest
on
Dec
embe
r 10
, 202
1
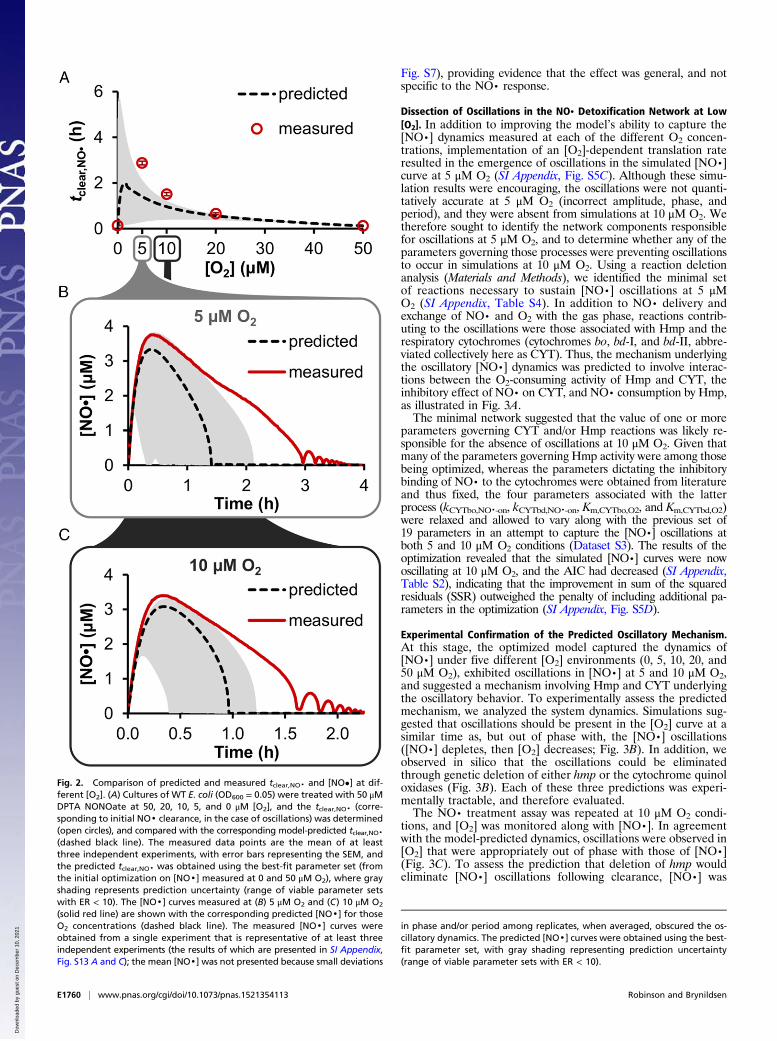
Fig. S7), providing evidence that the effect was general, and notspecific to the NO· response.Dissection of Oscillations in the NO· Detoxification Network at Low[O2]. In addition to improving the model’s ability to capture the[NO·] dynamics measured at each of the different O2 concen-trations, implementation of an [O2]-dependent translation rateresulted in the emergence of oscillations in the simulated [NO·]curve at 5 μM O2 (SI Appendix, Fig. S5C). Although these simu-lation results were encouraging, the oscillations were not quanti-tatively accurate at 5 μM O2 (incorrect amplitude, phase, andperiod), and they were absent from simulations at 10 μM O2. Wetherefore sought to identify the network components responsiblefor oscillations at 5 μM O2, and to determine whether any of theparameters governing those processes were preventing oscillationsto occur in simulations at 10 μM O2. Using a reaction deletionanalysis (Materials and Methods), we identified the minimal setof reactions necessary to sustain [NO·] oscillations at 5 μMO2 (SI Appendix, Table S4). In addition to NO· delivery andexchange of NO· and O2 with the gas phase, reactions contrib-uting to the oscillations were those associated with Hmp and therespiratory cytochromes (cytochromes bo, bd-I, and bd-II, abbre-viated collectively here as CYT). Thus, the mechanism underlyingthe oscillatory [NO·] dynamics was predicted to involve interac-tions between the O2-consuming activity of Hmp and CYT, theinhibitory effect of NO· on CYT, and NO· consumption by Hmp,as illustrated in Fig. 3A.The minimal network suggested that the value of one or more
parameters governing CYT and/or Hmp reactions was likely re-sponsible for the absence of oscillations at 10 μM O2. Given thatmany of the parameters governing Hmp activity were among thosebeing optimized, whereas the parameters dictating the inhibitorybinding of NO· to the cytochromes were obtained from literatureand thus fixed, the four parameters associated with the latterprocess (kCYTbo,NO·-on, kCYTbd,NO·-on, Km,CYTbo,O2, and Km,CYTbd,O2)were relaxed and allowed to vary along with the previous set of19 parameters in an attempt to capture the [NO·] oscillations atboth 5 and 10 μM O2 conditions (Dataset S3). The results of theoptimization revealed that the simulated [NO·] curves were nowoscillating at 10 μM O2, and the AIC had decreased (SI Appendix,Table S2), indicating that the improvement in sum of the squaredresiduals (SSR) outweighed the penalty of including additional pa-rameters in the optimization (SI Appendix, Fig. S5D).
Experimental Confirmation of the Predicted Oscillatory Mechanism.At this stage, the optimized model captured the dynamics of[NO·] under five different [O2] environments (0, 5, 10, 20, and50 μM O2), exhibited oscillations in [NO·] at 5 and 10 μM O2,and suggested a mechanism involving Hmp and CYT underlyingthe oscillatory behavior. To experimentally assess the predictedmechanism, we analyzed the system dynamics. Simulations sug-gested that oscillations should be present in the [O2] curve at asimilar time as, but out of phase with, the [NO·] oscillations([NO·] depletes, then [O2] decreases; Fig. 3B). In addition, weobserved in silico that the oscillations could be eliminatedthrough genetic deletion of either hmp or the cytochrome quinoloxidases (Fig. 3B). Each of these three predictions was experi-mentally tractable, and therefore evaluated.The NO· treatment assay was repeated at 10 μM O2 condi-
tions, and [O2] was monitored along with [NO·]. In agreementwith the model-predicted dynamics, oscillations were observed in[O2] that were appropriately out of phase with those of [NO·](Fig. 3C). To assess the prediction that deletion of hmp wouldeliminate [NO·] oscillations following clearance, [NO·] was
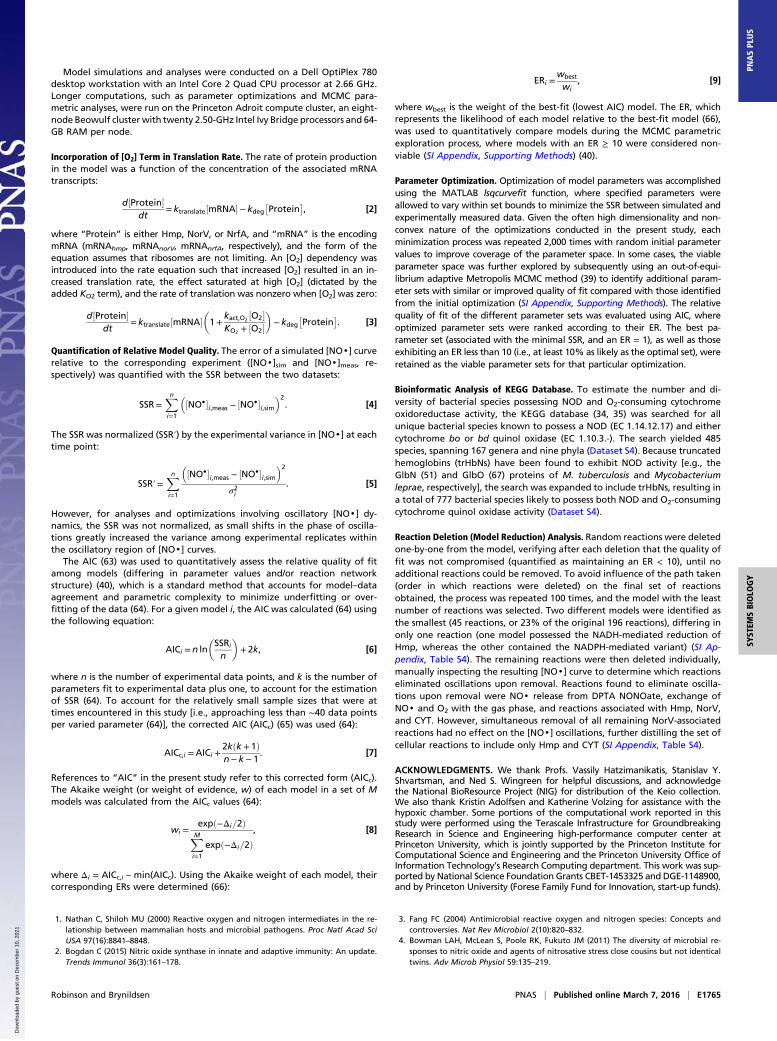
Fig. 2. Comparison of predicted and measured tclear,NO· and [NO•] at dif-ferent [O2]. (A) Cultures of WT E. coli (OD600 = 0.05) were treated with 50 μMDPTA NONOate at 50, 20, 10, 5, and 0 μM [O2], and the tclear,NO· (corre-sponding to initial NO· clearance, in the case of oscillations) was determined(open circles), and compared with the corresponding model-predicted tclear,NO·(dashed black line). The measured data points are the mean of at leastthree independent experiments, with error bars representing the SEM, andthe predicted tclear,NO· was obtained using the best-fit parameter set (fromthe initial optimization on [NO·] measured at 0 and 50 μM O2), where grayshading represents prediction uncertainty (range of viable parameter setswith ER < 10). The [NO·] curves measured at (B) 5 μM O2 and (C) 10 μM O2
(solid red line) are shown with the corresponding predicted [NO·] for thoseO2 concentrations (dashed black line). The measured [NO·] curves wereobtained from a single experiment that is representative of at least threeindependent experiments (the results of which are presented in SI Appendix,Fig. S13 A and C); the mean [NO·] was not presented because small deviations
in phase and/or period among replicates, when averaged, obscured the os-cillatory dynamics. The predicted [NO·] curves were obtained using the best-fit parameter set, with gray shading representing prediction uncertainty(range of viable parameter sets with ER < 10).
E1760 | www.pnas.org/cgi/doi/10.1073/pnas.1521354113 Robinson and Brynildsen
Dow
nloa
ded
by g
uest
on
Dec
embe
r 10
, 202
1
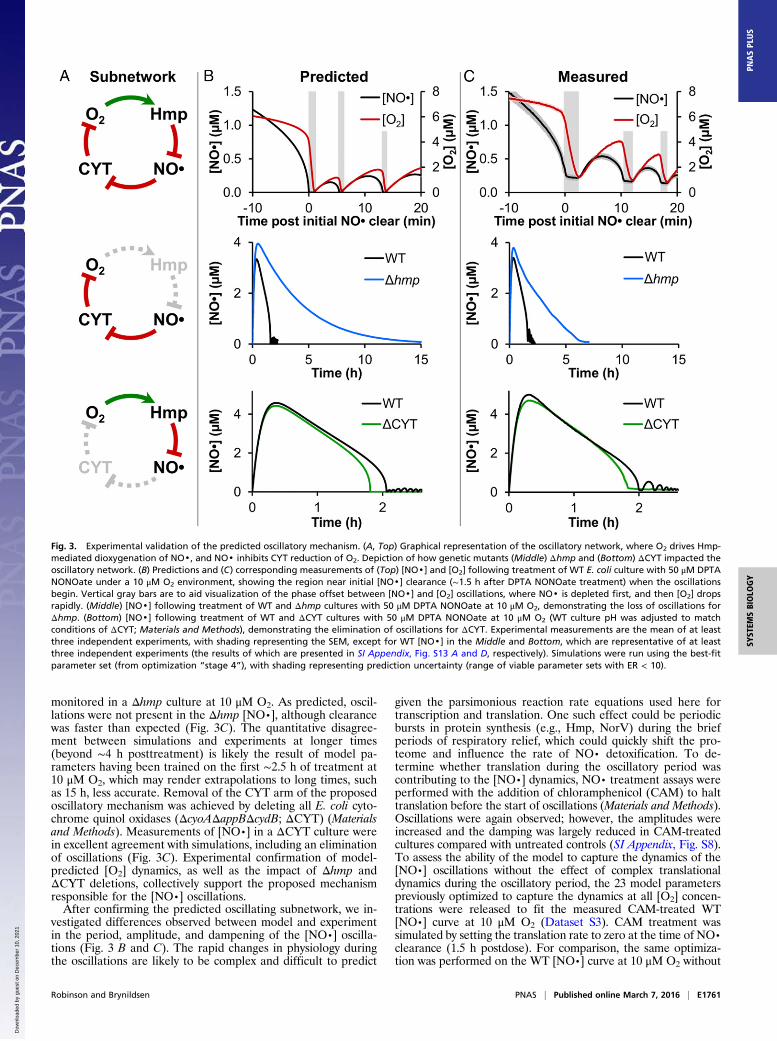
monitored in a Δhmp culture at 10 μM O2. As predicted, oscil-lations were not present in the Δhmp [NO·], although clearancewas faster than expected (Fig. 3C). The quantitative disagree-ment between simulations and experiments at longer times(beyond ∼4 h posttreatment) is likely the result of model pa-rameters having been trained on the first ∼2.5 h of treatment at10 μM O2, which may render extrapolations to long times, suchas 15 h, less accurate. Removal of the CYT arm of the proposedoscillatory mechanism was achieved by deleting all E. coli cyto-chrome quinol oxidases (ΔcyoAΔappBΔcydB; ΔCYT) (Materialsand Methods). Measurements of [NO·] in a ΔCYT culture werein excellent agreement with simulations, including an eliminationof oscillations (Fig. 3C). Experimental confirmation of model-predicted [O2] dynamics, as well as the impact of Δhmp andΔCYT deletions, collectively support the proposed mechanismresponsible for the [NO·] oscillations.After confirming the predicted oscillating subnetwork, we in-
vestigated differences observed between model and experimentin the period, amplitude, and dampening of the [NO·] oscilla-tions (Fig. 3 B and C). The rapid changes in physiology duringthe oscillations are likely to be complex and difficult to predict
given the parsimonious reaction rate equations used here fortranscription and translation. One such effect could be periodicbursts in protein synthesis (e.g., Hmp, NorV) during the briefperiods of respiratory relief, which could quickly shift the pro-teome and influence the rate of NO· detoxification. To de-termine whether translation during the oscillatory period wascontributing to the [NO·] dynamics, NO· treatment assays wereperformed with the addition of chloramphenicol (CAM) to halttranslation before the start of oscillations (Materials and Methods).Oscillations were again observed; however, the amplitudes wereincreased and the damping was largely reduced in CAM-treatedcultures compared with untreated controls (SI Appendix, Fig. S8).To assess the ability of the model to capture the dynamics of the[NO·] oscillations without the effect of complex translationaldynamics during the oscillatory period, the 23 model parameterspreviously optimized to capture the dynamics at all [O2] concen-trations were released to fit the measured CAM-treated WT[NO·] curve at 10 μM O2 (Dataset S3). CAM treatment wassimulated by setting the translation rate to zero at the time of NO·clearance (1.5 h postdose). For comparison, the same optimiza-tion was performed on the WT [NO·] curve at 10 μM O2 without
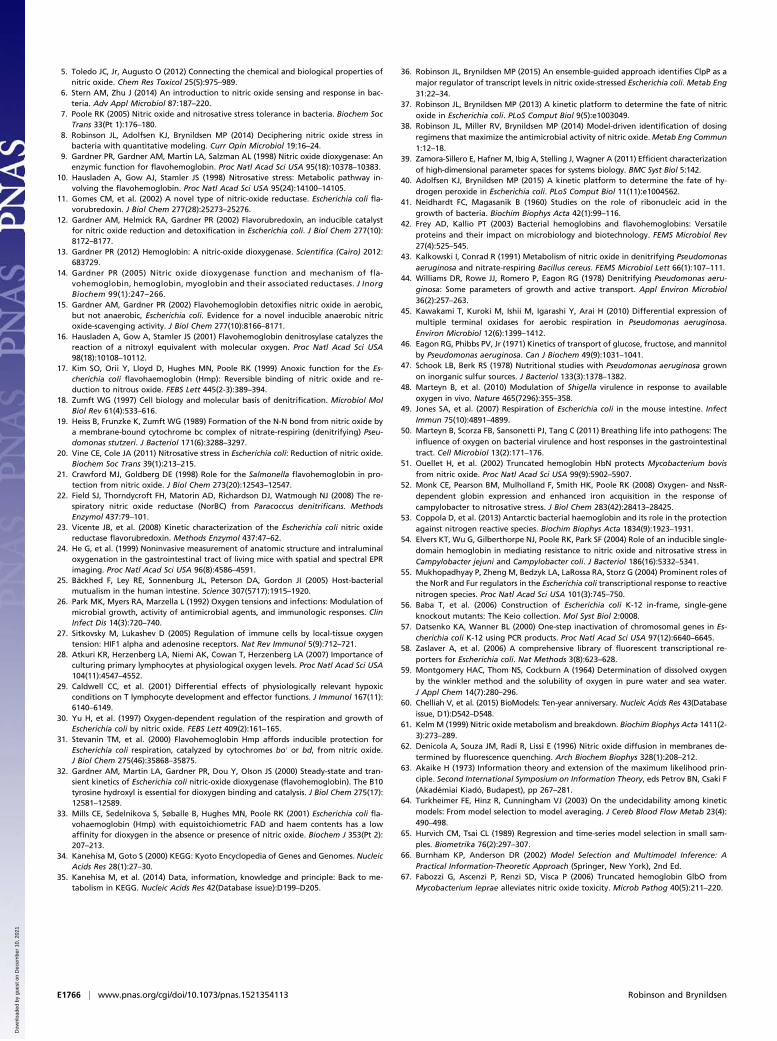
Fig. 3. Experimental validation of the predicted oscillatory mechanism. (A, Top) Graphical representation of the oscillatory network, where O2 drives Hmp-mediated dioxygenation of NO·, and NO· inhibits CYT reduction of O2. Depiction of how genetic mutants (Middle) Δhmp and (Bottom) ΔCYT impacted theoscillatory network. (B) Predictions and (C) corresponding measurements of (Top) [NO·] and [O2] following treatment of WT E. coli culture with 50 μM DPTANONOate under a 10 μM O2 environment, showing the region near initial [NO·] clearance (∼1.5 h after DPTA NONOate treatment) when the oscillationsbegin. Vertical gray bars are to aid visualization of the phase offset between [NO·] and [O2] oscillations, where NO· is depleted first, and then [O2] dropsrapidly. (Middle) [NO·] following treatment of WT and Δhmp cultures with 50 μM DPTA NONOate at 10 μM O2, demonstrating the loss of oscillations forΔhmp. (Bottom) [NO·] following treatment of WT and ΔCYT cultures with 50 μM DPTA NONOate at 10 μM O2 (WT culture pH was adjusted to matchconditions of ΔCYT; Materials and Methods), demonstrating the elimination of oscillations for ΔCYT. Experimental measurements are the mean of at leastthree independent experiments, with shading representing the SEM, except for WT [NO·] in the Middle and Bottom, which are representative of at leastthree independent experiments (the results of which are presented in SI Appendix, Fig. S13 A and D, respectively). Simulations were run using the best-fitparameter set (from optimization “stage 4”), with shading representing prediction uncertainty (range of viable parameter sets with ER < 10).
Robinson and Brynildsen PNAS | Published online March 7, 2016 | E1761
SYST
EMSBIOLO
GY
PNASPL
US
Dow
nloa
ded
by g
uest
on
Dec
embe
r 10
, 202
1
CAM addition (SI Appendix, Fig. S8A). The model was able tocapture the measured [NO·] dynamics for CAM-treated culturesfar more accurately than those that retained translational activityduring the oscillatory period, including much improved agreementin the period, amplitude, and rate of damping (SI Appendix,Fig. S8).
Oscillations in the NO· Response Network of Pseudomonas aeruginosa.Given that the metabolic stress response oscillator discovered heregenetically requires only the co-occurrence of NOD and CYTactivities, we performed a bioinformatics analysis of the KEGGdatabase (34, 35). We found that 777 different bacterial speciesharbor both NOD and CYT functions, and thereby have the ca-pacity to exhibit oscillatory behavior analogous to that of E. coli.To provide experimental evidence that the oscillator can be foundin diverse species, we chose to analyze the [NO·] dynamics ofP. aeruginosa cultures under low O2 conditions. P. aeruginosapossesses an NOD [flavohemoprotein (Fhp)] and O2-consumingcytochromes, but the network differs considerably from that ofE. coli because the Fhp sequence and structure are largely distinctfrom that of Hmp (<50% amino acid similarity) (42), P. aeruginosais denitrifying (43, 44), and encodes five aerobic terminal oxidases(Cyo, CIO, Cbb3-1, Cbb3-2, and Aa3) that differ in function(Cbb3-1, Cbb3-2, and Aa3 are cytochrome c oxidases), kinetics,and regulation from the three in E. coli (45).Initially, we investigated NO· detoxification dynamics of
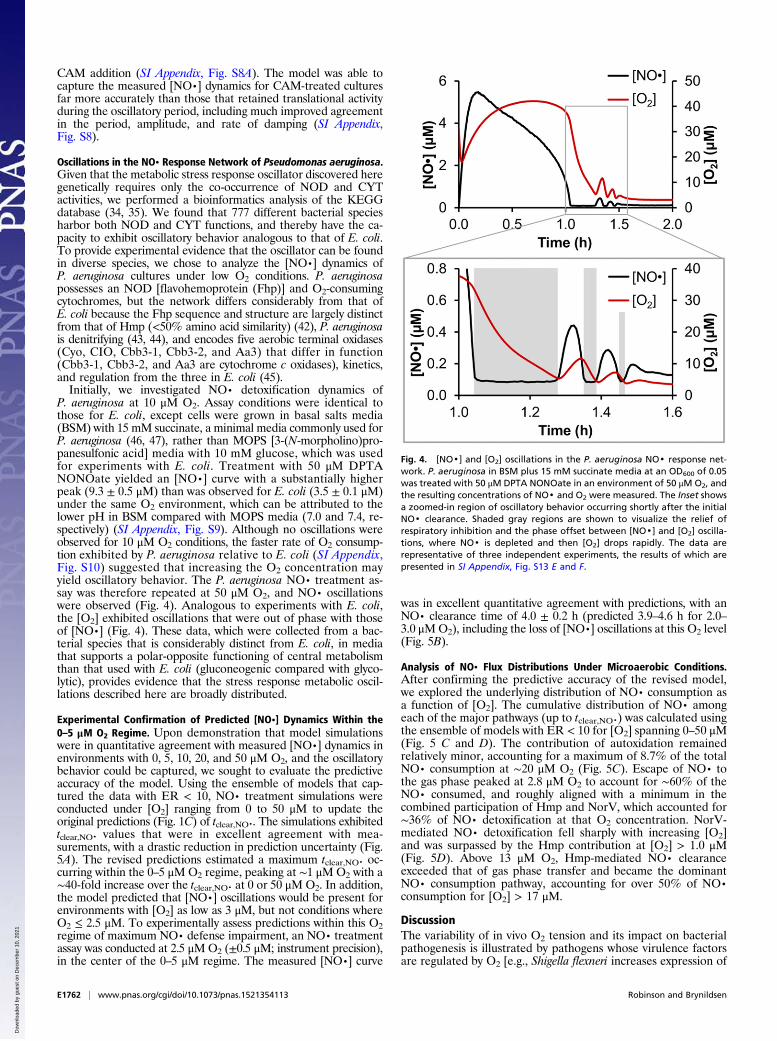
P. aeruginosa at 10 μM O2. Assay conditions were identical tothose for E. coli, except cells were grown in basal salts media(BSM) with 15 mM succinate, a minimal media commonly used forP. aeruginosa (46, 47), rather than MOPS [3-(N-morpholino)pro-panesulfonic acid] media with 10 mM glucose, which was usedfor experiments with E. coli. Treatment with 50 μM DPTANONOate yielded an [NO·] curve with a substantially higherpeak (9.3 ± 0.5 μM) than was observed for E. coli (3.5 ± 0.1 μM)under the same O2 environment, which can be attributed to thelower pH in BSM compared with MOPS media (7.0 and 7.4, re-spectively) (SI Appendix, Fig. S9). Although no oscillations wereobserved for 10 μM O2 conditions, the faster rate of O2 consump-tion exhibited by P. aeruginosa relative to E. coli (SI Appendix,Fig. S10) suggested that increasing the O2 concentration mayyield oscillatory behavior. The P. aeruginosa NO· treatment as-say was therefore repeated at 50 μM O2, and NO· oscillationswere observed (Fig. 4). Analogous to experiments with E. coli,the [O2] exhibited oscillations that were out of phase with thoseof [NO·] (Fig. 4). These data, which were collected from a bac-terial species that is considerably distinct from E. coli, in mediathat supports a polar-opposite functioning of central metabolismthan that used with E. coli (gluconeogenic compared with glyco-lytic), provides evidence that the stress response metabolic oscil-lations described here are broadly distributed.
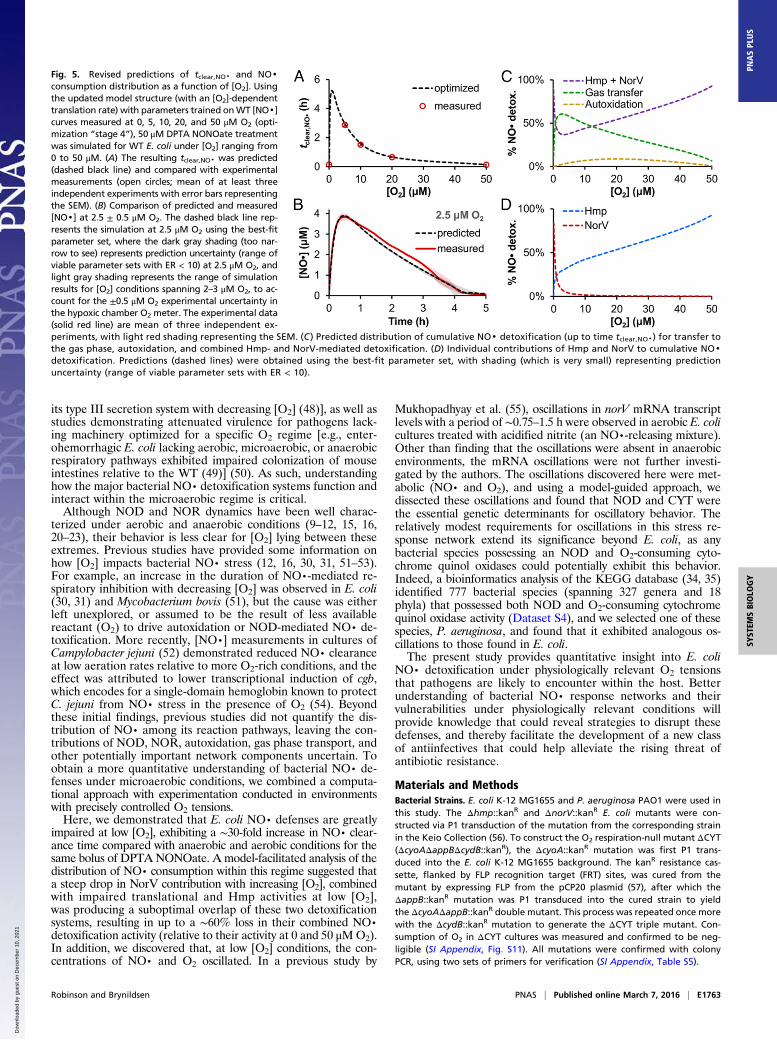
Experimental Confirmation of Predicted [NO·] Dynamics Within the0–5 μM O2 Regime. Upon demonstration that model simulationswere in quantitative agreement with measured [NO·] dynamics inenvironments with 0, 5, 10, 20, and 50 μM O2, and the oscillatorybehavior could be captured, we sought to evaluate the predictiveaccuracy of the model. Using the ensemble of models that cap-tured the data with ER < 10, NO· treatment simulations wereconducted under [O2] ranging from 0 to 50 μM to update theoriginal predictions (Fig. 1C) of tclear,NO·. The simulations exhibitedtclear,NO· values that were in excellent agreement with mea-surements, with a drastic reduction in prediction uncertainty (Fig.5A). The revised predictions estimated a maximum tclear,NO· oc-curring within the 0–5 μMO2 regime, peaking at ∼1 μMO2 with a∼40-fold increase over the tclear,NO· at 0 or 50 μM O2. In addition,the model predicted that [NO·] oscillations would be present forenvironments with [O2] as low as 3 μM, but not conditions whereO2 ≤ 2.5 μM. To experimentally assess predictions within this O2regime of maximum NO· defense impairment, an NO· treatmentassay was conducted at 2.5 μMO2 (±0.5 μM; instrument precision),in the center of the 0–5 μM regime. The measured [NO·] curve
was in excellent quantitative agreement with predictions, with anNO· clearance time of 4.0 ± 0.2 h (predicted 3.9–4.6 h for 2.0–3.0 μMO2), including the loss of [NO·] oscillations at this O2 level(Fig. 5B).
Analysis of NO· Flux Distributions Under Microaerobic Conditions.After confirming the predictive accuracy of the revised model,we explored the underlying distribution of NO· consumption asa function of [O2]. The cumulative distribution of NO· amongeach of the major pathways (up to tclear,NO·) was calculated usingthe ensemble of models with ER < 10 for [O2] spanning 0–50 μM(Fig. 5 C and D). The contribution of autoxidation remainedrelatively minor, accounting for a maximum of 8.7% of the totalNO· consumption at ∼20 μM O2 (Fig. 5C). Escape of NO· tothe gas phase peaked at 2.8 μM O2 to account for ∼60% of theNO· consumed, and roughly aligned with a minimum in thecombined participation of Hmp and NorV, which accounted for∼36% of NO· detoxification at that O2 concentration. NorV-mediated NO· detoxification fell sharply with increasing [O2]and was surpassed by the Hmp contribution at [O2] > 1.0 μM(Fig. 5D). Above 13 μM O2, Hmp-mediated NO· clearanceexceeded that of gas phase transfer and became the dominantNO· consumption pathway, accounting for over 50% of NO·consumption for [O2] > 17 μM.
DiscussionThe variability of in vivo O2 tension and its impact on bacterialpathogenesis is illustrated by pathogens whose virulence factorsare regulated by O2 [e.g., Shigella flexneri increases expression of
Fig. 4. [NO·] and [O2] oscillations in the P. aeruginosa NO· response net-work. P. aeruginosa in BSM plus 15 mM succinate media at an OD600 of 0.05was treated with 50 μM DPTA NONOate in an environment of 50 μM O2, andthe resulting concentrations of NO· and O2 were measured. The Inset showsa zoomed-in region of oscillatory behavior occurring shortly after the initialNO· clearance. Shaded gray regions are shown to visualize the relief ofrespiratory inhibition and the phase offset between [NO·] and [O2] oscilla-tions, where NO· is depleted and then [O2] drops rapidly. The data arerepresentative of three independent experiments, the results of which arepresented in SI Appendix, Fig. S13 E and F.
E1762 | www.pnas.org/cgi/doi/10.1073/pnas.1521354113 Robinson and Brynildsen
Dow
nloa
ded
by g
uest
on
Dec
embe
r 10
, 202
1
its type III secretion system with decreasing [O2] (48)], as well asstudies demonstrating attenuated virulence for pathogens lack-ing machinery optimized for a specific O2 regime [e.g., enter-ohemorrhagic E. coli lacking aerobic, microaerobic, or anaerobicrespiratory pathways exhibited impaired colonization of mouseintestines relative to the WT (49)] (50). As such, understandinghow the major bacterial NO· detoxification systems function andinteract within the microaerobic regime is critical.Although NOD and NOR dynamics have been well charac-
terized under aerobic and anaerobic conditions (9–12, 15, 16,20–23), their behavior is less clear for [O2] lying between theseextremes. Previous studies have provided some information onhow [O2] impacts bacterial NO· stress (12, 16, 30, 31, 51–53).For example, an increase in the duration of NO·-mediated re-spiratory inhibition with decreasing [O2] was observed in E. coli(30, 31) and Mycobacterium bovis (51), but the cause was eitherleft unexplored, or assumed to be the result of less availablereactant (O2) to drive autoxidation or NOD-mediated NO· de-toxification. More recently, [NO·] measurements in cultures ofCampylobacter jejuni (52) demonstrated reduced NO· clearanceat low aeration rates relative to more O2-rich conditions, and theeffect was attributed to lower transcriptional induction of cgb,which encodes for a single-domain hemoglobin known to protectC. jejuni from NO· stress in the presence of O2 (54). Beyondthese initial findings, previous studies did not quantify the dis-tribution of NO· among its reaction pathways, leaving the con-tributions of NOD, NOR, autoxidation, gas phase transport, andother potentially important network components uncertain. Toobtain a more quantitative understanding of bacterial NO· de-fenses under microaerobic conditions, we combined a computa-tional approach with experimentation conducted in environmentswith precisely controlled O2 tensions.Here, we demonstrated that E. coli NO· defenses are greatly
impaired at low [O2], exhibiting a ∼30-fold increase in NO· clear-ance time compared with anaerobic and aerobic conditions for thesame bolus of DPTA NONOate. A model-facilitated analysis of thedistribution of NO· consumption within this regime suggested thata steep drop in NorV contribution with increasing [O2], combinedwith impaired translational and Hmp activities at low [O2],was producing a suboptimal overlap of these two detoxificationsystems, resulting in up to a ∼60% loss in their combined NO·detoxification activity (relative to their activity at 0 and 50 μMO2).In addition, we discovered that, at low [O2] conditions, the con-centrations of NO· and O2 oscillated. In a previous study by
Mukhopadhyay et al. (55), oscillations in norV mRNA transcriptlevels with a period of ∼0.75–1.5 h were observed in aerobic E. colicultures treated with acidified nitrite (an NO·-releasing mixture).Other than finding that the oscillations were absent in anaerobicenvironments, the mRNA oscillations were not further investi-gated by the authors. The oscillations discovered here were met-abolic (NO· and O2), and using a model-guided approach, wedissected these oscillations and found that NOD and CYT werethe essential genetic determinants for oscillatory behavior. Therelatively modest requirements for oscillations in this stress re-sponse network extend its significance beyond E. coli, as anybacterial species possessing an NOD and O2-consuming cyto-chrome quinol oxidases could potentially exhibit this behavior.Indeed, a bioinformatics analysis of the KEGG database (34, 35)identified 777 bacterial species (spanning 327 genera and 18phyla) that possessed both NOD and O2-consuming cytochromequinol oxidase activity (Dataset S4), and we selected one of thesespecies, P. aeruginosa, and found that it exhibited analogous os-cillations to those found in E. coli.The present study provides quantitative insight into E. coli
NO· detoxification under physiologically relevant O2 tensionsthat pathogens are likely to encounter within the host. Betterunderstanding of bacterial NO· response networks and theirvulnerabilities under physiologically relevant conditions willprovide knowledge that could reveal strategies to disrupt thesedefenses, and thereby facilitate the development of a new classof antiinfectives that could help alleviate the rising threat ofantibiotic resistance.
Materials and MethodsBacterial Strains. E. coli K-12 MG1655 and P. aeruginosa PAO1 were used inthis study. The Δhmp::kanR and ΔnorV::kanR E. coli mutants were con-structed via P1 transduction of the mutation from the corresponding strainin the Keio Collection (56). To construct the O2 respiration-null mutant ΔCYT(ΔcyoAΔappBΔcydB::kanR), the ΔcyoA::kanR mutation was first P1 trans-duced into the E. coli K-12 MG1655 background. The kanR resistance cas-sette, flanked by FLP recognition target (FRT) sites, was cured from themutant by expressing FLP from the pCP20 plasmid (57), after which theΔappB::kanR mutation was P1 transduced into the cured strain to yieldthe ΔcyoAΔappB::kanR double mutant. This process was repeated once morewith the ΔcydB::kanR mutation to generate the ΔCYT triple mutant. Con-sumption of O2 in ΔCYT cultures was measured and confirmed to be neg-ligible (SI Appendix, Fig. S11). All mutations were confirmed with colonyPCR, using two sets of primers for verification (SI Appendix, Table S5).
Fig. 5. Revised predictions of tclear,NO· and NO·consumption distribution as a function of [O2]. Usingthe updated model structure (with an [O2]-dependenttranslation rate) with parameters trained onWT [NO·]curves measured at 0, 5, 10, 20, and 50 μM O2 (opti-mization “stage 4”), 50 μM DPTA NONOate treatmentwas simulated for WT E. coli under [O2] ranging from0 to 50 μM. (A) The resulting tclear,NO· was predicted(dashed black line) and compared with experimentalmeasurements (open circles; mean of at least threeindependent experiments with error bars representingthe SEM). (B) Comparison of predicted and measured[NO·] at 2.5 ± 0.5 μM O2. The dashed black line rep-resents the simulation at 2.5 μM O2 using the best-fitparameter set, where the dark gray shading (too nar-row to see) represents prediction uncertainty (range ofviable parameter sets with ER < 10) at 2.5 μM O2, andlight gray shading represents the range of simulationresults for [O2] conditions spanning 2–3 μM O2, to ac-count for the ±0.5 μM O2 experimental uncertainty inthe hypoxic chamber O2 meter. The experimental data(solid red line) are mean of three independent ex-periments, with light red shading representing the SEM. (C ) Predicted distribution of cumulative NO· detoxification (up to time tclear,NO·) for transfer tothe gas phase, autoxidation, and combined Hmp- and NorV-mediated detoxification. (D) Individual contributions of Hmp and NorV to cumulative NO·detoxification. Predictions (dashed lines) were obtained using the best-fit parameter set, with shading (which is very small) representing predictionuncertainty (range of viable parameter sets with ER < 10).
Robinson and Brynildsen PNAS | Published online March 7, 2016 | E1763
SYST
EMSBIOLO
GY
PNASPL
US
Dow
nloa
ded
by g
uest
on
Dec
embe
r 10
, 202
1
Plasmids. The Phmp-gfp and IPTG-inducible PT5-gfp plasmids were constructedin a previous study (36). Briefly, the Phmp-gfp plasmid possesses a SC101 or-igin of replication (low copy) and a kanR resistance marker obtained frompUA66 (58), and the Phmp promoter (250 nt immediately upstream of thehmp start codon) followed by the gfp coding sequence. The PT5-gfp plasmidalso possesses the SC101 origin of replication and kanR marker, as well aslacIq and IPTG-inducible PT5 promoter transferred from pQE-80L (Qiagen),with gfp expressed from PT5.
Chemicals and Growth Media. Growth media used in this study was LB Broth(BD Difco), MOPS minimal media (Teknova) with 10 mM glucose as thesole carbon source for E. coli (abbreviated here as “MOPS media”), andBSM minimal media with 15 mM succinate as the sole carbon source forP. aeruginosa. Delivery of NO· was achieved using the chemical donorDPTA NONOate (Cayman Chemical), which releases two NO· moleculesper parent compound. Antibiotics used were kanamycin (30 μg/mL) and CAM(100 μg/mL) (Fisher Scientific).
NO· Treatment Assays. A frozen −80 °C stock of E. coliwas used to inoculate 1mL of LB media in a 14-mL glass test tube, and was grown for 4 h at 37 °Cand 250 rpm. A test tube containing 1 mL of fresh MOPS media was in-oculated with 10 μL of the LB pregrowth culture, and was transferred to anincubated shaker within a hypoxic chamber (where all subsequent stepstook place) to grow overnight (16 h) at 37 °C and 200 rpm. The overnightculture was used to inoculate 20 mL of fresh MOPS media (equilibrated withthe chamber atmosphere overnight) in a 250-mL baffled shake flask to aninitial OD600 of 0.01, and grown at 37 °C and 200 rpm. When the flask cul-ture reached an OD600 of 0.2 (±0.02), an aliquot was quickly transferred to abioreactor containing 10 mL of prewarmed (37 °C) MOPS media, from whichan appropriate volume was discarded immediately before culture addition,such that the final volume and OD600 of the bioreactor culture was 10 mL and0.05, respectively. Immediately after inoculation, the bioreactor culture wastreated with 50 μM DPTA NONOate, and the concentration of NO· and/or O2
was monitored continuously (≥1 reads per s) for the duration of the assay.The assay procedure was similar for P. aeruginosa, with a few notable
differences. PAO1 cells from a −80 °C were used to inoculate 1 mL of LBmedia, which was grown overnight (16 h) in a hypoxic chamber at 37 °C and200 rpm. In a 250-mL baffled shake flask, 20 mL of BSM plus 15 mM succinatewas inoculated with 200 μL of the overnight LB culture, and was grown tomidexponential phase (OD600 = 0.2) before harvesting cells for DPTANONOate treatment (which was also conducted in BSM plus succinate media).
NO· and O2 Concentration Measurements. [NO·] in the culture was measuredusing an ISO-NOP NO· sensor (World Precision Instruments) suspended∼5 mm below the surface of the stirred bioreactor culture. The NO· probewas calibrated daily according to the manufacturer’s instructions beforemeasurements. Briefly, the NO· probe tip was suspended in a stirred 10-mLsolution of 0.1 M H2SO4 with 0.1 M KI in the bioreactor, and increasingvolumes of an aqueous nitrite standard (Fisher) were added to spontane-ously generate NO· in 1:1 molar ratio. The resulting signal was used togenerate a calibration curve facilitating conversion between probe signal (inpicoamperes) and [NO·] (in micromolar concentration).
Dissolved [O2] in the culture was measured using the fiber-optic Fire-StingO2 robust miniprobe from PyroScience, also suspended ∼5 mm belowthe surface of the stirred culture in the bioreactor. A temperature probe(PyroScience) was suspended in the water bath to automatically account forany temperature fluctuations. The O2 sensor was calibrated by allowing thesignal to stabilize in cell-free media while the chamber was open to theatmosphere, to obtain the air-saturated reading. The air-saturated [O2] forcell-free media (MOPS with 10 mM glucose or BSM with 15 mM succinate)was measured to be identical to that of deionized water at the same con-ditions (37 °C), and was thus set to 210 μM O2 (59). The factory-set value wasused for the zero-point (0% O2) reading, as it was confirmed to be accuratewhen the chamber environment was anaerobic.
Cell Viability Measurements. CFUs were quantified before and during NO·stress at 5 and 10 μMO2 conditions to assess whether a significant fraction ofthe cells were dying. A 10-μL sample was removed from the bioreactor im-mediately before DPTA NONOate treatment, and every half hour or everyhour after treatment for 10 or 5 μMO2 conditions, respectively, for a total offour samples. Each 10-μL aliquot was serially diluted in 1× PBS, delivered in10-μL spots onto LB plus agar plates, and incubated overnight (16 h) aero-bically at 37 °C. Individual colonies were counted the following day to de-termine the number of CFUs per milliliter at each time point.
Translation Rate Quantification. The rate of translation was quantified byproduction of GFP via fluorescence measurements. Plasmids possessing gfpunder control of the Phmp promoter or IPTG-inducible PT5 promoter wereconstructed in a previous study (36), and transformed into Δhmp E. coli. ThePhmp-gfp transformants were grown identically as described for the NO·treatment assay, dosed with 50 μM DPTA NONOate at 50, 10, and 5 μM O2,and 200-μL samples were removed every 30 min for 2 h to quantify GFPfluorescence (485-nm excitation, 515-nm emission). The procedure wasidentical for the PT5-gfp transformants, except the culture was induced with1 mM IPTG instead of treating with DPTA NONOate. Because cells weregrowing in the absence of DPTA NONOate treatment, samples were dilutedwith fresh MOPS media just before fluorescence measurements to maintaina constant OD600 of 0.05.
ΔCYT NO· Treatment Assay. An in silico deletion of all cytochromes in themodel was accomplished by fixing their concentrations to zero, and NO·treatment was simulated. The resulting [NO·] curve revealed a slightly fasterNO· clearance in the cytochrome-deficient mutant compared with the WT,as well as an elimination of the [NO·] oscillations (SI Appendix, Fig. S12). Toconfirm the prediction experimentally, essential subunits of cytochrome bo,bd-I, and bd-II terminal oxidases (cyoA, cydB, and appB) were deleted togenerate an O2 respiration-null mutant (ΔCYT). A ΔCYT culture was treatedwith 50 μM DPTA NONOate, and the resulting [NO·] curve revealed anelimination of the oscillations, as predicted by the model. However, the peakNO· concentration and clearance time were greater than that of the WTculture. A measurement of the culture pH at the time of dose revealed thatthe ΔCYT cells had acidified the media from a pH of 7.4 (exhibited by cell-free and WT cultures in the presence of O2) to a pH of ∼7.1, which increasesthe dissociation rate (NO· release rate) of DPTA NONOate. The experimentwas thus repeated with WT E. coli, but the culture pH was adjusted to 7.1with 2 M HCl immediately before DPTA NONOate treatment to replicate themedia conditions of the ΔCYT cells. The resulting pH-adjusted WT [NO·]curve exhibited a peak height and clearance time more similar to that ofΔCYT culture, confirming reduced pH as the source of the influence. Toreproduce this effect in the model, the DPTA NONOate release rate wasincreased until the simulated WT NO· clearance time matched that of thepH-adjusted WT measurements (∼2 h). Using this more accurate DPTANONOate release rate, NO· treatment was simulated for the ΔCYT mutantfor comparison with the pH-adjusted WT conditions.
Hypoxic Chamber. All assays in this study were conducted within a vinylhypoxic chamber with an anaerobic upgrade that was purchased from CoyLaboratory Products. The chamber environment for microaerobic experi-ments was maintained at the specified O2 concentration to within ±0.05%O2
(approximately ±0.5 μM dissolved O2 in the culture media), with ∼2,000 ppm(0.2%) CO2, and the balance N2. For anaerobic experiments, a palladiumcatalyst (Coy Laboratory Products) was placed in the chamber to eliminatetrace O2 by reacting with H2 gas, which was maintained at a level of ∼2.0%,with 0.2% CO2 and the balance N2. The environmental O2 concentrationsreported in the text refer to the concentration of dissolved O2 in cell-freemedia that was in equilibrium with the atmosphere of the hypoxic chamber(concentration after >24 h of exposure to atmosphere).
Model Construction and Simulation. The E. coli NO· model was constructed(37) and further developed (36, 38) in previous studies. Briefly, the model iscomprised of a system of ordinary differential equations (ODEs) describingthe change in concentration of biochemical species (C) as a function of in-tensive reaction rates (rI) and reaction stoichiometries (S):
dCdt
= S · r I . [1]
Reaction rates are a function of species concentrations and kinetic parameters,which were either derived from existing literature, or estimated from exper-imental measurements in this study. A complete list of all species, reactions,and kinetic parameters in the model is provided in Datasets S1 and S2, and SIAppendix, Table S1. Furthermore, an SBML version of this model was de-posited in BioModels (60) and assigned the identifier MODEL1601140000. Tofacilitate experimental parameterization and validation of the model, thesystem was partitioned into intracellular and extracellular (growth media)compartments, assuming rapid diffusion of O2 and NO· across the cell mem-brane (61, 62) (SI Appendix, Supporting Methods). Simulations were run bynumerically integrating the system of ODEs in MATLAB R2014b (The Math-Works) using the ode15s function.
E1764 | www.pnas.org/cgi/doi/10.1073/pnas.1521354113 Robinson and Brynildsen
Dow
nloa
ded
by g
uest
on
Dec
embe
r 10
, 202
1
Model simulations and analyses were conducted on a Dell OptiPlex 780desktop workstation with an Intel Core 2 Quad CPU processor at 2.66 GHz.Longer computations, such as parameter optimizations and MCMC para-metric analyses, were run on the Princeton Adroit compute cluster, an eight-node Beowulf cluster with twenty 2.50-GHz Intel Ivy Bridge processors and 64-GB RAM per node.
Incorporation of [O2] Term in Translation Rate. The rate of protein productionin the model was a function of the concentration of the associated mRNAtranscripts:
d½Protein�dt
= ktranslate½mRNA�− kdeg�Protein
�, [2]
where “Protein” is either Hmp, NorV, or NrfA, and “mRNA” is the encodingmRNA (mRNAhmp, mRNAnorV, mRNAnrfA, respectively), and the form of theequation assumes that ribosomes are not limiting. An [O2] dependency wasintroduced into the rate equation such that increased [O2] resulted in an in-creased translation rate, the effect saturated at high [O2] (dictated by theadded KO2 term), and the rate of translation was nonzero when [O2] was zero:
d½Protein�dt
= ktranslate½mRNA��1+
kact,O2½O2�
KO2 + ½O2��− kdeg
�Protein
�. [3]
Quantification of Relative Model Quality. The error of a simulated [NO·] curverelative to the corresponding experiment ([NO·]sim and [NO·]meas, re-spectively) was quantified with the SSR between the two datasets:
SSR=Xni=1
�½NO•�i,meas − ½NO•�i,sim
�2. [4]
The SSR was normalized (SSR′) by the experimental variance in [NO·] at eachtime point:
SSR′=Xni=1
�½NO•�i,meas − ½NO•�i,sim
�2
σ2i. [5]
However, for analyses and optimizations involving oscillatory [NO·] dy-namics, the SSR was not normalized, as small shifts in the phase of oscilla-tions greatly increased the variance among experimental replicates withinthe oscillatory region of [NO·] curves.
The AIC (63) was used to quantitatively assess the relative quality of fitamong models (differing in parameter values and/or reaction networkstructure) (40), which is a standard method that accounts for model–dataagreement and parametric complexity to minimize underfitting or over-fitting of the data (64). For a given model i, the AIC was calculated (64) usingthe following equation:
AICi =n ln�SSRi
n
�+ 2k, [6]
where n is the number of experimental data points, and k is the number ofparameters fit to experimental data plus one, to account for the estimationof SSR (64). To account for the relatively small sample sizes that were attimes encountered in this study [i.e., approaching less than ∼40 data pointsper varied parameter (64)], the corrected AIC (AICc) (65) was used (64):
AICc,i =AICi +2kðk+ 1Þn− k− 1
. [7]
References to “AIC” in the present study refer to this corrected form (AICc).The Akaike weight (or weight of evidence, w) of each model in a set of Mmodels was calculated from the AICc values (64):
wi =expð−Δi=2ÞXM
i=1
expð−Δi=2Þ, [8]
where Δi = AICc,i – min(AICc). Using the Akaike weight of each model, theircorresponding ERs were determined (66):
ERi =wbest
wi, [9]
where wbest is the weight of the best-fit (lowest AIC) model. The ER, whichrepresents the likelihood of each model relative to the best-fit model (66),was used to quantitatively compare models during the MCMC parametricexploration process, where models with an ER ≥ 10 were considered non-viable (SI Appendix, Supporting Methods) (40).
Parameter Optimization. Optimization of model parameters was accomplishedusing the MATLAB lsqcurvefit function, where specified parameters wereallowed to vary within set bounds to minimize the SSR between simulated andexperimentally measured data. Given the often high dimensionality and non-convex nature of the optimizations conducted in the present study, eachminimization process was repeated 2,000 times with random initial parametervalues to improve coverage of the parameter space. In some cases, the viableparameter space was further explored by subsequently using an out-of-equi-librium adaptive Metropolis MCMC method (39) to identify additional param-eter sets with similar or improved quality of fit compared with those identifiedfrom the initial optimization (SI Appendix, Supporting Methods). The relativequality of fit of the different parameter sets was evaluated using AIC, whereoptimized parameter sets were ranked according to their ER. The best pa-rameter set (associated with the minimal SSR, and an ER = 1), as well as thoseexhibiting an ER less than 10 (i.e., at least 10% as likely as the optimal set), wereretained as the viable parameter sets for that particular optimization.
Bioinformatic Analysis of KEGG Database. To estimate the number and di-versity of bacterial species possessing NOD and O2-consuming cytochromeoxidoreductase activity, the KEGG database (34, 35) was searched for allunique bacterial species known to possess a NOD (EC 1.14.12.17) and eithercytochrome bo or bd quinol oxidase (EC 1.10.3.-). The search yielded 485species, spanning 167 genera and nine phyla (Dataset S4). Because truncatedhemoglobins (trHbNs) have been found to exhibit NOD activity [e.g., theGlbN (51) and GlbO (67) proteins of M. tuberculosis and Mycobacteriumleprae, respectively], the search was expanded to include trHbNs, resulting ina total of 777 bacterial species likely to possess both NOD and O2-consumingcytochrome quinol oxidase activity (Dataset S4).
Reaction Deletion (Model Reduction) Analysis. Random reactions were deletedone-by-one from the model, verifying after each deletion that the quality offit was not compromised (quantified as maintaining an ER < 10), until noadditional reactions could be removed. To avoid influence of the path taken(order in which reactions were deleted) on the final set of reactionsobtained, the process was repeated 100 times, and the model with the leastnumber of reactions was selected. Two different models were identified asthe smallest (45 reactions, or 23% of the original 196 reactions), differing inonly one reaction (one model possessed the NADH-mediated reduction ofHmp, whereas the other contained the NADPH-mediated variant) (SI Ap-pendix, Table S4). The remaining reactions were then deleted individually,manually inspecting the resulting [NO·] curve to determine which reactionseliminated oscillations upon removal. Reactions found to eliminate oscilla-tions upon removal were NO· release from DPTA NONOate, exchange ofNO· and O2 with the gas phase, and reactions associated with Hmp, NorV,and CYT. However, simultaneous removal of all remaining NorV-associatedreactions had no effect on the [NO·] oscillations, further distilling the set ofcellular reactions to include only Hmp and CYT (SI Appendix, Table S4).
ACKNOWLEDGMENTS. We thank Profs. Vassily Hatzimanikatis, Stanislav Y.Shvartsman, and Ned S. Wingreen for helpful discussions, and acknowledgethe National BioResource Project (NIG) for distribution of the Keio collection.We also thank Kristin Adolfsen and Katherine Volzing for assistance with thehypoxic chamber. Some portions of the computational work reported in thisstudy were performed using the Terascale Infrastructure for GroundbreakingResearch in Science and Engineering high-performance computer center atPrinceton University, which is jointly supported by the Princeton Institute forComputational Science and Engineering and the Princeton University Office ofInformation Technology’s Research Computing department. This work was sup-ported by National Science Foundation Grants CBET-1453325 and DGE-1148900,and by Princeton University (Forese Family Fund for Innovation, start-up funds).
1. Nathan C, Shiloh MU (2000) Reactive oxygen and nitrogen intermediates in the re-lationship between mammalian hosts and microbial pathogens. Proc Natl Acad SciUSA 97(16):8841–8848.
2. Bogdan C (2015) Nitric oxide synthase in innate and adaptive immunity: An update.Trends Immunol 36(3):161–178.
3. Fang FC (2004) Antimicrobial reactive oxygen and nitrogen species: Concepts andcontroversies. Nat Rev Microbiol 2(10):820–832.
4. Bowman LAH, McLean S, Poole RK, Fukuto JM (2011) The diversity of microbial re-sponses to nitric oxide and agents of nitrosative stress close cousins but not identicaltwins. Adv Microb Physiol 59:135–219.
Robinson and Brynildsen PNAS | Published online March 7, 2016 | E1765
SYST
EMSBIOLO
GY
PNASPL
US
Dow
nloa
ded
by g
uest
on
Dec
embe
r 10
, 202
1
5. Toledo JC, Jr, Augusto O (2012) Connecting the chemical and biological properties ofnitric oxide. Chem Res Toxicol 25(5):975–989.
6. Stern AM, Zhu J (2014) An introduction to nitric oxide sensing and response in bac-teria. Adv Appl Microbiol 87:187–220.
7. Poole RK (2005) Nitric oxide and nitrosative stress tolerance in bacteria. Biochem SocTrans 33(Pt 1):176–180.
8. Robinson JL, Adolfsen KJ, Brynildsen MP (2014) Deciphering nitric oxide stress inbacteria with quantitative modeling. Curr Opin Microbiol 19:16–24.
9. Gardner PR, Gardner AM, Martin LA, Salzman AL (1998) Nitric oxide dioxygenase: Anenzymic function for flavohemoglobin. Proc Natl Acad Sci USA 95(18):10378–10383.
10. Hausladen A, Gow AJ, Stamler JS (1998) Nitrosative stress: Metabolic pathway in-volving the flavohemoglobin. Proc Natl Acad Sci USA 95(24):14100–14105.
11. Gomes CM, et al. (2002) A novel type of nitric-oxide reductase. Escherichia coli fla-vorubredoxin. J Biol Chem 277(28):25273–25276.
12. Gardner AM, Helmick RA, Gardner PR (2002) Flavorubredoxin, an inducible catalystfor nitric oxide reduction and detoxification in Escherichia coli. J Biol Chem 277(10):8172–8177.
13. Gardner PR (2012) Hemoglobin: A nitric-oxide dioxygenase. Scientifica (Cairo) 2012:683729.
14. Gardner PR (2005) Nitric oxide dioxygenase function and mechanism of fla-vohemoglobin, hemoglobin, myoglobin and their associated reductases. J InorgBiochem 99(1):247–266.
15. Gardner AM, Gardner PR (2002) Flavohemoglobin detoxifies nitric oxide in aerobic,but not anaerobic, Escherichia coli. Evidence for a novel inducible anaerobic nitricoxide-scavenging activity. J Biol Chem 277(10):8166–8171.
16. Hausladen A, Gow A, Stamler JS (2001) Flavohemoglobin denitrosylase catalyzes thereaction of a nitroxyl equivalent with molecular oxygen. Proc Natl Acad Sci USA98(18):10108–10112.
17. Kim SO, Orii Y, Lloyd D, Hughes MN, Poole RK (1999) Anoxic function for the Es-cherichia coli flavohaemoglobin (Hmp): Reversible binding of nitric oxide and re-duction to nitrous oxide. FEBS Lett 445(2-3):389–394.
18. Zumft WG (1997) Cell biology and molecular basis of denitrification. Microbiol MolBiol Rev 61(4):533–616.
19. Heiss B, Frunzke K, Zumft WG (1989) Formation of the N-N bond from nitric oxide bya membrane-bound cytochrome bc complex of nitrate-respiring (denitrifying) Pseu-domonas stutzeri. J Bacteriol 171(6):3288–3297.
20. Vine CE, Cole JA (2011) Nitrosative stress in Escherichia coli: Reduction of nitric oxide.Biochem Soc Trans 39(1):213–215.
21. Crawford MJ, Goldberg DE (1998) Role for the Salmonella flavohemoglobin in pro-tection from nitric oxide. J Biol Chem 273(20):12543–12547.
22. Field SJ, Thorndycroft FH, Matorin AD, Richardson DJ, Watmough NJ (2008) The re-spiratory nitric oxide reductase (NorBC) from Paracoccus denitrificans. MethodsEnzymol 437:79–101.
23. Vicente JB, et al. (2008) Kinetic characterization of the Escherichia coli nitric oxidereductase flavorubredoxin. Methods Enzymol 437:47–62.
24. He G, et al. (1999) Noninvasive measurement of anatomic structure and intraluminaloxygenation in the gastrointestinal tract of living mice with spatial and spectral EPRimaging. Proc Natl Acad Sci USA 96(8):4586–4591.
25. Bäckhed F, Ley RE, Sonnenburg JL, Peterson DA, Gordon JI (2005) Host-bacterialmutualism in the human intestine. Science 307(5717):1915–1920.
26. Park MK, Myers RA, Marzella L (1992) Oxygen tensions and infections: Modulation ofmicrobial growth, activity of antimicrobial agents, and immunologic responses. ClinInfect Dis 14(3):720–740.
27. Sitkovsky M, Lukashev D (2005) Regulation of immune cells by local-tissue oxygentension: HIF1 alpha and adenosine receptors. Nat Rev Immunol 5(9):712–721.
28. Atkuri KR, Herzenberg LA, Niemi AK, Cowan T, Herzenberg LA (2007) Importance ofculturing primary lymphocytes at physiological oxygen levels. Proc Natl Acad Sci USA104(11):4547–4552.
29. Caldwell CC, et al. (2001) Differential effects of physiologically relevant hypoxicconditions on T lymphocyte development and effector functions. J Immunol 167(11):6140–6149.
30. Yu H, et al. (1997) Oxygen-dependent regulation of the respiration and growth ofEscherichia coli by nitric oxide. FEBS Lett 409(2):161–165.
31. Stevanin TM, et al. (2000) Flavohemoglobin Hmp affords inducible protection forEscherichia coli respiration, catalyzed by cytochromes bo′ or bd, from nitric oxide.J Biol Chem 275(46):35868–35875.
32. Gardner AM, Martin LA, Gardner PR, Dou Y, Olson JS (2000) Steady-state and tran-sient kinetics of Escherichia coli nitric-oxide dioxygenase (flavohemoglobin). The B10tyrosine hydroxyl is essential for dioxygen binding and catalysis. J Biol Chem 275(17):12581–12589.
33. Mills CE, Sedelnikova S, Søballe B, Hughes MN, Poole RK (2001) Escherichia coli fla-vohaemoglobin (Hmp) with equistoichiometric FAD and haem contents has a lowaffinity for dioxygen in the absence or presence of nitric oxide. Biochem J 353(Pt 2):207–213.
34. Kanehisa M, Goto S (2000) KEGG: Kyoto Encyclopedia of Genes and Genomes. NucleicAcids Res 28(1):27–30.
35. Kanehisa M, et al. (2014) Data, information, knowledge and principle: Back to me-tabolism in KEGG. Nucleic Acids Res 42(Database issue):D199–D205.
36. Robinson JL, Brynildsen MP (2015) An ensemble-guided approach identifies ClpP as amajor regulator of transcript levels in nitric oxide-stressed Escherichia coli. Metab Eng31:22–34.
37. Robinson JL, Brynildsen MP (2013) A kinetic platform to determine the fate of nitricoxide in Escherichia coli. PLoS Comput Biol 9(5):e1003049.
38. Robinson JL, Miller RV, Brynildsen MP (2014) Model-driven identification of dosingregimens that maximize the antimicrobial activity of nitric oxide.Metab Eng Commun1:12–18.
39. Zamora-Sillero E, Hafner M, Ibig A, Stelling J, Wagner A (2011) Efficient characterizationof high-dimensional parameter spaces for systems biology. BMC Syst Biol 5:142.
40. Adolfsen KJ, Brynildsen MP (2015) A kinetic platform to determine the fate of hy-drogen peroxide in Escherichia coli. PLoS Comput Biol 11(11):e1004562.
41. Neidhardt FC, Magasanik B (1960) Studies on the role of ribonucleic acid in thegrowth of bacteria. Biochim Biophys Acta 42(1):99–116.
42. Frey AD, Kallio PT (2003) Bacterial hemoglobins and flavohemoglobins: Versatileproteins and their impact on microbiology and biotechnology. FEMS Microbiol Rev27(4):525–545.
43. Kalkowski I, Conrad R (1991) Metabolism of nitric oxide in denitrifying Pseudomonasaeruginosa and nitrate-respiring Bacillus cereus. FEMS Microbiol Lett 66(1):107–111.
44. Williams DR, Rowe JJ, Romero P, Eagon RG (1978) Denitrifying Pseudomonas aeru-ginosa: Some parameters of growth and active transport. Appl Environ Microbiol36(2):257–263.
45. Kawakami T, Kuroki M, Ishii M, Igarashi Y, Arai H (2010) Differential expression ofmultiple terminal oxidases for aerobic respiration in Pseudomonas aeruginosa.Environ Microbiol 12(6):1399–1412.
46. Eagon RG, Phibbs PV, Jr (1971) Kinetics of transport of glucose, fructose, and mannitolby Pseudomonas aeruginosa. Can J Biochem 49(9):1031–1041.
47. Schook LB, Berk RS (1978) Nutritional studies with Pseudomonas aeruginosa grownon inorganic sulfur sources. J Bacteriol 133(3):1378–1382.
48. Marteyn B, et al. (2010) Modulation of Shigella virulence in response to availableoxygen in vivo. Nature 465(7296):355–358.
49. Jones SA, et al. (2007) Respiration of Escherichia coli in the mouse intestine. InfectImmun 75(10):4891–4899.
50. Marteyn B, Scorza FB, Sansonetti PJ, Tang C (2011) Breathing life into pathogens: Theinfluence of oxygen on bacterial virulence and host responses in the gastrointestinaltract. Cell Microbiol 13(2):171–176.
51. Ouellet H, et al. (2002) Truncated hemoglobin HbN protects Mycobacterium bovisfrom nitric oxide. Proc Natl Acad Sci USA 99(9):5902–5907.
52. Monk CE, Pearson BM, Mulholland F, Smith HK, Poole RK (2008) Oxygen- and NssR-dependent globin expression and enhanced iron acquisition in the response ofcampylobacter to nitrosative stress. J Biol Chem 283(42):28413–28425.
53. Coppola D, et al. (2013) Antarctic bacterial haemoglobin and its role in the protectionagainst nitrogen reactive species. Biochim Biophys Acta 1834(9):1923–1931.
54. Elvers KT, Wu G, Gilberthorpe NJ, Poole RK, Park SF (2004) Role of an inducible single-domain hemoglobin in mediating resistance to nitric oxide and nitrosative stress inCampylobacter jejuni and Campylobacter coli. J Bacteriol 186(16):5332–5341.
55. Mukhopadhyay P, Zheng M, Bedzyk LA, LaRossa RA, Storz G (2004) Prominent roles ofthe NorR and Fur regulators in the Escherichia coli transcriptional response to reactivenitrogen species. Proc Natl Acad Sci USA 101(3):745–750.
56. Baba T, et al. (2006) Construction of Escherichia coli K-12 in-frame, single-geneknockout mutants: The Keio collection. Mol Syst Biol 2:0008.
57. Datsenko KA, Wanner BL (2000) One-step inactivation of chromosomal genes in Es-cherichia coli K-12 using PCR products. Proc Natl Acad Sci USA 97(12):6640–6645.
58. Zaslaver A, et al. (2006) A comprehensive library of fluorescent transcriptional re-porters for Escherichia coli. Nat Methods 3(8):623–628.
59. Montgomery HAC, Thom NS, Cockburn A (1964) Determination of dissolved oxygenby the winkler method and the solubility of oxygen in pure water and sea water.J Appl Chem 14(7):280–296.
60. Chelliah V, et al. (2015) BioModels: Ten-year anniversary. Nucleic Acids Res 43(Databaseissue, D1):D542–D548.
61. KelmM (1999) Nitric oxide metabolism and breakdown. Biochim Biophys Acta 1411(2-3):273–289.
62. Denicola A, Souza JM, Radi R, Lissi E (1996) Nitric oxide diffusion in membranes de-termined by fluorescence quenching. Arch Biochem Biophys 328(1):208–212.
63. Akaike H (1973) Information theory and extension of the maximum likelihood prin-ciple. Second International Symposium on Information Theory, eds Petrov BN, Csaki F(Akadémiai Kiadó, Budapest), pp 267–281.
64. Turkheimer FE, Hinz R, Cunningham VJ (2003) On the undecidability among kineticmodels: From model selection to model averaging. J Cereb Blood Flow Metab 23(4):490–498.
65. Hurvich CM, Tsai CL (1989) Regression and time-series model selection in small sam-ples. Biometrika 76(2):297–307.
66. Burnham KP, Anderson DR (2002) Model Selection and Multimodel Inference: APractical Information-Theoretic Approach (Springer, New York), 2nd Ed.
67. Fabozzi G, Ascenzi P, Renzi SD, Visca P (2006) Truncated hemoglobin GlbO fromMycobacterium leprae alleviates nitric oxide toxicity. Microb Pathog 40(5):211–220.
E1766 | www.pnas.org/cgi/doi/10.1073/pnas.1521354113 Robinson and Brynildsen
Dow
nloa
ded
by g
uest
on
Dec
embe
r 10
, 202
1


![Systematic Oscillations in Metabolic Activity in Rat Liver ...cancerres.aacrjournals.org/content/canres/26/7_Part_1/1547.full.pdf · [CANCER RESEARCH 26 Part 1, 1547-1560, July 1966]](https://img.pdfslide.us/doc/110x75/5a8274ba7f8b9a24668dbd06/systematic-oscillations-in-metabolic-activity-in-rat-liver-cancer-research-26.jpg)


![Dissection-BKW · 2018. 6. 1. · Dissection. Wereplaceournaive c -sumalgorithmbymoreadvancedtime-memorytechniqueslike Schroeppel-Shamir[34]anditsgeneralization,Dissection[11],toreducetheclassicrunningtime.Wecall](https://img.pdfslide.us/doc/110x75/5ffc5cc4c887922f656f708b/dissection-bkw-2018-6-1-dissection-wereplaceournaive-c-sumalgorithmbymoreadvancedtime-memorytechniqueslike.jpg)