Embed Size (px)
Citation preview
Discovering Characteristic Landmarks on Ancient Coinsusing Convolutional Networks
Jongpil Kim and Vladimir PavlovicRutgers, The State University of New Jersey
{jpkim, vladimir}@cs.rutgers.edu
Abstract
In this paper, we propose a novel method to find charac-teristic landmarks on ancient Roman imperial coins usingdeep convolutional neural network models (CNNs). We for-mulate an optimization problem to discover class-specificregions while guaranteeing specific controlled loss of ac-curacy. Analysis on visualization of the discovered regionconfirms that not only can the proposed method success-fully find a set of characteristic regions per class, , but alsothe discovered region is consistent with human expert an-notations. We also propose a new framework to recognizethe Roman coins which exploits hierarchical structure ofthe ancient Roman coins using the state-of-the-art classi-fication power of the CNNs adopted to a new task of coinclassification. Experimental results show that the proposedframework is able to effectively recognize the ancient Ro-man coins. For this research, we have collected a new Ro-man coin dataset where all coins are annotated and consistof observe (head) and reverse (tail) images.
1. Introduction
The ancient Roman coins have not only bullion valuesfrom precious materials such as gold and silver, but alsothey provide people with beautiful and historical arts of re-lief. They were first introduced during the third century BCand continued to be minted well across Imperial times. Themajor role of the Roman coins was to make an exchangeof goods and services easy for the Roman commerce. An-other important role in which researchers in numismaticshave been interested is to convey historical events or newsof the Roman empire via images on the coins. Especially,the Roman imperial coins were used to provide politicalpropaganda across the empire by engraving portraits of theRoman emperors or important achievement of the empire.As the Roman imperial coins are closely connect to the his-torical events of the empire, they could serve as importancereferences to understand the history of the Roman empire.
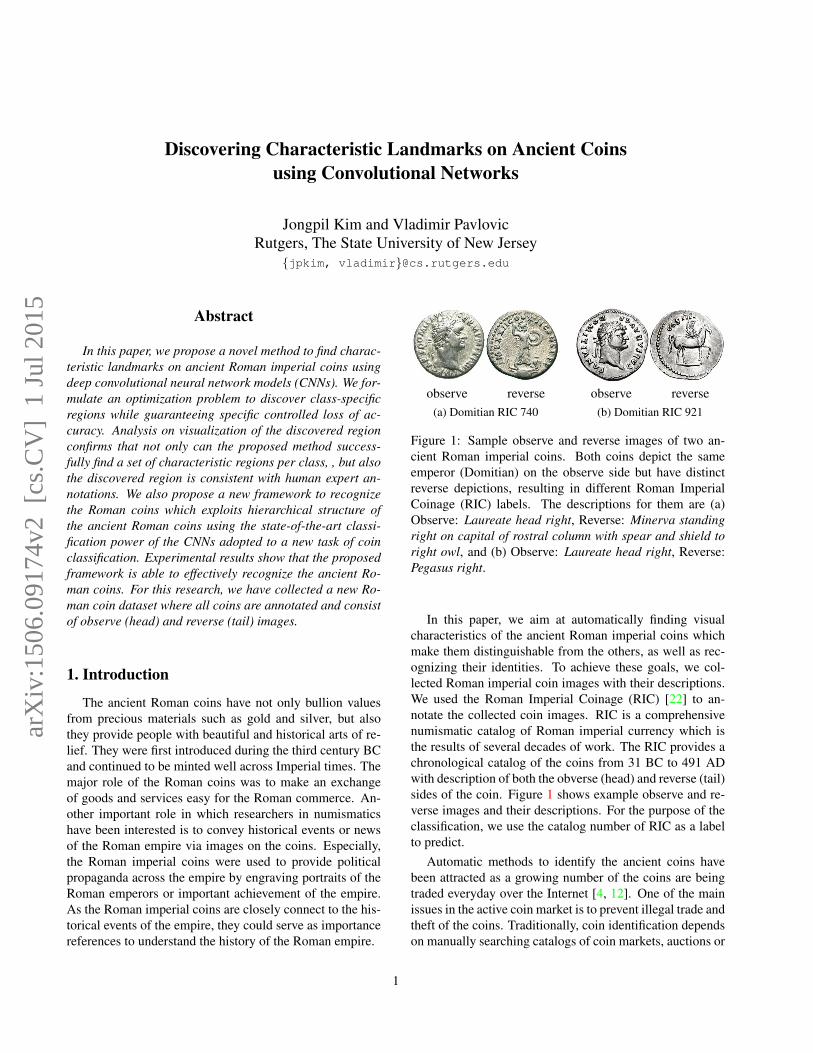
observe reverse(a) Domitian RIC 740
observe reverse(b) Domitian RIC 921
Figure 1: Sample observe and reverse images of two an-cient Roman imperial coins. Both coins depict the sameemperor (Domitian) on the observe side but have distinctreverse depictions, resulting in different Roman ImperialCoinage (RIC) labels. The descriptions for them are (a)Observe: Laureate head right, Reverse: Minerva standingright on capital of rostral column with spear and shield toright owl, and (b) Observe: Laureate head right, Reverse:Pegasus right.
In this paper, we aim at automatically finding visualcharacteristics of the ancient Roman imperial coins whichmake them distinguishable from the others, as well as rec-ognizing their identities. To achieve these goals, we col-lected Roman imperial coin images with their descriptions.We used the Roman Imperial Coinage (RIC) [22] to an-notate the collected coin images. RIC is a comprehensivenumismatic catalog of Roman imperial currency which isthe results of several decades of work. The RIC provides achronological catalog of the coins from 31 BC to 491 ADwith description of both the obverse (head) and reverse (tail)sides of the coin. Figure 1 shows example observe and re-verse images and their descriptions. For the purpose of theclassification, we use the catalog number of RIC as a labelto predict.
Automatic methods to identify the ancient coins havebeen attracted as a growing number of the coins are beingtraded everyday over the Internet [4, 12]. One of the mainissues in the active coin market is to prevent illegal trade andtheft of the coins. Traditionally, coin identification dependson manually searching catalogs of coin markets, auctions or
1
arX
iv:1
506.
0917
4v2
[cs
.CV
] 1
Jul
201
5
the Internet. However, it is impossible for the manual searchto cover all trades because the coin market is very active, forexample, over a half million coins are traded annually onlyin the north American market [12]. Therefore, automaticidentification of the ancient coins becomes significant.
Several works on coin classification have appeared inthe computer vision field. Some proposed methods use theedge detection of the engraved image on the coin [23, 26].Others represent the coin images as local features such asSIFT [20] and perform the classification [14]. Methodsusing the spatial pyramid models [3] and orientations ofpixels [4] are proposed to exploit the spatial information.Aligning coin images using the deformable part models hasrefined the recognition accuracy over the standard spatialpyramid models [15].
In this paper, we propose an automatic recognitionmethod for the Roman imperial coins using the convolu-tional neural network models (CNNs). Recently, the CNNmodels have shown the state-of-the-art performance in vari-ous computer vision problems including recognition, detec-tion and segmentation [8, 11, 27, 28], driven by the increas-ing availability of large training dataset and the improve-ment of the computational power of the GPUs. In this paper,we propose a hierarchical framework which employs theCNN models for the coin classification tasks by fine-tuninga pre-trained CNN model on the ImageNet dataset [7].
Second, we propose a novel method to find character-istic landmarks on the coin images. Our method is moti-vated by class saliency extraction proposed in [24] to findclass-sensitive regions. In this paper, we formulate an opti-mization problem so that a minimal set of the parts on thecoin image will be selected while the chosen set is still berecognized as the same category as the full image by theCNN models. We consider the chosen parts are deemed thepersistent, discriminative landmarks of the coin. Such land-marks can be critical for analysis of coin features by domainexperts, such as numismatists or historians.
The contributions of the paper can be highlighted asfollows: 1) a new coin data set where all the coins haveboth observe (head) and reverse (tail) images with annota-tions, 2) a new framework of recognizing the Ancient Ro-man coins based on the CNNs, 3) a new optimization-basedmethod to automatically find characteristic regions usingthe CNNs while guaranteeing specific controlled loss of ac-curacy.
2. Related WorkThere have been several methods to recognize coins in
the computer vision field. Bag-of-words approaches withextracted visual descriptors for the coin recognition wereproposed in [2, 3, 4, 15]. A directional kernel to considerorientations of pixels [4] and an angle histogram method [2]were proposed to use the explicit spatial information. In [3],
rectangular spatial tiling, log-polar spatial tiling and circu-lar spatial tiling methods were used to recognize the ancientcoins. Aligning the coin images by the deformable partmodel (DPM) [9] further improves the recognition accuracyover the standard spatial pyramid model [15]. In this paper,we use the CNNs which exploit the spatial information byperforming the convolution and handle the displacement ofthe coin image by performing the max-pooling.
The Roman imperial coin classification problem can beformulated as the fine-grained classification as all coins be-long to one super class, coin. To identify one class from theother looking-similar classes, which is one of the challengesin the fine-grained classification, people have conducted re-search on the part-based models so that objects are dividedinto a set of smaller parts and classification is performed bycomparing the parts [5, 10]. However, those methods re-quire annotated part labels while training, which takes aneffort to obtain. In this paper, we investigate an automaticmethod to find discriminative regions on the coins whichdoes not depend on human’s effort.
With the impressive performance of the deep convolu-tional neural network models, a lot of papers have been pro-posed to understand why and how they perform so well andgive insight the behaviors of the internal layers. The decon-volutional network [27] visualized the feature activities inthe intermediate layers of the CNN models by mapping fea-tures to pixels in the reverse order. A data-driven approachto visualize the receptive field of the neuron in the networkwas proposed in [30]. The method in [30] is based on theexhaustive search using the sliding-window technique andmeasures the difference between presence and absence ofone window on the coin image. In [24], they propose anoptimization method to reconstruct a representative imageof a class from an empty image by calculating a gradient ofthe CNN model with respect to the image. In this paper, wepropose a novel method to find discriminative landmarksof the coin image by formulating on optimization problem.Unlike [30] which requires exhaustive CNN evaluations forthe sliding windows, our method effectively finds a set ofdiscriminative regions by performing the optimization.
3. Proposed MethodIn this section, we first describe how to train our convo-
lutional neural network model for the task of the Roman im-perial coin classification. Then, we propose a novel methodto discover characteristic landmarks which make one coindistinguishable from the others.
3.1. Training Convolutional Neural Network forCoin Classification
The convolutional neural network (CNN) is the mostpopular deep learning method which was heavily studiedin 1990s [18]. Recently, a large amount of labeled data
and computational power using GPUs make it possible thatthe convolutional network becomes the most accurate ob-ject classification method [16].
Let Sc(x) be the score of class c for input x, which isfed to a classification layer (e.g., 1000-way softmax layer in[16]). Assuming that the softmax loss function is used, theloss function `c of the CNNs can be defined as:
`c(x;w) = − log
(exp (Sc(x;w))∑c′ exp (Sc′(x;w))
), (1)
where w are the weights of the complex, highly structured,deep CNNs. Then, stochastic gradient descent is used tominimize the loss `c by computing gradient with respect tow as ∂`c/∂w.
Although the CNN models are successful when there ex-ists large amount of labeled data, they are likely to per-form poorly on small datasets because there are millionsof parameters to be estimated [29]. To overcome the limita-tion on the small data, a method to finetune the pre-trainedmodel for new tasks was proposed, having shown success-ful performance [19, 28, 31]. In the fine-tunning method,we only need to change the softmax layer (which is the usu-ally the last layer of the CNN models) appropriately for thenew task.
Considering the number of the coin images in our dataset(about 4500), the CNN model is likely to be under-fittedif we train it only on the coin dataset even if we use thedata augmentation method [16]. Therefore, we train a deepconvolution neural network (CNN) model in the fine-tuningmanner. To achieve the goal, we adopt one of the most pop-ular architecture proposed by Krizhevsky et al. [16] whichis pre-trained on the ImagetNet with millions of natural im-ages. Specifically, we change the softmax layer of [16]for our classification purpose, and then finetune the covolu-tional network under the supervised setting. When training,we resize the original coin image to 256×256 and randomlycrop a sub region of size 224 × 224 as the data augmenta-tion discussed in [16]. When testing, we crop the centerof the coin. We use the open-source package Caffe [13] toimplement our CNN model.
3.2. Hierarchical Classification
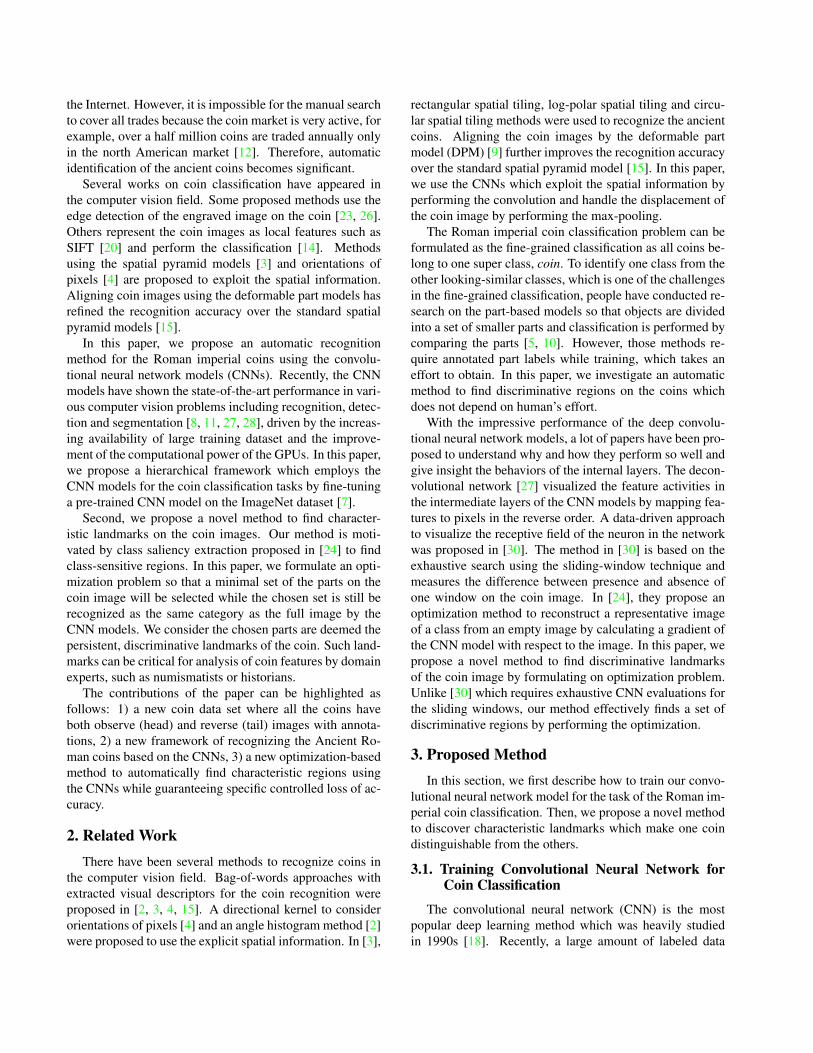
Each coin in our dataset has both observe (head) and re-verse (tail) images. A straight-forward method to use bothimages is to feed them together to classifiers (e.g., SVMor CNN) when training. In this paper, we exploit a hier-archical structure of the Roman imperial coins. One Ro-man emperor includes several RIC labels as shown in Fig-ure 1 while one RIC label belongs to exactly one emperor.Therefore, we can build a tree structure to represent the re-lationship between the Roman emperors and the RIC labelsas depicted in Figure 2. In the Emperor layer, we com-pute probability p(e|Io) for Emperor e given observe im-
Emperor
RIC
e
r
Io
Ir
p(e|Io)
… p(r|Ir)
p(e|Io) · p(r|Ir) · �(Pa(r) = e)
Figure 2: Hierarchical classification for the RIC label. Ioand Ir are the observe and reverse images, respectively. Inthe Emperor layer, we compute the probability of RIC labelr given reverse image Ir (resp., in the RIC layer, probabilityof e given Io ). Then the final prediction is defined as theproduct of the probabilities on the path from the root to theleaf.
age Io, and in the RIC layer, p(r|Ir) for RIC label r givenIr. Then the final probability is defined to be the productof the probabilities on the path from the root to the leaf asp(e|Io) · p(r|Ir) · δ(Pa(r) = e) where Pa(r) is the parentof node r and δ(·) is the indicator function.
For this purpose, we train two CNN models, one for theRIC label taking the reverse image and the other for theRoman emperor taking observe image. For a given pair ob-serve and reverse images, we evaluate the probabilities onthe nodes in the tree and choose the leaf node with the max-imum value as the prediction result.
3.3. Finding Characteristic Landmarks on RomanCoins
The coin classification problem can be considered as thefine-grained classification problem as all the images belongto one super class. Finding discriminative regions that rep-resent class characteristics plays an important role in thefine-grained classification. This is specifically true in thecontext of Roman coins, where domain experts (e.g., numis-matists) seek intuitive, visual landmark feedback associatedwith an otherwise automated classification task.
In this section, we introduce our method to discovercharacteristic landmarks on the Roman coins using theCNN model. We define the characteristic region set as thesmallest set of local patches sufficient to represent the iden-tity of the full image and distinguish it from other availableclasses.
Several approaches have been presented in the past thatattempt to identify intuitive/visual class characteristics ofCNNs [21, 24, 25]. However, their main purpose is largelyto reconstruct a representative, prototypical class image andnot necessarily find the discriminative regions. Unlike theprevious methods, the proposed method starts from specific
input image and removes visual information deemed irrele-vant for the coin’s accurate classification as an instance ofthe same class.
Let I and I(i) be the vectorized image and the ith pixelintensity of image I, respectively. Let rk, 1 ≤ k ≤ K, bethe set of indices that belongs to the kth subregion in imageI. The subregion could be a superpixel, a patch from thesliding window with overlapping, or even one pixel. Wedefine Ik to represent the kth subregion as follows:
Ik(i) =
{I(i) if i ∈ rk0 otherwise ,
K⋃k=1
Ik = I. (2)
Then we define a mask function fI(x), x =[x1, x2, . . . , xk]
> xi ∈ [0, 1], which maps image I tothe masked image fI(x) as a function of x:
fI(x) =
(K∑
k=1
xk · Ik)⊗C, (3)
where ⊗ is the element-wise product and C is a normaliza-tion vector counting how many times a pixel appears acrossthe subregions as
C(i) =1∑K
k=1 δ(i ∈ rk).
xk controls the transparency of the subregion rk so thatxk = 1 represents that the subregion has the full pixel in-tensity while xk = 0 implies that the region is transparent.
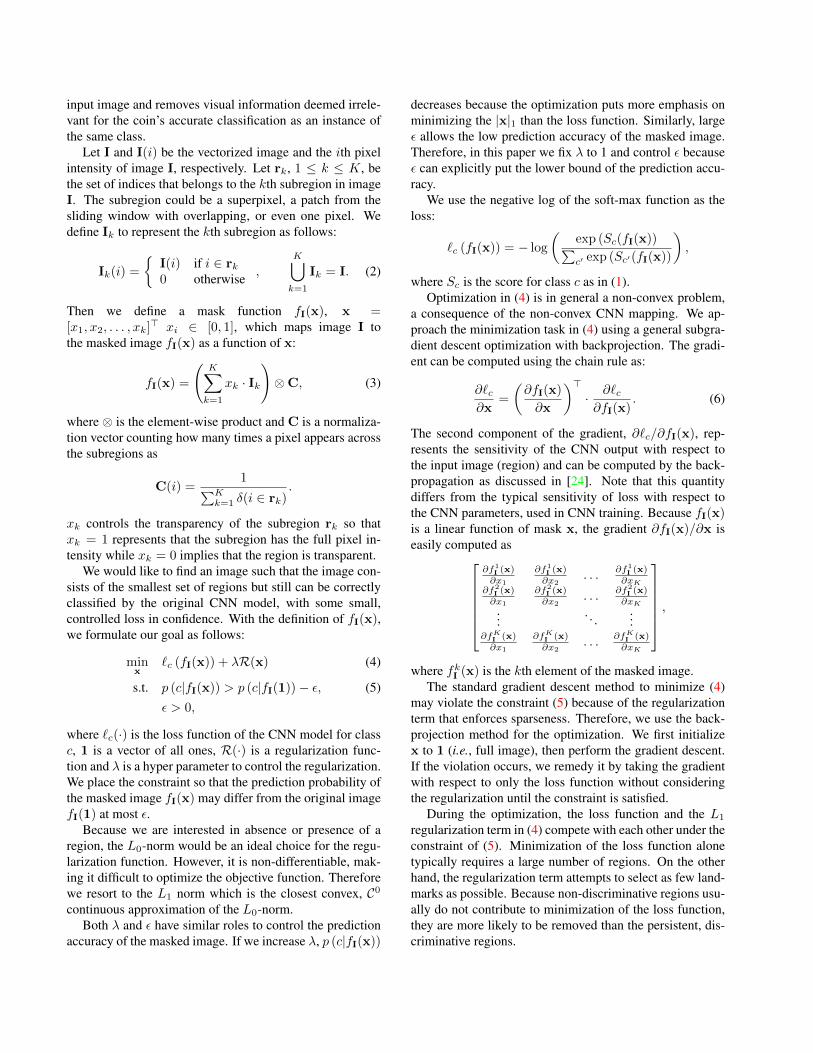
We would like to find an image such that the image con-sists of the smallest set of regions but still can be correctlyclassified by the original CNN model, with some small,controlled loss in confidence. With the definition of fI(x),we formulate our goal as follows:
minx
`c (fI(x)) + λR(x) (4)
s.t. p (c|fI(x)) > p (c|fI(1))− ε, (5)ε > 0,
where `c(·) is the loss function of the CNN model for classc, 1 is a vector of all ones, R(·) is a regularization func-tion and λ is a hyper parameter to control the regularization.We place the constraint so that the prediction probability ofthe masked image fI(x) may differ from the original imagefI(1) at most ε.
Because we are interested in absence or presence of aregion, the L0-norm would be an ideal choice for the regu-larization function. However, it is non-differentiable, mak-ing it difficult to optimize the objective function. Thereforewe resort to the L1 norm which is the closest convex, C0continuous approximation of the L0-norm.
Both λ and ε have similar roles to control the predictionaccuracy of the masked image. If we increase λ, p (c|fI(x))
decreases because the optimization puts more emphasis onminimizing the |x|1 than the loss function. Similarly, largeε allows the low prediction accuracy of the masked image.Therefore, in this paper we fix λ to 1 and control ε becauseε can explicitly put the lower bound of the prediction accu-racy.
We use the negative log of the soft-max function as theloss:
`c (fI(x)) = − log
(exp (Sc(fI(x))∑c′ exp (Sc′(fI(x))
),
where Sc is the score for class c as in (1).Optimization in (4) is in general a non-convex problem,
a consequence of the non-convex CNN mapping. We ap-proach the minimization task in (4) using a general subgra-dient descent optimization with backprojection. The gradi-ent can be computed using the chain rule as:
∂`c∂x
=
(∂fI(x)
∂x
)>· ∂`c∂fI(x)
. (6)
The second component of the gradient, ∂`c/∂fI(x), rep-resents the sensitivity of the CNN output with respect tothe input image (region) and can be computed by the back-propagation as discussed in [24]. Note that this quantitydiffers from the typical sensitivity of loss with respect tothe CNN parameters, used in CNN training. Because fI(x)is a linear function of mask x, the gradient ∂fI(x)/∂x iseasily computed as
∂f1I (x)∂x1
∂f1I (x)∂x2
. . .∂f1
I (x)∂xK
∂f2I (x)∂x1
∂f2I (x)∂x2
. . .∂f2
I (x)∂xK
.... . .
...∂fK
I (x)∂x1
∂fKI (x)∂x2
. . .∂fK
I (x)∂xK
,
where fkI (x) is the kth element of the masked image.The standard gradient descent method to minimize (4)
may violate the constraint (5) because of the regularizationterm that enforces sparseness. Therefore, we use the back-projection method for the optimization. We first initializex to 1 (i.e., full image), then perform the gradient descent.If the violation occurs, we remedy it by taking the gradientwith respect to only the loss function without consideringthe regularization until the constraint is satisfied.
During the optimization, the loss function and the L1
regularization term in (4) compete with each other under theconstraint of (5). Minimization of the loss function alonetypically requires a large number of regions. On the otherhand, the regularization term attempts to select as few land-marks as possible. Because non-discriminative regions usu-ally do not contribute to minimization of the loss function,they are more likely to be removed than the persistent, dis-criminative regions.
Iteration ×10 4
0 0.5 1 1.5 2 2.5 3 3.5 4 4.5 5 5.5
Accu
racy
0.4
0.45
0.5
0.55
0.6
0.65
0.7
CNN
SVM
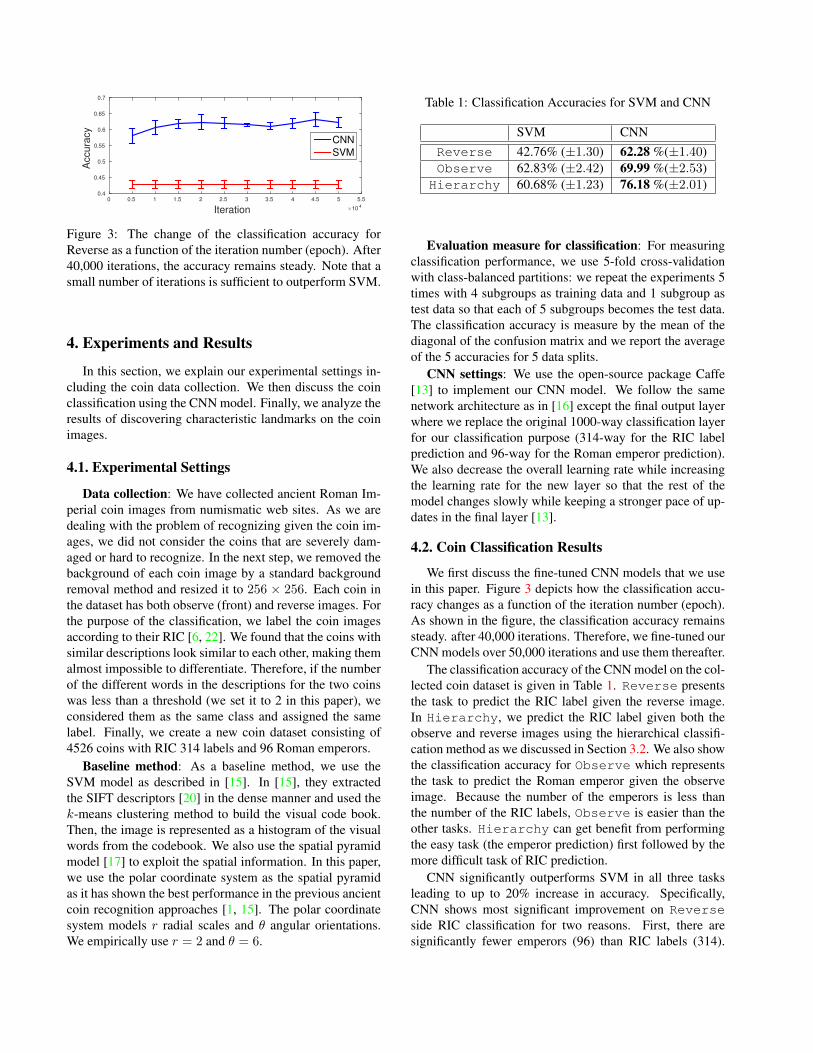
Figure 3: The change of the classification accuracy forReverse as a function of the iteration number (epoch). After40,000 iterations, the accuracy remains steady. Note that asmall number of iterations is sufficient to outperform SVM.
4. Experiments and Results
In this section, we explain our experimental settings in-cluding the coin data collection. We then discuss the coinclassification using the CNN model. Finally, we analyze theresults of discovering characteristic landmarks on the coinimages.
4.1. Experimental Settings
Data collection: We have collected ancient Roman Im-perial coin images from numismatic web sites. As we aredealing with the problem of recognizing given the coin im-ages, we did not consider the coins that are severely dam-aged or hard to recognize. In the next step, we removed thebackground of each coin image by a standard backgroundremoval method and resized it to 256 × 256. Each coin inthe dataset has both observe (front) and reverse images. Forthe purpose of the classification, we label the coin imagesaccording to their RIC [6, 22]. We found that the coins withsimilar descriptions look similar to each other, making themalmost impossible to differentiate. Therefore, if the numberof the different words in the descriptions for the two coinswas less than a threshold (we set it to 2 in this paper), weconsidered them as the same class and assigned the samelabel. Finally, we create a new coin dataset consisting of4526 coins with RIC 314 labels and 96 Roman emperors.
Baseline method: As a baseline method, we use theSVM model as described in [15]. In [15], they extractedthe SIFT descriptors [20] in the dense manner and used thek-means clustering method to build the visual code book.Then, the image is represented as a histogram of the visualwords from the codebook. We also use the spatial pyramidmodel [17] to exploit the spatial information. In this paper,we use the polar coordinate system as the spatial pyramidas it has shown the best performance in the previous ancientcoin recognition approaches [1, 15]. The polar coordinatesystem models r radial scales and θ angular orientations.We empirically use r = 2 and θ = 6.
Table 1: Classification Accuracies for SVM and CNN
SVM CNNReverse 42.76% (±1.30) 62.28 %(±1.40)Observe 62.83% (±2.42) 69.99 %(±2.53)
Hierarchy 60.68% (±1.23) 76.18 %(±2.01)
Evaluation measure for classification: For measuringclassification performance, we use 5-fold cross-validationwith class-balanced partitions: we repeat the experiments 5times with 4 subgroups as training data and 1 subgroup astest data so that each of 5 subgroups becomes the test data.The classification accuracy is measure by the mean of thediagonal of the confusion matrix and we report the averageof the 5 accuracies for 5 data splits.
CNN settings: We use the open-source package Caffe[13] to implement our CNN model. We follow the samenetwork architecture as in [16] except the final output layerwhere we replace the original 1000-way classification layerfor our classification purpose (314-way for the RIC labelprediction and 96-way for the Roman emperor prediction).We also decrease the overall learning rate while increasingthe learning rate for the new layer so that the rest of themodel changes slowly while keeping a stronger pace of up-dates in the final layer [13].
4.2. Coin Classification Results
We first discuss the fine-tuned CNN models that we usein this paper. Figure 3 depicts how the classification accu-racy changes as a function of the iteration number (epoch).As shown in the figure, the classification accuracy remainssteady. after 40,000 iterations. Therefore, we fine-tuned ourCNN models over 50,000 iterations and use them thereafter.
The classification accuracy of the CNN model on the col-lected coin dataset is given in Table 1. Reverse presentsthe task to predict the RIC label given the reverse image.In Hierarchy, we predict the RIC label given both theobserve and reverse images using the hierarchical classifi-cation method as we discussed in Section 3.2. We also showthe classification accuracy for Observe which representsthe task to predict the Roman emperor given the observeimage. Because the number of the emperors is less thanthe number of the RIC labels, Observe is easier than theother tasks. Hierarchy can get benefit from performingthe easy task (the emperor prediction) first followed by themore difficult task of RIC prediction.
CNN significantly outperforms SVM in all three tasksleading to up to 20% increase in accuracy. Specifically,CNN shows most significant improvement on Reverseside RIC classification for two reasons. First, there aresignificantly fewer emperors (96) than RIC labels (314).
(a) CNNReverse
(b) CNNHierarchy
(c) SVMReverse
(d) SVMHierarchy
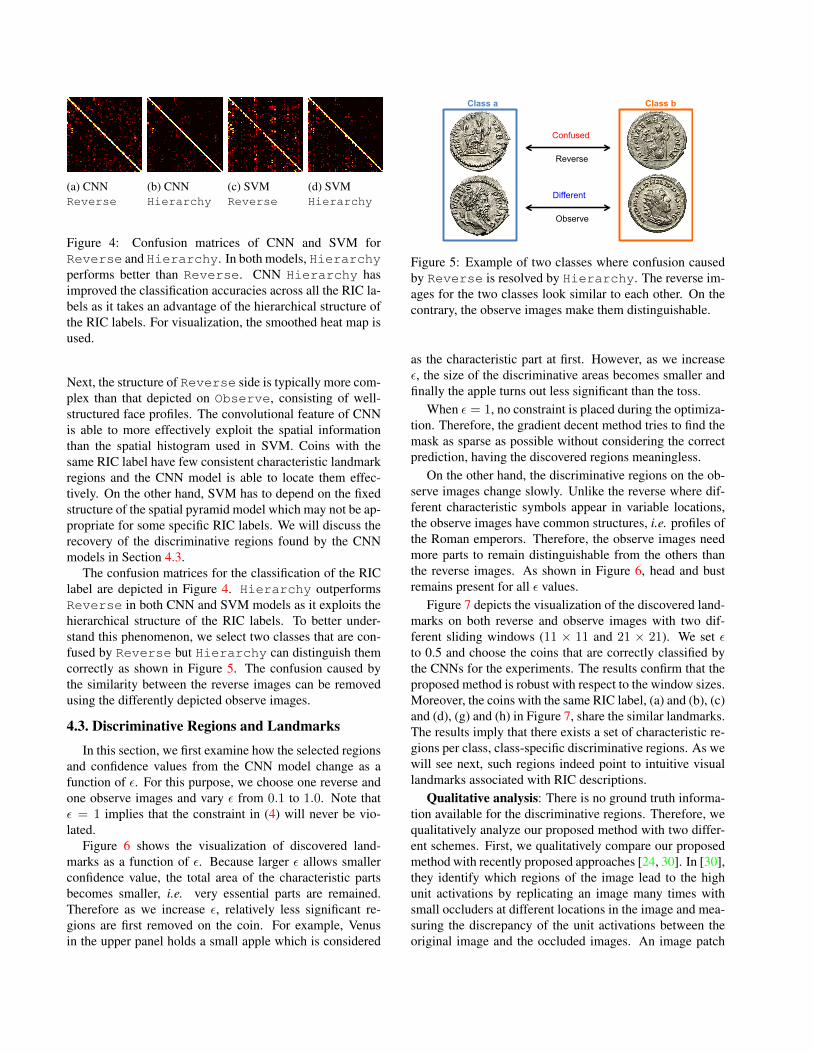
Figure 4: Confusion matrices of CNN and SVM forReverse and Hierarchy. In both models, Hierarchyperforms better than Reverse. CNN Hierarchy hasimproved the classification accuracies across all the RIC la-bels as it takes an advantage of the hierarchical structure ofthe RIC labels. For visualization, the smoothed heat map isused.
Next, the structure of Reverse side is typically more com-plex than that depicted on Observe, consisting of well-structured face profiles. The convolutional feature of CNNis able to more effectively exploit the spatial informationthan the spatial histogram used in SVM. Coins with thesame RIC label have few consistent characteristic landmarkregions and the CNN model is able to locate them effec-tively. On the other hand, SVM has to depend on the fixedstructure of the spatial pyramid model which may not be ap-propriate for some specific RIC labels. We will discuss therecovery of the discriminative regions found by the CNNmodels in Section 4.3.
The confusion matrices for the classification of the RIClabel are depicted in Figure 4. Hierarchy outperformsReverse in both CNN and SVM models as it exploits thehierarchical structure of the RIC labels. To better under-stand this phenomenon, we select two classes that are con-fused by Reverse but Hierarchy can distinguish themcorrectly as shown in Figure 5. The confusion caused bythe similarity between the reverse images can be removedusing the differently depicted observe images.
4.3. Discriminative Regions and Landmarks
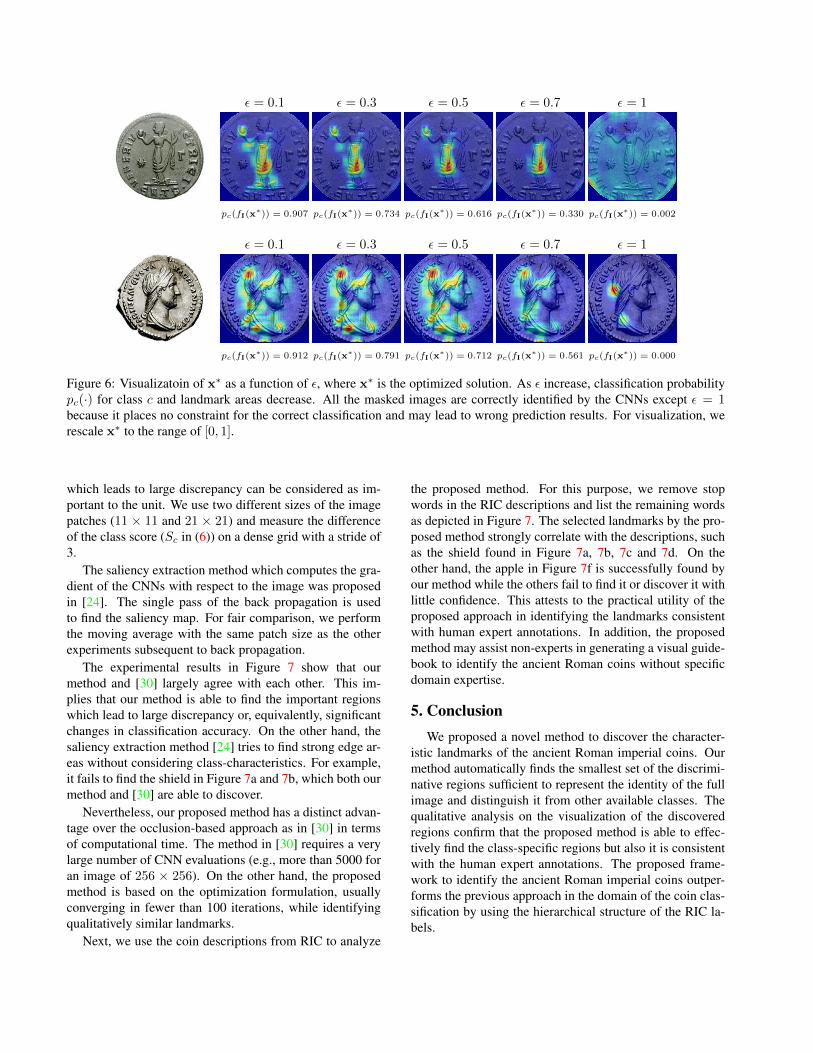
In this section, we first examine how the selected regionsand confidence values from the CNN model change as afunction of ε. For this purpose, we choose one reverse andone observe images and vary ε from 0.1 to 1.0. Note thatε = 1 implies that the constraint in (4) will never be vio-lated.
Figure 6 shows the visualization of discovered land-marks as a function of ε. Because larger ε allows smallerconfidence value, the total area of the characteristic partsbecomes smaller, i.e. very essential parts are remained.Therefore as we increase ε, relatively less significant re-gions are first removed on the coin. For example, Venusin the upper panel holds a small apple which is considered
Reverse
Observe
Confused
Different
Class a Class b
Figure 5: Example of two classes where confusion causedby Reverse is resolved by Hierarchy. The reverse im-ages for the two classes look similar to each other. On thecontrary, the observe images make them distinguishable.
as the characteristic part at first. However, as we increaseε, the size of the discriminative areas becomes smaller andfinally the apple turns out less significant than the toss.
When ε = 1, no constraint is placed during the optimiza-tion. Therefore, the gradient decent method tries to find themask as sparse as possible without considering the correctprediction, having the discovered regions meaningless.
On the other hand, the discriminative regions on the ob-serve images change slowly. Unlike the reverse where dif-ferent characteristic symbols appear in variable locations,the observe images have common structures, i.e. profiles ofthe Roman emperors. Therefore, the observe images needmore parts to remain distinguishable from the others thanthe reverse images. As shown in Figure 6, head and bustremains present for all ε values.
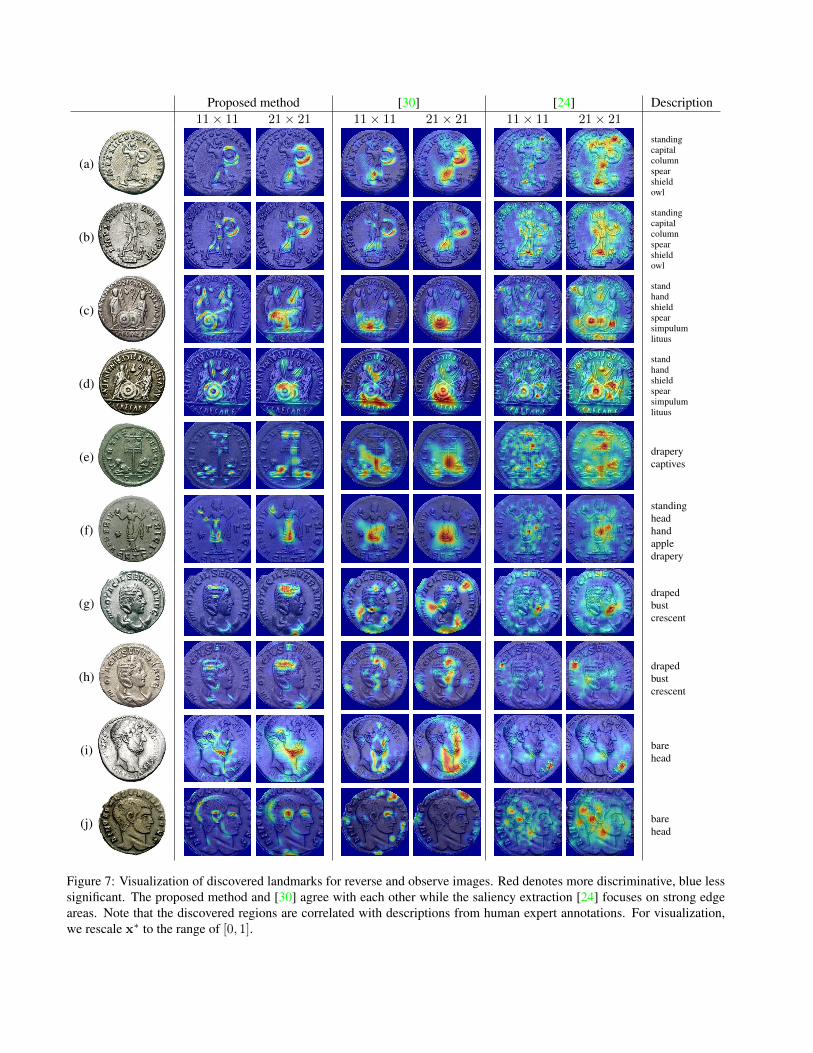
Figure 7 depicts the visualization of the discovered land-marks on both reverse and observe images with two dif-ferent sliding windows (11 × 11 and 21 × 21). We set εto 0.5 and choose the coins that are correctly classified bythe CNNs for the experiments. The results confirm that theproposed method is robust with respect to the window sizes.Moreover, the coins with the same RIC label, (a) and (b), (c)and (d), (g) and (h) in Figure 7, share the similar landmarks.The results imply that there exists a set of characteristic re-gions per class, class-specific discriminative regions. As wewill see next, such regions indeed point to intuitive visuallandmarks associated with RIC descriptions.
Qualitative analysis: There is no ground truth informa-tion available for the discriminative regions. Therefore, wequalitatively analyze our proposed method with two differ-ent schemes. First, we qualitatively compare our proposedmethod with recently proposed approaches [24, 30]. In [30],they identify which regions of the image lead to the highunit activations by replicating an image many times withsmall occluders at different locations in the image and mea-suring the discrepancy of the unit activations between theoriginal image and the occluded images. An image patch
ε = 0.1 ε = 0.3 ε = 0.5 ε = 0.7 ε = 1
pc(fI(x∗)) = 0.907 pc(fI(x
∗)) = 0.734 pc(fI(x∗)) = 0.616 pc(fI(x
∗)) = 0.330 pc(fI(x∗)) = 0.002
ε = 0.1 ε = 0.3 ε = 0.5 ε = 0.7 ε = 1
pc(fI(x∗)) = 0.912 pc(fI(x
∗)) = 0.791 pc(fI(x∗)) = 0.712 pc(fI(x
∗)) = 0.561 pc(fI(x∗)) = 0.000
Figure 6: Visualizatoin of x∗ as a function of ε, where x∗ is the optimized solution. As ε increase, classification probabilitypc(·) for class c and landmark areas decrease. All the masked images are correctly identified by the CNNs except ε = 1because it places no constraint for the correct classification and may lead to wrong prediction results. For visualization, werescale x∗ to the range of [0, 1].
which leads to large discrepancy can be considered as im-portant to the unit. We use two different sizes of the imagepatches (11 × 11 and 21 × 21) and measure the differenceof the class score (Sc in (6)) on a dense grid with a stride of3.
The saliency extraction method which computes the gra-dient of the CNNs with respect to the image was proposedin [24]. The single pass of the back propagation is usedto find the saliency map. For fair comparison, we performthe moving average with the same patch size as the otherexperiments subsequent to back propagation.
The experimental results in Figure 7 show that ourmethod and [30] largely agree with each other. This im-plies that our method is able to find the important regionswhich lead to large discrepancy or, equivalently, significantchanges in classification accuracy. On the other hand, thesaliency extraction method [24] tries to find strong edge ar-eas without considering class-characteristics. For example,it fails to find the shield in Figure 7a and 7b, which both ourmethod and [30] are able to discover.
Nevertheless, our proposed method has a distinct advan-tage over the occlusion-based approach as in [30] in termsof computational time. The method in [30] requires a verylarge number of CNN evaluations (e.g., more than 5000 foran image of 256 × 256). On the other hand, the proposedmethod is based on the optimization formulation, usuallyconverging in fewer than 100 iterations, while identifyingqualitatively similar landmarks.
Next, we use the coin descriptions from RIC to analyze
the proposed method. For this purpose, we remove stopwords in the RIC descriptions and list the remaining wordsas depicted in Figure 7. The selected landmarks by the pro-posed method strongly correlate with the descriptions, suchas the shield found in Figure 7a, 7b, 7c and 7d. On theother hand, the apple in Figure 7f is successfully found byour method while the others fail to find it or discover it withlittle confidence. This attests to the practical utility of theproposed approach in identifying the landmarks consistentwith human expert annotations. In addition, the proposedmethod may assist non-experts in generating a visual guide-book to identify the ancient Roman coins without specificdomain expertise.
5. ConclusionWe proposed a novel method to discover the character-
istic landmarks of the ancient Roman imperial coins. Ourmethod automatically finds the smallest set of the discrimi-native regions sufficient to represent the identity of the fullimage and distinguish it from other available classes. Thequalitative analysis on the visualization of the discoveredregions confirm that the proposed method is able to effec-tively find the class-specific regions but also it is consistentwith the human expert annotations. The proposed frame-work to identify the ancient Roman imperial coins outper-forms the previous approach in the domain of the coin clas-sification by using the hierarchical structure of the RIC la-bels.
Proposed method [30] [24] Description11× 11 21× 21 11× 11 21× 21 11× 11 21× 21
(a)
standingcapitalcolumnspearshieldowl
(b)
standingcapitalcolumnspearshieldowl
(c)
standhandshieldspearsimpulumlituus
(d)
standhandshieldspearsimpulumlituus
(e) draperycaptives
(f)
standingheadhandappledrapery
(g)drapedbustcrescent
(h)drapedbustcrescent
(i) barehead
(j) barehead
Figure 7: Visualization of discovered landmarks for reverse and observe images. Red denotes more discriminative, blue lesssignificant. The proposed method and [30] agree with each other while the saliency extraction [24] focuses on strong edgeareas. Note that the discovered regions are correlated with descriptions from human expert annotations. For visualization,we rescale x∗ to the range of [0, 1].
References[1] H. Anwar, S. Zambanini, and M. Kampel. A Bag of Vi-
sual Words Approach for Symbols-Based Coarse-GrainedAncient Coin Classification. CoRR, abs/1304.6:1–8, 2013.
[2] H. Anwar, S. Zambanini, and M. Kampel. A Rotation-Invariant Bag of Visual Words Model for Symbols basedAncient Coin Classification. In International Conference onImage Processing (ICIP), pages 5257–5261, 2014.
[3] H. Anwar, S. Zambanini, and M. Kampel. Coarse-grainedAncient Coin Classification using Image-based Reverse SideMotif Recognition. Machine Vision and Applications,26:295–304, 2015.
[4] O. Arandjelovic. Automatic attribution of ancient Romanimperial coins. In IEEE Conference on Computer Vision andPattern Recognition (CVPR), 2010.
[5] Y. Chai, V. Lempitsky, and A. Zisserman. Symbiotic Seg-mentation and Part Localization for Fine-Grained Catego-rization. In International Conference on Computer Vision(ICCV), 2013.
[6] H. Cohen. Description historique des monnaies frappeessous l’empire romain. Number Vol I-VIII. Paris, France, 2edition, 1880-1892.
[7] J. Deng, W. Dong, R. Socher, L.-J. Li, K. Li, and L. Fei-Fei.ImageNet: A Large-Scale Hierarchical Image Database. InIEEE Conference on Computer Vision and Pattern Recogni-tion (CVPR), 2009.
[8] J. Donahue, Y. Jia, O. Vinyals, J. Hoffman, N. Zhang,E. Tzeng, and T. Darrell. DeCAF: A Deep ConvolutionalActivation Feature for Generic Visual Recognition. In Inter-national Conference on Machine Learning (ICML), 2014.
[9] P. F. Felzenszwalb, R. B. Girshick, D. McAllester, and D. Ra-manan. Object Detection with Discriminatively Trained PartBased Models. IEEE Transactions on Pattern Analysis andMachine Intelligence, 32:1627–1645, 2010.
[10] E. Gavves, B. Fernando, C. G. M. Snoek, A. W. M. Smeul-ders, and T. Tuytelaars. Fine-Grained Categorization byAlignments Estimation. In International Conference onComputer Vision (ICCV), 2013.
[11] R. Girshick, J. Donahue, T. Darrell, and J. Malik. Rich fea-ture hierarchies for accurate object detection and semanticsegmentation. In IEEE Conference on Computer Vision andPattern Recognition (CVPR), pages 2–9, 2014.
[12] R. Huber-Mork, S. Zambanini, M. Zaharieva, and M. Kam-pel. Identification of ancient coins based on fusion ofshape and local features. Machine Vision and Applications,22(6):983–994, July 2011.
[13] Y. Jia, E. Shelhamer, J. Donahue, S. Karayev, J. Long, R. Gir-shick, S. Guadarrama, and T. Darrell. Caffe: ConvolutionalArchitecture for Fast Feature Embedding. arXiv preprintarXiv:1408.5093, 2014.
[14] M. Kampel and M. Zaharieva. Recognizing ancient coinsbased on local features. In International Symposium on Ad-vances in Visual Computing (ISVC), 2008.
[15] J. Kim and V. Pavlovic. Improving Ancient Roman CoinRecognition with Alignment and Spatial Encoding. In Work-shop on European Computer Vision Conference (ECCV),2014.
[16] A. Krizhevsky, I. Sutskever, and G. E. Hinton. ImageNetClassification with Deep Convolutional Neural Networks.
Advances in Neural Information Processing Systems (NIPS),pages 1–9, 2012.
[17] S. Lazebnik, C. Schmid, and J. Ponce. Beyond Bags ofFeatures: Spatial Pyramid Matching for Recognizing Natu-ral Scene Categories. In IEEE Computer Vision and PatternRecognition (CVPR), 2006.
[18] Y. Lecun, L. Bottou, Y. Bengio, and P. Haffner. Gradient-based learning applied to document recognition. In Proceed-ings of the IEEE, pages 2278–2324, 1998.
[19] J. Long, E. Shelhamer, and T. Darrell. Fully ConvolutionalNetworks for Semantic Segmentation. In IEEE Conferenceon Computer Vision and Pattern Recognition (CVPR), 2015.
[20] D. G. Lowe. Distinctive Image Features from Scale-InvariantKeypoints. International Journal of Computer Vision (IJCV),60:91–110, 2004.
[21] A. Mahendran and A. Vedaldi. Understanding Deep ImageRepresentations by Inverting Them. Arvix, 2014.
[22] H. Mattingly, E. Sydenham, C. Sutherland, and R. Carson.The Roman imperial coinage. Number v. 1 in The RomanImperial Coinage. Spink, 1923.
[23] M. Nolle, H. Penz, M. Rubik, K. Mayer, I. Hollaender, andR. Granec. Dagobert - A New Coin Recognition and SortingSystem. In Conference on Digital Image Computing: Tech-niques and Applications (DICTA), 2003.
[24] K. Simonyan, A. Vedaldi, and A. Zisserman. Deep InsideConvolutional Networks: Visualising Image ClassificationModels and Saliency Maps. In International Conferenceon Learning Representation (ICLR) Workshop, pages 1–8,2014.
[25] C. Szegedy, W. Zaremba, I. Sutskever, J. Bruna, D. Erhan,I. Goodfellow, and R. Fergus. Intriguing Properties of Neu-ral Networks. In International Conference on Learning Rep-resentation (ICLR), pages 1–10, 2014.
[26] L. J. P. van der Maaten and P. J. Boon. COIN-O-MATIC: Afast system for reliable coin classification. In MUSCLE CISCoin Competition Workshop, 2006.
[27] M. D. Zeiler and R. Fergus. Visualizing and UnderstandingConvolutional Networks. In European Conference on Com-puter Vision (ECCV), 2014.
[28] N. Zhang, J. Donahue, R. Girshick, and T. Darrell. Part-based R-CNNs for Fine-grained Category Detection. In Eu-ropean Conference on Computer Vision (ECCV), 2014.
[29] N. Zhang, M. Paluri, M. Ranzato, T. Darrell, and L. Bourdev.PANDA: Pose Aligned Networks for Deep Attribute Model-ing. In IEEE Conference on Computer Vision and PatternRecognition (CVPR), page 8, 2013.
[30] B. Zhou, A. Khosla, A. Lapedriza, A. Oliva, and A. Tor-ralba. Object Detectors Emerge in Deep Scene CNNs. In In-ternational Conference on Learning Representation (ICLR),2015.
[31] B. Zhou, A. Lapedriza, J. Xiao, A. Torralba, and A. Oliva.Learning Deep Features for Scene Recognition using PlacesDatabase. In Neuarl Information Processing Systems (NIPS),2014.