Embed Size (px)
Citation preview

1
Discover North Carolina Wines:
A Wine Tourism Visitor Profile Study
FINAL REPORT
February 2008
Prepared by
Dr. Michael Evans
Professor & Director of Hospitality & Tourism Management
Walker College of Business
Phone: 828 262 6222
Dr. Carol Pollard
Associate Professor of CIS & Co-Executive Director, CARET
Walker College of Business
Dr. Grant Holder
Professor of Chemistry & Director, Wine Production & Management Program
College of Arts and Sciences
Appalachian State University, Boone, NC 28608

2
Executive Summary
This project investigates the relationship between the wine tourist and the NC wine region
and its wineries. The project provides much-needed information about who the wine tourists
are and their motivations for visiting a wine region.
The project's major benefit provides knowledge that will enable wineries and wine regions to
guide product development and create marketing strategies to meet the wine tourists’ needs.
The project involved the development of an in-depth survey to fully understand the
characteristics and motivations of wine tourists and the extent of their satisfaction with the
winery experience.
The survey was distributed to 16 wineries in September 2007. To best represent the full NC
winery community, wineries were chosen based on geographic location and relative size.
The data collection ran through December 2007. Thirteen of the 16 wineries selected
returned 925 completed surveys. The surveys were collected using a random sample
procedure with the factor of one survey per travel party imposed. The data was collected in
the tasting rooms of the wineries.
The findings revealed that North Carolina wineries currently have 53% of the wine visitors
coming from the state of North Carolina. Other visits (approximately 47%) are coming from
border states or states on the east coast of the US. A minimal number of visitors are
international. The average party size is 2.85 persons and most are older adults and not
young families. The visitors have high household incomes and are highly educated.
Approximately 52% are day-trippers, with the rest of the sample spending one or more nights
(considered overnight visitors).
Approximately 61% were new or first-time visitors and 39% indicated they were returning
visitors. These statistics may be viewed as positive behaviors for a young and growing
industry. A majority of the visitors only visited one winery.
In general, the results of this preliminary study support the conclusion that the wineries in
North Carolina are doing an excellent job of providing satisfaction to the visitor, both from
the point of view of wine quality and quality of the overall experience. Current visitation
appears to be mainly a curiosity and desire to taste the wine produced at the winery.
The findings suggest there may be opportunities for future packaging of sightseeing drives
(scenic by-ways) with some limited shopping, and light outdoor recreation such as visiting
parks or using a walking or hiking trail.
Finally, segmenting the findings based on instate vs. out of state visitors and daytrippers vs.
overnight visitors revealed some interesting similarities and differences that can be used to
help focus future marketing efforts of the NC wine industry.

3
ACKNOWLEDGEMENTS
This research was made possible through the efforts of multiple people and
organizations. The authors wish to thank all those assisting with the project, especially:
Margo Metzger, Executive Director, North Carolina Wine & Grape Council, North
Carolina Division of Tourism, Film, and Sports Development, NC Department of
Commerce
Marlise Taylor, Director of Research, Division of Tourism, Film and Sports
Development, North Carolina Department of Commerce.
Lynn Minges, Executive Director, North Carolina Division of Tourism, Film, and Sports
Development, NC Department of Commerce
Participating NC Wineries
Banner Elk Winery (Dede Walton)
Biltmore Winery (Heather Jordan)
Chatham Hill Winery (Jill Winkler)
Childress Vineyards (Kathleen Watson)
Cypress Bend Vineyards (Tina Smith)
Dennis Vineyard (Amy Dennis)
Duplin Winery (Dave Fussel Jr.)
RagApple Lassie Vineyard (Lenna Hobson)
Raylen Vineyards (Steve Shepard)
Rockhouse Vineyard (Marsha Griffin)
Shelton Vineyards (George Denka, Jr.)
The Winery at Iron Gate Farm (Debra Stikeleather)
Silver Coast Winery (Maryanne Charlap Azzato)

4
Table of Contents
Section Page number
The North Carolina Wine Industry 5
Research Problem, Study Objectives and The Study 6
Demographic Characteristics of the Respondents 8
Respondent Profile 9
Geographic Profile 10
Travel Party Profile 11
Trip Behaviors 14
Economic Impact 17
Information Sources 18
Satisfaction with Winery Visit 20
Segmentation Analysis for Marketing Implications 21
Comparison of Instate vs. Out of State Visitors 21
Comparison of Daytrippers vs. Overnight Visitors 27
Conclusions 32
Bibliography 35
Appendix A – Survey Instrument 36
Appendix B – Visitors by State 39

5
The North Carolina Wine Industry
North Carolina (NC) has a long tradition in grape production and winemaking. NC’s
first commercial vineyard was founded in 1835 and at the turn of the century the state had 25
wineries making it one of the most productive wine states. Unfortunately the entire industry
closed down with the onset of prohibition.
Today, NC is home to a growing wine tourism industry with some 350 vineyards and
63 wineries in 31 counties. In the eastern part of the state, the muscadine grape, which
include scuppernongs (native to the region) are cultivated, while bunch grapes like
chardonnay and cabernet sauvignon are grown in several areas in western North Carolina.
Since 2000, the number of NC wineries in the state has tripled and grape acreage has more
than doubled to 1,300 acres enabling the state to become the 10th largest producer or grapes
and wine in the U.S. and the western part of the state now boasts the first federally
recognized American Viticulture Area (AVA) in North Carolina.
A recent study released in January 2007 by Governor Easley, further attests to the
exciting growth in North Carolina’s wine industry provides. For example, the study
commissioned by the state Department of Commerce’s Tourism Division and the NC Wine &
Grape Council reports that NC’s Wine and Grape Industry accounts for $813 million of the
state’s annual economy; is now home to 63 wineries which hosted more than 800,000 visitors
in 2005; creates 5,700 full-time jobs and $158 million in wages in conjunction with affiliated
businesses and has attracted tourist dollars to rural communities that desperately need new
economic development. In addition to growing grapes and agri-tourism the wine industry has
provided an opportunity for farm diversification (mainly from tobacco) and helped with
farmland preservation.

6
To promote the state as a wine-producing state, the NC Wine & Grape Council was
established in 1985. Since their inception, this state agency has partnered with many other
private and public sector organizations to improve the wine quality and promote the entire
industry. This includes business partners that are building vertical relationships with tour
operators and lodging firms. NC has several large firms including the Biltmore Estate
Winery, Shelton and Childress in the Yadkin Valley, and Duplin in the eastern part of the
state.
Research Problem
Many wine regions and tourism destinations recognize that the benefits of wine
tourism extend far beyond the “cellar door” to virtually all areas of the regional economy. To
date there appears to be little information available that documents the characteristics and
attitudes of North Carolina wine tourists or the market forces that underlie the growing
phenomenon of wine tourism. To capitalize on the benefits of this growing industry, North
Carolina could benefit from an over-arching set of studies to investigate these factors.
Study Objectives
To provide the first baseline data on the characteristics, trip behaviors, and attitudes of
visitors to the wine regions of North Carolina.
The Study
In 2007, the NC Wine & Grape Council awarded a research grant for a faculty team
from the John A. Walker College of Business and the College of Arts & Sciences at
Appalachian State University to conduct a study to assess the motivations and characteristics

7
of visitors to North Carolina wineries as part of the Grape Council’s continuing effort to
develop and promote the NC wine industry.
After working closely with the members of the NC Wine & Grape Council, the ASU
research team created a survey instrument (see Appendix A), developed a data collection plan
and engaged in training the survey administrators. The study variables agreed upon were the
following:
Demographic profile of visitor- age, income, education, etc.
Geographic profile - origin of visitor by state or country
Overnight vs. day tripper visitor
Duration or length of trip by travel party
Accommodation for overnight stays
Previous visitor or new visitor
Number of wineries visited on trip
Satisfaction with various aspects of the wine travel experience
Following the data collection period the team collected the data, created an electronic
database of responses, conducted a statistical data analysis, and prepared the research report.
This document constitutes the final phase of the research project.
The survey was distributed to 16 wineries in September 2007. To best represent the full
NC winery community, wineries were chosen based on geographic location and relative size.
The data collection ran through December 2007. Thirteen of the 16 wineries selected
returned 925 completed surveys. The surveys were collected using a random sample
procedure with the factor of one survey per travel party imposed. The data was collected in
the tasting rooms of the wineries. Table 1 shows the distribution of the surveys by winery.

8
Table 1 – Participating Wineries
Winery No. of Completed
Surveys
Biltmore 155
Shelton 135
Childress 109
Iron Gate 105
RagApple Lassie 100
Silver Coast 90
Rockhouse 45
Banner Elk 42
Duplin 40
Dennis 33
Chatham Hill 27
Raylen 24
Cypress Bend 20
TOTAL 925
This report is divided into multiple sections. The first section provides a demographic
description of the respondents. The second describes the visitors’ motivations and secondary
experiences prompting or facilitating enjoyment during the visit. The third section describes
the information sources upon which the NC wine tourist surveyed relied upon. Next a
segmentation analysis of instate vs. out of state visitors and daytrippers vs. overnight visitors
is described and the final section summarizes the overall experience of visiting a North
Carolina winery.
Demographic Characteristics of the Respondents
The demographic analysis includes respondent gender, income, education, and visitor
origin by state or country. The travel party analysis includes the number of people in the

9
travel party, the number of minors visiting with each travel party, and concludes with the
overall description of visitor itinerary.
Respondent Profile
A profile of the respondents revealed that on average, respondents were highly
educated, middle aged baby boomers with a higher than average household income level. Of
those reporting, 64% were female and 36% were male.
The great majority of respondents reported having completed a college degree (63%).
In addition, 29% reported some college while only 8% reported completing a high school
education. These figures compare with a less educated general NC tourist population reported
by Fast Facts TNS Travels America 2007 who report that 38% completed college and 22%
had some college. Education levels of respondents to the winery study are summarized
graphically in Figure 2. The age range of respondents was 20 yrs. to 92 yrs. The average age
of respondents is 47.4 years. Therefore, we could describe the average wine visitor as an
educated, young baby-boomer.
Figure 2. Education (n=909)
College Degree
63%
Some College
29%
High School
8%
College Degree
Some College
High School

10
The largest group (23%) reported an income of $75,000-$99,999, followed by those
in the $50,000-$74,999 bracket (21%). Nearly 37% of the respondents reported incomes over
$100,000. The income distribution of respondents is presented in Figure 1.
Geographic Profile
Visitors to NC wineries came from a total of 39 states. The number of visitors from
each state is shown in Appendix B. Most of the visitors came from the Eastern part of the
U.S. The breakdown of visitor locations by state and country with 2% or more responses is:
99.3% were visiting from locations within the USA
53% from North Carolina
8% from South Carolina
8% from Florida
4% from Virginia
3% from Pennsylvania
2% from New Jersey, Ohio, Tennessee, and Georgia
Other Countries represented included Canada (2), UK (2), India (1)
and Italy (1)
Figure 1. Income Distribution of Respondents
(n=789)
0 5 10 15 20 25
<$24,000
$25,000-$49,999
$50,000-$74,999
$75,000-$99,999
$100,000-$124,999
$125,000-$149,999
$150,000-$174,999
>$175,000
Ho
useh
old
In
co
me
Percent of Respondents

11
To further uncover the origin of visitors, we examined the percentage of surveys filled
out by out-of-state respondents, by wineries shown in Figure 3. The data indicate that the
larger wineries (i.e., Biltmore, Shelton and Childress) had the most out-of-state visitors.
The border states (North and South of NC) provide the majority of the NC wine
tourists. However, this is also true for all general tourism visitors to North Carolina. This
finding would suggest that our neighbor states and large cities are viable markets for
attracting wine visitors. This includes places like Columbia and Greenville (SC), Roanoke,
Norfolk, and Richmond (VA), Knoxville and Bristol (TN), and Atlanta (GA).
Travel Party Profile
The average size of a travel party to the NC winery is 2.85 persons. This is
comparable to the average NC travel party size of 2.8 persons reported by the 2006 Fast
Facts, TNS Travels America 2007. The range of visitors reported was 1 to 44 people. In the
Figure 3 - Out of State or International Visitors by Winery
(N=416)
0 10 20 30 40 50 60 70 80 90 1000
Cypress Bend Dennis
Chatham Hill Raylen
Rockhouse Duplin
Iron Gate Banner Elk
RagApple Lassie Silver Coast
Childress Shelton
Biltmore
Winery
Percent of Responses

12
analysis, the party of 44 people was removed as an outlier to avoid skewing the statistics. Of
this, 4% of the travel parties were single person and 8% were travelling in large groups of 6
persons or more. The majority of travel parties (54%) were part of a 2-person travel party.
A major concern of the study was the measurement of travel parties with children
under the age of 18 yrs. and the implications that may have on “family” winery offerings.
The data revealed that only 11% of the visitors to NC wineries brought minors with them. It
appears that winery visitation is more of an adult activity and that people are not choosing to
bring children under the age of 18 years to the wineries.
Figure 5 indicates the length of stay of the respondents. Across the sample, 52%
indicated they were day-trippers, while 10% reported staying one night, 26% reported staying
2-4 nights, and 12% reported staying 5 or more nights.
Figure 5. Length of Stay (n=903)
day trippers
stay one night
stay 2-4 nights
stay 5 or more
nights

13
Of those who characterized themselves as “overnight” visitors, the preferred
accomodation choices are given in Figure 6. This is a very positive finding in that visitors are
choosing local accommodations, thus adding to the economic impact of their visits.
Across the sample, 61% of the respondents reported they were first-time visitors to a North
Carolina winery (Figure7). The remainder (39%) indicated they were returning visitors
Figure 6 - Type of Accommodations Used (n=467)
0 10 20 30 40 50 60
Hotel/B&B
Friends/Family
Camp
Second Homes
Cabins
Resorts
Miscellaneous
Percentage of Respondents
Accommodation Type
Figure 7. New (First-time) vs. Returning Visitors (N=925)
New = 61%
Returning = 39%
14
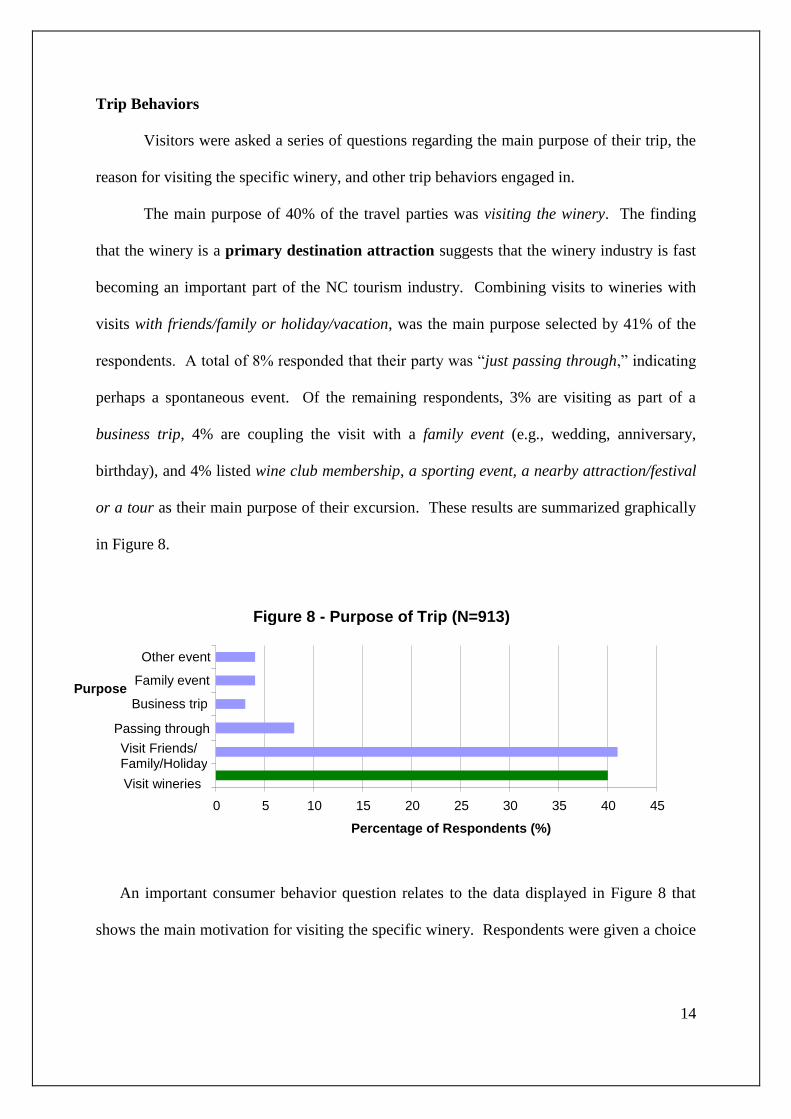
Trip Behaviors
Visitors were asked a series of questions regarding the main purpose of their trip, the
reason for visiting the specific winery, and other trip behaviors engaged in.
The main purpose of 40% of the travel parties was visiting the winery. The finding
that the winery is a primary destination attraction suggests that the winery industry is fast
becoming an important part of the NC tourism industry. Combining visits to wineries with
visits with friends/family or holiday/vacation, was the main purpose selected by 41% of the
respondents. A total of 8% responded that their party was “just passing through,” indicating
perhaps a spontaneous event. Of the remaining respondents, 3% are visiting as part of a
business trip, 4% are coupling the visit with a family event (e.g., wedding, anniversary,
birthday), and 4% listed wine club membership, a sporting event, a nearby attraction/festival
or a tour as their main purpose of their excursion. These results are summarized graphically
in Figure 8.
An important consumer behavior question relates to the data displayed in Figure 8 that
shows the main motivation for visiting the specific winery. Respondents were given a choice
Figure 8 - Purpose of Trip (N=913)
0 5 10 15 20 25 30 35 40 45
Visit wineries
Visit Friends/ Family/Holiday
Passing through
Business trip
Family event
Other event
Purpose
Percentage of Respondents (%)

15
of 10 activities and encouraged to select as many as were applicable. The responses are listed
below in order of descending priority.
Taste wine (63%)
Buy wine (57%)
Have a relaxing day out (49%)
Winery tour (31%)
Socialize with friends/family (22%)
Enjoy a rural setting (16%)
Eat at winery restaurant (12%)
To be entertained (10%)
Meet the winemaker (7%)
Other (4%)
The breadth of the travel party’s winery visit experience during the trip was also
surveyed. It was determined that 60% of the respondents visited only one winery during their
excursion. Two wineries were visited by 20% of respondents, 14% visited three or four
wineries, while only 6% visited five or more wineries. This information is conveyed
graphically in Figure 9.
Figure 9 - Number of Wineries Visited (N=869)
1 winery
60%
2 wineries
20%
3 or 4 wineries
14%
5 or more wineries
6%
16
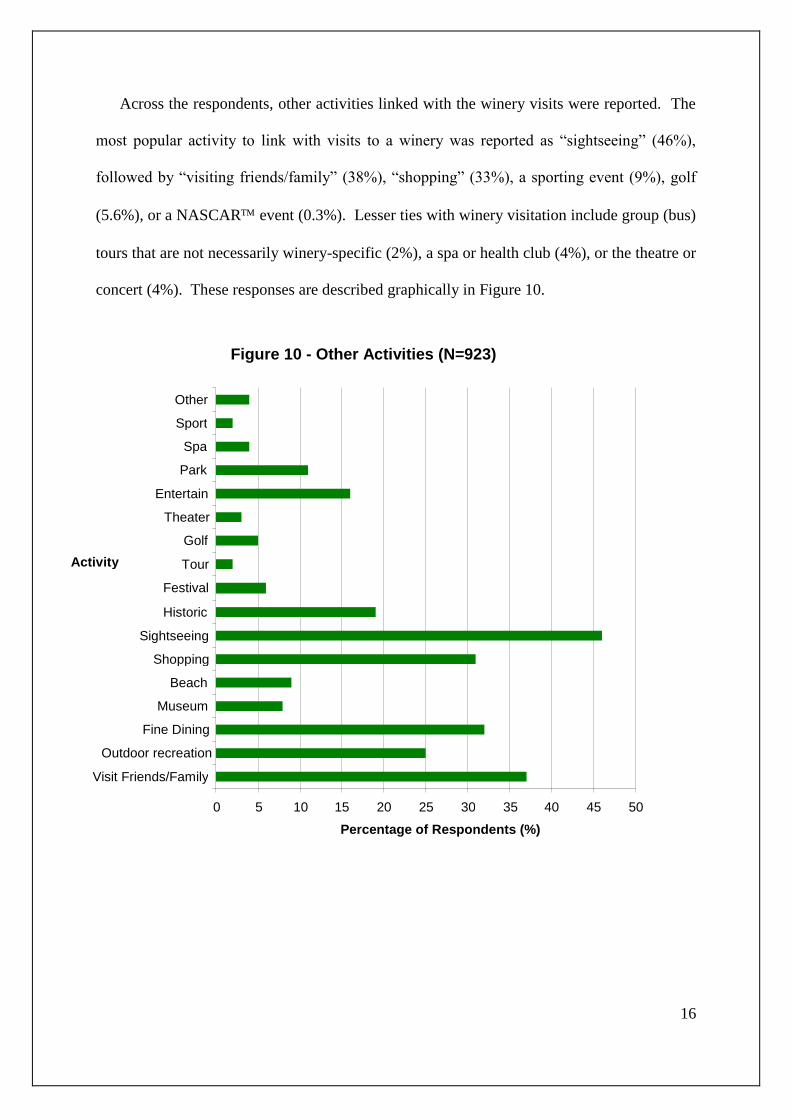
Across the respondents, other activities linked with the winery visits were reported. The
most popular activity to link with visits to a winery was reported as “sightseeing” (46%),
followed by “visiting friends/family” (38%), “shopping” (33%), a sporting event (9%), golf
(5.6%), or a NASCAR event (0.3%). Lesser ties with winery visitation include group (bus)
tours that are not necessarily winery-specific (2%), a spa or health club (4%), or the theatre or
concert (4%). These responses are described graphically in Figure 10.
Figure 10 - Other Activities (N=923)
0 5 10 15 20 25 30 35 40 45 50
Visit Friends/Family
Outdoor recreation
Fine Dining
Museum
Beach
Shopping
Sightseeing
Historic
Festival
Tour
Golf
Theater
Entertain
Park
Spa
Sport
Other
Activity
Percentage of Respondents (%)
17
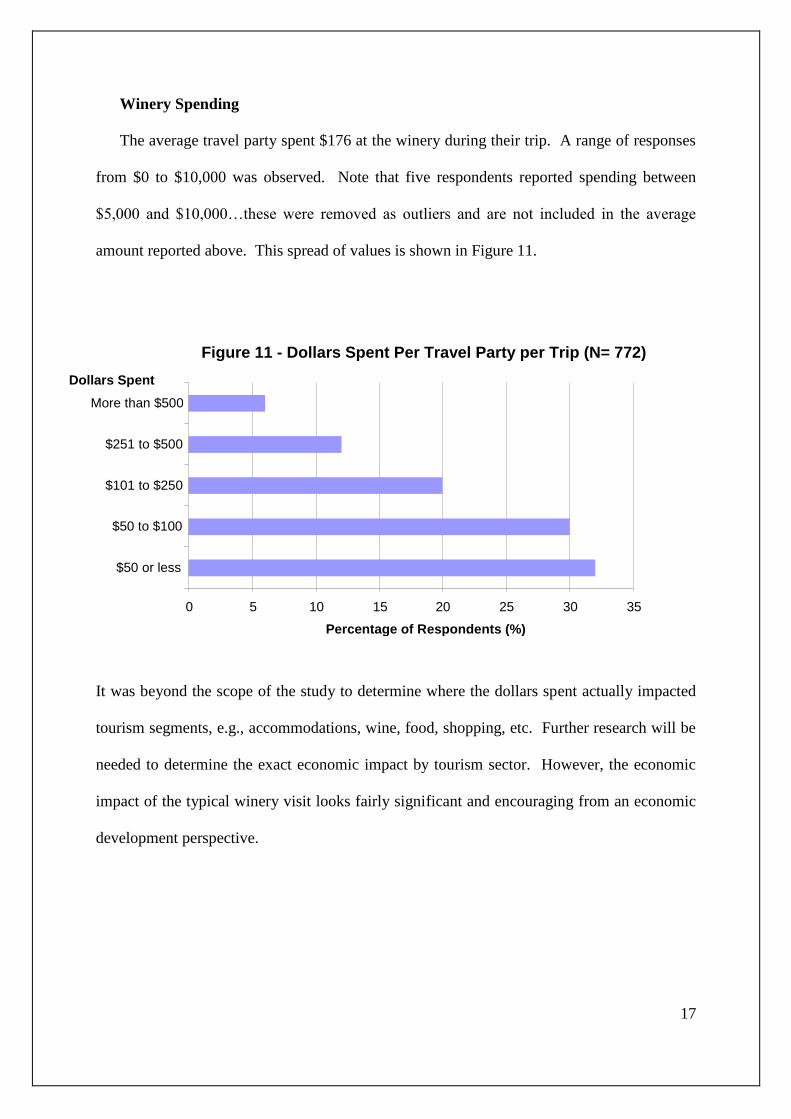
Winery Spending
The average travel party spent $176 at the winery during their trip. A range of responses
from $0 to $10,000 was observed. Note that five respondents reported spending between
$5,000 and $10,000…these were removed as outliers and are not included in the average
amount reported above. This spread of values is shown in Figure 11.
It was beyond the scope of the study to determine where the dollars spent actually impacted
tourism segments, e.g., accommodations, wine, food, shopping, etc. Further research will be
needed to determine the exact economic impact by tourism sector. However, the economic
impact of the typical winery visit looks fairly significant and encouraging from an economic
development perspective.
Figure 11 - Dollars Spent Per Travel Party per Trip (N= 772)
0 5 10 15 20 25 30 35
$50 or less
$50 to $100
$101 to $250
$251 to $500
More than $500
Dollars Spent
Percentage of Respondents (%)

18
Information Sources
An important question for industry planning/oversight organizations revolves around the
primary source of information used by winery visitors. Table 2 shows the most influential
sources of information used by percentage of visitors to the wineries
Table 2 – Most Influential Information Source (N=903)
Information Source Percent
(%)
Friend or Relative 31.8
Internet 16.2
Billboard Ad 10.7
Winery Brochure 7.5
Visitor Center 3.8
Magazine Ad 3.4
Directory/Guidebook 3.4
Previous Visit 2.7
TV Ad 2.4
Newspaper Ad 2.2
Personal/Business
Recommendation
1.9
News or Feature Story 1.7
Proximity 1.7
Saw Road Signs 1.7
Other 1.6
Reputation 1.1
Driving By 1.0
Saw/Tasted Wine 1.0
NASCAR 0.9
Wine Club Membership 0.8
Part of Tour 0.8
Festival Booth 0.6
Other Written Media 0.5
Radio Ad 0.3
Direct Mailing 0.3
TOTAL 100.0
Of particular interest is the relatively high importance of “word-of-mouth” referral by
friends and family. This appears to be a very effective method of marketing for the wine
industry and also follows traditional methods used by tourism attractions and hospitality
firms in general. However, it is very dependent on a very good experience by the visitor at

19
the attraction and/or destination. The internet and billboards also appear to be important
sources of information for consumers. Note in particular the relatively low effectiveness of
several forms of media ads, including radio, direct mail, etc. These findings are summarized
below graphically in Figure 12 by number of respondents using a specific information source.
Figure 12 - Influential Information Sources (n=903)
0 50 100 150 200 250 300
TV Ad
Magazine Ad
Billboard Ad
Newspaper Ad
Radio Ad
Internet
Friend or Relative
Visitor Center
Directory/Guidebook
News or Feature Story
Winery Brochure
Other
Personal/Business Recommendation
Driving By
Festival Booth
Reputation
Other Written Media
Previous Visit
Proximity
NASCAR
Wine Club Membership
Saw/Tasted Wine
Direct Mailing
Saw Road Signs
Part of Tour
Information Sources
Number of Respondents
20
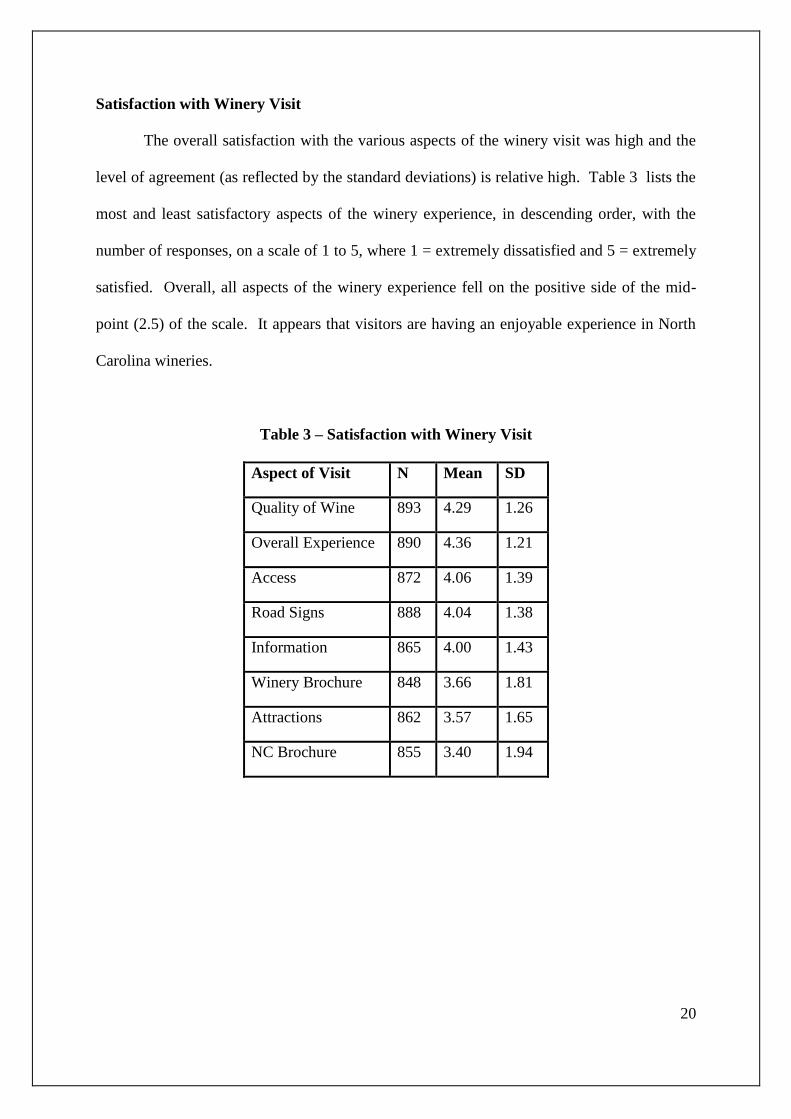
Satisfaction with Winery Visit
The overall satisfaction with the various aspects of the winery visit was high and the
level of agreement (as reflected by the standard deviations) is relative high. Table 3 lists the
most and least satisfactory aspects of the winery experience, in descending order, with the
number of responses, on a scale of 1 to 5, where 1 = extremely dissatisfied and 5 = extremely
satisfied. Overall, all aspects of the winery experience fell on the positive side of the mid-
point (2.5) of the scale. It appears that visitors are having an enjoyable experience in North
Carolina wineries.
Table 3 – Satisfaction with Winery Visit
Aspect of Visit N Mean SD
Quality of Wine 893 4.29 1.26
Overall Experience 890 4.36 1.21
Access 872 4.06 1.39
Road Signs 888 4.04 1.38
Information 865 4.00 1.43
Winery Brochure 848 3.66 1.81
Attractions 862 3.57 1.65
NC Brochure 855 3.40 1.94

21
Segmentation Analysis for Marketing Implications
To guide marketing and advertising strategies, a number of interesting questions can
be answered by the data relating to the differences between instate and out of state visitors
and daytrippers and overnight visitors.
Comparison of Instate vs. Out of State Visitors
Comparing instate vs. out of state visitors it was clear there were significant
differences between number of new vs. returning visitors (x2
= 37.294, df = 1, p<.001). The
data show that 72% of the out of state visitors were new visitors to the NC winery they were
visiting. In contrast, while a greater percentage of the instate visitors were new visitors
(52.5%) to the winery, the percentages of new vs. returning instate visitors were not very
different, as shown in Table 6.
Table 6
-Instate vs. Out of State by Type of Visitor (N = 925)
Type of
Visitor
% Instate
(N=509)
% Out of State
(N=416)
New 52.5 72.1
Returning 47.5 27.9
TOTAL 100.0 100.0

22
Similarly, there were significant differences (x2
= 197.439, df =13, p<.001) in the
main purpose of the trip for instate vs. out of state visitors across all choices. Table 7 shows
the main motivation in rank order for both instate and out of state visitors. Rank differences
of 5 or more were considered significant.
Analyzing individual purposes in this way, wine club membership was rated
significantly higher by instate visitors.
Table 7
Main Purpose of Trip by Instate vs. Out of State Visitors (N=913)
Purpose of Trip Instate (N=497) Out of State (N=416) Rank
Difference Percent (%) Rank Percent (%) Rank
Visiting Wineries 57.5 1 18.8 3 -2
Holiday or Vacation 13.7 2 35.8 1 1
Just Passing Through 9.7 3 6 4 -1
Visit Friends or Family 8.5 4 27.9 2 2
Family Event 3.2 5 4.1 5 0
Business 2.6 6 3.4 6 0
Miscellaneous purposes 2.2 7 1.9 7 0
Wine Club Member 1 8 0 13 -5
Season Pass 0.4 9 0 12 -3
Nearby Attraction 0.4 9 0.8 8 1
Festival 0.4 9 0 11 -2
Sport 0.2 12 0.5 10 2
Racing 0.2 12 0.8 8 4
TOTAL 100.0 100.0
23
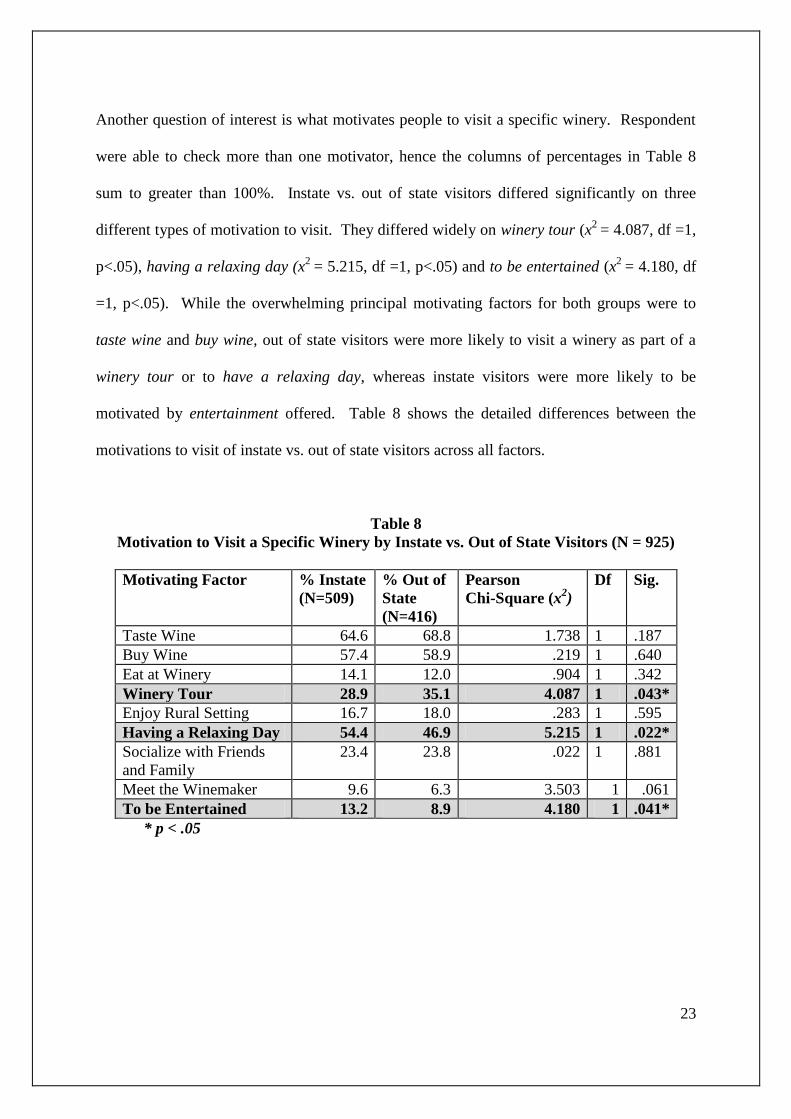
Another question of interest is what motivates people to visit a specific winery. Respondent
were able to check more than one motivator, hence the columns of percentages in Table 8
sum to greater than 100%. Instate vs. out of state visitors differed significantly on three
different types of motivation to visit. They differed widely on winery tour (x2
= 4.087, df =1,
p<.05), having a relaxing day (x2
= 5.215, df =1, p<.05) and to be entertained (x2
= 4.180, df
=1, p<.05). While the overwhelming principal motivating factors for both groups were to
taste wine and buy wine, out of state visitors were more likely to visit a winery as part of a
winery tour or to have a relaxing day, whereas instate visitors were more likely to be
motivated by entertainment offered. Table 8 shows the detailed differences between the
motivations to visit of instate vs. out of state visitors across all factors.
Table 8
Motivation to Visit a Specific Winery by Instate vs. Out of State Visitors (N = 925)
Motivating Factor % Instate
(N=509)
% Out of
State
(N=416)
Pearson
Chi-Square (x2)
Df Sig.
Taste Wine 64.6 68.8 1.738 1 .187
Buy Wine 57.4 58.9 .219 1 .640
Eat at Winery 14.1 12.0 .904 1 .342
Winery Tour 28.9 35.1 4.087 1 .043*
Enjoy Rural Setting 16.7 18.0 .283 1 .595
Having a Relaxing Day 54.4 46.9 5.215 1 .022*
Socialize with Friends
and Family
23.4 23.8 .022 1 .881
Meet the Winemaker 9.6 6.3 3.503 1 .061
To be Entertained 13.2 8.9 4.180 1 .041*
* p < .05
24
To better reach prospective winery visitors, it is important to understand the
information sources used. A comparison of the most influential information source used by
the respondents revealed some interesting differences between instate and out of state
visitors. An overall assessment of influential information source showed significant
differences between the two groups (x2= 59.119, df=24, p = 000).
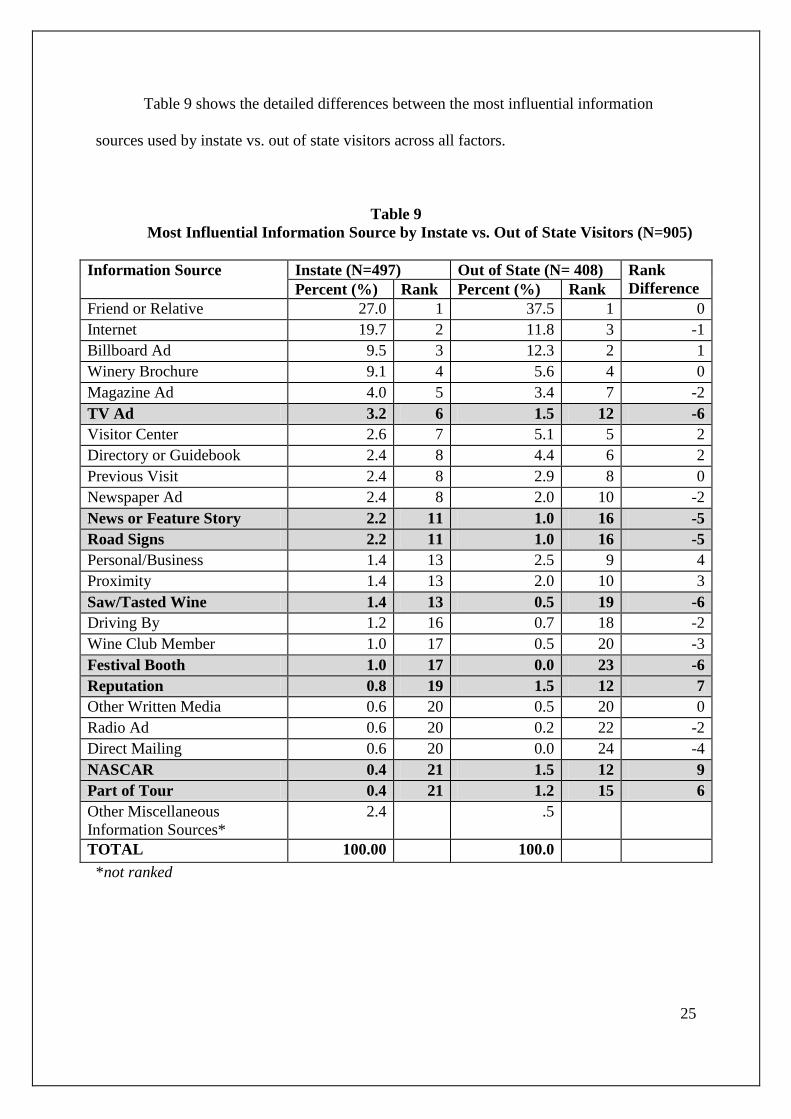
To identify the individual information sources that were significantly difference, the
sources were ranked according to percentage of respondents who chose a particular source
and rank differences between instate and out of state visitors were assessed. Significant
differences were found between eight information sources: TV Ads, news or feature story,
road signs, NASCAR, part of a tour, festival booth, reputation, and saw/tasted wine.
Instate visitors were influenced to a greater extent by the media - TV Ads, news or
feature stories, road signs, information found at a festival booth and seeing/tasting the wine,
whereas out of state visitors were influenced to a greater extent by reputation, NASCAR and
part of a tour.
25
Table 9 shows the detailed differences between the most influential information
sources used by instate vs. out of state visitors across all factors.
Table 9
Most Influential Information Source by Instate vs. Out of State Visitors (N=905)
Information Source Instate (N=497) Out of State (N= 408) Rank
Difference Percent (%) Rank Percent (%) Rank
Friend or Relative 27.0 1 37.5 1 0
Internet 19.7 2 11.8 3 -1
Billboard Ad 9.5 3 12.3 2 1
Winery Brochure 9.1 4 5.6 4 0
Magazine Ad 4.0 5 3.4 7 -2
TV Ad 3.2 6 1.5 12 -6
Visitor Center 2.6 7 5.1 5 2
Directory or Guidebook 2.4 8 4.4 6 2
Previous Visit 2.4 8 2.9 8 0
Newspaper Ad 2.4 8 2.0 10 -2
News or Feature Story 2.2 11 1.0 16 -5
Road Signs 2.2 11 1.0 16 -5
Personal/Business 1.4 13 2.5 9 4
Proximity 1.4 13 2.0 10 3
Saw/Tasted Wine 1.4 13 0.5 19 -6
Driving By 1.2 16 0.7 18 -2
Wine Club Member 1.0 17 0.5 20 -3
Festival Booth 1.0 17 0.0 23 -6
Reputation 0.8 19 1.5 12 7
Other Written Media 0.6 20 0.5 20 0
Radio Ad 0.6 20 0.2 22 -2
Direct Mailing 0.6 20 0.0 24 -4
NASCAR 0.4 21 1.5 12 9
Part of Tour 0.4 21 1.2 15 6
Other Miscellaneous
Information Sources*
2.4 .5
TOTAL 100.00 100.0
*not ranked

26
In moving towards packaging the winery experience with complementary activities, it
is useful to know what other activities visitors engaged in during their winery trip. Table 10
demonstrates a clear preference for a number of activities by instate vs. out of state visitors.
For example, out of state visitors were much more likely to include a visit to friends or
family, shopping, sightseeing (including a visit to a national or state park) or a historic tour in
their trip. They were also more likely to engage in fine dining experiences, take in a concert,
visits to museums and galleries and/or outdoor recreation, including a trip to the beach or
water.
Table 10
Activities Engaged in During Trip by Instate vs. Out of State Visitors (N=921)
Activities % Instate
(N= 506)
% Out of
State
(N=415)
Pearson
Chi-Square
(x2)
Df Sig.
Visit Friends/Family 31.4 44.8 17.466 1 .000***
Outdoor Recreation 20.2 28.0 7.665 1 .006**
Fine Dining 29.7 39.3 9.286 1 .002**
Museums/Gallery 6.1 11.6 8.713 1 .003**
Beach/Water 8.1 13.7 7.72 1 .005**
Shopping 24.8 41.4 28.938 1 .000***
Sightseeing 37.0 54.7 28.887 1 .000***
Historic Tour 11.4 26.7 35.719 1 .000***
Festival/Fair 5.1 8.2 3.553 1 .059
Group Tour 2.2 2.7 .23 1 .631
Golf 4.5 7.2 3.080 1 .079
Theater/Concert 2.6 5.3 4.708 1 .030*
Entertainment 14.6 1.3 1.328 1 .249
National/State Park 7.3 18.1 24.936 1 .000***
Spa/Health Club 3.0 5.1 2.707 1 .100
Sporting Event 2.0 3.6 2.348 1 .125
*p <.05, **p < .01, ***p < .001
Finally, the data were analyzed to assess the patterns of spending of instate vs. out of
state visitors. A t-test revealed a significant difference (t= -3.229, p< .001) between the
average number of dollars spent per travel party of instate visitors ($144.20) and that of
outstate visitors ($214.74). Out of state visitors, on average are spending 50% more than

27
travel parties of instate visitors. This finding would appear to indicate that the out of state
market should be an important component of any strategic planning exercise.
Comparison of Daytrippers vs. Overnight Visitors
Another segmentation of the data that would appear to be useful in focusing
marketing and advertising programs is the difference between daytrippers and overnight
visitors.
The data validated the assumption that the greater majority of out of state visitors stay
overnight. Comparing the groups it was clear that there were significant differences in the
numbers of instate vs. out of state visitors who were daytrippers or overnight visitors, as
shown in Table 11. However, the data also show that not all out of state visitors stay
overnight and that one in four visitors coming from out of state are daytrippers. This reveals
an opportunity to expand the winery experience to entice out of state visitors to spend more
time in North Carolina to increase the tourism dollars generated by the wine industry.
Table 11
Instate/Out of State by Daytripper/Overnight Visitors (N=925)
Type of Visitor % Instate % Out of State
Daytripper 75.2 24.8
Overnight 32.2 67.8
The data also revealed some interesting differences between daytrippers and overnight
visitors when the data were analyzed across the same dimensions described above for the
instate vs. out of state visitors.

28
Overall, there were significant differences in the main purpose of their trip between
daytrippers and overnight visitors (x2=246.001, df=13, p = .000). In analyzing the data on
individual factors, Table 12 shows that daytrippers ranked
a sport event significantly higher than the overnight visitors. And, while the rank of visiting
wineries, holiday/vacation and visiting family and friends is quite similar between the two
groups, it should be noted that the percentages choosing these categories were very different.
Daytrippers were more likely to have a main purpose of visiting a winery, while a larger
percentage of overnighters were visiting friends or family and/or enjoying a holiday or
vacation.
Table 12
Main Purpose of Trip by Daytrippers vs. Overnight (N=895)
Purpose of Trip Daytripper (N=465) Overnight (N=430) Rank
Difference Percent (%) Rank Percent (%) Rank
Visiting Wineries 59.1 1 19.3 3 -2
Just Passing Through 12.5 2 3.0 6 -4
Visit Friends or family 10.1 3 24.9 2 1
Holiday or Vacation 9.5 4 39.8 1 3
Family Event 2.6 5 4.7 4 1
Business 1.7 6 4.2 5 1
Wine Club Member 1.2 7 0.0 11 -4
Nearby Attraction 0.4 8 0.7 7 1
Racing 0.4 8 0.5 9 -1
Season Pass 0.4 8 0.0 11 -3
Festival 0.3 11 0.2 10 1
Sport 0.0 12 0.7 7 5
Other Miscellaneous
Purposes*
1.8 2.0
TOTAL 100.0 100.0
*not ranked

29
When comparing motivating factors for daytrippers to those of overnight visitors, no
significant differences were noted (See Table 13).
Table 13
Motivation to Visit by Daytrippers vs. Overnight (N=903)
Motivating Factor %
Daytripper
(N=471)
%
Overnight
(N=432)
Pearson
Chi-Square
(x2)
Df Sig.
Taste Wine 64.8 69.2 2.02 1 .155
Buy Wine 56.7 59.7 .852 1 .356
Eat at Winery 13.6 12.7 .145 1 .704
Winery Tour 29.9 33.3 1.204 1 .273
Enjoy Rural Setting 17.6 16.9 .083 1 .774
Having a Relaxing Day 52.7 49.1 1.155 1 .282
Socialize with Friends/Family 21.0 25.9 3.030 1 .082
Meet the Winemaker 7.0 9.5 1.849 1 .174
To be Entertained 11.3 11.3 .002 1 .966
When the most influential information source used by daytrippers on an individual
basis was compared to those used by overnight visitors, a number of similarities and
differences were noted.
30
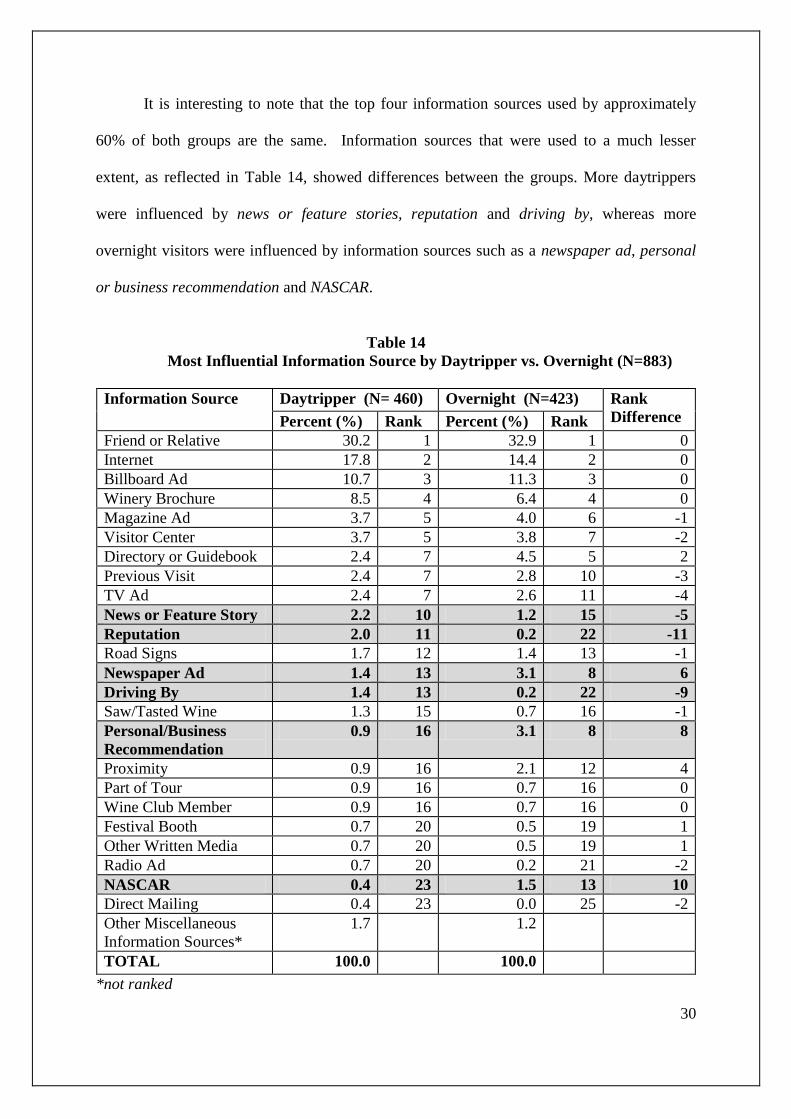
It is interesting to note that the top four information sources used by approximately
60% of both groups are the same. Information sources that were used to a much lesser
extent, as reflected in Table 14, showed differences between the groups. More daytrippers
were influenced by news or feature stories, reputation and driving by, whereas more
overnight visitors were influenced by information sources such as a newspaper ad, personal
or business recommendation and NASCAR.
Table 14
Most Influential Information Source by Daytripper vs. Overnight (N=883)
Information Source Daytripper (N= 460) Overnight (N=423) Rank
Difference Percent (%) Rank Percent (%) Rank
Friend or Relative 30.2 1 32.9 1 0
Internet 17.8 2 14.4 2 0
Billboard Ad 10.7 3 11.3 3 0
Winery Brochure 8.5 4 6.4 4 0
Magazine Ad 3.7 5 4.0 6 -1
Visitor Center 3.7 5 3.8 7 -2
Directory or Guidebook 2.4 7 4.5 5 2
Previous Visit 2.4 7 2.8 10 -3
TV Ad 2.4 7 2.6 11 -4
News or Feature Story 2.2 10 1.2 15 -5
Reputation 2.0 11 0.2 22 -11
Road Signs 1.7 12 1.4 13 -1
Newspaper Ad 1.4 13 3.1 8 6
Driving By 1.4 13 0.2 22 -9
Saw/Tasted Wine 1.3 15 0.7 16 -1
Personal/Business
Recommendation
0.9 16 3.1 8 8
Proximity 0.9 16 2.1 12 4
Part of Tour 0.9 16 0.7 16 0
Wine Club Member 0.9 16 0.7 16 0
Festival Booth 0.7 20 0.5 19 1
Other Written Media 0.7 20 0.5 19 1
Radio Ad 0.7 20 0.2 21 -2
NASCAR 0.4 23 1.5 13 10
Direct Mailing 0.4 23 0.0 25 -2
Other Miscellaneous
Information Sources*
1.7 1.2
TOTAL 100.0 100.0
*not ranked

31
Comparing daytrippers with overnights visitors relative to other activities they
engaged in during their winery trip, revealed a number of significant differences (See Table
15). For example, overnight visitors were much more likely to engage in outdoor
recreational activities (including visits to a national or state park and/or the beach or water),
historic tours, shopping, sightseeing and general entertainment. They were also more likely
to visit friends and family, stop by a museum or gallery or a festival/fair and perhaps indulge
in a relaxing visit to a spa or health club.
Table 15
Other Activities Engaged in during Trip by Daytrippers vs. Overnight Visitors (N=901)
Activities %
Daytripper
(N=469)
%
Overnight
(N=432)
Pearson
Chi-
Square
Df Sig.
Visit Friends/Family 33.8 41.7 5.870 1 .015*
Outdoor Recreation 14.9 33.3 41.69 1 .000***
Fine Dining 25.6 43.8 32.924 1 .000***
Museums/Gallery 6.6 10.6 4.692 1 .030*
Beach/Water 6.0 15.3 20.848 1 .000***
Shopping 24.9 40.3 24.172 1 .000***
Sightseeing 35.6 56.3 38.640 1 .000***
Historic Tour 13.4 24.1 16.864 1 .000***
Festival/Fair 4.1 8.6 7.859 1 .005**
Group Tour 2.6 2.1 .223 1 .637
Golf 4.5 7.2 3.011 1 .083
Theater/Concert 3.2 4.4 .892 1 .345
Entertainment 12.6 19.2 7.452 1 .006**
National/State Park 7.9 16.7 16.292 1 .000***
Spa/Health Club 1.9 6.0 10.122 1 .001**
Sporting Event 2.1 3.2 1.066 1 .302
*p <.05, **p < .01, ***p < .001

32
Conclusions
North Carolina wineries currently have 53% of the wine visitors coming from the
state of North Carolina. Other visits (approximately 47%) are coming from border states or
states on the east coast of the US. A minimal number of visitors are international. The
average party size is 2.85 persons. Most travel parties consist of older adults and not young
families. The visitors have high household incomes and are highly educated. Approximately
52% are day-trippers, with the rest of the sample spending one or more nights (considered
overnight visitors). The most popular accommodations used by overnight visitors were
hotels or B&B inns. Staying with family or friends was also a quite popular form of
accommodation.
Approximately 61% were new or first-time visitors and 39% indicated they were
returning visitors. These statistics may be viewed as positive behaviors for a young and
growing industry. A majority of the visitors only visited one winery. Some parties
visited more than one winery on their trip. We assume that this statistic will increase as the
NC wine industry expands and grows in popularity and reputation.
In general, the results of this preliminary study support the conclusion that the
wineries in North Carolina are doing an excellent job of providing satisfaction to the visitor,
both from the point of view of wine quality and quality of the overall experience. Current
visitation appears to be mainly a curiosity and desire to taste the wine produced at the
winery. The data suggest that at this point in time the majority of visitors are not going to the
wineries to dine or shop for items other than wine. It appears that many of the respondents
are travelling for the sole purpose of visiting the winery. And furthermore, 41% are using a
winery visit as an opportunity to have relaxing social experiences with friends or family.

33
There may be opportunities for future packaging of sightseeing drives (scenic by-ways) with
some limited shopping, and light outdoor recreation such as visiting parks or using a walking
or hiking trail. Further research or a review of other wine industry studies is suggested for
creative ideas and effective packaging opportunities.
Segmenting the findings based on instate vs. out of state visitors and daytrippers vs.
overnight visitors revealed some interesting similarities and differences that can be used to
help focus future marketing efforts of the NC wine industry. For example, while a great
percentage of instate visitors were new visitors to the winery, the percentages of new vs.
returning instate visitors were not very different. Similarly, the purpose and motivation for
visitors was significantly different. Instate visitors reported that wine club membership was a
more significant factor than for out of state visitors.
While the overwhelming principal motivating factors for both groups were to taste
wine and buy wine, out of state visitors were more likely to visit a winery as part of a winery
tour or to have a relaxing day, whereas instate visitors were ;more likely to be motivated by
entertainment offered at the winery. Significant differences were also found between
information sources used. Instate visitors were influenced to a greater extent by the media –
TV ads, news or feature stories, road signs, information found at a festival booth and
seeing/tasting wine, whereas out of state visitors were influenced to a greater extent by
reputation, NACAR and part of a tour.
Instate vs. out of state visitors also varied on the types of activities they combined
with their winery trip. Out of states visitors were much more likely to include a visit to
friends or family, shopping, sightseeing (including a visit to a national or state park) or a

34
historic tour in their trip. They were also more likely than instate visitors to engage in fine
dining experiences, take in a concert, visits to museums and galleries and/or outdoor
recreation, including a trip to beach or water. Finally, a comparison of instate vs. out of
state visitors revealed that out of state visitors on average spent 50% more than instate
visitors.
Comparing daytrippers with overnight visitors, it appears that daytrippers were more
likely to report a main purpose of visiting a winery, while a larger percentage of overnighters
said their main purpose was visiting friend or family and/or enjoying a holiday or vacation.
Motivating factors daytrippers and overnight visitors did not vary significantly. The greater
majority of both groups were influenced by friends or relatives, internet, billboard ads and a
winery brochure. However, more daytrippers were influenced by news or feature stories,
reputation and driving by, whereas more overnight visitors were influenced by information
sources such as a newspaper ad, personal or business recommendation and NASCAR.
Comparing activities engaged in during the winery trip, overnight visitors were much
more likely to engage in outdoor recreational activities (including visits to a national or state
park and/or beach or water), historic tours, shopping, sightseeing and general entertainment.
They were also more likely to visit friends and family, stop by a museum or gallery or a
festival/fair and perhaps visit a spa or health club.

35
Bibliography
Brown, G.P., Havitz, M.E., and Getz, D. (2006). Relationship Between Wine Involvement
and Wine-Related Travel. Journal of Travel and Tourism Marketing. Vol. 21(1):
31-46.
Charters, S. and Ali-Knight, J. (2000). Wine Tourism – a thirst for knowledge?
International Journal of Wine Marketing, Vol. 12(3): 70-81
Charters, S. and Ali-Knight, J. (2002). Who is the Wine Tourist? Tourism Management,
Vol. 23(3): 311-319.
Cullen, C., Pickering, G. and Phillips, R. (2002). Bacchus to the Future: Proceedings of the
Inaugural Brock University Wine Conference. St. Catherine’s Canada: Brock
University.
Dodd, T. and Bigotte, V. (1997). Perceptual Differences Among Visitor Groups to Wineries.
Journal of Travel Research, Vol 35(3): 46-51.
Dowling, R. and Carlsen, J. (1998). Wine Tourism: Perfect Partners. Proceedings of the
First Australian Wine Tourism Conference, Margaret River, Australia, May.
Canberra, Australia: Bureau of Tourism Research.
TNS Travels America (2007). Fast Facts 2006. North Carolina Visitor and Trip Profile.
North Carolina Division of Tourism, Film and Sports Development website.
Getz, D., Dowling, R., Carlsen, J. and Anderson, D. (1999). Critical Success Factors for
Wine Tourism, International Journal of Wine Marketing. Vol. 11(3): 20-44.
Getz, D. (2000). Explore Wine Tourism: Management, Development, Destinations. New
York: Cognizant.
Hall, M., Sharples, L., Cambourne, B. and Macionis, N. (2000). Wine Tourism around the
World. Oxford: Butterworth-Heinemann.
Lochshin, L. and Spawton, T. (2001). Using Involvement and Brand Equity to Develop a
Wine Tourism Strategy. International Journal of Wine Marketing, Vol. 13(1): 72-82.
MKF Research LLC (2007). Economic Impact of North Carolina Wine and Grapes 2005.
Accessed on September 2 2007 at:
http://www.nccommerce.com/NR/rdonlyres/BCCD24D8-5263-401B-AC43-
984A8968412B/0/EconomicImpactofNorthCarolinaWine2005.pdf
Ryan, C. (ed.) (2002). The Tourist Experience. 2nd
Edition. London: Continuum.
Yuan, J., Liping, A., Morrison, A. and Linton, S. (2004). An analysis of wine festival
attendees’ motivations: A synergy of wine, travel and special events. Journal of
Vacation Marketing, Vol 11(1): 41-58.

36
APPENDIX A
SURVEY

37
**** Win a chance to receive a free case of North Carolina wine ***** by completing this survey.
ONLY ONE SURVEY PER TRAVEL PARTY PLEASE.
This short survey is being conducted to learn more about the visitors to the North Carolina wine regions and is being conducted by the North Carolina Wine and Grape Council and the North Carolina Division of Tourism. Your opinions are very important to us as we continually strive to make your visitor experience more enjoyable. Please be assured that your responses are strictly confidential. If you have completed this survey at another winery please do not continue. 1. Are you a new or returning visitor to a North Carolina winery?
New Returning
2. Please tell us the total number of people in your travel party, including yourself.
1 person 2 people 3 people 4 people 5 people 6 or more people 3. Please tell us the number of people in your travel party who are under 18 years of age.
0 person 1 person 2 people 3 people 4 people 5 or more people 4. Are you here on a day trip or staying overnight in the area?
Day trip 1 night 2 nights 3 nights 4 nights 5 or more nights
5. If you are staying overnight, please tell us what type of accommodation you are using. Hotel/motel bed and
breakfast friends and family camping other, please
describe
6. What is the main purpose of your trip? Check one. Visiting wineries Visit friends or family Holiday/Vacation Business
Just passing through Other, please describe
7. What is your motivation for visiting THIS specific winery? Please check ALL that apply. Taste
wine Buy
wine Eat at
winery restaurant
Winery tour
Enjoy a rural setting
Have a relaxing day out
Socialize with friends/family Meet the winemaker
To be entertained Other, please describe
8. Which information source most influenced your decision to visit THIS winery or wine region? Check one. TV Ad Billboard
Ad Newspaper
Ad Magazine
Ad Radio Ad Internet
Friend and/or Relative
Visitor Center
Directory or Guidebook
News or Feature Story
Winery Brochure
Other, please describe
9. Please indicate how satisfied you were with EACH of these aspects of your visit to THIS winery. Aspect of Trip Extremely
Dissatisfied Reasonably Dissatisfied
Satisfied Reasonably Satisfied
Extremely Satisfied
No Experience
Quality of wine
Overall wine experience
Attractions on wine route
Access to wineries
Information about wineries
NC Winery brochure
Individual Winery Brochure
Road signs to wineries
10. How many wineries will you visit on this trip? 1 winery 2 wineries 3 wineries 4 wineries 5+ wineries
38
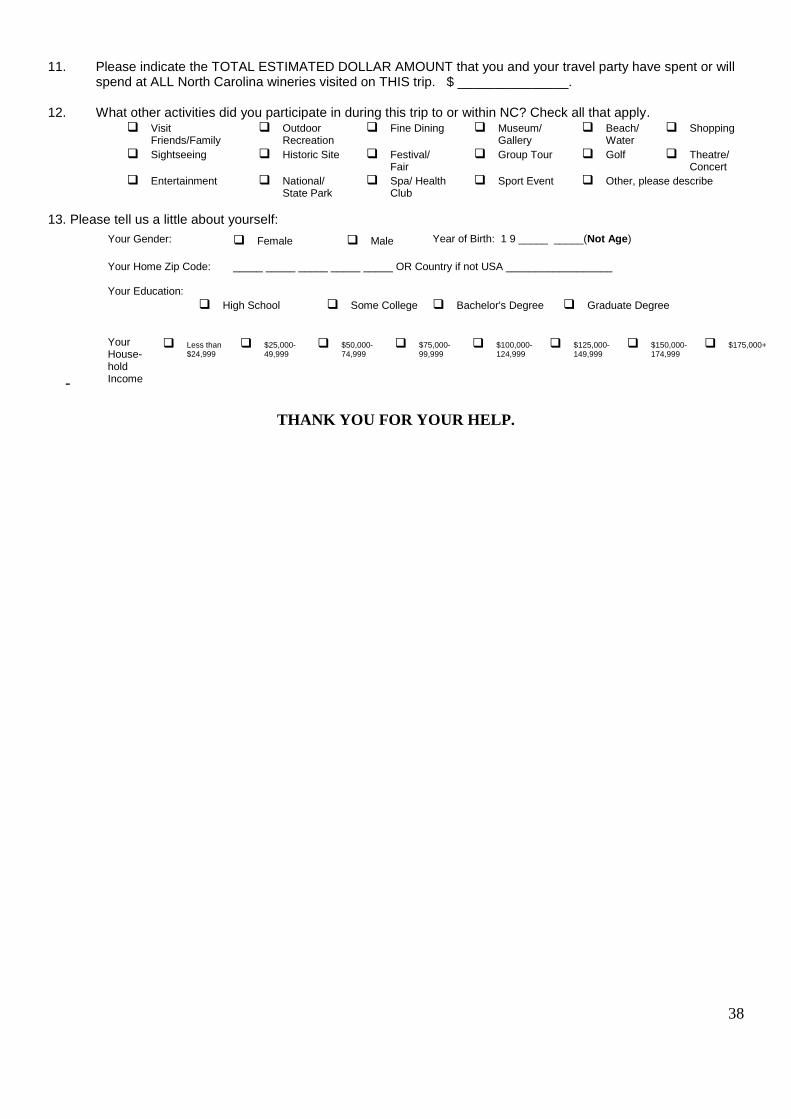
11. Please indicate the TOTAL ESTIMATED DOLLAR AMOUNT that you and your travel party have spent or will spend at ALL North Carolina wineries visited on THIS trip. $ _______________.
12. What other activities did you participate in during this trip to or within NC? Check all that apply.
Visit Friends/Family
Outdoor Recreation
Fine Dining Museum/ Gallery
Beach/ Water
Shopping
Sightseeing Historic Site Festival/ Fair
Group Tour Golf Theatre/ Concert
Entertainment National/ State Park
Spa/ Health Club
Sport Event Other, please describe
13. Please tell us a little about yourself:
-
THANK YOU FOR YOUR HELP.
Your Gender: Female Male Year of Birth: 1 9 _____ _____(Not Age)
Your Home Zip Code:
_____ _____ _____ _____ _____ OR Country if not USA __________________
Your Education:
High School
Some College
Bachelor's Degree
Graduate Degree
Your House-hold Income
Less than $24,999
$25,000-49,999
$50,000-74,999
$75,000-99,999
$100,000- 124,999
$125,000- 149,999
$150,000- 174,999
$175,000+

39
APPENDIX B
Visitors by State (N=893)
State
In
Alphabetical
Order
Number of
Responses
State
In
Alphabetical
Order
Number of
Responses
AK 2 MI 12
AL 4 MO 5
AZ 3 NC 470
AR 1 NE 1
CA 9 NJ 21
CO 3 NM 1
CT 3 NW 1
DC 1 NV 1
FL 68 NY 11
GA 14 OH 20
IA 5 OR 1
IL 11 PA 25
IN 5 RI 2
KS 1 SC 72
KY 10 TN 20
IA 5 TX 9
MA 5 VA 37
MC 1 WA 12
MD 10 WI 5
ME 1 WV 5