Embed Size (px)
Citation preview

Discover Cube Land

Copyright © 2011 Citilabs, Inc. All rights reserved.
Citilabs is a registered trademark of Citilabs, Inc. All other brand names and product names used in this book are trademarks, registered trademarks or trade names of their respective holders.

iii
Contents
About this Document .................................................................................................................. 4
Allocating socio-economic totals........................................................................................... 5
� To open and examine the Cube Land model ............................................................ 5
� To run a Cube Land scenario ................................................................................... 8
Studying transportation projects ......................................................................................... 13
� To analyze the land-use effects of a roadway project ............................................. 13
� To analyze the land-use effects of a transit project ................................................. 15
4
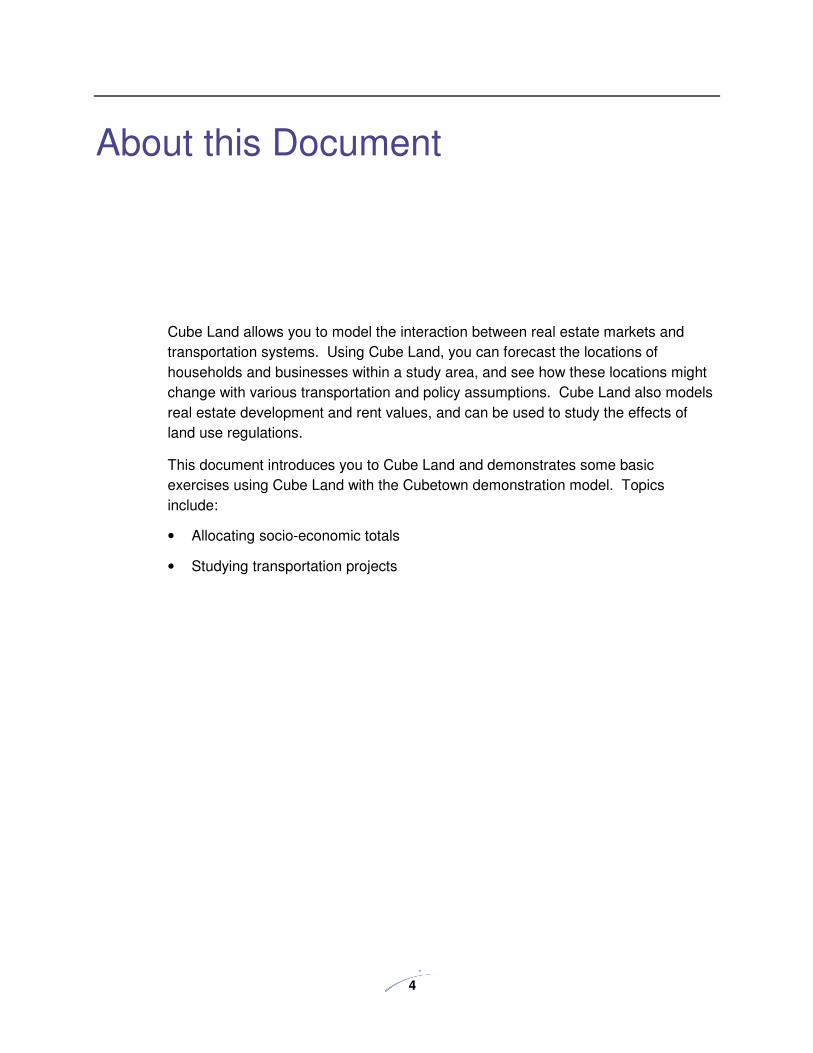
About this Document
Cube Land allows you to model the interaction between real estate markets and
transportation systems. Using Cube Land, you can forecast the locations of
households and businesses within a study area, and see how these locations might
change with various transportation and policy assumptions. Cube Land also models
real estate development and rent values, and can be used to study the effects of
land use regulations.
This document introduces you to Cube Land and demonstrates some basic
exercises using Cube Land with the Cubetown demonstration model. Topics
include:
• Allocating socio-economic totals
• Studying transportation projects
Discover Cube Land
5
Allocating socio-economic totals This exercise shows how you might use Cube Land to allocate revised socio-
economic control totals for a study area to transportation analysis zones for further
analysis.
� To open and examine the Cube Land model
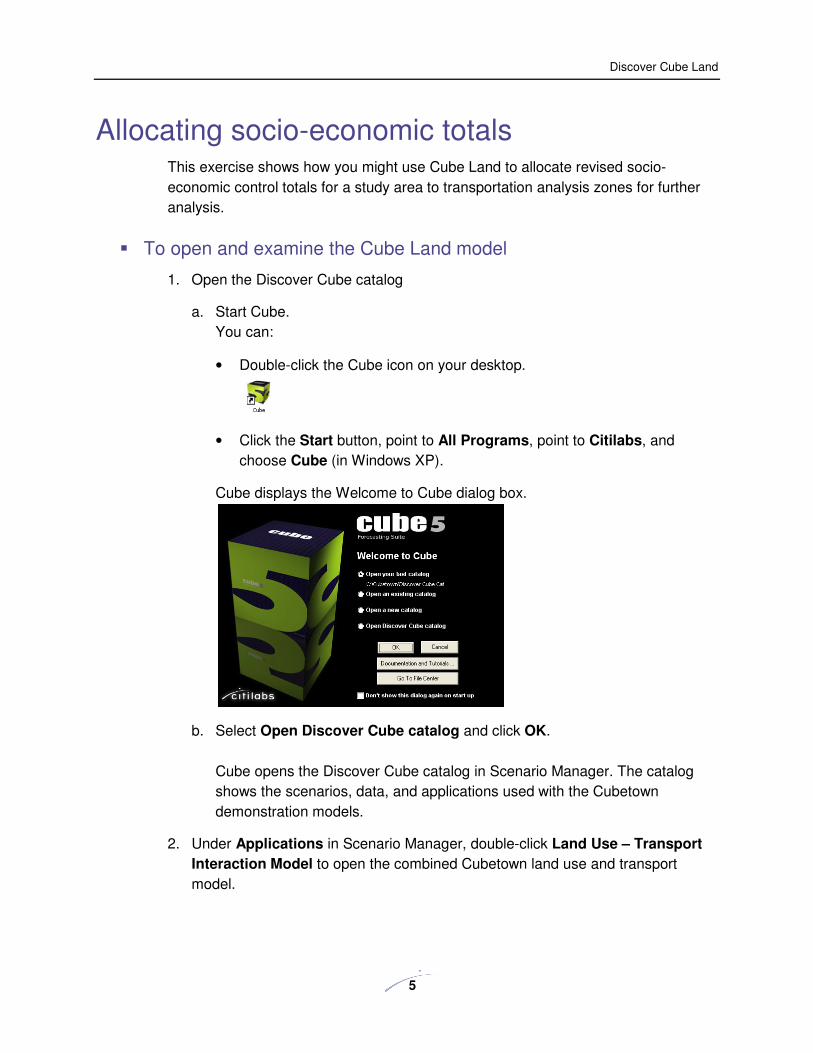
1. Open the Discover Cube catalog
a. Start Cube.
You can:
• Double-click the Cube icon on your desktop.
• Click the Start button, point to All Programs, point to Citilabs, and
choose Cube (in Windows XP).
Cube displays the Welcome to Cube dialog box.
b. Select Open Discover Cube catalog and click OK.
Cube opens the Discover Cube catalog in Scenario Manager. The catalog
shows the scenarios, data, and applications used with the Cubetown
demonstration models.
2. Under Applications in Scenario Manager, double-click Land Use – Transport
Interaction Model to open the combined Cubetown land use and transport
model.

Discover Cube Land
6
The dark blue boxes represent steps in the model, the light blue boxes show
inputs to each step, and the green boxes show the outputs. Lines represent the
links between outputs from one step and inputs to the next step.
The model has seven steps:
o Network processing – prepares input networks and initial travel cost matrices
o Feedback loop – copies and replaces trip and travel cost matrices with their
current values from the transportation model outputs
o Cube Land Demonstration Model – forecasts household and firm agent
location based upon current transportation model outputs and zonal
variables. Steps 3 through 7 are included in the feedback loop.
o Trip Generation – forecasts trip productions and attractions by zone based
upon the household and firm locations output from Cube Land
o Trip Distribution – applies a gravity model to forecast person-trips by purpose
o Mode Choice – applies a logit choice model to forecast person-trips by mode

Discover Cube Land
7
o Assignment – converts person-trips to peak hour vehicle-trips and performs
highway as well as public transit network assignment with congested costs
In effect, the Cube Land Demonstration model shown here is integrated with a
typical four-step Cube Voyager travel demand model. However, Cube Land can
be integrated with any type of model system, including activity-based models and
other software. In addition, if you have already developed all the necessary input
files, you could run Cube Land by itself, without feedback to a travel demand
model.
3. Double-click on the Cube Land Demonstration Model program group box to
open the Cubetown Cube Land model.
This model has three steps:
o Pre-Processing – use Cube Voyager to convert and format Cube Land input
data
o Land Model – run the Cube Land program
o Post-Processing – use Cube Voyager to convert and format Cube Land
outputs
The Cube Land inputs include:
o Zone-to-zone transportation network time, distance and cost matrices, or
“skims”
o Aggregate characteristics and total counts for each type of location decision-
maker, or “agent”. Examples of agent types include medium-income three-
person households and factories with 100 employees on average.

Discover Cube Land
8
o Land use zoning and regulations, such as the total area available in each
zone for designated land uses, and the typical characteristics of real estate
options by type, as well as prohibited land uses and subsidies by zone.
o Initial characteristics of zones, such as the share of developable land used by
type.
Some of the Cube Land inputs are generated by using Cube Voyager to interpret
and re-format travel demand model and GIS files in the structures expected by
Cube Land.
The Cube Land outputs include:
o The number of households and businesses of each type in each zone
o Rent associated with each type of real estate option in each zone
o Bids, the willingness of each agent to pay for each real estate option in each
zone
o Real estate supply, such as dwelling units and commercial units by type and
zone
Some of the Cube Land outputs are processed by Cube Voyager to summarize
zonal values and write attribute tables to shapefiles that can be viewed in the GIS
Window.
� To run a Cube Land scenario
1. Create the Growth scenario.
a. Under Scenarios in Scenario Manager, right-click on Base, and select Add
Child.
b. Name the new scenario Growth and enter a description in the Scenario
Properties dialog. Cube opens the Scenario Editing window for the Growth
scenario.

Discover Cube Land
9
2. Change the Growth Factor for EE Trips field to 1.5.
3. Edit the control totals.
a. Click Edit… next to the line for Agent attributes and control totals.
b. Cube recognizes that the file is shared with the parent scenario and asks if
you want to make a copy of the file for the current scenario. Click the Yes
button.
c. Name the file SE_GROWTH.dbf and store it in the C:\Cubetown\Inputs folder.
Cube opens the SE_GROWTH.dbf file.
This table contains a row for each household or firm type in the model, and

Discover Cube Land
10
columns corresponding to the attributes of the household or firm type. In
particular, the required column NAGENT contains the number of members of
each household or firm category, i.e. the total number of decision-making
“agents” to be located within the model.
d. Go to the Database menu and select Compute… to apply a simple recursive
growth rate calculation to the columns of the table. Type
“NAGENT=NAGENT*1.02^20” in the Equations field, then click Compute.
You can also modify the table cells directly in the Cube table editor window.
In real-world models, this table might be generated by regional
macroeconomic and demographic forecasting models, such as a spatial
input-output analysis package.
e. Close the table.
4. Run the model.
a. Click Save, then Run in the Scenario Editing window.
The Task Monitor window opens, showing the progress of the run. When
complete, a Task Run Result dialog box opens.
b. Click OK.
5. View the model outputs.

Discover Cube Land
11
a. Under Data in Scenario Manager, expand the folder named Outputs, and the
sub-folder named Land.
b. Double-click on Households and Jobs.
Cube opens the ZO_HHJOBS.SHP file, which is based upon the output of the
land-use model.
c. From the Cube menu, select Post, then point to Node/Point Chart…
d. Apply the Boundary Layer Node Chart settings shown below, and click OK.

Discover Cube Land
12
Cube displays a pie chart map showing the location and type of jobs in the
study area as forecast by the Cube Land model. Larger circles correspond to
zones with more employment, and the size of the slices in each circle
represents the relative share of the corresponding type of employment.
You could also create a bar chart showing the distribution of households by
size category (HH1 through HH4), or overlay other data, such as
transportation networks, and save an ArcGIS map document to share with
others. Close the map when finished.

Discover Cube Land
13
Studying transportation projects When Cube Land is integrated with a travel demand model, you can use the
integrated model to study the possible land-use effects of transportation projects.
This exercise shows how you might use Cube Land to study the effects of a roadway
project.
� To analyze the land-use effects of a roadway project
1. Create the new scenario.
a. Right-click on the Growth scenario and select Add Child.
b. Name the new scenario Roadways and enter a description in the Scenario
Properties dialog.
2. Change the Highway network input path to the Build Road network, stored at
“C:\Cubetown\Inputs\cubetown.mdb\Build”.
Note: This exercise assumes that you have already edited the Build network to
show the new roadway project. For more information, see the Exploring Cube
Base and Cube Voyager section of the Discover Cube tutorials.
3. Run the model.
a. Click Save, then Run in the Scenario Editing window.
The Task Monitor window opens, showing the progress of the run. When
complete, a Task Run Result dialog box opens.
b. Click OK.
c. Click Close to hide the Scenario Editing window.
4. View the outputs.
a. Under Data in Scenario Manager, expand Outputs, then Land. Double-click
on Compare Land Use to open the ZD_LAND.SHP file, which is a shapefile
containing differences between this scenario (Roadways) and its parent
(Growth) scenario.
b. Go to the Post menu and select Thematic Map…
c. In the Expression field, type HOUSEHOLDS. Click on the leftmost Color
rectangle and choose a red color, then click on the rightmost Color rectangle
and choose a blue color. Click Color On to apply the thematic map settings
as shown below.

Discover Cube Land
14
Cube displays a thematic map showing the effects of roadway construction
on household location. Zones that gain households are shown in blue, while
zones that lose households are shown in red. Purple zones experience no
change.
Discover Cube Land
15
� To analyze the land-use effects of a transit project
1. Create the new scenario.
a. Right-click on the Growth scenario and select Add Child.
b. Name the new scenario Transit and enter a description in the Scenario
Properties dialog.
2. Change the Public transit lines input path to the Headway PT network, stored
at “C:\Cubetown\Inputs\cubetown.mdb\Headway”.
Note: This exercise assumes that you have already edited the Headway PT
network to show increased transit service. For more information, see the
Exploring Cube Base and Cube Voyager section of the Discover Cube tutorials.
3. Run the model.
a. Click Save, then Run in the Scenario Editing window.
The Task Monitor window opens, showing the progress of the run. When
complete, a Task Run Result dialog box opens.
b. Click OK.
c. Click Close to hide the Scenario Editing window.
4. View the outputs by repeating step 4 of the previous exercise to set up a
thematic comparison map showing changes in household location.
Any type of project that can be represented in a travel model can be analyzed using
an integrated land use / transportation model. The sensitivity of household and firm
location to transportation projects in Cube Land will depend upon the form of the
accessibility and attractiveness measures used to represent the level of
transportation service in each zone by agent and mode, as well as the estimated
location bid functions coefficients for these variables.
You can also represent a wide variety of land use regulations using Cube Land,
including:
• Zoning restrictions on the amount of land available for certain uses
• Development constraints and prohibitions on land uses in selected zones
• Fixed (policy-driven) development and institutional uses
• Taxes and subsidies for specific types of land use and real estate development
For more information on these topics, please see the Cube Land Reference Guide.


Citilabs, Inc. 1211 Miccosukee Road
Tallahassee, FL USA 32308
www.citilabs.com
![CUBE-BL-JP-18 CUBE-PK-JP-18 CUBE-YL-JP-18 (JP) …...CUBE-BL-JP-18 CUBE-PK-JP-18 CUBE-YL-JP-18 (JP) 1.2 Litre Capacity [JP] Operating Guide (JP)Please read this entire guide before](https://img.pdfslide.us/doc/110x75/5f0aa9a57e708231d42cb922/cube-bl-jp-18-cube-pk-jp-18-cube-yl-jp-18-jp-cube-bl-jp-18-cube-pk-jp-18-cube-yl-jp-18.jpg)