Embed Size (px)
Citation preview

ABSTRACT
BOEHM, ETHAN ANDREW. Discourse in 1-1 Laptop Secondary Geometry Classrooms: Does Technology Play a Role? (Under the direction of Karen F. Hollebrands).
Technology is becoming increasingly prevalent in high school mathematics classrooms.
Recent curriculum reforms suggest more emphasis on students using appropriate technology
tools in the mathematics classroom and being able to communicate mathematical ideas
clearly. Three geometry teachers in 1-1 laptop classrooms using Geometer's Sketchpad are
the focus of this study. Classroom discourse is analyzed over two years using the Oregon
Mathematics Leadership Institute (OMLI) discourse analysis instrument. In this analysis two
questions are investigated: 1) What is typical classroom discourse with technology and
without technology? and 2) Is there change in classroom discourse over time with technology
and/or without technology? Particular interest is paid to types of discourse—the nature of the
mathematical depth of the discourse (e.g. Statements, Explanations, Challenges, ect.)—and
modes of discourse—what direction discourse occurs (e.g Teacher-to-Student, Student-to-
Group, ect.). The findings suggest that although the modes of discourse change significantly
when technology is used, the types of discourse remain consistent regardless of the
technological context. The modes of discourse tend to become more student-centered when
technology is present. The results can be useful for future research, software and curriculum
developers, current teaching practitioners, and pre-service teacher programs.

© Copyright 2013 by Ethan A. Boehm
All Rights Reserved

Discourse in 1-1 Laptop Secondary Geometry Classrooms: Does Technology Play a Role?
by Ethan Andrew Boehm
A thesis submitted to the Graduate Faculty of North Carolina State University
in partial fulfillment of the requirements for the degree of
Master of Science
Mathematics Education
Raleigh, North Carolina
2013
APPROVED BY:
_______________________________ ______________________________ Karen F. Hollebrands Hollylynne S. Lee Committee Chair ________________________________ Molly A. Fenn

ii
BIOGRAPHY
Ethan Andrew Boehm was born in Candler, North Carolina on November 19, 1983.
He is the son of Paul and Candice Boehm. At age eight he was placed in a foster home and
at ten moved in with Marshall Janes and Molly McMillan who became his adoptive parents.
Despite this challenging upbringing he has maintained good relationships with both his
biological and adoptive parents. Ethan graduated with honors from Charles D. Owen High
School in Black Mountain, North Carolina in June 2002. He then studied aerospace
engineering for two years at North Carolina State University before changing his major to
Mathematics Education, as he sought to be in a more people-oriented field that better
matched his natural abilities. In December 2006, Ethan graduated Cum Laude from North
Carolina State University in Raleigh, North Carolina with a Bachelor’s of Science in
Mathematics Education.
Ethan began his professional career as math teacher at Millbrook High School in
Raleigh, North Carolina in January 2007 where he taught Algebra 1, Advanced Functions
and Modeling, Computer Science, and Intro to High School Math. In August 2008, Ethan
accepted a math teaching position at Amicitia America School in Fez, Morocco. In the
course of his three years at Amicitia he was privileged to be able to teach all levels of math
from fifth grade through precalculus. During his time at Amicitia he was integrally involved
in school leadership by facilitating a school-wide transition from traditional to block
scheduling, creating and implementing an after-school discipline program, creating and
implementing a mandatory study hall program for all middle and high school students
seeking to meet the needs of a student body that was predominately English language

iii
learners, and accelerating the math curriculum to allow students to take Algebra 1 in eighth
grade and calculus in twelfth grade. After three years he moved back to the United States to
pursue graduate school.
In August 2011, Ethan began studying for a Master’s of Science in Mathematics
Education. His research interests have included technology in the classroom, dynamic
geometry environments, and mathematical discourse. During his program he accepted a two-
year graduate research assistantship with the NSF-funded Scaling Up STEM with the VCL
grant, under the supervision of Dr. Karen Hollebrands. As a research assistant Ethan has
moderated online professional development classes for algebra and geometry teachers
focused on using Geometer’s Sketchpad and Fathom software in the classroom, helped plan
and implement a weeklong professional development summer institute for teachers to learn
Fathom software, and conducted classroom observations.
When Ethan is not teaching, studying, or doing research about mathematics education
he enjoys travelling, exploring greenway trails, running half-marathons, learning about other
cultures, collecting maps, learning about urban planning, and hosting travellers. He has
accepted a two-year math teaching position at Nansha College Preparatory Academy in
Guangzhou, China beginning in the Fall of 2013.

iv
ACKNOWLEDGMENTS I would like to thank Karen Hollebrands for her unfailing support throughout this
process. She’s always been willing to read a draft, offer encouragement, and give feedback.
I’m grateful for everything I’ve learned from her, both in her role as mathematics teacher
educator and as a researcher, about reform-based pedagogy, geometric thinking, the
importance of mathematical discourse, and technology in the classroom. I would also like to
thank Hollylynne Lee for her expertise on technology in the classroom. In her Teaching
Mathematics with Advanced Technology class I learned about everything from how to
critique design principles for educational technologies, to how to create videos using
screencasts, as well as the significance of dynamic geometry. Finally, I’d like to than Molly
Fenn for being a math professor that seeks to implement reform-based pedagogy at the
university level. I have had the privilege of taking two classes from her and was impressed
the way that she encouraged student-centered learning and mathematical discourse in her
graduate level Non-Euclidean Geometry and Abstract Algebra courses.
Funding for this project was provided by the National Science Foundation (DRL-
0929543). Any opinions, findings, and conclusions or recommendations expressed herein are
those of the author and do not necessarily reflect the views of the National Science
Foundation.

v
TABLE OF CONTENTS ABSTRACT ............................................................................................................................................................ 1
BIOGRAPHY ......................................................................................................................................................... ii ACKNOWLEDGMENTS ................................................................................................................................... iv
LIST OF TABLES ............................................................................................................................................... vi
LIST OF FIGURES ............................................................................................................................................. vii CHAPTER 1: INTRODUCTION ...................................................................................................................... 1 Background .......................................................................................................................................................................... 1 Purpose of the Study ........................................................................................................................................................ 4 Significance and Limitations of the Study ............................................................................................................... 4 CHAPTER 2: LITERATURE REVIEW ......................................................................................................... 6 Discourse ............................................................................................................................................................................... 6 Technology ........................................................................................................................................................................... 9 1:1 Laptop Initiatives ....................................................................................................................................................... 9 Dynamic Geometry Environments .......................................................................................................................... 11 CHAPTER 3: METHODS ................................................................................................................................ 14 Context of Study .............................................................................................................................................................. 14 Instrument ......................................................................................................................................................................... 15 Procedures ......................................................................................................................................................................... 17 CHAPTER 4: FINDINGS ................................................................................................................................. 19 Introduction ...................................................................................................................................................................... 19
Case 1: Mr. Smith .................................................................................................................................................. 19 Case 2: Mrs. Johnson ........................................................................................................................................... 31 Case 3: Mrs. Anderson ........................................................................................................................................ 43 Cross-‐Case Comparison ..................................................................................................................................... 55
Summary of Findings .................................................................................................................................................... 57 CHAPTER 5: CONCLUSIONS, IMPLICATIONS, AND LIMITATIONS ............................................ 59 Conclusions ........................................................................................................................................................................ 59 Implications ....................................................................................................................................................................... 61 Limitations ......................................................................................................................................................................... 64 REFERENCES .................................................................................................................................................... 66
APPENDICES ..................................................................................................................................................... 71 Appendix A: OMLI Codes for Mathematical Discourse Analysis ................................................................ 72 Appendix B: OMLI Classroom Observation Discourse Analysis Form ..................................................... 73 Appendix C: Sample of Completed OMLI Discourse Analysis Form ......................................................... 74 Appendix D: Sample of Discourse Counts and Percentages ......................................................................... 75

vi
LIST OF TABLES Table 1. Mean Percentages of Mr. Smith's Discourse Types With and Without Technology ......... 22
Table 2. Mean Percentages of Mr. Smith's Discourse Modes With and Without Technology ........ 27
Table 3. Mean percentages of Mrs. Johnson’s discourse types with and without technology. ..... 34
Table 4. Mean percentages of Mrs. Johnson’s discourse modes with and without technology. ... 39
Table 5. Mean percentages of Mrs. Anderson’s discourse types with and without technology. .. 45
Table 6. Mean percentages of Mrs. Anderson’s discourse modes with and without technology. 51

vii
LIST OF FIGURES
Figure 1. Box plots of means per observation of discourse types for Mr. Smith. ................................ 24
Figure 2. Percentage of discourse type without technology by observation for Mr. Smith. .......... 25
Figure 3. Percentage of discourse type with technology by observation for Mr. Smith. ................. 25
Figure 4. Box plots of means per observation of discourse modes for Mr. Smith. ............................. 29
Figure 5. Percentage of discourse modes without technology by observation for Mr. Smith. ...... 30
Figure 6. Percentage of discourse modes without technology by observation for Mr. Smith. ...... 30
Figure 7. Box plots of means per observation of discourse types for Mrs. Johnson. ......................... 36
Figure 8. Percentage of discourse type means without technology for Mrs. Johnson. ..................... 37
Figure 9. Percentage of discourse type means with technology for Mrs. Johnson. ............................ 37
Figure 10. Box plots of means per observation of discourse modes for Mrs. Johnson. .................... 41
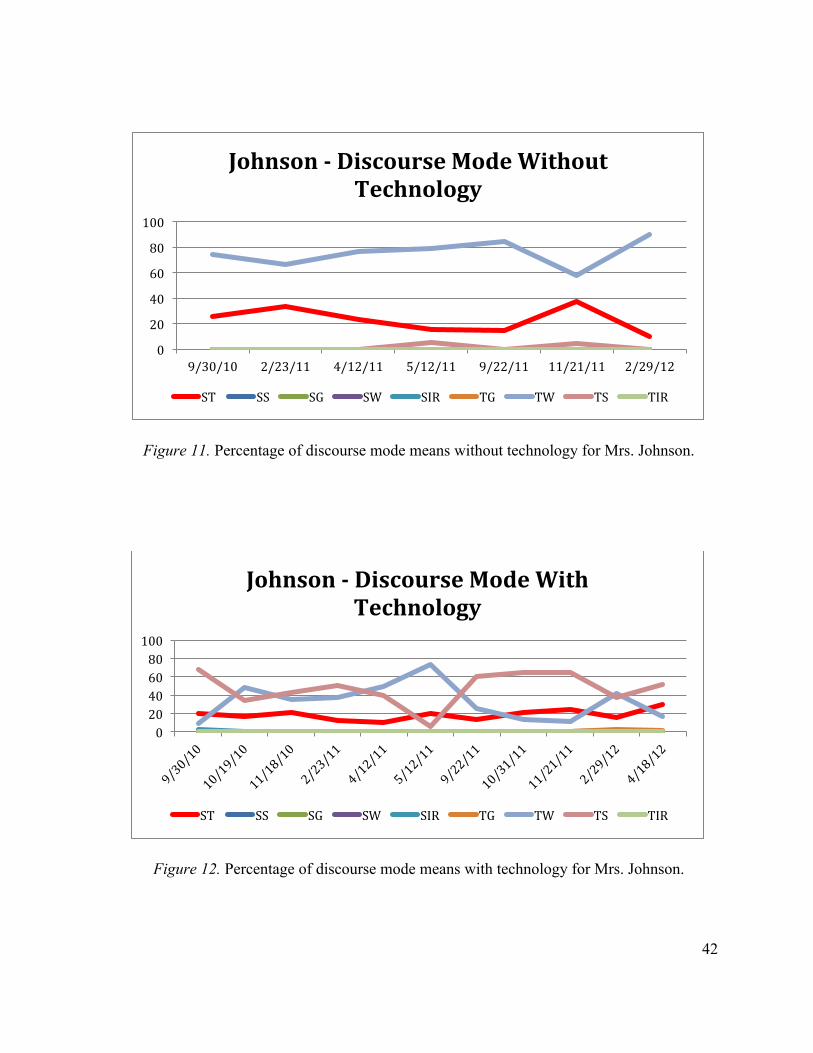
Figure 11. Percentage of discourse mode means without technology for Mrs. Johnson. ................ 42
Figure 12. Percentage of discourse mode means with technology for Mrs. Johnson. ....................... 42
Figure 13. Box plots of means per observation of discourse types for Mrs. Johnson. ...................... 48
Figure 14. Percentage of discourse type means without technology for Mrs. Anderson. ............... 49
Figure 15. Percentage of discourse type means with technology for Mrs. Anderson. ...................... 49
Figure 16. Box plots of means per observation of discourse modes for Mrs. Anderson. ................ 53
Figure 17. Percentage of discourse mode means without technology for Mrs. Anderson. ............ 54
Figure 18. Percentage of discourse mode means with technology for Mrs. Anderson. ................... 54

1
CHAPTER 1: INTRODUCTION
Background
Technology has become increasingly prevalent today both in and out of the
classroom. It has changed the way we access information as well as the way we
communicate. Today we primarily use the Internet to access information and we
communicate by email, texting, instant message, and video chat. These technologies were
virtually unknown twenty years ago. Students today often use interactive whiteboards, tablet
computers, or laptops to work on mathematically challenging tasks, submit assignments, take
assessments, or collaborate with their peers both in class and remotely. As the first
generation of students to come of age in the Information Age our students have grown up
inundated with the latest technology. Technology has offered more ways for students to both
collaborate and innovate. Yet in many classrooms pedagogical practices have yet to catch
up. To prepare students to be innovators of the twenty-first century we must start by teaching
them to be innovators in the classroom. Driving this point home Kay and Greenhill (2011)
write
Learning and innovation skills increasingly are being recognized as those
that separate students who are prepared for a more and more complex life
and work environments in the 21st century, and those who are not. A
focus on creativity, critical thinking, communication, and collaboration is
essential to prepare students for the future. (p. 49)
In 2009, President Obama announced a new “Educate to Innovate” initiative that
seeks to support STEM (Science, Technology, Engineering, and Mathematics) education as a

2
“national priority” so that American students can regain their global competitiveness by
“reaffirming and strengthening America’s role as the world’s engine of scientific discovery
and technological innovation [as] essential to meeting the challenges of this century” (The
White House, 2009).
How do you teach innovation? By giving students opportunities to communicate,
collaborate, and build their own understanding of ideas in the classroom (Kay and Greenhill,
2011). This philosophy is engendered by reform-oriented, constructivist ideas.
Constructivism as an educational philosophy espouses the belief that students learn best
when they are making sense of ideas in a learning community that is active, reflective, rich
with cognitive conflict, and social interactions (Wilson, 2012; Jones, Jones, & Vermette,
2010). This learning environment is contrasted with the traditional, lecture-based
pedagogical approach. In the classroom that is informed by a constructivist view of
knowing, students are doing more than just copying notes from the whiteboard and working
through examples. They are actively working together on challenging tasks in an
environment where communication with their peers is both encouraged and necessary, as
they struggle through tasks together. Also, students are constantly reflecting, both
individually and collectively, on what strategies worked and what they would do differently
the next time they solve a similar task. Perhaps this kind of constructivist environment will
help our students become the next innovators of the twenty-first century.
We are not seeing more evidence of reform-based pedagogy in our schools because
teachers beliefs about how math should be taught do not allow them to establish appropriate
“sociomathematical norms” to foster student learning in a constructivist way (Yackel &

3
Cobb, 1996). Not only are teachers faced with new curricula changes and new technology in
the classroom, but often they are given very little training on how to change their teaching
practices to most effectively leverage new technological tools. Thus, in order for teachers to
be preparing students for twenty-first century innovation and learning, they need to be
supported with adequate professional development that helps them establish
sociomathematical norms so that they can adapt to new technologies and improve their
pedagogical practices (Bennison & Goos, 2010).
Classroom teaching informed by a constructivist view is “social” if it is one that
pedagogically supports sociomathematical norms that encourage discourse (Yackel and
Cobb, 1996; Wilson, 2012). If students are surrounded with technologies outside of school
that support social communication among their peers, why are these not utilized in the
classroom too? One pedagogical practice that is necessary is for teachers to transition from
their role as the hub of learning to the facilitator of learning (NCTM, 1991). In researching
how to support discourse in mathematics classrooms Smith and Stein (2011) arrived at five
practices to help support teachers making the transition from being the hub of knowledge to a
facilitator of learning. They describe the five practices as anticipating student responses to a
task, monitoring student thinking as they work on a task, selecting particular students’ work
to highlight and discuss, sequencing these selections during the discussion to best emphasize
the mathematics or innovative approaches, and connecting the students work to other
mathematics, real-world contexts, and other students’ strategies. Thus, teachers can use these
five practices to encourage discourse in their classrooms to make them environments for both
learning and innovating.

4
Purpose of the Study
The influx of technology in the classroom as well as the need for more discourse in
the mathematics classroom provided the motivation for this study. The research questions
this study seeks to answer are:
1) What is typical mathematical discourse in three geometry teachers’ classes?
2) What changes in types and modes of discourse occur during a two-year professional
development experience when a teacher is using technology versus when they are not?
In answering these questions a longitudinal case study that employs quantitative
methods for analyzing qualitative data is used. Three geometry teachers from different 1-1
laptop school districts were provided with professional development on using Geometer’s
Sketchpad software and how to encourage discourse in their classrooms using the framework
presented by Smith and Stein (2011) in 5 Practices for Orchestrating Productive
Mathematics Discussions. Data was coded from video observations collected from the
participating teachers over a two-year period. Data was then analyzed both within each case
and across cases to answer the research questions.
Significance and Limitations of the Study
This study is significant because it has many unique characteristics. Four significant
factors will be named here. First, is the context of rural, 1-1 laptop schools. Although many
states and districts are trying to implement 1-1 laptop programs, 1-1 laptop schools are still
very much the minority due to the cost. Also, best practices for using the technology and
professional development to train teachers these best practices are still being worked out in

5
most states and districts. Second, is the nature of providing teacher with professional
development to support using Geometer’s Sketchpad in their 1-1 classrooms. Teachers were
trained how to create tasks of high-cognitive demand and share them with other teachers in
their cohort from a larger study. Third, professional development was offered to support
discourse using the framework of the 5 Practices (Smith and Stein, 2011). Finally, is the
unique nature of studying the intersection of discourse and technology in these 1-1 laptop
classrooms both when the technology is used, as well as when it is not used.
One limitation of this study was the limits to the number of times that we could
observe the teacher teaching a lesson with technology. In addition, there were difficulties in
capturing all of what was spoken during the class. A choice was made to place a microphone
on the teacher and have the camera focus on the teacher. Almost all recordable discourse
involved the teacher or came through the teacher’s microphone. Thus, this is a study of
teacher-related discourse and not a study of all classroom discourse.

6
CHAPTER 2: LITERATURE REVIEW The goal of this chapter is to provide a review of literature related to mathematical
discourse and the role of technology in the classroom. First, the focus will be to review the
research related to mathematical discourse. This will include a discussion of how
mathematical discourse has been defined and research findings related to the discourse in
mathematics classrooms. Then, the focus will shift to literature about technology in the
classroom. Specific attention will be paid to 1-1 laptop computing environments, the use of
dynamic geometry environments (DGEs), and the need for professional development to help
teachers become both expert users of technology tools and to leverage the tools
pedagogically to support student learning.
Discourse
Since the 1991 publication of the National Council of Teachers of Mathematics’
Professional Standards for Teaching Mathematics (NCTM, 1991) mathematical discourse
has become an important element of teaching mathematics and research regarding the
teaching of mathematics. These standards focus on the need for more mathematical
discourse in the classroom so that students have opportunities to share and justify their
thinking in the mathematics classroom. In order to “enhance discourse” it mentions the need
for technology, especially computers and calculators. They cite the need for teachers to
orchestrate discourse by “pos[ing] questions,” “listen[ing] carefully to student ideas,” and
“ask[ing] students to clarify and justify their ideas.” Furthermore, in 2000, NCTM followed
up with the Principles and Standards for School Mathematics. In this publication both the

7
Teaching Principle and Learning Principle cite discourse as a crucial part of mathematics
teaching and learning. In 2011 the Common Core State Standards Initiative released the
Common Core State Standards for Mathematics (CCSSI, 2011). In this publication seven
Process Standards address ways in which students should think and reason about
mathematics. The third Process Standard states that students should be able to “Construct
viable arguments and critique the reasoning of others.” Thus, emphasizing the importance of
discourse in the classroom, it stresses the need for students make sense of and share their
mathematical thinking in their classroom community and to give feedback to their peers.
What is meant by the term mathematical discourse? Many perspectives have been
offered to answer this question. Building on prior knowledge by interacting with others is
central to Nathan and Kunth’s (2003, p. 204) definition of the meaning of discourse.
Moschkovich (2007, p. 25) describes discourse as both “cognitive and social.” Whereas,
Sfard sees discourse as “tantamount to thinking itself.” Cayton (2012, p. 23) defined
discourse as “verbal interactions that focus on mathematics and serve to clarify, challenge,
expand, investigate, or justify content, solution strategies, or contributions from self or
others.” Synthesizing these perspectives I propose the following definition for this study:
mathematical discourse is any communication in a mathematical context that seeks to serve a
didactic purpose. By didactic purpose I mean discourse contributing to the learning of school
mathematics.
With the goal of studying discourse in K-12 mathematics classrooms the National
Science Foundation funded the five-year Oregon Mathematics Leadership Institute (OMLI)
project. This project consisted of summer professional development institutes and follow-up

8
activities during the school year (Weaver and Dick, 2009). Project personnel created a
classroom observation protocol that sought to investigate student discourse in mathematics
classrooms. The protocol focused on three levels of classroom discourse: Types, Modes, and
Tools. The Types of discourse were from those that required little cognitive demand to those
that required one to respond with more rigorous complex thinking: 1) answering 2) making a
statement or sharing, 3) explaining, 4) questioning, 5) challenging, 6) relating, 7) predicting
or conjecturing, 8) justifying, and 9) generalizing. The modes of discourse referred to the
direction of discourse: student-to-teacher, student-to-group, student-to-student, or students
individual reflection. Tools of mathematical discourse were 1) verbal, 2) gesturing/acting, 3)
written, 4) graphs, charts, sketches, 5) manipulatives, 6) symbolization, 7) notation, 8)
computers, calculators, and 9) other. Initially they did not find evidence that students
involved in the project achieved higher test scores on a statewide mathematics exam. They
cited the need to work out consistency in the implementation of the project goals at different
schools. Later they did find that schools participating in the OMLI program could be
predicted to have high student achievement than schools than those that did not. This
classroom observation protocol instrument is one used for this study.
Cayton (2012) studied discourse in algebra 1 classes using the same OMLI
instrument focusing particularly on question types when algebra 1 teachers were using pre-
constructed dynamic geometry sketches. She found that that the most common mode of
discourse was teacher to whole class and that the most common types of discourse where
statements and questions. She sought to study the influence of Boaler and Brodie’s (2012)

9
question types to discourse types and modes. Cayton found that these question types
supported multidimensional discourse in which “the goal is to utilize student ideas and
questions to drive the mathematical discourse” (2012, p. 26). She found that most often
teachers used the question types of exploring, probing, and generating discussion. She used
also used Drijvers, Doorman, Reed, & Gravemeijer’s (2010) teacher technology
orchestration types to describe how teachers used pre-constructed dynamic geometry
sketches. She found that when teachers discussed the screen both the quality and quantity of
discourse increased. However, when teachers explained the screen the converse was true, as
the quality and quantity of discourse decreased. These findings are especially pertinent as
they use the same instrument and support the findings of this study.
Technology
In 2000, NCTM’s Principles and Standards for School Mathematics technology was
elevated as one of six core principles for the teaching and learning of school mathematics.
Since then much research has been conducted regarding technology in the classroom. For
this literature review the focus will be on research directly related to 1:1 laptop environments
and dynamic geometry environments (DGEs).
1:1 Laptop Initiatives
The use of 1:1 laptops in schools has shown to have a positive impact on student
engagement and student motivation, as well as collaboration and communication in the
classroom (Argueta, et al, 2001; Corn, 2009). Argueuta et al in a study that assessed 1:1
laptop initiatives in six states found that high implementation of laptops in the classroom had

10
a very positive impact, yet low implementation created a distraction and disconnect between
learning objectives and the use of technology. Also, the 1-1 initiatives allowed for more
student innovation (p.8). Student achievement results were mixed. Although they found
positive achievement results in initiatives in Michigan, Maine and Florida, they found
inconclusive results in Virginia. Specifically they noted that 1-1 laptop initiatives increased
engagement among special needs and at-risk students (p. 4). Corn (2009) found that the 1-1
laptop environment helped teachers shift toward a more reform-based classroom
environment, as they became less the hub of information and more the facilitator of
discussions. Also, it was found that 1:1 initiatives allowed students to develop twenty-first
century skills such as “creating websites, working with databases and spreadsheets, using
digital images and video, social networking, blogging, and podcasting” (Corn, 2009, as cited
in Arguella 2011). Additionally, pedagogical changes were found across 1-1 laptop
initiatives. Specifically Arguella et al (2011) found that it helped create a more student-
centered environment, encouraged teachers to cluster student desks, and allowed teachers
more ability to differentiate classroom instruction (p. 9). In Maine, they found that teachers
and students reported a reversal of roles, students becoming the teachers and the teachers the
students, as often students knew more about using the technology than their teachers (p. 9).
Corn (2009) recommends that professional development and school leadership must
be a vital component of any successful 1-1 initiative. She cites the need for teachers to share
successful 1-1 lessons, model technology use, and have appropriate expectations for their
students. Also, foundational is support from both the school administration and the schools

11
technology staff. Arguella concludes that
Thorough planning, initial and ongoing targeted professional development, buy-in
from all stakeholders, and a robust infrastructure are also crucial for the success of the
initiative. Assessment of the initiative and its impact on student learning needs to take
place and the results should be used to make decisions aimed to improve student
learning (p. 11).
Without appropriate software technology 1-1 laptop environments are limited in
scope (Assude, T., Buteau, C., & Forgasz, H., 2010). With appropriate software, technology
can be used as more than a research, word processing, presentation, collaboration, or
communication tool. One type of software that is a powerful tool in the mathematics
classroom is Dynamic Geometry Environments. These environments will be the focus of the
next section.
Dynamic Geometry Environments
A Dynamic Geometry Environment (DGE) “is a computer microworld with
Euclidean geometry as the embedded infrastructure” (Lopez-Real and Leung, 2006, p665).
DGEs have come of age in the last twenty years and are beginning to change the way that
some think about geometry. Programs like The Geometer’s Sketchpad (Jackiw, 1991) and
Cabri-géométre (Baulac, Bellemain & Laborde, 1990, as cited in Hölzl, 1996) are both
examples of commonly used DGEs. Bacagglini-Frank (2010) wrote:

12
The innovative aspect of dynamic geometry software with respect to the traditional
paper-and-pencil is that the figures are “dynamic.” That is, points can be dragged
along the screen, so that during the process the properties according to which the
construction was made are maintained (p. 31).
DGEs can be helpful instructional tools in the classroom. The didactical
environment a teacher creates when using DGEs (specifically a culture of conjecturing), as
well as the tasks the teacher poses to students are “both important aspects of developing a
facility with deductive reasoning” (Jones, 2000, p. 81). Much research has focused on
dragging in relation to deductive reasoning and proving (Höltz, 1996; Marrades and
Gutiérrez, 2000; Jones, 2000; Azzarello et al, 2002; Hollebrands, 2007; Baccaglini-Frank,
2009). These studies were conducted with the assumption that learning should begin by
exploring. Through exploring students create empirical evidence (often by dragging and/or
measuring) on which to make conjectures. In order for students to move from reactive to
proactive dragging strategies students need to reflect on the mathematical connections they
make and write about why such connections can be made (Hollebrands, 2007, p. 190).
Baccaglini-Frank (2009) developed a framework for teachers use to help students begin
making conjectures using DGEs. Making conjectures is an important form of classroom
discourse in any geometry classroom.
Encouraging productive classroom discourse is a challenge for most teachers (Yackel
and Cobb, 1996; Nathan and Kunth, 2008). However, the use of DGEs facilitates new forms
of discourse (Sinclair and Yurita, 2008). Sinclair and Yurita found that both students and

13
their teacher were forced to come to terms with what it meant for figures to be dynamic
rather than static. Thus, they began discussing figures “as if they were a multitude of objects,
changing over time, rather than as a single object” (p. 24). This dynamic nature of DGEs
could be an avenue for teachers to change their classroom discourse.

14
CHAPTER 3: METHODS
In this chapter I describe the methodology of this research study. Sections are
organized focused on the context of the study and participants selected, the instrument used
to evaluate discourse in their classrooms, and the procedures used to analyze this discourse
data. This study is a longitudinal case study that employs quantitative methods for analyzing
qualitative data.
Context of Study
Three teachers were selected to participate in this study. They were chosen from a
larger group of high school geometry teachers in 1-1 laptop classrooms who were
participating in the geometry cohort of the NSF funded ITEST (Innovated Technology
Experiences for Students and Teachers) grant Scaling Up STEM with the VCL. Four 1-1
laptop school districts in the southeastern United States were involved in this larger project.
The goals of this project were to provide professional development through two weeklong
summer institutes, two yearlong online professional development classes, and classroom
level support for teachers to learn how to best utilize Geometer’s Sketchpad (GSP) in their
geometry classrooms. Additional interventions that were provided in this larger project were
role models from STEM careers, cloud computing (VCL), and professional development
focused on 5 Practices for Productive Mathematical Discussions (Smith and Stein, 2011).
The goal was to increase student interest in STEM related careers.
The three participants were selected from different districts and were chosen because
the most observational data existed for them compared to the rest of the cohort. For two of

15
the three teachers we had at least two observations per semester for four semesters, and for
the remaining teacher we had at least two observations per semester for three semesters.
Thus, we had between eight and twelve observations per teacher over a two-year time period
for the three selected teachers.
Instrument
The instrument this study utilizes is a modified version of OMLI (Oregon
Mathematics Leadership Institute) Classroom Observation Protocol created by RMC
Research Corporation (Weaver and Dick, 2006). This instrument provides codes for
mathematical discourse based on types of discourse, modes of discourse, and tools used for
discourse in classroom observations. Although technology is listed as one of many tools in
the OMLI, in the analysis of the current study a separate category was created specifically for
technology. In the analysis and coding for this study, codes for technology refer to laptop
use in the classroom using Geometer’s Sketchpad (GSP) by the teacher or students. Another
major change from the original OMLI instrument (which only attempted to code student-
initiated discourse) is that the focus is on teacher-related discourse. Teacher-related
discourse refers to the fact that much of the recordable discourse came through the teacher’s
microphone as it was the main microphone and almost all coded discourse came from this
source. One reason for this is that the larger research context was to provide professional
development to teachers. It should be noted that although the tools for mathematical
discourse were coded, technology was the only tool that was considered for analysis.

16
In this study mathematical discourse refers to any communication during the
geometry classes where the students or the teacher are communicating about a mathematical
idea. For example, the question “How did you get that?” or the statement “ I found that
they’re parallel” would be considered mathematical discourse. Also, if a teacher was
explaining how to use the technology to explore a mathematical idea this discourse was
coded. However, discourse unrelated to mathematics such as the statement “What a
basketball game this weekend!” or the administrative question “Can everyone get out their
homework?” was not coded. For example, discourse related to administrative tasks such as
attendance, make-up work, saving documents, or future assignments or assessments were not
coded. Only mathematical discourse was coded for analysis.
Types of mathematical discourse refer to the nature of mathematical depth of
discourse that takes place some of which are lower cognitive level and some higher cognitive
level. There are nine types of mathematical discourse. These nine types of discourse are
Answering (A), Making a Statement or Sharing (S), Explaining (E), Questioning (Q),
Challenging (C), Relating (R), Predicting or Conjecturing (P), Justifying (J), and
Generalizing (G).
Modes of mathematical discourse refer to the direction of communication. There are
nine coded modes of mathematical discourse based on who initiated the discourse (student or
teacher) and to whom the communication was directed (student, teacher, whole class, small
group, or individual reflection). These nine modes were Student-to-Teacher (ST), Student-
to-Student (SS), Student-to-Group (SG), Student-to-Whole Class (SW), Student’s Individual

17
Reflection (SIR), Teacher-to-Group (TG), Teacher-to-Whole Class (TW), Teacher-to-
Student (TS), and TIR (Teacher’s Individual Reflection).
Procedures
For this study the three participant teachers were observed two to three times a
semester for three to four semesters. This included one video camera, usually in the back of
the classroom, and a microphone on the teacher. The focus was on teacher discourse and
interactions that the teacher had with individual students or small groups. With only one
camera in the classroom, and two microphones (one on the camera and one on the teacher), it
was beyond the capability of this research project to record all mathematical discourse in the
classroom. Thus, there were inevitably many student-initiated forms of discourse that went
unrecorded.
This video data was first coded collaboratively using the modified OMLI Discourse
Analysis Protocol (see Appendices A and B) with the author and two colleagues until an 80%
inter-rater reliability was achieved. Then the author coded the remaining observations.
Special attention was made to code whether discourse occurred with laptops and GSP (with
technology) or without laptops and GSP (without technology), as this was the main
distinguishing factor by which the data were separated and analyzed. Percentages per
observation of each type and mode of discourse were calculated both with and without
technology for each participating teacher. The goal was to characterize what is typical
classroom discourse for these three geometry teachers both with and without technology.
Then, these discourse percentages were then plotted as color-coded lines on a line graph over

18
time to see if there was any pattern for a particular type or mode of discourse over the period
of the study (either with or without technology), or whether there was any pattern among
different modes or types. Although the data are discrete the choice was made to connect the
individual data points to show the trend over time. Also, calculated were standard deviations
and means of these discourse percentages based on the codes and whether or not technology
was involved in the discourse. The goal here was to see if there was a statistically significant
difference when technology was used versus when it was not used. Tests for statistical
significance (t-tests) were conducted for Mrs. Johnson and Mrs. Anderson for each type and
mode to test whether they changed when technology was present. The t-test for modes in
Mr. Smith’s classes was not conducted because the normality assumption was violated.
Finally, box plots were created to visually show the differences in spread between each
teacher’s coded discourse means per observation with and without technology. These box
plots should be interpreted with caution as they contain a limited set of data points.

19
CHAPTER 4: FINDINGS
Introduction
The purpose of this chapter is to report the findings of this study. Of particular
interest is: 1) What is typical mathematical discourse in three geometry teachers’ classes?
and 2) What changes in modes and types of discourse occur during a two-year professional
development experience when a teacher is using technology versus when they are not? In
each section the results for each teacher will be reported. In the final section, a cross-case
analysis will be reported. Data collected on days for which there were less than thirty
instances of discourse identified were omitted from the analysis due to insufficient sample
size.
Case 1: Mr. Smith
Mr. Smith was a teacher with two years experience teaching before his involvement
with the larger research project. He teaches at a rural high school in the southeastern region
of the United States that has four 90-minute block classes per day. His school had a student
population of 955 students that are 23% African American, 66% Caucasian, 9% Hispanic,
and less than 2% Asian, Native American, or other ethnicities at the time of the study. He
prefers for his students to work in small groups of three to four and solve mathematical tasks
collaboratively. Based on an online professional development course that this author
moderated, Mr. Smith tends to design mathematical tasks himself to foster student thinking
and is an expert user of Geometer’s Sketchpad, often creating his own dynamic sketches that
use advanced features of the tool. In the observations, Mr. Smith often uses the phrase “So

20
what I want you to think about is…” as he lets group members discuss and think on their own
while he facilitates discussion with other groups. He makes sure to check back with each
group to ensure that they are making sufficient progress. Technology plays a role in his use
of student group work. He almost always groups students to work collaboratively on tasks
where technology is used. Often he has students pull two to four desks together to work on a
task. However, when technology is not used, it is more common for the Mr. Smith to review
homework where he works the problems on the board, lectures from the front of the class, or
assigns individual work to students, who are seated in rows. Technology played a significant
role in Mr. Smith’s decisions to group students as well as the modes of discourse that were
documented.
Types
Mr. Smith’s discourse types, as identified by the researcher, in order of most
prevalent were: Statements (S), Questions (Q), Answers (A), Explanations (E), and
Challenges (C). These types of discourse, with the exception of Challenges (C), were
evident in all of Mr. Smith’s observations. Relating (R), Predicting and Conjecturing (P),
and Generalizing (G) are rarely observed. There is no change in frequency of these types
when technology is used versus when it is not used. However, there are more Statements and
Questions, but fewer Answers (from both Mr. Smith and his students) when technology is
present. A possible explanation for this decline in the number of answers could be Mr.
Smith’s tendency to elicit student thinking by using the phrase “So what I want you to think
about is…” He uses this very effectively and often comes back to the group when students
are ready to explain their reasoning.

21
Table 1 shows the mean percentages of discourse types both with and without
technology. It does not show any statistically significant differences between the mean
percentages of each discourse type when students are using technology versus when they are
not when using a two-tailed t-test to compare the means at a α=0.05 significant level.
However, it does show that the variation of each type of discourse increases when technology
is used. A notable difference is in the increase of Statements (S) when technology is used.
However, at the α=0.05 significance level α=0.181 is not considered statistically significant.
There were similar percentages of explanations when students are using technology versus
when they are not (p=0.405).
Figure 1 shows the means of the types of discourse with and without technology per
observation in a box plot graph. Although the standard deviation of Statements increased
from 5.86 without technology to 7.22 with technology (from Table 1) this is likely caused by
values in the first and fourth quartiles (values furthest from median). The median value of
the discourse type increased with technology. Thus, we see that Statements become more
frequent with technology but variation only changes slightly. A possible explanation for the
increase in Statements could be that the teacher feels the need to give more directions on how
to complete a mathematical task in the technological environment.
Both the median and the mean of Questions across observations decreased slightly.
However, the interquartile range (IQR) increases from 4.9 to 7.3, and this is observable with
the much wider box for technology in the box plot in Figure 1. A likely explanation for this
increase in spread is that some tasks with technology lend themselves to questioning more
than others. However, without technology the teacher uses a very similar format with most

22
lessons. Although there are fewer Answers than Questions they both changed in the same
way: the mean and the medians decreased slightly as the variation increased. This pattern
should not be a surprise as all Answers are responses to Questions.
Table 1. Mean Percentages of Mr. Smith's Discourse Types With and Without Technology
Discourse Type
Mean % Without
Technology (x̅NT)
Standard Deviation Without
Technology (sNT)
Mean % With
Technology (x̅T)
Standard Deviation Without
Technology (sT)
H0: x̅NT= x̅T Ha: x̅NT≠ x̅T P-
value
Statistically Significant?
(α<0.05)
Statements 37.1 5.86 42.1 7.22 0.181 No
Questions 28.6 3.16 26.4 7.13 0.467 No
Answers 21.1 4.04 20.0 6.54 0.698 No
Explanations 10.1 2.91 8.8 2.97 0.405 No
Challenges 1.8 1.40 1.9 1.84 0.868 No
Justifications 0.4 0.59 0.7 1.32 0.635 No
Relating 0.4 0.69 0.0 0.11 0.231
No
Generalizing 0.4 1.11 0.1 0.30 0.502 No
Predictions or Conjectures
0.0 0.00 0.0 0.00 N/A N/A
There were also similar percentages of Challenges (C) with and without technology.
In all cases (both with and without technology) less than 6% of all discourse are challenges.
23
Comparing the means between challenges with and without technology there is not a
statistically significant difference (p=0.868).
Justifications (J) and Generalizations (G) are sporadic and rare, hence they are not
represented in the box plots of Figure 1. Justifications occur in three segments of
observations with technology but also in an equal number of segments of observations
without technology. In both cases they are less than 2% of the recorded classroom discourse.
There is not a statistically significant difference in the mean percentage of justifications with
technology versus without technology (p=0.635). In only one observation Generalizations
(G) are recorded, in both segments of this observation: with and without technology.
Finally, there are no recorded Predictions or Conjectures (P) with or without
technology. A very likely explanation is that only the teacher wore a microphone and that
any predictions and conjectures by students went unrecorded or they are written down and
thus, non-verbal.
Although, there is no statistically significant difference in the types of discourse Mr.
Smith used with or without technology, we do see a change in variance for Statements,
Questions, and Answers.
Overall, the types of discourse do not vary when technology is or is not used. Thus, it
shows that the types of discourse observed in Mr. Smith’s class is consistent across contexts.
Mr. Smith appeared to use important pedagogical strategies, such as using the phrase “What I
want you to think about is…” both with and without technology.

24
Figure 1. Box plots of means per observation of discourse types for Mr. Smith.

25
Figure 2. Percentage of discourse type without technology by observation for Mr. Smith.
Figure 3. Percentage of discourse type with technology by observation for Mr. Smith.
0
20
40
60
80
100
10/7/10 11/5/10 12/9/10 3/7/11 5/18/11 10/10/11 12/12/11
Smith -‐ Discourse Type Without Technology
A S E Q C R P J G
0
20
40
60
80
100
10/7/10 11/5/10 12/9/10 3/7/11 3/31/11 10/10/11 12/12/11
Smith -‐ Discourse Type With Technology
A S E Q C R P J G

26
Modes
When Mr. Smith uses technology more modes of discourse are noted than without
technology (compare Charts 5 and 6). For example, without technology the modes of
discourse tend to center around Teacher-to-Whole Class (TW), Teacher-to-Student (TS),
Student-to-Teacher (ST). No other mode of discourse has a mean of more than 5% without
technology. However, with technology, Teacher-to-Group (TG) jumped to 9.8% and
instances of other modes occur (SS, SG, SW, TIR). In three of seven observations there are
recorded codes other than TW, TS, and ST. However, codes other than TW, TS, and ST only
occur in one observation without technology. This is important due to the existence of these
modes with technology (see Table 2). It is not possible to measure Mr. Smith’s modes of
discourse using a t-test because the normality assumption is violated. This means that the
data collected to measure the means of each mode of discourse generally were not normally
distributed with or without technology.
Although the means in Table 2 do not indicate a major change in the modes of
discourse, in six of seven observations when technology is and wi not used there is a
noticeable difference between the segment with technology and the segment without (see
Figures 5 and 6).
Also, there is much more variation in the modes of classroom discourse in Mr.
Smith’s classroom (compare Figures 5 and 6). The most variation of a single mode across
observations occurs with Teacher-to-Whole Class (TW) discourse. This can be explained by
the varying nature of Mr. Smith’s geometry lessons. Sometimes he walks students though
how to do a task in Geometer’s Sketchpad (technology demo) while in other instances he lets

27
students work through the tasks in their groups. When students work in groups sometimes he
stops to explain a concept that students are struggling with, while in other observations he
rarely stops to speak to the class as a whole.
Table 2. Mean Percentages of Mr. Smith's Discourse Modes With and Without Technology
Discourse Type
Mean % Without
Technology (x̅NT)
Standard Deviation Without
Technology (sNT)
Mean % With
Technology (x̅T)
Standard Deviation Without
Technology (sT)
H0: x̅NT= x̅T Ha: x̅NT≠ x̅T P-
value
Statistically Significant?
(α<0.05)
Teacher to Whole Class 37.7 11.79 38.6 13.58 N/A N/A
Teacher to Student 29.6 12.42 21.0 9.63 N/A N/A
Student to Teacher 29.3 5.39 27.5 5.13 N/A N/A
Teacher to Group 2.7 4.03 9.8 17.10 N/A N/A
Student to Student 0.5 0.58 2.6 5.31 N/A N/A
Student to Whole Class 0.2 0.46 0.3 0.78 N/A N/A
Student to Group 0.0 0.08 0.1 0.20 N/A N/A
Teacher Individual Reflection
0.0 0.00 0.1 0.15 N/A N/A
Student Individual Reflection
0.0 0.00 0.0 0.00 N/A N/A

28
Student-to-Teacher (ST) discourse with technology declines in five of six cases
where both technology is and is not used. This could be explained by Mr. Smith’s teaching
style or the limitation of only the Mr. Smith wearing a microphone. The most noticeable
difference is the decline of Teacher-to-Student (TS) discourse from 29.6% to 21.0%. A
possible explanation could be Mr. Smith’s tendency to probe students thinking while not
looking for an immediate answer and the increase in Teacher-to-Group (TG) discourse.
When he is not using technology he often calls on students to answer specific questions.
However, when he uses technology he more often circulates around the class and speaks to
groups as well as to individual students.
Recorded examples of Student-to-Whole-class (SW), Student-to-Group (SG),
Teacher-Individual-Reflection (TIR), and Student-Individual Reflection (SIR) are either non-
existent or rare. Student-initiated discourse is very hard to document due to the nature of
only having the teacher wearing a microphone.
It is noteworthy to mention that Mr. Smith’s last three observations showed much
more varied modes of discourse (see Figures 5 and 6). Also, over time there is a noticeable
decrease in his use of Teacher-to-Whole Class (TW) discourse when technology is used. This
could very well be attributed to on-going professional development both during Year One
and during the summer between year one and year two. This professional development
encouraged more student-centered activities with technology. This decrease in Teacher-to-
Whole-Class discourse also could be attributed to students’ increased familiarity with the
technology as the semester progressed.

29
Figure 4. Box plots of means per observation of discourse modes for Mr. Smith.

30
Figure 5. Percentage of discourse modes without technology by observation for Mr. Smith.
Figure 6. Percentage of discourse modes without technology by observation for Mr. Smith.
0
20
40
60
80
100
10/7/10 11/5/10 12/9/10 3/7/11 5/18/11 10/10/11 12/12/11
Smith -‐ Discourse Mode Without Technology
ST SS SG SW SIR TG TW TS TIR
0
20
40
60
80
100
10/7/10 11/5/10 12/9/10 3/7/11 3/31/11 10/10/11 12/12/11
Smith -‐ Discourse Mode With Technology
ST SS SG SW SIR TG TW TS TIR

31
Case 2: Mrs. Johnson
Mrs. Johnson was a teacher with thirteen years experience before becoming involved
with our team’s research. She also teaches at rural high school in the southeastern region of
the United States, but one that is in a distinct district from Mr. Smith’s school. Her school
has ninety-minute block classes that meet for one semester. Her school had a student
population of 824 students that are 50% African American, 37% Caucasian, and 13%
Hispanic at the time of this research. Mrs. Johnson teaches in traditional, lecture-based
manner and her students sit in rows facing the front of the classroom. Before her
involvement in our project she had no experience using Geometer’s Sketchpad (GSP)
software. When technology is not being used in her classroom she usually sits at the front of
the classroom and verbally reads pre-created notes for the students to copy in their
notebooks. Frequently she asks the class about a mathematical concept that they had learned
about before, but would offers little wait time before answering the question herself. Thus, I
observed that often students would disengage.
Mrs. Johnson always uses tasks with Geometer’s Sketchpad (GSP) that were either
designed at the summer professional institute that our project facilitated or tasks designed by
another teacher at her school. She uses the majority of each observation describing a task
using GSP. Thus, there is very limited discourse without technology (two observations had
discourse without technology with counts of 93 and 69, but all others are no more than 36).
In the first semester’s observations she seems very stressed giving students autonomy as they
work through GSP tasks in pairs. Often a student asks a question and Mrs. Johnson tells the

32
student how to solve the task or gives technology directions about the exact process needed
to use the software to do the task. She rarely, if ever, encourages students to explore the
technology for mathematical play unless it is explicitly written into the task. In the second
year, Mrs. Johnson becomes more familiar with the technology and more comfortable
allowing students to work in groups. The use of technology in Mrs. Johnson’s classroom
plays a major role in how she organizes her classroom (by grouping students in pairs), the
type of task that she assigns, as well as the types and modes of discourse that are observed.
Types
Mrs. Johnson’s types of discourse without technology are much less consistent than
Mr. Smith’s (see Figures 8 and 9). This is in large part due to the low counts of discourse
without technology, as most observations focused the majority of the class time on using
Geometer’s Sketchpad. However, like with Mr. Smith, in discourse with technology a clear
pattern emerges (see Figure 9), in order of most to least prevalent: Statements (S), Questions
(Q), Answers (A), and Explanations (E). There is almost never an occurrence of high-level
types of discourse such as Challenges (C), Relating (R), Predicting or Conjecturing (P),
Justifying (J), or Generalizing (G), thus they are left out of the box plots in Figure 7. A
plausible explanation is that only Mrs. Johnson wore a microphone, and she had a habit of
directing students through an activity, and in effect, limiting student thinking or opportunities
for discourse. Also, there are times when she had students write down their predictions or
conjectures, but this is not always recorded in the video observation.
There is a statistically significant difference in Statements when technology is used
versus when it is not (see Table 2) with a p-value of 0.00 at an α=0.05 significance level.

33
This is visually evident in the box plots in Figure 7. The plausible explanation for this is
Mrs. Johnson’s lack of experience with using technology in the classroom. The first year of
observations the percentage of the means of Mrs. Johnson’s Statements per observation is
relatively consistent when she is using technology (see Figure 9). Over the second year,
however, we see her number of Statements with technology decrease consistently from
73.6% in September to 55.3% in April. A possible explanation for this could be a
professional development summer institute between Year 1 and Year 2 that our project
facilitated that centered on The 5 Practices for Productive Mathematical Discussions (Smith
and Stein, 2011).
There is more spread in the number of Questions without technology (IQR=2.2) than
with technology (IQR=5.9). Also, there is inconsistency in the number of Questions without
technology, but with technology it remained fairly consistent the first year and increased
slightly the second year (see Figures 8 and 9). Thus, we can conclude that it is typical for
Questions with technology to fall in the range between 17.7% and 29.5% of discourse types
with technology.
Answers without technology varied from no Answers in two observations to 36.1% of
all types of discourse in one observation (compare Figures 7, 8, and 9). This is much more of
a spread than Answers with technology, which ranged from only from 3.5% to 17.2%, as
seen in the box plot in Figure 7.

34
Table 3. Mean percentages of Mrs. Johnson’s discourse types with and without technology
Discourse Type Mean % Without
Technology (x̅NT)
Standard Deviation Without
Technology (sNT)
Mean % With
Technology (x̅T)
Standard Deviation Without
Technology (sT)
H0: x̅NT= x̅T Vs. Ha: x̅NT≠ x̅T P-
value
Statistically Significant? α<0.05
Statements 45.6 8.61 62.5 6.20 0.00 Yes
Questions 26.6 5.82 24.5 3.96 0.41 No
Answers 22.1 8.61 10.0 3.54 0.00 Yes
Explanations 4.9 4.99 2.6 1.13 0.27 No
Challenges 0.4 1.05 0.2 0.17 0.57 No
Justifications 0.4 0.63 0.2 0.38 0.56 No
Relating 0.0 0.00 0.0 0.00 N/A N/A
Generalizing 0.0 0.0 0.0 0.11 0.48 No
Predictions or Conjectures
0.0 0.00 0.0 0.00 N/A N/A
There are very few Explanations without technology. In all cases they are less than
12.9% of discourse without technology, and in half of all the observations without
technology there are no Explanations. With technology they are evident in all observations
but ranged from 1.1% to 5.5% (see Figures 7 and 9).

35
As previously noted there are very few instances of any other types of discourse in
Mrs. Johnson’s geometry classes beyond the ones already mentioned. This is due to her
lecture approach to teaching and lack of differentiation in her instruction.

36
Figure 7. Box plots of means per observation of discourse types for Mrs. Johnson.

37
Figure 8. Percentage of discourse type means without technology for Mrs. Johnson.
Figure 9. Percentage of discourse type means with technology for Mrs. Johnson.
0
20
40
60
80
100
9/30/10 2/23/11 4/12/11 5/12/11 9/22/11 11/21/11 2/29/12
Johnson -‐ Discourse Type Without Technology
A S E Q C R P J G
0 20 40 60 80 100
Johnson -‐ Discourse Type With Technology
A S E Q C R P J G

38
Modes
There is considerable change of modes of discourse when technology is used (see
Figures 11 and 12). Technology plays a large role in facilitating different modes of discourse
in Mrs. Johnson’s geometry classes. Without technology the modes of discourse are almost
exclusively Teacher-to-Whole-Class and Student-to-Teacher. Teacher-to-Student discourse
is infrequent and rare. However, with technology there is a more balanced mix of these three
most common modes of discourse (TW, ST, and TS). All other types of discourse are either
non-existent or rare. Teacher-to-Group and Student-Individual-Reflection both are present in
the two observations with technology in the last semester (2.7% and 1.7%, respectively). In
8 of 11 observations there is more Teacher-to-Student than Teacher-to-Whole-Class
discourse with technology. Thus it is possible that technology provides Mrs. Johnson with a
medium to individualize instruction and that over time this becomes more the norm.
The difference of Teacher-to-Whole-Class (TW) discourse with and without
technology is statistically significant (p<0.00) at the α=0.05 significance level. There is a
major drop from a mean of 74.4% of Teacher-to-Whole-Class discourse without technology
to 32.9% with technology across all observations. In the box plot (Figure 10) we see that the
spread of this mode of discourse is smaller without technology. However, without
technology Teacher-to-Whole-Class discourse ranges from 58.0% to 89.7%, and is more than
65% in 9 of 10 cases. This is evidence of Mrs. Johnson’s lecture-based teaching style.
However, with technology all but one case (73.6%) ranged between 9.7% and 48.7%, a
significant reduction in Teacher-to-Whole-Class discourse.

39
There is also a statistically significant difference in Teacher-to-Student (TS) discourse
when technology is used (p<0.00). Teacher-to-Student discourse increases from a mean of
Table 4. Mean percentages of Mrs. Johnson’s discourse modes with and without technology
Discourse Type
Mean % Without
Technology (x̅NT)
Standard Deviation Without
Technology (sNT)
Mean % With
Technology (x̅T)
Standard Deviation Without
Technology (sT)
H0: x̅NT= x̅T Ha: x̅NT≠ x̅T P-
value
Statistically Significant?
(α<0.05)
Teacher to Whole Class 75.6 10.71 32.9 20.12 0.00 Yes
Teacher to Student 1.4 2.36 47.3 18.15 0.00 Yes
Student to Teacher 23.1 10.04 18.8 5.77 0.33 No
Teacher to Group 0.0 0.0 0.4 0.93 0.18 No
Student to Student 0.0 0.0 0.1 0.28 0.13 No
Student to Whole Class 0.0 0.0 0.0 0.0 N/A N/A
Student to Group 0.0 0.0 0.0 0.0 N/A N/A
Teacher Individual Reflection
0.0 0.0 0.0 0.10 0.34 No
Student Individual Reflection
0.0 0.0 0.4 0.80 0.14 No
1.4% without technology to 47.3% with technology. This is seen visually in the box plot
(Figure 10) and in the line graphs (Figures 11 and 12). Again, this is evidence of more

40
individualized discourse occurring in Mrs. Johnson’s geometry classes when technology is
present.
For Student-to-Teacher discourse there is an increase from the first year to the second
year from a mean of 16.7% to 21.6%. Thus, we see that over time in Mrs. Johnson’s
geometry classes there is more discourse from her students to her.

41
Figure 10. Box plots of means per observation of discourse modes for Mrs. Johnson.
42
Figure 11. Percentage of discourse mode means without technology for Mrs. Johnson.
Figure 12. Percentage of discourse mode means with technology for Mrs. Johnson.
0
20
40
60
80
100
9/30/10 2/23/11 4/12/11 5/12/11 9/22/11 11/21/11 2/29/12
Johnson -‐ Discourse Mode Without Technology
ST SS SG SW SIR TG TW TS TIR
0 20 40 60 80 100
Johnson -‐ Discourse Mode With Technology
ST SS SG SW SIR TG TW TS TIR

43
Case 3: Mrs. Anderson
Mrs. Anderson was a teacher with three years experience teaching before becoming
involved with this research project. She too taught at a rural high school in the southeastern
United States, but one distinct from both Mr. Smith and Mrs. Johnson’s schools. Her classes
are on semester block schedule with ninety-minute classes. Her school had a student
population of 1,611 students that are 18% African American, 74% Caucasian, 5% Hispanic,
2% Asian and less than 1% from other ethnicities. When students are not working on
technology tasks students would be seated in rows facing the front of the classroom. Mrs.
Anderson would often create tasks for students to work on in pairs. However, she would
often begin by sitting at the front of classroom and showing students features of Geometer’s
Sketchpad that they would need to solve the assigned task. She is very interested in having
her students use Geometer’s Sketchpad. One of her strengths when using Geometer’s
Sketchpad is her ability to highlight the difference between drawing (creating objects with no
relation to each other) and constructing (creating objects that have fixed relationships
between them and relationships that hold in the dynamic environment). Thus, she sometimes
has her students implement the “drag test” to see if the intended relationships in a student’s
construction hold and what the invariants are. One task that she uses frequently is for
students to model the definitions and theorems from the unit they are studying using GSP. In
most of the observations she allocates the majority of time in class to using technology.

44
Types Mrs. Anderson’s discourse without technology is relatively consistent throughout the
time of this study. The data for discourse without technology in the Fall 2010 semester (Fall
Year 1) has been omitted because the total number of discourse counts are less than thirty. In
four of seven observations the discourse types without technology in order of most to least
prevalent, as identified by the researcher, are: Statements (S), Questions (Q), Answers (A),
and Explanations (E) as shown in Figure 14. This is the same order of prevalence as
discourse with technology (Figure 15) and matches the findings from Mr. Smith and Mrs.
Johnson. However, it should be noted that the discourse without technology is more balanced
over time, whereas with technology more statements and less answers occurred. This can be
attributed to Mrs. Anderson’s style of providing a (sometimes prolonged) technology demo
before letting the students work in pairs on a task and/or the limitations of only have the
microphone on the teacher and thus only being able to record what that microphone could
pick up.
Statements are the most common form of discourse in Mrs. Anderson’s geometry
classes. However, in three of the seven observations without technology questions are
greater than or equal to the percentage of total discourse. There is also a statistically
significant difference between statements without technology and statements with technology
(p-value=0.02 at α<0.05 significance level). Of interest here is that the percentage of
discourse that were Statements is much higher with technology up from 45.5% to 57.4%, but
had a smaller spread, where the IQR decreased from 7.8 to 6.1 (see box plots in Figure 13).

45
Again, this could be attributed to Mrs. Anderson’s tendency to begin most classes with a
prolonged technology demonstration.
The percentage of means of Questions (Q) per observation is similar both with and
without technology. Both the mean and median decreased slightly, but the spread increased
only marginally as observed in Table 5 and box plots in Figure 13.
Table 5. Mean percentages of Mrs. Anderson’s discourse types with and without technology
Discourse Type
Mean % Without
Technology (x̅NT)
Standard Deviation Without
Technology (sNT)
Mean % With
Technology (x̅T)
Standard Deviation Without
Technology (sT)
H0: x̅NT= x̅T Vs. Ha: x̅NT≠ x̅T P-
value
Statistically Significant?
(α<0.05)
Statements 41.5 6.27 57.4 12.86 0.02 Yes
Questions 33.3 7.43 29.4
8.92 0.39 No
Answers 15.1 5.65 8.6 3.45 0.03 Yes
Explanations 6.8 4.71 3.5 2.53 0.14 No
Challenges 0.2 0.23 0.3 0.40 0.44 No
Justifications 3.0 4.18 0.4 0.82 0.17 No
Relating 0.1 0.19 0.1 0.20 0.50 No
Generalizing 0.0 0.00 0.1 0.15 0.36 No
Predictions or Conjectures
0.0 0.00 0.0 0.00 N/A N/A

46
Also, the difference of Answers (A) is statistically significant when technology is
used (p-value=0.03). Answers decline when technology is used from 15.1% to 8.6% (see
Table 5) of total discourse. This could be attributed to the increased use of Mrs. Anderson’s
technology demonstrations and the increase of Statements (S).
Explanations (E) are recorded more often when technology is not used. On average
Explanations were 6.8% of discourse without technology, but only 3.5% of discourse with
technology. Both the median and spread decreased with technology (see box plots in Figure
13). This could be attributed to Mrs. Anderson’s tendency to let students work on their own
in groups, but press students to offer explanations in their discourse when technology is not
used, such as their solutions to homework problems.
Also of interest is the mean percentage of Justifications (J) per observation. In five of
seven observations without technology Justifications occur. Often these Justifications
occurred as students are working out geometric proofs on the whiteboard. However, there
are no recorded Justifications with technology. This is most likely attributed to the stationary
position of the camera and the inability of the researcher to see student work. It should be
noted though that of the nine observations that justifications are absent from the first four
observations yet present all of the final five observations. This might be attributed to
professional development that our project provided both during the summer institute between
Year 1 and Year 2 as well as the online professional development class that the author
moderated.
Challenges (C), Predictions and Conjectures (P), Relating (R), and Generalizations
(G) are rare or not evident at all and thus omitted from the box plots in Figure 13. However,

47
it is noteworthy to mention that although Challenges occurred in the same number of
observations with technology as without (3), they always occur in higher numbers when
technology is used. Also, the only instances of Relating and Generalizing occur when
technology is used. Predictions and Conjectures are not observed in any of Mrs. Anderson’s
observations.

48
Figure 13. Box plots of means per observation of discourse types for Mrs. Johnson.

49
Figure 14. Percentage of discourse type means without technology for Mrs. Anderson.
Figure 15. Percentage of discourse type means with technology for Mrs. Anderson.
0
20
40
60
80
100
2/25/11 3/25/11 5/20/11 9/8/11 10/6/11 3/7/12 5/8/12
Anderson -‐ Discourse Type Without Technology
A S E Q C R P J G
0
20
40
60
80
100
10/1/10 11/19/10 2/25/11 3/25/11 5/20/11 10/6/11 3/7/12
Anderson -‐ Discourse Type With Technology
A S E Q C R P J G

50
Modes
Discourse modes in Mrs. Anderson’s classes vary depending on the kind of task that
students are working on or the type of lesson that is being delivered. This can be explained
by the observance of differentiation of Mrs. Anderson’s instruction techniques—sometimes
she does a technology demonstration, sometimes she has students present work on the board,
or sometimes students work in pairs on an assigned task.
Mrs. Anderson often conducts a technology demo then lets students work in groups.
However, the teacher microphone does not record much of this discourse when students are
working group in the final three (of seven) observations. This explains the very high instance
of Teacher-to-Whole Class (TW) discourse with technology for the last three observations
with technology. However, in three of the first four observations Teacher-to-Student (TS)
discourse is higher than Teacher-to-Whole Class discourse with technology.
Teacher-to-Whole Class (TW) discourse had a greater spread with technology, as
shown in Figure 16. However, although the median remains relatively unchanged the mean
decreases from 43.6% of discourse without technology to 39.8% with technology, as shown
in Table 6. This is evidence that Mrs. Anderson is able to use technology as a tool to
individualize her interactions with students.
Teacher-to-Student (TS) discourse increases from 29.6% to 39.8% of total discourse
when technology is used. However, the spread of the data of this mode with technology is
much greater than without technology as shown in the box plots in Figure 16. In three
observations when discourse is recorded both with and without technology Teacher-to-

51
Student discourse occurred at greater rates than Teacher-to-Whole class discourse (see dates
5/20/11, 10/6/11, and 3/7/12 in Figures 17 and 18). There might be a relationship between
the use of technology later in a class and the modes of discourse Mrs. Anderson employs
without technology earlier in a class period.
Table 6. Mean percentages of Mrs. Anderson’s discourse modes with and without technology
Discourse Type
Mean % Without
Technology (x̅NT)
Standard Deviation Without
Technology (sNT)
Mean % With
Technology (x̅T)
Standard Deviation Without
Technology (sT)
H0: x̅NT= x̅T Ha: x̅NT≠ x̅T P-
value
Statistically Significant?
(α<0.05)
Teacher to Whole Class 43.6 21.15 39.8 26.10 0.77 No
Teacher to Student 29.6 14.74 39.8 26.10 0.67 No
Student to Teacher 24.5 8.91 17.3 4.98 0.09 No
Teacher to Group 0.8 1.66 8.0 14.66 0.25 No
Student to Student 0.4 1.10 1.1 2.61 0.53 No
Student to Whole Class 1.1 2.69 0.0 0.11 0.33 No
Student to Group 0.0 0.00 0.0 0.00 N/A N/A
Teacher Individual Reflection
0.0 0.00 0.0 0.00 N/A N/A
Student Individual Reflection
0.0 0.00 0.0 0.00 N/A N/A

52
Teacher-to-Group (TG) discourse increases when technology is used, from 0.8% to
8.0%. However, the spread of this data increases when technology is used even though most
of this spread occurs in the upper two quartiles, as seen in Figure 16. Visually this can be
seen clearly in the line graphs in Figures 17 and 18.
Other modes of discourse are rarely recorded. This is partially due to the limitation of
only having a microphone on the teacher.

53
Figure 16. Box plots of means per observation of discourse modes for Mrs. Anderson.

54
Figure 17. Percentage of discourse mode means without technology for Mrs. Anderson.
Figure 18. Percentage of discourse mode means with technology for Mrs. Anderson.
0
20
40
60
80
100
2/25/11 3/25/11 5/20/11 9/8/11 10/6/11 3/7/12 5/8/12
Anderson -‐ Discourse Mode Without Technology
ST SS SG SW SIR TG TW TS TIR
0
20
40
60
80
100
10/1/10 11/19/10 2/25/11 3/25/11 5/20/11 10/6/11 3/7/12
Anderson -‐ Discourse Mode With Technology
ST SS SG SW SIR TG TW TS TIR

55
Cross-Case Comparison
Mr. Smith, Mrs. Johnson, and Mrs. Anderson each have a unique approach to
teaching and learning and this influenced the types and modes of discourse observed in their
geometry classes. However, there are both similarities and differences in the ways in which
these types or modes of discourse manifest themselves.
There are similarities and differences in the ways that the types of discourse are
evidenced across the three cases. In Mr. Smith’s case there is no significant difference in
any of the types of discourse. However, in both Mrs. Johnson and Mrs. Anderson’s cases
there is a statistically significant change in the number of Statements (S) observed.
Interestingly, Statements (S) increased in Mrs. Johnson’s classes, but decreased in Mrs.
Anderson’s when technology is in use. This could be a result in each teacher’s approach to
teaching with and without technology. Also of interest is Mrs. Johnson’s Explanations (E)
are present in all observations with technology and Mrs. Anderson’s Explanations occur in
higher frequencies when technology is present. For all teachers the types of discourse in
order of most to least prevalent with technology are: Statements (S), Questions (Q), Answers
(A), and Explanations (E). Without technology there is some variation in this order for Mrs.
Johnson and Mrs. Anderson, but this pattern clearly emerges when they use technology. For
Mr. Smith, Challenges (C) are present and emerge at consistent rates across contexts, yet are
rare for Mrs. Johnson and Mrs. Anderson. In all cases the instances of Relating (R),
Predicting and Conjecturing (P), and Generalizing (G) are rare. Across the cases we notice
that technology plays a role in the types of discourse observed in Mrs. Johnson and Mrs.

56
Anderson’s geometry classes. Both seem to change the way they teach in order to adapt the
technological context, whereas Mr. Smith seems to carry over his pedagogical techniques
across contexts.
The modes of discourse change when technology is introduced in all three cases,
much more drastically than the types. The way that each teacher organizes his or her class
and designs his or her lessons when technology is used considerably alters the modes of
discourse that occur. In most cases the shift is from whole class discourse (e.g. instances of
TW) to more individualized and student-centered types of discourse (e.g instances of TS, TG,
ST, SS, SW). This showed up in various ways throughout the data. In all cases there is a
higher instance of Teacher-to-Whole-Class (TW) discourse without technology than with
technology. In Mr. Smith’s case, only TW, TS, and ST were more than 5% of total discourse
without technology. Yet with technology we began to see higher instances of SS, SG, SW,
and TIR (compare Figures 5 and 6). For Mrs. Johnson this manifested itself in the fact that
without technology modes almost exclusively were restricted to TW and ST discourse, yet in
eight of eleven observations with technology TS occurs at a higher rate than TW (see Figure
12). In Mrs. Anderson’s case this is evidenced in the fact that TS increases when technology
is used.
Evidence of each teacher’s professional development is manifested in different ways.
For instance, there are no Justifications (J) in any of the first four of Mrs. Anderson’s
observations, yet they are present in each of the last five of her observations. In Mrs.
Johnson’s case the percentage of discourse coded as Statements (S) in her second year of the

57
study is reduced from 73.6% in September to 55.3%. in April with a steady decline in
between (see Figure 9).
Summary of Findings
In summary the goals of this study are to investigate the following questions: 1) What
is typical mathematical discourse in three geometry teachers’ geometry classes? and 2) What
changes in modes and types of discourse occur during a two-year professional development
experience? In reference to the first question it was found that although there is a some
variation between teachers and between observations of a single teacher typically discourse
types both with and without technology tend to have the following pattern in order of most to
least prevalent: Statements (S), Questions (Q), Answers (A), and Explanations (E).
Challenges (C), Relating (R), Predications and Conjectures (P), and Generalizing (G) were
rare. Also, with the exception of Statements and Answers for Mrs. Anderson, there is no
statistically significant evidence that the types of discourse changed when technology is used.
However, there is a marked change in modes of discourse for all three teachers. Although,
this manifests itself in unique ways for each teacher there is a trend that the technology
facilitates more student-centered discourse as evidenced by a decline in Teacher-to-Whole-
Class (TW) discourse replaced by an increase of Teacher-to-Student (TS) discourse as well
as higher instances of Student-to-Student (SS), Student-to-Group (SG), and Student-to-
Whole-Class (SW) when technology is used. In reference to the second research question the
findings suggest there is little change in types of discourse with or without technology over
time. However, it should be noted again that Justifications (J) were absent in all of Mrs.

58
Anderson’s first four observations, but present in the last five, regardless of technology. This
possibly suggests that she is able to integrate professional development in contexts with and
without technology. Changes over time of the modes of discourse varied by teacher. Mr.
Smith’s discourse modes seem to become more balanced over time between TS, ST, and
TW, especially with technology. Mrs. Anderson’s discourse modes remained consistent over
time both with and without technology. Mrs. Johnson’s modes of discourse became more
student-centered in the second year, as TS replaced TW as the dominant type of discourse in
her classroom. In Mrs. Anderson’s modes of mathematical discourse no trends emerged over
time. This could be attributed to the variety of tasks that Mrs. Anderson used and her
differentiation of instruction. Thus, we see that types of discourse can be typified by the S-
Q-A-E pattern, but there is little change with or without technology or over time. Modes of
discourse vary by teacher but often change when technology is introduced. This change
trends toward more student-centered discourse modes (TS and ST).

59
CHAPTER 5: CONCLUSIONS, IMPLICATIONS, AND LIMITATIONS In this study, two research questions are posed and discussed: 1) What is typical
mathematical discourse in three geometry teachers’ classes? and 2) What changes in modes
and types of discourse occur during a two-year professional development experience when a
teacher is using technology versus when they are not? The method used to study these
questions uses a discourse analysis tool that allowed the researcher to conduct a longitudinal
study to provide a quantitative analysis of qualitative data. The introduction for this study
describes many current issues facing education today including: the influx of technology in
the classroom, the need for reform-based pedagogy and more discourse in the classroom, the
lack of professional development for teachers to learn to use new technology tools or reform-
based pedagogical practices, and the need to develop students as innovators for the twenty-
first century. This study seeks to enlighten the intersection of these issues by focusing on
three geometry classes equipped with student-issued laptops and Geometer’s Sketchpad. The
goal of this study is to inform future professional development, secondary mathematics
pedagogical practices, pre-service teacher training, and future mathematics education
research. In this chapter conclusions are drawn and implications for future professional
development, teaching, and research are shared.
Conclusions
Types of mathematical discourse refer to the nature of mathematical depth of
discourse that takes place in the mathematics classroom. Some types of discourse require the
participant to recall a fact while others require novel and complex problem solving. Teachers

60
most often use Statements, Questions, Answers, and Explanations as their primary discourse
types both with and without technology. Instances of Challenges, Relations, Predictions and
Conjectures, and Generalizations are both sporadic and rare with and without technology.
However, instances of Challenges did occur in Mr. Smith’s classes both with and without
technology, but not in Mrs. Johnson or Mrs. Anderson’s classes. It is possible that Mr. Smith
received more reform-based professional development both as a pre-service and in-service
teacher, as his pedagogy seems to reflect this. Discourse types mostly remained unchanged
regardless of whether technology is or is not being used. Thus, it can be concluded that there
is no evidence that discourse types change in any consistent way when technology is
introduced to the classroom. In order for discourse types to change significantly toward
higher-level types of discourse, more professional development and support might be needed
as well as a change in teachers’ beliefs about pedagogy (Yackel and Cobb, 1996). Yet, these
discourse types are expected to occur at similar rates both with and without technology as
types of discourse seem to transcend the technological context.
Modes of mathematical discourse refer to the direction of communication. These
discourse modes are based on who initiated the discourse and to whom the communication is
directed. In general, findings suggest that modes of discourse do change when technology is
used. Also, findings suggest that technology facilitated a shift from teacher-centered
discourse modes to more student-centered ones. Evidence includes the following trends
when technology is present: a decrease in Teacher-to-Whole-Class discourse in Mrs. Adams
and Mrs. Anderson’s classes, instances of Student-to-Student, Student-to-Group, and
Student-to-Whole-Class discourse in Mr. Smith’s class, and an increase in Teacher-to-

61
Student discourse in Mrs. Johnson and Mrs. Adams classes. It is not possible to use a t-test
to test if Mr. Smith’s discourse changed because the data is non-parametric, as the normality
assumption is violated (see Figure 4). However, Mr. Smith’s discourse modes become more
balanced among the various modes when technology is used. Thus, there is evidence that
technology facilitates a change in discourse modes in ways that support student-centered,
reform-based pedagogy.
Implications
This study is intended to inform mathematics teaching and learning, professional
development of mathematics teachers, and research about mathematics education. It has
implications for mathematics teachers, professional development designers, mathematics
teacher educators, software developers, and mathematics education researchers. Although
this study focused on students’ uses Geometer’s Sketchpad in a 1-1 computing context the
results could be extended to other mathematics software in a 1-1 context as well.
Teachers need to shift from hubs of mathematical knowledge to facilitators of
learning (NCTM, 1991). In doing so they need to create a classroom environment where
students can develop and utilize higher-level cognitive skills, as they participate in a more
discourse-rich, collaborative learning environment. This study should enlighten both
successes and challenges to discourse in the mathematics classroom that will need to be
addressed for mathematics teaching and learning in the twenty-first century. One of these
successes is the ability for technology to act as a disruptive force to teacher’s traditional,
lecture-based teaching styles and allowing a shift toward more student-centered approaches,

62
as in Mrs. Johnson’s case. A challenge is how to help teachers develop the proper pedagogy
required to elicit higher-levels of discourse that students will need to thrive as innovators in
the twenty-first century. Teachers will need to be very intentional about both modeling
higher-level types of discourse and attempting to elicit these types of discourse from their
students, as they do not naturally occur with any frequency (possibly they do occur naturally
when students are young, but it is possible that this is trained out of them at an early age).
However, these higher-levels of discourse should manifest both in technological and non-
technological contexts as in Mr. Smith’s case. It is possible that technology does not serve as
a disrupting agent for teachers with discourse-rich classrooms, as in Mr. Smith’s case as he
often seamlessly transitions between technological and non-technological contexts.
Teachers should glean from this study the finding that technology can be used to facilitate a
more collaborative, student-centered classroom discourse, and utilize this finding for
maximum potential for student learning and innovation in their classrooms.
Professional development designers and mathematics teacher educators should utilize
these results to better train both pre-service and in-service teachers. This training should
focus on how to best use technology in their classrooms to elicit higher-levels of discourse
and create student-centered learning environments in their current or future classrooms.
Dynamic Geometry Environments (DGEs) are a vehicle that can provide a context for
conjecturing and proving (Höltz, 1996; Marrades and Gutiérrez, 2000; Jones, 2000;
Azzarello et al, 2002; Hollebrands, 2007; Baccaglini-Frank, 2009) that should be utilized to
take advantage of these affordances provided by dragging. Thus, teachers should be trained
how to best teaching using DGEs. The Common Core State Standards (CSSSM, 2010) and

63
the 5 Practices for Orchestrating Productive Mathematics Discussions (Smith & Stein,
2011), coupled with literature about other reform-based and technology-rich pedagogical
practices, should be used to help teachers develop the teaching skills and beliefs required to
help their students develop skills to be successful innovators for the twenty-first century.
This study has shown that much more work needs to be done to train teachers how to both
model higher-cognitive level types of discourse and elicit these high-cognitive level types of
discourse from their students.
Software and curriculum developers need to be aware that higher-cognitive levels of
types of mathematical discourse are necessarily for students to thrive in the twenty-first
century. Thus, they should attempt to design software and prepare resources with the goals
of eliciting higher levels of student thinking and generating student-centered mathematical
discourse. They should utilize this study’s finding that technology can be used as a tool to
help facilitate more student-centered modes of mathematical discourse in the classroom and
to design software and resources that capitalize on this potential for a more student-centered
learning environment.
Future researches may want to explore the mathematical discourse of a particular
student, student groups, or all students in a class when they are using technology versus when
they are not. In addition future researchers might want to focus on providing professional
development to one teacher and comparing the teacher-related mathematical discourse to
another teacher that does not receive professional development (a control). This could
inform what professional development strategies are most effective in improving
mathematics classroom discourse. Also, it would be interesting to know if different

64
mathematics classes (algebra, geometry, calculus) lend themselves toward different types or
modes of discourse. There still is much to be learned by future research into technology and
discourse in mathematics classrooms.
Limitations
More research on discourse and technology is necessary. The OMLI (Oregon
Mathematics Leadership Institute) Classroom Observation Protocol tool (Weaver and Dick,
2006) is helpful in identifying mathematical discourse in the classroom. However, it does
not distinguish between questions that elicit student thinking and those that do not. It also
does not take into account the mathematical task, as the task assigned might greatly influence
the types and modes of mathematical discourse. In addition, it is difficult to study all the
discourse that occurred in the classroom due to the reality that only the teacher wore a
microphone. Thus, almost all-recordable verbal discourse is filtered though the teachers’
microphones and so the decision is made to focus only on this recordable, teacher-related
discourse. The instrument does allow the researcher to collect data on the tools that are used
(verbal, written, gestures, writing, ect.), and the type of episode in which the discourse occurs
(whole class, small group, individual, ect.), but analyzing this data is beyond the scope of this
research project. Finally, although the person speaking is reflected in the analysis of the
modes of discourse, this is not taken into consideration when reporting the types. It would be
worthwhile for a future study to consider types of teacher discourse vs. types of student
discourse.

65
In sum, teachers need to be preparing students to thrive in the twenty-first century.
Technology is a powerful tool, but professional development and a change in teacher beliefs
are vital for teachers to capitalize on its benefits and to build discourse-rich, reform-based,
and student-centered classrooms. This study is only one step in that direction as it serves as a
call for a shift in teacher beliefs about the teaching and learning of mathematics, professional
development, and related research.
66
REFERENCES Argueta, R., Huff, J. D., Tingen, J., & Corn, J. (2011). 1:1 laptop initiatives: A summary of
research findings across six states. The Friday Institute White Paper Series. Raleigh,
NC: North Carolina State University.
Assude, T., Buteau, C., & Forgasz, H. (2010). Factors influencing implementation of
technology-rich mathematics curriculum and practices. Mathematics Education and
Technology-Rethinking the Terrain, 405-419.
Baccaglini-Frank, A. (2009). Conjecturing and proving in dynamic geometry after an
introduction of the dragging schemes. In Proceedings of the 10th International
Conference of the Mathematics into the 21st Century Project, Dresden, Germany,
September 2009.
Bennison, A., & Goos, M. (2010). Learning to teach mathematics with technology: A survey
of professional development needs, experiences and impacts. Mathematics Education
Research Journal, 22(1), 31-56.
Boaler, J., & Brodie, K. (2004). The importance, nature and impact of teacher questions. In
D.E. McDougall, & J A.Ross (Eds.), Proceedings of the Twenty-sixth Annual
Meeting of the North American Chapter of the International Group for Psychology of
Mathematics Education, 2, 773-782. Toronto, Ontario.
Cayton, C. S. A. (2012). Teachers’ implementation of pre-constructed dynamic geometry
tasks in technology-intensive algebra 1 classrooms. (Doctoral dissertation). Retrieved

67
from http://www.lib.ncsu.edu/resolver/1840.16/8198.
Common Core Standards for Mathematics. (2010). Retrieved from
http://www.corestandards.org/assets/CCSSI_Math%20Standards.pdf
Corn, J. (2009). Evaluation Report on the Progress of the North Carolina 1:1 Learning
Technology Initiative (Year 2) (NC State Board of Education Report). Raleigh, NC:
Friday Institute for Educational Innovation, North Carolina State University.
Drijvers, P., Doorman, M., Boon, P., Reed, H., and Gravemeijer, K. (2010). The teacher and
the tool: Instrumental orchestrations in the technology-rich mathematics classroom.
Educational Studies in Mathematics, 75, 213-234.
Hollebrands, K. F. (2007). The role of a dynamic software program for geometry in the
strategies high school mathematics students employ. Journal for Research in
Mathematics Education 38 (2), pp. 164-192.
Hölzl, R. (1996). How does ‘dragging’ affect the learning of geometry. International Journal
of Computer for Mathematical Learning 1 (2), 169-187.
Jackiw, N. (1991). The geometer’s sketchpad. Berkley. Key Curriculum Press.
Jones, K. (2000). Providing a foundation for deductive reasoning: students’ interpretations
when using dynamic geometry software and their evolving mathematical
explanations. Educational Studies in Mathematics. 44 (1), pp 55-85. Retrieved from
www.crme.soton.ac.uk/publications/kjpubs/JonesESM.pdf.

68
Jones, K., Jones, J. L., & Vermette, P. J. (2010). The constructivist mathematics classroom.
Mathematics Teaching, 219, 33-35.
Kay, K., & Greenhill, V. (2011). Twenty-first century students need 21st century
skills. Bringing schools into the 21st century, 41-65.
Lopez-Real, F., Leung, A. (2006) Dragging as a conceptual tool in dynamic geometry
environments. International journal of Mathematical Education in Science and
Technology 37 (6). 665-679. DOI: 10.1080/00207390600712539.
Marrades, R. and Gutiérrez, Á (2000). Proofs produced by secondary school students
learning geometry in a dynamic computer environment. Educational Student in
Mathematics (44, ½). pp. 87-125.
Moschkovich, J. (2003). What counts as mathematical discourse? In N. A. Pateman, B. J.
Dougherty, & J. Zilliox (Eds.), Proceedings of the 2003 joint meeting of Psychology
of Mathematics EducaitonME and Psychology of Mathematics Education-North
American Chapter (Vol. 3, pp. 325–331). Honolulu: University of Hawaii.
National Council of Teachers of Mathematics. (1991). Professional standards for teaching mathematics. Reston, VA: National Council of Teachers of Mathematics.
National Council of Teachers of Mathematics. (2000). Principles and standards for school mathematics. Reston, VA: Author.
Nathan, M. J., Knuth, E. J. (2003). A study of whole classroom mathematical discourse and
teacher change. Cognition and Instruction, 21(2), 175-207.
Sfard, A. (2001). There is more to discourse than meets the ears: looking at the thinking as
communicating to learn more about mathematical learning. Educational Studies in
69
Mathematics, 46(1/3), Bridging the Individual and the Social: Discursive Approaches
to Research in Mathematics Education (2001), 13-57.
Sinclair, N., & Yurita, V. (2008). To be or become: how dynamic geometry changes
discourse. Research in Mathematics Education, 10(2), 135-150.
Smith, M. S. & Stein, M. K. (2011). 5 practices for orchestrating productive mathematics discussions. Reston, VA: NCTM.
Stein, M. K., Engle, R. A. , Smith, M. S., & Hughes, E. K. (2008). Orchestrating productive
mathematical discussions: Helping teachers learn to better incorporate student
thinking. Mathematical Thinking and Learning, 10(4), 313-340.
Weaver, D. and Dick, T. (2006). Assessing the Quality and Quantity of Student Discourse in
Mathematics Classrooms: Year 1 Results. Retrieved from
http://ormath.mspnet.org/media/data/WeaverDick.pdf?media_000000006132.pdf
Weaver, D. and Dick, T. (2009). Oregon mathematics leadership institute project: Evaluation
results on teacher content knowledge, implementation fidelity, and student
achievement. The Journal of Mathematics and Science: Collaborative Explorations.
11, 57-84.
The White House (2009). President Obama launches "educate to innovate" campaign for
excellence in science, technology, engineering & math (stem) education. Retrieved
from http://www.whitehouse.gov/the-press-office/president-obama-launches-educate-
innovate-campaign-excellence-science-technology-en.

70
Wilson, B. G. (2012). Constructivism in practical and historical context. In R. A. Reiser & J.
V. Dempsey (Eds.), Trends and Issues in Instructional Design and Technology, 3rd
ed., 45-54.
Cobb, P., & Yackel, E. (1996). Constructivist, emergent, and sociocultural perspectives in the
context of developmental research. Educational psychologist, 31(3-4), 175-190.

71
APPENDICES

72
Appendix A: OMLI Codes for Mathematical Discourse Analysis
Types of Mathematical Discourse
Code Definition Explanation A Answering Answer from student or from teacher
S Making a statement or sharing Individual does not share how or why
E Explaining A mathematical idea may be explained, but there is no justification
Q Questioning A student or teacher asks a question to clarify own understanding
C Challenging Student or teacher makes a statement that challenges validity of an idea
R Relating Student or teacher indicates he/she has made a connection to prior knowledge
P Predicting or Conjecturing Based on student or teacher’s own understanding
J Justifying Student or teacher provides justification for the validity of an idea
G Generalizing Shifts from specific case to general understanding
Modes of Mathematical Discourse Code Definition Explanation
ST Student to Teacher Student primarily addresses the teacher, even if entire class hears
SS Student to Student SG Student to Group SW Student to Whole Class
SIR Student's Individual Reflection
TG Teacher to Group TW Teacher to Whole Class TS Teacher to Student
TIR Teacher's Individual Reflection Teacher may ponder out loud at the board

73
Appendix B: OMLI Classroom Observation Discourse Analysis Form
Evidence of Mathematical Discourse
Teacher: ___________________________________ Date: ______________________
Episode Type
Start/End Times
Stud
ents
O
bser
ved
Episode Description
Discourse Codes
Tally Larg
e G
roup
Pairs
/Sm
all
Gro
up
Indi
vidu
al
Mode Type Tools
Tech
Page: ___

74
Appendix C: Sample of Completed OMLI Discourse Analysis Form

75
Appendix D: Sample of Discourse Counts and Percentages
0.0
10.0
20.0
30.0
40.0
50.0
ST SS SG SW SIR TG TW TS TIR
Percent
Mode of Discourse
Discourse Mode Without Tech
0.0
10.0
20.0
30.0
40.0
50.0
ST SS SG SW SIR TG TW TS TIR
Percent
Mode of Discourse
Discourse Mode With Tech
Without Technology
MODE TOTAL Percent
ST 98 33.4
SS 2 0.7
SG 0 0.0
SW 0 0.0
SIR 0 0.0
TG 2 0.7
TW 143 48.8
TS 48 16.4
TIR 0 0.0
TOTAL 293
WITH TECHNOLOGY
TYPE TOTAL PERCENT
ST 82 31.2
SS 4 1.5
SG 0 0.0
SW 0 0.0
SIR 0 0.0
TG 43 16.3
TW 62 23.6
TS 72 27.4
TIR 0 0.0
TOTAL 263